COPENHAGEN S-BANE AUTOMATION STUDY - DK Forside · Automation is a concept gaining popularity for...
120
Copenhagen S-Bane Automation Study ______________________________________________________________ Ramboll-Atkins-Emch+Berger-Parsons i COPENHAGEN S-BANE AUTOMATION STUDY FINAL REPORT PARSONS TRANSPORTATION GROUP for DANISH MINISTRY OF TRANSPORT
Transcript of COPENHAGEN S-BANE AUTOMATION STUDY - DK Forside · Automation is a concept gaining popularity for...

Copenhagen S-Bane Automation Study
______________________________________________________________
Ramboll-Atkins-Emch+Berger-Parsons i
COPENHAGEN S-BANE AUTOMATION
STUDY
FINAL REPORT
PARSONS TRANSPORTATION GROUP
for
DANISH MINISTRY OF TRANSPORT

Copenhagen S-Bane Automation Study
______________________________________________________________
Ramboll-Atkins-Emch+Berger-Parsons 2
This Page is Intentionally Blank

Copenhagen S-Bane Automation Study
______________________________________________________________
Ramboll-Atkins-Emch+Berger-Parsons 3
This Page is Intentionally Blank

Copenhagen S-Bane Automation Study
______________________________________________________________
Ramboll-Atkins-Emch+Berger-Parsons 4
This Page is Intentionally Blank

Copenhagen S-Bane Automation Study
______________________________________________________________
Ramboll-Atkins-Emch+Berger-Parsons 5
Executive Summary
Upgrades and refurbishments of railway infrastructure create the opportunity to introduce new technologies and higher levels of automation into the operations. Automation is becoming increasingly prevalent in suburban and metro upgrades around the world. The signalling upgrade creates an opportunity for the S-Bane.
Automation can bring significant benefits to the S-Bane service. It will result in reduced travel time for passengers and a more reliable, punctual service. Automation creates a greater opportunity to reconfigure and increase the frequency of service, resulting in more capacity and reduced waiting times for passengers. The replacement of the traditional train driver role, with a roaming staff presence on trains and in stations, provides higher levels of customer service. Overall, the operations become more flexible, effective and efficient.
There is a strong business case for the deployment of UTO [driverless] operations across the network, even if there was no growth in passenger demand over the investment period. UTO results in a significant reduction in staff operating costs.
DTO [attended] operation has a business case, but less than UTO based upon the study’s staffing assumptions.
If affordability was a major investment consideration, deployment of STO+ would be at a significantly lower cost, offer a positive business case, and provide enhanced operational capability. The benefits can be taken as cost savings, or higher service provision, or a combination of both.
Conversion of all the existing rolling stock to UTO, DTO or STO+ operations is not considered practical or economic due to the assumed residual life of the asset.
The benefits of the upgrade to the signalling system have yet to be incorporated into a benefits management plan. The faster journey times can be taken as an enhanced timetable service, or more fully exploited through a metro style of service operation.
The central trunk line section in central Copenhagen represents a long term capacity constraint on the network. A shuttle service could alleviate this constraint, increasing the overall service capacity of the network if required.
A more practical approach to the upgrade of the network would be to consider a hybrid implementation strategy towards an eventual fully driverless network. This would involve different operations on separate parts of the network. For example, one strategy could be: an early purchase of new trains on the F line and implement UTO; cascade the old vehicles on to the remainder of the network providing a capacity increase; implement the shuttle service as a metro operation and provide an enhanced timetable, or metro service, on the other parts of the network; introduce UTO on the shuttle service with the new fleet of trains and STO+ elsewhere.
There are opportunities to further enhance the upgrade through changes to other asset areas such as track layout and line speeds. A system wide upgrade plan should be considered in any future studies.

Copenhagen S-Bane Automation Study
______________________________________________________________
Ramboll-Atkins-Emch+Berger-Parsons 6
This Page is Intentionally Blank

Copenhagen S-Bane Automation Study
______________________________________________________________
Ramboll-Atkins-Emch+Berger-Parsons 7
CONTENTS
MAIN REPORT
1 INTRODUCTION 13 1.1 Background 13 1.2 Automatic Operation 13 1.3 Document Structure 14 1.4 Acronyms and Abbreviations 15 1.5 References 15
2 METHODOLOGY 16 2.1 Study Objectives 16 2.2 Parsons Approach 16
3 THE S-BANE 18 3.1 Current Service 18 3.2 Current Infrastructure 20 3.3 Passenger Numbers 21 3.4 The Inner Ring Line 23 3.5 Performance Measures 23
4 TRAFFIC PLANNING 27 4.1 Future Service Increases 27 4.2 Differences between Timetable and Metro Services 29 4.3 Metro Service Winners and Losers 30 4.4 Metro Service Opportunity & Risks 31
5 AUTOMATION OPERATIONAL MODES AND SEVICE BENEFITS 32 5.1 Operating Modes 32 5.2 Passenger Benefits 32
6 EVALUATION OF COSTS 34 6.1 Cost Principles 34 6.2 Cost Phasing 35 6.3 Asset Area Cost Breakdown 35 6.4 Maintenance Costs 37 6.5 The Inner Ring Line 37
7 BASE CASE 38 7.1 Defining a Base Case 38 7.2 Service Options 39 7.3 Description of Service Options 41 7.4 The Shuttle Option (Hoje Taastrup to Kobenhavn H) 42 7.5 Results of Base Case Modelling 43 7.6 Agreed Base Case 46
8 AUTOMATION OPTIONS 47 8.1 UTO from 2030 with new trains 51 8.2 DTO from 2030 with new trains 52 8.3 Early DTO from 2020-2030 with converted trains 53 8.4 STO+ from 2030 with new trains 54 8.5 Pilot Line DTO from 2020+ (fleet conversion) then 2030+ (new fleet) 55 8.6 Pilot Line UTO from 2030 56 8.7 Metro 57

Copenhagen S-Bane Automation Study
______________________________________________________________
Ramboll-Atkins-Emch+Berger-Parsons 8
9 MIGRATION 58 9.1 Migration Issues 58 9.2 Migration Plan 59 9.3 Sensitivity Test 61 9.4 Hybrid Options 63
10 RISK 64 10.1 Introduction 64 10.2 Feasibility Risks 64 10.3 Design Risks 64 10.4 Pre Implementation Risks 65 10.5 Implementation Risks 65
11 CONCLUSIONS & RECOMMENDATIONS 67 11.1 Conclusions 67 11.2 Recommendations 68
12 CONTACT DETAILS & ACKNOWLEDGEMENTS 69
Copenhagen S-Bane Automation Study
______________________________________________________________
Ramboll-Atkins-Emch+Berger-Parsons 9
APPENDICES
APPENDIX A - OPERATIONAL CONCEPTS 72
1 Normal Operations 75
2 Failures And Incidents 76
3 Service Regulation 78
4 Automatic Turnaround 80
5 Staff Model 83
APPENDIX B - BENEFITS CAPTURE 87
1 Business Requirements 88
2 Benefits Management 88
3 Business Case 89
APPENDIX C - EVALUATION OF BENEFITS 93
1 Benefit Categories 94
2 The Inner Ring Line 101
3 Benefits Summary 101
APPENDIX D – METRO SERVICE 102
APPENDIX E – PRIME 107
APPENDIX F – ASSUMPTIONS REGISTER & DATASETS 110
APPENDIX G – BUSINESS REQUIREMENTS 114

Copenhagen S-Bane Automation Study
______________________________________________________________
Ramboll-Atkins-Emch+Berger-Parsons 10
TABLES
Table 1 Acronyms and Abbreviations .................................................................................. 15 Table 2 References ............................................................................................................. 15 Table 3 Study Objectives .................................................................................................... 16 Table 4 S-Banen Line Description ....................................................................................... 20 Table 5 Features of Timetable and Metro Services ............................................................. 30 Table 6 Operating Modes .................................................................................................... 32 Table 7 Benefits Summary .................................................................................................. 33 Table 8 Capital Costs Summary .......................................................................................... 34 Table 9 Rolling Stock Costs ................................................................................................ 35 Table 10 Communication Costs .......................................................................................... 37 Table 11 F-Line Capital Costs ............................................................................................. 37 Table 12 Service Options .................................................................................................... 39 Table 13 Detailed Service Frequencies ............................................................................... 40 Table 14 Detailed Line Descriptions for Options .................................................................. 40 Table 15 Features of Base Case ......................................................................................... 46 Table 16 Automation Options .............................................................................................. 47 Table 17 Metro Option ........................................................................................................ 47 Table 18 Summary of Quantified Assessment..................................................................... 49 Table 19 UTO Business Case ............................................................................................. 51 Table 20 DTO Business Case ............................................................................................. 52 Table 21 Early DTO Business Case .................................................................................... 53 Table 22 STO+ Business Case ........................................................................................... 54 Table 23 Pilot Line DTO Business Case ............................................................................. 55 Table 24 Pilot Line UTO Business Case ............................................................................. 56 Table 25 Metro Business Case ........................................................................................... 57 Table 26 Sensitivity Business Case .................................................................................... 62 Table 27 Operational Concept for Normal Operations ......................................................... 75 Table 28 Operational Concept for Failures and Incidents .................................................... 77 Table 29 Operational Concept for Service Regulation ......................................................... 79 Table 30 Comparison of S-Bane and Metro ........................................................................ 83 Table 31 Staff Numbers ...................................................................................................... 86 Table 32 Historic Regularity, Reliability & Customer Satisfaction Scores ............................ 96 Table 33 Prediction of Reliability and Regularity under DTO and UTO ................................ 97 Table 34 Relating Reliability & Regularity to Journey Time ................................................. 98 Table 35 Journey Time Improvements due to Reliability and Regularity.............................. 98 Table 36 Valuing Experience Benefits ................................................................................. 99 Table 37 Improvements in Experience Scores .................................................................... 99 Table 38 Valuing Passengers’ Perception of Safety and Security ..................................... 100 Table 39 Value of Improvements in Safety and Security ................................................... 100 Table 40 Benefits Summary .............................................................................................. 101 Table 41 Metro Winners and Losers ................................................................................. 103 Table 42 Metro Branch Summary...................................................................................... 106 Table 43 Assumptions Log ................................................................................................ 113

Copenhagen S-Bane Automation Study
______________________________________________________________
Ramboll-Atkins-Emch+Berger-Parsons 11
FIGURES Figure 1: S-banen Geography ............................................................................................. 18 Figure 2 S-Banen Route Map .............................................................................................. 19 Figure 3 Passengers Using Branches ................................................................................. 22 Figure 4 Annual Passenger Journeys ................................................................................. 22 Figure 5 Annual Passenger Kilometres ............................................................................... 23 Figure 6 Customer Satisfaction ........................................................................................... 24 Figure 7 Regularity and Reliability ....................................................................................... 25 Figure 8 Customer Satisfaction Survey versus Reliability .................................................... 25 Figure 9 DSB Passenger Experience Service Quality Measures ......................................... 26 Figure 10 Track Layout ....................................................................................................... 29 Figure 11 Simplification of the Route Map ........................................................................... 31 Figure 12 Shuttle Operation ................................................................................................ 42 Figure 13 Journey Time Comparisons for Options .............................................................. 44 Figure 14 Architecture of Roles and Systems ..................................................................... 73 Figure 15 UTO Incident Response Times versus Mobile Staff Coverage ............................ 84 Figure 16 Benefits Mapping ................................................................................................ 88 Figure 17 UTO Benefits Map ............................................................................................... 91 Figure 18 Relationships between Regularity, Reliability & Customer Satisfaction ............... 96 Figure 19 PRIME Modules ................................................................................................ 108 Figure 20 Passenger Daily Profile ..................................................................................... 109

Copenhagen S-Bane Automation Study
______________________________________________________________
Ramboll-Atkins-Emch+Berger-Parsons 12
This Page is Intentionally Blank

Copenhagen S-Bane Automation Study
______________________________________________________________
Ramboll-Atkins-Emch+Berger-Parsons 13
1 INTRODUCTION
1.1 Background
Banedanmark has developed a new “Signalling Strategy” to renew all the Banedanmark signalling systems by 2021. The aim is to achieve reductions in lifecycle costs while at the same time improving the performance of the signalling system. As part of this strategy, the plan is to replace all signalling on the Copenhagen S-Bane with a suitable metro/urban railway signalling system by 2020. A new set of operational rules for the S-bane is to be developed, adopting best practise from other metro/urban railway systems around the world. The Signalling Strategy delivers semi-automatic train operation (STO) and enables the potential to deliver long term improvements to the S-Bane services. STO also provides the opportunity to consider pursuing more automation through further technology investments. The Danish Ministry of Transport has commissioned Parsons to perform a study considering how the S-Bane operations and passenger services can be further improved through the exploitation of further automation and eventual driverless operation (S-Bane Automatic Operations or S-Bane UTO). The purpose of the S-Bane Automatic Operations study is to develop a number of potential future scenarios exploiting varying degrees of automation, and to establish an indicative investment case for each. The results of this study will enable the Danish Ministry of Transport to develop a future policy for S-Bane automation that aligns with the overall long-term vision for the S-Bane. The findings of this study are the subject of this report.
1.2 Automatic Operation
Automation is a concept gaining popularity for metro operators around the world, whereby trains are operated without the traditional driver role. Removing the requirement to have a member of staff in the cab of all trains in service means that staff can be redeployed to locations where they add more value, either on the train or elsewhere dependant on the level of automation employed. NTO refers to trains being manually driven by Train Drivers, like today. STO is a system that automatically drives a train whilst supervised by a Train Driver positioned in the driving cab. The Train Driver is still responsible for other driving functions such as the safe departure of trains and visually monitoring the track ahead. The signalling strategy will deliver STO. It is the availability of STO operation that makes further Automation improvements possible. Under DTO operation, the requirement for a Train Driver to be situated in the driving cab is removed. Systems provide the functions of safe departure and detecting intrusions onto the tracks. However it is necessary to have a member of staff, or

Copenhagen S-Bane Automation Study
______________________________________________________________
Ramboll-Atkins-Emch+Berger-Parsons 14
Train Captain, on-board every train in passenger service in order to manage failures and abnormal situations. Under normal circumstances the Train Captain is free to perform customer-facing services rather than be occupied driving the train. Under UTO, further systems are introduced to reduce the occurrences of failures and automatically detect and remotely manage failures. This eliminates the need for the Train Captain. Instead, the train service can be supervised by a group of Mobile Staff who can patrol trains and stations and attend to a train as requested from the Traffic Control Centre (TCC). DTO is less common-place than UTO but maybe more appropriate for refurbishments of existing metros. It is possible to implement DTO or UTO on certain parts of the network only where the benefits are greatest. For example, automation around the terminus can enable a much faster-turnaround of trains (Automatic Turn-Around (ATA)) which potentially has significant operational performance and cost advantages for a small implementation area. STO, DTO, UTO and ATA are operational concepts referred to throughout this report. They are described in more detail in section 5.
1.3 Document Structure
Following this introduction, in section 0 the study objectives and the Parsons method of approach to the study is explained. In section 3 the S-Bane service is discussed. This section includes a commentary on the current service, infrastructure, passengers and performance measures. Section 4 discusses traffic planning issues, and compares the differences in “timetable” and “metro” philosophies. Section 5 describes the operational concepts for STO, DTO, UTO and ATA. Section 6 describes the Parsons approach to understanding the benefits of automation. Sections 7 and 8 describe how the benefits and costs of automation are evaluated. Section 9 describes the various services options considered for post signalling upgrade and the eventual selection of a “base case”. Section 10 contains the results of the business case evaluation for the automation options relative to the base case. Section 11 discussed the migration to driverless operations Section 12 discusses the general risks of pursuing UTO. Finally, in section 13 are the conclusions and recommendations arising from the study.

Copenhagen S-Bane Automation Study
______________________________________________________________
Ramboll-Atkins-Emch+Berger-Parsons 15
1.4 Acronyms and Abbreviations
ATA
Automatic Turn Around
ATP Automatic Train Protection ATO CBTC CIS CSS
Automatic Train Operation Communication Based Train Control Customer Information System Customer Satisfaction Survey
DTO Attended Train Operation MSP Managing Successful Programmes NTO Normal Train Operation OTT PEA PIS PNR PSD PTID
On Train Time Passenger Emergency Alarm Passenger Information System Physical Needs Request Platform Screen Doors Platform Train Intrusion Detection
PWT STO
Platform Wait Time Semi-Automatic Train Operation
TCC Traffic Control Centre TIS Train Information System TOC Train Operating Company TPH Trains Per Hour UTO Unattended Train Operation
Table 1 Acronyms and Abbreviations
1.5 References
Sources Referenced Date Number / Issue App 3.2 Functional Requirements Att 2 Operational Concept.docx 26/02/2010 13-017439-SSST Version 2 S-Bane Business Requirements Modernisation of Control Systems 13/06/2008 FS185 221-001(2) Version 2 Manual Samfunds-økonomisk Analyse - Trafikministeriet 06/2003 87-91013-36-4 Kompass Ledelsesrapport – DSB 2H 2009 & 1H 2010 Managing Successful Programmes Manual - Office of Government Commerce
03/09/2007
Traffic Modelling S-Bane – Atkins, Signalling Programme 15/01/2010 RRR_AARSAG_FORDEL_V1_PUB(1).xls 07/06/2010
Table 2 References

Copenhagen S-Bane Automation Study
______________________________________________________________
Ramboll-Atkins-Emch+Berger-Parsons 16
2 METHODOLOGY
2.1 Study Objectives
Five objectives of the study were agreed between Parsons and the Ministry of Transport.
Objective
1 Define base case scenarios around manual train operation (NTO) & Semi-automatic Train Operation (STO) operations [post signalling renewal]
2 For each incremental Automation step from STO to Unattended Train Operation (UTO), compare and contrast costs & benefits.
3 Operational measures required to realise the business benefits are to be described.
4 Provide an outline migration strategy both functionally and geographically for each step where appropriate.
5 Establish indicative investment business case for each migration step
Table 3 Study Objectives
2.2 Parsons Approach
i) Looking Ahead to 2020 and Beyond (Objective 1)
Objective 1 required Parsons to consider what the S-Bane service and operations would look like following the signalling renewal. In order to do this it was necessary to understand the current passengers, train service operations and performance and then understand how these would change as a result of STO and any other known developments to the public transport network.
In the absence of a readily available long term plan setting out answers to these questions, Parsons set about collating assumptions from various experts within the Transport Ministry, Banedanmark Signalling Programme and DSB. Following a rapid review of current operations and service performance using easily available data, Parsons proposed a number of options to the study Steering Group (25th June 2010). Amongst other options, Parsons proposed the consideration of a “metro service” concept as a base case (see section 9).
ii) Dealing with the Multitude of Options (Objectiv es 2, 4 & 5)
It became apparent to Parsons early in the study that there would be potentially a large number of possible strategies. Objective 2 required Parsons to consider how much Automation should ultimately be implemented in terms of technology by geographical area (i.e. options for what the “end-state” should be). Objective 4 required Parsons to consider the best way of migrating to the “end state” (i.e. “migration” options for “end state” options). A further complication was that different services would potentially apply to different situations.
With four dimensions to consider (technology, geography, timing and service) achieving the study objectives with a consistent logical method presented a

Copenhagen S-Bane Automation Study
______________________________________________________________
Ramboll-Atkins-Emch+Berger-Parsons 17
considerable challenge. This was even more difficult as the “base case” was also unclear at the outset.
To meet this challenge a business case model was developed that enabled different strategies to be compared with one another. A single strategy could reflect a whole long-term upgrade programme. A strategic option was defined by a number of interventions and service changes over a 30+ year period spanning the introduction of new rolling-stock. Each strategy would have its own stream of costs and benefits which could be compared with others on a whole-life basis. Depending upon how many interventions were varied between options, the model could be used to compare both small and large differences between different strategies and could be used to reject a large number of ideas that were found to be considerably inferior to others. As a consequence a small number of the most attractive strategies were developed that could be considered in more detail.
The advantage of this approach was that, once developed, the same model could be used to consistently meet objectives 2, 4 and 5.
iii) Describing the Operational Measures (Objective 3)
The Signalling Programme has defined the requirements of the new signalling to be UTO “capable”. The operational concept for UTO was therefore already developed, as far as necessary for defining the signalling requirements (13-017439-SSST App 3.2 Functional Requirements Att 2 Operational Concept.docx).
These concept statements were assumed for the purpose of this study, and supplemented where necessary with further assumptions (listed in the operational sections of the assumptions register in Appendix C). Most of the “new thinking” to supplement the previous work was related to the staffing functions and staffing levels that would be possible. These assumptions demanded the most attention from Parsons as they would ultimately have a significant impact upon the business case.
For DTO, the corresponding concept statement would be the same as either STO or UTO depending upon whether the function was to be performed by staff or system.

Copenhagen S-Bane Automation Study
______________________________________________________________
Ramboll-Atkins-Emch+Berger-Parsons 18
3 THE S-BANE
3.1 Current Service
The S-Bane network consists of 85 Stations over 155 route kilometers carrying up to around 350,000 passenger journeys on a busy weekday. There is a single 12 kilometer end-to-end line (the F-Line or often referred to as the “Inner Ring” line) but the majority of the network consists of three branch lines to the south and west of the city joining to three branches to the north and north west, all through a single trunk section through the city centre (one track in each direction between Vesterport and Svanemollen). During the peaks there are 30 trains per hour (tph) through the trunk section. On the branches the service frequencies are either 6tph, 9tph or 12tph throughout most of the traffic day.
Figure 1 S-banen Geography

Copenhagen S-Bane Automation Study
______________________________________________________________
Ramboll-Atkins-Emch+Berger-Parsons 19
The network is described as six separate routes (A, E, B, Bx, C and H) each with its own timetable, start and end destinations, and stopping pattern. The service is marketed to passengers as a timetabled service with a simple “clock-face” 10 minute repeating cycle. Travel times from the ends of the lines to the city centre on the fast services are approximately 40 minutes (Koge to Kobenhavn H 39 minutes, Hillerod to Kobenhavn H 40 minutes, Frederikssund to Kobenhavn H 43 minutes).
The service control philosophy is to deliver the timetabled service as closely as possible. The operator DSB-Tog has “punctuality” and “reliability” performance measures both of which are calculated from the deviations compared to the timetable.
Figure 2 S-Banen Route Map

Copenhagen S-Bane Automation Study
______________________________________________________________
Ramboll-Atkins-Emch+Berger-Parsons 20
Table 4 S-Banen Line Description
3.2 Current Infrastructure
i) Rolling Stock
The majority of the current fleet of S-Trains were built and delivered into service during the early 2000s, with the first eight trains arriving in 1996. The design represents an innovative concept of public mass transit: a lightweight and comfortable articulated train with short but very wide car bodies based on single-axle running gears. The fleet consists of 102 eight-car (SA) and 31 four-car (SE) units. Each car has a single wide double door. The vehicle configuration of the eight-car unit is composed of two half-sets of nearly the same constructional design with five single-axle running gears each. To form a longer train, the individual sets can be easily coupled to form twelve or sixteen car trains (168 meters). SAs and SEs can operate to all branches and longer train formations are routinely operated during the peaks. The exception is the Inner Ring Line where only single four-car SEs operate. The top speed is 120km/h. ii) Signalling
The current signalling system is a fixed block cab signalling system which transmits data to the trains through low-bandwidth audio frequency induction loops between the rails. Different frequency combinations encode different target speeds which are indicated to the train driver. If the driver exceeds the target speed on entering a block a service brake will be automatically initiated. The line capacity with this fixed block characteristic is around 30tph. The signalling is approaching the end of its service life and is already showing signs of declining reliability, hence the intention of the Signalling Programme to replace all the signalling with a CBTC system by 2020. This moving block characteristic will provide a theoretical capacity of up to 40tph.

Copenhagen S-Bane Automation Study
______________________________________________________________
Ramboll-Atkins-Emch+Berger-Parsons 21
iii) Track & Trackside
The trains run on a standard gauge track (1435mm) below ground level in the city centre. Outside the tracks are in the open, often on embankments. On some outer-area sections there is little or no fencing to prevent trespassing onto the tracks. On some sections the tracks run alongside the outer suburban/regional/intercity mainlines. There are a number of track connections with the mainline but the mainline has its own signalling and power standards and the connections are mainly used for engineering trains, so the S-Bane effectively has an entirely independent track network. The S-Bane is generally well equipped with reversing facilities, sidings and diversionary routes providing a decent degree of operational flexibility. However, it is not possible to run fast and slow trains on different tracks or easily exploit over-taking at stations with alternate routes as part of the timetable. A diagram of the track layout is shown in section 4.1.3. iv) Power
The trains are powered by overhead wires at 1500v-1650v DC. Power is drawn from the national grid from around 40 feeder stations spread around the network. v) Communications
The S-bane is covered by a cab radio system which is to be replaced by a GSM-R voice system (this will also form the Voice Radio and Signalling System Data radio for the Fjernbane which is important to bear in mind in areas where the two networks run in parallel). There is a running man radio system used by DSB in depots and areas near to depots and some DSB staff make use of a Tetra Radio. There is no Train to Infrastructure Data Radio on the S-bane at present (although one will be provided by the Signalling Programme it is not specified to include spare capacity for other purposes). Banedanmark operates a Fixed Transmission Network based on fibres throughout the S-bane which will be upgraded to meet the needs of the Signalling Programme.
3.3 Passenger Numbers
An estimated 92 million journeys were made on the S-Bane in 2009. Passenger numbers have been in decline since the 1990s, although recent years have shown a slight recovery in usage following timetable improvements in 2007. Increased competition from the car, particularly for the longer journeys from the outer sections is considered to be the main reason for the decline.
The busiest section of the line is obviously in and around the city centre and the most popular traffic destinations of Norreport and Kobenhavn H. On the branches there are busy stations in the most populated areas of the suburbs (Hillerod, Lyngby etc) as well as important interchange stations with the regional railways (Hellerup etc).

Copenhagen S-Bane Automation Study
______________________________________________________________
Ramboll-Atkins-Emch+Berger-Parsons 22
The demand is distributed mostly to the southern branches of Koge, Hoje Taastrup and Frederikssund. To the north the Hillerod branch is by far the most heavily used. However, even the busiest sections seldom experience passenger volumes so high that passengers are forced to stand in crowded conditions, or cause problems with long station stop times (the trains have wide doors and spacious vestibule areas).
Figure 3 Passengers Using Branches
Passenger numbers have increased slightly in recent years, but they are still below the level in the 1990s. Also, the annual passenger kilometers travelled has been in steady decline over the last decade, despite the volume of service operated increasing over the period.
DSB S-Tog Annual Passenger Journeys (Millions) - Including Lille Nord
82
84
86
88
90
92
94
96
Figure 4 Annual Passenger Journeys

Copenhagen S-Bane Automation Study
______________________________________________________________
Ramboll-Atkins-Emch+Berger-Parsons 23
DSB S-Tog Annual Passenger Kilometres (Millions) - Including Lille Nord
Figure 5 Annual Passenger Kilometres
The future demand outlook is uncertain and therefore it has been assumed in this study that there is no underlying growth1 in demand due to demographic, economic or societal changes (i.e. 2008 demand levels will remain throughout the period of assessment).
3.4 The Inner Ring Line
The F-Line is a simple end to end line which, although part of the S-Bane, can operate with little interaction with the rest of the network. The service level is 12tph throughout most of the weekdays and 6tph evenings and weekends. In 2008 the number of passenger boardings on the F-Line was around 12 million (around 13% of the S-Bane). The service is operated with a maximum of ten 4-car trains (SEs).
3.5 Performance Measures
i) Customer Satisfaction
The Transport Ministry, Banedanmark and DSB focus on many different performance measures, some reflecting the contractual arrangements and payment incentives between the parties. However, Customer Satisfaction (CSS) is ultimately the most important outcome and is surveyed every 6 months. A new methodology was introduced in 2007 which unfortunately meant that the data for 2005 and 2006 could not easily be incorporated into the analysis for this study.
1 Automation options that produce passenger benefits will attract more passengers to the metro. This is explained in more detail in section 4 of Appendix B.

Copenhagen S-Bane Automation Study
______________________________________________________________
Ramboll-Atkins-Emch+Berger-Parsons 24
Customer Satisfaction has declined over the last year by 16 hundredths of a point to stand at 7.69. Service performance has also declined slightly over this period.
Figure 6 Customer Satisfaction
ii) Train Service Performance – Reliability & Regul arity
The two main train service performance measures are Regularity and Reliability.
Regularity measures occurrences of trains becoming late compared to timetable. When a train becomes more than 150 seconds late then this is recorded as an “affected arrival” (or “disruption”). The first occurrence of lateness on a trip is noted as an affected arrival, and provided the train does not pick up anymore lateness only one affected arrival will be recorded regardless of how many stops the train is late at. Disruptions can be related back to incidents which are attributed to the responsible party. The measure is expressed as an overall percentage ((planned arrivals -affected arrivals)/planned arrivals)).
Reliability measures the number of arrivals compared to timetabled at all locations. It is a measure of the proportion of planned service delivered. Late running is not directly captured by Reliability, although late running will tend to increase the likelihood of the operator having to cancel a trip or turn a train short in order to return to the timetable. Therefore the measures have some overlap.
Of the two measures Reliability would appear to be more representative of the passengers’ perception of quality, whereas Regularity is recorded in a way which better enables causes of delays to be identified and focused on.
Reliability and Regularity measures are calculated by time of day and for different sections of the network. However, they are only loosely related. There is a weak correlation between the measures when annualised. At a more detailed level there is little or no correlation at all.

Copenhagen S-Bane Automation Study
______________________________________________________________
Ramboll-Atkins-Emch+Berger-Parsons 25
Figure 7 Regularity and Reliability
Of the two measures, Reliability appears to be the stronger predictor of Customer Satisfaction than Regularity. However, there are only a few years of data, so although this seems a reasonable conclusion, it is only a tentative conclusion statistically.
Figure 8 Customer Satisfaction Survey (CSS) versus Reliability
Copenhagen S-Bane Automation Study
______________________________________________________________
Ramboll-Atkins-Emch+Berger-Parsons 26
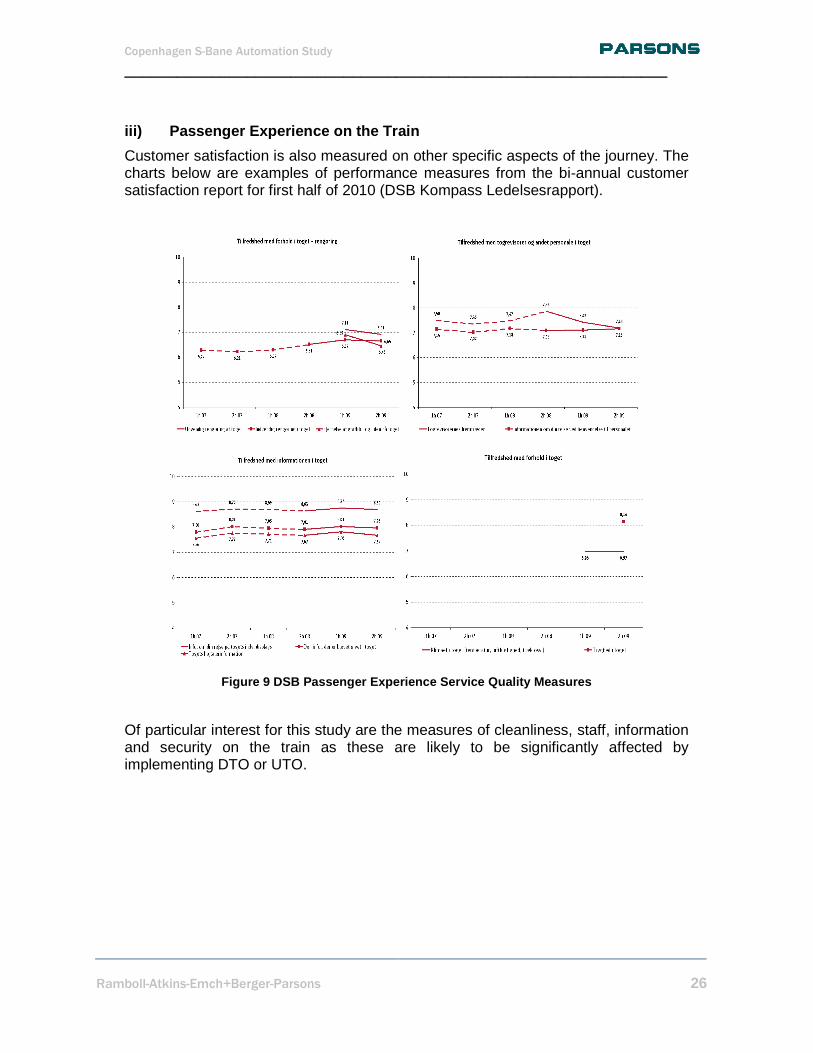
iii) Passenger Experience on the Train
Customer satisfaction is also measured on other specific aspects of the journey. The charts below are examples of performance measures from the bi-annual customer satisfaction report for first half of 2010 (DSB Kompass Ledelsesrapport).
Figure 9 DSB Passenger Experience Service Quality M easures
Of particular interest for this study are the measures of cleanliness, staff, information and security on the train as these are likely to be significantly affected by implementing DTO or UTO.

Copenhagen S-Bane Automation Study
______________________________________________________________
Ramboll-Atkins-Emch+Berger-Parsons 27
4 TRAFFIC PLANNING
4.1 Future Service Increases
Over the next three decades, asset replacement and the introduction of new technology will provide the capability to provide a faster more frequent service. However, fully exploiting this capability will be challenging with the current marketing and control philosophy.
i) The 10 Minute Cycle
Today’s 10 minute service is easy to understand and remember as it is always “0x, 1x, 2x...minutes past the hour”. However, the timetable will become more complicated for passengers to understand and remember if the service intervals depart from the clock-face 10 minute cycle. For example, an 8 minute service repeats itself every 2 hours (e.g. 03, 11, 19, 27, 35, 43, 51, 59, 07, 15...etc).
If the 10 minute cycle is retained there will be restrictions on the way the timetable can be enhanced, as increases must be allocated in “blocks” of 3tph potentially resulting in a sub-optimal balance of services.
ii) Fast and Slow Trains
The current timetable has a fine balance of fast and slow trains meeting the needs of the both the longer distance commuters and those passengers performing local journeys in the outer section. The combined services provide a high frequency “turn up and go” service in the central area. Research into passenger attitudes performed for DSB in 2004, showed that the proportion of passengers preferring faster travel times (35%) exceeded those preferring higher frequencies (28%). Also, the S-Banes market share for the long distance trips is less sensitive to frequency than the shorter trips (less than 15km).
However, maintaining the fine balance through the scheduling of both slow and fast trains over the same tracks may become more difficult and less beneficial on branches where the frequency is increased. Fast trains must run between slow trains. For the maximum travel time advantage, a fast train must depart the last station before “going fast” as long as possible after the preceding slow train and immediately before the next slow train. When the fast train catches up the slow train in front there is no longer any advantage in not stopping at all stations. This means that the maximum time advantage for a fast train operating along the same tracks as a slow train is approximately equal to the slow headway minus 4 minutes (as there will need to be two intervals of around 2 minutes between trains contained within the slow headway). To realise the benefit of fast trains, all the services in this irregular pattern need to be running in correct order and exactly on time to prevent a slow train impeding a fast train. Allowing an operating margin of a minute this corresponds to a 5 minute advantage for today’s 10 minute cycle. For an 8 minute cycle the saving reduces by 40% to 3 minutes.
An alternative “metro-style” operation, without the timetabling restrictions of providing both fast and slow trains, would be more flexible and upgradeable to higher frequencies. However, market share for the longer trips may reduce unless there are compensating benefits for the disadvantaged longer distance commuters.

Copenhagen S-Bane Automation Study
______________________________________________________________
Ramboll-Atkins-Emch+Berger-Parsons 28
iii) Central Area Bottleneck
An important feature of the service is the central area trunk section between Vesterport and Nordhavn (single track in each direction). As all the services go through this section, any delay in this area has rapid consequences for the whole network and are difficult to recover from.
The maximum capacity is currently thought to be 30tph. 30tph is operated for around an hour and a half during the weekday morning and afternoon peaks. 30tph is achieved reliably on most days. 30tph is also convenient for the passenger timetables (i.e. a train every two minutes, and every 5, 10, or 20 minutes to the branches). In future the capacity of the trunk section could be a constraining factor on the service plan, but with today’s traffic this is not a problem for the timetable.
The design capacity of the replacement CBTC signalling is to support a 90 second headway. “Traffic Modelling S-Bane” (Atkins technical note 15/01/2010) concludes: “The new CBTC signal system will make it possible [to] create a timetable with a 90 sec. headway in the central tube, though the punctuality of a timetable with this headway will be lower than a scenario with the current timetable implemented”.
It is Parsons’ opinion that timetabling 40tph through the trunk is unlikely to be an attractive option and may not be practical. To enable the service to operate more reliably, recover from delays and to protect the travel times (by minimising queuing through and on the approaches to the trunk section) 33tph - 36tph is a more viable aspiration. Even at these levels, recovery from central area delays will be difficult. The fewer trains that are timetabled through the trunk, the faster the travel times are likely to be through the section.

Copenhagen S-Bane Automation Study
______________________________________________________________
Ramboll-Atkins-Emch+Berger-Parsons 29
S-Bane Track Layout - The Central Bottleneck area is shown in the Ellipse.
Figure 10 Track Layout
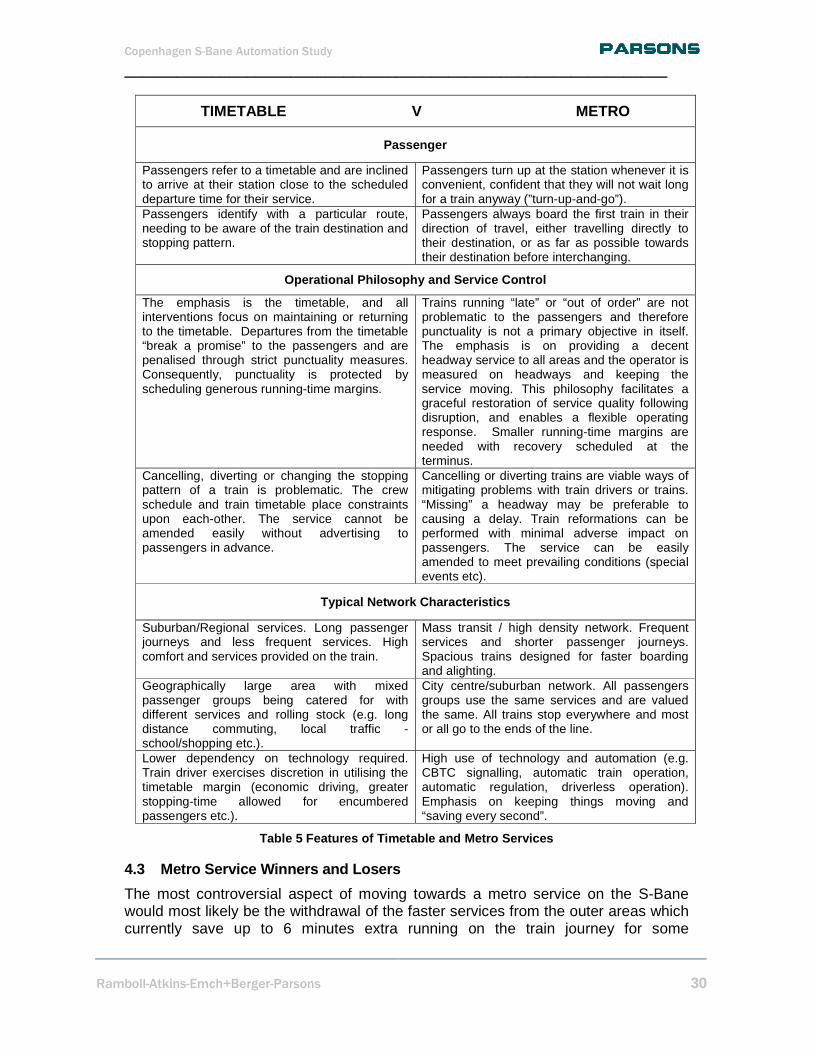
4.2 Differences between Timetable and Metro Service s
In considering future traffic planning issues it is useful to consider the type of service that the S-Bane could be. Today the S-Bane has features of both a “timetable” and “metro” service. Automatic operations tend to be features of metro services because the flexibility of automation is more easily exploited.
Copenhagen S-Bane Automation Study
______________________________________________________________
Ramboll-Atkins-Emch+Berger-Parsons 30
TIMETABLE V METRO
Passenger
Passengers refer to a timetable and are inclined to arrive at their station close to the scheduled departure time for their service.
Passengers turn up at the station whenever it is convenient, confident that they will not wait long for a train anyway (”turn-up-and-go”).
Passengers identify with a particular route, needing to be aware of the train destination and stopping pattern.
Passengers always board the first train in their direction of travel, either travelling directly to their destination, or as far as possible towards their destination before interchanging.
Operational Philosophy and Service Control
The emphasis is the timetable, and all interventions focus on maintaining or returning to the timetable. Departures from the timetable “break a promise” to the passengers and are penalised through strict punctuality measures. Consequently, punctuality is protected by scheduling generous running-time margins.
Trains running “late” or “out of order” are not problematic to the passengers and therefore punctuality is not a primary objective in itself. The emphasis is on providing a decent headway service to all areas and the operator is measured on headways and keeping the service moving. This philosophy facilitates a graceful restoration of service quality following disruption, and enables a flexible operating response. Smaller running-time margins are needed with recovery scheduled at the terminus.
Cancelling, diverting or changing the stopping pattern of a train is problematic. The crew schedule and train timetable place constraints upon each-other. The service cannot be amended easily without advertising to passengers in advance.
Cancelling or diverting trains are viable ways of mitigating problems with train drivers or trains. “Missing” a headway may be preferable to causing a delay. Train reformations can be performed with minimal adverse impact on passengers. The service can be easily amended to meet prevailing conditions (special events etc).
Typical Network Characteristics
Suburban/Regional services. Long passenger journeys and less frequent services. High comfort and services provided on the train.
Mass transit / high density network. Frequent services and shorter passenger journeys. Spacious trains designed for faster boarding and alighting.
Geographically large area with mixed passenger groups being catered for with different services and rolling stock (e.g. long distance commuting, local traffic - school/shopping etc.).
City centre/suburban network. All passengers groups use the same services and are valued the same. All trains stop everywhere and most or all go to the ends of the line.
Lower dependency on technology required. Train driver exercises discretion in utilising the timetable margin (economic driving, greater stopping-time allowed for encumbered passengers etc.).
High use of technology and automation (e.g. CBTC signalling, automatic train operation, automatic regulation, driverless operation). Emphasis on keeping things moving and “saving every second”.
Table 5 Features of Timetable and Metro Services
4.3 Metro Service Winners and Losers
The most controversial aspect of moving towards a metro service on the S-Bane would most likely be the withdrawal of the faster services from the outer areas which currently save up to 6 minutes extra running on the train journey for some

Copenhagen S-Bane Automation Study
______________________________________________________________
Ramboll-Atkins-Emch+Berger-Parsons 31
passengers compared to the stopping service. Fast services operate from all the branches on the network with the exception of the short Klampenborg branch. The passengers who currently benefit from the faster services would possibly perceive a worse service with a metro-style service (i.e. would be “losers”) unless other compensating benefits outweighed the slower trains (e.g. a more frequent service). Other passengers stand to gain from a metro service as they get a more frequent, regular service (i.e. “winners”).
An analysis has been performed to compare the impact on travel times for different passenger groups if a metro style service was implemented today (see Appendix A). The analysis indicates that, overall, there are more benefits than disbenefits, as the “winners” save more time than the increased travel time experienced by the “losers”. However the cost of operations would increase.
4.4 Metro Service Opportunity & Risks
The simple “winners and losers” analysis does not take account of the operational benefits of providing a consistent headway service with even intervals between trains. Also there are marketing benefits of a providing a simpler service which could increase usage by making it easier to attract new customers. Furthermore, the scheduling flexibility offered by a metro service would allow the traffic planners to re-assess service levels to all destinations over all periods of the day. It would be possible to optimise the service levels in accordance with the profile of demand without the constraints of the 10 minute cycle.
How the map might be simplified?
Figure 11 Simplification of the Route Map
However there still remains considerable concern about mitigating the adverse impact to the longer distance commuters (who lose their fast trains) and retaining the market share for these groups. It may therefore be, politically, a more viable strategy to change to a metro-style service when it is possible to reduce the travel times generally for everybody when the new signaling is introduced (e.g. faster running times with STO with tighter recovery margins). The marketing of the changes could then emphasise the overall benefits.

Copenhagen S-Bane Automation Study
______________________________________________________________
Ramboll-Atkins-Emch+Berger-Parsons 32
5 AUTOMATION OPERATIONAL MODES AND SEVICE BENEFITS
5.1 Operating Modes
The main differences between NTO through to UTO are summarised below. The operating concepts and associated staffing models are discussed thoroughly in Appendix A.
Operating Mode
Driving Staffing [Driver]
Protection System Enhancements / Changes
NTO Manual Driver in cab ATP As is
STO Automatic [ATO]
Operator in cab
ATP Signalling upgrade Non driving activities “as is”
Enhanced - STO
Automatic [ATO]
Operator in cab
ATP Automatic Dwell Time Mgt Auto Reversing Rear Cab Emergency Reversing
DTO Automatic [ATO]
Operator mobile on
train
ATP Route security fencing Obstacle detection Route wide PTI protection Smart doors Mobile door controls
UTO Automatic [ATO]
Unattended ATP Increased reliability Remote driving Real time train to control centre communications
Table 6 Operating Modes
During normal operations, DTO is more like UTO than STO as the systems perform most of the normal functions automatically. However during most failure scenarios DTO is more like STO than UTO, as the Train Captain deals with problems in much the same way as the Train Driver does with STO.
5.2 Passenger Benefits
The benefits of automation fall into three categories:
i) Schedule refers to the level of service provided in the plan or timetable (i.e. frequency of trains, formation of the trains and running times). By simulating the service the impact that different schedules have on total passenger time can be calculated.
Copenhagen S-Bane Automation Study
______________________________________________________________
Ramboll-Atkins-Emch+Berger-Parsons 33
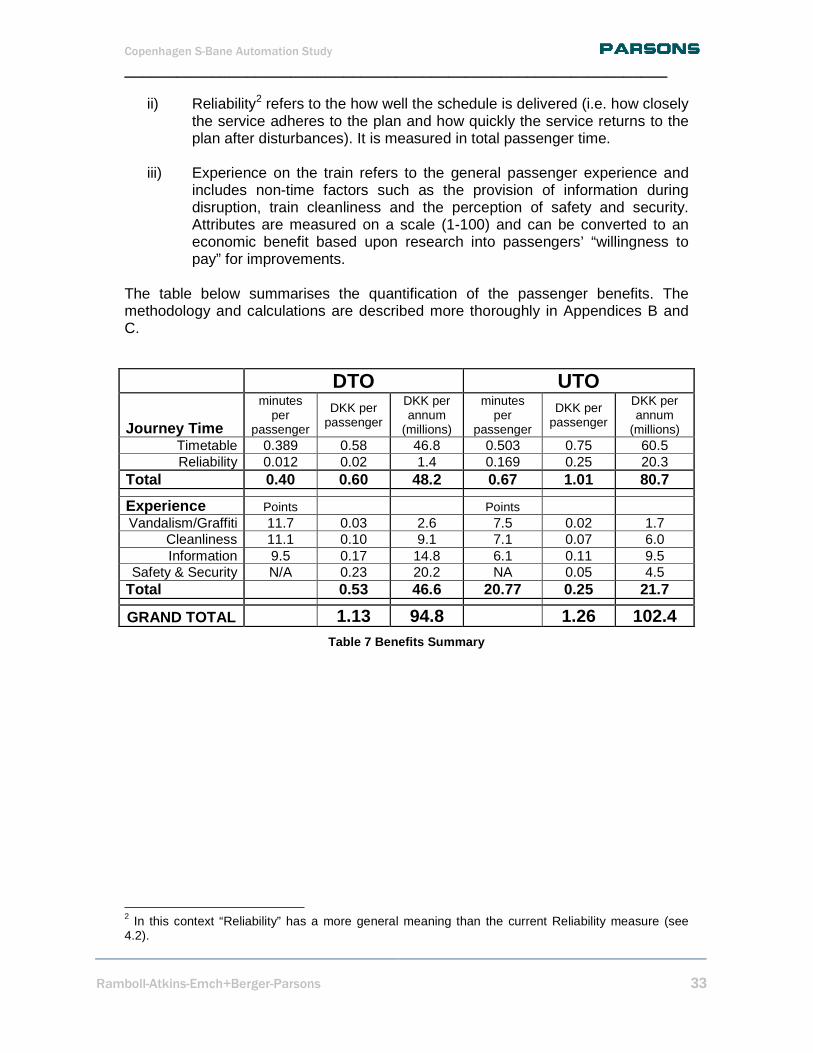
ii) Reliability2 refers to the how well the schedule is delivered (i.e. how closely the service adheres to the plan and how quickly the service returns to the plan after disturbances). It is measured in total passenger time.
iii) Experience on the train refers to the general passenger experience and
includes non-time factors such as the provision of information during disruption, train cleanliness and the perception of safety and security. Attributes are measured on a scale (1-100) and can be converted to an economic benefit based upon research into passengers’ “willingness to pay” for improvements.
The table below summarises the quantification of the passenger benefits. The methodology and calculations are described more thoroughly in Appendices B and C.
Table 7 Benefits Summary
2 In this context “Reliability” has a more general meaning than the current Reliability measure (see 4.2).
DTO UTO
Journey Time
minutes per
passenger
DKK per passenger
DKK per annum
(millions)
minutes per
passenger
DKK per passenger
DKK per annum
(millions) Timetable 0.389 0.58 46.8 0.503 0.75 60.5 Reliability 0.012 0.02 1.4 0.169 0.25 20.3
Total 0.40 0.60 48.2 0.67 1.01 80.7
Experience Points Points Vandalism/Graffiti 11.7 0.03 2.6 7.5 0.02 1.7
Cleanliness 11.1 0.10 9.1 7.1 0.07 6.0 Information 9.5 0.17 14.8 6.1 0.11 9.5
Safety & Security N/A 0.23 20.2 NA 0.05 4.5 Total
0.53 46.6 20.77 0.25 21.7
GRAND TOTAL 1.13 94.8 1.26 102.4

Copenhagen S-Bane Automation Study
______________________________________________________________
Ramboll-Atkins-Emch+Berger-Parsons 34
6 EVALUATION OF COSTS
6.1 Cost Principles
Without a systems requirements specification or concept design, the estimation of costs in this study is very approximate and should be considered to be a budgetary provision. Therefore a relatively simple cost-breakdown structure has been applied as it needs to be easily applicable to calculating costs for numerous options. Parsons have used experience from previous studies to make assumptions and estimations.
The costs are broken down into main asset areas, Rolling Stock, Stations, Communications, Centralised Control and Track Protection. Section 8.3 contains the capital cost breakdown for these areas. In each case, maintenance costs are assumed to be a fixed percentage of the capital costs applying equally in every year following the introduction into service of the assets. A small capital allowance is made for Signalling, which is assumed to be procured as “UTO ready”, but in practise is likely to require some interface modifications. This allowance is included in the Centralised Control costs. At this stage of the project development it is appropriate to apply a single percentage allowance for Project Management, Risk, Contingency and Optimism Bias. This is included in the asset cost pricing (“contingency”) as the level is likely to vary by type. The costs are therefore “all-inclusive” and are deliberately cautious. As the project develops and preferred strategies identified, a more detailed investment plan can be produced from a more detailed cost breakdown. However the true costs will only be revealed under competitive tendering. The approximate cost for implementing UTO across the whole S-Bane after the introduction of new rolling stock is estimated at approximately DKK 3.3bn and for DTO just DKK 1.8bn.
COSTS (DKK bn 2010 prices)
STO+ (New
Trains)
DTO (New
Trains)
UTO (New
Trains) Rolling Stock 0.21 0.21 1.31 Stations 0.08 1.07 1.07 Track Protection 0.07 0.48 0.48 Centralised Control 0 0 0.11 Communications 0 0 0.34 TOTAL 0.36 1.76 3.31
Table 8 Capital Costs Summary
The above table excludes the potential cost saving of purchasing fewer trains, and the additional migration costs of implementing DTO prior to the introduction of new Rolling Stock. The business case model takes both of these effects into account where applicable to an option. The F-Line is included in the overall costs above.

Copenhagen S-Bane Automation Study
______________________________________________________________
Ramboll-Atkins-Emch+Berger-Parsons 35
6.2 Cost Phasing
The timing of the costs will affect the financial evaluation as costs are significantly discounted at the rate of 5% per annum. The financial evaluation is based upon a number of technology interventions over a whole programme. A technology intervention is required in advance of an assumed service option (that requires that technology) coming into effect. A technology intervention will potentially have costs in the each of the different asset areas. The costs for each asset area will be assumed to fall a number of years before the benefits and operating costs of the service option accrue. In reality the costs for each asset area intervention will probably be phased over a number of years so the actual cost profile will be smoother than the profile assumed in the evaluation. However, the overall business case result will not be significantly affected by this simplification, provided a sufficient time-lag has been assumed, as the overall effect of the discounting will be similar either way. A time lag of 2 years has been assumed, apart from new rolling stock purchase where 4 years has been assumed.
6.3 Asset Area Cost Breakdown
i) Rolling Stock
The following table shows the Rolling Stock costs for new trains, and conversion costs for the existing trains.
New Fleet Base Cost (DKK Millions)
All-Inclusive Cost (DKK millions)
Contingency etc (% of ∆ base cost)
STO per Train 52.8 52.8 0% DTO per Train 54.1 54.6 33% UTO per Train 61.0 63.7 33%
Fleet Conversion to DTO
Fixed Costs 3.8 7.7 100% DTO per Train 1.0 1.9 100%
Table 9 Rolling Stock Costs
The costs used in the business case are inclusive of contingency. For the new trains the contingency is applied to the difference in costs compared to an STO train. The cost breakdown for the base costs are shown in Appendix D. For the new fleet, it is assumed that the whole fleet would be equipped to the same specification, so the fixed cost elements are converted to per-8-Car-train costs based upon a nominal fleet size of 120. A UTO fleet of around 120 trains is estimated to be about DKK 1.31bn (around 20%) more expensive than a conventional STO fleet. By comparison, the equivalent DTO fleet would be just DKK 0.21bn more expensive (3%-4%). In either UTO or DTO cases, if implemented network wide, around 5% -10% fewer trains could be purchased (due to the faster turnaround times). This saving in trains could reduce the extra UTO costs by up to a half, and make the DTO fleet costs less than the STO case. However, in the business case, the benefit of the

Copenhagen S-Bane Automation Study
______________________________________________________________
Ramboll-Atkins-Emch+Berger-Parsons 36
higher number of longer train formations has been assumed instead of a smaller fleet (except on the F-Line where one less train is required). The biggest reason for the UTO cost difference is for the train to be more reliable than a train which has a member of staff on board. The extent of the reliability improvement (which creates the associated cost premium) would be the subject of a Reliability and Maintainability (RAM) analysis.
The S-Train conversion (retrofit) costs are represented as a fixed (lump sum) cost plus a cost for each train. The conversion costs for UTO are likely to be too expensive to make a business case. The prospect of implementing UTO prior to fleet replacement has been rejected by the Project Steering Group but DTO is a possibility (about DKK 0.25 bn for 102 x 8 car and 31x 4 Car). ii) Stations
The station costs are the same for DTO and UTO and nearly all attributable to the assumed installation of a Platform Intruder Detection System. The costs assumed are DKK 3.3 million per platform3 plus 66% contingency, risk etc (i.e. DKK 5.4 million per platform. Across the whole network of approximately 200 platforms the station costs are an estimated DKK 1.08bn. Even when allowing for a high amount of risk and contingency, this technology should be less expensive than fitting Platform Screen Doors (PSDs) everywhere, so this is the assumption made for the business case. However “prevention” is a better mitigation than “detection” and PSDs have other benefits that would merit their consideration at some platforms on a case by case basis.
iii) Track Protection
DTO and UTO both require costs for track protection (fencing, bridge-caging, CCTV, signage etc). The allowance in the business case (DKK 2.8 million per kilometre) is inclusive of 66% contingency, risk etc. The cost of securing the whole network of around 170km is an estimated DKK 0.48 bn.
iv) Centralised Control
The costs for Centralised Control are estimated to be DKK 0.11 bn. These costs are used in the business case for UTO and are inclusive of 33% contingency. The majority of the costs are for the alarm management, system monitoring and passenger information systems plus an allowance for signalling modifications. v) Communication System
The following table shows the costs for the Communications System. This is assumed to be necessary for UTO only where real time on-train CCTV and remote train monitoring requires an upgraded communications system to be installed. The system has central and wayside (fibre optic cable and antennae) components so is
3 Base cost estimates provided by the Metro were DKK 3 million per platform

Copenhagen S-Bane Automation Study
______________________________________________________________
Ramboll-Atkins-Emch+Berger-Parsons 37
represented as a fixed cost plus a variable cost per-kilometre. The cost of the system for the whole 170km network is estimated as DKK 0.34bn. Communications System
Base Cost (DKK Millions)
All-Inclusive Cost (DKK millions)
Contingency etc (% of ∆ base cost)
System 28.6 47.6 66% Per Kilometre 1.02 1.69 66%
Table 10 Communication Costs
6.4 Maintenance Costs
Annual maintenance costs for the Communications System and Stations are assumed to be 10% of the base capital costs (excluding contingency). For new Rolling Stock, Trackside Protection and Centralised Control 5% of the base capital costs are assumed.
6.5 The Inner Ring Line
The same unit costs described in 8.3 are applied to the smaller F-Line. Only 4-Car trains are operated (i.e. longer train formations are not operated) so one less 4-Car SE replacement train will need to be purchased (due to faster reversing benefit). Where it is assumed that DTO or UTO would only be implemented on the F-Line as part of an overall programme to install the same technology on parts of the wider network, then the centralised control and system communications costs for the F-Line options are not included in the F-Line costs but are accounted for in the network totals. If UTO is implemented on the F-Line only, a significant proportion of the network’s fixed costs for control and communications would need to be accounted for (50% has been assumed).
COSTS (DKK bn today’s prices) DTO (New Fleet)
UTO (network)
UTO (F Only)
Rolling Stock 0.02 0.07 0.07 Fewer Trains -0.03 -0.03 -0.03 Stations 0.13 0.13 0.13 Track Protection 0.03 0.03 0.03 Centralised Control 0 0 0.07 Communications (wayside) 0 0.02 0.06 TOTAL 0.14 0.22 0.32
Table 11 F-Line Capital Costs

Copenhagen S-Bane Automation Study
______________________________________________________________
Ramboll-Atkins-Emch+Berger-Parsons 38
7 BASE CASE
7.1 Defining a Base Case
It is necessary to construct a base case which reasonably optimises the use of the future network and assets without significant additional expenditure other than that already planned and budgeted (i.e. the Signalling Programme). Therefore it is necessary to consider the benefits introduced by the Signalling Programme and the manner in which those benefits are exploited. In particular, the following should be features of the base case:
i) The faster inter-station running times of STO compared to NTO. ii) Efficient utilisation of the existing fleet of trains (making a reasonable
allowance for spares). iii) A timetable and service pattern that minimises passenger journey time
within reasonable physical and operational constraints. iv) An efficient staff organisation. v) A replacement fleet of trains when the existing S-Train becomes
reasonably life expired – the size of the fleet being sufficient to provide an optimum level of service provision4
vi) Consideration of economic and demographic changes and future
enhancements to the transport network.
The benefits of ATA, DTO and UTO directly affect the number of trains and number of staff needed to operate the service. Also, the case for modified or higher service levels may improve with automation. Therefore, it is most important to consider these particular base case assumptions carefully to ensure that the costs and benefits attributable to automation are fair. This was done by modelling a variety of options without any automation and selecting one of the best performing option in terms of whole-life costs and benefits. Item vi) has not been considered in the study as the assumption is to be cautious with regard to the passenger demand and evaluate automation on today’s passenger numbers. Any structural changes to the network might affect STO and DTO/UTO in similar proportions and in that case would be unlikely to significantly affect the business case for automation. Therefore to simplify the analysis, the benefits were assessed only for existing S-Bane users (on a 2008 demand base), rather than attempting to model the impact on the whole Copenhagen transport network.
4 Assumed to be same number of vehicles as today (to allow for maintenance and longer formations). This assumption may not be the best as the configuration of the new trains is not known and the value of longer formations has not been properly assessed on an incremental cost:benefit analysis. However the assumption applies equally to all options so is reasonable for this study.

Copenhagen S-Bane Automation Study
______________________________________________________________
Ramboll-Atkins-Emch+Berger-Parsons 39
7.2 Service Options
A number of service pattern variants were considered.
Table 12 Service Options
Koge Fred Hoje Hill FarumKlamp Koge Fred Hoje Hill FarumKlamp
1 Today Today's Timetable (13.12.2009)
2 TT30 Today's Pattern with faster running times (STO)
3 TT33 Option 2 plus extra 3 tph H (Frederikssund to Farum)
4 TT36 Option 3 plus extra 3tph Bx (Hoje Taastrup to Osterport) 12
5 TT34 Today's Pattern but on 8 minute standard* 11.25 11.25 11.25 15 11.25 7.5 11.25 11.25 7.5 11.25 11.25 7.5
6 M30 "Metro Running" 9
7 M33 "Metro Running"
8 M36 "Metro Running" 12 12
9 M34 "Metro Running" 11.25 11.25 11.25 15 11.25 7.5 11.25 11.25 7.5 11.25 11.25 7.5
10 M45 "Metro Running" (Shuttle Hoje Taastrup to Kobenahvn H) 15 15 15 15 9 6 12 12 12 12 9 6
9 9
12
Peak TPHOption Description
Off Peak TPH
12 12 6 12 6 129
12
9
* Requires some slowing of fast trains with additional stops
9 6
129
1212 6 12 6 12 9 6
9
9
For the F-Line frequencies of 12tph, 15tph and 18tph were considered. The detailed service specifications (reversing points and stopping patterns) are described in the following tables. The services use the same notation as today (A-H) but the routes for some of the services are re-defined in some of the options.

Copenhagen S-Bane Automation Study
______________________________________________________________
Ramboll-Atkins-Emch+Berger-Parsons 40
Table 13 Detailed Service Frequencies Peak TPH Off Peak TPH
A B Bx C E H TOTAL A B Bx C E H TOTAL 1 6 6 3 6 6 3 30 6 6 0 6 6 3 27 2 6 6 3 6 6 3 30 6 6 0 6 6 3 27 3 6 6 6 6 6 3 33 6 6 0 6 6 3 27 4 6 6 6 6 6 6 36 6 6 0 6 6 3 27 5 7.5 7.5 3.75 7.5 3.75 3.75 33.75 7.5 7.5 0 7.5 3.75 3.75 30 6 0 6 3 0 12 9 30 0 6 0 0 12 9 27 7 0 6 6 0 12 9 33 0 6 0 0 12 9 27 8 0 6 6 0 12 12 36 0 6 0 0 12 9 27 9 0 7.5 0 0 15 11.25 33.75 0 7.5 0 0 11.3 11.25 30 10 0 0 15 6 15 9 45 0 0 12 6 12 6 30
Table 14 Detailed Line Descriptions for Options
A B Bx C E H 1 Alternate Hundige
and Solrod Strand 80 mins a.m peak only
Alternate Ballerup and
Frederiksund Farum 2hr Peak only, else Osterport
2 Alternate Hundige
and Solrod Strand Full 2hr Peaks
Alternate Ballerup and
Frederiksund Farum 2hr Peak only, else Osterport
3 Alternate Hundige
and Solrod Strand Full 2hr Peaks
Alternate Ballerup and
Frederiksund Farum 2hr Peak only, else Osterport
4 Alternate Hundige
and Solrod Strand Full 2hr Peaks
Alternate Ballerup and
Frederiksund Farum 2hr Peak only, else Osterport
5 Alternate Koge and
Solrod Strand
Alternate Holte and
Hilleroid Full 2hr Peaks
Alternate Ballerup and
Frederiksund
Additionally calls Friheden &
Amarken and Virum & Sorgenfri.
Farum all day. Additionally calls at
Kildedale, Malmparken, & Skovlunde
and Emdrup..
6 N/A
New Route. All Stops
Hoje Tasstrup to
Klampenbourg. 2hr Peak Only. Stops Everywhere. N/A
Koge to Hilleroid Stops Everywhere
peak. Off Peak 6 tph reverse Solrod
Strand and 6tph Holte.
Frederiksund to Farum stops
everywhere. Off peak 3 tph reverse
Ballerup and Osterport.
7 N/A
New Route. All Stops
Hoje Tasstrup to
Klampenbourg. 2hr Peak Only. Stops Everywhere. N/A
Koge to Hilleroid Stops Everywhere
peak. Off Peak 6 tph reverse Solrod
Strand and 6tph Holte.
Frederiksund to Farum stops
everywhere. Off peak 3 tph reverse
Ballerup and Osterport.
8 N/A
New Route. All Stops
Hoje Tasstrup to
Klampenbourg. 2hr Peak Only. Stops Everywhere. N/A
Koge to Hilleroid Stops Everywhere
peak. Off Peak 6 tph reverse Solrod
Strand and 6tph Holte.
Frederiksund to Farum stops
everywhere. Off peak 3 tph reverse
Ballerup and Osterport.
9 N/A
New Route. All Stops
Hoje Tasstrup to
Klampenbourg. N/A N/A
Koge to Hilleroid Stops Everywhere
peak. Half reverse Solrod Strand
and Holte peak and third off peak.
Frederiksund to Farum stops
everywhere. Off peak 3.75 tph reverse
Ballerup and 3.75 Osterport.
10 N/A N/A
New Route. All Stops Hoje Tasstrup to
Kobenhavn H (3 tph extends to
Osterport and 3tph to Farum off peak).
All stops Frederiksund to
Klampenbourg. Half reverse
Ballerup peak and off peak.
Koge to Hilleroid Stops Everywhere
peak. Half reverse Solrod Strand
and Holte peak and off peak.
Frederiksund to Farum stops
everywhere.
Copenhagen S-Bane Automation Study
______________________________________________________________
Ramboll-Atkins-Emch+Berger-Parsons 41
7.3 Description of Service Options
Option 1 is exactly as today’s timetable (with today’s NTO running times). This option is not really a sensible scenario to be considering for 2020, but is included just for completeness and validation of the model. Option 2 is today’s service pattern but with faster end-to-end running times and a little less recovery time. The Bx service runs for the full 2 hours peak. It also assumes a line speed increase from 100kph to 120 kph between Lyngby and Hillerod. The faster round-trip times mean that the timetable requires fewer trains. The extra vehicles are utilised to form more 16 car trains during the peaks. Options 3 and 4 are like option 2 but instead of using the extra vehicles to form longer trains, additional services are introduced on the Bx and H lines. Options 2, 3 and 4 are the set of options that retain the timetable/line branding philosophy of today. Option 5 is an attempt to redistribute services better than options 3 and 4. It shifts the repeating cycle from today’s 5/10/20 minute standard to a 4/8/16 minute standard. There are two important consequences of this.
i) The “fast” services save less time (than the slow services) compared to options 2 to 5 (i.e. a maximum of 4 minutes saved compared to 6 minutes). However the fast services are more frequent (8/16 minutes instead of 10/20 minutes).
ii) There is less value in publishing a timetable for the passengers.
Option 5 is therefore a “compromise option” between today’s “timetable philosophy” and a fully “metro-style” service. Options 6 to 9 are different variants of a metro style operation. There are no fast services. During the peaks all of the services go to the ends of the lines (except Osterport is used to reverse some peak trains north to south in options 6 to 8). These four metro-style options have been constructed in an attempt to find the best balance between the branches and north/south. The services that consume fewer trains have more 16 car trains during the peak. Option 10 is a radical re-configuration of services which provides a big increase in the total tph to the southern branches. This is achieved by introducing a “shuttle”5 service between Hoje Taastrup and Kobenhavn H. 5 Shuttle services are self-contained, usually short, end-to-end branch routes that connect into a busier network. They are part of the same network but can operate independently (although timetables may be configured to provide convenient connections with each other if services are infrequent).

Copenhagen S-Bane Automation Study
______________________________________________________________
Ramboll-Atkins-Emch+Berger-Parsons 42
7.4 The Shuttle Option (Hoje Taastrup to Kobenhavn H)
This option exploits the fact that there will be 4-tracks between Dybbolsbro and Kobenhavn H6 (two tracks in each direction). Exploiting this 4-track line capacity and using platform 11 at Kobenhavn H as a reversing facility, enables 15 tph to operate to all the three southern branches without overloading the central trunk section Vesterport to Nordhavn (which would be at 30tph as today).
Shuttle Operation (Shown in Red)
Figure 12 Shuttle Operation
The disadvantage with any shuttle service is that more passengers have to interchange. Anybody coming from the Hoje Taastrup branch travelling beyond Kobenhavn H will need to interchange at Dybbolsbro to avoid having to walk over the footbridge at Kobenhavn H. However, the interchange will be easy and 30tph will be operating through the platform alongside, so the additional walking and waiting time will be very small. In the reverse direction (southbound) passengers can interchange at either Kobenhavn H or Dybbolsbro. The revised service pattern should not be operationally difficult, but it will be necessary to be able to reverse trains quickly at Kobenhavn H (probably 1 to 2 minutes) as it is essential that no trains are delayed outside of Kobenhavn H as a result of platform 11 being occupied. Without automation this would possibly require a “stepping back” or “double ending” arrangement requiring extra Train Drivers7.
6 Track 138 will be re-instated linking Kobenhavn H and Enghave through the disused southbound platform at Dybbolsbro. 7 “Stepping back” requires a spare driver waiting at platform 11 Kobenhavn H to immediately enter the driving cab and reverse the train. “Double ending” is where another driver enters the rear cab at Dybbolsbro so is able to reverse the train immediately at Kobenhavn H (this option is expensive needing extra drivers). Another possibility is that the same driver changes ends as quickly as possible and always has signalling authority to proceed to Dybbolsbro, where the train can wait to regulate to plan if necessary (this quick change of ends might be possible with short trains).

Copenhagen S-Bane Automation Study
______________________________________________________________
Ramboll-Atkins-Emch+Berger-Parsons 43
With Automatic Turnaround, the driver could change ends while the train is travelling Dybbolsbro-Kobenhavn-Dybbolsbro. With DTO or UTO there is no problem. It is unfortunate that the track layout requires the trains from Hoje Taastrup to cross the trains from Koge to arrive in platform 11 at Kobenhavn H (see track diagram above). There is also a conflicting move with trains for Koge when departing Dybbolsbro for Enghave. These conflicts could be eliminated if the shuttle service was the Koge service rather than the Hoje Taastrup service, but there would be many more passengers from the Koge branch needing to interchange. Another variant would be to make some or all of the shuttles come from Frederikssund, as this branch has fewer interchangers than the Hoje Taastrup branch and the number of conflicting train moves would be the same. However, there are some other advantages in selecting the Hoje Taastrup branch for the shuttle service. The reasons are to do with future automation possibilities and the number of trains required to operate the shuttle:
i) The running time from Hoje Taastrup is the quickest (compared to Koge or Frederikssund) so, if only the shuttle were to be automated to a high frequency metro operation, the adverse impact on the long distance commuter would be less and fewer trains would need to be converted.
ii) It would be possible to operate the shuttle with SE trains. A first step towards network automation could be to convert all the SEs to DTO capability, and operate DTO on the F-Line and on the Hoje Taastrup shuttle.
iii) Operating the shuttle with SEs reduces the train conflict times (as the trains are shorter).
iv) Hoje Taastrup is where the depot is situated. If all the replacement fleet was equipped for DTO/UTO but only part of the network equipped for DTO/UTO operation, it would be possible to bring trains to and from the depot in DTO/UTO and keep Kobenhavn H as the location where all Train Drivers are managed. This would make it operationally very easy to introduce extra trains into service or return trains to depot and easier to change the service particularly during and after disruptions.
7.5 Results of Base Case Modelling
i) Explanation of Chart
The following chart shows the average passenger journey times (generalised time in minutes per passenger) for each of the ten service options described in 9.3. The results include peak and off peak journey times combined and are broken down by the journey component (platform wait time, on train time (OTT), crowding penalty & interchange penalty). The lower the journey time the better the service for the average passenger.

Copenhagen S-Bane Automation Study
______________________________________________________________
Ramboll-Atkins-Emch+Berger-Parsons 44
8.37 8.18 8.17 8.09
6.88 6.70 6.686.19 5.94 5.66
0.350.34 0.20
0.87
0.72
0.05 0.05
0.050.01
0.08
13.97
11.51 11.47
11.68
12.11
12.29 12.30
12.05 12.3212.03
0.37
0.180.17
0.25
0.34
0.23 0.28
0.12 0.20
0.13
0.23
0.430.43
0.43
0.19
0.25 0.26
0.23 0.26
0.23
0
1
2
3
4
5
6
7
8
9
10
11
12
13
14
15
16
17
18
19
20
21
22
23
24
25
Today TT30 TT33 TT36 TT34 M30 M33 M36 M34 M45
Wait <12 Wait > 12 OTT Crowding Interchange
Figure 13 Journey Time Comparisons for Options
The top two components on the chart (interchange and crowding) are similarly small throughout the options. This is to be expected as all options consume the same number of vehicles (train cars) in all cases during the peaks, and the number of interchangers will be small regardless of the service pattern.

Copenhagen S-Bane Automation Study
______________________________________________________________
Ramboll-Atkins-Emch+Berger-Parsons 45
The on-train times represent the average time spent riding on the train (inter-station run times and dwell times). The differences between the options are due to:
i) the timetable (i.e. whether there are fast trains or not)
ii) dwell times (i.e. the numbers of boarders and alighters due to the headway of the train and the train length)
iii) the amount of train congestion (i.e. the occurrences of trains being impeded or held by the signalling).
The waiting times are weighted by a factor of 2 in accordance with a headway service treatment as very few passengers have a scheduled service frequency of greater than 12 minutes. However, for interest, the wait time is broken down to illustrate the average amount of time experienced on headways that are actually greater than 12 minutes. A high proportion of the total wait time in the greater-than-12-minutes category would tend to indicate that the option is not very stable, would be more difficult to operate, and would be less resilient to delays. Firm conclusions should not be drawn from just small differences between options as the modelling is imperfect. A degree of judgement has had to be taken when constructing the option (e.g. how to form up services at the termini and which trains are selected to be long, utilising the spare available cars). It is entirely possible that with more effort taken to optimise services, small differences between options could be reversed. ii) Results Summary
Option 1 is clearly the worst (has the highest overall journey time) as it reflects the NTO service (i.e. does not capture the benefits of the signalling upgrade). This is to be expected. Options 6-10, the metro options, are all superior to the timetable options 2-5. In general, the metro options have longer on-train times as a result of the withdrawal of fast services. However, the longer on-train times are out-weighed by the reduced waiting times. This confirms the results of the static analysis (see 4.3, 4.4 and Appendix A). The Prime simulation also picks up the “stability” benefit of a generally more uniform service pattern with the metro options. The best timetable option is option 3 (the 33tph timetable with additional H line services compared to today). The poor performance of Option 4 (the 36tph timetable with additional Bx services), appears to support the suggestion that it would be difficult to increase frequencies much beyond 33-34 tph whilst retaining the existing timetabling philosophy. The best metro option is the shuttle option 10. This is unsurprising as the frequency is the highest, and there is no additional pressure on the central trunk bottleneck

Copenhagen S-Bane Automation Study
______________________________________________________________
Ramboll-Atkins-Emch+Berger-Parsons 46
which remains at 30tph. Option 10 also has the highest operational costs (i.e. more train operators to drive the higher number of (shorter) trains).
7.6 Agreed Base Case
Although a metro service has the potential to provide reduced journey times overall, the study’s Steering Group elected to define a timetable operation as the base case. The following table summarises the agreed base case.
Infrastructure & Assets Signalling CBTC & STO (Higher capacity, and faster more
consistent inter-station running). Line Speed Today’s, except Lyngby – Hillerod 120km/h Track Layout Today’s, except reinstate 4th track through Dybbolsbro Rolling Stock to 2030 S-Train. 93 SAs and 27 SEs available for peak service
(out of 102 and 31 respectively) Rolling Stock post 2030 Similar layout characteristics as SA/SE, and fleet size
identical to today. Line side Fencing Maintained as today. No security enhancements
assumed. Service Pattern As today (lines defined by routes A-H. Peak Frequency Increased to 33 tph (increase H line from 3tph to 6 tph). Off Peak Frequency As today. Running Times Timetable improved to exploit STO and tighter margins. F-Line Increased from 12tph to 15 tph Staff Train Drivers Same ratio staff hours / train hours as today Revenue Inspectors Same ratio staff hours / train hours as today Runners Same ratio staff hours / train hours as today Passenger Demand Origins & Destinations Journeys as today
Table 15 Features of Base Case

Copenhagen S-Bane Automation Study
______________________________________________________________
Ramboll-Atkins-Emch+Berger-Parsons 47
8 AUTOMATION OPTIONS
Options were constructed to be compared against the base case. An option is a change programme defined over the same period as the base case (2020-2055) and represented by a sequence of service changes exploiting automation capability (STO+, DTO, UTO) over an area. Each option has its own stream of costs and benefits represented as a number of interventions & deltas relative to the base case. A realistic option must contain an “end-state” and an implied “migration strategy”. However, in order to more easily identify the strategic conclusions the number of interventions in each option is initially kept to a theoretical minimum before developing a single “best” option based upon a practical migration plan (see 11.3). The automation options do not include any reconfigurations to the service. This avoids confusing the benefits of automation with that of a service change that could be implemented in any event.
Name Description 1 UTO Implement UTO line wide with new rolling stock 2 DTO Implement UTO line wide with new rolling stock 3 Early DTO Implement DTO line wide converting existing rolling stock 4 STO+ Implement Auto Reversing line wide with new rolling stock 5 Pilot Line Implement DTO on Pilot Line 6 Pilot Line Implement UTO on Pilot Line
Table 16 Automation Options
As a comparison to the business case of automation a business case for moving to a metro-style service has been produced. The option is assessed over the period post signaling upgrade and pre new rolling stock, although the case for an earlier migration or combining the metro service with new trains and automation is strong also.
Name Description 7 Metro Implement 36tph Metro with existing rolling stock 2021- 2030
(Option 8 described in section 9) with no Automation
Table 17 Metro Option
It is important to note that none of the above options are:
i) Believed to be optimal
ii) Incorporate a realistic migration strategy. It is believed that a combination of automation and service reconfiguration combining the best features of each, and pursued as part of an incremental migration plan will be the best strategy (see section 9.4 “Hybrid” Options).

Copenhagen S-Bane Automation Study
______________________________________________________________
Ramboll-Atkins-Emch+Berger-Parsons 48
This page is intentionally blank

Copenhagen S-Bane Automation Study
______________________________________________________________
Ramboll-Atkins-Emch+Berger-Parsons 49
The following table summarises the results of the quantified assessment of the seven options, the results of which are presented in more detail in sections 8.1 to 8.7. The costs and benefits are indicative given the assumptions made throughout the study, so are examples of what might be achievable. All costs are in DKK millions 2010 prices. Positive numbers indicate cost savings & benefits, and negative signs indicate cost losses and disbenefits. Option Capital
Costs Annual
Maintenance & Energy
Annual Staff Costs
Annual Socio
Economic Benefit
Net Financial Effect
Including Revenue (Present Value)
Net Socio Economic
Benefit (Present Value)
Benefit Cost Ratio
1 UTO -3267 -160 204 102 -207 959 4.65 2 DTO -1734 -92 67 95 -425 888 2.09 3 ∆ Early DTO -240 -93 69 95 -467 601 1.29 4 STO+ -133 -1 15 0 65 0 Revenue Positive
5 Pilot DTO -172 -9 10 4 -43 62 1.44 6 Pilot UTO -324 -12 22 1 49 17 Revenue Positive
7 Metro STO 0 0 -7 59 156 1312 Revenue Positive
Table 18 Summary of Quantified Assessment
Copenhagen S-Bane Automation Study
______________________________________________________________
Ramboll-Atkins-Emch+Berger-Parsons 50
This page is intentionally blank
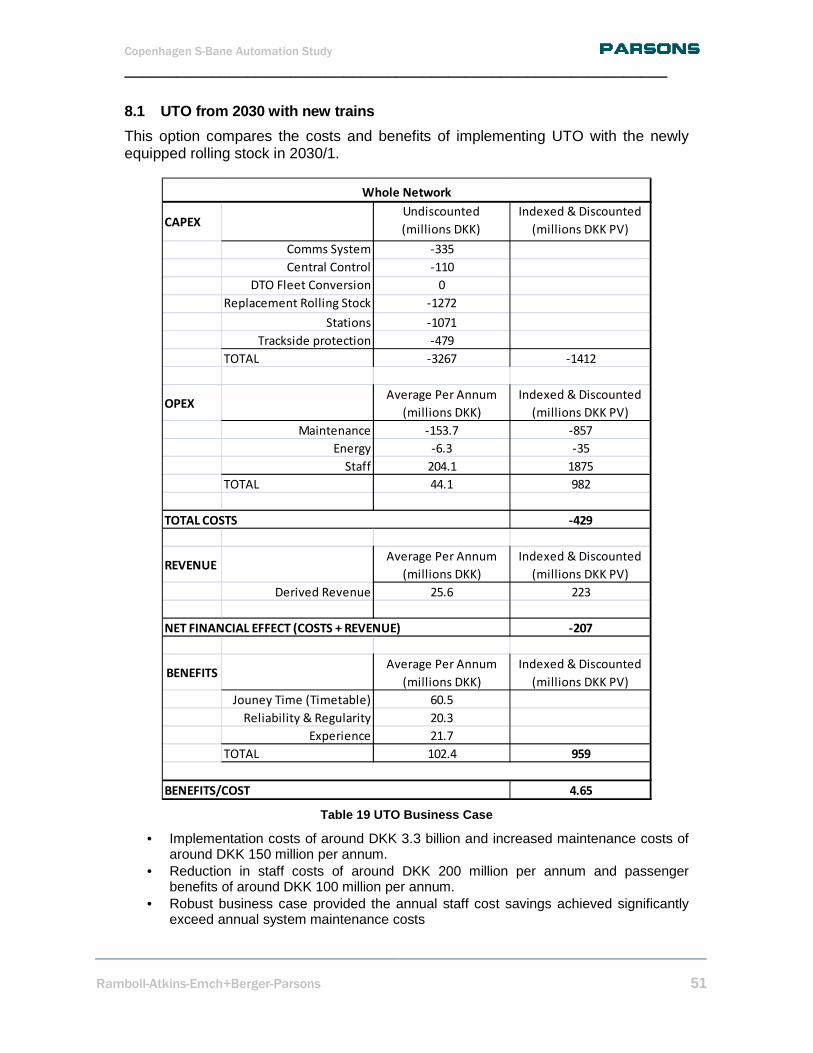
Copenhagen S-Bane Automation Study
______________________________________________________________
Ramboll-Atkins-Emch+Berger-Parsons 51
8.1 UTO from 2030 with new trains
This option compares the costs and benefits of implementing UTO with the newly equipped rolling stock in 2030/1.
CAPEXUndiscounted
(millions DKK)
Indexed & Discounted
(millions DKK PV)
Comms System -335
Central Control -110
DTO Fleet Conversion 0
Replacement Rolling Stock -1272
Stations -1071
Trackside protection -479
TOTAL -3267 -1412
OPEXAverage Per Annum
(millions DKK)
Indexed & Discounted
(millions DKK PV)
Maintenance -153.7 -857
Energy -6.3 -35
Staff 204.1 1875
TOTAL 44.1 982
-429
REVENUEAverage Per Annum
(millions DKK)
Indexed & Discounted
(millions DKK PV)
Derived Revenue 25.6 223
-207
BENEFITSAverage Per Annum
(millions DKK)
Indexed & Discounted
(millions DKK PV)
Jouney Time (Timetable) 60.5
Reliability & Regularity 20.3
Experience 21.7
TOTAL 102.4 959
4.65BENEFITS/COST
Whole Network
TOTAL COSTS
NET FINANCIAL EFFECT (COSTS + REVENUE)
Table 19 UTO Business Case
• Implementation costs of around DKK 3.3 billion and increased maintenance costs of around DKK 150 million per annum.
• Reduction in staff costs of around DKK 200 million per annum and passenger benefits of around DKK 100 million per annum.
• Robust business case provided the annual staff cost savings achieved significantly exceed annual system maintenance costs

Copenhagen S-Bane Automation Study
______________________________________________________________
Ramboll-Atkins-Emch+Berger-Parsons 52
8.2 DTO from 2030 with new trains
This option compares the costs and benefits of implementing DTO with the newly equipped rolling stock in 2030/1.
CAPEXUndiscounted
(millions DKK)
Indexed & Discounted
(millions DKK PV)
Comms System 0
Central Control 0
DTO Fleet Conversion 0
Replacement Rolling Stock -184
Stations -1071
Trackside protection -479
TOTAL -1734 -728
OPEXAverage Per Annum
(millions DKK)
Indexed & Discounted
(millions DKK PV)
Maintenance -87.7 -489
Energy -4.4 -25
Staff 66.5 611
TOTAL -25.6 97
-632
REVENUEAverage Per Annum
(millions DKK)
Indexed & Discounted
(millions DKK PV)
Derived Revenue 23.7 207
-425
BENEFITSAverage Per Annum
(millions DKK)
Indexed & Discounted
(millions DKK PV)
Jouney Time (Timetable) 46.8
Reliability & Regularity 1.4
Experience 46.6
TOTAL 94.8 888
2.09BENEFITS/COST
Whole Network
TOTAL COSTS
NET FINANCIAL EFFECT (COSTS + REVENUE)
Table 20 DTO Business Case
• Implementation costs of around DKK 1.7 billion and increased maintenance costs of around DKK 90 million per annum.
• Reduction in staff costs of around DKK 70 million per annum and passenger benefits of around DKK 95 million per annum.
• Business case exists, provided staff cost savings achieved. If even fewer Revenue Inspectors and greater emphasis on revenue protection duties for the Train Captain and/or a reduction in Train Captain employment costs (compared to Train Driver) could significantly strengthen business case.

Copenhagen S-Bane Automation Study
______________________________________________________________
Ramboll-Atkins-Emch+Berger-Parsons 53
8.3 Early DTO from 2020-2030 with converted trains
This option compares the costs and benefits of implementing DTO early with converted trains (2020/21) compared to implementing with new trains 10 years later.
CAPEXUndiscounted
(millions DKK)
Indexed & Discounted
(millions DKK PV)
Comms System 0
Central Control 0
DTO Fleet Conversion -240
Replacement Rolling Stock 0
Stations 0
Trackside protection 0
TOTAL -240 -567
OPEXAverage Per Annum
(millions DKK)
Indexed & Discounted
(millions DKK PV)
Maintenance -89.0 -444
Energy -4.4 -22
Staff 68.8 423
TOTAL -24.5 -43
-610
REVENUEAverage Per Annum
(millions DKK)
Indexed & Discounted
(millions DKK PV)
Derived Revenue 23.7 144
-467
BENEFITSAverage Per Annum
(millions DKK)
Indexed & Discounted
(millions DKK PV)
Jouney Time (Timetable) 46.8
Reliability & Regularity 1.4
Experience 46.6
TOTAL 94.8 601
1.29BENEFITS/COST
Whole Network
TOTAL COSTS
NET FINANCIAL EFFECT (COSTS + REVENUE)
Table 21 Early DTO Business Case
• Additional fleet conversions costs of DKK 240 million • Advancement by 10 years of around DKK 1.5 billion of costs on stations and
trackside protection. • Earlier reduction in staff costs of around DKK 70 million per annum and earlier
passenger benefits of around DKK 95 million per annum. • Case is marginal. Any delay to benefits realisation would undermine case.

Copenhagen S-Bane Automation Study
______________________________________________________________
Ramboll-Atkins-Emch+Berger-Parsons 54
8.4 STO+ from 2030 with new trains
This option compares the costs and benefits of implementing just Automatic Reversing with newly equipped rolling stock in 2030/31.
CAPEXUndiscounted
(millions DKK)
Indexed & Discounted
(millions DKK PV)
Comms System 0
Central Control 0
DTO Fleet Conversion 0
Replacement Rolling Stock 18
Stations -81
Trackside protection -70
TOTAL -133 -75
OPEXAverage Per Annum
(millions DKK)
Indexed & Discounted
(millions DKK PV)
Maintenance 1.0 5
Energy 0.0 0
Staff 14.7 135
TOTAL 15.6 140
65
REVENUEAverage Per Annum
(millions DKK)
Indexed & Discounted
(millions DKK PV)
Derived Revenue 0.0 0
65
BENEFITSAverage Per Annum
(millions DKK)
Indexed & Discounted
(millions DKK PV)
Jouney Time (Timetable) 0.0
Reliability & Regularity 0.0
Experience 0.0
TOTAL 0.0 0
Revenue PositiveBENEFITS/COST
Whole Network
TOTAL COSTS
NET FINANCIAL EFFECT (COSTS + REVENUE)
Table 22 STO+ Business Case
• Additional new fleet DTO train capability costs are more than offset with fewer trains • Intrusion detection and trackside protection equipment needed around termini (DKK
150 million). • Fewer trains in service require fewer train drivers saving DKK 15 million per annum. • Case is marginal and highly sensitive to detailed timetabling (reduction in layovers)
affecting staff savings. • Scheme unviable with existing fleet.

Copenhagen S-Bane Automation Study
______________________________________________________________
Ramboll-Atkins-Emch+Berger-Parsons 55
8.5 Pilot Line DTO from 2020+ (fleet conversion) th en 2030+ (new fleet)
This option compares the costs and benefits of implementing DTO on the F-Line. This could possibly be the position if the pursuit of automation on the other lines was abandoned after the pilot.
CAPEXUndiscounted
(millions DKK)
Indexed & Discounted
(millions DKK PV)
Comms System 0
Central Control 0
DTO Fleet Conversion -25
Replacement Rolling Stock 16
Stations -130
Trackside protection -33
TOTAL -172 -120
OPEX Average Per Annum Indexed & Discounted
Maintenance -8.6 -93
Energy 0.0 0
Staff 10.2 154
TOTAL 1.6 61
-58
REVENUEAverage Per Annum
(millions DKK)
Indexed & Discounted
(millions DKK PV)
Derived Revenue 1.0 15
-43
BENEFITSAverage Per Annum
(millions DKK)
Indexed & Discounted
(millions DKK PV)
Jouney Time (Timetable) 0.0
Reliability & Regularity 0.0
Experience 3.9
TOTAL 3.9 62
1.44
NET FINANCIAL EFFECT (COSTS + REVENUE)
Inner Ring Line (F-Line)
BENEFITS/COST
TOTAL COSTS
Table 23 Pilot Line DTO Business Case
• Implementation costs of DKK 170 million. • Staff savings offset system maintenance cost in today’s values, and savings continue
to increase in real terms (due to rising employment costs). • Benefits of DKK 4 million per annum (lower per passenger benefit than other lines
due to shorter trips). • Marginal business case over 35 years so unlikely to be an objective in its own right.

Copenhagen S-Bane Automation Study
______________________________________________________________
Ramboll-Atkins-Emch+Berger-Parsons 56
8.6 Pilot Line UTO from 2030
CAPEXUndiscounted
(millions DKK)
Indexed & Discounted
(millions DKK PV)
Comms System -67
Central Control -55
DTO Fleet Conversion 0
Replacement Rolling Stock -39
Stations -130
Trackside protection -33
TOTAL -324 -136
OPEX Average Per Annum Indexed & Discounted
Maintenance -11.7 -91
Energy 0.0 0
Staff 21.5 272
TOTAL 9.8 181
45
REVENUEAverage Per Annum
(millions DKK)
Indexed & Discounted
(millions DKK PV)
Derived Revenue 0.3 4
49
BENEFITSAverage Per Annum
(millions DKK)
Indexed & Discounted
(millions DKK PV)
Jouney Time (Timetable) 0.0
Reliability & Regularity 0.0
Experience 1.3
TOTAL 1.3 17
Revenue Positive
Inner Ring Line (F-Line)
BENEFITS/COST
TOTAL COSTS
NET FINANCIAL EFFECT (COSTS + REVENUE)
Table 24 Pilot Line UTO Business Case
• Implementation costs of DKK 320 million. • Staff savings offset system maintenance cost in today’s values, and savings continue
to increase in real terms (due to rising employment costs). • Benefits of DKK 1 million per annum (lower per passenger benefit than other lines
due to shorter trips). • Business case carrying 50% of fixed network costs for Communications and
Centralised control. • Due to simplicity and short line length, a more efficient service control concept could
be possible improving business case further (less Communications, Centralised Control and/or Mobile Staff Costs).
• Possible to implement pre-2030 with advanced rolling stock order.

Copenhagen S-Bane Automation Study
______________________________________________________________
Ramboll-Atkins-Emch+Berger-Parsons 57
8.7 Metro
This option compares the costs and benefits of implementing the Metro service (option 8 M36 described in section 9.3) for the ten year period following the signaling upgrade 2021 and until the new fleet is purchased 2030.
CAPEXUndiscounted
(millions DKK)
Indexed & Discounted
(millions DKK PV)
Comms System 0
Central Control 0
DTO Fleet Conversion 0
Replacement Rolling Stock 0
Stations 0
Trackside protection 0
TOTAL 0 0
OPEXAverage Per Annum
(millions DKK)
Indexed & Discounted
(millions DKK PV)
Maintenance 0.2 4
Energy 0.2 4
Staff -7.5 -166
TOTAL -7.0 -157
-157
REVENUEAverage Per Annum
(millions DKK)
Indexed & Discounted
(millions DKK PV)
Derived Revenue 14.8 313
156
BENEFITSAverage Per Annum
(millions DKK)
Indexed & Discounted
(millions DKK PV)
Jouney Time (Timetable) 59.1
Reliability & Regularity 0.0
Experience 0.0
TOTAL 59.1 1312
Revenue PositiveBENEFITS/COST
Whole Network
TOTAL COSTS
NET FINANCIAL EFFECT (COSTS + REVENUE)
Table 25 Metro Business Case
• Can be implemented without capital expenditure. • Benefits of DKK 200 million per annum due reduced waiting times and more
consistent intervals due to the simpler service pattern. • More trains in service (fewer longer trains during the peaks) requires more train
drivers DKK 28 million per annum) • Strong business case. • Opportunity for flexible traffic planning and synergy with automation options.

Copenhagen S-Bane Automation Study
______________________________________________________________
Ramboll-Atkins-Emch+Berger-Parsons 58
9 MIGRATION
9.1 Migration Issues
There are a number of issues to consider for a migration towards UTO.
i) There are potentially a large number of risks with such a major change programme (see section 12) but a well-considered, gradual migration will enable these risks to be managed more easily and effectively. A slower migration may defer some of the potential return on the earlier investments, but a slower migration is a more preferable strategy for managing the technology, operational, organisational and service changes in small increments.
ii) Although incremental change is usually considered to be good industry practice, there are some practical difficulties in combining different operational concepts over the same network when the routes and services are interworked. Although technically a train is either operating in STO, DTO or UTO mode and can easily be made to interwork together, the operational procedures that will need to be in place to deal with failure scenarios will differ depending upon circumstances. This is likely to make training and planning staff deployment much more complicated.
iii) The profiles of expenditure compared to the timing of the exploitation of
benefits will significantly affect the overall business case. Ideally expenditure should be deferred as long as possible and closely match the profile of benefits.
iv) The assumed replacement of the S-Train fleet in 2030 is a key consideration. A major strategic decision whether to opt for STO, DTO or UTO long term will be required before the train fleet procurement. Until that decision needs to be taken, automation can be pursued in trial areas to inform the decision, but there are risks of abortive costs if the policy-makers decide to change the overall strategy.
v) Converting all or some of the existing trains to UTO is unlikely to be viable
given the diminishing remaining life of the fleet following the Signalling Programme (i.e. only a maximum of 10 years 2020-2030). Therefore an implementation of DTO on all or part of the S-Bane during the period 2020-2030 is more viable. This strategy defers a decision on commitment to investments in UTO systems (Communications, Rolling Stock etc) until 2025+ until some DTO experience is gained.
vi) ATA potentially provides a high benefit for a small geographical
implementation of PTID and Track Protection. However, converting all the SA’s to exploit just a small number of reversing locations prior to 2030 is unlikely to be very efficient. Alternatively, only converting some SA’s and

Copenhagen S-Bane Automation Study
______________________________________________________________
Ramboll-Atkins-Emch+Berger-Parsons 59
restricting the routes on which they operate (segmenting the fleet) may introduce problems when the service becomes disrupted (as it restricts the options available to the Traffic Controllers).
vii) UTO or DTO network-wide requires a considerable investment in PTID and
Track Protection. By testing the technology, operational concepts and public reaction on a smaller area (or a number of smaller areas) there is much less financial exposure if the plan has to be significantly re-engineered or aborted.
viii) The Inner Ring (F-Line) is an ideal early-deployment area as it is short and self-contained (i.e. disruptions on the F-Line do not affect the rest of the network). Also the line operates with around 10 4-Car SE trains only making partial fleet conversion to DTO (SEs only) an efficient option as the fleet is easily “segmented” from the rest of the network.
ix) Migration towards the changed service pattern is also a consideration. The
base case options described in 9.3 are meant to be the services that could be operated shortly after STO is implemented (around 2020/2021) without needing further investments in automation. However, if the service that would be operated with ATA, DTO or UTO differs from the base case service, then there is a question of whether to change the service a) before, b) at the same time, or c) after the technology is introduced. It is also possible to either change the service in small increments or combine the STO change with the automation change into one “big bang” change.
x) Adopting DTO as a migration state obviously has benefits from a risk mitigation perspective, but may make it politically more difficult to achieve UTO, as the incremental case to UTO may be seen as creating a reduction in customer service (and perceived safety) simply to save costs through staff cuts. The resistance to the final change to UTO may therefore be greater than from STO, when the overall package is more clearly bringing service and safety benefits.
9.2 Migration Plan
The process of developing the migration plan and evaluating the business case is iterative. However, some simple tests using the Business Case Model, tended to confirm the following principles:
1) The base case service (9.6) should be implemented soon after 2020 to exploit the benefits of the Signalling Programme.
2) DTO could be implemented on the F-Line as early as possible following the introduction of STO. This involves equipping the 24 platforms with PTID Systems, securing 12 kilometres of track with security fencing, bridge caging etc, and converting at least 12 SE trains (cab rewiring, door fitments etc).

Copenhagen S-Bane Automation Study
______________________________________________________________
Ramboll-Atkins-Emch+Berger-Parsons 60
3) DTO or ATA could also be implemented on part of the S-Bane network (excluding the F-Line) at the same time, or soon after the F-Line implementation. This could either be: a) ATA at all reversing locations (see 5.4) requiring all the S-Train fleet to be
modified. This saves operational costs as fewer trains (and staff) are needed to operate the service.
b) Implementing DTO on the shuttle service Hoje Taastrup to Kobenhavn H, with just the remaining SE trains being converted to provide this service. This improves the operation of the shuttle with only few trains needing to be converted.
c) Both of the above.
However, unless the purchase of new trains was advanced, and/or the service reconfigured (and segregated by operational concept and rolling stock groups over different routes or geographical areas) DTO introduction (prior to stock replacement) is unlikely to be favourable to the business case unless the Revenue Protection costs are reduced accordingly (see 5.5.2 & 10.3). The advancement costs of additional PTID and Track Protection being delivered early would then be compensated by operational cost savings. However, this would require an early reduction in the number of Revenue Inspectors and adapting the Train Driver to a Train Captain that is trained to support the Revenue Protection activities in order to prevent fare evasion increasing.
4) A decision can be taken whether to pursue UTO prior to the procurement of the new rolling stock. If UTO is to be pursued, it could be tested and operated on the F-Line with around 10-12 new 4-car trains prior to the rest of the fleet production. This would require investments in the Control and Communications systems but would enable the rolling stock reliability to be proved. The strategy also defers the greater expenditure of equipping the rest of the network with PTID and Track Protection for another 1-2 years.
5) UTO could then be implemented in stages over geographical areas. With an interworked timetable service, and the fact that staff efficiencies are likely to be more significant than passenger benefits, there seem to be no obvious advantages for starting the migration in any one particular area than other (from a benefits realisation perspective).

Copenhagen S-Bane Automation Study
______________________________________________________________
Ramboll-Atkins-Emch+Berger-Parsons 61
9.3 Sensitivity Test
From the findings in Section 10, 11.1 & 11.2 a business case has been produced for a realistically deliverable migration. It should be considered to be a cautious assumption of how the benefits of automation might lag the expenditure as a result of the practicalities of absorbing change and minimising risk. The business case is based upon the following plan:
2020 Signalling Implemented 2021 Signalling Benefits Realised 2022 DTO Implemented on F-Line 2025 Go/No go decision to pursue automation on other lines 2030 New fleet Introduced with UTO Capability 2031-2033 Progressive DTO roll-out (no particular geographic priority assumed) 2033 UTO Implemented on F-Line 2034-2036 Progressive UTO roll-out (no particular geographic priority assumed)
This business case for the phased introduction is evaluated over 35 years from 2020. The business case is still reasonable (ratio 1.89), but it is worse than the “theoretical” UTO case presented in 8.1 (ratio 4.68) because the benefits “lag” the investment more to allow for a more realistic migration.
However, whilst this scenario confirms the viability of automation from a business case perspective, the sensitivity test, whilst realistically deliverable, is unlikely to be optimal.
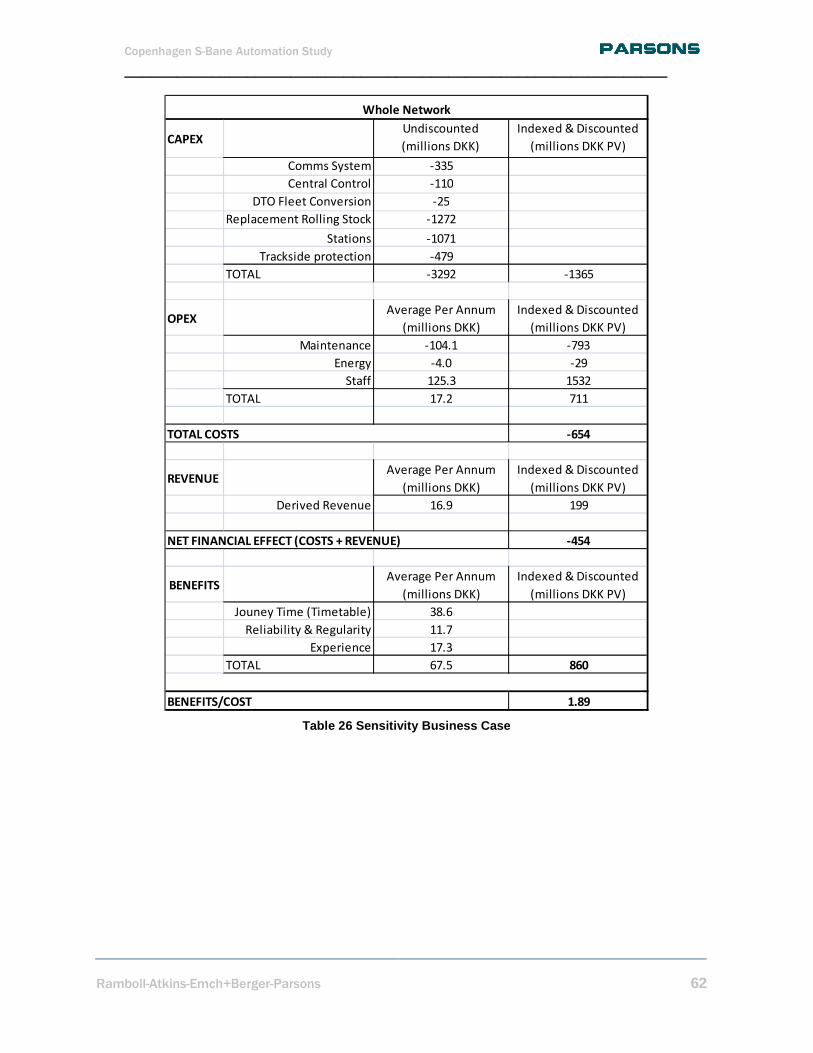
Copenhagen S-Bane Automation Study
______________________________________________________________
Ramboll-Atkins-Emch+Berger-Parsons 62
CAPEXUndiscounted
(millions DKK)
Indexed & Discounted
(millions DKK PV)
Comms System -335
Central Control -110
DTO Fleet Conversion -25
Replacement Rolling Stock -1272
Stations -1071
Trackside protection -479
TOTAL -3292 -1365
OPEXAverage Per Annum
(millions DKK)
Indexed & Discounted
(millions DKK PV)
Maintenance -104.1 -793
Energy -4.0 -29
Staff 125.3 1532
TOTAL 17.2 711
-654
REVENUEAverage Per Annum
(millions DKK)
Indexed & Discounted
(millions DKK PV)
Derived Revenue 16.9 199
-454
BENEFITSAverage Per Annum
(millions DKK)
Indexed & Discounted
(millions DKK PV)
Jouney Time (Timetable) 38.6
Reliability & Regularity 11.7
Experience 17.3
TOTAL 67.5 860
1.89BENEFITS/COST
Whole Network
TOTAL COSTS
NET FINANCIAL EFFECT (COSTS + REVENUE)
Table 26 Sensitivity Business Case

Copenhagen S-Bane Automation Study
______________________________________________________________
Ramboll-Atkins-Emch+Berger-Parsons 63
9.4 Hybrid Options
A “hybrid” option, in the context of the study, means a state (either an end-state or a state during migration) where different services or geographical areas exploit differing levels of automation.
However, what makes a hybrid state different from just any migration step is that a hybrid state will be based upon a logical partitioning of services that makes sense from an operational and traffic planning perspective. If further hybrid states can be identified (other than just the obvious separation of the F-Line), there is a realistic prospect of finding an automation strategy that is more economically viable, truly incremental and more acceptable from a political perspective. Hybrid investment scenarios have not been analysed in any detail during the study as it was not part of the original scope and requires a greater traffic planning perspective.
i) Advantages of Hybrid Strategy
- Better provides for the proving of the operating concepts8 and gauging customer reaction.
- The benefits will be apparent at each increment.
- The business case need not be dependent upon achieving the next stage as a business case will be developed for each increment. This will enable progressive investments to be made that match growing demand, whilst securing early benefit delivery.
- If a subsequent stage is deferred or not progressed, the railway is not left in the state of an “unfinished” upgrade.
ii) Examples of Hybrid Options
- STO+ around the termini
- DTO or UTO on the F-Line
- DTO or UTO between Hoje Taastrup and Kobenhavn H (as metro-style
shuttle)
8 This may mean having separate operating concepts on different parts of the network.
Copenhagen S-Bane Automation Study
______________________________________________________________
Ramboll-Atkins-Emch+Berger-Parsons 64
10 RISK
10.1 Introduction
It was not possible to perform a risk assessment as part of this study. Ideally risk workshops should be performed involving all stakeholders as this would enable the risks that are specific to the S-Bane environment to be captured. However, from previous studies on other metros a number of general risks have been identified which are likely to apply to the S-Bane Automation.
Risks can be considered depending upon the phase of the project when the cause of the risk would occur:
i) Feasibility
ii) Design
iii) Pre-Implementation
iv) Implementation
v) Post-Implementation
10.2 Feasibility Risks
The biggest risk that could occur during the feasibility stage of the project is that the project is prematurely stopped or delayed. The two main cause of this would be: i) Government will not have sufficient confidence or courage to pursue the
project for fear of political, passenger or trade union opposition. ii) Government will not be convinced of the economic or business case for
pursing UTO. The second of these is also affected by other long-term strategic issues (future organisation, fleet replacement, other projects etc) and competition for funding. Where there are numerous options and uncertainty, there may be a greater tendency to not take a positive decision unless the business case is very strong.
10.3 Design Risks
The risks that are caused during the design of UTO would typically result in delays and cost overruns, perhaps during the implementation phase if the project proceeds with poor design solutions. The novelty and increased complexity of the UTO systems mean the project is more prone to risk if the design authority does not have the right skills and competencies available. System reliability, and the impact that the increased safety systems have on overall system performance are the main concerns. The complications of any changes to the network (i.e. a line extension) would increase the risk further.

Copenhagen S-Bane Automation Study
______________________________________________________________
Ramboll-Atkins-Emch+Berger-Parsons 65
10.4 Pre Implementation Risks
Pre-implementation it will be necessary to ensure that there will be a willing, competent operator to enable a smooth migration to UTO and then deliver the benefits of UTO to the passengers and stakeholders. There are risks if a suitable operator is not appointed with an appropriate contractual relationship. There is less risk if the contractual arrangements encourage, rather than resist, the journey to UTO. The project may also be exposed to the risk of political and economic change resulting in external interference or even withdrawal of necessary funding.
10.5 Implementation Risks
The implementation risks are likely to be the most numerous. They can be categorised further into the following groups depending upon the responsibility for the cause of the risk. i) Infrastructure Owner
A risk of delay, cost overruns and loss of reputation is caused by a possible lack of a suitably competent technical and project management resource within the Infrastructure Owner. Also a failure to manage passenger and stakeholder expectations could result in loss of reputation if the benefits of the project are ‘over-sold’ by the Infrastructure Owner. ii) Safety
Difficulty in gaining safety approvals from the Danish Rail Inspectorate and Health and Safety Authorities or objections from the Fire Brigade could lead to delays and cost increases (or ultimately failure to achieve UTO). Possible causes are poor planning, failure to involve the right authorities early enough, inconsistencies between standards if part of the network is STO/DTO, and the possibility of an incident occurring (either on the S-Bane or elsewhere in the world) that changes the safety criteria.
iii) Passenger
The interaction of the passengers with the UTO systems is an area of risk and could result in disturbances to the service. Accidental or deliberate interference with the train doors, emergency brakes and intrusion detection systems are possible areas of risk. The handling of encumbered or disabled passengers could cause additional problems if the design and planning of solutions is insufficient. Managing and educating the passengers differently on the UTO areas (as opposed to the STO/DTO) could result in passenger confusion during migration, or if UTO is only partially implemented.

Copenhagen S-Bane Automation Study
______________________________________________________________
Ramboll-Atkins-Emch+Berger-Parsons 66
iv) Operator
It is possible that, even with early commitment to UTO from the chosen operator, the size of the change is too great to be undertaken without incurring increased costs (e.g. double manning of mobile staff).
v) Maintainer
Increased costs and service disturbances would be caused if the impact that UTO has on track maintenance or depot operations is under-estimated or poorly planned for. Reduced ability to perform track maintenance activities during traffic hours and failure to resource and plan for maintenance of more hi-tech systems are likely causes. vi) Political
Changes to the political climate could result in pressure to delay implementation or to incur extra costs to meet additional demands from trade unions, political bodies or pressure groups.
vii) Post Implementation
Plans beyond the first stages of the automation programme would depend, to some extent, upon the early success of those changes. This may result in pressures to change the future long term strategy.

Copenhagen S-Bane Automation Study
______________________________________________________________
Ramboll-Atkins-Emch+Berger-Parsons 67
11 CONCLUSIONS & RECOMMENDATIONS
11.1 Conclusions
Signalling Upgrade
i) The signalling upgrade and STO capability provide the potential for faster, more frequent, and more reliable services compared to today’s timetable.
ii) Due to the interworking of fast and slow services and the importance of maintaining punctuality for the passengers’ timetable, 33tph through the trunk section appears to be the best practical peak service frequency post the signalling upgrade.
iii) The timetable philosophy and the central trunk section bottleneck, limits the capacity growth of the network in the long term.
Driverless Operations
i) The long-term case for further investment in systems to enable automation is clear but is dependent upon resultant operating cost savings. These savings will require an organisational redesign, combining existing job roles into more flexible, customer-facing roles.
ii) With no growth in passenger demand assumed, in none of the automation scenarios considered, were the passenger service benefits alone found sufficient to justify the technology costs.
iii) Unattended Train Operations (UTO) (combining the revenue control and train driving roles into a Mobile Staff role) has the greatest operating cost savings and the most favourable business case.
iv) DTO (where the Train Driver is replaced with a Train Captain free to move through the train) also has a business case. The case is less attractive than for UTO but would be easier to achieve than UTO.
Automation Prior to Fleet Replacement
i) The business case for early network-wide DTO implementation involving the conversion of existing trains is marginal. Early UTO is not viable from a business case perspective.
ii) The opportunities and benefits of STO+ are limited with current train design and have limited strategic significance on their own without growth in traffic.
iii) A viable early deployment would be to equip the Inner Ring Line (F-Line) as a pilot line soon after the signalling upgrade (2020) and prior to the replacement of the existing S-Train fleet. This could be done by converting a number of the existing trains or advancing the purchase of some new trains.
Metro Style Operation
i) There are opportunities to reconfigure the service into a metro-style operation further improving journey times and increasing total network capacity in the long-

Copenhagen S-Bane Automation Study
______________________________________________________________
Ramboll-Atkins-Emch+Berger-Parsons 68
term.
ii) The business case for metro operations appears very strong but would require an increase in staff. The benefits are greatest following the signalling upgrade but a variant could be implemented earlier.
Hybrid Scenarios
i) The study has not considered automation and migration strategies based upon hybrid options where different parts of the network exploit different levels of automation (STO, STO+, DTO and UTO). Hybrid options may require reconfiguring the service into “part metro / part timetable” or “shuttle services”.
ii) Hybrid options would facilitate the automation migration compared to the situation envisaged with the assumed timetabled service (where only the F-Line can be separated) and potentially offer more efficient migration and end-states. This would further strengthen the case for automation.
iii) The best performing base-case option in terms of journey times (option 10) utilised a shuttle. This option provides enhanced capacity and more alternatives for implementing automation and suggests that hybrid options are likely to be the most advantageous way of implementing automation.
iv) Alternative automation strategies involving hybrid options may emerge if the long term requirements of the S-Bane are considered further as part of an overall upgrade plan designed to meet the future needs of the network. The plan could consider all asset areas, track layout, operations and radical reconfiguration of services and be optimised based upon a whole-life cost:benefit approach.
11.2 Recommendations
i) There is a business case for automation in the long term. The opportunity should be pursued further.
ii) Automation will be best implemented with a hybrid strategy to maximise early benefit delivery and minimise implementation risk. The next stage of the study should be to develop these hybrid options and define a strategy.
iii) Automation should be progressed as an overall line-upgrade plan considering all asset areas, track layout, services and operations. The plan can be optimised as a system on a whole-life cost:benefit basis.
iv) A more detailed operating concept and organisational design should be developed for the emergent hybrid solution.
v) There are significant benefits to be derived from the Signalling Programme which have yet to be fully specified as part of a benefits management plan. This should be progressed irrespective of any future automation studies.
vi) The possibility of moving towards a metro-style of service should be considered regardless of automation potential.

Copenhagen S-Bane Automation Study
______________________________________________________________
Ramboll-Atkins-Emch+Berger-Parsons 69
12 Contact Details & Acknowledgements
This report was produced by Parsons Transportation Group, for further assistance please contact: Paul Thomas, Vice President Parsons Holborn Gate4, 330 High Holborn London WC1V 7QT UK +44 (0)20 7203 8440 +44 (0)78 7947 4982 [email protected] [email protected] www.parsons.com Parsons gratefully acknowledge the assistance received from many individuals working for the Ministry of Transport, Banedanmark, DSB S-Tog and the Metro. Requests for information were dealt with willingly and promptly and all questions were answered to the best of the organisations’ abilities. Particular acknowledgement is extended to the individuals below and their colleagues, who spent many hours assisting Parsons through numerous meetings, conference calls and email exchanges. Without this input the production of this report would not have been possible. Jorgen Ostergaard – Ministry of Transport Bastian Zibrandtsen – Ministry of Transport Michael Larsen - Banedanmark Joachim Bak – DSB S-Tog Cathrine Spangsberg Ipsen – DSB S-Tog Helge Erlandsen - Metro

Copenhagen S-Bane Automation Study
______________________________________________________________
Ramboll-Atkins-Emch+Berger-Parsons 70
This Page is Intentionally Blank

Copenhagen S-Bane Automation Study
______________________________________________________________
Ramboll-Atkins-Emch+Berger-Parsons 71
APPENDICES
Copenhagen S-Bane Automation Study
______________________________________________________________
Ramboll-Atkins-Emch+Berger-Parsons 72
APPENDIX A - OPERATIONAL CONCEPTS
The Context Diagram below is taken from Section 3.1 of the Operational Concept produced by the Signalling Programme (Ref: SP-13-017439-SSST App 3.2 Functional Requirements Att 2 Operational Concept.docx). It shows the roles and systems for STO. Section 5 of the same document contains nearly 100 detailed concept statements (most concept statements have several more detailed sub-statements associated with them). Each concept statement compares the current case with the STO case and the UTO case. The concept statements in the operational concept have not been revisited as part of this study. However, the important differences between NTO, STO, DTO and UTO are summarised in sections 5.1 to 5.3. The DTO case will either be the same as the STO or UTO case depending upon whether the function is performed by staff or system. Typically with DTO, during normal operations systems perform the routine functions (5.1) but the Train Captain tends to perform the same role as the Train Driver for when there are failures and incidents (5.2). Train Regulation (5.3) generally has the same restrictions for DTO as STO. Automatic Turnaround (ATA) is described separately in 5.4. The staffing concepts for DTO and UTO are discussed in more detail in section 5.5.

Copenhagen S-Bane Automation Study
______________________________________________________________
Ramboll-Atkins-Emch+Berger-Parsons 73
Figure 14 Architecture of Roles and Systems
Copenhagen S-Bane Automation Study
______________________________________________________________
Ramboll-Atkins-Emch+Berger-Parsons 74
This Page is Intentionally Blank

Copenhagen S-Bane Automation Study
______________________________________________________________
Ramboll-Atkins-Emch+Berger-Parsons 75
1 Normal Operations
Section 5.1 of the Operational Concept (SP-13-017439-SSST App 3.2 Functional Requirements Att 2 Operational Concept.docx) describes the normal functions that occur during the traffic day. The main differences at UTO are summarised below. During normal operations, DTO is more like UTO than STO as the systems perform most of the normal functions automatically. Where the comment has been highlighted in green a benefit has been assumed in the business case.
STO UTO Comment DTO
Train Preparation
Performed by Runners like today. Self Testing.
UTO procedure requires remote diagnosis systems, Enhanced Fleet Manager and possible Mobile Staff
Involvement. Small reduction in Runners.
STO
Enter Train Performed by Runners (like NTO).
Runners take train to handover point where train is automatically
driven unattended to first platform.
Handover point likely to be before platform so small reduction in the
Runners. STO
Platform Start
Train Driver observes
platform/train interface (like NTO).
Doors close and train departs automatically.
Requires Intrusion prevention or detection (PSD or PTID). Sensitive edge doors needed. Handheld or
door panel override feature for Train Captain or Mobile Staff. Variability in
dwell times is reduced.
UTO
Drive on Line
Train automatically driven but Train Driver observes
track clear ahead and brakes if
required (like NTO).
No manual monitoring from drivers cab.
Obstacles must be prevented and collisions
detected.
Lines must be secure to prevent persons/animals/obstacles on tracks (fencing, vegetation control, CCTV
etc). Collision detection system required on train.
UTO
Platform Stop
On approach Train Driver checks no intrusions from platform area.
Passengers operate door open buttons.
(like NTO).
No manual monitoring from drivers cab.
Obstacles must be detected automatically (or observed by Mobile
Staff) and train automatically brought to
a halt outside station.
Requires Intrusion prevention or detection (PSD or PTID). Platform
control buttons. UTO
Train Reversing
Conventional operation with Train
Driver changing ends (like NTO). No
detraining before sidings.
No need to change ends. Schedule does not need time
allowance for driver to change ends. UTO
Crew Change
Handover procedure and crew
management supervision. Time
allowed at Kobenhavn H.
No handover or supervision required.
Schedule does not need time allowance for driver to change.
Handover and supervision required for DTO but maybe a faster
procedure.
STO
Table 27 Operational Concept for Normal Operations

Copenhagen S-Bane Automation Study
______________________________________________________________
Ramboll-Atkins-Emch+Berger-Parsons 76
2 Failures and Incidents
Section 5.1.22 of the Operational Concept (SP-13-017439-SSST App 3.2 Functional Requirements Att 2 Operational Concept.docx) describes the most usual failure scenarios. The main differences at UTO are summarised below. In these instances, DTO is more like STO than UTO, as the Train Captain deals with problems in much the same way as the Train Driver with STO. Where the comment has been highlighted in green a benefit has been assumed in the business case.
STO UTO Comment DTO
Door Faults Driver secures doors & de-trains passengers.
Mobile Staff must attend to secure/de-train
Longer response time. Must be offset with fewer
occurrences. STO
Brake Faults Driver can release. Fleet Manager must release remotely from TCC
Remote diagnostics and reset capability required STO
Faults that do not stop train
Driver will be alarmed and train will be withdrawn.
Driver alarms must be routed to Fleet Manager. In UTO Mobile Staff de-train
passengers.
In DTO alarm must be routed to Train Captain. STO
Faults that stop train
Driver fixes else a Maintenance Action required.
Fleet Manager fixes remotely else Maintenance
Action.
Remote diagnostics and reset capability required. STO
Using a healthy train to assist a
failed train
Pull or Push. Healthy Train Driver performs coupling.
Mobile Staff must meet healthy train.
Longer response time. Must be offset with fewer
occurrences. STO
Signalling & protection system
failures
Driver drives at reduced speed proceeding on sight.
Mobile Staff must meet train to take it through failed area. Longer response time. STO
Track Condition problems Driver reports defects Mobile Staff reports defects. Defects possibly go
unnoticed for longer. STO
Derailment Driver stops train immediately. Automatic brake and
Signalman receives alarm immediately.
Automatic detection system. In DTO Train Captain has
emergency brake. STO
Radio Failures Driver uses mobile phone. Mobile Staff uses mobile phone.
Passengers require voice communications to TCC. STO
Person under train Driver manages with
Signalman & Emergency Services.
Train emergency brakes and sends alarm to Fleet manager. Information Assistant interrogates
CCTV. Emergency services called.
Forward facing CCTV required for monitoring & investigation (note: not a remote driving capability).
STO
Signal Overrun Trip/Emergency Brake. Signalman and driver
dialogue.
If Fleet Manager and Signalman satisfied train can
resume. Else Mobile Staff must meet train.
Remote Diagnostic & Reset needed. STO
Platform Overrun Driver informs Signalman. Usually runs to next station
without opening doors. Alarm routed to Signalman.
Alarm/Message Routing to TCC (or Train Captain for
DTO). STO
Passengers /Trespassers
trackside
Driver reports. Response is either to impose a speed
restrictions or suspension.
A passenger could report this via two way
communication. Mobile Staff could travel to area.
Network Security (fencing, CCTV, bridge caging etc). UTO

Copenhagen S-Bane Automation Study
______________________________________________________________
Ramboll-Atkins-Emch+Berger-Parsons 77
STO UTO Comment DTO
Passenger Emergency Alarm
Train Emergency Brakes (although Train could proceed
to next station).
Train assumed to proceed to next station to be met by
Mobile Staff.
On-Train CCTV and two-way voice communication
with Control Centre Information Assistant. Less
likely to be a PEA under DTO.
STO
Physical Needs Request (PNR) Driver informs signalman Not applicable
Reduced PNR delays (DTO). Eliminated PNR
delays (UTO). STO
Crew Change problem
Spare Driver Found else Running man removes from
service. Not applicable Eliminated delays and
withdrawals (UTO). STO
Emergency Detrainment
(Station or not in station)
Driver performs de-trainment.
Can be instigated by Information Assistant but requires Runner or Mobile
Staff for positive de-trainment.
In-car real-time CCTV available for Information
Assistant. Longer response time.
STO
Managing Failed Trains
Train marked as “failed”. Signalman turns off route
setting in area. Recovery may involve Driver fixing,
Maintainer fixing or procedure to join with healthy train and
remove.
Remote Diagnostic and reset capability by Fleet
manager. If removing Mobile Staff will be involved in
coupling with healthy train. See also Faults that Stop
Train.
Remote Diagnostic & Reset needed.
STO
Managing Failed Signalling
Work through failed area under rule and line of sight
driving.
Mobile Staff meets Train before train can proceed
again under caution.
Longer response time and probably unable to sustain
through running. No remote driving capability assumed.
STO
Managing Failed Points
Work through failed area under rule and line of sight.
May need Driver or Maintainer to lock points.
Mobile Staff attends before train can proceed again
under caution.
Longer response time and probably unable to sustain
through running. No remote driving capability assumed.
STO
Manage Problems with UTO Platform
Train Interface N/A
If PSDs then train can proceed through non-
stopping. If PTID needs resetting by Mobile Staff. If still failed then Maintenance
Action required.
PTID must be reliable and not prone to false
detections. UTO
Catenary All trains come to halt in area. Drivers perform detrainments.
Detrainments managed by Mobile Staff, Runners and
Information Assistants.
Passenger self-detrainment maybe necessary under advice from Information
Assistants.
STO
Traffic Control Centre Evacuation
Trains can continue to run with auto signalling mode and mobile phones used for backup communication.
More difficult as normal operations rely on more TCC systems (remote
diagnostics etc).
More Information Assistants on hand to perform communications.
STO
Table 28 Operational Concept for Failures and Incid ents

Copenhagen S-Bane Automation Study
______________________________________________________________
Ramboll-Atkins-Emch+Berger-Parsons 78
3 Service Regulation
Section 5.2 of the Operational Concept (SP-13-017439-SSST App 3.2 Functional Requirements Att 2 Operational Concept.docx) describes how the service plan is controlled and modified. The main differences at UTO are summarised below. DTO is most like STO as the Train Captain is connected to the Train so there are generally the same restrictions as with a Train Driver in the STO case. Where the comment is highlighted in green a benefit has been assumed in the business case.
STO UTO Comment DTO
Traffic Control Centre Operations Location still to be determined. Location still to be
determined.
TCC will need to accommodate more
Information Assistants and Fleet Manager.
STO
Train Regulation Decision Support and improved operator interface.
Decision Support and improved operator interface.
Requires integration with Passenger Information
Systems STO
Alternative Train Regulation
Auto Headway Regulation & Dynamic Numbering facility
provided as alternative on-line timetable (but still restricted
use due to Driver constraints)
Exploiting Auto Headway Regulation & Dynamic
Numbering facility much easier without Driver
constraints.
The functionality provided in STO system is likely to be more wide-spread used at UTO but may need some
system modifications.
STO
Train Cancellation
Planned Cancellations are entered into timetable -
information provided to staff and passengers. (Unplanned
cancellations dealt under Train Regulation).
UTO Procedure could be simpler and
planned/unplanned distinction less relevant if
much easier to responding to prevailing conditions.
More online, dynamic service information (PIS,
Web based etc) rather than paper timetables.
STO
Information Distribution
Information Assistants provide to Stations, and Signalmen to
Trains.
Passenger Information System provides
automatically to Trains and Stations.
More Information Assistants required to meet increased
requirements to trains. STO
Extra Trains Planned ad hoc as required. Unplanned involves timetable
edit.
Much easier under UTO as Service Manager does not
need to discuss Driver resource with TOC.
More likely to exploit opportunities to introduce extra trains. More decision
support/automatic timetable edits would be useful.
STO
Exchange of Rolling Stock
Involves Service Manager, Fleet Manager, Drivers and
Information Assistants. Managed entirely from TCC.
Easier to perform under UTO without driver
involvement - although Mobile Staff may need to help passengers switch
trains.
STO
Exceptional Turn Around or Reuse of Rolling Stock
Unit
Involves Service Manager, Fleet Manager, Drivers and
Information Assistants.
Much easier under UTO as Service Manager does not
need to discuss Driver resource with TOC or agree
with Driver.
Likely to be easier to perform under UTO without
Driver involvement. STO
Train Taken out of Service for
Maintenance
Request by TOC Manager for cancellation or exchange.
Request by TOC Manager for cancellation or exchange.
Likely to be easier to perform under UTO without
driver involvement - although Mobile Staff /Runners may
need to be on hand to detrain.
STO
Unplanned Split or Join
Request by Fleet Manager. Timetable edited to enable
cancellation after join or insert new trip after split.
Able to easily enact a split anywhere as no new driver
required.
Can more often remove units rather than whole trains
as splits are far easier (i.e. less cancellations). Also easier to perform so less
disruption.
STO

Copenhagen S-Bane Automation Study
______________________________________________________________
Ramboll-Atkins-Emch+Berger-Parsons 79
STO UTO Comment DTO
Major Changes
Performed in accordance with a defined decision process. Train Driver rostering and
passenger publicity required.
Procedure can be much simpler as no Train Driver
rosters or passenger timetable updates required.
Should be easier to implement (hence more
likely to decide to perform major change where
preferable).
STO
Operating S-bane radio system
Radio has priorities, two-way and 1-1 and broadcast facility.
Mobile phone is back up.
Mobile Staff will require radio and phone.
Mobile Staff will require radio and phone. Maybe need a system for locating Mobile
Staff on the network.
STO
Speed Restrictions
Procedure in place involving changes to Signalling
Protection, No line-side signage. Use of publications and if necessary signalman-
driver train radio.
Any conversation, if required, will be with Mobile
Staff. PIS automatically invoked.
Possibly need a wind (Catenary Swaying) detection system as
currently reported by driver.
STO
Table 29 Operational Concept for Service Regulation

Copenhagen S-Bane Automation Study
______________________________________________________________
Ramboll-Atkins-Emch+Berger-Parsons 80
4 Automatic Turnaround
i) The Automatic Turnaround Opportunity
Automatic Turnaround (ATA) provides the possibility to reduce the time taken for a train to reverse by avoiding the time taken for a driver to change ends walking from one driving cab to another. The benefit is that the time saving can be reflected in the timetable enabling the same level of passenger service to be delivered with fewer trains. This provides operating costs savings (fewer drivers) and/or allows the free rolling stock to be used to provide more service. When a new fleet is purchased there is the opportunity of saving capital costs through a reduced fleet size. The relevant platforms must be equipped with a PTID system or PSDs. Where installed the PTID system will continually monitor the track area within platforms for intrusions by persons or objects that may cause damage or delays to the train. In case of such an intrusion the ATP will stop the train short of the platform (if possible, otherwise the train will be stopped as soon as possible). The area will be equipped with additional risk reduction measures such as CCTV, fencing and warning signs. The train will automatically drive into the platform or siding, reverse its direction and then when required by the online timetable, depart and drive into the next platform. At locations where there is a high service frequency a control will be provided to enable the train driver to report that they are present and ready to take over the train when it reverses. Until this control is activated the train will not depart the siding or platform. The detailed procedure is different depending upon whether the train is reversing in a platform or siding. If the train reverses in a siding, the driver gets off the train while it moves into and out of the siding with no member of staff on board. The procedure saves the most time if the platform at the station is an island platform, so the driver simply crosses the platform to rejoin the train. If the train reverses in a platform, the driver must walk through the train whilst the train is travelling from the penultimate station. ii) The Automatic Turnaround Procedure (Sidings)
The two locations where trains reverse in sidings behind an island platform are Solrod Strand and Ballerup. The ATA procedure would be as follows:
i) When the driver of a reversing train reaches a platform where automatic
reversing is allowed, provided that they have not been informed by the Signalman that automatic reversing is temporarily not allowed then they will

Copenhagen S-Bane Automation Study
______________________________________________________________
Ramboll-Atkins-Emch+Berger-Parsons 81
set the Signalling and Protection System to an appropriate mode and disembark from the train.
ii) Once on the Platform the Driver will go to a control box located to afford a
good view of the Platform and open the control box with a generic key. The control box will include an indicator to show when the Train may proceed, a dispatch control and an emergency stop control.
iii) When the Driver notes that Passenger alighting has ceased and the indicator shows that the Train can proceed they will activate the dispatch control. Any doors not yet closed will close and the Platform Edge Doors (if fitted) will close and the Train will depart. The Driver may stop the Train using the emergency stop control if required.
iv) The Driver will visually inspect the pantographs as the Train departs the platform (unless an automated CCTV based inspection system is available).
v) The Driver will close the control box and make their way to the departure platform.
vi) When the entire Train is within the platform, the Signalling and Protection System (Train) informs the Train on which side the doors may be opened (left, right or both). The Train then enables Passenger opening of doors on the specified side(s) when the Train comes to a stop. The doors close automatically after a configured period when no movement is detected, but can be reopened by a Passenger.
vii) The Driver will board the Train and open the desk (using a key), check that the Train is ready for service, log on to the Train (this automatically logs the Driver on to the S-bane Radio).
iii) The Automatic Turnaround Procedure (Platforms)
This can occur at many more locations than the sidings procedure but requires the train to be operating in DTO between the last two stations. The possible locations are Klampenborg, Hillerod, Holte, Farum, Osterport, Frederikssund, Hoje Taastrup, Koge and Kobenhavn H (if a new shuttle service were introduced with trains reversing at Kobenhavn H). The procedure, which would need more development, would be similar to the following:
i) The driver will supervise the departure of the train at the penultimate platform
(the last platform before the end of the line or route) in the usual way under STO.
ii) The driver then sets the train to an appropriate mode and leaves the cab through the door into the saloon while the train is motion.

Copenhagen S-Bane Automation Study
______________________________________________________________
Ramboll-Atkins-Emch+Berger-Parsons 82
iii) The driver walks back though the train towards the rear cab. (As it is the last stop the train is unlikely to be crowded and passengers are unlikely to distract the driver).
iv) When the entire Train is within the last platform, the Signalling and Protection System (Train) informs the Train on which side the doors may be opened (left, right or both). The Train then enables Passenger opening of doors on the specified side(s) when the Train comes to a stop. The doors close automatically after a configured period when no movement is detected, but can be reopened by a Passenger.
v) After a minimum elapsed time and not before the timetabled departure time,
the train will automatically close any remaining open doors and depart on return trip.
vi) The driver will be expected to be in the correct front cab by the time the train arrives at the first station stop, where the train is reset to STO and proceeds normally.
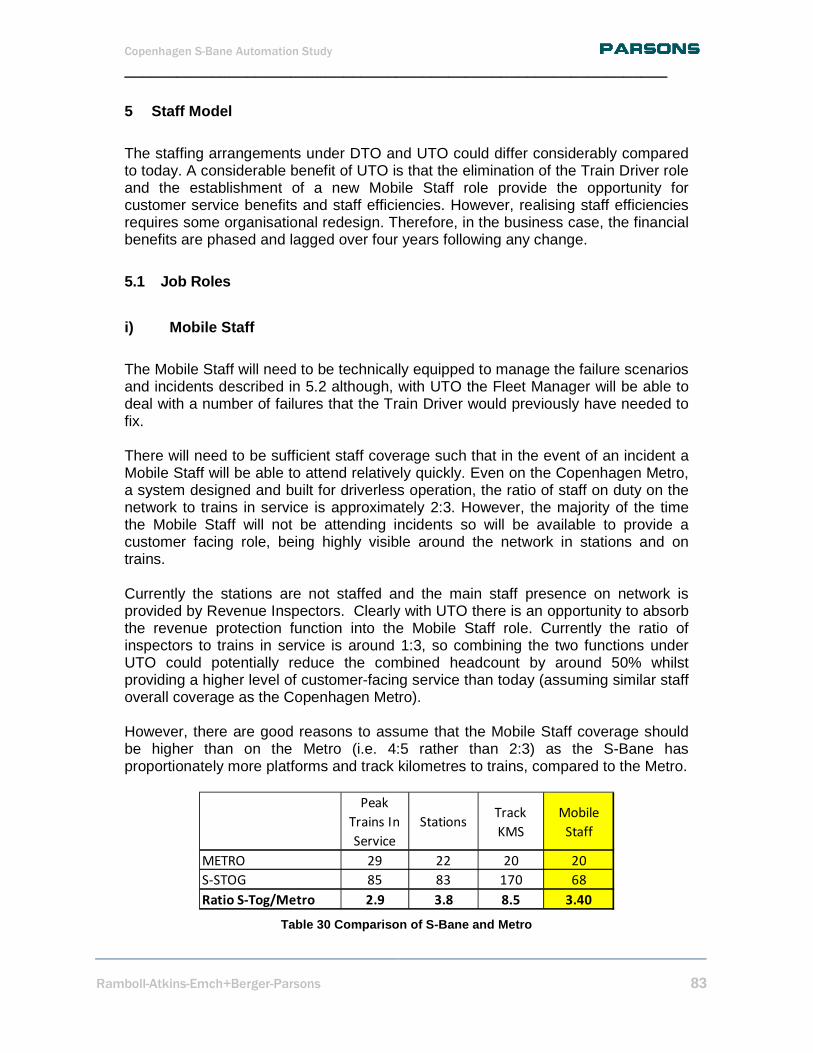
Copenhagen S-Bane Automation Study
______________________________________________________________
Ramboll-Atkins-Emch+Berger-Parsons 83
5 Staff Model
The staffing arrangements under DTO and UTO could differ considerably compared to today. A considerable benefit of UTO is that the elimination of the Train Driver role and the establishment of a new Mobile Staff role provide the opportunity for customer service benefits and staff efficiencies. However, realising staff efficiencies requires some organisational redesign. Therefore, in the business case, the financial benefits are phased and lagged over four years following any change.
5.1 Job Roles
i) Mobile Staff
The Mobile Staff will need to be technically equipped to manage the failure scenarios and incidents described in 5.2 although, with UTO the Fleet Manager will be able to deal with a number of failures that the Train Driver would previously have needed to fix. There will need to be sufficient staff coverage such that in the event of an incident a Mobile Staff will be able to attend relatively quickly. Even on the Copenhagen Metro, a system designed and built for driverless operation, the ratio of staff on duty on the network to trains in service is approximately 2:3. However, the majority of the time the Mobile Staff will not be attending incidents so will be available to provide a customer facing role, being highly visible around the network in stations and on trains. Currently the stations are not staffed and the main staff presence on network is provided by Revenue Inspectors. Clearly with UTO there is an opportunity to absorb the revenue protection function into the Mobile Staff role. Currently the ratio of inspectors to trains in service is around 1:3, so combining the two functions under UTO could potentially reduce the combined headcount by around 50% whilst providing a higher level of customer-facing service than today (assuming similar staff overall coverage as the Copenhagen Metro). However, there are good reasons to assume that the Mobile Staff coverage should be higher than on the Metro (i.e. 4:5 rather than 2:3) as the S-Bane has proportionately more platforms and track kilometres to trains, compared to the Metro.
Peak
Trains In
Service
StationsTrack
KMS
Mobile
Staff
METRO 29 22 20 20
S-STOG 85 83 170 68
Ratio S-Tog/Metro 2.9 3.8 8.5 3.40 Table 30 Comparison of S-Bane and Metro

Copenhagen S-Bane Automation Study
______________________________________________________________
Ramboll-Atkins-Emch+Berger-Parsons 84
Also, incident response times are a serious consideration. A simple incident response model estimating the average time taken for a Mobile Staff to attend a failed train based upon a distribution of incidents suggests that number of incidents taking more than 20 minutes to attend to more than trebles if the coverage is 2:3 rather than 4:5.
0
2
4
6
8
10
12
14
16
18
20
50%
55%
60%
65%
70%
75%
80%
85%
90%
95%
100%
% o
f inc
iden
ts
Mobile Staff : Trains in Service
UTO Incident Response Times
Average Minutes
% longer than 10
minutes
% longer than 20
minutes
Figure 15 UTO Incident Response Times versus Mobile Staff Coverage
The number of Mobile Staff assumed is one of the most important influences on the business case, operational performance and safety.
ii) Train Captain
With DTO, the Train Driver role changes to a Train Captain role. With the current fleet, the Train Captain will need to be nearly as technically proficient as the Train Driver, but also perform customer facing services, so there is little prospect of achieving staff savings compared to Train Driver costs. However, it is possible that the number of Revenue Inspectors could be reduced or eventually eliminated under DTO. Revenue Inspectors will often patrol in pairs for safety and security reasons. However, if they know that a member of staff will be on hand to assist if required, it may be possible to provide the same level of overall revenue protection with fewer inspectors. iii) Information Assistants
Information Assistants are members of the TOC situated in the TCC responsible for passing information to Customers on stations via the Customer Information System (CIS). Under DTO the Train Captain will be making on-train announcements like

Copenhagen S-Bane Automation Study
______________________________________________________________
Ramboll-Atkins-Emch+Berger-Parsons 85
STO, but under UTO the CIS will need to be enhanced to a Passenger Information System (PIS) that provides information to both stations and trains. The Information Assistants will potentially have more CCTV cameras to interrogate and will also have a direct one-to-one voice communications link to passengers on trains. Although the communications and centralised control systems will be upgraded, it is still anticipated that the number of Information Assistants will need to increase to provide the additional functions. iv) Runners
Runners (or Running Men) are TOC depot staff that drive trains between the depot and the first and last station stops. Runners also undertake coupling and decoupling operations and perform light train cleaning activities. In some cases a Train Driver may undertake certain Running Man tasks. In future the number of Runners may be expected to increase if the train service increases. Otherwise the numbers would stay approximately the same, although under UTO some modest savings of around 10% could be saved as the train delivery into service and train return from service procedures becomes more efficient.
5.2 Staff Model Assumptions and Results
The staff model (part of the business case model) estimates the annual staff costs across the affected roles. The key assumptions with the Staff Model are:
i) The STO base case has fewer trains in service due to faster running (see section 9)
ii) The number of Runners required is proportional to the number of tasks (trains
in and out of service manoeuvres and coupling/uncouplings) so is affected by the assumed services and peak/off-peak transition.
iii) Under UTO the number of Runners is reduced by 10% as the tasks become more efficient.
iv) The number of Train Captains is the same as the number of Train Drivers (for the same number of trains in service)
v) The employment cost of a Train Captain is equal to that of a Train Driver.
vi) In STO, the number of Revenue Inspectors is proportional to the number of trains in service.
vii) In DTO, the number of Revenue Inspectors is half that required for STO (for the same number of trains in service)

Copenhagen S-Bane Automation Study
______________________________________________________________
Ramboll-Atkins-Emch+Berger-Parsons 86
viii) The number of Mobile Staff is proportional to the number of trains in service. Compared to the number of Train Drivers required for STO, there is a 10% saving due to improved roster efficiency, and then a further 20% saving due to an assumed coverage ratio of 4:5 (Mobile Staff to trains in service).
ix) The employment cost of a Mobile Staff is 25% less than a Train Driver.
x) The number of Information Assistants and Fleet Managers are proportional to the number of trains in service, although for UTO twice as many Information Assistants are required.
xi) Employment costs increase in real-terms in line with assumed economic growth.
Today STO DTO UTO RUNNERS 111 115 117 104
TRAIN DRIVERS 524 498 0 0
TRAIN CAPTAINS 0 0 450 0
REVENUE INSPECTORS 206 196 89 0
MOBILE STAFF 0 0 0 322
FLEET MANAGERS 10 10 9 9
INFORMATION ASSISTANTS 23 22 21 40
TOTAL STAFF 874 841 685 476
ANNUAL COSTS (millions DKK) 420 404 335 193 Table 31 Staff Numbers

Copenhagen S-Bane Automation Study
______________________________________________________________
Ramboll-Atkins-Emch+Berger-Parsons 87
APPENDIX B - BENEFITS CAPTURE
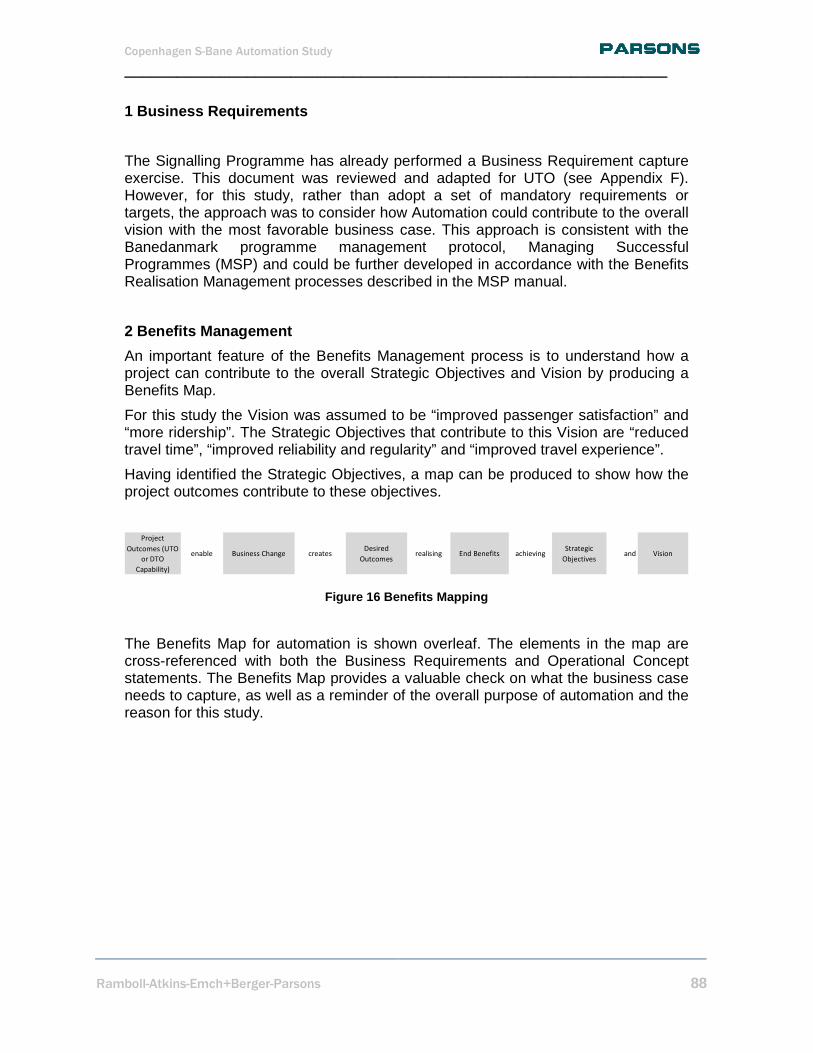
Copenhagen S-Bane Automation Study
______________________________________________________________
Ramboll-Atkins-Emch+Berger-Parsons 88
1 Business Requirements
The Signalling Programme has already performed a Business Requirement capture exercise. This document was reviewed and adapted for UTO (see Appendix F). However, for this study, rather than adopt a set of mandatory requirements or targets, the approach was to consider how Automation could contribute to the overall vision with the most favorable business case. This approach is consistent with the Banedanmark programme management protocol, Managing Successful Programmes (MSP) and could be further developed in accordance with the Benefits Realisation Management processes described in the MSP manual.
2 Benefits Management
An important feature of the Benefits Management process is to understand how a project can contribute to the overall Strategic Objectives and Vision by producing a Benefits Map.
For this study the Vision was assumed to be “improved passenger satisfaction” and “more ridership”. The Strategic Objectives that contribute to this Vision are “reduced travel time”, “improved reliability and regularity” and “improved travel experience”.
Having identified the Strategic Objectives, a map can be produced to show how the project outcomes contribute to these objectives.
Project
Outcomes (UTO
or DTO
Capability)
enable Business Change createsDesired
Outcomesrealising End Benefits achieving
Strategic
Objectivesand Vision
Figure 16 Benefits Mapping
The Benefits Map for automation is shown overleaf. The elements in the map are cross-referenced with both the Business Requirements and Operational Concept statements. The Benefits Map provides a valuable check on what the business case needs to capture, as well as a reminder of the overall purpose of automation and the reason for this study.

Copenhagen S-Bane Automation Study
______________________________________________________________
Ramboll-Atkins-Emch+Berger-Parsons 89
3 Business Case
The business case has been developed with assumptions agreed with the Steering Group. As far as possible the methodology is in accordance with the Danish Ministry of Transport’s guidelines manual and prices for socio-economic analysis (manual for samfunds-økonomisk analyse and Transportøkonomiske Enhedspriser til brug for samfundsøkonomiske analyser). However, as described in section 2.2 the evaluation is both complex and unusual and therefore Parsons have made simplifications and departures from the manual in the interest of delivering the most value to the Transport Ministry within the constraints of this study. However, if the Transport Ministry are inclined to progress automation policy further as a result of this study there are improvements that can be made. Issues of particular interest and worthy of further consideration in any future study include:
i) Performing a more comprehensive traffic planning exercise based upon passenger demand forecasts for 2020 and beyond.
ii) Further investigation into the evaluation of the benefits of timetabled “fast” services and “hidden wait” time (see section 5).
iii) Further investigation into the evaluation of the customer experience benefits (Parsons have adopted a methodology similar to that used elsewhere (e.g. in London) which may not be equally applicable for passengers in Copenhagen).
iv) A review of key financial parameter assumptions such as real term cost
increases, fares elasticity, treatment of tax etc.)
v) A quantified assessment of risks pertinent to the S-Bane.
vi) Consideration of other ways of delivering end benefits towards the strategic objectives (e.g. other asset investments, network enhancements, operational changes, exploitation of technological advances etc.).
vii) Development of a long-term strategic plan for the S-Bane with quantified
targets.
All of the above have the potential to affect the strength of the business case compared to the analysis performed in this study.

Copenhagen S-Bane Automation Study
______________________________________________________________
Ramboll-Atkins-Emch+Berger-Parsons 90
4 Elasticity
The traffic generated by making the service more attractive to passengers is represented in the business case as a revenue effect. The amount of revenue predicted from new passengers to Copenhagen public transport is calculated as a proportion of the socio-economic benefit generated for existing passengers. This proportion is the “conditional elasticity”. Parsons have assumed a value of 0.25 which is similar than the value recently assumed in studies elsewhere. DSB have predicted, through their own observations and modelling, that a one minute improvement in journey time generates 2.9% extra traffic, and a one minute improvement in wait time generates 4.4% extra traffic. Assuming an average DKK 11.55 per trip, then this would correspond to S-Bane “own price” elasticities of 0.22 and 0.17 respectively9. However, the “own price” elasticity includes passengers transferring from other public transport services so will naturally be higher than the conditional elasticity. This suggests that 0.25 might be too high for the conditional elasticity. However, without knowledge of other factors present in this research, it is difficult for Parsons to speculate further and it is suggested that this should be a matter for DSB and the Transport Ministry to agree in future studies.
9 One minute journey time = DKK 1.5 & One minute wait time = 2 x DKK 1.5 = DKK 3. (2.9% x DKK 11.55)/1.5 DKK = 0.22 & (4.4% x DKK 11.55)/3 DKK = 0.17

Copenhagen S-Bane Automation Study
______________________________________________________________
Ramboll-Atkins-Emch+Berger-Parsons 91
Project
Outcomes (UTO
or DTO
Capability)
enable Business Change createsDesired
Outcomesrealising End Benefits achieving
Strategic
ObjectivesVision
Passenger Education Shorter dwell times
Automatic Door Close
(OPS 224)
More consistent dwell
timesFaster running times
Automatic Door Open
(OPS 220)
Punctual terminus
departures
Automatic Train
Departure
(OPS 224)
Better Automatic Train
regulation
Easier more effective service
modifications (BR90)
High Practical Line
Capacity
Reduced travel time
(BR18, BR33)
Automatic Enter Service
(OPS 214)
Simpler More Effective
MarketingHigher operating capacity
Automatic Exit Service
(OPS 229)
"Metro Service" operating &
Marketing philosophy
More frequent,less
crowded and reconfigured
planned services (BR25)
Hand held device for Mobile
Staff to "logon" to train and
be in saloon (OPS 214)
Procedures and Processes for
exploiting flexible scheduling to suit
prevailing conditions.
Fewer Crew Change delays
(OPS 359,360)
Automatic Reversing
Planned & Unplanned
(OPS 223, OPS58)
Fewer Crew Scheduling &
Timetable Constraints
Better Adherence to Plan
(BR24)
Improved Reliability
(BR31)
Improved passenger
satisfation
(BR15)
Faster scheduled reversing Better Recovery to Plan More ridership (BR14)
Customer-facing multi-
functional staff organisation
(BR12)
Easier Unscheduled
Reversing
Fewer delays and
cancellations
Fewer crew absence
cancellations & PNR delays
(OPS 327)
Quicker Fix time for routine
train problems. Fewer Staff
Errors (BR19)
Improved passenger
experience (BR33)
Remote train diagnostic and
remote resetting capability
(OPS 155,233,834,1161)
Organisation to provide
technical support from TCC
New trains without drivers'
cabs or with removable cabs
Reduced Vandalism & Graffiti
Fewer PEAs
(OPS 230)
Better perception of safety &
security
Higher Staff Presence and
customer service on train
Better Passenger Information
(BR21)
Two way voice communication
between passenger on-train and
TCC (OPS 230,231)
Organisation to provide enhanced
security monitoring & passenger
information from TCC (OPS 197)
Real time CCTV (train saloon,
train forward facing, network
security) (OPS 330,OPS 129)
and
Figure 17 UTO Benefits Map

Copenhagen S-Bane Automation Study
______________________________________________________________
Ramboll-Atkins-Emch+Berger-Parsons 92
This Page is Intentionally Blank

Copenhagen S-Bane Automation Study
______________________________________________________________
Ramboll-Atkins-Emch+Berger-Parsons 93
APPENDIX C - EVALUATION OF BENEFITS

Copenhagen S-Bane Automation Study
______________________________________________________________
Ramboll-Atkins-Emch+Berger-Parsons 94
1 Benefit Categories
The benefits that contribute to customer satisfaction and the business case can be considered in three categories that correspond to the three Strategic Objectives shown in the Benefits Map in Appendix D.
iv) Schedule refers to the level of service provided in the plan or timetable (i.e. frequency of trains, formation of the trains and running times). By simulating the service the impact that different schedules have on total passenger time can be calculated.
v) Reliability10 refers to the how well the schedule is delivered (i.e. how
closely the service adheres to the plan and how quickly the service returns to the plan after disturbances). It is measured in total passenger time.
vi) Experience on the train refers to the general passenger experience and
includes non-time factors such as the provision of information during disruption, train cleanliness and the perception of safety and security. Attributes are measured on a scale (1-100) and can be converted to an economic benefit based upon research into passengers’ “willingness to pay” for improvements.
1.1 Schedule Benefits
i) Methodology
The Schedule benefits were estimated by simulating the different service options using Prime (see Appendix B for a description of this model). The options are defined using a Service Definition Template. The template contains the following information for each option:
i) The peak and off peak frequencies for each route or service ii) The operating mode for each of the above (STO, DTO, UTO) and train
type (SA or SE). iii) The total number of trains (SAs and SEs) available to provide the
passenger services. iv) Which services the surplus trains will be allocated to for providing longer
formations during the peaks. v) At which reversing locations ATA is provided.
10 In this context “Reliability” has a more general meaning than the current Reliability measure (see 4.2).

Copenhagen S-Bane Automation Study
______________________________________________________________
Ramboll-Atkins-Emch+Berger-Parsons 95
This information is used to construct a timetable to be simulated in Prime. The Prime model then produces the following results (Results Template) for each option:
i) The number of trains needed for each route or service (peak/off peak)
ii) The surplus number of trains allocated to each route or service for longer formations (peak only)
iii) The number of train/car kilometres operated on each route/service
iv) The number of passengers carried on each route/service
v) The number of passenger kilometres travelled on each route/service
vi) The passenger waiting time for each route/service
vii) The passenger riding time for each route/service
viii) The total passenger interchanges between routes/services
ix) The total traction energy consumed peak and off peak
Using the data in the Results Template, the Business Case Model can calculate the annual travel time for each option. The Business Case Model will, in each year, compare the selected option defined to be in operation for that year of the programme with the option that is assumed in that year of the base case programme. The difference in journey times will be converted into a socio-economic benefit for that year of the programme. The data in the Results Template is also used in the calculation of operating costs and is used to define the infrastructure that would be needed to support the option. These Results statistics also feed into the calculation of Reliability and Experience benefits in those options where different routes/services operate under different operating modes. ii) Faster Reversing
A particular issue arises when considering the value of faster train reversing times on the S-Bane. The ability to save several minutes at each end of the line is usually of very high value to train operators as it often,
i) relieves a capacity constraint, and ii) enables a higher level of service with the same number of vehicles.
A feature of the S-Bane network is the large number of branches, and relatively well equipped reversing facilities. Therefore the first “advantage” above does not apply. The second advantage applies, but the S-Bane currently has a fleet size well in excess of the number of trains required to operate the timetable. However the fleet is

Copenhagen S-Bane Automation Study
______________________________________________________________
Ramboll-Atkins-Emch+Berger-Parsons 96
well utilised as a number of longer train formations are operated during the peaks. Faster reversing would enable more longer formations to be operated, which should be a benefit in terms of reduced standing and shorter station dwell times. The study has assumed no increase in passenger numbers compared to 2008, but clearly if demand were to increase the benefit of faster reversing would be even greater. Furthermore, original advice was to disregard the small amount of crowding penalty from the analysis. However, had this been done, longer formations would have no benefit at all – in fact they would have a cost in terms of extra track and train maintenance and additional coupling/uncoupling. Therefore Parsons have taken the approach to capture the social costs of crowding and the journey time impact of dwell times in the overall analysis as these are features of the Prime model anyway. iii) Removable Driving Cabs
With DTO/UTO it would be possible to introduce a new fleet of trains with a temporary driving cab which could be subsequently removed after the migration to DTO/UTO providing more space for passengers. Parsons have decided not to incorporate this opportunity into the analysis as the passenger demand levels may not justify the costs. Also the flexibility to operate trains in STO on some parts of the network may still be important. However, this is a benefit which has been valued highly on other driver-less railways, so would merit consideration alongside the decision on how many trains to purchase depending upon the traffic forecasts.
1.2 Reliability Benefit
The reliability benefits are calculated by the Reliability Model in the Business Case Model. The model makes assumptions about how DTO and UTO would impact the Reliability and Regularity performance measures, and then estimates how these two measures combined relate to passenger journey times.
Regularity Reliability CSS 2005 88.75 95.95 2006 88.75 95.95 2007 91.66 96.39 7.755 2008 94.32 96.88 7.8 2009 95.67 96.91 7.835 2010 94.55 96.25 7.69
Table 32 Historic Regularity, Reliability & Custome r Satisfaction Scores
CSS v Reliability CSS v Regularity Reliability v Regularity
Figure 18 Relationships between Regularity, Reliabi lity & Customer Satisfaction

Copenhagen S-Bane Automation Study
______________________________________________________________
Ramboll-Atkins-Emch+Berger-Parsons 97
The above data suggests that of the two train service measures, Reliability is the probably the most important. Improvements to either ought to improve journey times and customer satisfaction but to add-together the results of Reliability and Regularity would double-count their effect on journey times. However, to use just the Reliability measure would under-estimate the effect. Therefore the two measures have been combined to a produce a “Combined Performance” based on the above relationship. The table below contains the predicted differences in performance between STO, DTO and UTO. The STO base case statistics are taken from 01/01/2010 – 07/06/2010. The “Combined Performance” is thus calculated for STO, DTO and UTO. Reliability = 1 - Share Cancelled
Regularity = 1 - Share Delayed Rel iabi l i ty Regulari ty Rel i abi l i ty Regulari ty Rel iabi l i ty Regulari ty
0.01 0.03 0.01 0.03 0 0
0.01 0.07 0.01 0.07 0 0
0.02 0.00 0.02 0.00 0 0
0.01 0.07 0.01 0.07 0 0
0.00 0.00 0.00 0.00 0 0
0.09 0.01 0.09 0.01 0 0
0.00 0.00 0.00 0.00 0 0
0.00 0.01 0.00 0.01 0 0
0.00 0.00 0.00 0.00 0 0
0.01 0.01 0.01 0.01 0 0
0.00 0.00 0.00 0.00 0 0
0.00 0.01 0.00 0.01 0 0
0.00 0.02 0.00 0.02 0 0
0.00 0.01 0.00 0.01 0 0
0.64 0.91 0.64 0.91 0.32 0.46
0.04 0.11 0.03 0.07 0.03 0.09
0.09 0.07 0.06 0.05 0.06 0.05
0.06 0.03 0.02 0.01 0.01 0.00
2.86 4.59 2.86 4.59 2.29 3.67
TOTAL RELIABILITY & REGULARITY 3.85 5.98 3.61 5.64 2.71 4.27
TOTAL COMBINED "PERFORMANCE" 4.57 4.29 3.22
Train Driver Feed
Coverage ratio
Failure to break
Replaced the late
Illness
Train Operator Error
Practice
Signal passing
Viewed wrong turn
STO DTO UTO
Appeared too late
Taxa Compared
Toilet visit
Stood on Wrong platform
Recovery after Disorder
Equipment (4) gene compared
Vandalism
Trackside Security Person Colliding
Near collision
Impact & recovery from other incidents
Table 33 Prediction of Reliability and Regularity u nder DTO and UTO
The important assumptions are:
i) Under UTO problems caused by train drivers are eliminated.
ii) Under UTO train equipment is 50% more reliable due to the improved specification assumed for a new “UTO capable” fleet.
iii) Under DTO, and to a lesser extent UTO, there is less vandalism due to higher staff presence (33% and 16.7% respectively).
iv) Under DTO and UTO there are less collision and “near miss” delays due to the increased track-side security.

Copenhagen S-Bane Automation Study
______________________________________________________________
Ramboll-Atkins-Emch+Berger-Parsons 98
v) Under UTO it is easier to recover from all incidents due to the ability to more easily divert and reform train trips to return more quickly to the plan (20% better recovery).
These calculations produce a “Combined Performance” result for STO, DTO and UTO. These results are converted into travel time benefits per passenger. The assumed relationship is that for each point improvement in the “Combined Performance”, the travel time improves by 0.63% (based on a nominal 20 minute journey). This assumed relationship is explained in more detail below.
A lost (percentage) point in the “Combined Performance” measure corresponds to 1% of “missed headways”. Therefore 1% of passengers have an extended wait time. If the “missed headway” is the result of a delay rather than a cancellation, a further 1% of passengers experience the equivalent delay in their time on the train. Assuming on average, passengers usually experience a 5 minute headway (and therefore a 5 minute weighted wait time) and a 15 minute running time, then, if half of the missed headways arise from delays then the journey time increases from 20 mins to (20.10+20.15)/2 = 20.125 mins (i.e. a 0.63% increase).
50% Simple Cancellation
99% Achieved
Headway
1% Missed
Headway Average
Wait Time 5 15
Train Time 15 15
Total Time 20 30 20.10
% Affected 99% 1%
50% Cancellation as result of
Delay
99% Achieved
Headway
1% Missed
Headway Average
Wait Time 5 15
Train Time 15 20
Total Time 20 35 20.15
% Affected 99% 1% Table 34 Relating Reliability & Regularity to Journ ey Time
The Business Case Model can calculate the annual travel time saved for each option due to an improvement in the “Combined Performance”. An option may have different modes of operation on different parts of the network, so the “Combined Performance” improvements will only apply in proportion to the number of trains operating in each mode. STO DTO UTO Reliability 96.15% 96.23% 97.29% See above
Regularity 94.02% 94.10% 95.73% See above
Combined Performance 4.57 4.48 3.22 100*{(1-Rel) + [0.12 x (1-Reg)]}
% Travel Time Lost 2.86% 2.80% 2.01% Combined x 0.63%
Table 35 Journey Time Improvements due to Reliabili ty and Regularity
The Business Case Model will, in each year, compare the selected option defined to be in operation for that year of the programme with the option that is assumed in that year of the base case programme. The difference in journey times will be converted into a socio-economic benefit for that year of the programme. The methodology described in this section 7.3 is certainly not perfect. The existing Reliability and Regularity measures are both based on meeting a timetable objective (punctuality and numbers of departures as specified in the timetable) rather than a headway or journey time measure. Also the statistical relationships between the measures are not strong. There appears little research to draw upon. Parsons, have spent some time analysing the available performance data in a number of different
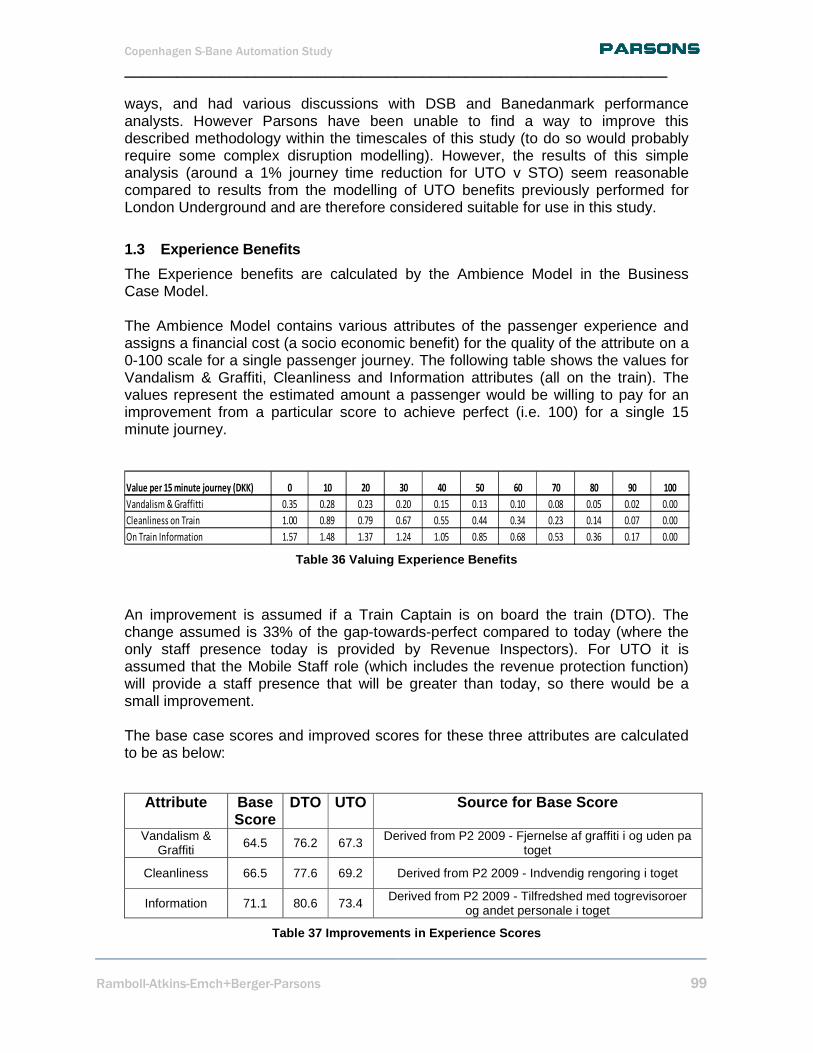
Copenhagen S-Bane Automation Study
______________________________________________________________
Ramboll-Atkins-Emch+Berger-Parsons 99
ways, and had various discussions with DSB and Banedanmark performance analysts. However Parsons have been unable to find a way to improve this described methodology within the timescales of this study (to do so would probably require some complex disruption modelling). However, the results of this simple analysis (around a 1% journey time reduction for UTO v STO) seem reasonable compared to results from the modelling of UTO benefits previously performed for London Underground and are therefore considered suitable for use in this study.
1.3 Experience Benefits
The Experience benefits are calculated by the Ambience Model in the Business Case Model. The Ambience Model contains various attributes of the passenger experience and assigns a financial cost (a socio economic benefit) for the quality of the attribute on a 0-100 scale for a single passenger journey. The following table shows the values for Vandalism & Graffiti, Cleanliness and Information attributes (all on the train). The values represent the estimated amount a passenger would be willing to pay for an improvement from a particular score to achieve perfect (i.e. 100) for a single 15 minute journey.
Value per 15 minute journey (DKK) 0 10 20 30 40 50 60 70 80 90 100
Vandalism & Graffitti 0.35 0.28 0.23 0.20 0.15 0.13 0.10 0.08 0.05 0.02 0.00
Cleanliness on Train 1.00 0.89 0.79 0.67 0.55 0.44 0.34 0.23 0.14 0.07 0.00
On Train Information 1.57 1.48 1.37 1.24 1.05 0.85 0.68 0.53 0.36 0.17 0.00 Table 36 Valuing Experience Benefits
An improvement is assumed if a Train Captain is on board the train (DTO). The change assumed is 33% of the gap-towards-perfect compared to today (where the only staff presence today is provided by Revenue Inspectors). For UTO it is assumed that the Mobile Staff role (which includes the revenue protection function) will provide a staff presence that will be greater than today, so there would be a small improvement. The base case scores and improved scores for these three attributes are calculated to be as below:
Attribute Base Score
DTO UTO Source for Base Score
Vandalism & Graffiti 64.5 76.2 67.3 Derived from P2 2009 - Fjernelse af graffiti i og uden pa
toget
Cleanliness 66.5 77.6 69.2 Derived from P2 2009 - Indvendig rengoring i toget
Information 71.1 80.6 73.4 Derived from P2 2009 - Tilfredshed med togrevisoroer og andet personale i toget
Table 37 Improvements in Experience Scores

Copenhagen S-Bane Automation Study
______________________________________________________________
Ramboll-Atkins-Emch+Berger-Parsons 100
For example, it is assumed that a passenger would be willing to pay around 0.03 DKK for the benefit of travelling 15 minutes in a train with less vandalism and graffiti predicted with DTO compared to STO (i.e. look up the value of 64.5 by interpolating between 60 and 70 (i.e. around 0.09), and subtract the value found for 76.5 by interpolating between 70 and 80 (i.e. around 0.06)). A similar methodology provides a financial value for an improved perception of safety and security that passengers feel when a member of staff is on a train. The values represent the willingness-to-pay to achieve the best situation of a visible roaming staff on board the train (in DKK per 15 minute journey).
Costs per 15 Minute Journey (DKK) No Driver 0.89 Driver in Cab 0.41 Visible Roaming Staff on Train 0.00
Table 38 Valuing Passengers’ Perception of Safety a nd Security
When applied to STO, DTO and UTO the above values reduce. The STO situation has both a Train Driver in the cab and some roaming Revenue Inspectors so is better than the “Driver in Cab” situation. The UTO situation has Mobile Staff providing a roaming presence on most trains so is much better than the “No Driver” situation. Note that the UTO situation is, overall, perceived slightly better than STO because although the passengers will be aware that sometimes there is no member of staff on the train to call upon in an emergency, the high Mobile Staff visibility outweighs this effect11.
Costs per 15 Minute Journey (DKK) UTO 0.18 STO (Base Case) 0.23 DTO 0.00
Table 39 Value of Improvements in Safety and Securi ty
The Business Case Model can calculate the annual Experience benefits for each option due to the level of staff presence. The option may have different modes of operation on different parts of the network, so the benefits will only apply in proportion to the passengers kilometres travelled on trains operating in each mode. The Business Case Model will, in each year, compare the selected option defined to be in operation for that year of the programme with the option that is assumed in that year of the base case programme. The difference in Experience benefits are combined with the journey time benefits to provided a total socio-economic benefit for that year of the programme. 11 The model assumes 44%, 100% and 80% levels of staff presence on the train for STO (revenue Inspectors), DTO (Train Captains), and UTO (Mobile Staff) respectively. In the case of STO and UTO, the Revenue Inspectors and Mobile Staff will spend a proportion of their time on stations so their actual time on the train will be less. However, when they are not on the train there will be a corresponding benefit for staff presence and visibility in stations. For simplicity it has been assumed that the benefit accrues entirely on the train and not in stations. Note that their appears to be no precedent for any quantification of these benefits within the Danish socio-economic framework, so this subject requires further investigation in any event.

Copenhagen S-Bane Automation Study
______________________________________________________________
Ramboll-Atkins-Emch+Berger-Parsons 101
2 The Inner Ring Line
The passenger benefits arising from Automation of the F-Line are small. The line is not constrained by signalling restrictions and it would be possible to increase the frequency to 15tph or 18tph without the automation technology. The reliability of the F-Line can be almost as good under STO as UTO. With shorter simple journeys, staff presence on the train is a less significant benefit. However, implementing DTO or UTO on the F-Line would be easier than other parts of the S-Bane as the line is simple, small and self-contained. It would enable technology and operational concepts to be tested in a relatively self-contained environment with little risk to the wider network operations. Therefore, the F-Line is important for the wider automation programme despite its relatively small strategic importance or financial contribution to the overall network business case. A simple model was constructed that contained the F-Line options. The passenger travel time on the train and the reliability of the service was considered to be the same for all options. However, the platform waiting time and passenger experience varied depending upon the frequency of the schedule (12tph, 15tph or 18tph) and the mode of operation (STO, DTO or UTO). Calculating the service statistics (e.g. train kilometres etc) for each option is simple. The F-Line financial evaluation can identify the best strategy for the F-Line and this is taken into account when assessing the overall business case. 3 Benefits Summary
Table 40 Benefits Summary
DTO UTO
Journey Time
minutes per
passenger
DKK per passenger
DKK per annum
(millions)
minutes per
passenger
DKK per passenger
DKK per annum
(millions) Timetable 0.389 0.58 46.8 0.503 0.75 60.5 Reliability 0.012 0.02 1.4 0.169 0.25 20.3
Total 0.40 0.60 48.2 0.67 1.01 80.7
Experience Points Points Vandalism/Graffiti 11.7 0.03 2.6 7.5 0.02 1.7
Cleanliness 11.1 0.10 9.1 7.1 0.07 6.0 Information 9.5 0.17 14.8 6.1 0.11 9.5
Safety & Security N/A 0.23 20.2 NA 0.05 4.5 Total
0.53 46.6 20.77 0.25 21.7
GRAND TOTAL 1.13 94.8 1.26 102.4

Copenhagen S-Bane Automation Study
______________________________________________________________
Ramboll-Atkins-Emch+Berger-Parsons 102
APPENDIX D – Metro Service
The following table provides an estimate of the impacts for the main passenger groups affected on the branches if today’s service levels were converted to all station stopping, with more trains running to the ends of lines. The number of passengers affected at each group of stations is taken from the 2008 Origin and Destination demand matrix. There are a large number of journeys within the central area, or local journeys on branches which are not affected by the change. The table includes only the journeys that traverse the fast sections to/from the central area and journeys to/from stations which are not served by fast trains. Example journey times are shown to Norreport. However, there are several issues and questions that arise when considering the “winners and losers”. i) The metro service eliminates the necessity to interchange for some journeys (e.g.
Koge to Brondby Strand).
ii) The mixture of fast and slow services introduces irregular service intervals at certain stations. A fast train will naturally catch-up the slow train in front of it and open up a gap from the slow train behind it. So, for example at Nly Ellebjerg, there is a 12tph service to the city, but the timetable intervals are alternately 2 minutes and 8 minutes (average wait time 3.5 minutes)12. Under a metro service this would be a uniform 5 minutes (average wait time 2.5 minutes). Therefore many more passengers benefit from the better regularity of a metro service in addition to those passengers at the stations served with additional stops.
iii) Where a mixture of fast and slow services exists, it is interesting to consider the resulting behaviour of the passengers. Firstly, as the fast and slow sections are along the same track there is no “overtaking”, so it is always worthwhile passengers taking the first train. In locations where the fast and slow frequencies are the same, the first train is much more likely to be the fast service, even if the passenger arrives randomly at the station (this is because the slow service generally has to follow immediately after the fast departure). Alternatively, for those passengers who refer to the timetable and plan their journey accordingly, the slow services will always be avoided (provided the service is running close to timetable). So for most of the potential “losers” in the table above, the slow services have little value today and are much less utilised.
12 Average Wait Time = ∑hi
2 / 2*∑hi = (82 + 22)/2*(2+8) = 3.5 minutes

Copenhagen S-Bane Automation Study
______________________________________________________________
Ramboll-Atkins-Emch+Berger-Parsons 103
Table 41 Metro Winners and Losers

Copenhagen S-Bane Automation Study
______________________________________________________________
Ramboll-Atkins-Emch+Berger-Parsons 104
This Page is Intentionally Blank
Copenhagen S-Bane Automation Study
______________________________________________________________
Ramboll-Atkins-Emch+Berger-Parsons 105
iv) Many passengers who use the timetable to plan their journey will often only wait 0-3 minutes for their train even if the frequency is 6tph or 3tph. This will usually be the case if their preceding leg of the journey is walking and they can reliably predict their arrival time at the station. However, there is an “inconvenience” cost in having to travel at precise times, and a fast infrequent service may be inferior to a slower frequent service where the passengers journey planning can be more flexible. If the preceding leg is rail, bus, taxi or car, it might be difficult to time one’s arrival to such precision anyway.
v) The Transport Ministry’s guidance on Socio Economic Analysis recommends that for calculating waiting time costs, headways up to 12 minutes should be treated as headway services, and greater than 12 as timetable services. On this basis, the E-Line is already a headway service and the Hilleroid and Koge passenger groups (the “losers” in the above table) experience an average wait time of 5 minutes (half the headway). The service to Hilleroid and Koge would need to double to 12 tph to offset the slower train times of a metro service. (If the service were doubled , the average wait time would be 2.5 minutes. As waiting time is valued twice as highly as running time, this wait time improvement would offset the 5 minute slower train time).
vi) The timetable at Holte is a typical example of the effect of irregularity where there is both a fast and slow service. Following the Transport Ministry guidance, Holte has a headway service already (6tph fast and 6 tph slow). The irregularity produces fast southbound trains on a 7 minute headway followed by slow train on a 3 minute headway. The average wait time is therefore 2.9 minutes (see footnote 6 for the formula). Assuming that the runtime saving of 5 minutes is only experienced by 70% of the passengers, the average saving is just 3.5 minutes. An even headway 12 tph metro service has a wait time of 2.5 minutes. The metro wait time saving when doubled (2.9-2.5=0.4 minutes x 2 =0.8 minute) offsets nearly 25% of the average time saved on the faster train service. Therefore, the net penalty of the metro service to this passenger group of “losers” is only 2.7 minutes (i.e. just over half of the 5 minutes difference for the faster train).
vii) For the passenger groups where there is only a 3tph fast service interworking with a 6 tph slow service the calculation is even more interesting. Considering the fast service in isolation, the Transport Ministry guidance states the wait time should be considered to be 6 minutes but with a formula for an additional time penalty for the inconvenience, based upon the actual headway (in this case 20 minutes). This calculation produces a result which is substantially greater than the wait time of the combined service treated as a headway service. Therefore the only reasonable calculation of wait time for the current timetable must consider the combined services. However, irregularity is again a feature of the current timetable. For example, at Hoje Taastrup the intervals are 10 mins, 7 minutes and 3 minutes over a 20 minute cycle (the fast service being on a 7 minute headway). So, like the Holte example, only a proportion of the passenger group can be assumed to experience the benefit of the faster trains, and there is also an offsetting irregularity penalty. Where the fast train saves only 2 or 3 minutes compared to the stopping service the net benefit is negligible or not at all.

Copenhagen S-Bane Automation Study
______________________________________________________________
Ramboll-Atkins-Emch+Berger-Parsons 106
viii) The metro service is likely to have some additional benefits as a consequence of being more uniform. The even intervals are likely to be more robust to small delays, with less chance of wide gaps opening up and without the problems of fast trains being delayed by slow trains directly in front of them. Also, the impact of disruption or imperfect punctuality will be greater where passengers have deliberately timed their arrival at the station to correspond to a timetabled departure. For these passengers, if their fast service does not arrive on time, the “promise” has been broken and they are more likely to be dissatisfied. Finally, the uniform metro services, especially those operating to ends of the line, will load more evenly, resulting in fewer passengers having to stand and more consistent station stop-times. These consequential benefits are not easy to quantify but tend to reveal themselves under multi-train simulations.
ix) Running all trains stopping at all stations and/or running more trains to the ends of the line has an additional cost as more trains will be required to run the service. An estimated extra 413 trains would be required to convert today’s operation into an all stopping metro service. A further 6 trains would be needed to extend all trains to Koge and Hillerod. This has assumed to be a necessary compensation for the groups of passengers at the ends of these branches. It is assumed that there remains short tripping at Osterport and Ballerup. However, the amount of short-tripping and optimum service frequencies to the branches would become a traffic planning exercise itself, and a question of cost benefit analysis.
Quantified Analysis.
The overall assessment shows that, with today’s service levels, it would not be beneficial to move to a metro service without running more trains and this would have associated costs. However, if the trains and train drivers were available, the overall case appears to be marginal in today’s circumstances provided the biggest losers at Koge and Hillerod were compensated with more trains. Running more trains at shorter length during the peaks would reduce the marginal cost per train hour making the change more viable. A traffic planning exercise would need to be undertaken to confirm these conclusions.
METRO PROPOSALS Passenger Hours Per
Annum
Social Benefit Per Annum (93 DKK per hour)
Extra Trains in Peak/Off Peak
Service
Train Hours Per Day
Operating Costs Per
Day (800DKK Train/Hour)
Total Operating Costs per
Annum (milllions DKK)
Benefit/Costs (NTO)
Hillerod (E line) all Stations and all trains extended (B line) -189,024 17.6 4.3 77.4 61920 22.60 0.78
Farum (H line) all stations-43,146 4.0 0.3/0 1.5 1200 0.44 9.16
Frederiksuund (H line) all stations-37,415 3.5 1.1 19.8 15840 5.78 0.60
Hoje Taastrup (Bx line) all stations-86,708 8.1 0.3/0 1.5 1200 0.44 18.41
Koge (E line) all Stations and all trains extended (A line) -260,301 24.2 4.1 73.8 59040 21.55 1.12
Metro Package -616,594 57.3 10.0/9.4 174.0 139,200 50.8 1.13 Table 42 Metro Branch Summary
13 For cost benefit analysis it is appropriate to consider fractions of trains. In reality a tactical decision would be taken whether to provide an additional train or not which would provide more/less benefit in itself.

107
APPENDIX E – Prime
PRIME Outline PRIME is a Modelling Environment rather than a modelling tool. This means that it is a toolbox of compatible modelling modules that can be configured and customised to the requirements of a specific project. Features offered by PRIME include:
• Providing a flexible modelling environment which is easily adaptable to different study objectives as well as different railway characteristics.
• Giving a full profile of signalling headways at each point on the line. This not only identifies the main bottlenecks but also shows potential secondary pinch points that could limit capacity if the primary bottlenecks are eased.
• Simulating target service patterns to evaluate the actual headways can be achieved.
• Simulating different patterns of service perturbations to determine realistic operational headway targets.
• Evaluating the impact of perturbations on punctuality and journey times.
• Evaluating the impact of rolling stock traction systems.
• Evaluating energy consumption.
• Evaluating the impact of train design on passenger capacity and dwell time efficiency.
• Exploring different service patterns and timetables.
• Exploring operational strategies such as unattended operation and automatic reversing.
Parsons have utilized PRIME on a number of railway projects including:
• A study of the maximum capacity that could be obtained for future operations on the YUS Line in Toronto.
• A UK Department for Transport looked at the ability of Level 3 ETCS to support high density commuter services such as Thameslink upgrade and Crossrail.
• Capacity optimisation for the Copenhagen Metro City Ring project.
• Developing a business case for unattended operation on the Stockholm commuter lines.
• Train System Optimisation for London Underground
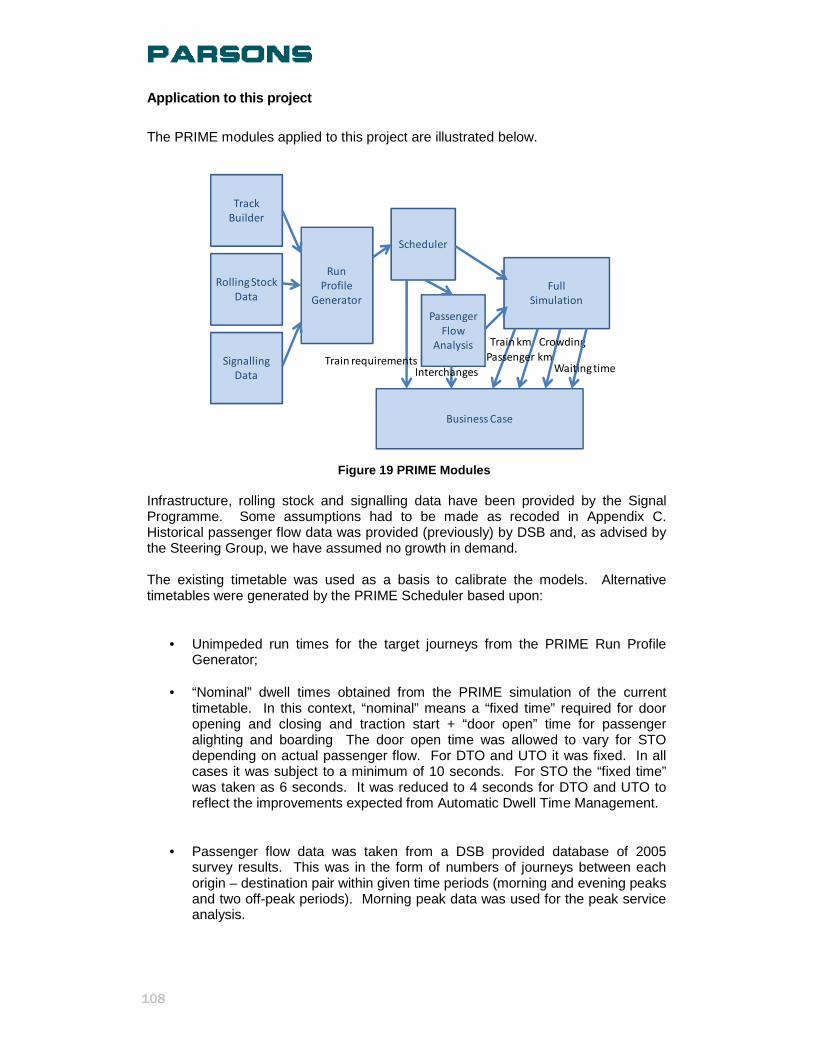
108
Application to this project
The PRIME modules applied to this project are illustrated below. Infrastructure, rolling stock and signalling data have been provided by the Signal Programme. Some assumptions had to be made as recoded in Appendix C. Historical passenger flow data was provided (previously) by DSB and, as advised by the Steering Group, we have assumed no growth in demand. The existing timetable was used as a basis to calibrate the models. Alternative timetables were generated by the PRIME Scheduler based upon:
• Unimpeded run times for the target journeys from the PRIME Run Profile Generator;
• “Nominal” dwell times obtained from the PRIME simulation of the current timetable. In this context, “nominal” means a “fixed time” required for door opening and closing and traction start + “door open” time for passenger alighting and boarding The door open time was allowed to vary for STO depending on actual passenger flow. For DTO and UTO it was fixed. In all cases it was subject to a minimum of 10 seconds. For STO the “fixed time” was taken as 6 seconds. It was reduced to 4 seconds for DTO and UTO to reflect the improvements expected from Automatic Dwell Time Management.
• Passenger flow data was taken from a DSB provided database of 2005 survey results. This was in the form of numbers of journeys between each origin – destination pair within given time periods (morning and evening peaks and two off-peak periods). Morning peak data was used for the peak service analysis.
Track
Builder
Rolling Stock
Data
Signalling
Data
Scheduler
Run
Profile
Generator
Passenger
Flow
Analysis
Full
Simulation
Business Case
Interchanges
Train km
Train requirements Passenger km
Crowding
Waiting time
Figure 19 PRIME Modules
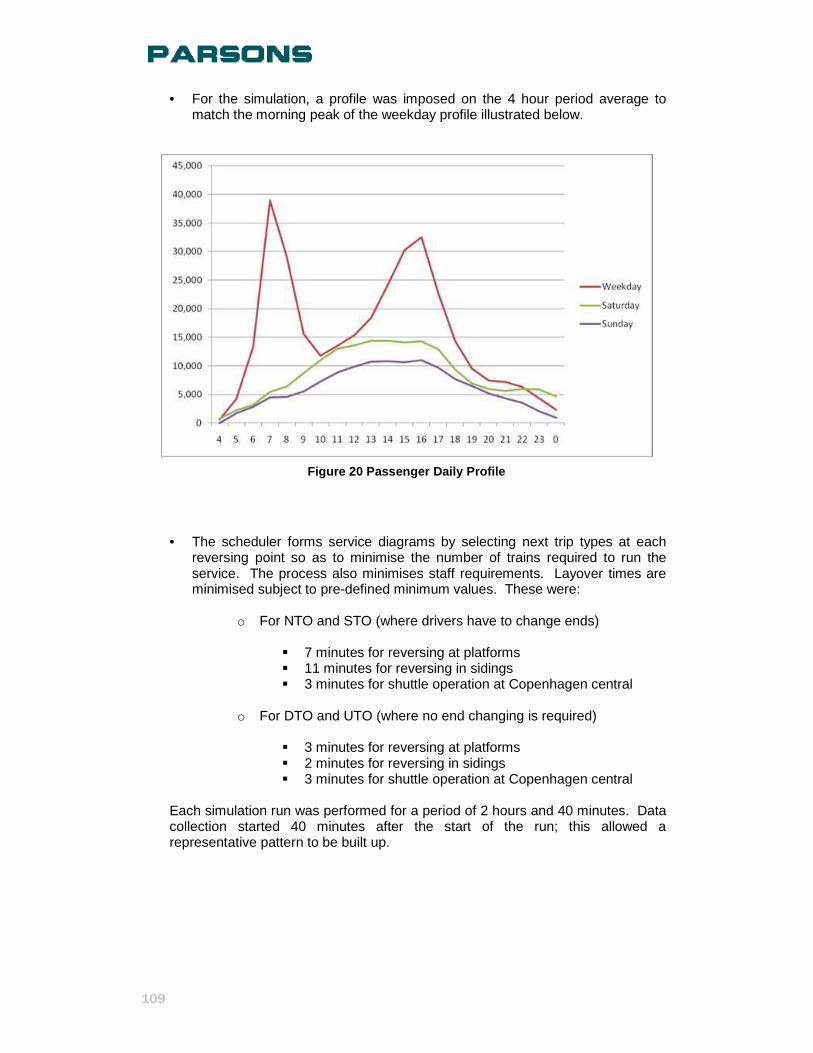
109
• For the simulation, a profile was imposed on the 4 hour period average to match the morning peak of the weekday profile illustrated below.
Figure 20 Passenger Daily Profile
• The scheduler forms service diagrams by selecting next trip types at each reversing point so as to minimise the number of trains required to run the service. The process also minimises staff requirements. Layover times are minimised subject to pre-defined minimum values. These were:
o For NTO and STO (where drivers have to change ends)
� 7 minutes for reversing at platforms � 11 minutes for reversing in sidings � 3 minutes for shuttle operation at Copenhagen central
o For DTO and UTO (where no end changing is required)
� 3 minutes for reversing at platforms � 2 minutes for reversing in sidings � 3 minutes for shuttle operation at Copenhagen central
Each simulation run was performed for a period of 2 hours and 40 minutes. Data collection started 40 minutes after the start of the run; this allowed a representative pattern to be built up.
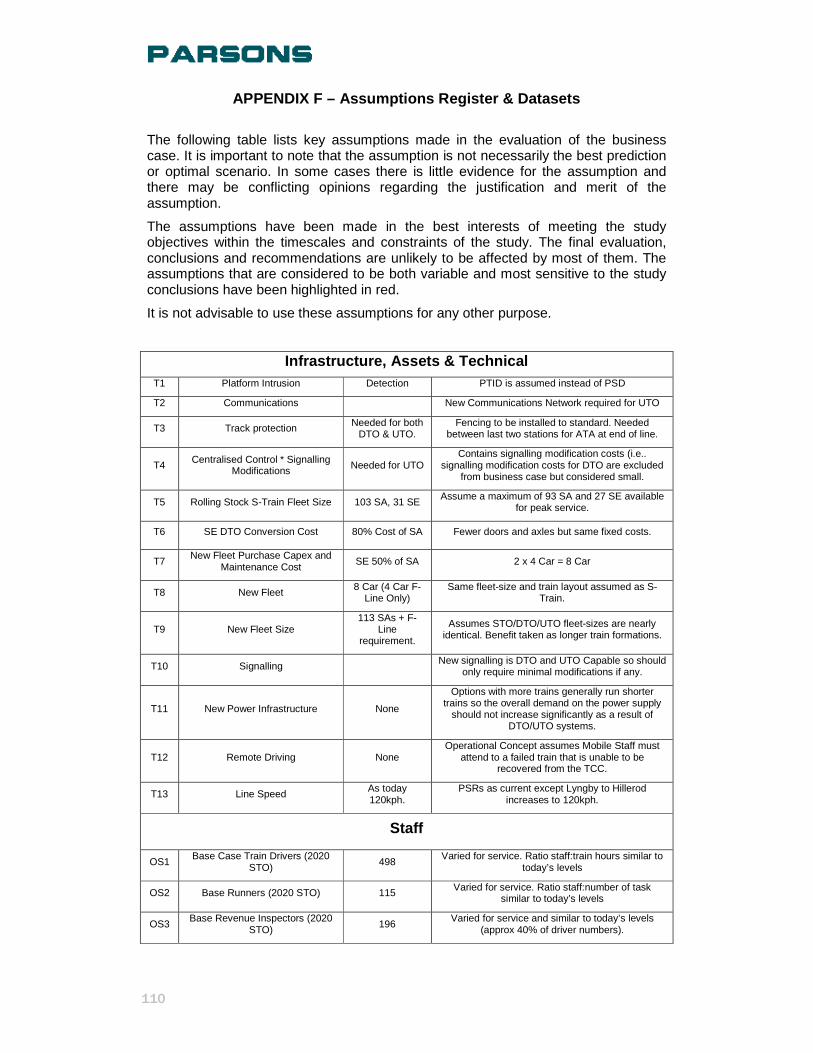
110
APPENDIX F – Assumptions Register & Datasets
The following table lists key assumptions made in the evaluation of the business case. It is important to note that the assumption is not necessarily the best prediction or optimal scenario. In some cases there is little evidence for the assumption and there may be conflicting opinions regarding the justification and merit of the assumption.
The assumptions have been made in the best interests of meeting the study objectives within the timescales and constraints of the study. The final evaluation, conclusions and recommendations are unlikely to be affected by most of them. The assumptions that are considered to be both variable and most sensitive to the study conclusions have been highlighted in red.
It is not advisable to use these assumptions for any other purpose.
Infrastructure, Assets & Technical T1 Platform Intrusion Detection PTID is assumed instead of PSD
T2 Communications New Communications Network required for UTO
T3 Track protection Needed for both DTO & UTO.
Fencing to be installed to standard. Needed between last two stations for ATA at end of line.
T4 Centralised Control * Signalling Modifications Needed for UTO
Contains signalling modification costs (i.e.. signalling modification costs for DTO are excluded
from business case but considered small.
T5 Rolling Stock S-Train Fleet Size 103 SA, 31 SE Assume a maximum of 93 SA and 27 SE available
for peak service.
T6 SE DTO Conversion Cost 80% Cost of SA Fewer doors and axles but same fixed costs.
T7 New Fleet Purchase Capex and
Maintenance Cost SE 50% of SA 2 x 4 Car = 8 Car
T8 New Fleet 8 Car (4 Car F-Line Only)
Same fleet-size and train layout assumed as S-Train.
T9 New Fleet Size 113 SAs + F-
Line requirement.
Assumes STO/DTO/UTO fleet-sizes are nearly identical. Benefit taken as longer train formations.
T10 Signalling New signalling is DTO and UTO Capable so should only require minimal modifications if any.
T11 New Power Infrastructure None
Options with more trains generally run shorter trains so the overall demand on the power supply
should not increase significantly as a result of DTO/UTO systems.
T12 Remote Driving None Operational Concept assumes Mobile Staff must
attend to a failed train that is unable to be recovered from the TCC.
T13 Line Speed As today 120kph.
PSRs as current except Lyngby to Hillerod increases to 120kph.
Staff
OS1 Base Case Train Drivers (2020
STO) 498 Varied for service. Ratio staff:train hours similar to
today’s levels
OS2 Base Runners (2020 STO) 115 Varied for service. Ratio staff:number of task similar to today’s levels
OS3 Base Revenue Inspectors (2020
STO) 196 Varied for service and similar to today’s levels
(approx 40% of driver numbers).

111
OS4 Train Captains (DTO) Same ratio as Train Drivers
Assume same schedule efficiency as for drivers.
OS5 Mobile Staff (UTO) 4:5 Mobile Staff
to Trains in Service
Compared to Metro (ratio 2:3). Higher due to relatively more platforms and track kilometres.
OS6 Mobile Staff / Train driver Efficiency
90%
Parsons Estimate as Mobile Staff shifts are not constrained by Timetable and Driving Shift
restrictions.
OS7 Information Assistants Base Case (2020 STO)
22 Varied for service and similar to today’s levels. Twice as many needed for UTO.
OS8 Fleet Managers 37 Varied for service and similar to today’s levels
OS9 Revenue Inspectors 50% reduction
DTO, 100% reduction UTO.
Assumes a synergy with the Train Captain and Mobile Staff roles.
Operational Performance
OP1 Minimum Train Reversing STO 240 seconds Parsons estimate for train driver walking length of train (discussed with DSB). 150 seconds for SE.
OP2 Minimum Train Reversing DTO/UTO
30 seconds Parsons estimate (could be faster)
OP3 Crew Change Kobenhavn H Location to be the same as today. 90 seconds allowance for STO/DTO made.
OP4 Depots and Stabling Hoje Taastrup Same maintenance depot and same out-stabling as today.
Service
S1 Prime Peak Hours 07:00-09:00, 15:00-17:00 Busied 2 hours from the demand profile.
S2 Prime Off Peak Hours 12:30-14:30 Busied 2 hours from the demand profile. Off peak
costs and benefits annualised from costs & benefits in weekday inter-peak period.
S3 Base Case Service Pattern
33 TPH Peak
No change off peak
Additional 3 tph peak on H Line as agreed with Steering Group
S4 Prime Timetable Recovery Zero Recovery removed from running times in Prime
model. Additional 10% trains required off peak to provide compensating recovery at terminus.
S5 Prime Demand Annualisation 445 Peaks
1366 Off Peaks
Number of Prime peaks and off peaks needed to produce 80.1 million journeys and a 48%:52% split.
S6 Prime Train Kilometrage Annualisation
500 Peaks
2250 Off peak
Estimated from inspecting timetable. Assumes 250 weekdays and equivalent of 12 hours per day of
the full off peak operation (i.e. allows for quiet periods).
S7 F-Line 15tph Peak,
Average 10tph other times
Increase of 25% compared to today.
Business Case Evaluation (Parameters in Business Ca se Model)
BC1 Value of Time DKK 90 per
Hour Advised by Transport Ministry in meeting 28/06/10
BC2 UK Value of Time £8.91 per hour Used to value Experience benefits from London (i.e. by ratio of DKK/UK)
BC3 Revenue Elasticity 0.25 Estimated Parsons
BC4 Platform Waiting Penalty = 1 1 1.0 x the average waiting time (i.e. all headways assumed less than 12 minutes).
BC5 Interchange penalty 5 minutes per
passenger Provided by Transport Ministry

112
BC6 Exchange Rate DKK to £ 8.80 Taken 19/07/2010
BC7 Exchange Rate DKK to Euro 7.45 Taken 19/07/2010
BC8 Average passenger ride time per
journey(exclude F Line) 15 minutes
Prime predicts approximately 12 minutes per trip but journeys > trips (due to interchange) and there
will be excess running time.
BC9 Average passenger ride time F
Line. 9 minutes Estimated Parsons (assumes approx 6km per
journey)
BC10 Annual passenger journeys
(exclude F Line) 80.1 million Pattern of demand (origin and Destinations) taken from 2005 database and results uplifted to 2008.
BC11 Annual passenger journeys F
Line 12 million From 2008 Demand Matrix. Pattern of demand not
needed (average trip length assumed).
BC12 Peaks periods per annum 252 x 2 (a.m.
and p.m.) Assumes 8 Bank Holidays
BC13 Off peak periods per annum 350 Assumes 350 x (9.30-16.30) equivalent to all off peak.
BC14 Demand Growth Zero No basis for other assumption.
BC15 Value of time increase (real
terms)
122% 2020, 143% 2030, 167% 2040, 208% 2050, 254% 2060
(2010=100%)
Taken as GDP growth from Transport Economic Unit for Socio-Economic Analysis
BC16 Salary increase (real terms) See Value of
Time Increase. Taken as GDP growth from Transport Economic
Unit for Socio-Economic Analysis
BC17 Energy price increase (real terms) Zero No firm basis for other assumption.
BC18 Maintenance price increase (real
terms) Zero No firm basis for other assumption.
BC19 Capital price increase (real terms) Zero No firm basis for other assumption.
BC20 Discount Rate 5% per annum Taken as GDP growth from Transport Economic Unit for Socio-Economic Analysis
BC21 Project Life 2055 end Assumes 25 years following fleet replacement
BC22 Capital Cost Lag (Trains) 4 years Assume costs are incurred on average 4 years before full fleet in revenue service.
BC23 Capital Cost Lag (Not Train) 2 years Assume costs are incurred on average 2 years before assets fully operational in revenue service.
BC24 Revenue Lag following service
improvement 4 years Gradual build up, 40% first year, 70% second, 90% third, 100% four years.
Costs
C1 Cost of Energy DKK 0.62 per Kilowatt Hour Assume UK is 7p per KWH and convert to DKK.
C2 Energy per Car KM 1.49 KWH Produces an energy cost of
C3 Marginal Maintenance Costs
Current Fleet DKK 0.92 per Car Kilometre Assumes marginal train & track etc maintenance.
C4 Marginal Maintenance Costs New
Fleet DKK 0.46 per Car Kilometre
Excludes marginal train maintenance (captured as % of capex).
C5 Opex Comms System Lineside 6.00%
Corresponds to 10% of the base costs excluding the 66% contingency.
C6 Opex Central Control 3.75%
Corresponds to 5% of the base costs excluding the 33% contingency.
C7 Opex DTO Fleet Conversion 3.00%
Corresponds to 6% of the base costs excluding the 100% contingency.
C8 Opex STO/DTO/UTO New Fleet
3.75%
Corresponds to 5% of the base costs excluding the 33% contingency.
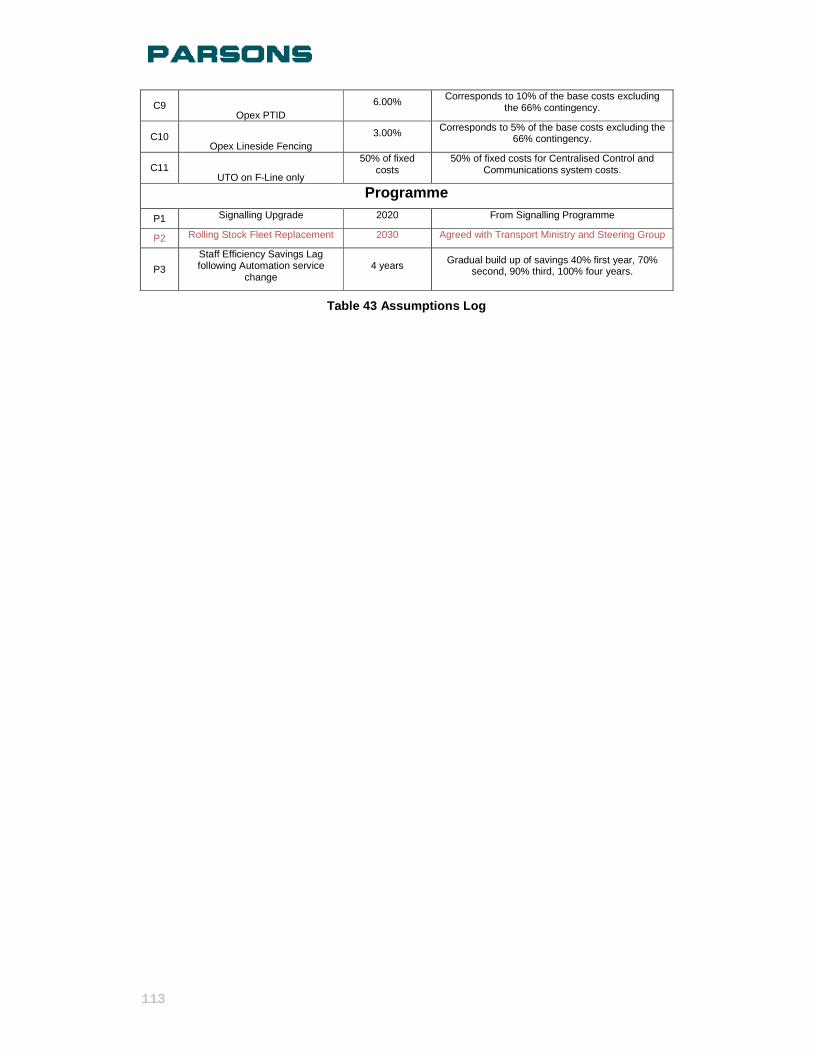
113
C9 Opex PTID
6.00% Corresponds to 10% of the base costs excluding the 66% contingency.
C10 Opex Lineside Fencing
3.00% Corresponds to 5% of the base costs excluding the 66% contingency.
C11 UTO on F-Line only
50% of fixed costs
50% of fixed costs for Centralised Control and Communications system costs.
Programme
P1 Signalling Upgrade 2020 From Signalling Programme
P2 Rolling Stock Fleet Replacement 2030 Agreed with Transport Ministry and Steering Group
P3
Staff Efficiency Savings Lag following Automation service
change 4 years Gradual build up of savings 40% first year, 70%
second, 90% third, 100% four years.
Table 43 Assumptions Log

114
APPENDIX G – Business Requirements
The following appendix is arranged by categories of requirements. The categories relate to the elements of railway operation that are mainly benefited by the contained requirements. Every requirement in this appendix contains the word “shall”. This ensures there is no ambiguity about which statements are requirements and which are not. Many of the groups of requirements are preceded by a narrative text in italics, intended to give an informal summary of coverage of the requirements, these are not the requirements. All requirements in this document are identified by a unique number prefixed with BR (i.e. BR.n). The Prefix BR applies to the set of business requirements and the number is consistent with that used for the (S-Bane, Business, Requirements Modernisation of Control Systems (MoCS), Ref FS185 221-001(2) June 2008). Most of the UTO Business Requirements are derived requirements from the MoCS, slightly amended as applicable where the specific context requires some rewording. The requirement numbers are unique for all time to a particular requirement. A requirement may be changed but its requirement number remains the same, if a requirement is deleted its number cannot be reused. This means that no sense can be made of the sequence of requirement numbers however any reference to a requirement can always be tracked. Where necessary, guidance is recorded with a requirement. Guidance is used to convey information which may help in the development or understanding of a requirement. The Expected Consequences record the Visions and Technical Requirements and are those elicited from the MoCS BR Workshop on 15th June 2007, along with a number of existing documents. These sources were used to develop and refine the original set of Business Requirements for MoCS. The consequences therefore are unlikely to be due solely to Automatic Operations, but it is envisaged that Automatic Operations can make significant contributions to the achievement of overall targets for the Signalling Programme or the Overall Vision. Each of these consequences is categorized: R1 - High Priority Requirement (technical) R2 - Medium Priority Requirement (technical) R3 - Lower Priority Requirement (technical) V20 - Vision for 2020 V50 - Vision for 2050 SV - Stakeholder Vision extracted from published documents (Banedanmark and DSB S-tog ‘Vision and Mission’ documents).

115
Project
BR.120 All stakeholders in Automatic Operation shall be identified and consulted at all stages of the project through the established Automatic Operations Steering Group. Expected Consequences: Source.33 Partnering between stakeholders at all appropriate levels. R3
Corporate The service delivered by Automatic Operations will directly support S-bane in achieving its visions. Automatic Operation should directly contribute to achieving S-bane's ultimate goal of attracting additional and more satisfied customers.
BR.14 Automatic Operations shall attract more customers. Expected Consequences : Source.54 Vision: 90% of public transport movement to be by rail. V50 Source.70 Vision: S-train to carry 103 million passengers per year. [It is anticipated there will be 100 million passengers per year by 2014]. SV Source.77 Vision: Design of systems to be aesthetically pleasing SV
BR.15 Automatic Operations shall improve customer satisfaction. Expected Consequences : Source.71 Vision: Customer satisfaction to be >10 (on a scale of 13) SV
BR.116 Automatic Operations shall not inhibit the increased integration of transport services in the Copenhagen area. Guidance : S-train services should be co-ordinated with other forms of transport such as buses, other trains and ferries. Expected Consequences : Source.41 Vision: S-train service co-ordinated with buses V20 Source.75 Vision: S-train system to be co-ordinated with other transport systems, road, buses, ferries etc. SV Source.137 Service information between trains and bus services (R2) R2
BR.126 Automatic Operations shall not inhibit extended hours of operation. Guidance : Up to 24hr operation. Expected Consequences : Source.40 Vision: Capability for 24 hour train service. V20
Customer The main benefits that Automatic Operations must deliver to the customer are related to reduced travel times.
116
The service will recover more rapidly following an incident and be less sensitive to perturbations, these improvements will reduce crowding on trains and platforms. Traffic controllers will have greater flexibility and be able to better respond to unforeseen changes in customer demand. Through Automatic Operations customers will benefit from improved communications.
BR.33 Automatic Operations shall enable the provision of fast and safe journeys in a comfortable and attractive environment. Expected Consequences : Source.10 Maximum speed to be at least current 120 km/h R1 Source.28 Less passenger crowding on platforms and trains R3 Source.29 Clean stations and trains R2 Source.32 10% lower passenger journey time compared to 2007 R3 Source.38 Vision: Minimise travel time V20 Source.74 Vision: Safety level equivalent to current level or better SV Source.77 Vision: Design of systems to be aesthetically pleasing SV Source.101 Client Satisfaction: Banedanmark wants satisfied clients. This can be achieved by keeping the promises made to the clients. Banedanmark's clients are both operators and passengers. (BDK) SV Source.102 Vision: An annual increase in client satisfaction (operators) of 5%. (BDK) SV Source.103 Vision: An annual increase in client satisfaction with passengers of 5%. (BDK) SV Source.108 DSB S-train mission: The S-train unites the capital and ensures that people reach their destination quickly, comfortably and safely. We are on track - it's that simple! (DSB) SV Source.110 DSB S-train vision: International recognition as a competitive big city railway operator. (DSB) SV Source.114 A general client satisfaction of at least 10 (on a scale of 13) (DSB) SV
BR.21 Automatic Operations shall improve the speed and quality of information distribution to customers about delays and subsequent service recovery. Guidance : Information must be based on up-to-date real information. Expected Consequences : Source.11 System to integrate with traffic information systems so stations (and internet) display current, continuous and real time service information R1 Source.49 Vision: Fully automated traffic information system V20 Source.114 A general client satisfaction of at least 10 (on a scale of 13) (DSB) SV Source.121 Alternative route information available to passengers during delayed services. (R1) R1
BR.90 Automatic Operations shall enable traffic control centre staff to easily modify the service in a way that benefits customers with greater flexibility. Expected Consequences : Source.20 Quick and easy recovery from disruption with decision support systems for controllers. R1 Source.22 Fall back strategy to allow reduced service when parts of system not available. R2 Source.36 Flexibility to allow different forms of operation, including shunting, convoy, turnbacks. R3 Source.46 Vision: Highly flexible system. V20 Source.55 Vision: Dynamic timetable able to respond to demand with changes to services and additional services. V50 Source.129 Information system to inform control centre of passenger numbers on individual services to enable control centre to effectively re-route passengers on to other services. (R3) R3 Source.131 Quicker turnarounds at more locations R1
BR.18 Automatic Operations shall reduce travel times.

117
Expected Consequences : Source.32 10% lower passenger journey time compared to 2007 R3 Source.38 Vision: Minimise travel time V20 Source.124 Reduced journey time. R1
BR.25 Automatic Operations shall provide higher capacity. Expected Consequences : Source.28 Less passenger crowding on platforms and trains R3 Source.2 80-90 second timetabled headway at stations in the central area. R1 Source.37 Vision: Traffic growth on trains not roads V20
BR.31 Automatic Operations shall improve punctuality. Guidance : In this context, punctuality is a measure of the actual service delivered compared to the planned service, whether specified in terms of a timetable or in terms of regularity of service. Expected Consequences : Source.1 Punctuality target of 97% R2
System Performance Automatic Operations will deliver a reliable and consistent train service, Reliability will be provided by robust automated systems delivering the planned service with a minimum of human operation and intervention. Following an incident, Automatic Operations will recover the service quickly by supporting service reformations. To enable the best use of facilities, facilities will be provided to diagnose problems and manage the service.
BR.19 Automatic Operations shall reduce delays due to faults. Guidance : This is achievable both by reducing faults and reducing their impact. Expected Consequences : Source.4 Temporary speed restrictions applicable over dynamically defined sections (not limited to full block sections). R1 Source.5 Bi-directional signalling to allow routing around problems with minimal service impact (but not a normal mode of operation). R1 Source.7 Availability of signalling system to at least equal availability of 2003 R1 Source.20 Quick and easy recovery from disruption with decision support systems for controllers. R1 Source.22 Fall back strategy to allow reduced service when parts of system not available. R2 Source.23 Diagnose and repair faults from CTC R2 Source.24 Fault diagnosis integrated with decision support system R1 Source.119 10 minute headway for operation as fall back on single track R1 Source.127 Bi-directional signalled passing routes. (R1) R1
BR.24 Automatic Operations shall enable the operation of a more reliable and predictable service. Expected Consequences : Source.1 Punctuality target of 97%, of which signalling element achieves 99.9%. R2 Source.7 Availability of signalling system to at least equal availability of 2003 R1

118
Source.13 Support systems required for on and off line timetable systems and punctuality data. R1 Source.39 Vision: Reliability attributable to signalling of 99.9% V20 Source.115 A punctuality of 97% (own share of irregularities 2%) (DSB) SV
Operational Flexibility
BR.45 Automatic Operations shall support the operation of different length train consists. Guidance : Train consist is the composition of the train in terms of cars. Expected Consequences : Source.19 Flexibility and different speed/acceleration/braking profiles for various types of rolling stock, as provided by moving block for example. R3
BR.80 Automatic Operations shall support the change of a train's consist at passenger stations. Expected Consequences : Source.136 Splitting and joining trains at platforms in passenger service (R1) R1
BR.56 It shall be possible to transport trains which are not equipped with new systems in Automatic areas without disrupting the service in the Automatic area. Expected Consequences : Source.8 Signalling system to be compatible with engineering trains R1 Source.47 Vision: Mixed traffic - driverless trains and other trains operating on same tracks. V20 Source.143 Mixed traffic drivers and driverless (R1) R1
BR.123 Automatic Operations shall increase the automation of control tasks. Expected Consequences : Source.14 Simulation education and training required for control centre staff R1 Source.15 System needs to be easily controlled by the Traffic Controllers R1 Source.45 Vision: Reduced need for manual intervention by traffic control staff. V20
Staff Automatic Operations will be designed to enable future operation with no staff onboard the train or on the platform (there may be benefits however in providing staff onboard the train or on the platform).
BR.125 Automatic Operations shall support the provision of stimulating and rewarding roles for staff. Expected Consequences : Source.69 Vision: S-train to be a good place to work. SV Source.109 DSB S-train vision: International recognition as a marked railway operator and a good place to work. (DSB) SV
BR.117 Automatic Operations shall account for the requirements of staff. Guidance : New and changed system must be designed with full account for the needs of staff. Expected Consequences : Source.18 Drivers and control staff requirements to be taken into account. R1

119
Implementation/Migration Disruption and risks caused by Automatic Operations should be minimised through careful design and planning covering both human and technical issues. In planning the migration towards Automatic Operations, opportunities should be sought to introduce it incrementally on a functional, geographic or asset by asset basis where this reduces any aspect of risk or enables benefits to be realised earlier.
BR.59 During the implementation of Automatic Operations, disruption and performance deterioration caused by works shall be minimised. Expected Consequences : Source.12 During transition between current and new systems delays to passengers should be minimised. R1
BR.61 Automation systems shall be designed in a way that will facilitate Automatic Operations functionality and coverage being implemented on an incremental basis. Guidance : In this context "coverage" can refer to geographical coverage or fleet coverage. Expected Consequences : Source.12 During transition between current and new systems delays to passengers should be minimised. R1
Safety Automatic Operations shall deliver a railway which should achieve improved levels of safety as at present.
BR.27 Automatic Operations shall maintain or improve overall levels of safety. Guidance : Minimum requirements to maintain current levels. Expected Consequences : Source.72 Vision: Work related safety to increase by 1% each year SV Source.74 Vision: Safety level equivalent to current level or better SV Source.76 Vision: Reliability & safety as defined in EU standards SV Source.116 That the current level of safety is at least maintained and that there are constant efforts to try and heighten the level. (DSB) SV
BR.65 Automatic Operations shall include safe systems of work for people on or about the track. Guidance : In this context "systems" include planning and execution. Expected Consequences : Source.73 Vision: Staff incidents reduced by half each year SV Source.74 Vision: Safety level equivalent to current level or better SV
Environmental A better service with more capacity will attract passengers who would otherwise have travelled by car. A more punctual service leads to less signal checks and as such more efficient energy usage, and Automatic Operations would enable running a more frequent service with shorter trains using less power.
120
BR.92 Automatic Operations shall enable more efficient use of energy resources. Expected Consequences : Source.6 Speed control at junction approaches to optimise merging of lines (intelligent optimised junction management to reduce braking/stopping/restarts). R1 Source.78 Vision: Systems to be ecological, environmentally friendly and sustainable SV Source.122 System optimised speed/coasting for most efficient service. If manual: indicated to driver. If Auto: ATC drives to optimise efficient performance. R1
Operating Cost Automatic Operations can reduce costs due to the more efficient use of people and assets.
BR.67 Automatic Operations shall enable equivalent service levels to be delivered at a lower operating cost. Expected Consequences : Source.42 Vision: Lower public subsidies V20 Source.43 Vision: Low lifecycle cost V20 Source.98 Vision: An annual improvement of efficiency of at least 2% (BDK) SV Source.122 System optimised speed/coasting for most efficient service. If manual: indicated to driver. If Auto: ATC drives to optimise efficient performance. R1


![Supplement to Jamieson's Scottish dictionary with … · REE [201] REL REEL-BANE,Eeele-bane,Eewel-bane, Royal-bane,s. Anunknownmaterialof whichsaddlesweresupposedtobemade. Thistermoccursfrequently,andundervarious](https://static.fdocuments.us/doc/165x107/5b9b1d3909d3f22d2a8ca0f9/supplement-to-jamiesons-scottish-dictionary-with-ree-201-rel-reel-baneeeele-baneeewel-bane.jpg)