Coordinating rule-based and system-wide ... -...
16
General rights Copyright and moral rights for the publications made accessible in the public portal are retained by the authors and/or other copyright owners and it is a condition of accessing publications that users recognise and abide by the legal requirements associated with these rights. • Users may download and print one copy of any publication from the public portal for the purpose of private study or research. • You may not further distribute the material or use it for any profit-making activity or commercial gain • You may freely distribute the URL identifying the publication in the public portal If you believe that this document breaches copyright please contact us providing details, and we will remove access to the work immediately and investigate your claim. Downloaded from orbit.dtu.dk on: Sep 15, 2018 Coordinating rule-based and system-wide model predictive control strategies to reduce storage expansion of combined urban drainage systems: The case study of Lundtofte, Denmark Meneses Ortega, Elbys Jose; Gaussens, Marion; Jakobsen, Carsten; Mikkelsen, Peter Steen; Grum, Morten; Vezzaro, Luca Published in: Water Link to article, DOI: 10.3390/w10010076 Publication date: 2018 Document Version Publisher's PDF, also known as Version of record Link back to DTU Orbit Citation (APA): Meneses, E. J., Gaussens, M., Jakobsen, C., Mikkelsen, P. S., Grum, M., & Vezzaro, L. (2018). Coordinating rule-based and system-wide model predictive control strategies to reduce storage expansion of combined urban drainage systems: The case study of Lundtofte, Denmark. Water, 10(1), [76]. DOI: 10.3390/w10010076
Transcript of Coordinating rule-based and system-wide ... -...
General rights Copyright and moral rights for the publications made accessible in the public portal are retained by the authors and/or other copyright owners and it is a condition of accessing publications that users recognise and abide by the legal requirements associated with these rights.
• Users may download and print one copy of any publication from the public portal for the purpose of private study or research. • You may not further distribute the material or use it for any profit-making activity or commercial gain • You may freely distribute the URL identifying the publication in the public portal
If you believe that this document breaches copyright please contact us providing details, and we will remove access to the work immediately and investigate your claim.
Downloaded from orbit.dtu.dk on: Sep 15, 2018
Coordinating rule-based and system-wide model predictive control strategies toreduce storage expansion of combined urban drainage systems: The case study ofLundtofte, Denmark
Meneses Ortega, Elbys Jose; Gaussens, Marion; Jakobsen, Carsten; Mikkelsen, Peter Steen; Grum,Morten; Vezzaro, LucaPublished in:Water
Link to article, DOI:10.3390/w10010076
Publication date:2018
Document VersionPublisher's PDF, also known as Version of record
Link back to DTU Orbit
Citation (APA):Meneses, E. J., Gaussens, M., Jakobsen, C., Mikkelsen, P. S., Grum, M., & Vezzaro, L. (2018). Coordinatingrule-based and system-wide model predictive control strategies to reduce storage expansion of combined urbandrainage systems: The case study of Lundtofte, Denmark. Water, 10(1), [76]. DOI: 10.3390/w10010076
water
Article
Coordinating Rule-Based and System-Wide ModelPredictive Control Strategies to Reduce StorageExpansion of Combined Urban Drainage Systems:The Case Study of Lundtofte, Denmark
Elbys Jose Meneses 1,2, Marion Gaussens 1, Carsten Jakobsen 2, Peter Steen Mikkelsen 1 ID ,Morten Grum 2,† and Luca Vezzaro 1,2,* ID
1 Department of Environmental Engineering (DTU Environment), Technical University of Denmark,2800 Kongens Lyngby, Denmark; [email protected] (E.J.M.); [email protected] (M.G.);[email protected] (P.S.M.)
2 Kruger A/S, Veolia Water Technologies, 2860 Søborg, Denmark; [email protected] (C.J.);[email protected] (M.G.)
* Correspondence: [email protected]; Tel.: +45-452-515-79† Current Address: Water Zerv, Environmental Services, 2700 Brønshøj, Denmark.
Received: 20 October 2017; Accepted: 21 December 2017; Published: 16 January 2018
Abstract: The environmental benefits of combining traditional infrastructure solutions for urbandrainage (increasing storage volume) with real time control (RTC) strategies were investigated inthe Lundofte catchment in Denmark, where an expensive traditional infrastructure expansion isplanned to comply with environmental requirements. A coordinating, rule-based RTC strategyand a global, system-wide risk-based dynamic optimization strategy (model predictive control),were compared using a detailed hydrodynamic model. RTC allowed a reduction of the plannedstorage volume by 21% while improving the system performance in terms of combined seweroverflow (CSO) volumes, environmental impacts, and utility costs, which were reduced by up to 10%.The risk-based optimization strategy provided slightly better performance in terms of reducing CSOvolumes, with evident improvements in environmental impacts and utility costs, due to its ability toprioritize among the environmental sensitivity of different recipients. A method for extrapolatingannual statistics from a limited number of events over a time interval was developed and applied toestimate yearly performance, based on the simulation of 46 events over a five-year period. This studyillustrates that including RTC during the planning stages reduces the infrastructural costs whileoffering better environmental protection, and that dynamic risk-based optimisation allows prioritisingenvironmental impact reduction for particularly sensitive locations.
Keywords: combined sewer overflow (CSO); coordinating real time control (RTC); Dynamic OverflowRisk Assessment (DORA); environmental impact reduction; sensitivity of receiving waters
1. Introduction
The interest in online optimization of combined urban drainage systems (UDS) through real timecontrol (RTC) strategies is increasing both among researchers and practitioners. Examples of this arepresented in Schütze and Muschalla [1]. Increasingly, UDS are facing demands for better performancein terms of the reduction of environmental impacts and flood risk, while decreasing their costsand environmental footprint. Large-scale, static, infrastructural investments such as disconnectingimpervious areas, increasing pipe capacity, and creating additional storage facilities, are often applied,but their costs can be extremely high, especially for older systems located in densely populated areaswith high property values. Conversely, RTC has the ability to monitor and dynamically adapt UDS
Water 2018, 10, 76; doi:10.3390/w10010076 www.mdpi.com/journal/water
Water 2018, 10, 76 2 of 15
to the current situation to minimize combined sewer overflows (CSO) and optimize flows to thewastewater treatment plant (WWTP) [2]. Numerous practical applications have reported performanceimprovements and capital cost reductions by implementing RTC in sewer networks [3–9].
A variety of RTC strategies exist with different elements, such as forecasting, online models,optimization algorithms, etc., included in the implementation. System-wide RTC strategies can bedivided in two groups: reactive systems or predictive systems [10]. The first are typically operatedby predefined ruled-based control actions, and do not require complex features such as rainfall andrunoff on-line forecasting models. Mollerup et al. [11,12] suggested distinguishing between a basic,regulatory, reactive control layer based on local control loops, and a more elaborate, coordinating,control layer where control loops may interact, and constraints on actuator capacities or water levels atkey locations in the system may be handled. Predictive control systems are more complex, with severalfeatures, such as online models and weather forecasts, to estimate the future status of the UDS andreact accordingly.
Typically, RTC has been compared against static infrastructural investments [13,14], but littleinformation exists about combined approaches, where static and RTC approaches are complementaryelements of the same solution, such as the expansion of storage volume in combination with RTC.As the cost of a RTC strategy mainly depends on the required equipment, including sensors, actuators,controllers, and telemetry, and the costs of operation and maintenance, a cost–benefit analysis shouldbe performed to identify the most appropriate solution [13,15].
This study aimed to demonstrate the benefits of combining an infrastructural solution (basinexpansion) with two alternative RTC approaches in the Lundtofte catchment in Denmark, where astorage expansion is being planned to comply with new and stricter legal requirements. We alsoconsidered the impact sensitivity in different sections of the receiving water body. The systemperformance was evaluated in terms of CSO volume reduction, environmental impact, and investmentand operation costs. The two RTC approaches are (1) a reactive, coordinating RTC system basedon a set of predefined “if–then–else” control rules; and (2) a model predictive control (MPC)system employing a risk-based optimization algorithm that considers flow forecast uncertainty andsystem-wide distributed CSO impact cost, called DORA (Dynamic Overflow Risk Assessment [16]).The comparison followed the procedure outlined in the M180 guidelines [15], and the catchment wassimulated with a detailed hydrodynamic urban drainage model for 46 historical rain events recordedduring a five-year period. Based on the results of the single event simulations, we developed a methodto extrapolate annual statistics, and quantified the benefits on a yearly basis.
2. Materials and Methods
2.1. Study Area: The Lundtofte Catchment
The Lundtofte catchment (Figure 1) covers an impervious area of 584 ha with a residence timeof approximately 7 h. The WWTP (Mølleåværket, in the northeast corner of the catchment) has acapacity of 132,000 PE, with an average daily load around 1000 m3/h and a maximum capacity in wetweather of 1.5 m3/s (5400 m3/h). The catchment includes 16 storage basins with significant volumesfor control, including one at the WWTP, and 47 CSO structures discharging to different sections ofthe Mølle Å river system. Among the potential control points, where placing an actuator is possible,13 correspond to CSO structures, while four are located at other points in the system.
The combined UDS in the area collects both stormwater and wastewater from differentmunicipalities (Gladsaxe, Lyngby-Taarbæk, and Rudersdal) and is operated by different water utilitycompanies, resulting in the uncoordinated management of different parts of the system, with fewexceptions. The main collectors and the WTTP are jointly managed. The Mølle Å river system isdivided into four environmental sections (Figure 1a): Gladsaxe in the Gladsaxe municipality; StadesKrog, Brede, and Orholm in the Lyngby-Taarbæk municipality; and Nymølle and Aalebækken sharedby the Lyngby-Taarbæk and Rudersdal municipalities. Each environmental section has different

Water 2018, 10, 76 3 of 15
sensitivities and regulations, while being affected by CSO discharges caused by UDSs belonging todifferent utility companies.
The Lyngby-Taarbæk utility company is planning to upgrade its UDS to minimize CSO dischargesand to fulfil legal requirements. A proposed river restoration plan involves a 24,200 m3 expansion ofthe detention storage, distributed amongst four key locations (Figure 1b).
Water 2018, 10, 76 3 of 15
different sensitivities and regulations, while being affected by CSO discharges caused by UDSs belonging to different utility companies.
The Lyngby-Taarbæk utility company is planning to upgrade its UDS to minimize CSO discharges and to fulfil legal requirements. A proposed river restoration plan involves a 24,200 m3 expansion of the detention storage, distributed amongst four key locations (Figure 1b).
Figure 1. Overview of the Mølle Å river system, the urban drainage system (UDS), and storage volumes in the Lundtofte catchment: (a) location of the rain gauges and regulated environmental sections; and (b) potential impact of overflows river sections, also referred as environmental impact areas (see Appendix A2 for more details).
2.2. Model and Input Data
The system performance was simulated using an existing high-fidelity (HiFi) model, a detailed hydrodynamic model consisting of 612 nodes and 614 links, which was implemented in MIKE URBAN (MU; www.mikebydhi.com).
Historical precipitation data were retrieved from the Danish Water Pollution Committee network operated by the Danish Meteorological Institute [17]. Rain series from four stations (Figure 1a) were selected to represent the spatial rainfall distribution in the catchment over a five-year period from February 2008 to February 2013, when all four rain gauges were in service.
The use of complex HiFi models, like MU, is recommended when assessing RTC potentials due to their ability to simulate backwater effects [10], but these models have high computational requirements, making long-term simulations impractical and unfeasible. Therefore, 46 rain events were selected to represent the annual variation in rainfall in terms of rainfall depth and duration. This selection included the 15 largest rain events occurring during the observation period, and 31 additional events, which represent more frequently occurring medium- and small-sized rain events. Additionally, two 14-year rainfall time series were used to establish a relationship between the magnitude of the 46 CSO events and their return period (Section 2.5).
Figure 1. Overview of the Mølle Å river system, the urban drainage system (UDS), and storagevolumes in the Lundtofte catchment: (a) location of the rain gauges and regulated environmentalsections; and (b) potential impact of overflows river sections, also referred as environmental impactareas (see Appendix B for more details).
2.2. Model and Input Data
The system performance was simulated using an existing high-fidelity (HiFi) model, a detailedhydrodynamic model consisting of 612 nodes and 614 links, which was implemented in MIKE URBAN(MU; www.mikebydhi.com).
Historical precipitation data were retrieved from the Danish Water Pollution Committee networkoperated by the Danish Meteorological Institute [17]. Rain series from four stations (Figure 1a) wereselected to represent the spatial rainfall distribution in the catchment over a five-year period fromFebruary 2008 to February 2013, when all four rain gauges were in service.
The use of complex HiFi models, like MU, is recommended when assessing RTC potentials due totheir ability to simulate backwater effects [10], but these models have high computational requirements,making long-term simulations impractical and unfeasible. Therefore, 46 rain events were selected torepresent the annual variation in rainfall in terms of rainfall depth and duration. This selection includedthe 15 largest rain events occurring during the observation period, and 31 additional events, whichrepresent more frequently occurring medium- and small-sized rain events. Additionally, two 14-yearrainfall time series were used to establish a relationship between the magnitude of the 46 CSO eventsand their return period (Section 2.5).

Water 2018, 10, 76 4 of 15
2.3. Development of RTC Strategies
This study followed the steps outlined in the M180 guideline document prepared by the GermanAssociation for Water, Wastewater, and Waste [15].
2.3.1. Preliminary Analysis of Control Potential and Design of Reactive Control Loops
Across the 17 locations with control potential, a preliminary analysis showed that the existingstorage was seldom used. The implementation of both RTC strategies was simulated by addingactuators at these sites in the form of moveable gates in the MU model. The actuators were set tomaximize the storage volume while avoiding the creation of additional problems up or downstream.For example, high storage volumes were found in pipes with relatively flat slopes; their inclusion inthe RTC improved the system performance without storage expansion. Moreover, a static solutionwas included in the model by enlarging a short pipe stretch of 250 m located in a rural area in theRudersdal municipality, which was identified as a bottleneck in the system.
Specific measures were implemented to avoid flooding as a result of the introduction of RTC.For example, if the water level rose above a surcharge threshold, the RTC set-points were overwritten,allowing the maximum possible discharge.
2.3.2. Rule Based Real Time Control (RBC)
The reactive, rule based approach operates based only on the present state of the system, i.e.,information on current flows and water levels. The RBC approach applies several pre-defined“if–then–else” rules for all possible states of the system to fully utilize the storage capacity, and reducesthe CSO volumes and impacts. The RBC was optimized based on a trial and error procedure, based onthe MU results. Basically, outflow set-points from controlled points were modified depending on thefilling degree of the local and neighboring basins. In case of unavoidable overflows, the RBC strategywas designed to protect the most sensitive receiving waters.
2.3.3. Model Predictive Control (MPC)
This predictive approach applies a global, system-wide risk-based optimization strategy, calledDynamic Overflow Risk Assessment (DORA) [16], which combines actual measurements from thesystem (in this case, states were simulated with the MU model), rainfall–runoff forecasts, and theuncertainty of these forecasts. DORA minimizes a global risk function, which is calculated as:
Risk function =Nbasins
∑i=1
(RCr,i + RF,i − Rhor,i) (1)
where RCr is the expected cost of overflows due to the runoff already in the UDS; RF is the expectedcost of overflow volume generated by the rainfall occurring within the forecast horizon, set to 2 h;and Rhor optimizes the available storage volume beyond the forecast horizon by mainly controllingthe emptying of basins.
The expected cost of CSO due to forecasted runoff RF for each controlled point (i) includes forecastuncertainty and is calculated as:
RF,i = Ri·∫ ∞
Vcritical
VF,i·p(VF,i)dVF,i (2)
where Ri is the risk factor for the ith basin (expressed in monetary units, e.g., EUR/m3); Vcritical isthe available storage capacity (i.e., when the forecasted runoff is greater than Vcritical, overflow willoccur); VF,i is the forecasted runoff to the ith basin; and p(VF,i) is the probability associated withthe forecasted runoff volume. DORA aims to reduce the overflow risk across the entire catchment,as calculated by Equation (1), by adjusting the flows between the controlled points. Optimal average

Water 2018, 10, 76 5 of 15
flows over the next 2 h are identified at each time step of 2 min, which is every time new measurementsof water levels and flows are available, by using a genetic algorithm, as initially proposed by Rauchand Harremoës [18]. In this study “perfect rainfall forecasts” are used, which generate predictedrunoff volumes that correspond to the actual inflows to the controlled points. DORA allows for theprioritization of the controlled points through the risk factor Ri: higher values of Ri are assignedto the most sensitive points, resulting in higher CSO risk than at less sensitive points. In this case,the monetary value of overflow, expressed by the risk factor Ri, was defined as an arbitrary value,reflecting the different sensitivity of the different discharge points (see Section 2.4.2). A constantforecast uncertainty was assumed, allowing the calculation of the CSO risk with an analytical solution,as in Vezzaro and Grum [16].
2.3.4. Simulated Scenarios
In this study three scenarios were simulated:
1. The baseline scenario represented the traditional approach, where only static solutions areimplemented, which included the 24,200 m3 basin volume expansion at four locations (Figure 1and Table 1), without RTC.
2. The RBC scenario included the new actuators mentioned in Section 2.3.1 and basin volumeexpansions of 18,980 m3 (Table 1). The sizes of these basins were defined according to an iterativeprocess, where the RBC scenario was simulated in MU for the 46 events, along with graduallysmaller basin storage volumes, until the total CSO volume was equal to the one obtained inthe baseline scenario, i.e., the legal requirement for CSO volume discharge. The RBC scenariorequired a storage volume that was 5220 m3 (21%) lower than in the baseline scenario to obtainsimilar performance in terms of CSO volume reduction.
3. The MPC scenario used the same actuators and storage as the RBC scenario, but the system wasglobally controlled by DORA, which aimed to minimize the CSO risk by using the forecastedrunoff as described in Equation (1).
Table 1. Increased storage volumes for the simulated scenarios at relevant basin locations.
Location Baseline Scenario (m3) RBC and MPC Scenarios (m3) Saved Volume (m3)
Dybendal 500 0 500Aalebækken 7800 6700 1100
Aalebækken Nord 3500 2400 1100Stades Krog 1 12,400 9880 2520
Total 24,200 18,980 5220
2.4. Indicators of Scenario Performance
The three scenarios were compared by looking at CSO volume, environmental impact riskpoints, and utility cost. These outputs were calculated both on a global, system-wide scale and on aper-environmental section basis.
2.4.1. Combined Sewer Overflow Volume
The CSO volume is the most straightforward output for assessing RTC strategies. This variable isalso commonly used by legislation [8], but does not fully evaluate the environmental effects on thereceiving water body [19–21].
2.4.2. Environmental Impact Risk Points (EIRP)
To better assess the environmental impacts of CSOs, the environmental impact risk point (EIRP)indicator was calculated. This indicator was obtained for each CSO structure as the product of the CSOvolume and the unit EIRP, defined as a number of points given per m3 of overflow. High EIRP values

Water 2018, 10, 76 6 of 15
indicate that considerable adverse impacts on the environment are expected. The unit EIRP dependson the location of each CSO structure, and considers both the local conditions and the sensitivity of thereceiving water bodies. EIRP is equivalent, but not identical, to the risk factor Ri used by the MPCscenario using DORA. In this study, the risk factor Ri was defined by simply dividing the EIRP valueby 10 (Appendix B).
As no in situ studies on the sensitivity of the Mølle Å stream are available, unit EIRPs wereassigned by using the U.S. Environmental Protection Agency (EPA) method for CSO ranking [10].This method prioritizes CSO structures by considering, among others, (1) the direct risk to publichealth; (2) the characteristics of the receiving water bodies (lakes with low turbulence and mixingdegree are assigned a higher score than rivers); (3) the composition of wastewater (urban areas withhigh traffic loads, highly impervious areas, and commercial or industrial activities are assigned higherscores than residential or rural areas); and (4) estimates of flow contributions (a high score is assignedwhere a high proportion exists between CSO flows and recipient water flow).
No direct risk to public health was assumed in the Lundtofte catchment since bathing activitiesare limited and no significant public health impacts have been reported. The U.S. EPA method allowedthe identification of three main groups of CSO structures (Figure 1b):
1. CSO structures likely to generate a low impact with scores of 30 points or less, located downstreamalong the river and mainly in residential or rural areas with low population density.
2. CSO structures likely to generate medium impact with scores between 30 and 100 points, locatedmidstream and mainly in residential areas with medium population density.
3. CSO structures likely to have a high impact with scores between 100 and 150 points, locatedupstream, near lakes, and mainly in urban areas with higher density.
2.4.3. Utility Costs
The materials and construction costs for all scenarios presented in this study were estimatedaccording to Dirckx et al. [13]. Other costs, such as subscription to rainfall forecast services, operationand maintenance (O & M), and troubleshooting services, were estimated based on the METSAMproject in Copenhagen [22]. A detailed description of the utility costs used in this study is available inAppendix A. The yearly expenses for the different services were included in the total utility costs asestimated net present values (NVP):
NPV (i) =N
∑t=0
Rt
(1 + i)t (3)
where i is the discount rate; N is the project lifetime; and Rt is the yearly cost. A typical discount rateand the utility life of sewer systems of 3% and 50 years were used, respectively.
2.5. Extrapolation of Annual Statistics
The 46 simulated events (Section 2.2) have different magnitudes and return periods. To extrapolateyearly statistics from this set of discrete events, expected annual CSO volumes and EIRPs werecalculated using an approach inspired by a method applied in flood risk management [23].
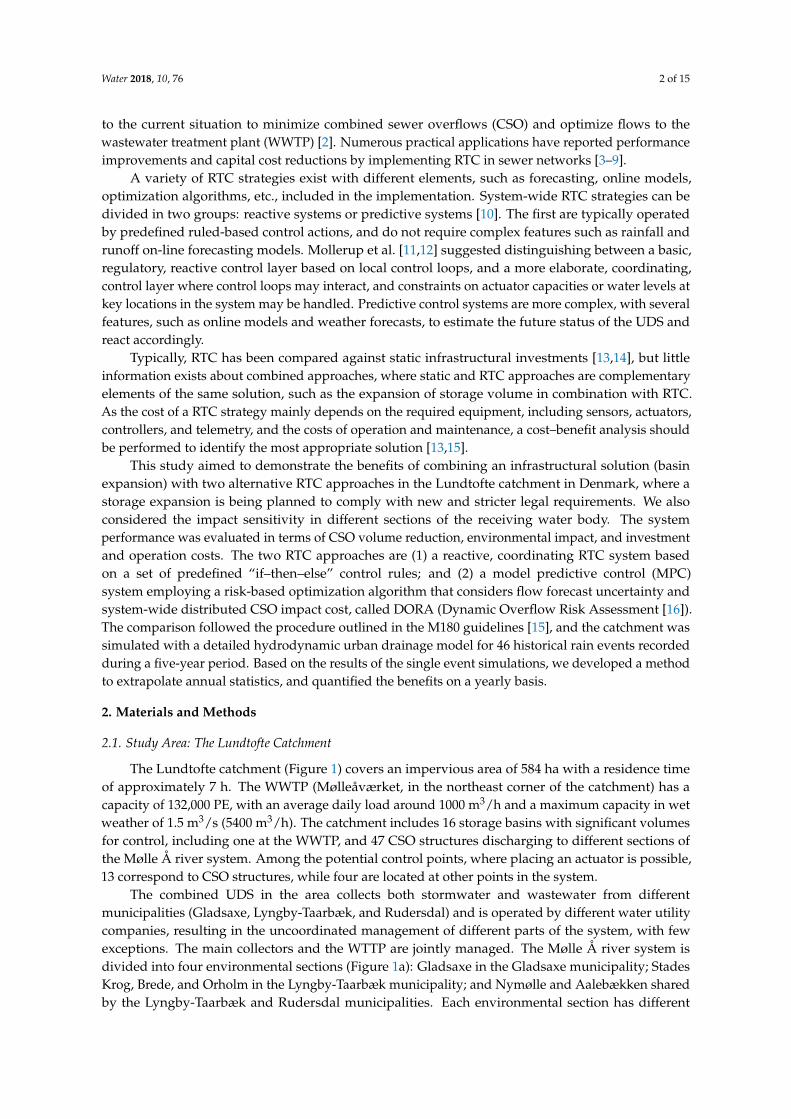
The CSO density curve f CSO (Figure 2) was estimated by multiplying the CSO volume for eachevent with the event’s frequency. These event frequencies were determined based on long-termstatistics, performed on the baseline scenario for a period of 14 years. The frequencies were assignedbased on the total CSO volumes generated per event. The expected relative change in yearly CSOvolume for scenario A (∆CSOA) was then calculated as (Figure 2):
∆CSOA = 1 −∫ t=1 yr
0 fCSO,A (t)dt∫ t=1 yr0 fCSO, baseline(t)dt
(4)
Water 2018, 10, 76 7 of 15
where f CSO,baseline(t) (m3/year) is the CSO density curve for the baseline scenario and f CSO,A(t)(m3/year) is the CSO density curve for scenario A.Water 2018, 10, 76 7 of 15
Figure 2. Illustration of method used to extrapolate annual statistics from discrete events with different return periods. The hatched area corresponds to the difference between two investigated scenarios.
3. Results and Discussion
3.1. Preliminary Results of Control Potential Based on the M180 Guidelines
A crude estimation of the control potential in the catchment was performed by gathering all physical characteristics (basin and pipe volumes, actuators, etc.) and hydraulic data (filling degrees, CSO frequency, etc.) of the studied UDS. According to the point system listed in the M180 guideline, [15] Lyngby-Taarbæk scored 33 points, corresponding to a medium–high potential for RTC.
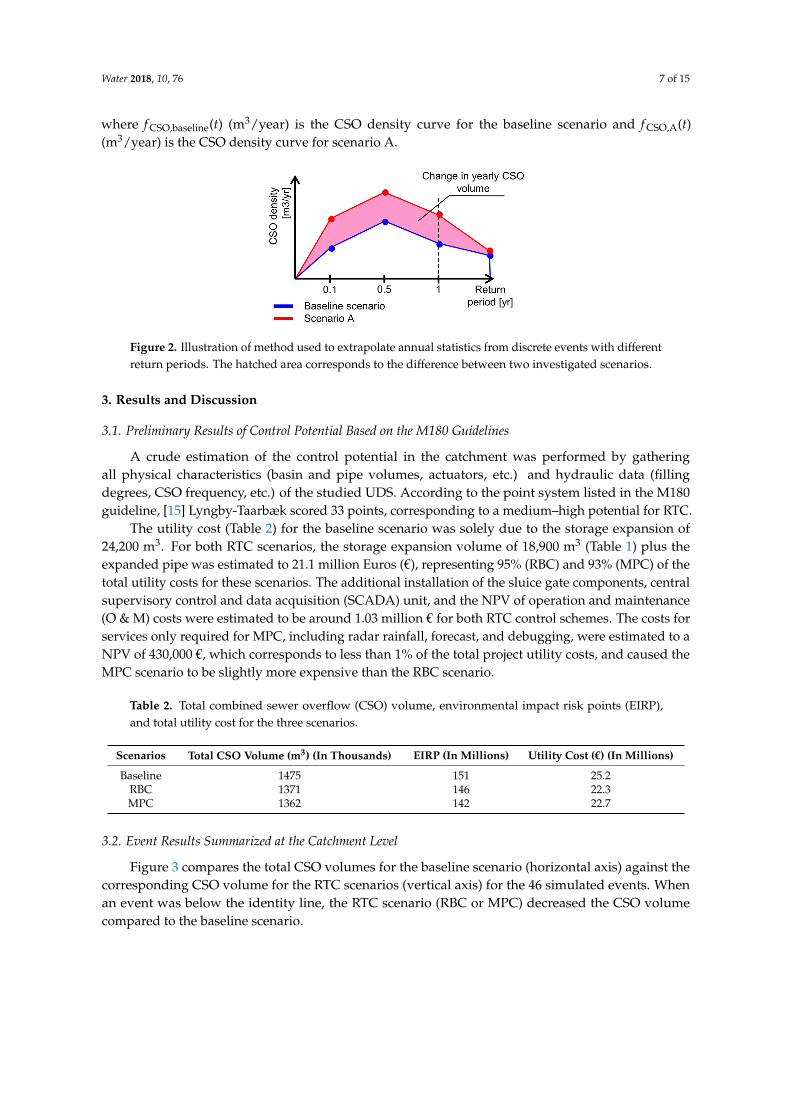
The utility cost (Table 2) for the baseline scenario was solely due to the storage expansion of 24,200 m3. For both RTC scenarios, the storage expansion volume of 18,900 m3 (Table 1) plus the expanded pipe was estimated to 21.1 million Euros (€), representing 95% (RBC) and 93% (MPC) of the total utility costs for these scenarios. The additional installation of the sluice gate components, central supervisory control and data acquisition (SCADA) unit, and the NPV of operation and maintenance (O & M) costs were estimated to be around 1.03 million € for both RTC control schemes. The costs for services only required for MPC, including radar rainfall, forecast, and debugging, were estimated to a NPV of 430,000 €, which corresponds to less than 1% of the total project utility costs, and caused the MPC scenario to be slightly more expensive than the RBC scenario.
Table 2. Total combined sewer overflow (CSO) volume, environmental impact risk points (EIRP), and total utility cost for the three scenarios.
Scenarios Total CSO Volume (m3) (In Thousands)
EIRP (In Millions) Utility Cost (€) (In Millions)
Baseline 1475 151 25.2 RBC 1371 146 22.3 MPC 1362 142 22.7
3.2. Event Results Summarized at the Catchment Level
Figure 3 compares the total CSO volumes for the baseline scenario (horizontal axis) against the corresponding CSO volume for the RTC scenarios (vertical axis) for the 46 simulated events. When an event was below the identity line, the RTC scenario (RBC or MPC) decreased the CSO volume compared to the baseline scenario.
Figure 2. Illustration of method used to extrapolate annual statistics from discrete events with differentreturn periods. The hatched area corresponds to the difference between two investigated scenarios.
3. Results and Discussion
3.1. Preliminary Results of Control Potential Based on the M180 Guidelines
A crude estimation of the control potential in the catchment was performed by gatheringall physical characteristics (basin and pipe volumes, actuators, etc.) and hydraulic data (fillingdegrees, CSO frequency, etc.) of the studied UDS. According to the point system listed in the M180guideline, [15] Lyngby-Taarbæk scored 33 points, corresponding to a medium–high potential for RTC.
The utility cost (Table 2) for the baseline scenario was solely due to the storage expansion of24,200 m3. For both RTC scenarios, the storage expansion volume of 18,900 m3 (Table 1) plus theexpanded pipe was estimated to 21.1 million Euros (€), representing 95% (RBC) and 93% (MPC) of thetotal utility costs for these scenarios. The additional installation of the sluice gate components, centralsupervisory control and data acquisition (SCADA) unit, and the NPV of operation and maintenance(O & M) costs were estimated to be around 1.03 million € for both RTC control schemes. The costs forservices only required for MPC, including radar rainfall, forecast, and debugging, were estimated to aNPV of 430,000 €, which corresponds to less than 1% of the total project utility costs, and caused theMPC scenario to be slightly more expensive than the RBC scenario.
Table 2. Total combined sewer overflow (CSO) volume, environmental impact risk points (EIRP),and total utility cost for the three scenarios.
Scenarios Total CSO Volume (m3) (In Thousands) EIRP (In Millions) Utility Cost (€) (In Millions)
Baseline 1475 151 25.2RBC 1371 146 22.3MPC 1362 142 22.7
3.2. Event Results Summarized at the Catchment Level
Figure 3 compares the total CSO volumes for the baseline scenario (horizontal axis) against thecorresponding CSO volume for the RTC scenarios (vertical axis) for the 46 simulated events. Whenan event was below the identity line, the RTC scenario (RBC or MPC) decreased the CSO volumecompared to the baseline scenario.
Water 2018, 10, 76 8 of 15Water 2018, 10, 76 8 of 15
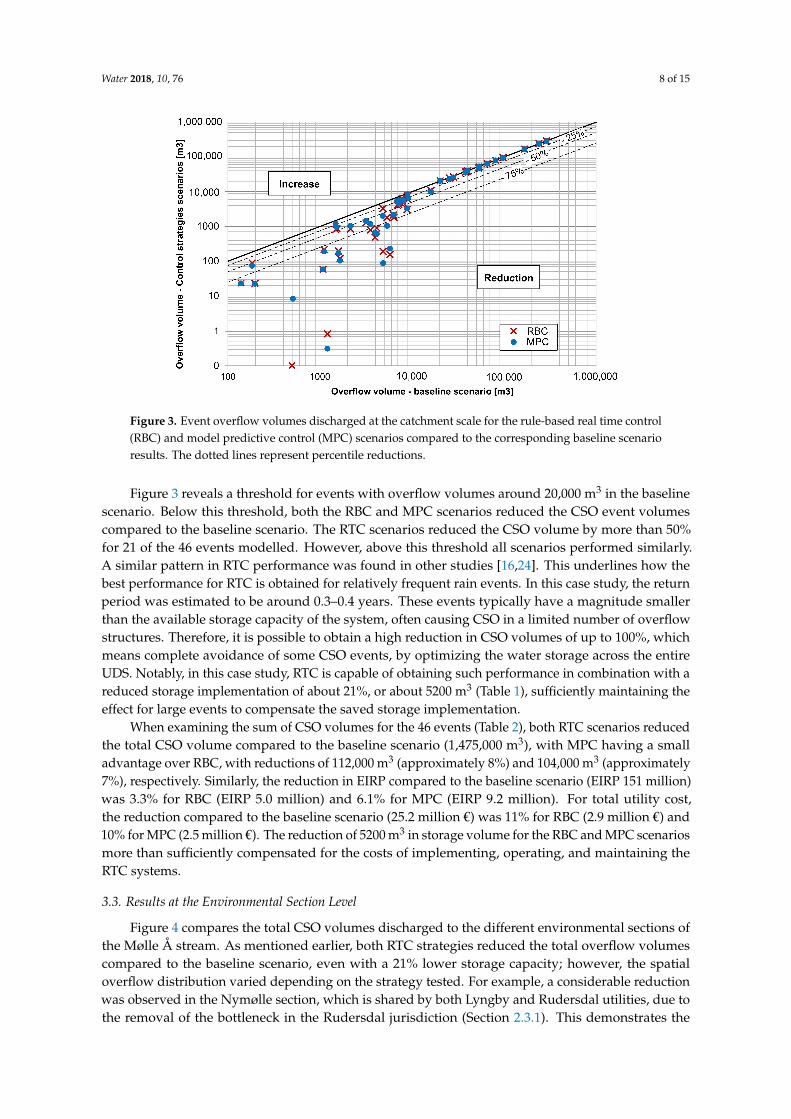
Figure 3. Event overflow volumes discharged at the catchment scale for the rule-based real time control (RBC) and model predictive control (MPC) scenarios compared to the corresponding baseline scenario results. The dotted lines represent percentile reductions.
Figure 3 reveals a threshold for events with overflow volumes around 20,000 m3 in the baseline scenario. Below this threshold, both the RBC and MPC scenarios reduced the CSO event volumes compared to the baseline scenario. The RTC scenarios reduced the CSO volume by more than 50% for 21 of the 46 events modelled. However, above this threshold all scenarios performed similarly. A similar pattern in RTC performance was found in other studies [16,24]. This underlines how the best performance for RTC is obtained for relatively frequent rain events. In this case study, the return period was estimated to be around 0.3–0.4 years. These events typically have a magnitude smaller than the available storage capacity of the system, often causing CSO in a limited number of overflow structures. Therefore, it is possible to obtain a high reduction in CSO volumes of up to 100%, which means complete avoidance of some CSO events, by optimizing the water storage across the entire UDS. Notably, in this case study, RTC is capable of obtaining such performance in combination with a reduced storage implementation of about 21%, or about 5200 m3 (Table 1), sufficiently maintaining the effect for large events to compensate the saved storage implementation.
When examining the sum of CSO volumes for the 46 events (Table 2), both RTC scenarios reduced the total CSO volume compared to the baseline scenario (1,475,000 m3), with MPC having a small advantage over RBC, with reductions of 112,000 m3 (approximately 8%) and 104,000 m3 (approximately 7%), respectively. Similarly, the reduction in EIRP compared to the baseline scenario (EIRP 151 million) was 3.3% for RBC (EIRP 5.0 million) and 6.1% for MPC (EIRP 9.2 million). For total utility cost, the reduction compared to the baseline scenario (25.2 million €) was 11% for RBC (2.9 million €) and 10% for MPC (2.5 million €). The reduction of 5200 m3 in storage volume for the RBC and MPC scenarios more than sufficiently compensated for the costs of implementing, operating, and maintaining the RTC systems.
3.3. Results at the Environmental Section Level
Figure 4 compares the total CSO volumes discharged to the different environmental sections of the Mølle Å stream. As mentioned earlier, both RTC strategies reduced the total overflow volumes compared to the baseline scenario, even with a 21% lower storage capacity; however, the spatial overflow distribution varied depending on the strategy tested. For example, a considerable reduction was observed in the Nymølle section, which is shared by both Lyngby and Rudersdal utilities, due to the removal of the bottleneck in the Rudersdal jurisdiction (Section 2.3.1). This demonstrates the benefit of integrated management beyond the jurisdiction of the different water utilities. The Nymølle environmental section has low sensitivity, whereas Aalebækken, Stades Krog,
Figure 3. Event overflow volumes discharged at the catchment scale for the rule-based real time control(RBC) and model predictive control (MPC) scenarios compared to the corresponding baseline scenarioresults. The dotted lines represent percentile reductions.
Figure 3 reveals a threshold for events with overflow volumes around 20,000 m3 in the baselinescenario. Below this threshold, both the RBC and MPC scenarios reduced the CSO event volumescompared to the baseline scenario. The RTC scenarios reduced the CSO volume by more than 50%for 21 of the 46 events modelled. However, above this threshold all scenarios performed similarly.A similar pattern in RTC performance was found in other studies [16,24]. This underlines how thebest performance for RTC is obtained for relatively frequent rain events. In this case study, the returnperiod was estimated to be around 0.3–0.4 years. These events typically have a magnitude smallerthan the available storage capacity of the system, often causing CSO in a limited number of overflowstructures. Therefore, it is possible to obtain a high reduction in CSO volumes of up to 100%, whichmeans complete avoidance of some CSO events, by optimizing the water storage across the entireUDS. Notably, in this case study, RTC is capable of obtaining such performance in combination with areduced storage implementation of about 21%, or about 5200 m3 (Table 1), sufficiently maintaining theeffect for large events to compensate the saved storage implementation.
When examining the sum of CSO volumes for the 46 events (Table 2), both RTC scenarios reducedthe total CSO volume compared to the baseline scenario (1,475,000 m3), with MPC having a smalladvantage over RBC, with reductions of 112,000 m3 (approximately 8%) and 104,000 m3 (approximately7%), respectively. Similarly, the reduction in EIRP compared to the baseline scenario (EIRP 151 million)was 3.3% for RBC (EIRP 5.0 million) and 6.1% for MPC (EIRP 9.2 million). For total utility cost,the reduction compared to the baseline scenario (25.2 million €) was 11% for RBC (2.9 million €) and10% for MPC (2.5 million €). The reduction of 5200 m3 in storage volume for the RBC and MPC scenariosmore than sufficiently compensated for the costs of implementing, operating, and maintaining theRTC systems.
3.3. Results at the Environmental Section Level
Figure 4 compares the total CSO volumes discharged to the different environmental sections ofthe Mølle Å stream. As mentioned earlier, both RTC strategies reduced the total overflow volumescompared to the baseline scenario, even with a 21% lower storage capacity; however, the spatialoverflow distribution varied depending on the strategy tested. For example, a considerable reductionwas observed in the Nymølle section, which is shared by both Lyngby and Rudersdal utilities, due tothe removal of the bottleneck in the Rudersdal jurisdiction (Section 2.3.1). This demonstrates the

Water 2018, 10, 76 9 of 15
benefit of integrated management beyond the jurisdiction of the different water utilities. The Nymølleenvironmental section has low sensitivity, whereas Aalebækken, Stades Krog, and Gladsaxe havehigh to medium sensitivities, explaining why the MPC scenario yields higher total CSO volumes inNymølle than the RBC scenario.
Water 2018, 10, 76 9 of 15
and Gladsaxe have high to medium sensitivities, explaining why the MPC scenario yields higher total CSO volumes in Nymølle than the RBC scenario.
Figure 4. Distribution of the total overflow volume per environmental section for the three scenarios.
Figure 5 compares the total CSO volumes discharged to recipients with high, medium, and low sensitivities. For areas with a high impact cost or more sensitive areas (Figure 1b), MPC reduced the total CSO volume by 33,000 m3 (4.3%), whereas RBC only reduced the volume by 10,000 m3 (1.3%) compared to the baseline scenario (Figure 5a). For the lowest impact cost areas, RBC resulted in higher CSO reductions with 100,000 m3 (21%), whereas MPC reduced CSO by only 67,000 m3 (14%). Again, these results are due to the different objective functions applied by RBC and MPC. Both strategies tend to move the overflows from the most sensitive to the least sensitive areas, but the risk-based approach used in the MPC strategy has greater flexibility in defining the optimal set-points, and thus obtains lower environmental impacts (Table 3).
Figure 5. Overflow volumes for the three scenarios depending on the sensitivity of the recipient. The white rectangle above each column shows the total overflow volume for all sensitivity classes. (a) All 46 simulated events; (b) Events only included with less than 20,000 m3 of CSO in the baseline scenario.
Table 3. Simulated environmental impact risk point (EIRP) values expressed as millions for different environmental impact areas and their relative reduction.
Scenarios Low Impact Medium Impact High Impact Total Baseline 13.7 23.2 114 151
RBC 9.62 (−30%) 23.8 (+2.8%) 113 (−1.3%) 146 (−3.3%) MPC 10.7 (−22%) 21.9 (−5.5%) 110 (−4.3%) 142 (−6.1%)
Figure 4. Distribution of the total overflow volume per environmental section for the three scenarios.
Figure 5 compares the total CSO volumes discharged to recipients with high, medium, and lowsensitivities. For areas with a high impact cost or more sensitive areas (Figure 1b), MPC reduced thetotal CSO volume by 33,000 m3 (4.3%), whereas RBC only reduced the volume by 10,000 m3 (1.3%)compared to the baseline scenario (Figure 5a). For the lowest impact cost areas, RBC resulted in higherCSO reductions with 100,000 m3 (21%), whereas MPC reduced CSO by only 67,000 m3 (14%). Again,these results are due to the different objective functions applied by RBC and MPC. Both strategies tendto move the overflows from the most sensitive to the least sensitive areas, but the risk-based approachused in the MPC strategy has greater flexibility in defining the optimal set-points, and thus obtainslower environmental impacts (Table 3).
Water 2018, 10, 76 9 of 15
and Gladsaxe have high to medium sensitivities, explaining why the MPC scenario yields higher total CSO volumes in Nymølle than the RBC scenario.
Figure 4. Distribution of the total overflow volume per environmental section for the three scenarios.
Figure 5 compares the total CSO volumes discharged to recipients with high, medium, and low sensitivities. For areas with a high impact cost or more sensitive areas (Figure 1b), MPC reduced the total CSO volume by 33,000 m3 (4.3%), whereas RBC only reduced the volume by 10,000 m3 (1.3%) compared to the baseline scenario (Figure 5a). For the lowest impact cost areas, RBC resulted in higher CSO reductions with 100,000 m3 (21%), whereas MPC reduced CSO by only 67,000 m3 (14%). Again, these results are due to the different objective functions applied by RBC and MPC. Both strategies tend to move the overflows from the most sensitive to the least sensitive areas, but the risk-based approach used in the MPC strategy has greater flexibility in defining the optimal set-points, and thus obtains lower environmental impacts (Table 3).
Figure 5. Overflow volumes for the three scenarios depending on the sensitivity of the recipient. The white rectangle above each column shows the total overflow volume for all sensitivity classes. (a) All 46 simulated events; (b) Events only included with less than 20,000 m3 of CSO in the baseline scenario.
Table 3. Simulated environmental impact risk point (EIRP) values expressed as millions for different environmental impact areas and their relative reduction.
Scenarios Low Impact Medium Impact High Impact Total Baseline 13.7 23.2 114 151
RBC 9.62 (−30%) 23.8 (+2.8%) 113 (−1.3%) 146 (−3.3%) MPC 10.7 (−22%) 21.9 (−5.5%) 110 (−4.3%) 142 (−6.1%)
Figure 5. Overflow volumes for the three scenarios depending on the sensitivity of the recipient.The white rectangle above each column shows the total overflow volume for all sensitivity classes.(a) All 46 simulated events; (b) Events only included with less than 20,000 m3 of CSO in thebaseline scenario.
Water 2018, 10, 76 10 of 15
Table 3. Simulated environmental impact risk point (EIRP) values expressed as millions for differentenvironmental impact areas and their relative reduction.
Scenarios Low Impact Medium Impact High Impact Total
Baseline 13.7 23.2 114 151RBC 9.62 (−30%) 23.8 (+2.8%) 113 (−1.3%) 146 (−3.3%)MPC 10.7 (−22%) 21.9 (−5.5%) 110 (−4.3%) 142 (−6.1%)
Looking at the events that caused less than 20,000 m3 CSO in the baseline scenario, which werethe events where control fully expressed its potential for using the available storage volume, the RBCscenario obtained slightly higher overall CSO volume reductions compared to the MPC scenario.However, when looking at the most sensitive recipients in the high impact category, the MPC scenarioobtained better results (Figure 5b). MPC reduced the CSOs in the areas with high sensitivity by 36%,from 19,000 to 12,000 m3, whereas the RBC strategy increased the overflows by 10%, from 19,000to 21,000 m3. This is explained by the objective function used in DORA, where different dischargelocations are prioritized according to the value of Ri. In some cases, a lower environmental impactcould be achieved by overloading less sensitive points to protect more sensitive sections.
3.4. Estimated Yearly Performance
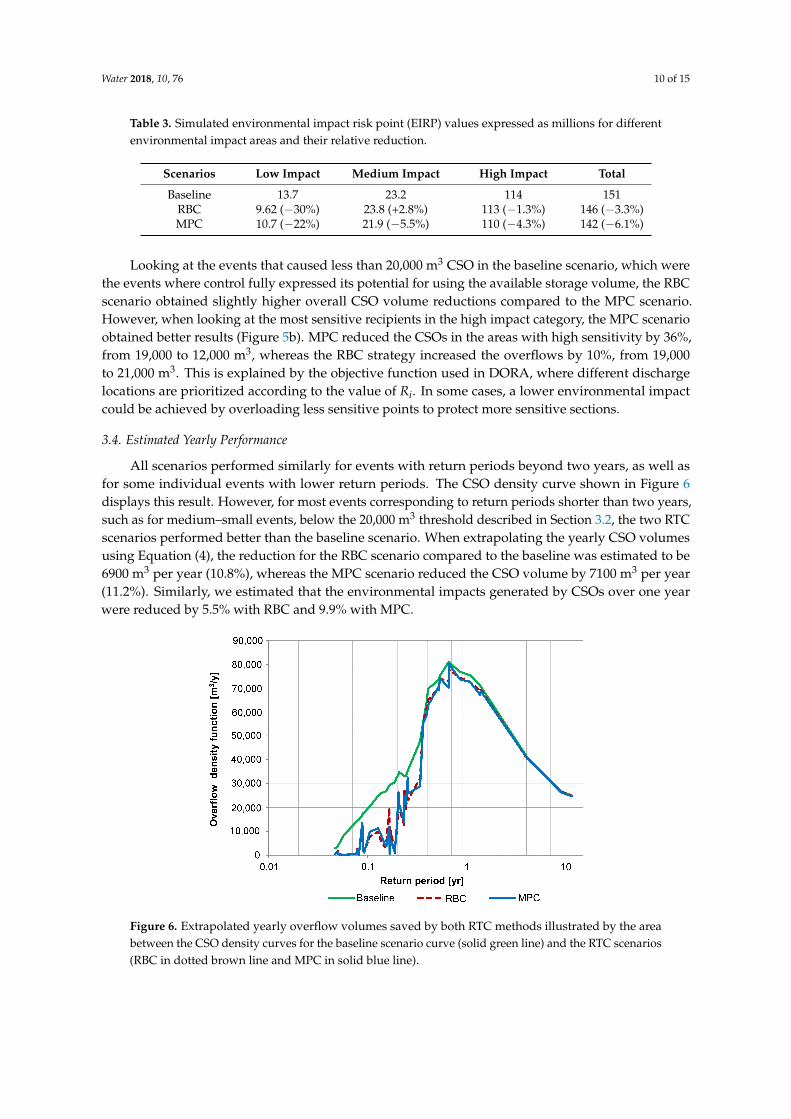
All scenarios performed similarly for events with return periods beyond two years, as well asfor some individual events with lower return periods. The CSO density curve shown in Figure 6displays this result. However, for most events corresponding to return periods shorter than two years,such as for medium–small events, below the 20,000 m3 threshold described in Section 3.2, the two RTCscenarios performed better than the baseline scenario. When extrapolating the yearly CSO volumesusing Equation (4), the reduction for the RBC scenario compared to the baseline was estimated to be6900 m3 per year (10.8%), whereas the MPC scenario reduced the CSO volume by 7100 m3 per year(11.2%). Similarly, we estimated that the environmental impacts generated by CSOs over one yearwere reduced by 5.5% with RBC and 9.9% with MPC.
Water 2018, 10, 76 10 of 15
Looking at the events that caused less than 20,000 m3 CSO in the baseline scenario, which were the events where control fully expressed its potential for using the available storage volume, the RBC scenario obtained slightly higher overall CSO volume reductions compared to the MPC scenario. However, when looking at the most sensitive recipients in the high impact category, the MPC scenario obtained better results (Figure 5b). MPC reduced the CSOs in the areas with high sensitivity by 36%, from 19,000 to 12,000 m3, whereas the RBC strategy increased the overflows by 10%, from 19,000 to 21,000 m3. This is explained by the objective function used in DORA, where different discharge locations are prioritized according to the value of Ri. In some cases, a lower environmental impact could be achieved by overloading less sensitive points to protect more sensitive sections.
3.4. Estimated Yearly Performance
All scenarios performed similarly for events with return periods beyond two years, as well as for some individual events with lower return periods. The CSO density curve shown in Figure 6 displays this result. However, for most events corresponding to return periods shorter than two years, such as for medium–small events, below the 20,000 m3 threshold described in Section 3.2, the two RTC scenarios performed better than the baseline scenario. When extrapolating the yearly CSO volumes using Equation (4), the reduction for the RBC scenario compared to the baseline was estimated to be 6900 m3 per year (10.8%), whereas the MPC scenario reduced the CSO volume by 7100 m3 per year (11.2%). Similarly, we estimated that the environmental impacts generated by CSOs over one year were reduced by 5.5% with RBC and 9.9% with MPC.
Figure 6. Extrapolated yearly overflow volumes saved by both RTC methods illustrated by the area between the CSO density curves for the baseline scenario curve (solid green line) and the RTC scenarios (RBC in dotted brown line and MPC in solid blue line).
4. Discussion
Both the investigated RTC strategies enable important CSO reductions depending on the magnitude of the overflow, with greater relative improvements obtained for events with magnitudes comparable to or lower than the available storage capacity. Conversely, no improvements were observed for events exceeding the available storage capacity, implying that for extreme events, such as those that cause flooding, more drastic solutions are required to create the necessary storage capacity. These solutions could involve carefully using public spaces such as parks or parking lots to store water. This is the classic behavior of a RTC system, which optimizes the usage of the available storage volume in the UDS, but cannot avoid CSO when this capacity is exceeded, which was reflected in our findings.
Figure 6. Extrapolated yearly overflow volumes saved by both RTC methods illustrated by the areabetween the CSO density curves for the baseline scenario curve (solid green line) and the RTC scenarios(RBC in dotted brown line and MPC in solid blue line).

Water 2018, 10, 76 11 of 15
4. Discussion
Both the investigated RTC strategies enable important CSO reductions depending on themagnitude of the overflow, with greater relative improvements obtained for events with magnitudescomparable to or lower than the available storage capacity. Conversely, no improvements wereobserved for events exceeding the available storage capacity, implying that for extreme events, such asthose that cause flooding, more drastic solutions are required to create the necessary storage capacity.These solutions could involve carefully using public spaces such as parks or parking lots to store water.This is the classic behavior of a RTC system, which optimizes the usage of the available storage volumein the UDS, but cannot avoid CSO when this capacity is exceeded, which was reflected in our findings.
The control methods tested in this study involve different levels of complexity. The complexrisk-based optimization MPC approach, including weather forecasts and uncertainty (MPC scenario),generated better overall results for the overflow distribution. This was expected, since the optimizationroutine has a global, system-wide overview of the current and future status with a two-hour forecast ofthe sewer network, allowing a continuous redistribution of water volumes across the system to reducethe environmental impacts. In this specific case study, the simple “if–then–else” control rules appliedin the coordinating control approach (RBC scenario) was simpler and faster to implement than MPC,showing reasonably good results considering the total overflow volume. However, rule-based controlstruggles to adapt to other objectives than CSO volume reduction, such as water-quality based controlstrategies [24], where the pollution at each controlled point and the sensitivity of the receiving bodieschange in time and cannot be described by “if–then–else” rules. Similarly, the risk factor Ri (expressedin monetary units) can be linked to actual pollution levels at the discharge point if a CSO price isdefined. For example, tariffs are defined for pollutant loads discharged by WWTPs in Denmark.
The full potential of the DORA algorithm has not yet been fully explored. As shown byLöwe et al. [25], a dynamic estimation of the forecast uncertainty can lead to significant improvementsin the MPC performance compared to the use of the constant uncertainty description adopted inthis study.
This simulation study only provides an estimate of the RTC potential in the Lundtofte catchment.The MU model used is a simplification of the real system, and dynamics are often more complexin reality. Also, the simulations were run offline, considering perfect weather forecasts. For onlineapplications, real-time radar data and forecasts would be used instead of data from the four raingauges used here, leading to a potentially better description of the spatial rainfall distribution butincreasing the input and forecast uncertainty. The actual performance of the MPC strategy may thus belower than in this study, even though uncertainty was considered and integrated into the optimizationalgorithm. Further investigations are therefore needed to fully document the expected effects of theconsidered MPC strategy.
5. Conclusions
This study showed how the combination of real time control (RTC) of urban drainage systems(UDS) with investment in static solutions can potentially reduce the need for infrastructure expansioninvestments while maintaining or improving the level of service. Based on simulations with a detailedhydrodynamic model, two RTC scenarios were investigated using spatially distributed rainfall as theinput: a coordinating rule-based control strategy aimed at reducing CSO discharge volumes whileavoiding flooding (RBC), and a model predictive control strategy (MPC) that employs a risk-basedoptimization algorithm considering flow forecast uncertainty two hours in advance and system-widedistributed CSO impact cost (utility). We furthermore developed a method to extrapolate annualstatistics based on limited historical data (46 events from a five year period) and quantified the benefitsin terms of CSO volume reduction, environmental impact reduction, and total utility cost, of includingthe two RTC strategies when planning the expansion and improvement of existing drainage networks.
Water 2018, 10, 76 12 of 15
The Lundtofte urban drainage system (UDS) offers an interesting opportunity to implement RTC,as both the investigated RTC strategies resulted in improvements compared to the baseline scenariobased only on static infrastructure expansion. Several specific conclusions were obtained:
• Both RTC strategies reduced the storage volume expansion otherwise needed to fulfill theenvironmental regulations for CSO discharge by 5220 m3 (21%).
• Both RTC strategies yielded reductions in CSO volumes, environmental impact risk points (EIRP),and total utility cost for the catchment as a whole, and for the individual environmental sections.
• RTC reduced the overflow volumes for frequently occurring events of magnitudes up to the totalstorage volume available in the system, which in this system corresponds to estimated eventreturn periods lower than 0.4 years. For medium to large events, with a return period greaterthan about 1–2 years, RTC did not change the performance of the system.
• RTC optimally exploited the storage capacity across all involved municipalities, resulting in lowerCSO volumes and impacts on sensitive receiving waters.
Comparing the control strategies, the MPC strategy had more benefits in terms of CSO impactsto sensitive recipients than the RBC strategy. Also, yearly statistics for the MPC strategy suggested areduction in CSO volume of 11.2% and 9.9% in EIRP. Despite its simplicity, the RBC strategy achievedimportant reductions of 10.2% in CSO volume and 5.5% in EIRP on a yearly basis. Different RTCapproaches can be implemented and significantly contribute to the improvement in the performance ofUDS in a practical situation. Different strategies could complement each other in a robust hierarchicalsystem. The simple RBC strategy can be used as a fallback strategy when problems occur in thecomplex MPC strategy, for example due to missing forecast data. Therefore, we recommend testingdifferent control strategies to find the best suitable solutions for each specific case or catchment.
Acknowledgments: The results presented in this study were obtained under the framework of Luca Vezzaro’sindustrial postdoc project “MOPSUS—Model predictive control of urban drainage systems under uncertainty”,which was financed by the Innovation Fund Denmark. The DORA control strategy was developed in the SWIproject (Storm- and Wastewater Informatics), a strategic Danish Research Project financed by the Danish Agency forScience Technology and Innovation under the Programme Commission on Sustainable Energy and Environment.The precipitation data were obtained from the Danish Meteorological Institute (DMI) and the Water PollutionCommittee of The Society of Danish Engineers (SVK).
Author Contributions: Elbys Meneses and Marion Gaussens performed all the model simulation and the resultsanalysis as part of their MSc thesis project at DTU Environment. Carsten Jakobsen and Morten Grum helpedbuilding the model and analyzing the results. Peter Steen Mikkelsen and Luca Vezzaro contributed to planningthe project, to analyzing the results, and to commenting on and extending the manuscript, which was mainlywritten by Elbys Meneses.
Conflicts of Interest: The authors declare no conflict of interest. The funding bodies had no role in the design ofthe study; in the collection, analyses, or interpretation of data; in the writing of the manuscript; and in the decisionto publish the results.
Appendix A
The central unit of supervision control and data acquisition (SCADA unit) is an element toensure the coordination, data gathering, and processing for RTC operation. This SCADA unit costsapproximately 30,000 € per unit [13]. At the location of the sluice gates, four types of elements managethe in-situ coordination. These elements include: movable gates which are the physical objects thatcontrol the flows in the sewer; hydraulic engines that provide mobility to the gates; programmablelogic controllers (PLCs); and power supplies, which in many cases are not readily available at the site.The total cost for a remote RTC set-up was estimated to be 35,000 € at each location where an actuatorwas placed [13]. Detailed costs can be found in Table A1. The costs were estimated for sluice gates,since most of the actuators used for the RTC scenarios were modelled or described as sludge gates.
The basin and pipe expansions were estimated at 802 €/m3 and 250 €/m, respectively [13]. All thescenarios included some sort of basin expansion; therefore, this price was applied depending on theexpansion volume. A pipe expansion cost was applied only to the MPC and RTC scenarios (250 m).
Water 2018, 10, 76 13 of 15
Preliminary RTC analysis in the sewer network indicated that by increasing the pipe capacity at thislocation, major CSO reductions could be achieved with dynamic control. The removal of this bottleneckenabled the discharge of higher amounts of combined sewage to the treatment plant when the systemwas not under high loading.
O & M expenses are difficult to estimate and vary widely depending on the location affecting thedistance travelled by the technical staff involved, size, and depth of the actuator. Moreover, O & Mcosts may be significantly reduced if a set contract with a service contractor is in place. The estimatedO & M costs were 600–1200 € per year based on costs in the nearby city of Copenhagen, includingtwo to three visits per year for lubrication of the equipment and a general check-up. Other extra costsconsidered for the MPC strategy were the access to radar data (raw rain images), modelled forecastdata, and troubleshooting and debugging services. From experiences in on-going RTC projects in thecity of Copenhagen, the prices of the aforementioned services were set to 5400 €/year for each service.
Table A1. Unit utility cost descriptions for all scenarios tested. A cross (X) means that the item isincluded in the given scenario.
Item Unit Cost Baseline RBC MPC
Storage €/m3 802 X X XPipe €/m 250 X X
SCADA € 30,000 X XSluice gate € 5000 X X
Hydraulic Engine € 10,000 X XPLC * € 15,000 X XEI ** € 5000 X X
O & M *** €/year/unit 600–1200 X XRadar rain data €/year 5400 X
Forecast rain data €/year 5400 XDebug service €/year 5400 X
* PLC: Programmable logical controller; ** EI: Electrical installation; *** O & M: Operation and maintenance.
Appendix B
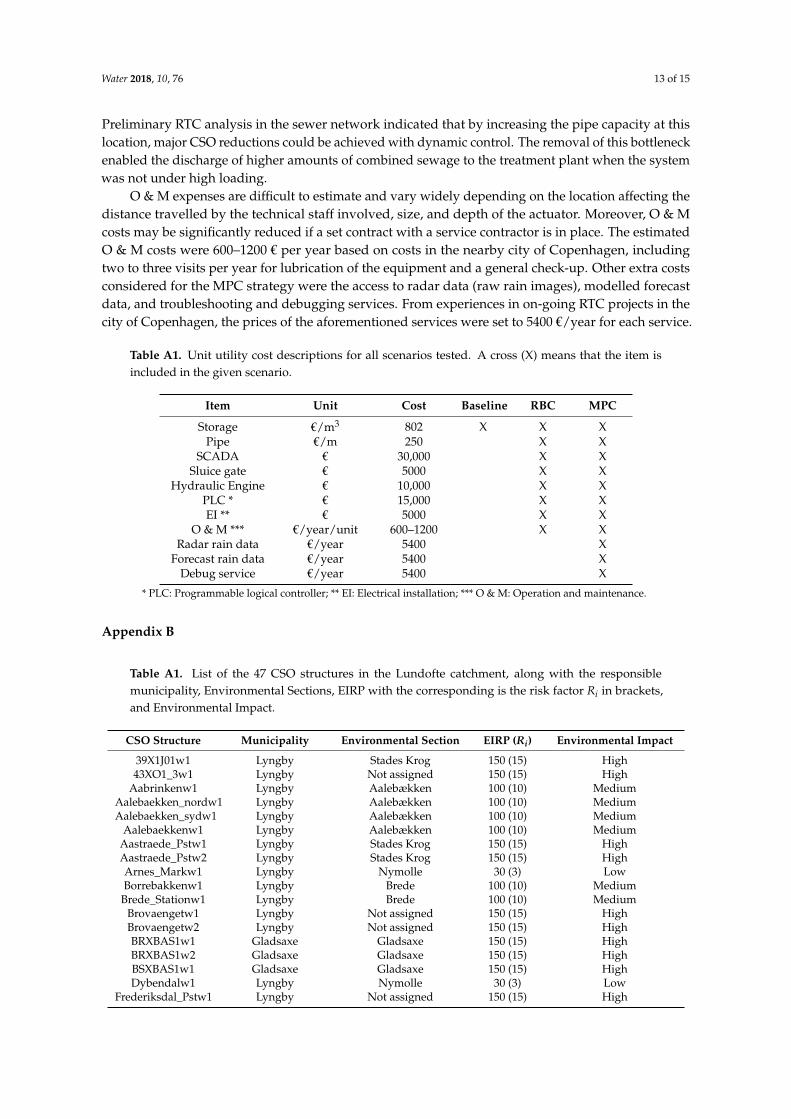
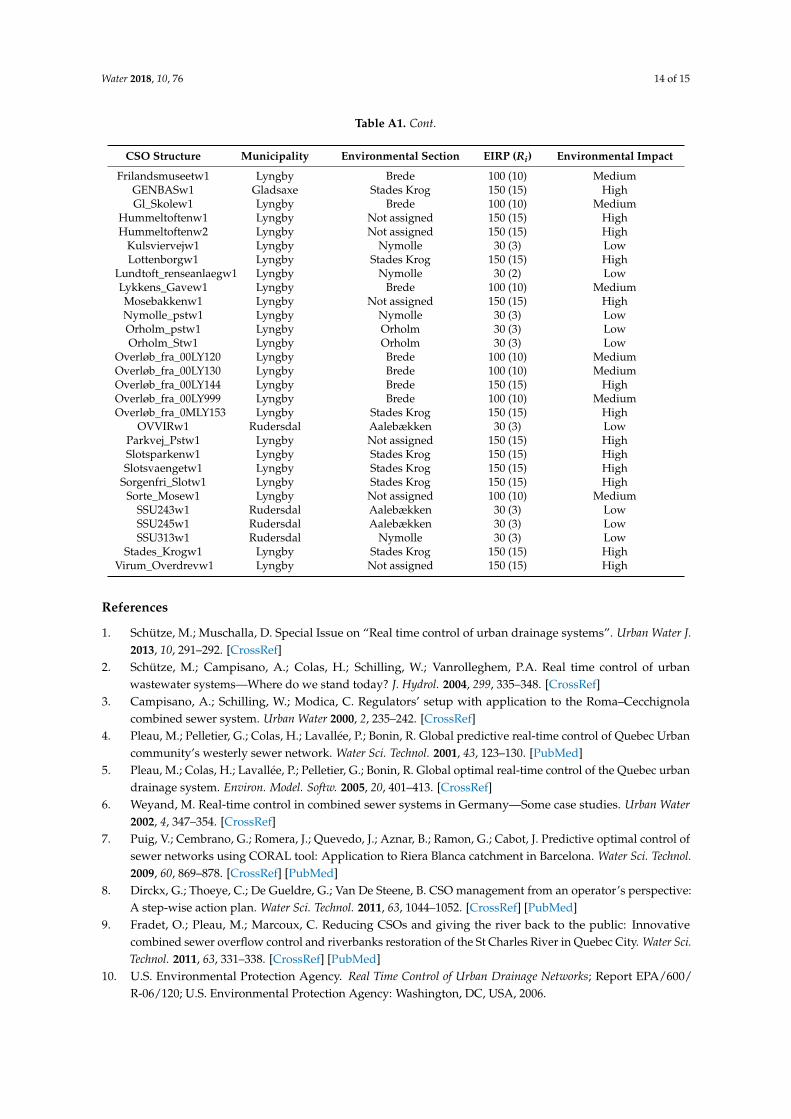
Table A1. List of the 47 CSO structures in the Lundofte catchment, along with the responsiblemunicipality, Environmental Sections, EIRP with the corresponding is the risk factor Ri in brackets,and Environmental Impact.
CSO Structure Municipality Environmental Section EIRP (Ri) Environmental Impact
39X1J01w1 Lyngby Stades Krog 150 (15) High43XO1_3w1 Lyngby Not assigned 150 (15) High
Aabrinkenw1 Lyngby Aalebækken 100 (10) MediumAalebaekken_nordw1 Lyngby Aalebækken 100 (10) MediumAalebaekken_sydw1 Lyngby Aalebækken 100 (10) Medium
Aalebaekkenw1 Lyngby Aalebækken 100 (10) MediumAastraede_Pstw1 Lyngby Stades Krog 150 (15) HighAastraede_Pstw2 Lyngby Stades Krog 150 (15) HighArnes_Markw1 Lyngby Nymolle 30 (3) LowBorrebakkenw1 Lyngby Brede 100 (10) Medium
Brede_Stationw1 Lyngby Brede 100 (10) MediumBrovaengetw1 Lyngby Not assigned 150 (15) HighBrovaengetw2 Lyngby Not assigned 150 (15) HighBRXBAS1w1 Gladsaxe Gladsaxe 150 (15) HighBRXBAS1w2 Gladsaxe Gladsaxe 150 (15) HighBSXBAS1w1 Gladsaxe Gladsaxe 150 (15) HighDybendalw1 Lyngby Nymolle 30 (3) Low
Frederiksdal_Pstw1 Lyngby Not assigned 150 (15) High
Water 2018, 10, 76 14 of 15
Table A1. Cont.
CSO Structure Municipality Environmental Section EIRP (Ri) Environmental Impact
Frilandsmuseetw1 Lyngby Brede 100 (10) MediumGENBASw1 Gladsaxe Stades Krog 150 (15) HighGl_Skolew1 Lyngby Brede 100 (10) Medium
Hummeltoftenw1 Lyngby Not assigned 150 (15) HighHummeltoftenw2 Lyngby Not assigned 150 (15) High
Kulsviervejw1 Lyngby Nymolle 30 (3) LowLottenborgw1 Lyngby Stades Krog 150 (15) High
Lundtoft_renseanlaegw1 Lyngby Nymolle 30 (2) LowLykkens_Gavew1 Lyngby Brede 100 (10) MediumMosebakkenw1 Lyngby Not assigned 150 (15) HighNymolle_pstw1 Lyngby Nymolle 30 (3) LowOrholm_pstw1 Lyngby Orholm 30 (3) LowOrholm_Stw1 Lyngby Orholm 30 (3) Low
Overløb_fra_00LY120 Lyngby Brede 100 (10) MediumOverløb_fra_00LY130 Lyngby Brede 100 (10) MediumOverløb_fra_00LY144 Lyngby Brede 150 (15) HighOverløb_fra_00LY999 Lyngby Brede 100 (10) MediumOverløb_fra_0MLY153 Lyngby Stades Krog 150 (15) High
OVVIRw1 Rudersdal Aalebækken 30 (3) LowParkvej_Pstw1 Lyngby Not assigned 150 (15) HighSlotsparkenw1 Lyngby Stades Krog 150 (15) HighSlotsvaengetw1 Lyngby Stades Krog 150 (15) High
Sorgenfri_Slotw1 Lyngby Stades Krog 150 (15) HighSorte_Mosew1 Lyngby Not assigned 100 (10) Medium
SSU243w1 Rudersdal Aalebækken 30 (3) LowSSU245w1 Rudersdal Aalebækken 30 (3) LowSSU313w1 Rudersdal Nymolle 30 (3) Low
Stades_Krogw1 Lyngby Stades Krog 150 (15) HighVirum_Overdrevw1 Lyngby Not assigned 150 (15) High
References
1. Schütze, M.; Muschalla, D. Special Issue on “Real time control of urban drainage systems”. Urban Water J.2013, 10, 291–292. [CrossRef]
2. Schütze, M.; Campisano, A.; Colas, H.; Schilling, W.; Vanrolleghem, P.A. Real time control of urbanwastewater systems—Where do we stand today? J. Hydrol. 2004, 299, 335–348. [CrossRef]
3. Campisano, A.; Schilling, W.; Modica, C. Regulators’ setup with application to the Roma–Cecchignolacombined sewer system. Urban Water 2000, 2, 235–242. [CrossRef]
4. Pleau, M.; Pelletier, G.; Colas, H.; Lavallée, P.; Bonin, R. Global predictive real-time control of Quebec Urbancommunity’s westerly sewer network. Water Sci. Technol. 2001, 43, 123–130. [PubMed]
5. Pleau, M.; Colas, H.; Lavallée, P.; Pelletier, G.; Bonin, R. Global optimal real-time control of the Quebec urbandrainage system. Environ. Model. Softw. 2005, 20, 401–413. [CrossRef]
6. Weyand, M. Real-time control in combined sewer systems in Germany—Some case studies. Urban Water2002, 4, 347–354. [CrossRef]
7. Puig, V.; Cembrano, G.; Romera, J.; Quevedo, J.; Aznar, B.; Ramon, G.; Cabot, J. Predictive optimal control ofsewer networks using CORAL tool: Application to Riera Blanca catchment in Barcelona. Water Sci. Technol.2009, 60, 869–878. [CrossRef] [PubMed]
8. Dirckx, G.; Thoeye, C.; De Gueldre, G.; Van De Steene, B. CSO management from an operator’s perspective:A step-wise action plan. Water Sci. Technol. 2011, 63, 1044–1052. [CrossRef] [PubMed]
9. Fradet, O.; Pleau, M.; Marcoux, C. Reducing CSOs and giving the river back to the public: Innovativecombined sewer overflow control and riverbanks restoration of the St Charles River in Quebec City. Water Sci.Technol. 2011, 63, 331–338. [CrossRef] [PubMed]
10. U.S. Environmental Protection Agency. Real Time Control of Urban Drainage Networks; Report EPA/600/R-06/120; U.S. Environmental Protection Agency: Washington, DC, USA, 2006.
Water 2018, 10, 76 15 of 15
11. Mollerup, A.L.; Mikkelsen, P.S.; Thornberg, D.; Sin, G. Regulatory control analysis and design for sewersystems. Environ. Model. Softw. 2015, 66, 153–166. [CrossRef]
12. Mollerup, A.L.; Mikkelsen, P.S.; Thornberg, D.; Sin, G. Controlling sewer systems—A critical review basedon systems in three EU cities. Urban Water J. 2017, 14, 435–442. [CrossRef]
13. Dirckx, G.; Schütze, M.; Kroll, S.; Thoeye, C.; De Gueldre, G.; Van De Steene, B. Cost-efficiency of RTC forCSO impact mitigation. Urban Water J. 2011, 8, 367–377. [CrossRef]
14. Linde, J.J. Combined effects of retrofitting, storm-water infiltration and real time control for combined seweroverflow abatement. In Proceedings of the 4th International Conference on Developments in Urban DrainageModelling (UDM98), London, UK, 21–24 September 1998.
15. Schütze, M.; Erbe, V.; Haas, U.; Scheer, M.; Weyand, M. Sewer system real-time control supported by theM180 guideline document. Urban Water J. 2008, 5, 67–76. [CrossRef]
16. Vezzaro, L.; Grum, M. A generalised Dynamic Overflow Risk Assessment (DORA) for Real Time Control ofurban drainage systems. J. Hydrol. 2014, 515, 292–303. [CrossRef]
17. Jørgensen, H.K.; Rosenørn, S.; Madsen, H.; Mikkelsen, P.S. Quality control of rain data used for urban runoffsystems. Water Sci. Technol. 1998, 37, 113–120.
18. Rauch, W.; Harremoës, P. On the potential of genetic algorithms in urban drainage modeling. Urban Water1999, 1, 79–89. [CrossRef]
19. Rauch, W.; Harremoës, P. Genetic algorithms in real time control applied to minimize transient pollutionfrom urban wastewater systems. Water Res. 1999, 33, 1265–1277. [CrossRef]
20. Engelhard, C.; De Toffol, S.; Rauch, W. Suitability of CSO performance indicators for compliance withambient water quality targets. Urban Water J. 2008, 5, 43–49. [CrossRef]
21. Lau, J.; Butler, D.; Schütze, M. Is combined sewer overflow spill frequency/volume a good indicator ofreceiving water quality impact? Urban Water 2002, 4, 181–189. [CrossRef]
22. Grum, M.; Thornberg, D.; Christensen, M.L.; Shididi, S.A.; Thirsing, C. Full-Scale Real Time ControlDemonstration Project in Copenhagen’s Largest Urban Drainage Catchments. In Proceedings of the 12thInternational Conference on Urban Drainage (12ICUD), Porto Alegre, RS, Brazil, 11–16 September 2011.
23. Zhou, Q.; Mikkelsen, P.S.; Halsnæs, K.; Arnbjerg-Nielsen, K. Framework for economic pluvial flood riskassessment considering climate change effects and adaptation benefits. J. Hydrol. 2012, 414–415, 539–549.[CrossRef]
24. Vezzaro, L.; Lund Christensen, M.; Thirsing, C.; Grum, M.; Mikkelsen, P.S. Water quality-based real timecontrol of integrated urban drainage: A preliminary study from Copenhagen, Denmark. Procedia Eng. 2013,70, 1707–1716. [CrossRef]
25. Löwe, R.; Vezzaro, L.; Mikkelsen, P.S.; Grum, M.; Madsen, H. Probabilistic runoff volume forecasting inrisk-based optimization for RTC of urban drainage systems. Environ. Model. Softw. 2016, 80, 143–158.[CrossRef]
© 2018 by the authors. Licensee MDPI, Basel, Switzerland. This article is an open accessarticle distributed under the terms and conditions of the Creative Commons Attribution(CC BY) license (http://creativecommons.org/licenses/by/4.0/).