COORDINATING MINISTRY FOR ECONOMIC AFFAIRS OF … · Gambar3 : TambahanAngkatanKerja, Kesempatan...
12
1 COORDINATING MINISTRY FOR ECONOMIC AFFAIRS OF THE REPUBLIC OF INDONESIA Main Building, Ministry of Finance, Jl. Lapangan Banteng Timur No. 2‐4 Jakarta 10710 Tel: (021) 351‐1178 Fax: (021) 351‐1186 Website: http://www.ekon.go.id PRESS RELEASE GOVERNMENT OF INDONESIA EVALUATION OF THE ECONOMY IN 2008 AND OUTLOOK FOR 2009 Jakarta, 5 January 2009 – The Coordinating Minister for Economic Affairs, Sri Mulyani Indrawati, is optimistic that the Indonesian economy will achieve 5% growth in 2009. The Minister expressed this view at her office today during a dialogue with media editorial staff and economists on “EVALUATION OF THE ECONOMY IN 2008 AND OUTLOOK FOR 2009." The Coordinating Minister was accompanied by eight ministers in charge of economic portfolios. Coordinating Minister Sri Mulyani explained the following: “Although faced with the impact of the global financial crisis, the Indonesian economy will be able to chart 5% growth in 2009. This prediction is based on an evaluation of Indonesia’s economic performance during the past five years and the budget outcome for the recently completed 2008 fiscal year. The 2008 budget deficit at only 0.1% of GDP, well below the originally planned 2.1% of GDP, affords the Government greater headroom for implementing pro‐growth, pro‐job and pro‐poor programmes. The Rp 52.3 trillion unused portion of budget expenditures in 2008 is a blessing in disguise in the current global financial crisis, as the Government is able to appropriate part of this money to promoting economic growth amid the present global slowdown." A. Economic growth in 2005‐2008 underpins 2009 growth projection In this part of her speech, Coordinating Minister Sri Mulyani explained the various areas of progress in the economy, as demonstrated by three key economic indicators: • Accelerated economic growth. The period following the 1997/98 monetary crisis has been marked by renewed economic growth, most importantly during 2004‐2008 (Chart 1). This acceleration has also been supported by improved equilibrium in sources of economic growth, with investment taking on greater importance alongside continued high growth in private consumption (Chart 2).
-
Upload
truongkhue -
Category
Documents
-
view
212 -
download
0
Transcript of COORDINATING MINISTRY FOR ECONOMIC AFFAIRS OF … · Gambar3 : TambahanAngkatanKerja, Kesempatan...
1
COORDINATING MINISTRY FOR ECONOMIC AFFAIRS
OF THE REPUBLIC OF INDONESIA Main Building, Ministry of Finance, Jl. Lapangan Banteng Timur No. 2‐4 Jakarta 10710
Tel: (021) 351‐1178 Fax: (021) 351‐1186 Website: http://www.ekon.go.id
PRESS RELEASE GOVERNMENT OF INDONESIA EVALUATION OF THE ECONOMY IN 2008 AND
OUTLOOK FOR 2009
Jakarta, 5 January 2009 – The Coordinating Minister for Economic Affairs, Sri Mulyani Indrawati, is optimistic that the Indonesian economy will achieve 5% growth in 2009. The Minister expressed this view at her office today during a dialogue with media editorial staff and economists on “EVALUATION OF THE ECONOMY IN 2008 AND OUTLOOK FOR 2009." The Coordinating Minister was accompanied by eight ministers in charge of economic portfolios. Coordinating Minister Sri Mulyani explained the following: “Although faced with the impact of the global financial crisis, the Indonesian economy will be able to chart 5% growth in 2009. This prediction is based on an evaluation of Indonesia’s economic performance during the past five years and the budget outcome for the recently completed 2008 fiscal year. The 2008 budget deficit at only 0.1% of GDP, well below the originally planned 2.1% of GDP, affords the Government greater headroom for implementing pro‐growth, pro‐job and pro‐poor programmes. The Rp 52.3 trillion unused portion of budget expenditures in 2008 is a blessing in disguise in the current global financial crisis, as the Government is able to appropriate part of this money to promoting economic growth amid the present global slowdown."
A. Economic growth in 2005‐2008 underpins 2009 growth projection
In this part of her speech, Coordinating Minister Sri Mulyani explained the various areas of progress in the economy, as demonstrated by three key economic indicators: • Accelerated economic growth. The period following the 1997/98 monetary crisis has been marked
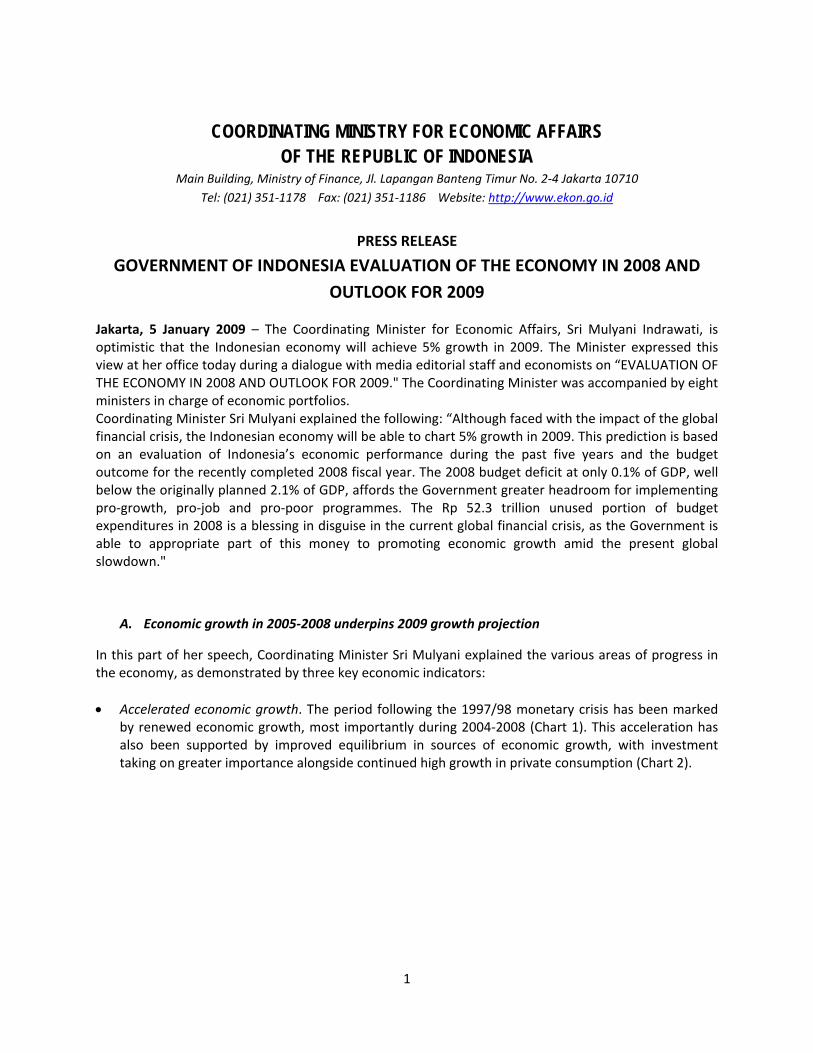
by renewed economic growth, most importantly during 2004‐2008 (Chart 1). This acceleration has also been supported by improved equilibrium in sources of economic growth, with investment taking on greater importance alongside continued high growth in private consumption (Chart 2).
2
Chart 1: Post‐Monetary Crisis Acceleration in Economic Growth
In tandem with the successful creation of macroeconomic stability (exchange rate and inflation), Indonesia’s per capita income measured in US dollars improved 1.8 times over the end‐2004 position to edge past USD2,000 at end‐2008.
Chart 2: Improved Equilibrium and Sustainability in Sources of Growth
• Poverty Reduction. Poverty has been successfully reduced through economic growth combined with price stability in essential items, despite a surge in poverty during the 2005‐2006 period. The latest socio‐economic census data for March 2008 shows that poverty has reached new lows. The poverty reduction has been achieved in both rural and urban areas.
3. Investment 35%
4. Net Exports 8%
1. Private Consumption 52%
2. Government Consumption 5%
Contributions to GDP Growth, 2007 Contributions to GDP Growth, H1/2008
4. Net Exports 14%
1. Private Consumption
42%
3. Investment 41%
Post-Crisis Acceleration of Economic Growth
Non-Oil and Gas
GDP per Capita (USD)
Tot
2. Government Consumption 3%
3
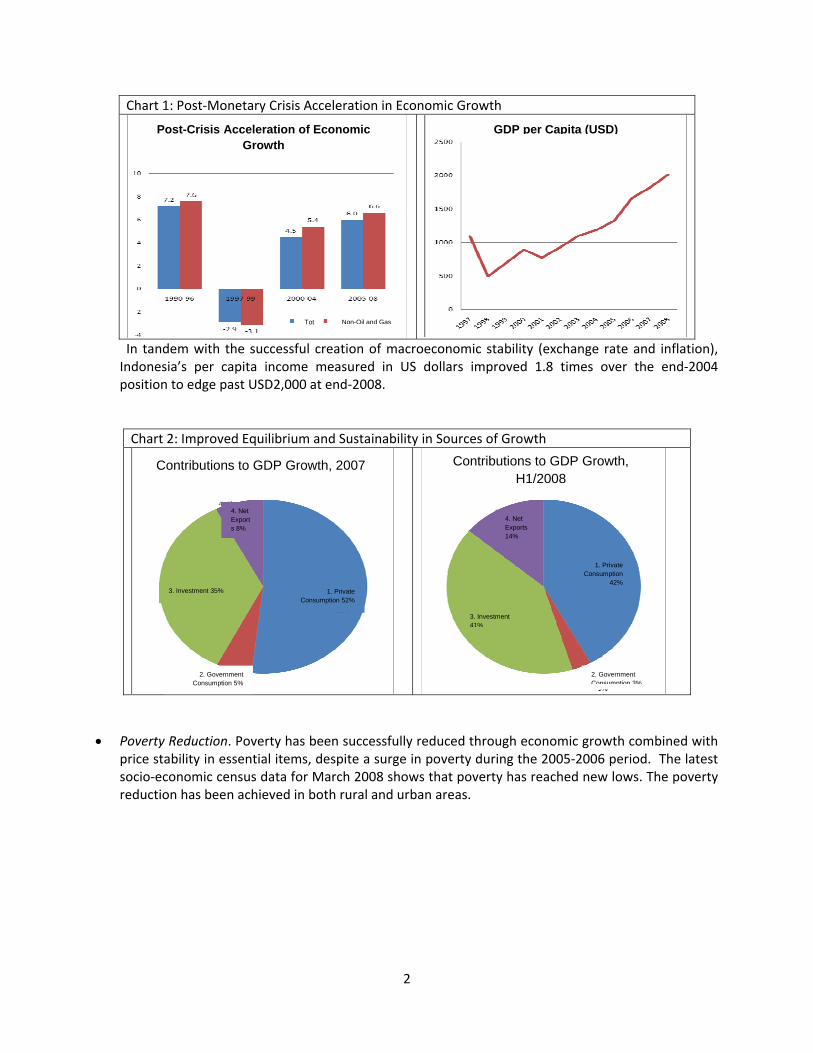
Table 1: Poverty Reduction
Poverty by Various Measures 1996 1998 1999 2000 2001 2002 2003 2004 2005 2006 2007 2008 BPS Total numbers** 34.1 49.5 47.97 38.7 37.9 38.4 37.3 36.1 35.1 39.3 37.2 35.0 Percentage 17.5 24.2 19.1 18.4 18.2 17.4 17.4 16.7 16.0 17.8 16.6 15.4 Poverty Line, PPP USD 1 per capita/day (World Bank)Total numbers 15.4 na 24.9 20.9 19.7 15.5 14.5 16.5 13.6 19.5 15.5 14.2* Percent 7.8 na 12.0 9.9 9.2 7.2 6.6 7.4 6.0 8.5 6.7 5.9* Poverty Line, PPP USD 2 per capita/day (World Bank)Total numbers 99.6 na 135 125.3 125.2 115.6 110 109.1 102.1 113.8 105.3 100.7* Percent 50.5 na 65.1 59.5 58.7 53.5 50.1 49 45.2 49.6 45.2 42.6* *) projection **) Population living in poverty (millions)Sources: The Central Statistics Agency (BPS) and the World Bank
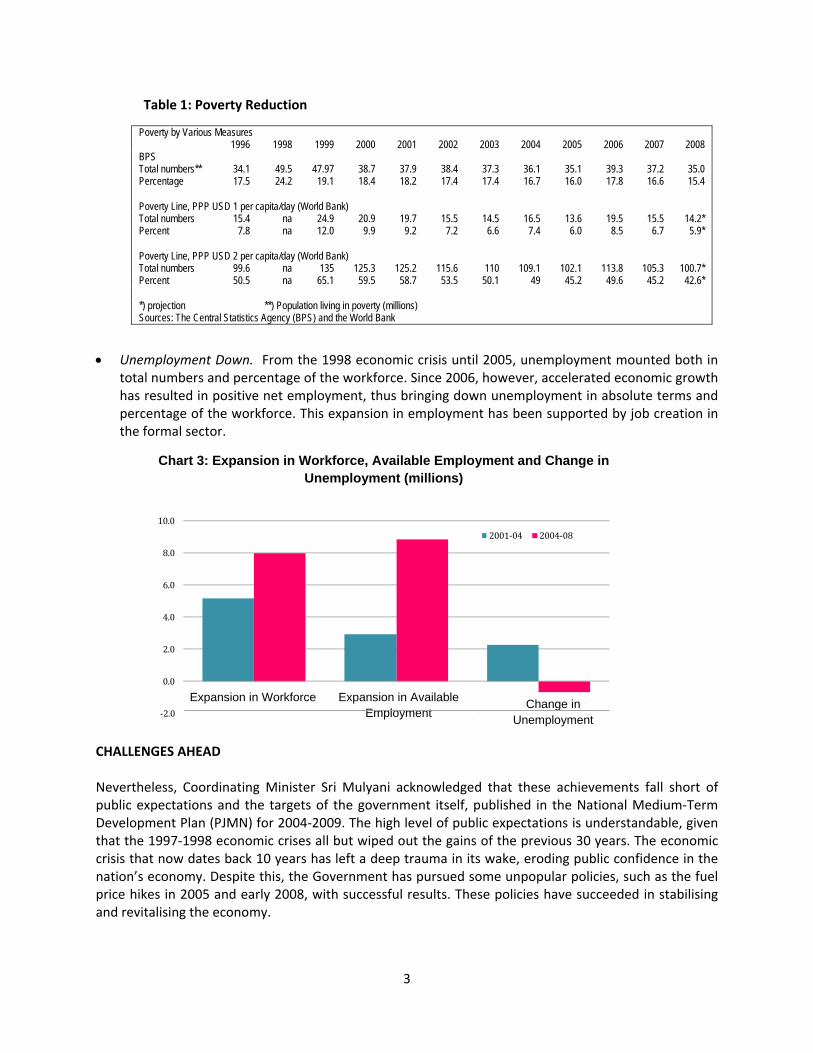
• Unemployment Down. From the 1998 economic crisis until 2005, unemployment mounted both in total numbers and percentage of the workforce. Since 2006, however, accelerated economic growth has resulted in positive net employment, thus bringing down unemployment in absolute terms and percentage of the workforce. This expansion in employment has been supported by job creation in the formal sector.
‐2.0
0.0
2.0
4.0
6.0
8.0
10.0
Tambahan Angkatan Kerja Tambahan Kesempatan Kerja
Perubahan Jumlah Pengangguran
Gambar3 : Tambahan AngkatanKerja, KesempatanKerja dan Perubahan Jumlah Pengangguran (juta
orang)
2001‐04 2004‐08
CHALLENGES AHEAD Nevertheless, Coordinating Minister Sri Mulyani acknowledged that these achievements fall short of public expectations and the targets of the government itself, published in the National Medium‐Term Development Plan (PJMN) for 2004‐2009. The high level of public expectations is understandable, given that the 1997‐1998 economic crises all but wiped out the gains of the previous 30 years. The economic crisis that now dates back 10 years has left a deep trauma in its wake, eroding public confidence in the nation’s economy. Despite this, the Government has pursued some unpopular policies, such as the fuel price hikes in 2005 and early 2008, with successful results. These policies have succeeded in stabilising and revitalising the economy.
Chart 3: Expansion in Workforce, Available Employment and Change in Unemployment (millions)
Expansion in Workforce Expansion in Available Employment
Change in Unemployment
4
In the medium and long‐term perspective, Indonesia still needs to attain higher levels of economic growth over the coming decade for several reasons. First, changes in technology have reduced elasticity in job creation per 1% of economic growth. Thus if we wish to lower unemployment to about 4%‐5%, Indonesia's non‐oil and gas sectors will have to maintain a consistent level of growth throughout the coming decade at over 7%. This is a worldwide phenomenon compelling many countries to undergo a reorientation in their economic development strategies. Second, poverty in Indonesia remains high. Most families in Indonesia continue to live just above the poverty line. Higher growth during the coming decade will be necessary not only to bring down absolute poverty (now at about 6%), but also to reduce the numbers of the near‐poor, which account for almost half of the Indonesian population. These near‐poor households are vulnerable to shocks, ranging from individual to global or systemic. Support for this group will be vital to stimulating the domestic economy and the democratic transition process, given that this group represents an important section of the middle class. We also need to restore the performance of tradable sectors, which has lagged behind in the economic growth creation process over the past 5 years. Rapid growth in tradable sectors is essential to finance investment and sustain external debt service payments in future years.
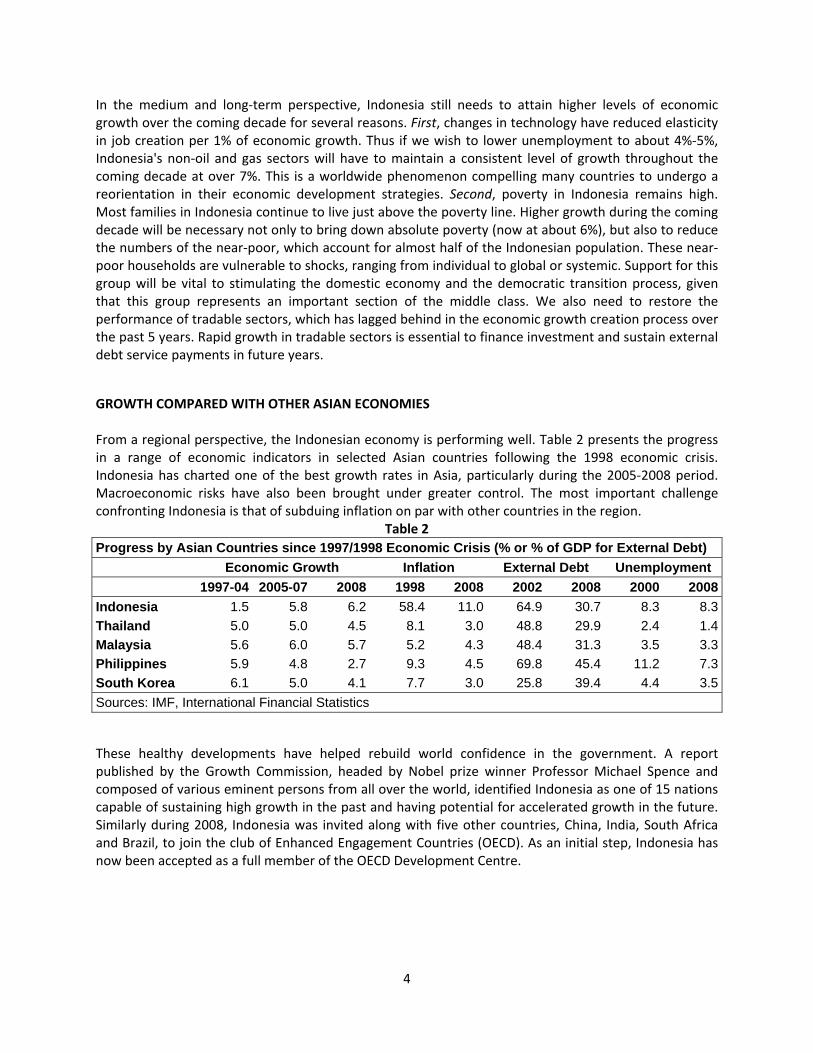
GROWTH COMPARED WITH OTHER ASIAN ECONOMIES From a regional perspective, the Indonesian economy is performing well. Table 2 presents the progress in a range of economic indicators in selected Asian countries following the 1998 economic crisis. Indonesia has charted one of the best growth rates in Asia, particularly during the 2005‐2008 period. Macroeconomic risks have also been brought under greater control. The most important challenge confronting Indonesia is that of subduing inflation on par with other countries in the region.
Table 2 Progress by Asian Countries since 1997/1998 Economic Crisis (% or % of GDP for External Debt) Economic Growth Inflation External Debt Unemployment 1997-04 2005-07 2008 1998 2008 2002 2008 2000 2008Indonesia 1.5 5.8 6.2 58.4 11.0 64.9 30.7 8.3 8.3Thailand 5.0 5.0 4.5 8.1 3.0 48.8 29.9 2.4 1.4Malaysia 5.6 6.0 5.7 5.2 4.3 48.4 31.3 3.5 3.3Philippines 5.9 4.8 2.7 9.3 4.5 69.8 45.4 11.2 7.3South Korea 6.1 5.0 4.1 7.7 3.0 25.8 39.4 4.4 3.5Sources: IMF, International Financial Statistics These healthy developments have helped rebuild world confidence in the government. A report published by the Growth Commission, headed by Nobel prize winner Professor Michael Spence and composed of various eminent persons from all over the world, identified Indonesia as one of 15 nations capable of sustaining high growth in the past and having potential for accelerated growth in the future. Similarly during 2008, Indonesia was invited along with five other countries, China, India, South Africa and Brazil, to join the club of Enhanced Engagement Countries (OECD). As an initial step, Indonesia has now been accepted as a full member of the OECD Development Centre.
5
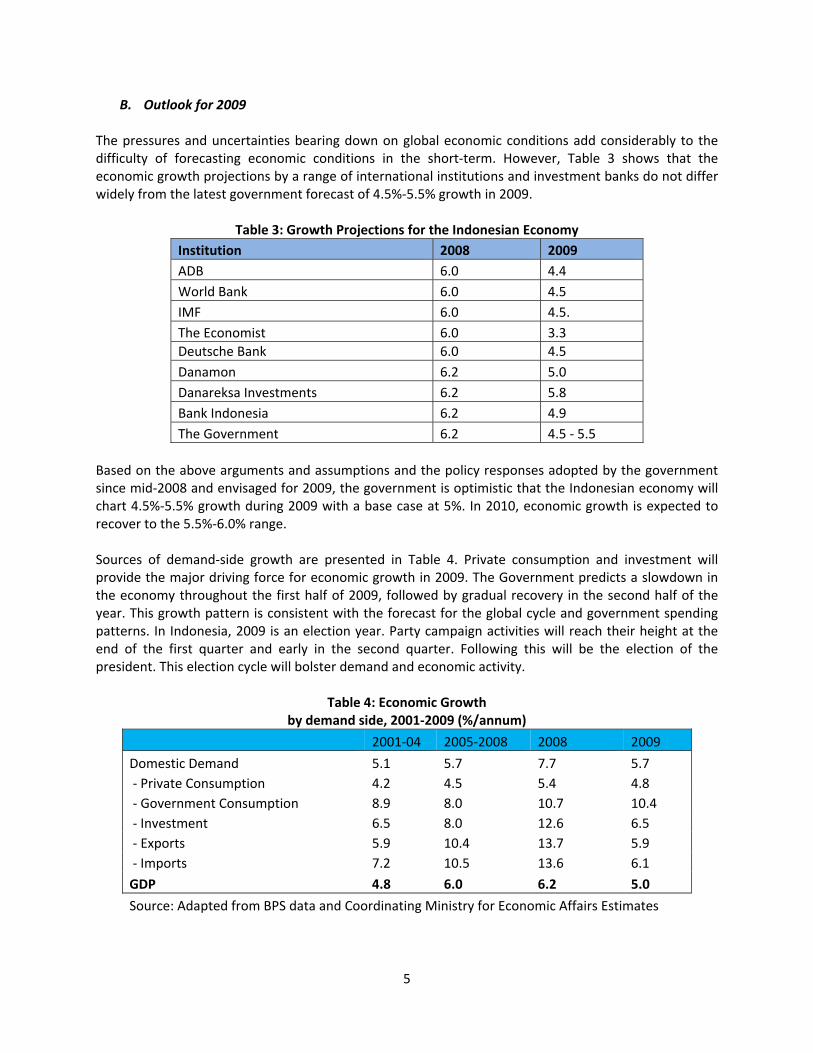
B. Outlook for 2009 The pressures and uncertainties bearing down on global economic conditions add considerably to the difficulty of forecasting economic conditions in the short‐term. However, Table 3 shows that the economic growth projections by a range of international institutions and investment banks do not differ widely from the latest government forecast of 4.5%‐5.5% growth in 2009.
Table 3: Growth Projections for the Indonesian Economy Institution 2008 2009 ADB 6.0 4.4 World Bank 6.0 4.5 IMF 6.0 4.5. The Economist 6.0 3.3 Deutsche Bank 6.0 4.5 Danamon 6.2 5.0 Danareksa Investments 6.2 5.8 Bank Indonesia 6.2 4.9 The Government 6.2 4.5 ‐ 5.5
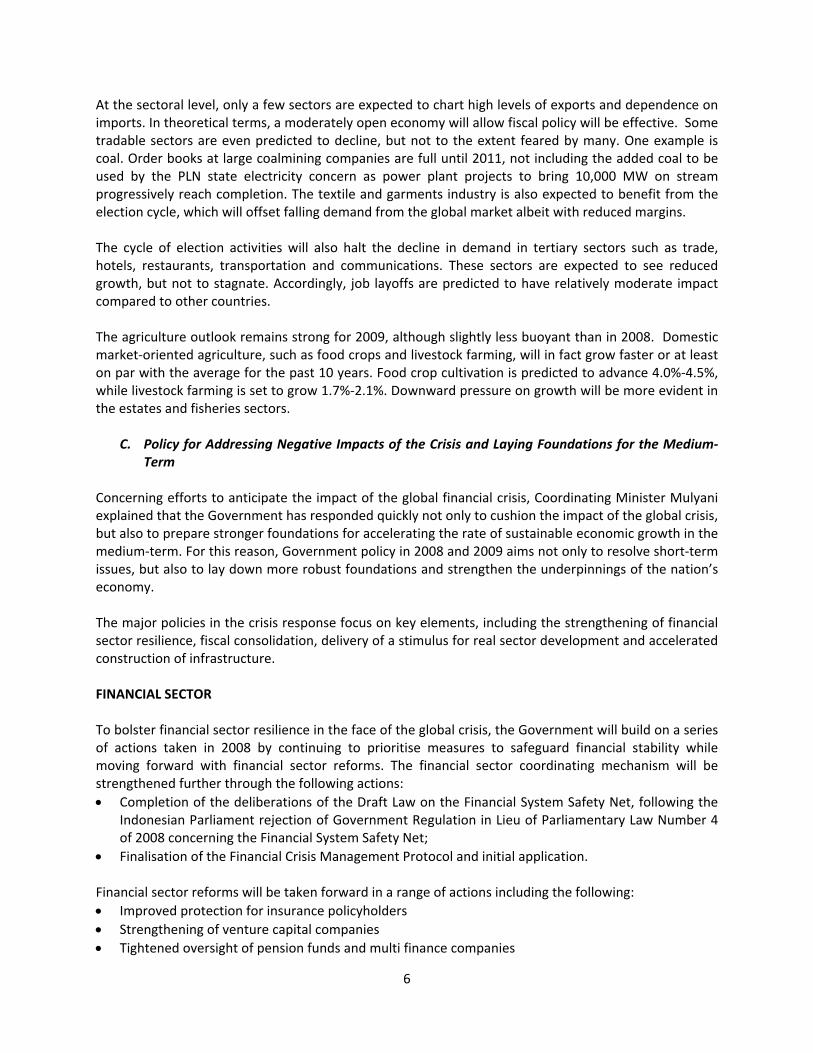
Based on the above arguments and assumptions and the policy responses adopted by the government since mid‐2008 and envisaged for 2009, the government is optimistic that the Indonesian economy will chart 4.5%‐5.5% growth during 2009 with a base case at 5%. In 2010, economic growth is expected to recover to the 5.5%‐6.0% range. Sources of demand‐side growth are presented in Table 4. Private consumption and investment will provide the major driving force for economic growth in 2009. The Government predicts a slowdown in the economy throughout the first half of 2009, followed by gradual recovery in the second half of the year. This growth pattern is consistent with the forecast for the global cycle and government spending patterns. In Indonesia, 2009 is an election year. Party campaign activities will reach their height at the end of the first quarter and early in the second quarter. Following this will be the election of the president. This election cycle will bolster demand and economic activity.
Table 4: Economic Growth by demand side, 2001‐2009 (%/annum)
2001‐04 2005‐2008 2008 2009
Domestic Demand 5.1 5.7 7.7 5.7 ‐ Private Consumption 4.2 4.5 5.4 4.8 ‐ Government Consumption 8.9 8.0 10.7 10.4 ‐ Investment 6.5 8.0 12.6 6.5 ‐ Exports 5.9 10.4 13.7 5.9 ‐ Imports 7.2 10.5 13.6 6.1
GDP 4.8 6.0 6.2 5.0
Source: Adapted from BPS data and Coordinating Ministry for Economic Affairs Estimates
6
At the sectoral level, only a few sectors are expected to chart high levels of exports and dependence on imports. In theoretical terms, a moderately open economy will allow fiscal policy will be effective. Some tradable sectors are even predicted to decline, but not to the extent feared by many. One example is coal. Order books at large coalmining companies are full until 2011, not including the added coal to be used by the PLN state electricity concern as power plant projects to bring 10,000 MW on stream progressively reach completion. The textile and garments industry is also expected to benefit from the election cycle, which will offset falling demand from the global market albeit with reduced margins. The cycle of election activities will also halt the decline in demand in tertiary sectors such as trade, hotels, restaurants, transportation and communications. These sectors are expected to see reduced growth, but not to stagnate. Accordingly, job layoffs are predicted to have relatively moderate impact compared to other countries. The agriculture outlook remains strong for 2009, although slightly less buoyant than in 2008. Domestic market‐oriented agriculture, such as food crops and livestock farming, will in fact grow faster or at least on par with the average for the past 10 years. Food crop cultivation is predicted to advance 4.0%‐4.5%, while livestock farming is set to grow 1.7%‐2.1%. Downward pressure on growth will be more evident in the estates and fisheries sectors.
C. Policy for Addressing Negative Impacts of the Crisis and Laying Foundations for the Medium‐Term
Concerning efforts to anticipate the impact of the global financial crisis, Coordinating Minister Mulyani explained that the Government has responded quickly not only to cushion the impact of the global crisis, but also to prepare stronger foundations for accelerating the rate of sustainable economic growth in the medium‐term. For this reason, Government policy in 2008 and 2009 aims not only to resolve short‐term issues, but also to lay down more robust foundations and strengthen the underpinnings of the nation’s economy. The major policies in the crisis response focus on key elements, including the strengthening of financial sector resilience, fiscal consolidation, delivery of a stimulus for real sector development and accelerated construction of infrastructure. FINANCIAL SECTOR To bolster financial sector resilience in the face of the global crisis, the Government will build on a series of actions taken in 2008 by continuing to prioritise measures to safeguard financial stability while moving forward with financial sector reforms. The financial sector coordinating mechanism will be strengthened further through the following actions: • Completion of the deliberations of the Draft Law on the Financial System Safety Net, following the
Indonesian Parliament rejection of Government Regulation in Lieu of Parliamentary Law Number 4 of 2008 concerning the Financial System Safety Net;
• Finalisation of the Financial Crisis Management Protocol and initial application. Financial sector reforms will be taken forward in a range of actions including the following: • Improved protection for insurance policyholders • Strengthening of venture capital companies • Tightened oversight of pension funds and multi finance companies
7
• Development of credit insurance companies, including underwriting for small and medium enterprises.
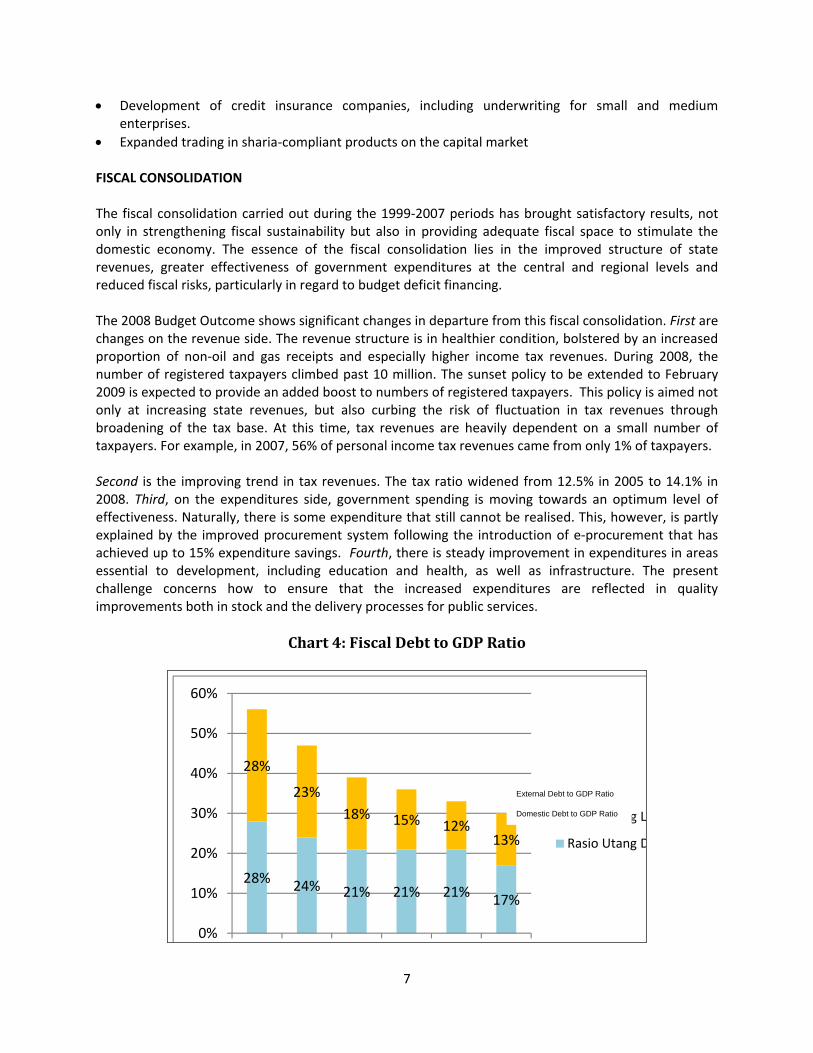
• Expanded trading in sharia‐compliant products on the capital market FISCAL CONSOLIDATION The fiscal consolidation carried out during the 1999‐2007 periods has brought satisfactory results, not only in strengthening fiscal sustainability but also in providing adequate fiscal space to stimulate the domestic economy. The essence of the fiscal consolidation lies in the improved structure of state revenues, greater effectiveness of government expenditures at the central and regional levels and reduced fiscal risks, particularly in regard to budget deficit financing. The 2008 Budget Outcome shows significant changes in departure from this fiscal consolidation. First are changes on the revenue side. The revenue structure is in healthier condition, bolstered by an increased proportion of non‐oil and gas receipts and especially higher income tax revenues. During 2008, the number of registered taxpayers climbed past 10 million. The sunset policy to be extended to February 2009 is expected to provide an added boost to numbers of registered taxpayers. This policy is aimed not only at increasing state revenues, but also curbing the risk of fluctuation in tax revenues through broadening of the tax base. At this time, tax revenues are heavily dependent on a small number of taxpayers. For example, in 2007, 56% of personal income tax revenues came from only 1% of taxpayers. Second is the improving trend in tax revenues. The tax ratio widened from 12.5% in 2005 to 14.1% in 2008. Third, on the expenditures side, government spending is moving towards an optimum level of effectiveness. Naturally, there is some expenditure that still cannot be realised. This, however, is partly explained by the improved procurement system following the introduction of e‐procurement that has achieved up to 15% expenditure savings. Fourth, there is steady improvement in expenditures in areas essential to development, including education and health, as well as infrastructure. The present challenge concerns how to ensure that the increased expenditures are reflected in quality improvements both in stock and the delivery processes for public services.
Chart 4: Fiscal Debt to GDP Ratio
28% 24% 21% 21% 21% 17%
28%
23%18% 15% 12%
13%
0%
10%
20%
30%
40%
50%
60%
Rasio Utang L
Rasio Utang D
External Debt to GDP Ratio
Domestic Debt to GDP Ratio
8
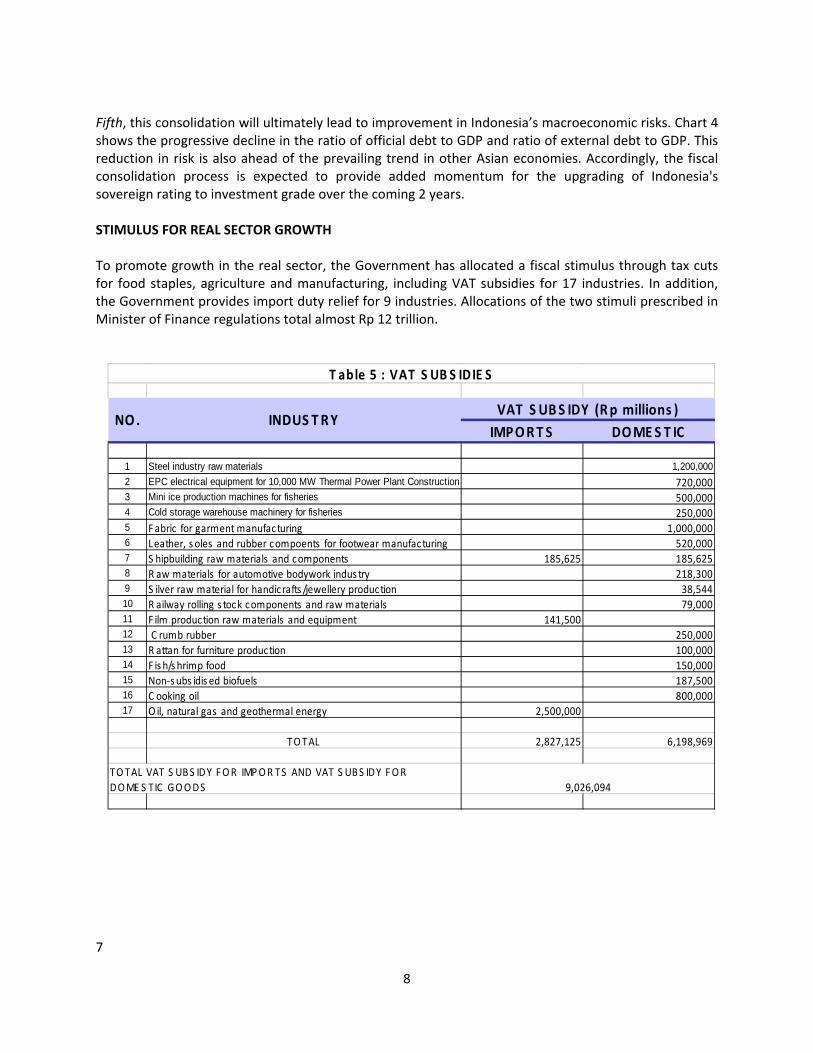
Fifth, this consolidation will ultimately lead to improvement in Indonesia’s macroeconomic risks. Chart 4 shows the progressive decline in the ratio of official debt to GDP and ratio of external debt to GDP. This reduction in risk is also ahead of the prevailing trend in other Asian economies. Accordingly, the fiscal consolidation process is expected to provide added momentum for the upgrading of Indonesia's sovereign rating to investment grade over the coming 2 years. STIMULUS FOR REAL SECTOR GROWTH To promote growth in the real sector, the Government has allocated a fiscal stimulus through tax cuts for food staples, agriculture and manufacturing, including VAT subsidies for 17 industries. In addition, the Government provides import duty relief for 9 industries. Allocations of the two stimuli prescribed in Minister of Finance regulations total almost Rp 12 trillion.
7
IMPORT S DOMES T IC
1 Steel industry raw materials 1,200,0002 EPC electrical equipment for 10,000 MW Thermal Power Plant Construction 720,0003 Mini ice production machines for fisheries 500,0004 Cold storage warehouse machinery for fisheries 250,0005 Fabric for garment manufacturing 1,000,0006 Leather, s oles and rubber compoents for footwear manufacturing 520,0007 S hipbuilding raw materials and components 185,625 185,6258 R aw materials for automotive bodywork indus try 218,3009 S ilver raw material for handic rafts /jewellery production 38,54410 R ailway rolling s tock components and raw materials 79,00011 F ilm production raw materials and equipment 141,50012 C rumb rubber 250,00013 R attan for furniture production 100,00014 F is h/s hrimp food 150,00015 Non‐s ubs idis ed biofuels 187,50016 C ooking oil 800,00017 O il, natural gas and geothermal energy 2,500,000
TOTAL 2,827,125 6,198,969
9,026,094
T able 5 : VAT S UB S IDIE S
NO. INDUS TRYVAT S UBS IDY (Rp millions )
TOTAL VAT S UBS IDY FOR IMPOR TS AND VAT S UBS IDY FOR DOME S TIC GOODS
9
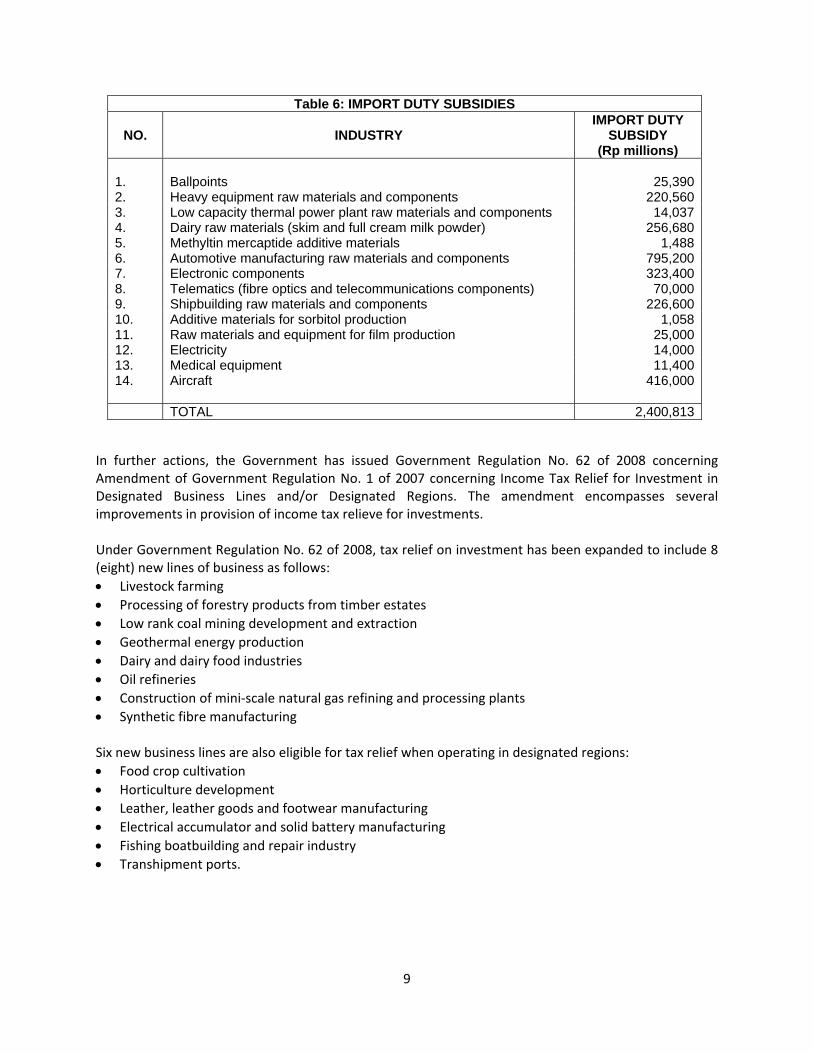
Table 6: IMPORT DUTY SUBSIDIES
NO. INDUSTRY IMPORT DUTY
SUBSIDY (Rp millions)
1. Ballpoints 25,3902. Heavy equipment raw materials and components 220,5603. Low capacity thermal power plant raw materials and components 14,0374. Dairy raw materials (skim and full cream milk powder) 256,6805. Methyltin mercaptide additive materials 1,4886. Automotive manufacturing raw materials and components 795,2007. Electronic components 323,4008. Telematics (fibre optics and telecommunications components) 70,0009. Shipbuilding raw materials and components 226,60010. Additive materials for sorbitol production 1,05811. Raw materials and equipment for film production 25,00012. Electricity 14,00013. Medical equipment 11,40014. Aircraft 416,000 TOTAL 2,400,813
In further actions, the Government has issued Government Regulation No. 62 of 2008 concerning Amendment of Government Regulation No. 1 of 2007 concerning Income Tax Relief for Investment in Designated Business Lines and/or Designated Regions. The amendment encompasses several improvements in provision of income tax relieve for investments. Under Government Regulation No. 62 of 2008, tax relief on investment has been expanded to include 8 (eight) new lines of business as follows: • Livestock farming • Processing of forestry products from timber estates • Low rank coal mining development and extraction • Geothermal energy production • Dairy and dairy food industries • Oil refineries • Construction of mini‐scale natural gas refining and processing plants • Synthetic fibre manufacturing Six new business lines are also eligible for tax relief when operating in designated regions: • Food crop cultivation • Horticulture development • Leather, leather goods and footwear manufacturing • Electrical accumulator and solid battery manufacturing • Fishing boatbuilding and repair industry • Transhipment ports.

10
INFRASTRUCTURE CONSTRUCTION FACED WITH THE GLOBAL ECONOMIC CRISIS
Experiences in various countries and existing theories point to the importance of the government role in continuing to build infrastructure amid the global economic slowdown. For this reason, the line ministries and other government agencies in charge of infrastructure are expected to take various measures to anticipate the spill over effects of the global economic slowdown in 2009. Actions to be taken for government projects include (1) accelerated tendering process under the 2009 budget, e.g. by commencing tender announcements at the end of 2008; (2) accelerated process for disbursement of project budgets, providing market actors with greater flexibility in cash flow management; and (3) accelerated implementation of projects funded by external debt.
For greater effect in job creation, the government has allocated capital expenditures for infrastructure construction totalling at least Rp 72 trillion, distributed among various line ministries and government agencies as shown in the chart below.
Likewise, infrastructure development is vital to creating jobs for the workforce and promoting the use of domestic products. In this regard, it is necessary to plan for labour intensive development of infrastructure, but needless to say without sacrificing quality. This will require field technical support and training to safeguard the quality of construction. Similarly, to promote domestic industry, it is necessary to boost the use of local technology and domestically produced raw materials.
Chart 5
Domestic Debt to GDP Ratio
Department of Public Work
Department of Transportation
Department of Energy and Mineral Resources
Ministry of Finance
Department of Maritime and Fisheries Affairs
Department of National Education
Department of Religious Affairs
Department of Health
Trilion IDR

11
Budget Capital Expenditures, 2009
Ministry of Public Works 25.8 Ministry of Communications 12.6 Ministry of Energy and Natural Resources
4.5
Ministry of Finance 2.8 Ministry of Fisheries and Maritime Affairs
1.1
Ministry of Education 3.5 Ministry of Religion 2.2 Ministry of Health 1 0 5 10 15 20 25 30 Trillions of rupiahs
Almost all new infrastructure projects must be preceded by land expropriation. At this time, many obstacles persist to the expropriation of land for infrastructure construction. Even though the government has a relatively well developed legal framework that has undergone several amendments to accommodate principles of fairness and to protect the rights of citizens, many obstacles continue to be discovered. The most important constraint is the absence of an efficient or effective dispute resolution mechanism when the government fails to reach agreement with land owners fail on prices. To resolve the issue of fluctuating land prices, the government has set aside Rp 4.89 trillion. These funds are expected to remove the delays holding up toll road construction in Java. Similarly, the Government has set aside a revolving Land Fund that can be tapped by investors for land expropriation.
To promote and accelerate the construction of infrastructure funded by the Budget and through public‐private partnerships, the Government will pursue a range of strategies, including a shortening of the time required for land expropriation that now often poses formidable obstacles to the construction of transportation and other infrastructure. In this regard, the various government stakeholders will pursue corrective measures and other improvements at the operational level to support more efficient and consistent implementation of the existing regulations.
To ensure the efficient, effective, accountable and transparent implementation of infrastructure projects, it is necessary commence with a properly ordered procurement process. The government will introduce e‐procurement in order to provide for broader participation in the infrastructure procurement process through use of information technology.
The 2009 Budget envisages substantial allocations for central government transfers to the regions, consisting of Rp 24,819 trillion in General Allocation Funds (DAKI) and Rp 8,856 trillion in Special Autonomy Funds. Part of these funds will be used to finance infrastructure construction programmes. To ensure that funds are used for their intended purposes, the government will put into place a control mechanism for use of the transfer funds to ensure that funds are used as appropriate to the infrastructure construction programme adopted at the national level.
D. Policymaking process
Coordinating Minister Sri Mulyani explained that in addition to the programmes and budget allocations approved by Indonesian Parliament in the 2009 Budget law, such as explained above, the Government still has to finalise programmes and budget allocations using part of the expenditure surplus from the 2008 Budget. These items will be finalised in the near future in consultation with various stakeholders

12
and in compliance with the applicable laws and regulations, thus ensuring appropriately targeted and effective policy implementation.
===***===


![ANALISA EKONOMI[3]perkiraan arus kas pertahun Tahun Arus Kas 1 Rp. 300 juta 2 Rp. 250 juta 3 Rp. 200 juta 4 Rp. 150 juta 5 Rp. 100 juta Contoh ... Menaksir tingkat kemanfaatan 19/11](https://static.fdocuments.us/doc/165x107/5a7522a37f8b9a0d558c29ee/analisa-ekonomi3perkiraan-arus-kas-pertahun-tahun-arus-kas-1-rp-300-juta-2-rp.jpg)