Downstream Upstream Relationship and The Grand Ethiopian ...
Cooperation and conflict between upstreamand downstream countries in African
transboundary rivers
Esther Delbourg1* and Eric Strobl1
1Dpt. of Economics, Ecole Polytechnique, France
June 1, 2012
Abstract
This study examines the impact of certain hydrological and weatherfeatures on conflict and cooperation between African riparian coun-tries displaying a clear upstream-downstream relationship from 1950to 2008. The main innovation in this approach is to look at rela-tive water scarcity within a basin, namely streamflow. The mainhypothesis is that upstream/downstream relationship, the extent ofwater availability to each country and evapotranspiration - an essen-tial weather feature for agriculture - will be significantly correlatedto the intensity of cooperation and/or conflict, as established by theBasins At Risk scale (BARscale) database of Wolf et al. (2003). Afterperforming a pooled ordered probit including Mundlak terms, resultsshow that the success of cooperation is more sensible to upstream vari-ations in streamflow and evapotranspiration than downstream ones.As such, the upstream country seems to benefit from its geographicaladvantage, although general harmony in the basin seems importantas building dams upstream will foster cooperation. Moreover, stream-flow and evapotranspiration factors have opposite roles in enhancing
∗I am grateful for financing from the Axa Research Fund. I also wish to thankRafael Treibich and Mathias Andre for their kind help and time. Ecole Polytech-nique, department CECO - Route de Saclay 91120 Palaiseau, France. E-mail: [email protected]/[email protected] - Tel: +33.1.69.33.30.63
1

cooperation: harsh weather conditions for soils upstream will be asso-ciated with successful cooperation schemes while increased streamflowupstream and downstream are correlated with lower cooperation in-tensity.
2

Contents
1 Introduction 4
2 Literature Review 6
3 Data and Summary Statistics 93.1 Region of Analysis . . . . . . . . . . . . . . . . . . . . . . . . 93.2 Unit of Analysis . . . . . . . . . . . . . . . . . . . . . . . . . . 113.3 Upstream versus downstream relationships . . . . . . . . . . . 123.4 International Freshwater Treaties Database and the BARscale 153.5 Streamflow . . . . . . . . . . . . . . . . . . . . . . . . . . . . . 183.6 Evapotranspiration . . . . . . . . . . . . . . . . . . . . . . . . 193.7 Population, Dams and Lagged Values . . . . . . . . . . . . . . 203.8 Summary Statistics . . . . . . . . . . . . . . . . . . . . . . . . 22
4 Methodology 264.1 Extension to the baseline setting . . . . . . . . . . . . . . . . 29
5 Regression results 30
6 Conclusion 39
Appendices 41
A BARscale as described in Wolf’s database 41
B Description of the African basins studied in this paper 44
C Regression results - simple ordered probit without and withcontrols 45
References 47
3

1 Introduction
Among many of the challenges African countries are facing today standstransboundary water management - that is management of water that crossesinternational borders. Out of 260 major transboundary river basins in theworld, 80 are to be found in Africa; 12 African countries are co-riparian toover four different river basins and some major rivers such as the Congo/Zaire,the Nile or the Niger are even shared by over ten riparian countries. Theterm ”riparian” refers to nations sharing a common river basin and thus con-strained in their consumption of the resource. Indeed, any water use withina shared basin is bound to affect in some way any other possible uses ofthe resource by other riparian countries. It also implies that these countriesare constrained by natural asymmetries induced by their relative positionswithin the basin.
This is why the transboundary nature of water management in Africalies at the heart of the public and scientific debate about cooperation andconflict over international waters. But even though concepts such as waterwars (Starr, 1991; Ismail Serageldin, World Bank, 1995; Gleick, 1993; Lowi,1993; Homer-Dixon, 1994; Klare, 2001; Ehrlich and Ehrlich 1990) or waterconflicts thrive in the geopolitical literature, most specialists and historiansagree to say that the history of water politics is one of cooperation ratherthan one of confrontation (Wolf, 1998, Yoffe et al., 2003 and Turton, 2000).
In the general attempt to understand what actually triggers coopera-tion or conflict among riparian countries, previous literature has focused onpolitics and institutions (Kameri-Mbote, 2005; Bhaduri and Babier, 2008;Shlomi Dinar, 2008, etc.), on identifying types of geographical cooperationalschemes (Dombrowki, 2007; Wolf et al, 1999, 2003; etc.) and on determin-ing economic gains from cooperation (Ambec and Ehlers, 2007; Whittingtonet al., 2005, 2006; Sadoff and Grey, 2002, 2005). These papers generallyemphasize the role of economic, political, historical, cultural and geograph-ical constraints binding riparian countries as they are compelled to sharetheir water resources. A growing literature has also sought to relate climatechange to conflicts, mainly exploring the rivalry induced by the increase inthe degradation of available resources, forcing populations to migrate inter-nally or to cross borders (Homer-Dixon, 1994, 1999; Hauge and Ellingsen,1998; de Soysa, 2002; Miguel et al., 2009).
However, no attention has been given to the decisive exogenous featuresof geography, weather and water availability altogether. First of all, because
4
water crosses political borders, addressing water cooperation in Africa is in-trinsically tied to understanding the various and complex geographical con-figurations of its water basins. Upstream users may easily affect downstreamusers while in the case of border rivers, shared lakes users may mutually af-fect each other and therefore any incentive to cooperate will be constrainedby such relative positions (Dombrowski, 2007). Second, and closely related,is the amount of water available to each country, namely the streamflow,which an upstream country can also affect to some extent, by performing saywater withdrawal for irrigation or safekeeping. Last but not least, climaticconditions within a basin will affect countries’ vulnerability or strengths andthus their dependency to a successful basin cooperation scheme. It is ac-tually the variations in climate that we should look at, and furthermore atthe increasing variability of climate in the years to come that altogether hin-der predictability, increase uncertainty and thus tensions around the waterresource.
The purpose of this thesis is thus to empirically investigate how partof hydrological and weather factors play a role in facilitating such con-flict/cooperation among country members that feature a clear upstream/downstreamrelationship within transboundary river basins. The main innovation in thisapproach is to explicitly take account an aspect that has been largely ignoredin the current literature namely actual relative water scarcity within a basin,as measured by historical river flow and upstream/downstream relationshipsbetween nations. We choose to focus on upstream vs downstream relation-ships because of the natural asymmetry they induce and of the unidirectionalexternalities that emanate from them.
The main hypothesis here is that upstream/downstream relationship, theextent of water availability to each country as well as a local variable cap-turing part of the weather features, namely evapotranspiration, will be sig-nificantly correlated to the intensity of cooperation and/or conflict betweenAfrican countries during 1950 to 2006, as established by the Basins At Riskscale (BARscale) database of Wolf et al. (2003).
We build our database to address these particular issues: using theBARscale as our dependent variable, we disaggregate the data into coun-try pairs that feature a clear upstream/downstream relation and focus onhow water availability and evapotranspiration variations within this relationhave affected the given BARscale in the last 50 years. We perform a pooledordered probit adding Mundlak terms, first using only our two variables, andthen adding controls.
5

Our main findings are that for pairs of countries displaying a natural up-stream/downstream asymmetry, our two hydrological and weather featuresmatter for cooperative agreements more than conflictive ones. Furthermore,they play opposite roles in determining cooperative agreements: higher evap-otranspiration conditions upstream and downstream - meaning drier soils -will always be positively correlated with the intensity of agreements, while itis unfavorable streamflow upstream and downstream that will always lessenthe intensity of cooperation. Lastly, the success of cooperation seems to bemore sensible to upstream variations in streamflow and evapotranspiration,meaning that as far as exogenous features are concerned,
This outline of the rest of the paper is as follows: in the next sectionwe describe part of the existing literature on water cooperation that hasbeen of great use to us and that we have the ambition to complete. Insection 3, we describe our data and how we build it to meet our empiricalapproach. Section 4 explains the econometrics we use and why we choseto perform ordered probit regressions using the Mundlak transformation.Section 5 shows regressions and results. Section 6 concludes.
2 Literature Review
Most papers on the topic agree that the transboundary nature of watermanagement gives higher incentives for states to enter a cooperative mode(Kameri-Mbote (2005), Giordano et al. (2002), Lindemann (2005), Turtonet al. (2005), Yoffe et al. (2003), Uitto and Duda, (2002). We understandcooperation as defined by Ostrom (1990): it takes place if the actors involvedchoose strategies that allow them to realize gains of cooperation. Conflictoccurs if there is contestation of the status quo allocation of the resource.
Following the same intuition, Sadoff and Grey (2002) explain the incen-tives to enter conflict or cooperation based on the perceived benefits of suchbehavior. By doing so, they have to consider that countries have the abilityto perceive the finality of cooperative or conflictive agreements but do notaddress what actually trigger it, which this article is set out to do.
Another point raised by the literature addresses asymmetries betweencountries. As Whittington et al. (2005, 2006) argue, riparian countries mustexploit their endogenous and endogenous strengths to offset potential weak-nesses and eventually be better off. As Dombrowsky (2007) clearly explains,this is exactly what the upstream vs downstream relationship emphasizes, as
6

it introduces natural asymmetry in facing the water resource. Because of thisgeographical inequality, taking other things equal, upstream countries havemuch less incentives to cooperate with their downstream counterpart. There-fore downstream countries must set to exploit their attractive exogenous andendogenous features to stimulate such incentives.
The interest of the downstream versus upstream can be better under-stood through the studies of unidirectional and negative externalities. Rogers(1997) describes the problem of transboundary water management as oneof pervasive unidirectional externality. Barret (1994) offers an initial game-theoretic reconstruction of different transboundary water management issues,distinguishing unidirectional and reciprocal externality. Dombrowsky (2007)describes negative externalities in an upstream/downstream configuration aswater withdrawal from upstream dams or upstream water pollution. Pos-itive externalities can include upstream wastewater treatment of upstreamprovision of retention area. Through the upstream/downstream relationship,the variable streamflow that we use can thus easily be altered through theseexternalities. Moreover, our results are consistent with her conclusions thatnegative externalities associated with geography and water asymmetries givemore often incentives to cooperate than positive externalities. Indeed, thelatter need not always lead to cooperation as riparians are less constrainedby their counterparts.
The need for countries to balance their assets and offset their naturaland endogenous weaknesses is also the basis of cooperative game theory lit-erature. Kilgour and Dinar (1995, 2001) develop a water sharing modelin order to determine efficient allocations depending on actual hydrologicalflows. Their results imply that taking hydrological variability into accountproduces higher welfare levels than allocations based on average flows. Whit-tington, Wu and Sadoff (2005) and Wu and Whittington (2006) explore thenotion of economic value of water through the Nile Economic OptimizationModel. They consider different coalition schemes within the Nile accordingto countries (unilateralism, bilateralism and multilateralism) and determinethe annual pattern of water use that will maximize the sum of economic ben-efits from irrigated agriculture and hydropower. They give very interestingthough debatable recommendations for the Nile river, typically illustratingupstream vs downstream cooperational challenges.
One of the closest study that our paper can refer to is the article by Songand Whittington (2004) as they set out to determine the type of interna-tional rivers and type of country pairs that are more likely to host coopera-
7

tive treaties over the hydrological common resource. In fact they point outthat ”much less attention has been paid in the international waters literatureto physical/spatial factors influencing cooperative action” which is preciselywhat we set out to do. By using the same database as this article - the BasinsAt Risk project conducted by Aaron T. Wolf at the Oregon University in 2003described a bit further - they develop a typology of rivers according to dif-ferent criteria, mainly civilization, size of population and GDP with differentcombinations of the three. They also disaggregate the data into countrypairs such as we do, but extend their study to the rest of the world insteadof focusing only on Africa. The main difference in the way we treat thedatabase is that this study will consider the intensity of each event and notjust their existence. Part of their conclusions are of importance to us: theyfind that transboundary rivers that cross riparians with countervailing pow-ers, population and economic hegemon are more likely to cooperate. Theyalso find that river types appear more important in determining cooperativetreaties than do country pair types, suggesting that cooperation is easier toachieve when there is little history of it. This statement follows this paper’smethodology as we distinguish river types but not country pair types, anddo control for a lagged value of history of cooperation for country pairs. Asthis study also controls for GDP and population as well, we will attempt toput our results in perspective with Song and Whittington’s conclusions.
Last but not least, this study is made possible by the Basins At Riskproject conducted by Aaron T. Wolf at the Oregon University in 2003. It isset on determining what reasons have caused and will generate global waterconflict since the 1950s. It identifies over 2000 transboundary events oninternational watercourses between 1950 and 2008, out of which around twothirds are classified as cooperative, and only one third as conflictive.
S. Yoffe, Wolf and M. Giordano build a scale to classify events by theirintensity. By creating biophysical, economic and geopolitical variables, theytest hypotheses about factors associated with water conflict. But instead oftesting how country specific features correlate with their scale, they focuson the issue of the treaty: agreement over water quantity, quality, jointmanagement, hydropower, etc. (See appendix 1). Moreover, they do not usecountry pairs as their unit of study but only countries at the individual level,thus depriving the study of any geographical perspective, unlike this paper.
They find interesting trends: treaties over water quantity, quality, jointmanagement and hydropower tend to be highly cooperative while conflictiverelations tend to center around quantity and infrastructure concerns. All
8
in all, no single indicator can clearly explain conflict or cooperation (amongclimatic, water stress, government type, dependence variables), confirmingthe intuition that willingness and ability to cooperate are constrained by amultitude of factors.
The patterns they find are partly issued from summary statistics of theirdata (see Appendix 1), partly from linear regressions models to test thelevel of international conflict/cooperation over water to a set of quantifiableindependent variables (GDP, population density, overall relations, rate ofpopulation growth, number of dams, dam density, basin area, water stress,HDI, agriculture as % of GDP and hydropower). We control for few of thesevariables, as they introduce important endogeneities in our ordered probitregression but instead use exogenous variables that are absent from the BARproject, mainly streamflow and evapotranspiration.
3 Data and Summary Statistics
3.1 Region of Analysis
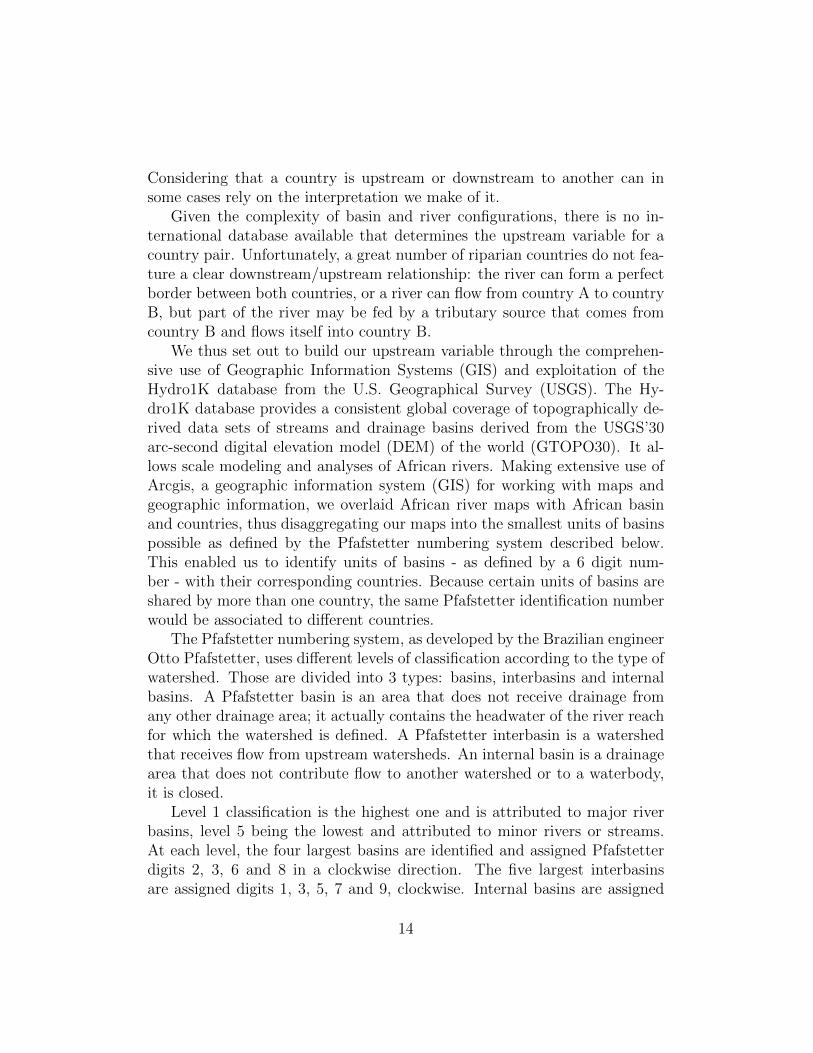
This study will focus on 16 river basins, namely: the Awash, the Congo/Zaire,the Gambia, the Incomati, the Juba-Shibeli, the Kunene, the Lake Chad, theLimpopo, the Niger, the Nile, the Okavango, the Orange, the Ruvuma, theSenegal, the Volta and the Zambezi. We consider mainly some of the largestbasins in Africa (except for the Awash, Ruvuma and Juba-Shibeli) becausesmaller international rivers are not as important to riparians as small rivers,and will have less incentive to cooperate. In fact as Table 1 shows below,transboundary basins of at least 6 countries ”produce” twice as much eventsas basins with 4 and less countries.
See the underlined basins on the map and Appendix 3 for specific detailsabout them.
As we are studying water management within transboundary basins, welimit ourselves to country interactions within river basins and not betweenthem. Indeed, many water treaties will include countries that do not sharea river basin. Studying those interactions go beyond the scope of this paperbecause countries are no longer constrained (at least by) by their relativepositions within a specific basin. However, we do take into account the totalnumber of countries initially involved in each agreement for each country pairthus including countries outside of the basins concerned. This will enable us
9

Table 1: Number of events by basin from 1950 to 2006 according tonumber of countries in the basin
Totalctriesbasin N mean sd2 8 6.25 2.121323 18 10.11111 4.8005994 59 14.01695 5.1645066 7 7 08 5 5 09 25 25 011 136 117.4706 30.3883412 11 11 0Total 269 66.37546 56.29682Source: /Users/esthounz/Dropbox/Thesis/1rst article/Data/13 avril ’12/Event database - no CP.dta
to test for sub-samples of the data to see if the model works better with smalltransboundary basins (4 or less countries) or large basins (6 countries andmore).
10

3.2 Unit of Analysis
Determining what causes conflict and cooperation over water between ri-parian countries requires choosing a relevant unit of study. For the sake offeasibility, we can consider 3 geographical units:
- The basin as a whole, by building mean values for our variables.
- Countries at the individual level
- Country pairs
Wolf’s database precisely describes what conflict or cooperation can be,at different levels of intensities. In general, conflict between countries overwater can be understood as a series of tensions or specific non-cooperativeacts perpetrated by one of the countries regarding the others. On the other
11

hand, cooperation will designate a series of agreements and events fosteringbilateral or multilateral action for the sake of the common water resource.The International Freshwater Treaties Database (Wolf) attributes the sameBARscale to each of the countries involved in a specific water-related event,and we choose to disaggregate the data into country pairs for the followingreasons:
- Our main hypothesis implies that the upstream vs downstream rela-tion will matter for the intensity of cooperation or conflict betweencountries, hence the need to operate at country pair level.
- African river basins greatly differ in the number of riparian countries.Working at the basin level would have introduced too much noise in theinterpretation of results between basins featuring 2 riparian countriesand those with 10 riparian countries for instance. Indeed, cooperationand conflict are to be understood differently when dealing with numer-ous countries as multilateralism can be more unstable than bilateralism.On the other hand, highly conflictive agreements are more unlikely tooccur if an important number of countries are present during the nego-tiations. Also, in a same basin, events from 1950 to 2008 rarely involvethe exact same countries at the same time. Working at the countrypair level enables us to find a common denominator to basins.
- Moreover, understanding cooperation or conflict due to climatic condi-tions and water scarcity requires between-country data confrontation.Confronting a countrys behavior alone throughout time with its ex-ogenous and endogenous features would be of no interest. Thereforeit would be harder to interpret what made two countries cooperate orconfront each other.
3.3 Upstream versus downstream relationships
As one can see on the following maps, rivers within basins do not respectpolitical borders, implying the necessity to determine the kind of hydro-geographic relationship there is between two riparian countries.
In reality such relationships are extremely complex to determine and af-firm. There are hundreds of watersheds and rivers within basins that crossborders in all ways possible, thus making any configuration locally possible.
12
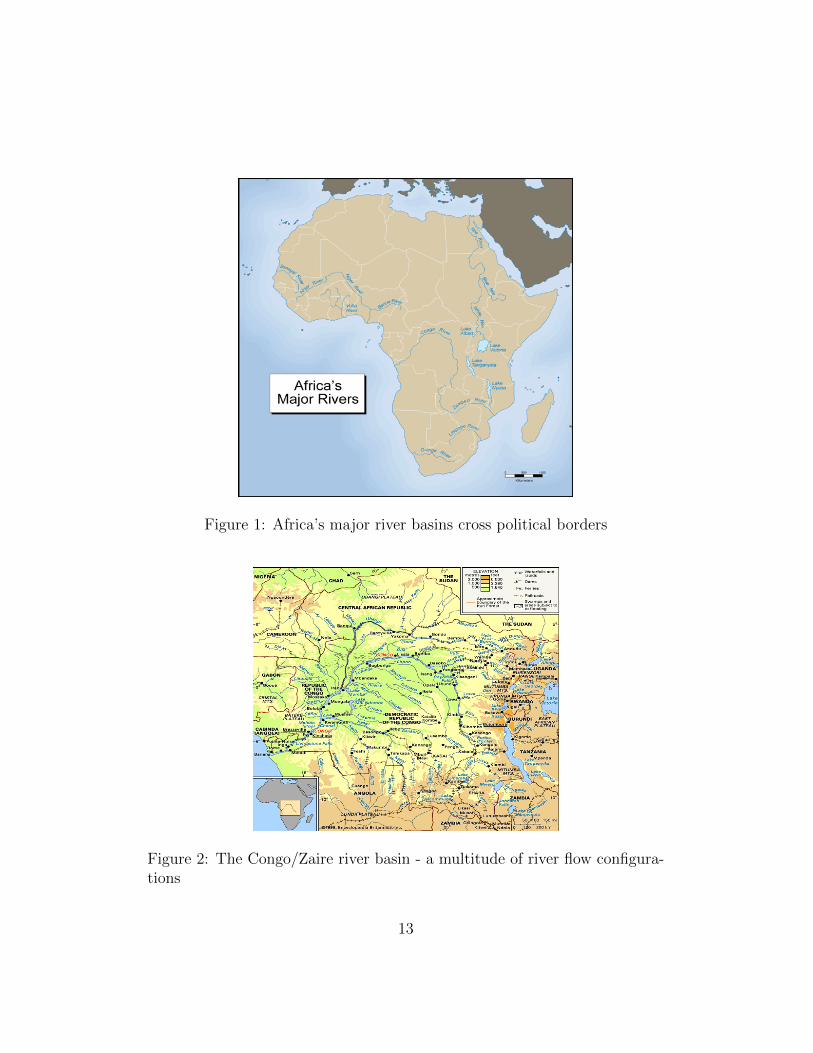
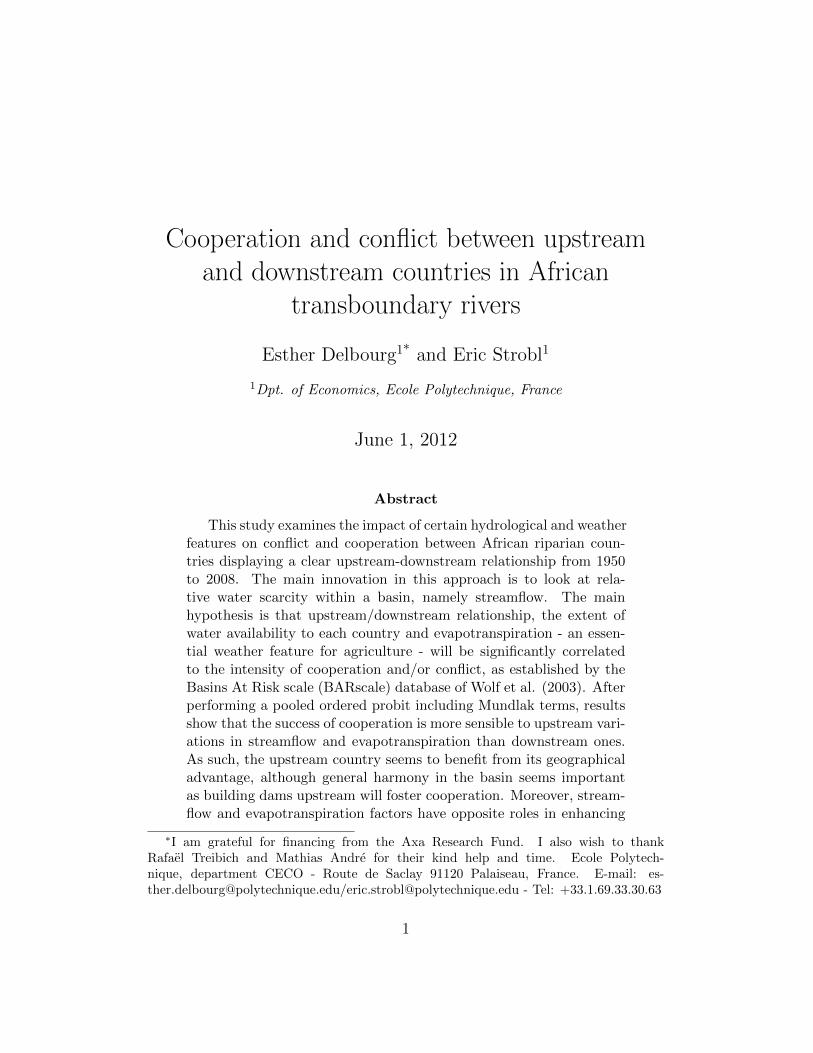
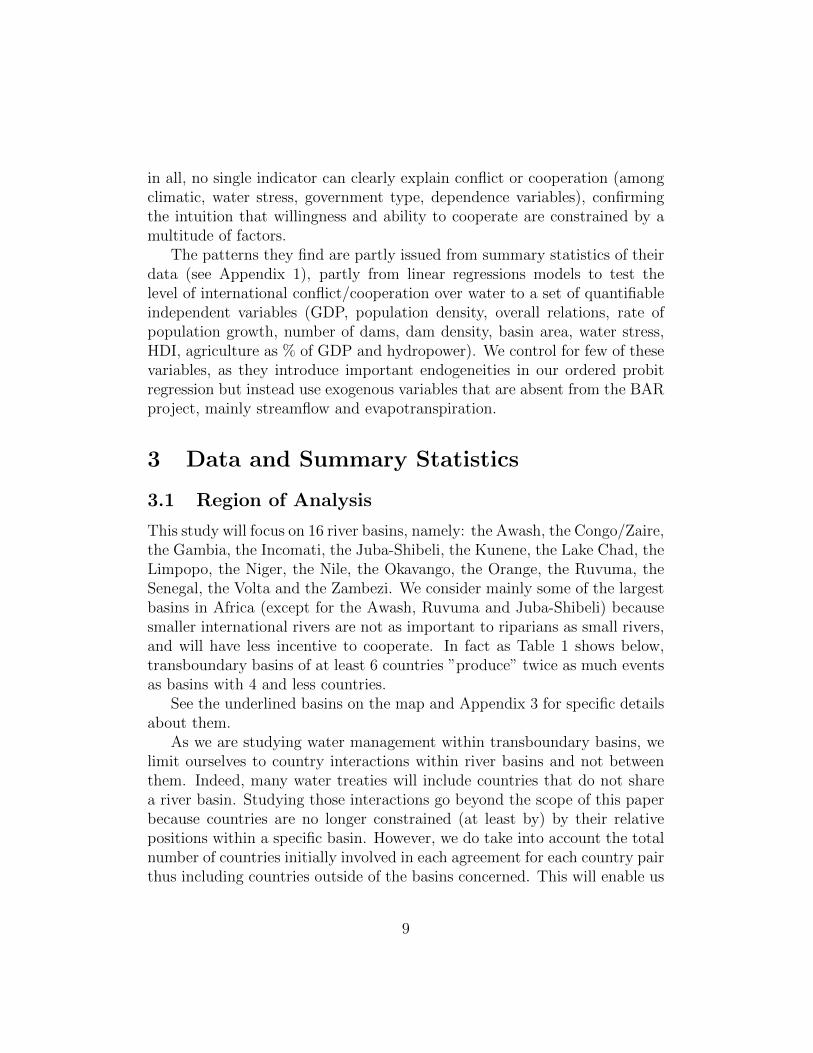
Figure 1: Africa’s major river basins cross political borders
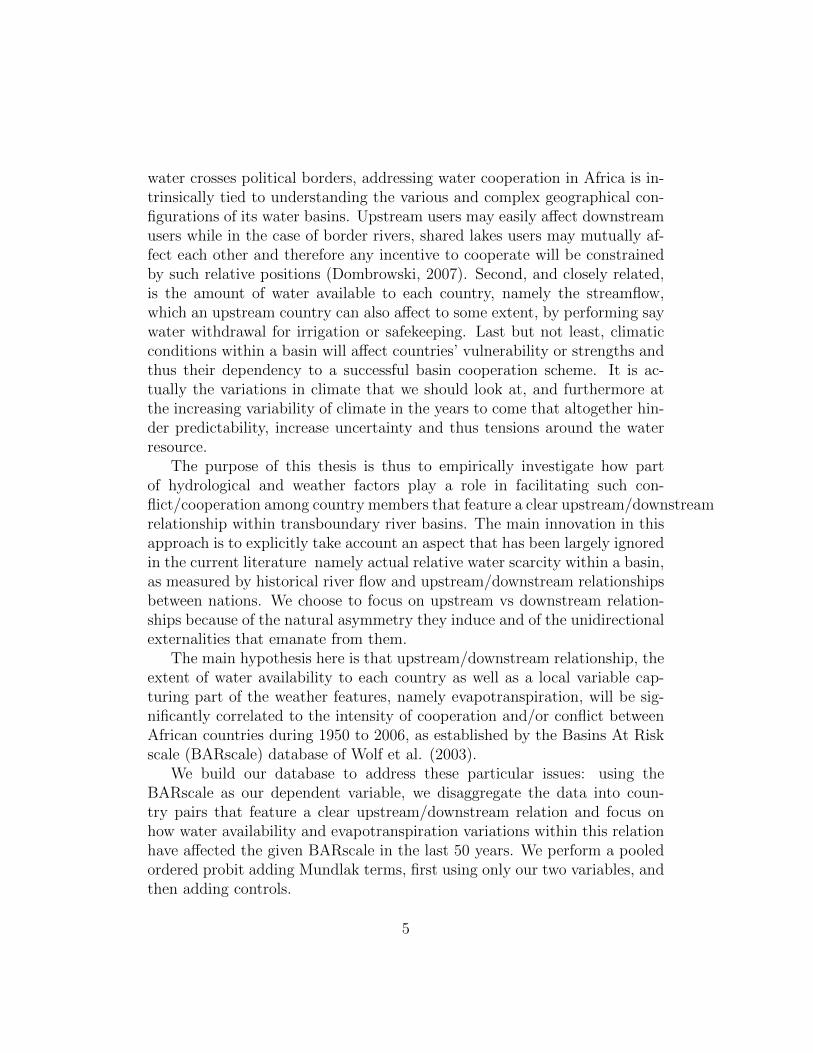
Figure 2: The Congo/Zaire river basin - a multitude of river flow configura-tions
13
Considering that a country is upstream or downstream to another can insome cases rely on the interpretation we make of it.
Given the complexity of basin and river configurations, there is no in-ternational database available that determines the upstream variable for acountry pair. Unfortunately, a great number of riparian countries do not fea-ture a clear downstream/upstream relationship: the river can form a perfectborder between both countries, or a river can flow from country A to countryB, but part of the river may be fed by a tributary source that comes fromcountry B and flows itself into country B.
We thus set out to build our upstream variable through the comprehen-sive use of Geographic Information Systems (GIS) and exploitation of theHydro1K database from the U.S. Geographical Survey (USGS). The Hy-dro1K database provides a consistent global coverage of topographically de-rived data sets of streams and drainage basins derived from the USGS’30arc-second digital elevation model (DEM) of the world (GTOPO30). It al-lows scale modeling and analyses of African rivers. Making extensive use ofArcgis, a geographic information system (GIS) for working with maps andgeographic information, we overlaid African river maps with African basinand countries, thus disaggregating our maps into the smallest units of basinspossible as defined by the Pfafstetter numbering system described below.This enabled us to identify units of basins - as defined by a 6 digit num-ber - with their corresponding countries. Because certain units of basins areshared by more than one country, the same Pfafstetter identification numberwould be associated to different countries.
The Pfafstetter numbering system, as developed by the Brazilian engineerOtto Pfafstetter, uses different levels of classification according to the type ofwatershed. Those are divided into 3 types: basins, interbasins and internalbasins. A Pfafstetter basin is an area that does not receive drainage fromany other drainage area; it actually contains the headwater of the river reachfor which the watershed is defined. A Pfafstetter interbasin is a watershedthat receives flow from upstream watersheds. An internal basin is a drainagearea that does not contribute flow to another watershed or to a waterbody,it is closed.
Level 1 classification is the highest one and is attributed to major riverbasins, level 5 being the lowest and attributed to minor rivers or streams.At each level, the four largest basins are identified and assigned Pfafstetterdigits 2, 3, 6 and 8 in a clockwise direction. The five largest interbasinsare assigned digits 1, 3, 5, 7 and 9, clockwise. Internal basins are assigned
14

the number 0. Basins continue to be subdivided and numbered as before atlevels 2 to 5. Interbasins continue to be divided into the 4 largest basinsat levels 2 to 5 but instead of numbering the resulting basins in a clockwisedirection, the basins are numbered from the most downstream basin to themost upstream.
For example, a Pfafstetter number of 8673 indicates that the basin drainsthrough basin number 8 at level 1, basin number 6 at level 2, interbasinnumber 7 at level 3 and interbasin number 3 at level 4.
Because certain identification numbers corresponded to two countries atthe same time, we had to look at the 5 digit number identification (the firstsmallest basin identification after the 6 digit number one) in order to lookwhere that part of the basin was located in majority. Once each of our6 digit basin identification number was assigned to a unique country, thePfafstetter system enabled us to derive a downstream/upstream relationshipbetween all of our 6 digit basin identification number, thus deriving a down-stream/upstream relationship between African countries.
Our unit of study being country pairs (country 1, country 2), our up-stream variable was built in the following way:
- The variable upstream will be equal to 1 if country 1 is upstream
- The variable upstream will be equal to 2 if country 2 is upstream
- The variable upstream will be equal to 0 if no clear upstream/downstreamrelationship has been established between the two countries. All ob-servations with a 0 value for the upstream variable were not taken intoaccount in the coming regressions.
3.4 International Freshwater Treaties Database and theBARscale
The BARscale we use is part of the Basins At Risk (BAR) project led byAaron T. Wolf, project director at the Department of Geosciences of the Ore-gon State University. His research focuses on issues relating transboundarywater resources to political conflict and cooperation, combining environmen-tal science with dispute resolution theory and practice. His team created a
15
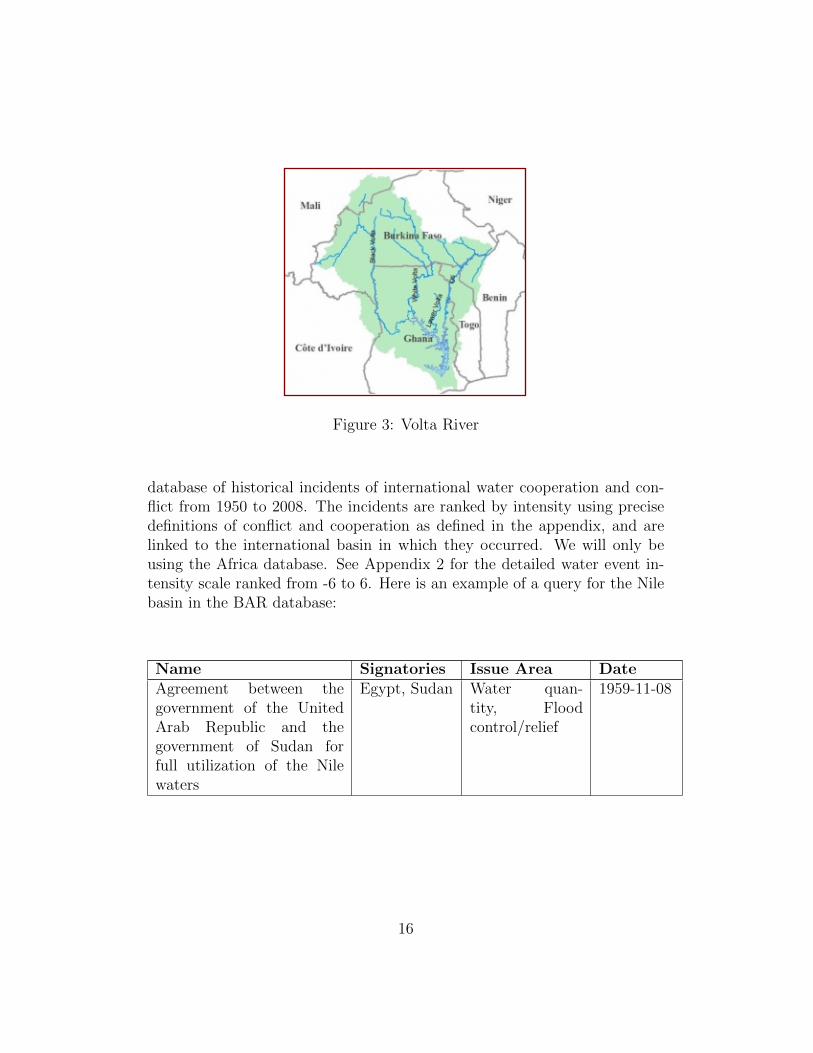
Figure 3: Volta River
database of historical incidents of international water cooperation and con-flict from 1950 to 2008. The incidents are ranked by intensity using precisedefinitions of conflict and cooperation as defined in the appendix, and arelinked to the international basin in which they occurred. We will only beusing the Africa database. See Appendix 2 for the detailed water event in-tensity scale ranked from -6 to 6. Here is an example of a query for the Nilebasin in the BAR database:
Name Signatories Issue Area DateAgreement between thegovernment of the UnitedArab Republic and thegovernment of Sudan forfull utilization of the Nilewaters
Egypt, Sudan Water quan-tity, Floodcontrol/relief
1959-11-08
16
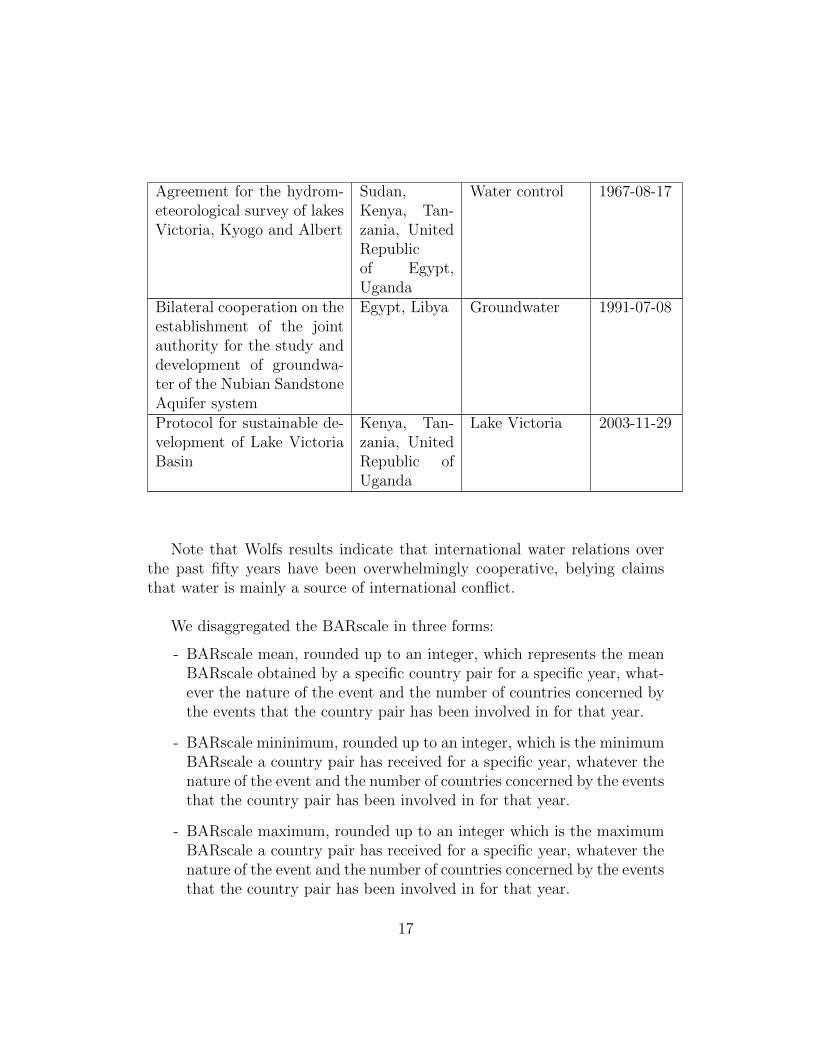
Agreement for the hydrom-eteorological survey of lakesVictoria, Kyogo and Albert
Sudan,Kenya, Tan-zania, UnitedRepublicof Egypt,Uganda
Water control 1967-08-17
Bilateral cooperation on theestablishment of the jointauthority for the study anddevelopment of groundwa-ter of the Nubian SandstoneAquifer system
Egypt, Libya Groundwater 1991-07-08
Protocol for sustainable de-velopment of Lake VictoriaBasin
Kenya, Tan-zania, UnitedRepublic ofUganda
Lake Victoria 2003-11-29
Note that Wolfs results indicate that international water relations overthe past fifty years have been overwhelmingly cooperative, belying claimsthat water is mainly a source of international conflict.
We disaggregated the BARscale in three forms:
- BARscale mean, rounded up to an integer, which represents the meanBARscale obtained by a specific country pair for a specific year, what-ever the nature of the event and the number of countries concerned bythe events that the country pair has been involved in for that year.
- BARscale mininimum, rounded up to an integer, which is the minimumBARscale a country pair has received for a specific year, whatever thenature of the event and the number of countries concerned by the eventsthat the country pair has been involved in for that year.
- BARscale maximum, rounded up to an integer which is the maximumBARscale a country pair has received for a specific year, whatever thenature of the event and the number of countries concerned by the eventsthat the country pair has been involved in for that year.
17

A country pair will have a different values for each different computationsof BARscale if both countries of the pair have been involved together, duringthe same year, in different events that received different values of BARscales.
If we roughly interpret the differences between those different BARscales,BARscale max is representative of cooperative water events, while BARscalemin is representative of more conflictive events. Mean BARscale, on theother hand, is only relevant if a country pair was involved in different eventsin a same year and cannot truly express the intensity of riparian cooperationor conflict.
Moreover, the BAR database was filtered to take into account only Africandata. It gave us a total of 17 168 observations for our 16 basins and 296 dis-tinct country pairs from 1949 to 2006, during which 771 water events occurredfor 39 countries. Cleaning the database to have only upstream and down-stream countries left us with 8178 observations for 16 basins, 141 distinctcountry pairs over 58 years, covering 36 countries. And after dropping ob-servations with missing real gdp or population values, we were left with 6316observations for 141 distinct country pairs, 16 basins covering 36 countries.
We then build our database in order for our unit study to be country pairswithin every basin for each year. Each country pair is then assigned a countrypair identification number. Note that events initially involve countries withinand outside the identified basins. Each water event therefore appears once inthe database if it only involved two countries. It will appear several times if itinvolved more than two countries, thus including more than one country pair- as long as the concerned country pair displays an upstream/downstreamrelationship.
Combined with geographical, spatial and climatic data, this water eventdatabase offers a resource for a qualitative and quantitative exploration ofAfrican water issues.
3.5 Streamflow
Our measure of the natural resource over which cooperative/conflictive eventsbetween country pairs occurs is water, and we proxy this by a measure ofstreamflow. More precisely, streamflow is a component of the water runoffand the main mechanism by which water moves from the land to the oceans.It is mainly formed by precipitation runoff in the watershed and by thecontribution of other tributary rivers or water bodies. It is to be read inm3/s. A particularity about streamflow is that it is always changing from
18
day to day, mostly because of:
- Natural Mechanisms: runoff from rainfall and snowmelt, evaporationfrom soil and surface-water bodies, evapotranspiration, ground-waterdischarge from aquifers, sedimentation of lakes and wetlands, etc.
- Human-induced mechanisms: surface-water withdrawals and transbasindiversions (through dams), construction, removal, and sedimentation ofreservoirs, irrigation through stream channelization, etc.
It is a mostly relevant and useful indicator for our study as streamflow willdetermine both the amount of water available to a country but then also itsleverage on or its dependency regarding the whole of the basin.
Strobl and Blanc (2009) compute streamflow data per year and per coun-try using the GeoSFM model (Geospatial Streal Flow Model) built by theUSGS (U.S. Geographical Survey). It is a semidistributed physically basedhydrological model, with particular relevance for Africas hydrology (Asanteet al., 2007a; Asante et al., 2007b). It stimulates the dynamics of runoff pro-cesses using spatial information on river basin and network coverage, landcover type, soil characteristics and daily precipitation and evapotranspirationdata.
They use the HYDRO1k data to delineate basins and river network. TheHYDRO1k database was also built by the USGS and provides drainage basinboundaries data for the African continent as derived from river network andflow direction data. At its most disaggregated level, this involves dividingthe African continent into 7131 6-digit hydrological basins, with an averageof 4,200 km2. Each basin is then assigned a Pfafstetter 6-digit code thatallows to determine whether it is upstream, downstream or not related toanother basin in the data set.
3.6 Evapotranspiration
Evapotranspiration (et) combines normal evaporation and plant transpira-tion from land surface to atmosphere. It represents an evaporative demandof the air within a basin. Because plants will transpire more as soils areliquid, such a measure is important in order to manage catchments for watersupply and irrigation. It is also a comprehensive weather indicator as it is acombination of solar radiation and temperature.
19

It is actually only part of all the variables that describe the weatherand this study intends to develop itself further by taking into account theStandardized Precipitation Index (SPI) which is a way of measuring droughtthat considers only precipitation.
Evapotranspiration data is obtained from the CRU TS 2.1 dataset (Mitchelland Jones, 2005) compiled by the Climatic Research Unit (CRU) at the Uni-versity of East Anglia. Strobl and Blanc (2009) use monthly data on mmof precipitation and degrees of average, minimum and maximum tempera-ture, all of which were given at the 0.5 degree resolution globally for landsurface areas over the period 1901-2002, to calculate annual river basin levelmeasures of these weather factors.
Strobl and Blanc follow the computation in Hargreaves and Samani (1985):
ET = 0.0023(Tavg + 17.8)(Tmax− Tmin)0.5Ra (1)
where Tavg, Tmax and Tmin are mean, maximum and minimum tem-perature, respectively and Ra is the extraterrestrial radiation calculated fol-lowing Allen et al. (1998).
The evapotranspiration rate is expressed in millimetres (mm) per unit oftime. The rate expresses the amount of water lost from a cropped surfacein units of water depth. The time unit here is year. As one hectare has asurface of 10000 m2 and 1 mm is equal to 0.001 m, a loss of 1 mm of watercorresponds to a loss of 10m3 of water per hectare. In other words, 1 mmday-1 is equivalent to 10 m3 ha-1 day-l.
3.7 Population, Dams and Lagged Values
Including endogenous features of the countries is essential as the impact ofexogenous features of weather and streamflow can be easily mitigated bycountry-specific features. These are likely to influence the outcome of waterevents and so our dependent variable, the BARscale. Egypt’s prosperousreign over the Nile cannot be understood without its long history nor itscolonization. The country has always perceived its downstream location as athreat while it also enabled it to hold influence over the Mediterranean Sea.
Our main problem is to be limited by the number and nature of thesevariables, as they will induce endogeneity within the regression. In order toaccount for economic status and general commitment/concern of countriesover water issues, we will introduce two controls: real gdp and number ofdams per country.
20

Real GDP and number of dams both account for economic status andinvestment in water management. Countries that build dams over the yearsare more likely to be involved in water events but this information cannothelp predict the intensity of such events. Indeed, dam investment showsconcern for water management and water access, but it will also impact theshared resource as a whole. It encourages countries to discuss water issuesand perhaps increase the probability of cooperation - on the other hand,an increase in the number of dams can also increase the probability of non-compatible projects over the transboundary basin.
Real gdp is taken from the Penn World Table (PWT) 7.0, as provided byAlan Heston, Robert Summers and Bettina Aten, Penn World Table Version7.0, Center for International Comparisons of Production, Income and Pricesat the University of Pennsylvania, May 2011. It is derived from growth ratesat 2005 constant prices.
Number of dams per country and per year is provided by Strobl andStrobl (2010) where they use the FAOs African Dams Database, a georef-erenced database of large dams. It contains information about the date ofconstruction and was completed using updated data from the InternationalCommission on Large Dams (ICOLD), internet searches and a list of damsand their characteristics provided by the South African Department of Waterand Forestry.
The main issue is that there are many ways in which real gdp and numberof dams can be highly endogenous in our regressions. One of them wouldbe that they can easily be linked to unobserved historical events such ascolonization which would have brought the necessary funds to build dams andcontribute to the global development of the countrys economy, thus giving itmore political leverage and power to make the water event successful or notaccording to its own interest.
Another one, more relevant perhaps in this case, is that we can make theassumption that dams are built in periods prone to water events. Indeed,building a dam upstream or downstream requires government implicationfor water-related economic issues and so perhaps a higher and compelledcommitment to management issues of the shared resource. Building a damwill also affect in some way the shared basin, and riparian countries willfeel concerned. It can open up the way to successful cooperation events ifthe country building the dam seems concerned by the effect of its projecton other riparians, or lead to conflictive events if not. So the correlationbetween number of dams and the unexplained factors during a precise year
21
is only contemporary of that year. Lagged values of number of dams in acountry will not be a part of a dynamic introduced by the project of a newdam, supposedly correlated with an event. When looking at the yearly data,it so turns out that every time a dam is built, water events occur the sameyear.
We follow the same reasoning for real gdp. As a control variable foreconomic development, it can be highly correlated with unobserved factorsinfluencing the intensity of water events. African economies rely heavilyon farming and irrigation, and are thus easily affected by lack of water,harsh climatic conditions and poor water infrastructures. Enhanced climaticconditions may steer local economy and increase real gdp per capita, makingthe country either less or more cooperative according to the benefits it canget out of a water event. Taking the lag value of real gdp per capita enablesus to get round this contemporary correlation.
We will thus use lagged control variables in order to avoid high endogene-ity issues. We take into account real gdp and number of dams and distinguishthem in the same way as above:
- lag rgdpU and lag rgdpD for the real gdp of the upstream and down-stream countries
- lag DAMU and lag DAMD for upstream and downstream number ofdams
We will also be using a lag history variable: by country pair, it representsthe lagged sum of events a country pair has been involved since 150. Thisis helpful in analyzing the frequency of a country pair in water events: wewill find generally that water events between two countries follow each otherclosely in time, thus supposedly increasing the likeliness of having an eventoccur as the years go by.
3.8 Summary Statistics
Our database initially displayed 17168 observations covering all possiblecountry-pairs within our 16 basins during each year from 1950 to 2006. Fil-tering the database for countries displaying a clear upstream/downstreamrelationship, we ended up with 9106 observations. Ignoring certain year ob-servations for missing values of real gdp for certain countries in the early1950s left us with a total of 6884 observations for 157 different country pairs
22
over the 16 basins. This also means that the total number of years observedwill differ from one country pair to another.
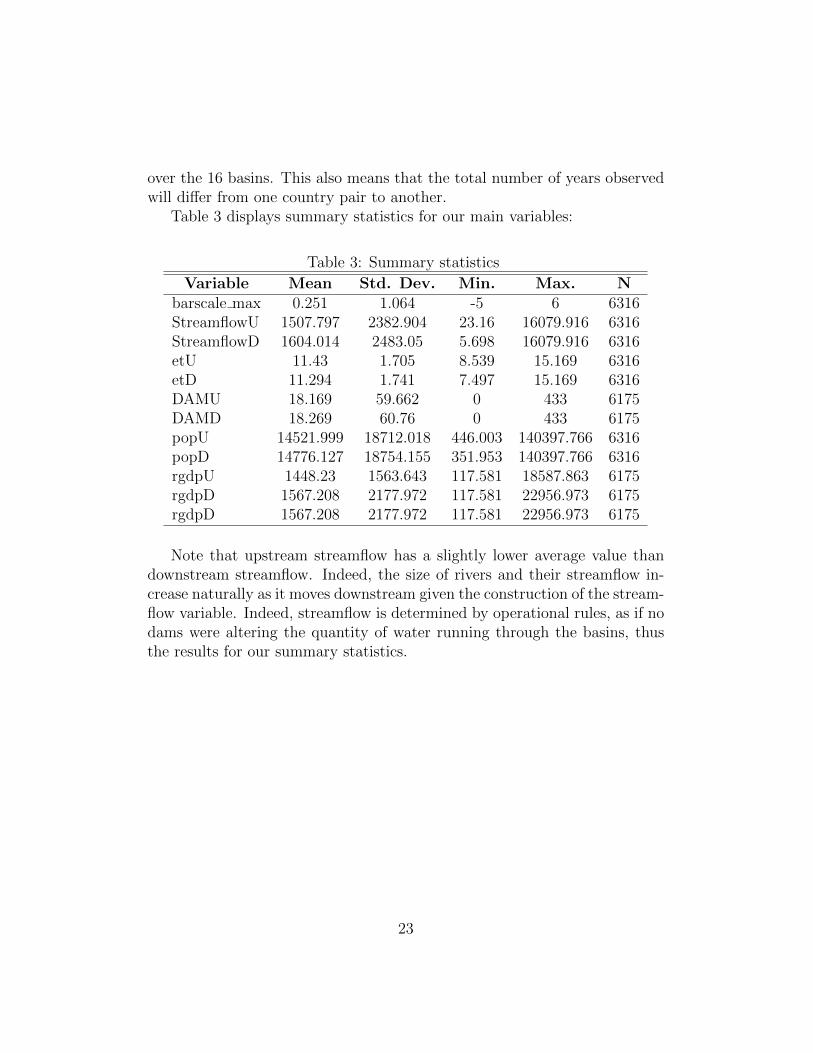
Table 3 displays summary statistics for our main variables:
Table 3: Summary statistics
Variable Mean Std. Dev. Min. Max. Nbarscale max 0.251 1.064 -5 6 6316StreamflowU 1507.797 2382.904 23.16 16079.916 6316StreamflowD 1604.014 2483.05 5.698 16079.916 6316etU 11.43 1.705 8.539 15.169 6316etD 11.294 1.741 7.497 15.169 6316DAMU 18.169 59.662 0 433 6175DAMD 18.269 60.76 0 433 6175popU 14521.999 18712.018 446.003 140397.766 6316popD 14776.127 18754.155 351.953 140397.766 6316rgdpU 1448.23 1563.643 117.581 18587.863 6175rgdpD 1567.208 2177.972 117.581 22956.973 6175rgdpD 1567.208 2177.972 117.581 22956.973 6175
Note that upstream streamflow has a slightly lower average value thandownstream streamflow. Indeed, the size of rivers and their streamflow in-crease naturally as it moves downstream given the construction of the stream-flow variable. Indeed, streamflow is determined by operational rules, as if nodams were altering the quantity of water running through the basins, thusthe results for our summary statistics.
23

Tab
le4:
Max
bars
cale
Str
UStr
DetU
etD
Min
ctri
es
Max
ctri
es
DA
MU
DA
MD
-543
0.72
9510
23.1
129.
5637
718.
8587
862
25
0-2
1477
.55
1478
.234
10.8
7335
10.7
0893
2.12
52.
125
62.8
7518
-135
3.86
895.
6059
10.7
9331
12.1
6706
88
1.75
3.25
015
56.7
9216
35.0
9611
.448
7611
.298
24.0
0170
82.0
0170
8216
.914
9517
.809
071
825.
8908
1339
.585
11.0
8004
11.3
9511
7.11
7188
7.26
5625
12.4
9219
18.3
5156
255
3.53
0773
6.68
2712
.006
1712
.007
052.
452.
644
.35.
73
683.
3519
1240
.359
10.4
2029
10.8
6055
6.94
2857
7.4
28.3
4286
28.6
2857
493
5.30
6112
26.3
4710
.736
0810
.940
876.
4062
57.
2578
1337
.377
9522
.062
995
363.
4849
465.
6783
13.9
0957
13.2
3973
99
13.4
7.2
610
06.5
9411
56.0
2511
.745
11.3
2793
5.89
4737
5.91
7293
50.6
5414
34.4
8872
Tot
al15
07.7
9716
04.0
1411
.429
6611
.294
36.4
6120
96.4
8495
8818
.169
2318
.268
5Source:
/Use
rs/e
sth
oun
z/D
rop
box
/Th
esis
/1rs
tart
icle
/D
ata
/F
inal
data
/C
on
flic
td
ata
Fin
al
28.0
5.d
ta
24
Table 4 gives more insight into the relationship about upstream/downstreamstreamflow, minimum and maximum countries involved in the correspondingevents, mean number of upstream/downstream dams according to maximumBARscale. Priori to understanding country incentives according to their cli-matic features, we must state a few facts:
1. First of all, mean downstream streamflow is higher than mean up-stream streamflow. High streamflow is an advantage for downstreamcountries but makes them more vulnerable to upstream water use: pol-lution, withdrawal, etc. and so more likely to enter in cooperation withupstream countries.
2. Lower upstream streamflow can induce upstream nations to cooperatewith downstream countries around flood control, joint management,water transfers. On the other hand, it can also hinder cooperation, asupstream nations will want to withdraw water as much as they can,unilaterally, ignoring downstream complaints.
3. There is no real linear relationship between maximum BARscale andupstream/downstream streamflow. All we can see is that the highestand lowest values of BARscale, meaning successful/unsuccessful coop-erations are associated with high mean levels of upstream and down-stream streamflow.
4. Here we see that there is no major difference between the minimum andmaximum number of countries involved in different events during thesame year because most country pairs are involved in only one eventper year.
5. We can see that in our data, highly conflictive events (BARscale from-5 to -4) do not concern more than 2 countries (BARscales -5 and -2), while highly cooperative events involve over 6 countries. Risking acausality relation between the number of countries involved in an eventand its success would be dangerous because we would need to controlfor many other factors, but also because of reverse causality. Buildinga multilateral agreement requires time and money that countries willnot be willing to give up unless they believe that the outcome maybe of great interest (a better outcome than by acting unilaterally).It could also be a sort of multilateralism effect, where each country
25

representative realizes that a conflictive outcome between more than2 countries seems obsolete. On the other hand, strongly disagreeingwith one country seems less risky. This goes against Shlomi Dinar(2008) who argues that bilateral cooperation seems easier to achievethan multilateral cooperation. Indeed, the more actors, the harder itis to ensure full compliance, no free-riding, and to enforce punishmentshould terms of the agreement be violated.
6. In our data, for country pairs that are involved in successful coopera-tion and get a BARscale higher than 3, number of downstream damsexceed 20. For a BARscale of 6, proof of intense cooperation, upstreamcountries have a mean of 50 dams. As upstream dams are a real con-cern for downstream dams for fear of water withdrawal and pollution,this may be in keeping with general intuition.
7. Although no general trend can be deduced from this table, we cansee that country pairs that suffer highly conflictive agreements (-6)feature an important asymmetry in number of dams: 5 dams upstreamand 0 downstream or even 62 dams upstream for 18 downstream. Thistypically could be the case for Egypt: a downstream country with muchbetter economic prospects - but with vulnerability to water quantitiesand pollution - does not want to foster cooperation and initiates anaggressive strategy over the river basin (cf 1959 Nile Basin bilateralagreement between Egypt and Sudan).
4 Methodology
In order to exploit our hydrological and climatic country-pair data, we needto build a model that allows to control for country-pair specific traits. Theuse of panel data as well as the development of suitable micro-econometrictechniques allow us to derive evidence of hydrological and climatic link tocooperation and conflict.
First of all, the need to account for the ordered structure of our de-pendent variable (from -6 to 6) leads us to use an ordered probit model.Furthermore, given the strong heterogeneity of country-pairs, exacerbatedby unobserved factors such as political affinities, history, culture, etc., theeconometric analysis needs to account for unobservable country-pair effectsand potential heteroskedaticity.
26

Therefore we specify a heteroskedaticity pooled panel ordered probit,which is augmented to account for unobserved time-invariant country-paireffects. We control for these unobserved effects, which are neither consideredas parameters to estimate nor as having a certain distribution and being inde-pendent from all covariates, accommodating the model by Mundlak (1978).In this way we control for fixed effects, where the modified random coeffi-cients model leads to an estimator identical to the fixed effect estimator ofthe basic specification when unobserved effects are assumed to be normallydistributed conditional on the covariates.
Baseline Setting
We first use a basic pooled panel ordered probit model. Our first regres-sion will only include our hydrological and climatic variables while the secondwill control for lagged values of upstream and downstream gdp, number ofdams and number of events the country pair has been involved in the past.
The ordered categorical outcome for BARscale is coded in a rank pre-serving manner:
BARscaleit ε [−6, ..., j, ..., 6]
where BARscaleit is attributed to country pair i (i = 1,,157) for year t(t = 1950, 2006). The vector of covariates X is of dimension and representsupstream and downstream streamflow and evapotranspiration as followed:
Xit = (StreamflowUit, StreamflowDit, etUit, etDit)
The cumulative probabilities of the outcome are linked to a single indexof independent variables as follows:
P (BARscaleit ≤ j/Xit) = Φ(αj −Xitβ)
where αj and βj are unknown parameters and Φ is the standard normalcumulative density function.
Well-defined probabilities are ensured if αj > αj−1, αj = ∞ such thatΦ(∞) = 1 and α0 = −∞ such that Φ(−∞) = 0. Ordered response models areexpressed by means of an underlying continuous latent process BARscale∗itand a response scheme:
27
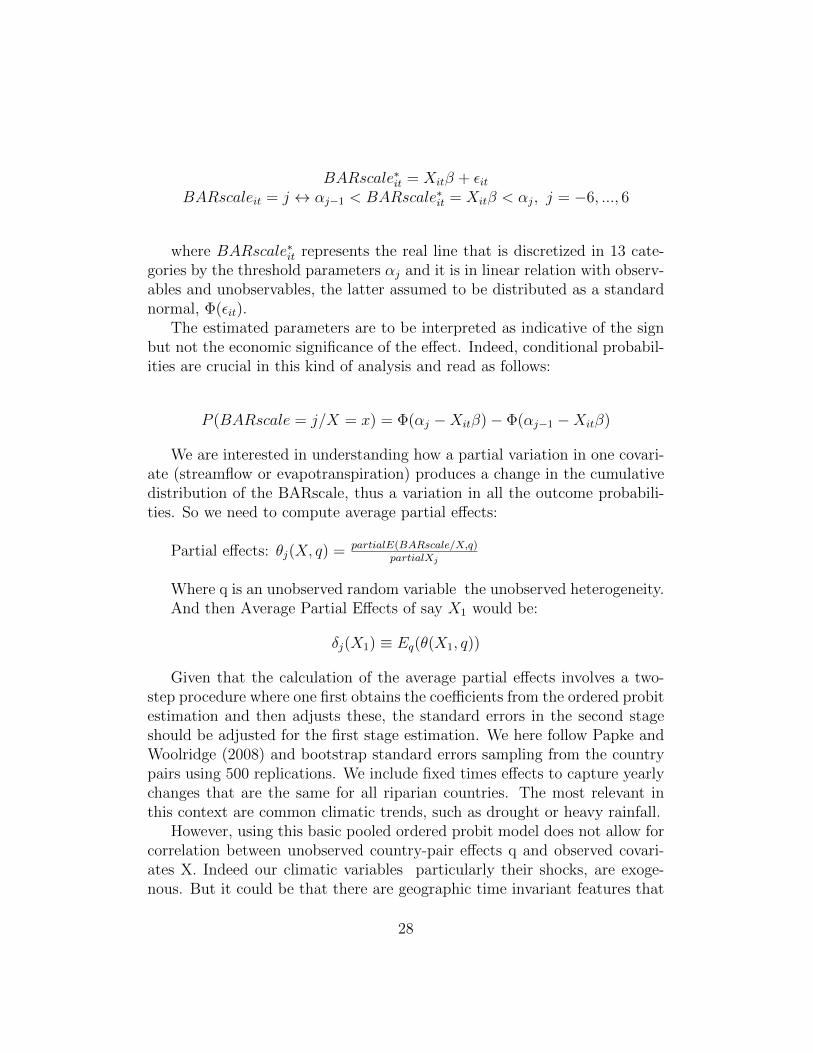
BARscale∗it = Xitβ + εitBARscaleit = j ↔ αj−1 < BARscale∗it = Xitβ < αj, j = −6, ..., 6
where BARscale∗it represents the real line that is discretized in 13 cate-gories by the threshold parameters αj and it is in linear relation with observ-ables and unobservables, the latter assumed to be distributed as a standardnormal, Φ(εit).
The estimated parameters are to be interpreted as indicative of the signbut not the economic significance of the effect. Indeed, conditional probabil-ities are crucial in this kind of analysis and read as follows:
P (BARscale = j/X = x) = Φ(αj −Xitβ)− Φ(αj−1 −Xitβ)
We are interested in understanding how a partial variation in one covari-ate (streamflow or evapotranspiration) produces a change in the cumulativedistribution of the BARscale, thus a variation in all the outcome probabili-ties. So we need to compute average partial effects:
Partial effects: θj(X, q) = partialE(BARscale/X,q)partialXj
Where q is an unobserved random variable the unobserved heterogeneity.And then Average Partial Effects of say X1 would be:
δj(X1) ≡ Eq(θ(X1, q))
Given that the calculation of the average partial effects involves a two-step procedure where one first obtains the coefficients from the ordered probitestimation and then adjusts these, the standard errors in the second stageshould be adjusted for the first stage estimation. We here follow Papke andWoolridge (2008) and bootstrap standard errors sampling from the countrypairs using 500 replications. We include fixed times effects to capture yearlychanges that are the same for all riparian countries. The most relevant inthis context are common climatic trends, such as drought or heavy rainfall.
However, using this basic pooled ordered probit model does not allow forcorrelation between unobserved country-pair effects q and observed covari-ates X. Indeed our climatic variables particularly their shocks, are exoge-nous. But it could be that there are geographic time invariant features that
28
are correlated with cooperation and also climate. Just as these geographicfeatures might play a role in cooperate but also determine access to waterand therefore water availability. So we operate two main adjustments to ourbaseline setting by introducing unobserved country effects and controlling forpotential heteroskedaticity of the errors.
4.1 Extension to the baseline setting
It is not unfeasible to at least hypothesize that there are some unobserved(to the researcher) time invariant factors that could be correlated with ourcountry pair cooperation and our explanatory variables. In other words,while shocks to river flow are clearly exogenous, depending on local condi-tions and weather, there may be geographic features that are correlated withthe average river flow across country pairs and their tendency to cooperate.For example, the nature of the soil might determine the degree of transfer ofwater resources from upstream to downstream countries. But it could alsobe possible that soil quality might also determine whether countries are bothmainly agricultural producers and, perhaps, countries with similar economiesof production are on average more likely to cooperate. It is thus desirableto at least determine whether allowing for such time invariant unobservablesmight influence results. Assuming that such unobserved country pair specificeffects exist, the specification of the model changes as follows:
BARscale∗it = ξi +Xitβ + εit
with i=1,..,157 and t=1950,.., 2006.
In a linear model ξi could be eliminated by a first difference estimationor by a within-transformation. The ordered probit, instead, given its non-linear form, does not permit similar methods. One option might be to use arandom effects ordered probit model. However, this would assume that theunobserved time varying determinants of cooperation are not serially corre-lated. But it is easy to imagine that there might be some persistence in theunobserved time varying determinants of cooperation. What we do insteadis use a Mundlak transformation, i.e., we model the conditional distributionof such a term with respect to the covariates as:
εit = Xiγ + φit
29

where Xi is the average over time of the time varying exogenous vari-ables Xi and φit is a random error term with φit/Xi N(0, σ2
phi) . In essencethe Mundlak transformation entails including the average values of the timevarying explanatory variables in our main specification. One should notethat as long as the time varying explanatory variables are strictly exogenousthis is equivalent to fixed effects estimator. A test of γ = 0 constitutes a testthat the individual country pair effects are uncorrelated with the observables.
5 Regression results
As explained above, we chose our dependent variable to be the maximumBARscale obtained for each year by a same country pair. In cases whereupstream/downstream country pairs are involved in more than one event ina same year perhaps meaning they feel highly involved in shared water man-agement our dependent variable will take the highest value of the BARscaleattributed to this country pair in that year. To some extent, we can claimthat the results we obtain relate to events that are more representative ofsuccessful cooperation rather than conflictive one. Since a same country paircan be involved in different events in a same year and thus display differentBARscales, this means our dependent variable is representative of the most”successful” water events for that country pair and for that year. By ”suc-cessful” we could also say the ”least worse”: indeed if some country pairsonly display negative BARscales for a year - thus meaning that events havenot been successful at all - we will take the least negative BARscale as ourdependent variable.
Because we do not get significant results using minimum and extremeevents BARscales, it is difficult for us to claim anything about the role ofclimatic and hydrological variables regarding the most conflictive events inthe database. This study could therefore be further extended by includingother control variables such as geographical constraints for access to water,water pollution, hydropower, trade data, aid and financing programs, edu-cation, ethnical fractionalization, number of bordering countries, history ofcivil conflict, of colonial past, etc.
The first results we provide are obtained through an ordered probit addingMundlak terms, without and with controls. We provide the regression resultsfor a simple ordered probit in appendix C.
30

The next results provide a baseline for understanding the different kindsof effects our explanatory variables have on the intensity of cooperation be-tween country pairs, as defined by Wolf’s BARscale.
Table 5: Ordered probit including Mundlak terms without and with controls
R3 R4Upstream streamflow -0.0000269∗∗∗ (-3.74) -0.0000195∗∗∗ (-3.89)Downstream streamflow -0.0000152∗ (-2.56) -0.0000163∗∗∗ (-3.43)Upstream et -0.0212∗ (-2.25) -0.0303∗∗ (-3.26)Downstream et -0.0000458 (-0.01) 0.0112 (1.34)Upstream number of dams 0.000557∗∗ (2.82)Downstream number of dams 0.000144 (0.73)Upstream country population -0.00000215∗∗ (-2.63)Downstream country population 0.000000654 (1.03)Upstream real gdp 0.00000578 (0.71)Downstream real gdp -0.00000166 (-0.27)Lag history of events 0.00920 (1.15)N 6175 6175
t statistics in parentheses∗ p < 0.05, ∗∗ p < 0.01, ∗∗∗ p < 0.001
Here are the corresponding regressions for Table 5:(R3): ordered probit including Mundlak terms,using maximum barscale asdependent variable, and only upstream/downstream streamflow and evapo-transpiration as independent variables(R4): same as R3 but adding upstream/downstream control variables
About R3
R3 results show that upstream and downstream streamflow as well asupstream evapotranspiration parameters are quite significant and negativelycorrelated with maximum BARscale. The downstream evapotranspirationparameter on the other hand is not significant. This means that a de-crease/increase by 1 m3/s over the year in upstream streamflow will in-crease/decrease the maximum BARscale they obtain with regards to thedownstream counterpart by 0,0000269. This actually means that a decrease
31

or an increase by 37,174 m3/s in upstream streamflow would be necessary tomove the maximum BARscale by a point on the -6 to +6 range, which wouldrepresent in a second what would have been gained or lost in less than halfa day at the speed of 1 m3/s. Compared to the average value of upstreamstreamflow
The same reasoning for downstream streamflow will increase/decrease themaximum BARscale by 0,0000152. Also, an increase/decrease in upstreamevapotranspiration by 1 mm will decrease/increase maximum BARscale by0,0212 (a little less than 0,5% on the BARscale).
So here in other words, a more comfortable position regarding quanti-ties of water upstream/downstream is correlated with less successful wa-ter events. Conversely it means that lower levels of upstream/downstreamstreamflow will be correlated with more successful levels of cooperation. Re-garding evapotranspiration, higher values are associated with a higher rate ofwater absorption into the air, thus drying the soils. So better conditions foragriculture upstream will be associated with more successful water events.Harsh years for the soils will correlate with less successful ones.
Understanding why we obtain such results requires acknowledgement ofthe geographical asymmetry induced by the upstream/downstream relation-ship. When upstream and downstream streamflow parameters are negative,they are so for different reasons. Indeed, because higher streamflow meansaccess to higher quantities of water, it is desirable for both upstream anddownstream countries. Nevertheless, higher values of streamflow increasedownstream vulnerability regarding the quality of the water they receivesince it has already ”ran through” the upstream counterpart. Bear also inmind that downstream quantity of streamflow is subject to alterations by theupstream country through water retention or storage.
The results for the upstream streamflow are only partly intuitive: highquantities of water induce high potential for agricultural, industrial and civiluse and make cooperative agreement over the quantity of water with thedownstream counterpart much less attractive. Indeed, if upstream stream-flow increased over a period of time, the downstream country could ask forspecific clauses over quantity of water likely to be declined or negotiatedby the upstream country – thus lowering the BARscale should a coopera-tive agreement even take place. On the other hand, a decrease in upstreamstreamflow does not intuitively lead to an increase in the BARscale. Onewould think that with the country would use its natural advantage over thedownstream country to refuse/slow down negotiations or cooperation thus
32
leading to a less successful ”grade” of the event. This led us to think thatperhaps there was a non-linear effect of streamflow on the BARscale. Wechecked for that by including a squared term for streamflow upstream andthe parameter turned out to be insignificant. We thus come up with the fol-lowing interpretation of the results: a decrease in upstream streamflow willinduce two things: 1) less disagreements over the very controversial issue ofwater quantity with the downstream country and 2) perhaps increased effortsto cooperate with the downstream country to offset this loss in streamflowand make an efficient use of it. Both effects would eventually increase thesuccess of cooperation and so the BARscale.
Reasoning is similar for the downstream streamflow negative parameters:all factors held constant, a decrease in downstream streamflow emphasizesthe already vulnerable position it holds regarding the upstream country, thusincreasing willingness and efforts to achieve successful cooperation. It feelsnevertheless that a downstream country should always be willing to coop-erate but our results show that an increase in downstream streamflow willdecrease the BARscale. This first lies in the positive externalities that em-anate from higher streamflow. If used properly, higher quantities of watercan foster hydropower, agricultural and industrial activities thus temporarilyoffsetting the downstream dependency towards the upstream counterpart. Itseems the downstream country temporarily has satisfaction over an essentialvariable regarding water and thus can 1) afford to haggle over other waterissues and 2) benefit from positive externalities due to the increased stream-flow that temporarily divert the aim of cooperation. Also, as downstreamcountries are by nature constrained in their position relative to that of theupstream country, they have two options: be highly cooperative or highly ag-gressive. In that sense, Egypt as the most downstream country of the basinhas used its economic superiority to impose its conditions on the use of theNile waters without giving way to cooperation. Higher streamflow correlatedwith decreasing BARscale values might be linked to this idea.
Note that the parameter for upstream streamflow has a higher value thandownstream streamflow: variations in streamflow upstream have a higherimpact on maximum BARscale than downstream. This vindicates the ideathat the upstream country has a higher leverage regarding cooperation andthat as it is affected by such variations, its own commitment will have ahigher impact on cooperation than that of the downstream counterpart. Ina way, cooperation is likely to be more successful if the upstream countryreally wants it.
33
Higher values of upstream evapotranspiration will equally divert countriesfrom cooperating with their downstream counterpart. Increasing evaporativedemand of the air within a basin will create local/regional/national issues inagriculture that cannot obviously be offset by agreements with a downstreamcounterpart. Indeed, cooperative agreements are costly and require time thatare not necessarily available when dealing with economic issues. Upstreamcountries might thus be less inclined considering downstream’s counterpartsdemand, thus lowering the BARscale of the event, should it actually takeplace. On the other hand, lower upstream evapotranspiration, meaning bet-ter prospects for the quality of soils and crops is likely to enhance economicperformances and water uses in the country thus giving more schedule andwillingness for cooperation.
The insignificance of the downstream evapotranspiration parameter andthe low level of significance (10%) of the upstream one recall our intuitionthat upstream variations will matter more for successful cooperation thandownstream ones. Here, as evapotranspiration is hardly significant, we canexpect downstream evapotranspiration not to be significant at all. Again,evapotranspiration is a local phenomenon that is hard to offset by simplycooperating with an upstream/downstream counterpart.
Nevertheless, it is intuitive to think that many other factors affect co-operation: we mentioned that higher streamflow should be ”used properly”by the downstream country, such a use being highly dependent on economicfactors for instance.
About R4
Adding controls actually reinforces the significance of our first three in-dependent variables, upstream/downstream streamflow and upstream evap-otranspiration. The lagged number of upstream dams is significant and pos-itively correlated with maximum BARscale while the upstream country pop-ulation is significant but negatively correlated with maximum BARscale.
While upstream streamflow stays highly statistically significant but withless magnitude, downstream streamflow becomes highly significant contraryto R3. Upstream evapotranspiration becomes more significant as well, whiledownstream evapotranspiration stays insignificant. Adding controls thus in-creases the negative correlation between downstream streamflow and maxi-mum BARscale, leaving to understand that streamflow - quantity of wateravailable - is an essential variable for the outcome of cooperation, both up-
34
stream and downstream.The fact that an additional dam built upstream in a transboundary water
basin raises maximum BARscale by 0.000557 is consistent with the ideathat important infrastructures upstream automatically affect downstreamcountries, thus fostering the imperative for a successful cooperation. Indeed,international laws do not compel countries to individually obtain approvalfor the building of the dams - but regional agreements do and the building ofdams is either part or at the origins of (successful) cooperative agreements.Also, dams may be beneficial for the downstream counterpart when theycan allow for flood control - in which case the outcome of cooperation maybe a good one. This result actually shows that it is no case beneficial tothe upstream country to isolate itself from the transboundary community inbuilding a dam. Economic and political incentives just as general harmonywithin the region are essential components that no country could do without.
The fact that upstream country population is negatively correlated withmaximum BARscale is also fairly intuitive: a higher population requireshigher local needs in terms of individual, agricultural and industrial waterconsumption. Again, because of the upstream country’s geographical up-hand, a higher population naturally reduces commitment to cooperation withthe downstream country. A higher population also increases the likelinessof having to content numerous local institutions, thus making it harder tofind common grounds prior to a cooperative agreement with the downstreamcounterpart, and lowering the maximum BARscale.
So here, downstream number of dams, downstream country population,upstream/downstream real gdp and history of events for the country pairare not statistically significant in our model. Downstream number of damsis hardly likely to be an issue for the upstream counterpart, thus the ab-sence of correlation with the intensity of any kind of cooperation betweenthe two countries. Downstream country population could have had somekind of impact on the country’s needs for water and thus increase impetusand compromises for cooperation. Our results show no such thing, leading tobelieve that the mechanisms underlying the willingness to cooperate down-stream work differently: because the downstream position is considered asvulnerable, it seems efforts to cooperate would be maintained all year long.In that sense, the more or less constant rise in population is not enough of ashock to truly correlated and perhaps foster cooperation with the upstreamcountry. Now past history of events is not significant for the success of co-operation for a specific year.
35
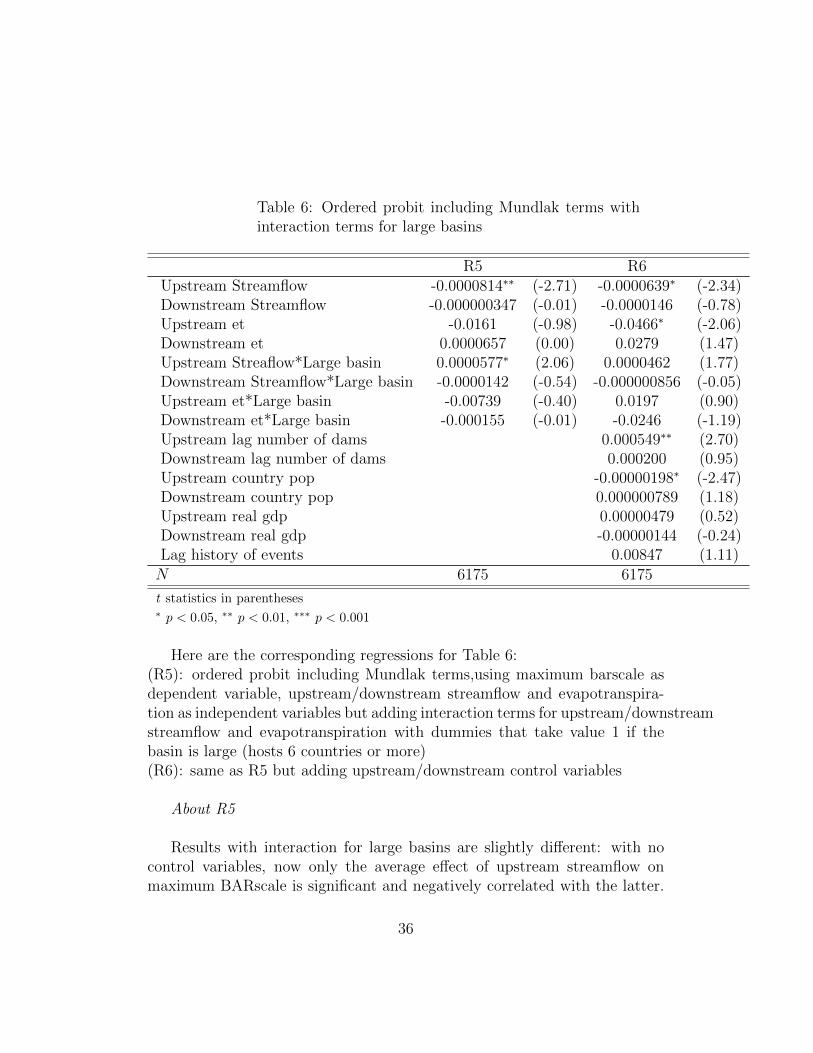
Table 6: Ordered probit including Mundlak terms withinteraction terms for large basins
R5 R6Upstream Streamflow -0.0000814∗∗ (-2.71) -0.0000639∗ (-2.34)Downstream Streamflow -0.000000347 (-0.01) -0.0000146 (-0.78)Upstream et -0.0161 (-0.98) -0.0466∗ (-2.06)Downstream et 0.0000657 (0.00) 0.0279 (1.47)Upstream Streaflow*Large basin 0.0000577∗ (2.06) 0.0000462 (1.77)Downstream Streamflow*Large basin -0.0000142 (-0.54) -0.000000856 (-0.05)Upstream et*Large basin -0.00739 (-0.40) 0.0197 (0.90)Downstream et*Large basin -0.000155 (-0.01) -0.0246 (-1.19)Upstream lag number of dams 0.000549∗∗ (2.70)Downstream lag number of dams 0.000200 (0.95)Upstream country pop -0.00000198∗ (-2.47)Downstream country pop 0.000000789 (1.18)Upstream real gdp 0.00000479 (0.52)Downstream real gdp -0.00000144 (-0.24)Lag history of events 0.00847 (1.11)N 6175 6175
t statistics in parentheses∗ p < 0.05, ∗∗ p < 0.01, ∗∗∗ p < 0.001
Here are the corresponding regressions for Table 6:(R5): ordered probit including Mundlak terms,using maximum barscale asdependent variable, upstream/downstream streamflow and evapotranspira-tion as independent variables but adding interaction terms for upstream/downstreamstreamflow and evapotranspiration with dummies that take value 1 if thebasin is large (hosts 6 countries or more)(R6): same as R5 but adding upstream/downstream control variables
About R5
Results with interaction for large basins are slightly different: with nocontrol variables, now only the average effect of upstream streamflow onmaximum BARscale is significant and negatively correlated with the latter.
36

The interaction term between upstream streamflow and large basin actuallygives us the marginal effect of upstream streamflow on maximum BARscaledue to the large basin. Since it is significant and positive, this means thatthere is an additional effect of upstream streamflow on maximum BARscalein large basins that is positive. But the total effect of upstream streamflow forlarge basins is the sum of the coefficient of the average effect plus the marginaleffect which is overall negative (-0,000814+0,0000577 = -0,0007563).
So the average effect matches our previous results as upstream streamflowis negatively correlated with maximum BARscale. The new element is theadditional positive effect for large basins: as upstream streamflow increases,it will to some extent increase the BARscale. Indeed, as the number ofcountries that share a basin increase, chances are the issues and concernsat stake become more numerous as well, making it harder to find commongrounds. Because streamflow upstream seems to be an important componentfor cooperation, it will become one of the main concerns, overriding the otherfactors. As upstream streamflow increases, the country concerned will facea higher number of downstream counterparts making cooperation harder toachieve, but leaving the increased streamflow a central part in enhancingcooperation. Conversely, a decrease in upstream streamflow would makethe country less enclined to accept all of the others’ demands, thus makingcooperation less successful, as judged by Wolf and his team.
This result is to consider relative to the findings of Domobrowsky (2007)that cooperation between many parties is harder to achieve than for a smallergroup, thus giving priority to a restrained number of issues at stake withinthe cooperation.
Evapotranspiration upstream and downstream lose all significancy, em-phasizing the very local role of temperature and drought.
About R6
Adding controls, upstream streamflow remains significant for small andlarge basins (though at a lower level) while the marginal effect of upstreamstreamflow for large basins becomes insignificant. On the other hand, up-stream evapotranspiration for small and large becomes slightly significant.Upstream number of dams takes on high significance, just like before, andupstream population as well.
37

Table 7: Ordered probit including Mundlak terms withinteraction terms for bordering countries
R7 R8Upstream streamflow -0.0000294∗∗∗ (-3.98) -0.0000101 (-1.67)Downstream streamflow -0.0000225∗ (-2.48) -0.00000775 (-1.05)Upstream et -0.0401∗∗ (-2.96) -0.0154 (-1.20)Downstream et 0.0253 (1.96) 0.00921 (0.74)Upstream streamflow*bordering country 0.0000170 (0.99) 0.00000862 (0.53)Downstream streamflow*bordering country 0.00000864 (0.76) -9.75e-08 (-0.01)Upstream et*bordering country 0.0278 (1.83) 0.00292 (0.22)Downstream et*bordering country -0.0307 (-1.90) -0.00397 (-0.28)Upstream lag number of dams 0.000257 (1.20)Downstream lag number of dams 0.0000611 (0.32)Upstream country pop -0.000000953 (-1.13)Downstream country pop 0.000000264 (0.38)Upstream real gdp 0.00000321 (0.39)Downstream real gdp -0.000000987 (-0.17)Lag history of events 0.00414 (0.51)N 6175 6175
t statistics in parentheses∗ p < 0.05, ∗∗ p < 0.01, ∗∗∗ p < 0.001
Here are the corresponding regressions for Table 7:(R7): ordered probit including Mundlak terms,using maximum barscale asdependent variable, upstream/downstream streamflow and evapotranspira-tion as independent variables but adding interaction terms for upstream/downstreamstreamflow and evapotranspiration with dummies that take value 1 if thecountry-pair countries share a border (hosts 6 countries or more).(R8): same as R7 but adding upstream/downstream control variables.
About R7
So upstream streamflow is as usual highly significant and negatively cor-related with maximum BARscale for every upstream-downstream couple,sharing a border or not. Downstream streamflow is significant and nega-tively correlated, just as upstream evapotranspiration, recalling our previous
38
results. But here, we see that there is no marginal effect of our variables dueto a common border for the country pair.
About R8
None of our variables are statistically significant right now when con-sidering marginal effects for neighboring countries and adding our controlvariables.
6 Conclusion
The complexity of understanding what leads two riparian countries to cooper-ate or enter conflict over water lies in multidisciplinary approaches. Politicaland economic incentives will respond to each other as they interact with cli-mate, geography, culture and history. Isolating the effects of these featuresbecomes difficult, as no country will interact the same way with each of itsriparian counterparts. It is also an issue of choosing what kind of data toapply and find the right unit of study in order for them to provide results ofinterest.
In this study, we try to determine if two of many variables that captureclimate have facilitated such cooperation or conflict between 1950 and 2006.We limit ourselves to streamflow and evapotranspiration as such, and onlyobserve riparian country pairs that feature a clear upstream versus down-stream relationship. This introduces a natural asymmetry within the countrypairs and enables us to obtain significant results. Using maximum BARscale- which is more representative of cooperative than conflictive water eventsas our dependent variable, we perform an ordered probit and add Mundlakterms allowing for correlation between unobservable factors and our covari-ates. Our results show mainly three things:
1. Streamflow and evapotranspiration work in opposite ways in enhancingcooperation: while a decrease in streamflow seems to deviate focus froma successful cooperation, a decrease in streamflow will actually enhanceit. Indeed, streamflow is the exogenous variable that is shared by bothcountries of the country pair while weather is local.
2. Cooperative agreements are more sensitive to upstream variations ofweather and streamflow, thus leading to believe that the upstream
39
country actually does make use of its geographical advantage. Co-operation is likely to be more successful when the upstream countryexperiences a shock in temperature or streamflow.
3. However, as the number of dams upstream increase thus the increasingthe downstream country’s need for cooperation, it seems the upstreamcounterpart responds well showing that other economic and politicalfactors as well as overall harmony in the management of the basinremain important factors.
4. Downstream countries are more constrained by geography and in theupstream/downstream country pair relationship, cooperation will beless sensitive to downstream streamflow and evapotranspiration thuscompelling the downstream country to rely on other - more likely en-dogenous factors - to achieve its goals.
The implications of this study are that endogenous factors should beput forward to lead cooperation and not be overridden by exogenousfactors that are out of reach. Leaving cooperation to correlate too muchwith variations in weather or streamflow is not a strong nor a lasting ba-sis for economic and/or political alliances and benefits. Transboundarywater management is bound to be constrained by geographical features,but natural asymmetries used as leverage in cooperation will lead tounbalanced schemes.
Finally, this study could and should be completed in many ways. Firstof all, there are important facts hard to come by: who initiated the co-operation and in the long-term, what was the true outcome of a ”good”or a ”bad”-scaled event? Also, the part of GDP attributed to water isa critical element in how countries. Consider as well that downstreamcountries can be upstream countries and this should be controlled for.Last but not least, one should consider general geolocalization of acountry within the African continent. Indeed, economic asymmetriesbetween non-riparian countries are important in determining ripariansbehavior towards each other. Foreign help and direct investments playan important role in building African water and energy infrastructuresand should not be overlooked. Furthermore, the relationships we foundbetween climatic/hydrological variables and BARscale can be of use forclimate change scenarios.
40

Appendices
A BARscale as described in Wolf’s database
BARscale Event Description-6 Extensive War Acts causing deaths, dislocation or high strategic
cost: Use of nuclear weapons; full scale air, naval, or land battles;invasion of territory; occupation of territory; massive bombing ofcivilian areas; capturing of soldiers in battle; large scale bombingof military installations; chemical or biological warfare.
-5 Small scale military acts: Limited air, sea, or border skirmishes;border police acts; annexing territory already occupied; seizing ma-terial of target country; imposing blockades; assassinating leadersof target country; material support of subversive activities againsttarget country.
-4 Political-military hostile actions: Inciting riots or rebellions(training or financial aid for rebellions); encouraging guerilla activ-ities against target country; limited and sporadic terrorist actions;kidnapping or torturing foreign citizens or prisoners of war; giv-ing sanctuary to terrorists; breaking diplomatic relations; attack-ing diplomats or embassies; expelling military advisors; executingalleged spies; nationalizing companies without compensation.
-3 Diplomatic-economic hostile actions: Increasing troop mobi-lization; boycotts; imposing economic sanctions; hindering move-ment on land, waterways, or in the air; embargoing goods; refusingmutual trade rights; closing borders and blocking free communica-tion; manipulating trade or currency to cause economic problems;halting aid; granting sanctuary to opposition leaders; mobilizinghostile demonstrations against target country; refusing to supportforeign military allies; recalling ambassador for emergency consul-tations regarding target country; refusing visas to other nationalsor restricting movement in country; expelling or arresting nationalsor press; spying on foreign government officials; terminating majoragreements. Unilateral construction of water projects against an-other countrys protests; reducing flow of water to another country,abrogation of a water agreement.
41

-2 Strong verbal expressions displaying hostility in interac-tion: Warning retaliation for acts; making threatening demandsand accusations; condemning strongly specific actions or policies;denouncing leaders, system, or ideology; postponing heads of statevisits; refusing participation in meetings or summits; leveling strongpropaganda attacks; denying support; blocking or vetoing policy orproposals in the UN or other international bodies. Official interac-tions only.
-1 Mild verbal expressions displaying discord in interac-tion:Low key objection to policies or behavior; communicating dis-satisfaction through third party; failing to reach an agreement; re-fusing protest note; denying accusations; objecting to explanationof goals, position, etc.; requesting change in policy. Both unofficialand official, including diplomatic notes of protest.
0 Neutral or non-significant acts for the inter-nation situa-tion: Rhetorical policy statements; non-consequential news items;non-governmental visitors; indifference statements; compensatingfor nationalized enterprises or private property; no comment state-ments.
1 Minor official exchanges, talks or policy expressions– mildverbal support: Meeting of high officials; conferring on problemsof mutual interest; visit by lower officials for talks; issuing jointcommuniqus; appointing ambassadors; announcing cease-fires; non-governmental exchanges; proposing talks; public non-governmentalsupport of regime; exchanging prisoners of war; requesting supportfor policy; stating or explaining policy.
2 Official verbal support of goals, values, or regime: Officialsupport of policy; raising legation to embassy; reaffirming friend-ship; asking for help against third party; apologizing for unfavor-able actions or statements; allowing entry of press correspondents;thanking or asking for aid; resuming broken diplomatic or otherrelations.
42

3 Cultural or scientific agreement or support (non- strate-gic): Starting diplomatic relations; establishing technological orscientific communication; proposing or offering economic or mili-tary aid; recognizing government; visit by head of state; openingborders; conducting or enacting friendship agreements; conductingcultural or academic agreements or exchanges. Agreements to setup cooperative working groups.
4 Non-military economic, technological or industrial agree-ment: Making economic loans, grants; agreeing to economic pacts;giving industrial, cultural, or educational assistance; conductingtrade agreements or granting most favored nation status; estab-lishing common transportation or communication networks; sellingindustrial- technological surplus supplies; providing technical ex-pertise; ceasing economic restrictions; repaying debts; selling non-military goods; giving disaster relief. Legal, cooperative actionsbetween nations that are not treaties; cooperative projects for wa-tershed management, irrigation, poverty-alleviation.
5 Military economic or strategic support: Selling nuclear powerplants or materials; providing air, naval, or land facilities for bases;giving technical or advisory military assistance; granting militaryaid; sharing highly advanced technology; intervening with militarysupport at request of government; concluding military agreements;training military personnel; joint programs and plans to initiateand pursue disarmament.
6 International Freshwater Treaty; Major strategic alliance (re-gional or international): Fighting a war jointly; establishing a jointmilitary command or alliance; conducting joint military maneuvers;establishing economic common market; joining or organizing inter-national alliances; establishing joint program to raise the globalquality of life.
43
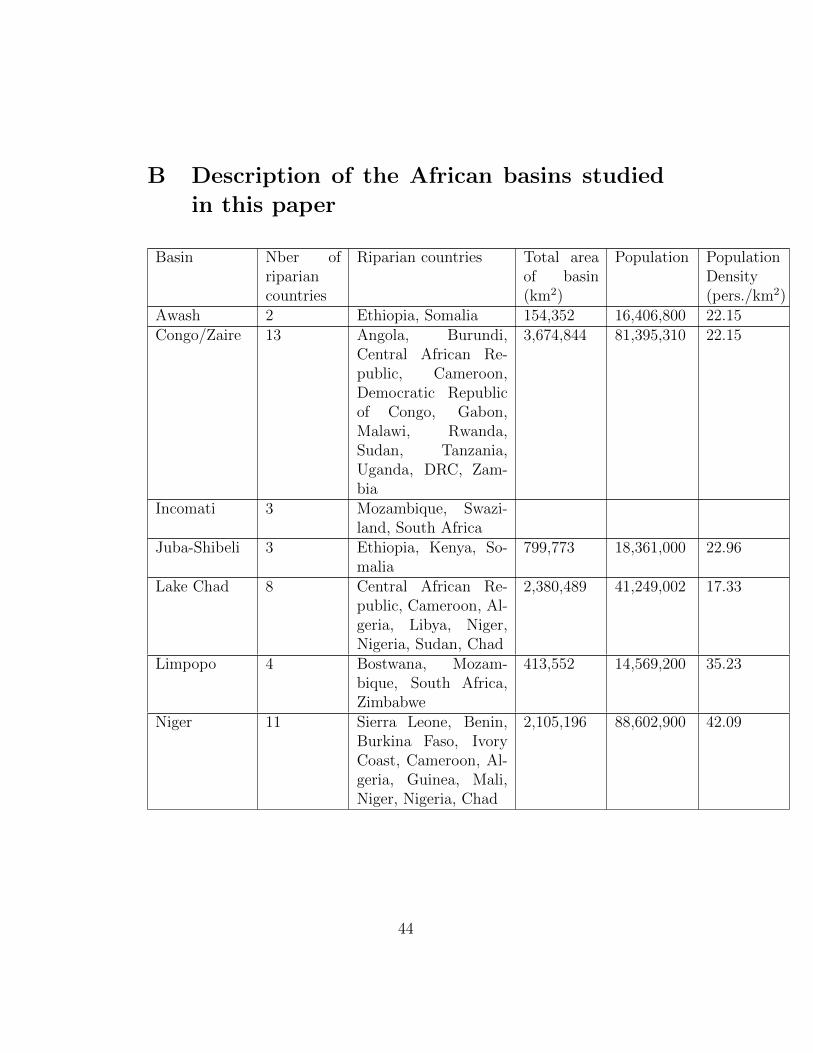
B Description of the African basins studied
in this paper
Basin Nber ofripariancountries
Riparian countries Total areaof basin(km2)
Population PopulationDensity(pers./km2)
Awash 2 Ethiopia, Somalia 154,352 16,406,800 22.15Congo/Zaire 13 Angola, Burundi,
Central African Re-public, Cameroon,Democratic Republicof Congo, Gabon,Malawi, Rwanda,Sudan, Tanzania,Uganda, DRC, Zam-bia
3,674,844 81,395,310 22.15
Incomati 3 Mozambique, Swazi-land, South Africa
Juba-Shibeli 3 Ethiopia, Kenya, So-malia
799,773 18,361,000 22.96
Lake Chad 8 Central African Re-public, Cameroon, Al-geria, Libya, Niger,Nigeria, Sudan, Chad
2,380,489 41,249,002 17.33
Limpopo 4 Bostwana, Mozam-bique, South Africa,Zimbabwe
413,552 14,569,200 35.23
Niger 11 Sierra Leone, Benin,Burkina Faso, IvoryCoast, Cameroon, Al-geria, Guinea, Mali,Niger, Nigeria, Chad
2,105,196 88,602,900 42.09
44
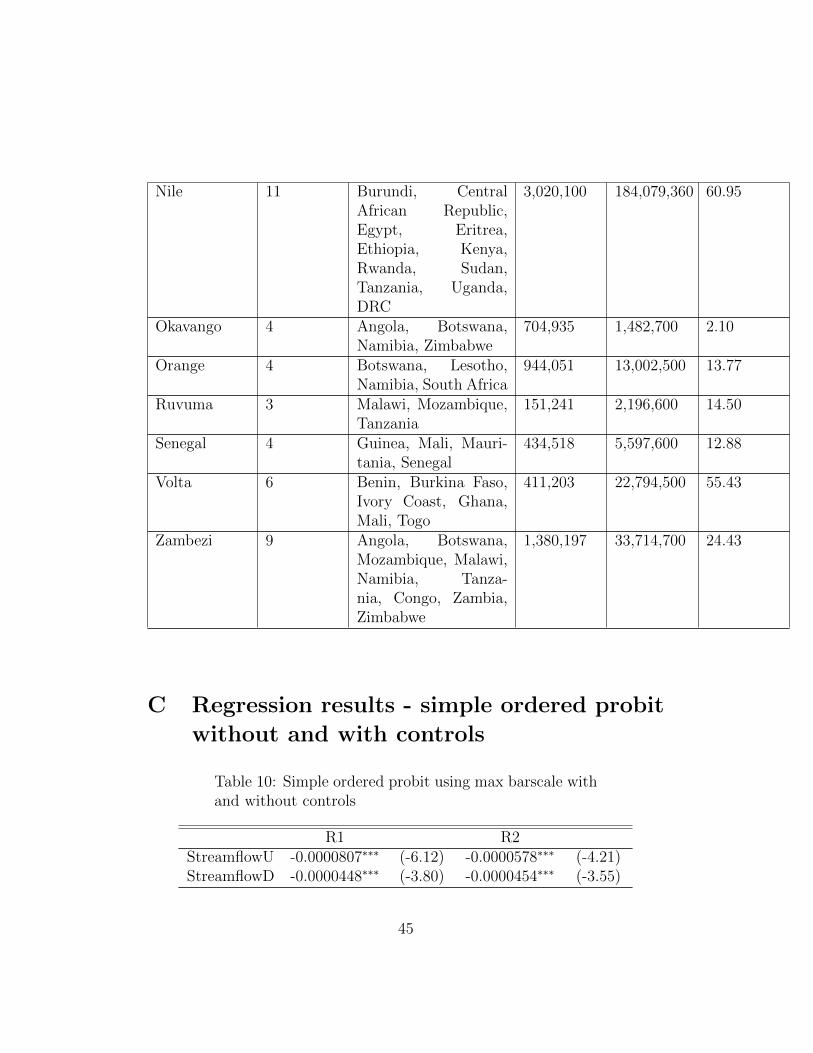
Nile 11 Burundi, CentralAfrican Republic,Egypt, Eritrea,Ethiopia, Kenya,Rwanda, Sudan,Tanzania, Uganda,DRC
3,020,100 184,079,360 60.95
Okavango 4 Angola, Botswana,Namibia, Zimbabwe
704,935 1,482,700 2.10
Orange 4 Botswana, Lesotho,Namibia, South Africa
944,051 13,002,500 13.77
Ruvuma 3 Malawi, Mozambique,Tanzania
151,241 2,196,600 14.50
Senegal 4 Guinea, Mali, Mauri-tania, Senegal
434,518 5,597,600 12.88
Volta 6 Benin, Burkina Faso,Ivory Coast, Ghana,Mali, Togo
411,203 22,794,500 55.43
Zambezi 9 Angola, Botswana,Mozambique, Malawi,Namibia, Tanza-nia, Congo, Zambia,Zimbabwe
1,380,197 33,714,700 24.43
C Regression results - simple ordered probit
without and with controls
Table 10: Simple ordered probit using max barscale withand without controls
R1 R2StreamflowU -0.0000807∗∗∗ (-6.12) -0.0000578∗∗∗ (-4.21)StreamflowD -0.0000448∗∗∗ (-3.80) -0.0000454∗∗∗ (-3.55)
45

etU -0.0586∗∗ (-3.19) -0.0675∗∗∗ (-3.37)etD 0.00289 (0.16) 0.0265 (1.32)DAMU 0.00157∗∗∗ (4.62)DAMD 0.000665 (1.85)popU -0.00000278 (-1.92)popD 0.00000434∗∗∗ (3.57)lag history 0.0469∗∗∗ (9.40)cut1 -4.467∗∗∗ (-14.29) -4.115∗∗∗ (-12.51)cut2 -3.873∗∗∗ (-17.98) -3.526∗∗∗ (-15.19)cut3 -3.763∗∗∗ (-17.91) -3.424∗∗∗ (-15.03)cut4 0.671∗∗∗ (3.71) 1.047∗∗∗ (5.12)cut5 0.843∗∗∗ (4.66) 1.233∗∗∗ (6.03)cut6 0.875∗∗∗ (4.84) 1.267∗∗∗ (6.19)cut7 0.935∗∗∗ (5.16) 1.331∗∗∗ (6.50)cut8 1.227∗∗∗ (6.73) 1.630∗∗∗ (7.91)cut9 1.243∗∗∗ (6.81) 1.645∗∗∗ (7.98)N 6316 6175
t statistics in parentheses∗ p < 0.05, ∗∗ p < 0.01, ∗∗∗ p < 0.001
Here are the corresponding regressions for Table 6:(R1): simple ordered probit using maximum barscale as dependent variable,and only upstream/downstream streamflow and evapotranspiration as inde-pendent variables(R2): same as R1 but adding upstream/downstream control variables
46

References
[1] S. Ambec and A. Dinar. Hot stuff: Would climate change alter trans-boundary water sharing treaties? IDEI Working Papers, 2010.
[2] S. Ambec and L. Ehlers. Cooperation and equity in the river sharingproblem. Game theory and policy making in natural resources and theenvironment, 2008.
[3] E.B. Barbier. Upstream dams and downstream water allocation: thecase of the hadejia-jama’are floodplain, northern nigeria. Water re-sources research, 39(11):1311–1319, 2003.
[4] A. Bhaduri and E.B. Barbier. Political altruism of transboundary watersharing. The BE Journal of Economic Analysis & Policy, 8(1):32, 2008.
[5] Anik Bhaduri, Utpal Manna, Edward B. Barbier, and Jens Liebe. Coop-eration in transboundary water sharing under climate change. Discus-sion Papers 51303, University of Bonn, Center for Development Research(ZEF), June 2009.
[6] S. Dinar. International water treaties: Negotiation and cooperation alongtransboundary rivers, volume 72. Psychology Press, 2008.
[7] I. Dombrowsky. Benefit-sharing in transboundary water managementthrough intra-water sector issue linkage? On the Water Front, page 25.
[8] I. Dombrowsky. Conflict, cooperation and institutions in internationalwater management: an economic analysis. Edward Elgar Pub, 2007.
[9] Ernest Sergenti Edward Miguel, Shanker Satyanath. Economic shocksand civil conflict: An instrumental variables approach. Journal of Po-litical Economy, 112(4):725–753, 2004.
[10] M.K. Graversen. Regulating water extraction in a river basin withupstream-downstream communities. FOI Working Paper, 2011.
[11] C.S. Hendrix and S.M. Glaser. Trends and triggers: Climate, climatechange and civil conflict in sub-saharan africa. Political geography,26(6):695–715, 2007.
47
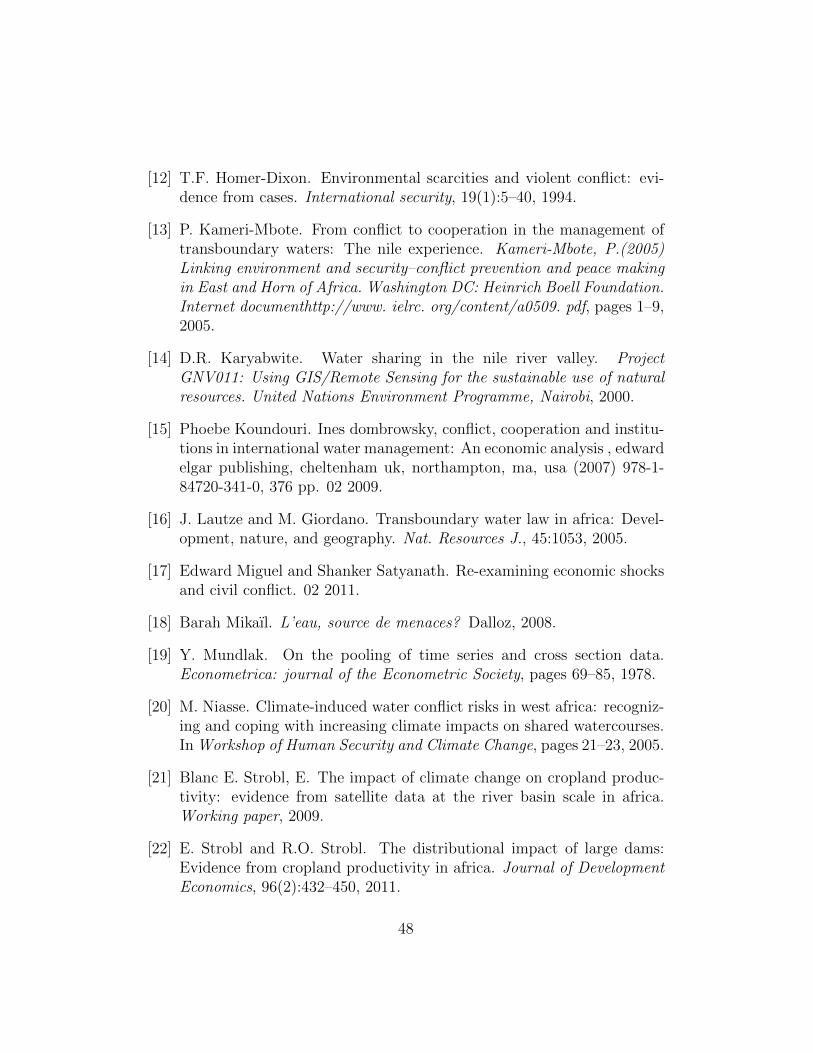
[12] T.F. Homer-Dixon. Environmental scarcities and violent conflict: evi-dence from cases. International security, 19(1):5–40, 1994.
[13] P. Kameri-Mbote. From conflict to cooperation in the management oftransboundary waters: The nile experience. Kameri-Mbote, P.(2005)Linking environment and security–conflict prevention and peace makingin East and Horn of Africa. Washington DC: Heinrich Boell Foundation.Internet documenthttp://www. ielrc. org/content/a0509. pdf, pages 1–9,2005.
[14] D.R. Karyabwite. Water sharing in the nile river valley. ProjectGNV011: Using GIS/Remote Sensing for the sustainable use of naturalresources. United Nations Environment Programme, Nairobi, 2000.
[15] Phoebe Koundouri. Ines dombrowsky, conflict, cooperation and institu-tions in international water management: An economic analysis , edwardelgar publishing, cheltenham uk, northampton, ma, usa (2007) 978-1-84720-341-0, 376 pp. 02 2009.
[16] J. Lautze and M. Giordano. Transboundary water law in africa: Devel-opment, nature, and geography. Nat. Resources J., 45:1053, 2005.
[17] Edward Miguel and Shanker Satyanath. Re-examining economic shocksand civil conflict. 02 2011.
[18] Barah Mikaıl. L’eau, source de menaces? Dalloz, 2008.
[19] Y. Mundlak. On the pooling of time series and cross section data.Econometrica: journal of the Econometric Society, pages 69–85, 1978.
[20] M. Niasse. Climate-induced water conflict risks in west africa: recogniz-ing and coping with increasing climate impacts on shared watercourses.In Workshop of Human Security and Climate Change, pages 21–23, 2005.
[21] Blanc E. Strobl, E. The impact of climate change on cropland produc-tivity: evidence from satellite data at the river basin scale in africa.Working paper, 2009.
[22] E. Strobl and R.O. Strobl. The distributional impact of large dams:Evidence from cropland productivity in africa. Journal of DevelopmentEconomics, 96(2):432–450, 2011.
48
[23] A.R. Turton. Water as a source of conflict or cooperation: the case ofsouth africa and its transboundary rivers. CSIR Report, pages 2005–002,2005.
[24] J.I. Uitto and A.M. Duda. Management of transboundary water re-sources: lessons from international cooperation for conflict prevention.The Geographical Journal, 168(4):365–378, 2002.
[25] D. Whittington, X. Wu, and C. Sadoff. Water resources managementin the nile basin: the economic value of cooperation. Water Policy,7(3):227–252, 2005.
[26] J.M. Wooldridge. Correlated random effects models with unbalancedpanels. Manuscript (version July 2009) Michigan State University, 2009.
[27] X. Wu and D. Whittington. Incentive compatibility and conflict resolu-tion in international river basins: A case study of the nile basin. Waterresources research, 42(2):W02417, 2006.
[28] S. Yoffe, A.T. Wolf, and M. Giordano. Conflict and cooperation overinternational freshwater resources: Indicators of basins at risr1. JAWRAJournal of the American Water Resources Association, 39(5):1109–1126,2003.
49