Cookson Group plc Annual Report 2004 - … · futuristic spherical building is constructed from...
86
Cookson Group plc Annual Report 2004 Around your world
Transcript of Cookson Group plc Annual Report 2004 - … · futuristic spherical building is constructed from...
Cookson Group plc Annual Report 2004
Around your world
COOKSON WE ARE A LEADING MATERIALS SCIENCE
COMPANY SUPPLYING PRODUCTS AND
SERVICES TO CUSTOMERS WORLDWIDE.
OUR OPERATIONS ARE FORMED INTO THREE
DIV IS IONS – CERAMICS, ELECTRONICS AND
PRECIOUS METALS.
WE AIM TO ADD VALUE TO OUR CUSTOMERS’
BUSINESSES BY PROVIDING MATERIALS,
PROCESSES AND SERVICES THAT ALLOW
THEM TO INCREASE THE EFFICIENCY, QUALITY
AND PRODUCTIV ITY OF THEIR OPERATIONS.
THROUGHOUT THE WORLD, COOKSON
COMPANIES ARE KNOWN FOR SUPPLYING
PRODUCTS THAT REPRESENT THE BEST
TECHNOLOGY, SUPPORTED BY THE BEST
TECHNICAL SERVICE.
YOU MAY BE SURPRISED WHERE OUR
PRODUCTS ARE FOUND AROUND YOUR WORLD.

Mobile phone (Electronics) Products from all threesectors of the division are used in the production of“smaller, faster, lighter” electronic devices such asmobile phones.
Architectural glass (Ceramics) Glass production andtreatment processes both use the refractory productsproduced by the Ceramics division’s Glass sector,including furnace refractories, tin bath blocks andtempering rollers.
2
1 Taxi door trim (Electronics) It may look like metal butmany shiny automobile components like the trim onthis cab door are in fact plated plastic. The Chemistrysector of the Electronics division provides metallic platingsolutions for a wide range of automotive applications.
MP3 player (Electronics) Sophisticated consumerelectronic products such as MP3 players require the advanced electronic materials supplied by theElectronics division. Consumer electronics are drivingthe global electronics industry to an increasing degree.
4
3
2
3
1
5
4

Skyscrapers (Ceramics) At the core of this skyscraperis a steel shell. The Ceramics division is the world’sleading supplier of advanced refractory products to the steel industry.
Trash can (Ceramics) Governments all over the worldare seeking to reduce the impact of landfills by requiringthe incineration of waste; the Ceramics division producessilicon carbide tiles used to line waste incinerators.
6
5 Jewellery (Precious Metals) New York is a citysynonymous with the jewellery industry, think Tiffany of Fifth Avenue and the exclusive boutiques of MadisonAvenue. Cookson Precious Metals supplies designerjewellers, mass market retailers and high street stores.
Digital camera (Electronics) Over 50 million digitalcameras were sold worldwide in 2004. Ever increasingspecifications demand higher performance materialsfrom suppliers such as Cookson’s Electronics division.
8
7
86
7

Laptops (Electronics) Laptop computers need maximumprocessing power in minimum space which leads tosignificant heat generation. Cookson’s materials work to counteract the effects of this heat to protect both the machine and the user.
Concrete buildings (Ceramics) The Industrial Processessector provides refractories to a myriad of applications,including the cement industry from which the concreteused in building construction is made.
2
1 Vehicles (Ceramics and Electronics) Cars and buses are manufactured from automotive grade steel, one of the highest quality and thinnest grades of steel. It is mainly produced using the continuouscasting process which is facilitated by the flow controlrefractory products supplied by Cookson’s Ceramicsdivision. In the Electronics division, automotive electronicsare becoming increasingly important as the number ofelectronic devices found in vehicles continues to grow.
3
4
2
1
3

Mobile phone (Electronics) Mobile phone sales grewby 19% in Asia-Pacific in 2004, with over 60% of all unitssold in China. Amongst Cookson Electronics’ customersare the leading foreign and local manufacturers of mobilephones in the region.
Jewellery (Precious Metals) Cookson Precious Metalsis a leading supplier of fabricated precious metals to thejewellery industry. Each year, we process over 750 tonnesof metal including gold, silver and platinum.
5
4 Matro Shopping Mall, Shanghai (Ceramics) Thisfuturistic spherical building is constructed from steel andglass, industries which use over 75% of the Ceramicsdivision’s products.
Bluetooth headset (Electronics) The Electronicsdivision provides materials to Bluetooth and many other wireless applications.
Car wheels (Electronics and Ceramics) The plating ofaluminium car wheels in China was a particular successstory for the Electronics division’s Chemistry sector in2004. In addition, the Ceramics division’s Foundry sectorintroduced new products in 2004 which are used in themanufacture of aluminium wheels.
8
7
6
5
6
7
8
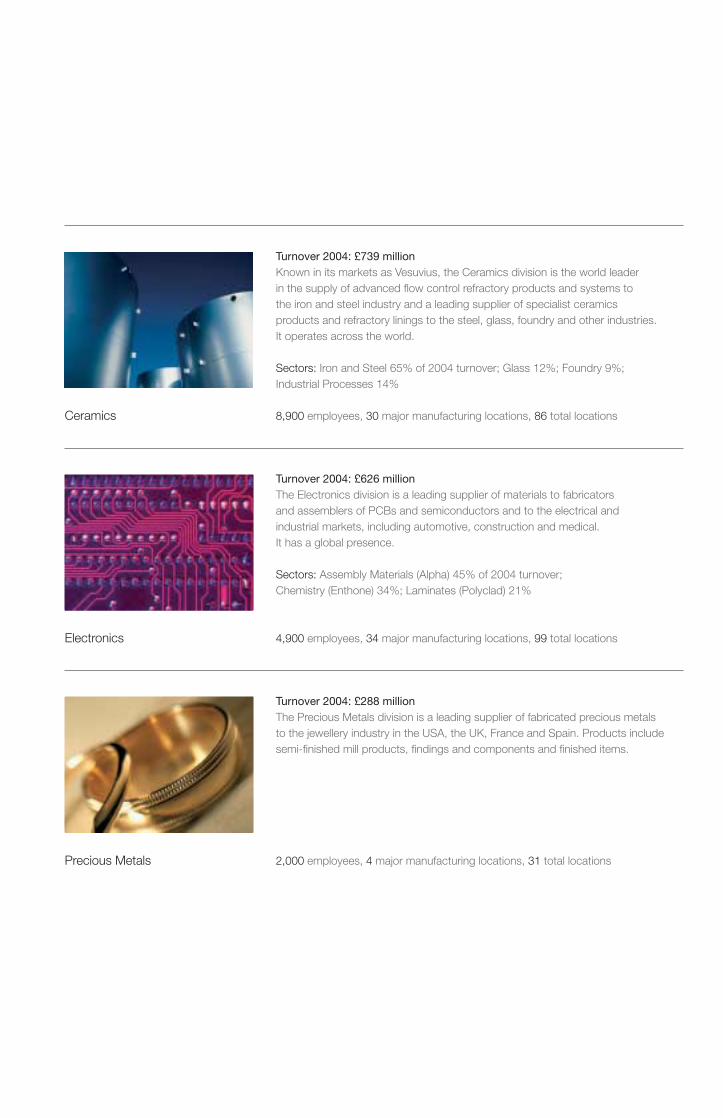
Ceramics
Electronics
Precious Metals
Turnover 2004: £739 millionKnown in its markets as Vesuvius, the Ceramics division is the world leader in the supply of advanced flow control refractory products and systems to the iron and steel industry and a leading supplier of specialist ceramics products and refractory linings to the steel, glass, foundry and other industries. It operates across the world.
Sectors: Iron and Steel 65% of 2004 turnover; Glass 12%; Foundry 9%; Industrial Processes 14%
8,900 employees, 30 major manufacturing locations, 86 total locations
Turnover 2004: £626 millionThe Electronics division is a leading supplier of materials to fabricators and assemblers of PCBs and semiconductors and to the electrical and industrial markets, including automotive, construction and medical. It has a global presence.
Sectors: Assembly Materials (Alpha) 45% of 2004 turnover; Chemistry (Enthone) 34%; Laminates (Polyclad) 21%
4,900 employees, 34 major manufacturing locations, 99 total locations
Turnover 2004: £288 millionThe Precious Metals division is a leading supplier of fabricated precious metalsto the jewellery industry in the USA, the UK, France and Spain. Products includesemi-finished mill products, findings and components and finished items.
2,000 employees, 4 major manufacturing locations, 31 total locations
Highlights 1
Around your world in 2004 2
Corporate social responsibility 6
Chairman’s statement 8
Chief Executive’s statement 9
Operating review 11
Financial review 18
Board of Directors 23
Directors’ report 24
Directors’ remuneration report 31
Corporate responsibility statement 40
Health, safety and environmental report 41
Directors’ responsibility statement 42
Auditor’s report 43
Group profit and loss account 44
Statement of total Group recognised gains and losses 44
Balance sheets 45
Statement of Group cash flows 46
Reconciliation of operating profit to netcash inflow from operating activities 47
Analysis of Group net debt 47
Analysis of movements in Groupshareholders’ funds 47
Notes to the accounts 48
Five year summary – continuing operations 72
Five year summary – Group 73
Shareholder information 75
Glossary of technical and financial terms 76
CONTENTS
1Cookson Group plc Annual Report 2004
OVERVIEW
Operating profit* up 60% at constant exchange rates– all three divisions record strong increases in operating profit
Significant improvement in return on sales*
Headline EPS* increases three-fold
Marked reduction in net debt
New £200 million bank facility announced in March 2005
Strategic review concluded
SUMMARY OF RESULTS2004 2003
Continuing operationsTurnover £1,698m £1,624mOperating profit* £119.6m £81.2mReturn on sales* 7.0% 5.0%
GroupProfit/(loss) before tax– Headline* £93.1m £32.6m– Basic £(18.7)m £(187.3)mEarnings per share– Headline* 3.3p 1.1p– Basic (2.7)p (10.9)p
Free cash flow £51.6m £15.7mNet debt £306.9m £358.5m*Before amortisation of intangibles and exceptional items.
H IGHLIGHTS
2Cookson Group plc Annual Report 2004
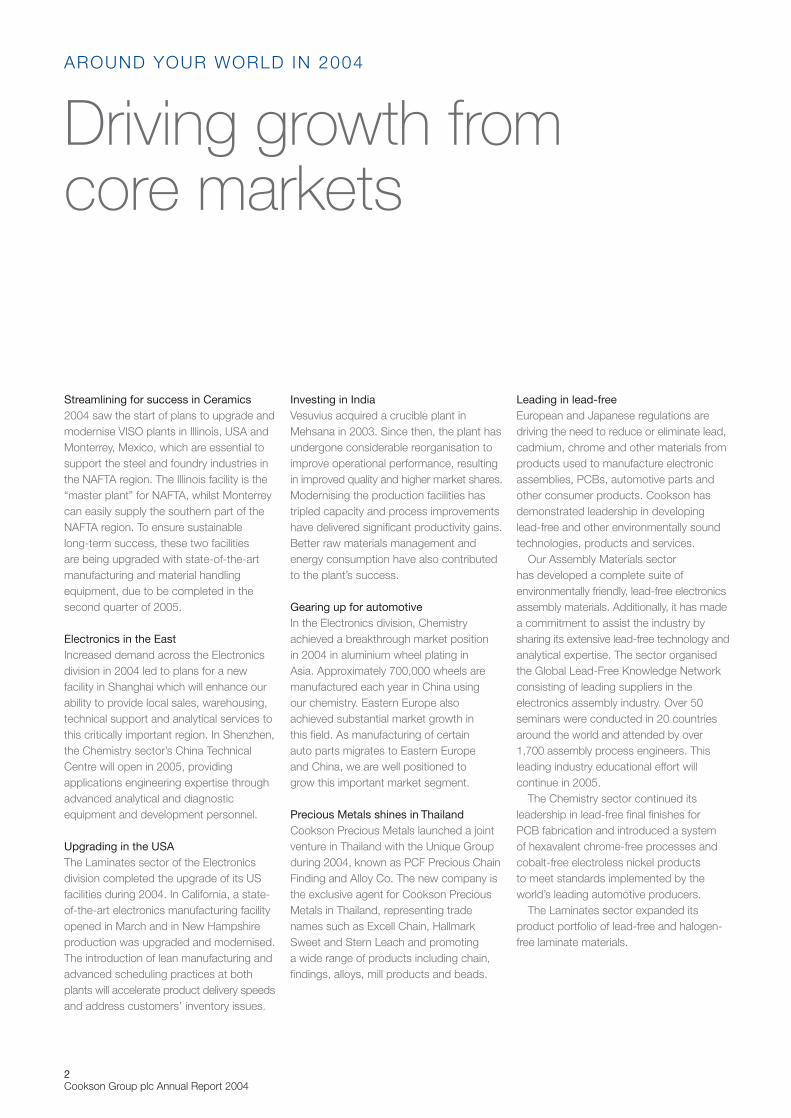
Streamlining for success in Ceramics2004 saw the start of plans to upgrade andmodernise VISO plants in Illinois, USA andMonterrey, Mexico, which are essential tosupport the steel and foundry industries inthe NAFTA region. The Illinois facility is the“master plant” for NAFTA, whilst Monterreycan easily supply the southern part of theNAFTA region. To ensure sustainable long-term success, these two facilities are being upgraded with state-of-the-artmanufacturing and material handlingequipment, due to be completed in thesecond quarter of 2005.
Electronics in the EastIncreased demand across the Electronicsdivision in 2004 led to plans for a newfacility in Shanghai which will enhance ourability to provide local sales, warehousing,technical support and analytical services tothis critically important region. In Shenzhen,the Chemistry sector’s China TechnicalCentre will open in 2005, providingapplications engineering expertise throughadvanced analytical and diagnosticequipment and development personnel.
Upgrading in the USAThe Laminates sector of the Electronicsdivision completed the upgrade of its USfacilities during 2004. In California, a state-of-the-art electronics manufacturing facilityopened in March and in New Hampshireproduction was upgraded and modernised.The introduction of lean manufacturing andadvanced scheduling practices at bothplants will accelerate product delivery speedsand address customers’ inventory issues.
Investing in IndiaVesuvius acquired a crucible plant inMehsana in 2003. Since then, the plant hasundergone considerable reorganisation toimprove operational performance, resultingin improved quality and higher market shares.Modernising the production facilities hastripled capacity and process improvementshave delivered significant productivity gains.Better raw materials management andenergy consumption have also contributedto the plant’s success.
Gearing up for automotiveIn the Electronics division, Chemistryachieved a breakthrough market position in 2004 in aluminium wheel plating in Asia. Approximately 700,000 wheels aremanufactured each year in China using our chemistry. Eastern Europe alsoachieved substantial market growth in this field. As manufacturing of certain auto parts migrates to Eastern Europe and China, we are well positioned to grow this important market segment.
Precious Metals shines in ThailandCookson Precious Metals launched a jointventure in Thailand with the Unique Groupduring 2004, known as PCF Precious ChainFinding and Alloy Co. The new company isthe exclusive agent for Cookson PreciousMetals in Thailand, representing tradenames such as Excell Chain, HallmarkSweet and Stern Leach and promoting a wide range of products including chain,findings, alloys, mill products and beads.
Leading in lead-freeEuropean and Japanese regulations aredriving the need to reduce or eliminate lead,cadmium, chrome and other materials fromproducts used to manufacture electronicassemblies, PCBs, automotive parts andother consumer products. Cookson hasdemonstrated leadership in developinglead-free and other environmentally soundtechnologies, products and services.
Our Assembly Materials sector has developed a complete suite ofenvironmentally friendly, lead-free electronicsassembly materials. Additionally, it has madea commitment to assist the industry bysharing its extensive lead-free technology andanalytical expertise. The sector organisedthe Global Lead-Free Knowledge Networkconsisting of leading suppliers in theelectronics assembly industry. Over 50seminars were conducted in 20 countriesaround the world and attended by over1,700 assembly process engineers. Thisleading industry educational effort willcontinue in 2005.
The Chemistry sector continued itsleadership in lead-free final finishes for PCB fabrication and introduced a systemof hexavalent chrome-free processes andcobalt-free electroless nickel products to meet standards implemented by theworld’s leading automotive producers.
The Laminates sector expanded itsproduct portfolio of lead-free and halogen-free laminate materials.
AROUND YOUR WORLD IN 2004
Driving growth from core markets
3Cookson Group plc Annual Report 2004
1 2 3
5 6
7 8
4
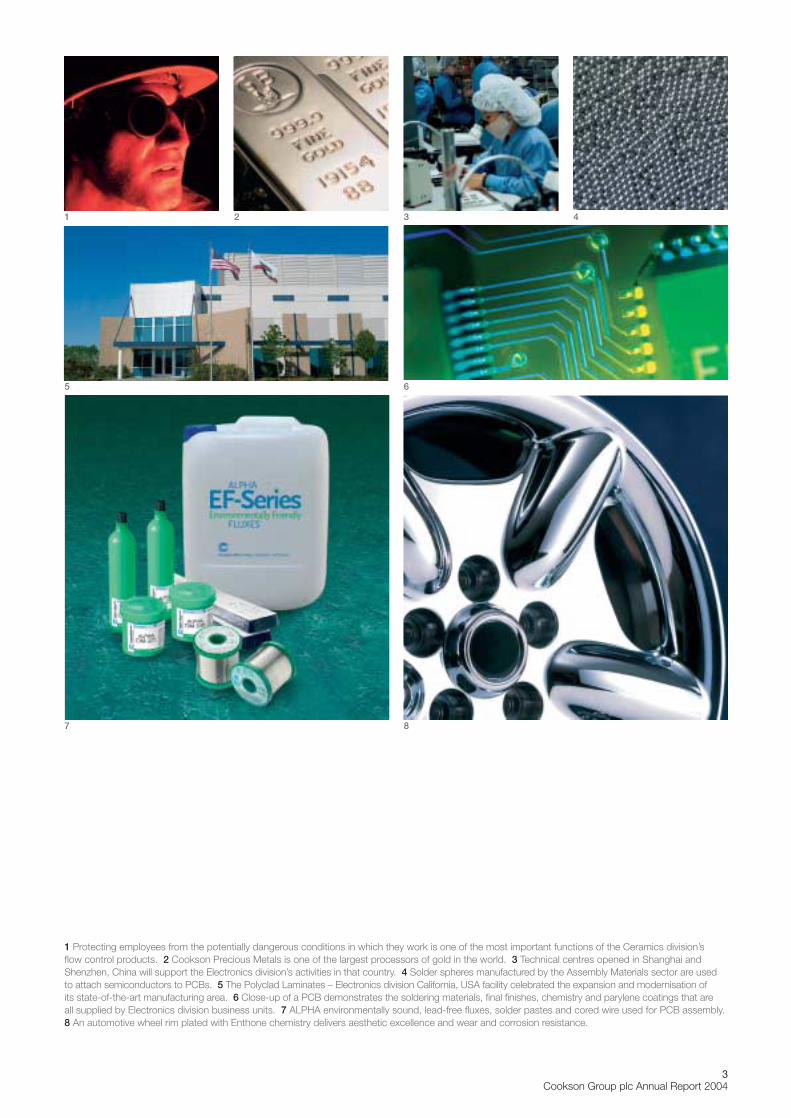
1 Protecting employees from the potentially dangerous conditions in which they work is one of the most important functions of the Ceramics division’s flow control products. 2 Cookson Precious Metals is one of the largest processors of gold in the world. 3 Technical centres opened in Shanghai andShenzhen, China will support the Electronics division’s activities in that country. 4 Solder spheres manufactured by the Assembly Materials sector are used to attach semiconductors to PCBs. 5 The Polyclad Laminates – Electronics division California, USA facility celebrated the expansion and modernisation of its state-of-the-art manufacturing area. 6 Close-up of a PCB demonstrates the soldering materials, final finishes, chemistry and parylene coatings that are all supplied by Electronics division business units. 7 ALPHA environmentally sound, lead-free fluxes, solder pastes and cored wire used for PCB assembly.8 An automotive wheel rim plated with Enthone chemistry delivers aesthetic excellence and wear and corrosion resistance.
4Cookson Group plc Annual Report 2004
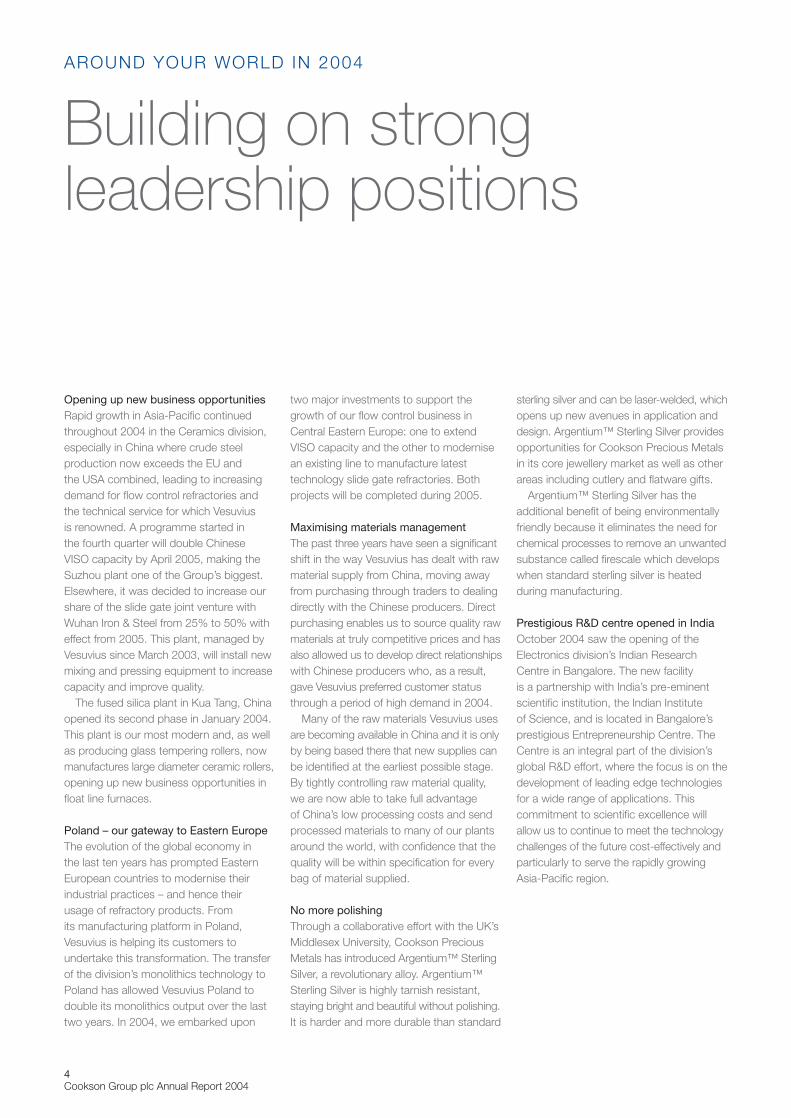
Opening up new business opportunitiesRapid growth in Asia-Pacific continuedthroughout 2004 in the Ceramics division,especially in China where crude steelproduction now exceeds the EU and the USA combined, leading to increasingdemand for flow control refractories andthe technical service for which Vesuvius is renowned. A programme started in the fourth quarter will double Chinese VISO capacity by April 2005, making theSuzhou plant one of the Group’s biggest.Elsewhere, it was decided to increase ourshare of the slide gate joint venture withWuhan Iron & Steel from 25% to 50% witheffect from 2005. This plant, managed byVesuvius since March 2003, will install newmixing and pressing equipment to increasecapacity and improve quality.
The fused silica plant in Kua Tang, Chinaopened its second phase in January 2004.This plant is our most modern and, as wellas producing glass tempering rollers, nowmanufactures large diameter ceramic rollers,opening up new business opportunities infloat line furnaces.
Poland – our gateway to Eastern EuropeThe evolution of the global economy in the last ten years has prompted EasternEuropean countries to modernise theirindustrial practices – and hence their usage of refractory products. From its manufacturing platform in Poland,Vesuvius is helping its customers toundertake this transformation. The transferof the division’s monolithics technology toPoland has allowed Vesuvius Poland todouble its monolithics output over the lasttwo years. In 2004, we embarked upon
two major investments to support thegrowth of our flow control business inCentral Eastern Europe: one to extendVISO capacity and the other to modernisean existing line to manufacture latesttechnology slide gate refractories. Bothprojects will be completed during 2005.
Maximising materials managementThe past three years have seen a significantshift in the way Vesuvius has dealt with rawmaterial supply from China, moving awayfrom purchasing through traders to dealingdirectly with the Chinese producers. Directpurchasing enables us to source quality rawmaterials at truly competitive prices and hasalso allowed us to develop direct relationshipswith Chinese producers who, as a result,gave Vesuvius preferred customer statusthrough a period of high demand in 2004.
Many of the raw materials Vesuvius usesare becoming available in China and it is onlyby being based there that new supplies canbe identified at the earliest possible stage.By tightly controlling raw material quality,we are now able to take full advantage of China’s low processing costs and sendprocessed materials to many of our plantsaround the world, with confidence that thequality will be within specification for everybag of material supplied.
No more polishingThrough a collaborative effort with the UK’sMiddlesex University, Cookson PreciousMetals has introduced Argentium™ SterlingSilver, a revolutionary alloy. Argentium™Sterling Silver is highly tarnish resistant,staying bright and beautiful without polishing.It is harder and more durable than standard
sterling silver and can be laser-welded, whichopens up new avenues in application anddesign. Argentium™ Sterling Silver providesopportunities for Cookson Precious Metalsin its core jewellery market as well as otherareas including cutlery and flatware gifts.
Argentium™ Sterling Silver has theadditional benefit of being environmentallyfriendly because it eliminates the need forchemical processes to remove an unwantedsubstance called firescale which developswhen standard sterling silver is heatedduring manufacturing.
Prestigious R&D centre opened in IndiaOctober 2004 saw the opening of theElectronics division’s Indian ResearchCentre in Bangalore. The new facility is a partnership with India’s pre-eminentscientific institution, the Indian Institute of Science, and is located in Bangalore’sprestigious Entrepreneurship Centre. TheCentre is an integral part of the division’sglobal R&D effort, where the focus is on thedevelopment of leading edge technologiesfor a wide range of applications. Thiscommitment to scientific excellence willallow us to continue to meet the technologychallenges of the future cost-effectively andparticularly to serve the rapidly growingAsia-Pacific region.
AROUND YOUR WORLD IN 2004
Building on strongleadership positions
5Cookson Group plc Annual Report 2004
3 4 5
1 2
7 8
6
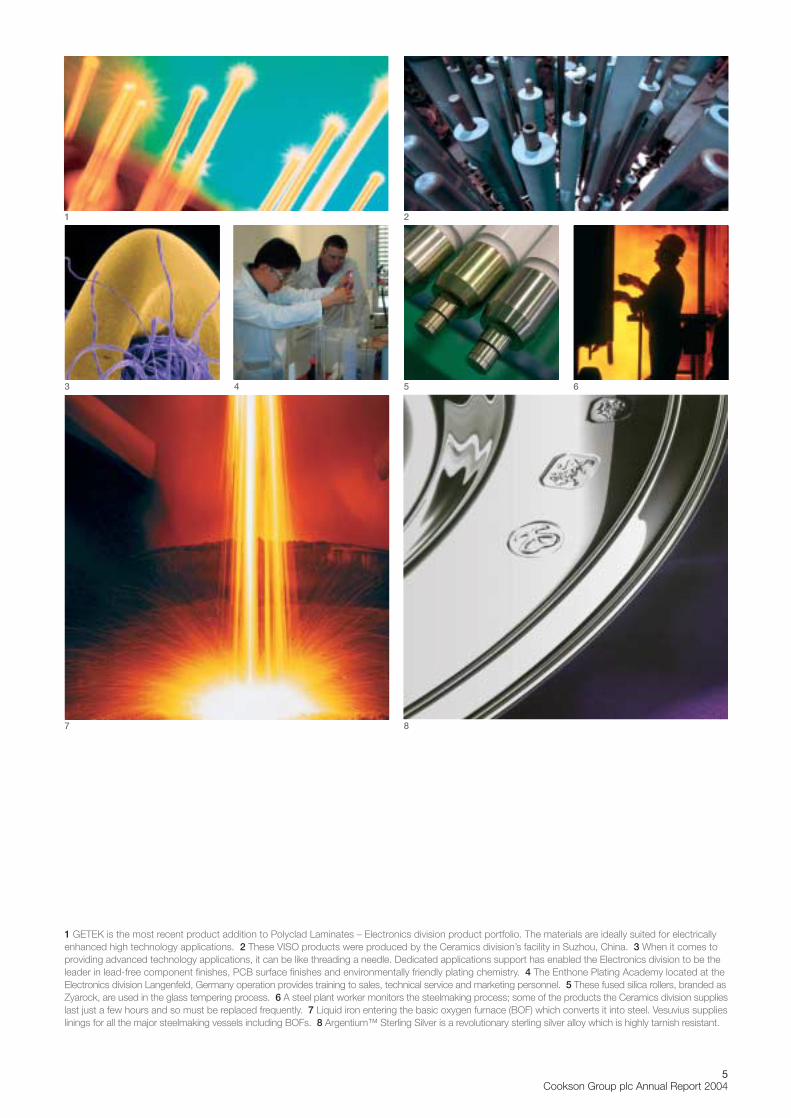
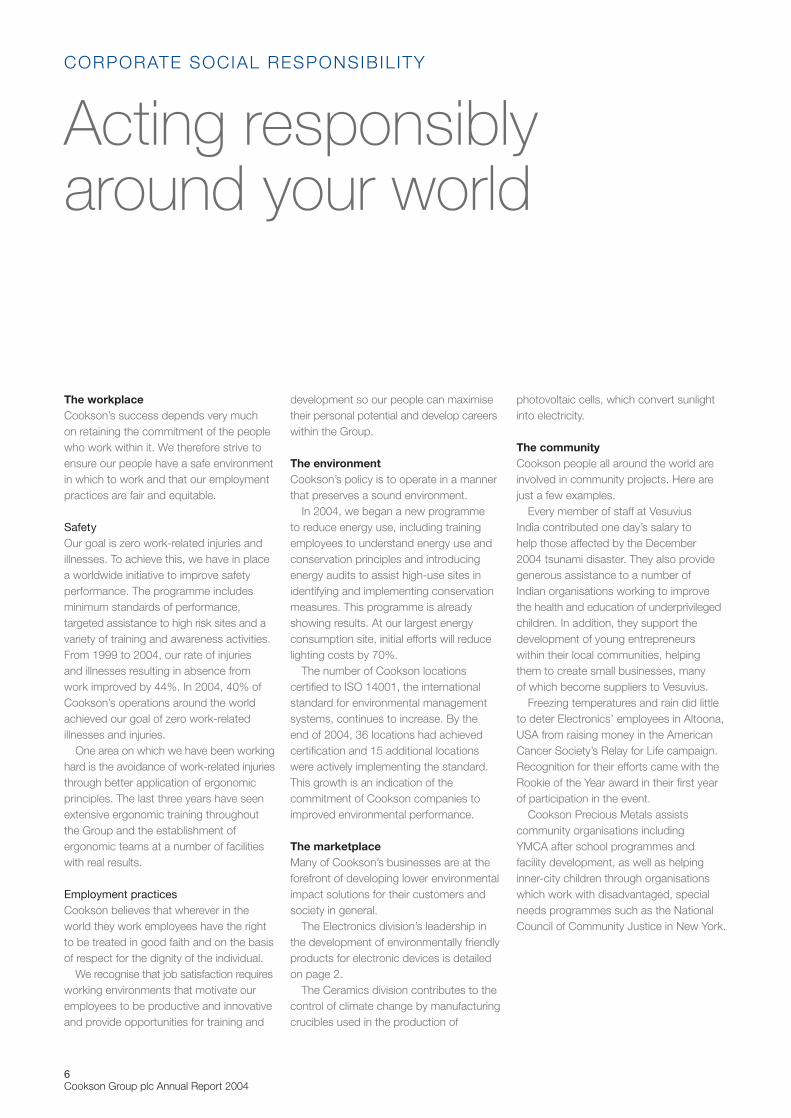
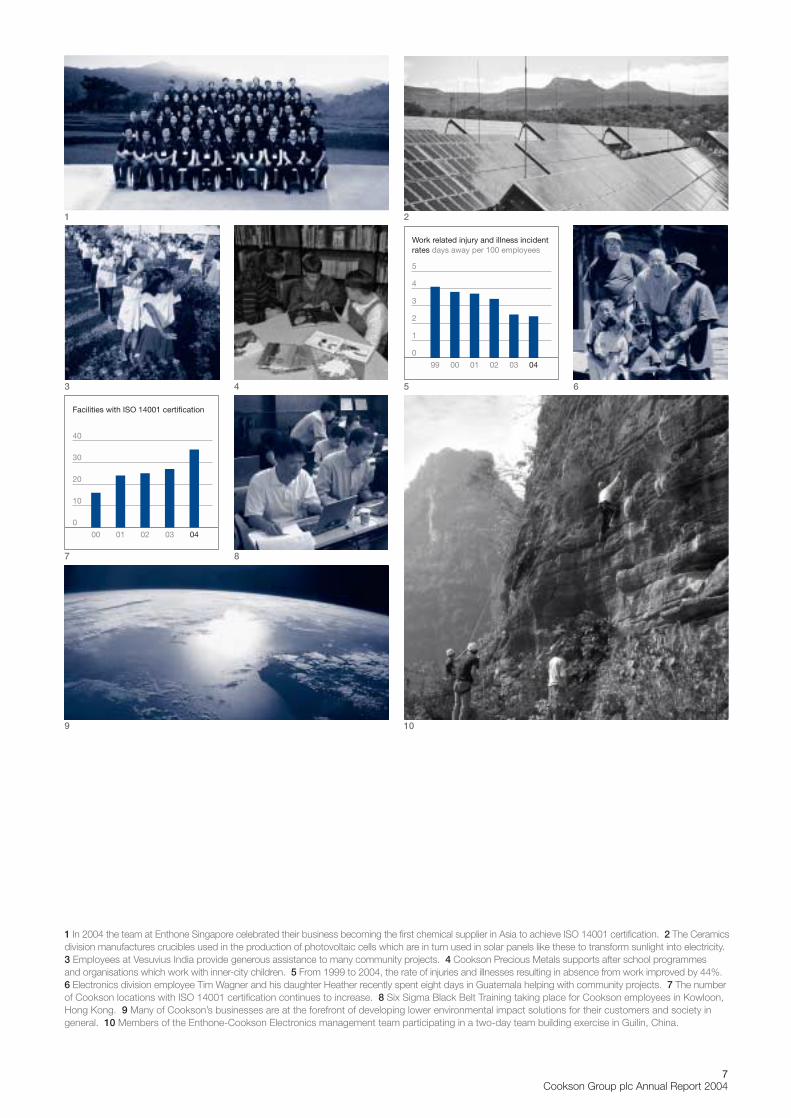
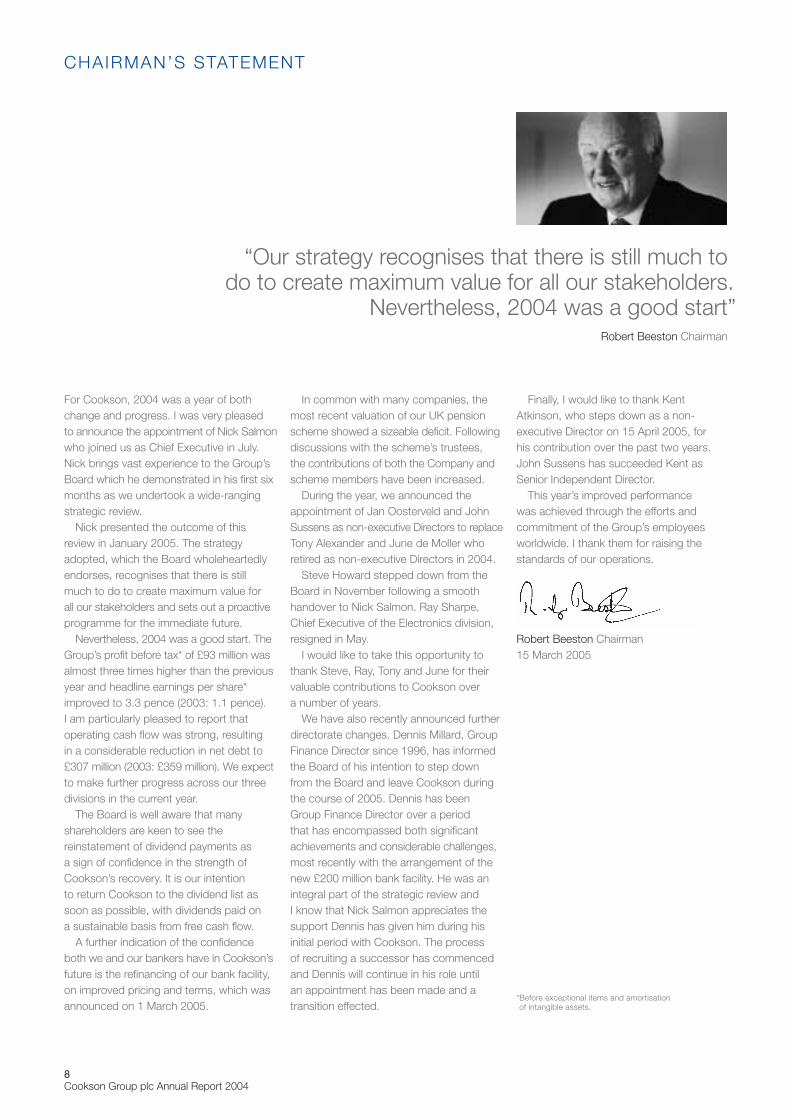
1 GETEK is the most recent product addition to Polyclad Laminates – Electronics division product portfolio. The materials are ideally suited for electricallyenhanced high technology applications. 2 These VISO products were produced by the Ceramics division’s facility in Suzhou, China. 3 When it comes toproviding advanced technology applications, it can be like threading a needle. Dedicated applications support has enabled the Electronics division to be theleader in lead-free component finishes, PCB surface finishes and environmentally friendly plating chemistry. 4 The Enthone Plating Academy located at theElectronics division Langenfeld, Germany operation provides training to sales, technical service and marketing personnel. 5 These fused silica rollers, branded asZyarock, are used in the glass tempering process. 6 A steel plant worker monitors the steelmaking process; some of the products the Ceramics division supplieslast just a few hours and so must be replaced frequently. 7 Liquid iron entering the basic oxygen furnace (BOF) which converts it into steel. Vesuvius supplieslinings for all the major steelmaking vessels including BOFs. 8 Argentium™ Sterling Silver is a revolutionary sterling silver alloy which is highly tarnish resistant.
6Cookson Group plc Annual Report 2004
The workplaceCookson’s success depends very much on retaining the commitment of the peoplewho work within it. We therefore strive toensure our people have a safe environmentin which to work and that our employmentpractices are fair and equitable.
SafetyOur goal is zero work-related injuries andillnesses. To achieve this, we have in placea worldwide initiative to improve safetyperformance. The programme includesminimum standards of performance,targeted assistance to high risk sites and avariety of training and awareness activities.From 1999 to 2004, our rate of injuries and illnesses resulting in absence fromwork improved by 44%. In 2004, 40% ofCookson’s operations around the worldachieved our goal of zero work-relatedillnesses and injuries.
One area on which we have been workinghard is the avoidance of work-related injuriesthrough better application of ergonomicprinciples. The last three years have seenextensive ergonomic training throughoutthe Group and the establishment ofergonomic teams at a number of facilitieswith real results.
Employment practicesCookson believes that wherever in theworld they work employees have the rightto be treated in good faith and on the basisof respect for the dignity of the individual.
We recognise that job satisfaction requiresworking environments that motivate ouremployees to be productive and innovativeand provide opportunities for training and
development so our people can maximisetheir personal potential and develop careerswithin the Group.
The environmentCookson’s policy is to operate in a mannerthat preserves a sound environment.
In 2004, we began a new programme to reduce energy use, including trainingemployees to understand energy use andconservation principles and introducingenergy audits to assist high-use sites inidentifying and implementing conservationmeasures. This programme is alreadyshowing results. At our largest energyconsumption site, initial efforts will reducelighting costs by 70%.
The number of Cookson locationscertified to ISO 14001, the internationalstandard for environmental managementsystems, continues to increase. By the end of 2004, 36 locations had achievedcertification and 15 additional locationswere actively implementing the standard.This growth is an indication of thecommitment of Cookson companies toimproved environmental performance.
The marketplaceMany of Cookson’s businesses are at theforefront of developing lower environmentalimpact solutions for their customers andsociety in general.
The Electronics division’s leadership inthe development of environmentally friendlyproducts for electronic devices is detailedon page 2.
The Ceramics division contributes to thecontrol of climate change by manufacturingcrucibles used in the production of
photovoltaic cells, which convert sunlightinto electricity.
The communityCookson people all around the world areinvolved in community projects. Here arejust a few examples.
Every member of staff at Vesuvius India contributed one day’s salary to help those affected by the December 2004 tsunami disaster. They also providegenerous assistance to a number of Indian organisations working to improvethe health and education of underprivilegedchildren. In addition, they support thedevelopment of young entrepreneurs within their local communities, helpingthem to create small businesses, many of which become suppliers to Vesuvius.
Freezing temperatures and rain did littleto deter Electronics’ employees in Altoona,USA from raising money in the AmericanCancer Society’s Relay for Life campaign.Recognition for their efforts came with theRookie of the Year award in their first yearof participation in the event.
Cookson Precious Metals assistscommunity organisations including YMCA after school programmes and facility development, as well as helpinginner-city children through organisationswhich work with disadvantaged, specialneeds programmes such as the NationalCouncil of Community Justice in New York.
CORPORATE SOCIAL RESPONSIBIL ITY
Acting responsiblyaround your world
7Cookson Group plc Annual Report 2004
3 4
8
5
4
3
2
1
0
040302010099
Work related injury and illness incident rates days away per 100 employees
5
40
30
20
10
0
0403020100
Facilities with ISO 14001 certification
7
2
9 10
6
1 In 2004 the team at Enthone Singapore celebrated their business becoming the first chemical supplier in Asia to achieve ISO 14001 certification. 2 The Ceramicsdivision manufactures crucibles used in the production of photovoltaic cells which are in turn used in solar panels like these to transform sunlight into electricity.3 Employees at Vesuvius India provide generous assistance to many community projects. 4 Cookson Precious Metals supports after school programmes and organisations which work with inner-city children. 5 From 1999 to 2004, the rate of injuries and illnesses resulting in absence from work improved by 44%.6 Electronics division employee Tim Wagner and his daughter Heather recently spent eight days in Guatemala helping with community projects. 7 The numberof Cookson locations with ISO 14001 certification continues to increase. 8 Six Sigma Black Belt Training taking place for Cookson employees in Kowloon,Hong Kong. 9 Many of Cookson’s businesses are at the forefront of developing lower environmental impact solutions for their customers and society ingeneral. 10 Members of the Enthone-Cookson Electronics management team participating in a two-day team building exercise in Guilin, China.
1
8Cookson Group plc Annual Report 2004
CHAIRMAN’S STATEMENT
For Cookson, 2004 was a year of bothchange and progress. I was very pleased to announce the appointment of Nick Salmonwho joined us as Chief Executive in July.Nick brings vast experience to the Group’sBoard which he demonstrated in his first sixmonths as we undertook a wide-rangingstrategic review.
Nick presented the outcome of thisreview in January 2005. The strategyadopted, which the Board wholeheartedlyendorses, recognises that there is stillmuch to do to create maximum value for all our stakeholders and sets out a proactiveprogramme for the immediate future.
Nevertheless, 2004 was a good start. TheGroup’s profit before tax* of £93 million wasalmost three times higher than the previousyear and headline earnings per share*improved to 3.3 pence (2003: 1.1 pence). I am particularly pleased to report thatoperating cash flow was strong, resulting in a considerable reduction in net debt to£307 million (2003: £359 million). We expectto make further progress across our threedivisions in the current year.
The Board is well aware that manyshareholders are keen to see thereinstatement of dividend payments as a sign of confidence in the strength ofCookson’s recovery. It is our intention to return Cookson to the dividend list assoon as possible, with dividends paid on a sustainable basis from free cash flow.
A further indication of the confidenceboth we and our bankers have in Cookson’sfuture is the refinancing of our bank facility,on improved pricing and terms, which wasannounced on 1 March 2005.
In common with many companies, themost recent valuation of our UK pensionscheme showed a sizeable deficit. Followingdiscussions with the scheme’s trustees, the contributions of both the Company andscheme members have been increased.
During the year, we announced theappointment of Jan Oosterveld and JohnSussens as non-executive Directors to replaceTony Alexander and June de Moller whoretired as non-executive Directors in 2004.
Steve Howard stepped down from theBoard in November following a smoothhandover to Nick Salmon. Ray Sharpe,Chief Executive of the Electronics division,resigned in May.
I would like to take this opportunity tothank Steve, Ray, Tony and June for theirvaluable contributions to Cookson over a number of years.
We have also recently announced furtherdirectorate changes. Dennis Millard, GroupFinance Director since 1996, has informedthe Board of his intention to step downfrom the Board and leave Cookson duringthe course of 2005. Dennis has beenGroup Finance Director over a period that has encompassed both significantachievements and considerable challenges,most recently with the arrangement of thenew £200 million bank facility. He was anintegral part of the strategic review and I know that Nick Salmon appreciates thesupport Dennis has given him during hisinitial period with Cookson. The process of recruiting a successor has commencedand Dennis will continue in his role until an appointment has been made and atransition effected.
Finally, I would like to thank KentAtkinson, who steps down as a non-executive Director on 15 April 2005, for his contribution over the past two years.John Sussens has succeeded Kent asSenior Independent Director.
This year’s improved performance was achieved through the efforts andcommitment of the Group’s employeesworldwide. I thank them for raising thestandards of our operations.
Robert Beeston Chairman15 March 2005
*Before exceptional items and amortisation of intangible assets.
“Our strategy recognises that there is still much todo to create maximum value for all our stakeholders.
Nevertheless, 2004 was a good start”Robert Beeston Chairman
9Cookson Group plc Annual Report 2004
CHIEF EXECUTIVE’S STATEMENT
2004 resultsThe Group’s results showed a markedimprovement in 2004, benefiting from bothbetter market conditions and action takento restructure certain businesses and controlcosts. Turnover from continuing operationswas up 5% at reported exchange rates to£1,698 million. Operating profit forcontinuing operations before exceptionalitems and amortisation of intangible assetsrose by 47% to £120 million. Net incomeafter tax, amortisation of intangible assets andexceptional charges improved from a loss of£205 million in 2003 to a loss of £50 millionin 2004. Net debt at 31 December 2004 was£307 million, compared to £359 million at31 December 2003, reflecting an exceptionallystrong fourth quarter improvement.
This much improved performance camefrom a marked pick-up in the global marketsfor our Electronics division, which started in the last quarter of 2003, together withcontinued strong growth in global demandfor steel and glass, the most important end markets for the Ceramics division. ThePrecious Metals division delivered a betterresult than last year despite relatively weakconsumer demand for gold jewellery in thepeak fourth quarter shopping season.
The overall improvement also reflects thebenefits from the disposal of the Electronicsdivision’s loss-making equipment businessSpeedline, which was sold in November2003, and from the ongoing restructuringof that division’s Laminates sector whichhas transformed it from loss-making tobreak-even.
Actions taken during 2004 to addressunderperforming businesses included:
Restructuring of Precious Metals in Europe:We closed two manufacturing sites in Franceduring 2004 and consolidated seven salesoffices into three. European production wasreorganised to focus on gold products in theUK and silver products in Spain. Completionof this programme will take place in thesecond quarter of 2005.
Restructuring of Electronics in the USAand Europe: In the second half of the yearwe initiated a further phase of restructuringin the Laminates sector in the USA andGermany including rationalisation of theUS-based divisional head office. Completionof the US initiatives and implementation ofa social plan in Germany, which has beenagreed with the local unions, are scheduledto take place in the first half of 2005.
Disposals and rationalisation in Ceramics:As part of our strategy to exit low margincommodity activities, in December 2004 wesold two refractory brick making businessesbased in Belgium and Germany for a cashconsideration of £1 million. We alsolaunched a project to rationalise productionin NAFTA and expand our Mexican plant.
These measures, the costs of which arereported in the exceptional charges, will yieldimproved operating results going forward.
Strategic reviewSince my arrival in July 2004, I haveundertaken a thorough review of Cookson’soperations and with the Board haveconducted a complete strategic review, the result of which we presented to thefinancial markets on 18 January 2005. The full presentation is available on ourwebsite, www.cooksongroup.co.uk, and
I highlight the main conclusions from thereview below:– there has been a common misconception
that Cookson is a pure electronicscompany. In reality, since the disposal of Speedline and with the restructuring of Laminates, less than 30% of our salesand profits come from electronics markets;
– all our main businesses command strongmarket share and technology positionsand have production facilities that arewell adapted to their geographic markets.However, more can be done to improveperformance; and
– the Group has adequate financialresources. The new £200 millionunsecured bank facility is a clear andtangible confirmation of our improvedfinancial condition and prospects.
StrategyAs a result of the review, the Group willpursue a strategy which incorporates the following.
Our operational focus will be ondeveloping the performance of our corebusinesses by capitalising on existingstrong market shares and technologicalexpertise and investing further in growingmarkets. Operational improvement plansare being introduced at all businesseswhich are designed to produce markedgains in competitiveness, profitability andcash generation. These plans revolvearound the following principles:
Products and markets: We will focus onhigher technology, higher margin products,maintaining a high R&D spend and exitingcommodity activities.
“We have fundamentally sound positions in our markets, good products and technologies and a great team of committed people
worldwide who are striving to deliver continuous improvements in customer service and returns to our shareholders”
Nick Salmon Chief Executive
Investment and restructuring: We have awell balanced geographic match betweenour production facilities and our customermarkets. That is to say “we make where we sell”, critical because in all our activitieswe need to be a “just-in-time” supplier (see charts below). Today 37% of our sales originate from NAFTA, 36% from the EU and 27% from the Rest of the World,principally Asia-Pacific. We anticipatestrongest market growth in Asia-Pacific andthe Rest of the World. NAFTA is expected toshow continued, albeit modest, growth whilstEurope is expected to decline slowly. We willprogressively adapt our production capacitiesto the evolution of our geographic markets,investing in new production capacity inemerging markets while restructuring asnecessary in mature markets.
Cost reduction: We will simplify ourstructure and take out costs, particularlyoverhead costs. We have already identifiedcentral cost savings of some £3 million. We will continue to focus on improving theeffectiveness of our materials purchasingas nearly 50% of our cost of sales is in raw materials.
Specific examples of how these principlesare being applied in each division can befound in the Operating and Financial Reviewstarting on page 11.
ObjectivesBy focusing on our activities in this way, wewill create the right platform from which wecan develop our higher growth, higher marginbusinesses in order to achieve the margintargets outlined in the strategic review:10% return on sales by 2007 for both theCeramics and Electronics divisions and15% return on net sales value (i.e. excluding
the precious metal content) for the PreciousMetals division.
We also plan to reduce debt significantlyover the next 2-3 years through a combinationof stronger operational cash flow – fromimproved profitability and working capitalmanagement – and a disposal programmewhich aims to raise over £100 million fromthe sale of a number of non-core businessesfrom across all three divisions. The sale ofthe fraternity rings business, from thePrecious Metals division, in December 2004for £3 million was a first step in thisprogramme.
We are also repositioning Cookson fromits historical perception as a highly cyclicalstock and intend to resume a sustainabledividend payment as soon as possible,with dividends funded from free cash flow.
ObservationsThis is my first year in the Group. Sincejoining in July, I have travelled extensivelyaround our global operations, meetingemployees and customers. This experiencehas convinced me that we have fundamentallysound positions in our markets, goodproducts and technologies and a great teamof committed people worldwide who arestriving to deliver continuous improvementsin customer service and returns to ourshareholders. Some senior managementchanges have been necessary and I amvery confident that the internal promotionsof Steve Corbett to Chief Executive of theElectronics division, Rick Richesin to ChiefExecutive of the Laminates sector andHuub van Dunn to Chief Executive of theChemistry sector will bring improvedperformance in their respective businesses.
I have been pleased to see a strong and
sincere commitment to ensuring world classhealth, safety and environmental compliancein all our facilities in all regions. Furthermore,I have been favourably impressed with the Group’s internal controls and overalloperational structure, which combine arelatively lean, decentralised operatingapproach with strong central financial controland governance functions. This year has alsoseen an enormous effort to ensure timelyimplementation of new regulatory standardssuch as IFRS and the Sarbanes-Oxley Act.
OutlookTrading in the early weeks of 2005 suggeststhat the robust market conditions experiencedby the Ceramics division in 2004 arecontinuing. In the Electronics division, therewas evidence in late January and Februarythat customers were de-stocking inventoriesof some higher margin products, althoughmomentum now appears to be returning.The relatively weak retail trading environmentwhich impacted the Precious Metals division throughout the second half of 2004 continues but many jewellery industryobservers remain optimistic of a recovery.
From this position, we are confident thatwe can deliver additional improvements in2005 as we execute our strategy to enhanceoperational performance, strengthen ourbalance sheet further via the disposalprogramme and build on our core businesses.
Nick Salmon Chief Executive15 March 2005
10Cookson Group plc Annual Report 2004
CHIEF EXECUTIVE’S STATEMENT CONTINUED
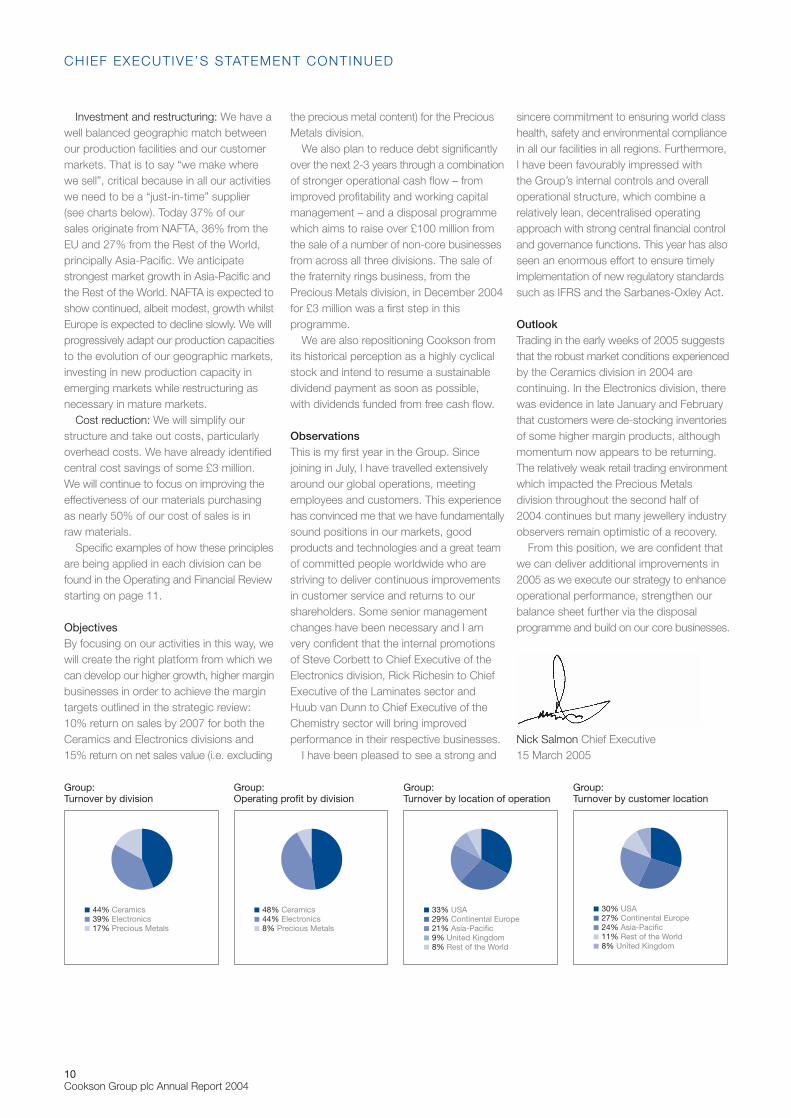
Group:Turnover by division
Group:Turnover by location of operation
Group:Turnover by customer location
Group:Operating profit by division
44% Ceramics39% Electronics17% Precious Metals
33% USA29% Continental Europe21% Asia-Pacific9% United Kingdom8% Rest of the World
30% USA27% Continental Europe24% Asia-Pacific11% Rest of the World8% United Kingdom
48% Ceramics44% Electronics8% Precious Metals
11Cookson Group plc Annual Report 2004
OPERATING REVIEW
Group performanceTurnover for the Group’s continuingoperations, including joint ventures, was11% higher in 2004 than 2003 at constantexchange rates and 5% higher at reportedexchange rates. In the second half of 2004,turnover increased by 10% at constantexchange rates over the second half of 2003 and fourth quarter turnover of£437 million was 4% higher than the same quarter last year. These growth ratesreflect the fact that Group performance had begun to recover in the second half of 2003, particularly in the fourth quarter.
Higher profits from continuing operationsacross all three divisions resulted in a 60% increase in operating profit in 2004 at constant exchange rates and a 47%increase at reported exchange rates. Fourthquarter operating profit of £35.6 millionwas 18% higher than the same quarter last year at constant exchange rates. Allthree divisions registered improvements in operating profit for the year over 2003:Ceramics increased by £10.6 million (23%),Electronics was £30.0 million (154%) higherand Precious Metals was up £1.7 million(23%). Profits from joint ventures rose by£2.3 million at constant exchange rates to £4.0 million (up £2.0 million at reportedexchange rates).
Return on sales for the Group’scontinuing operations of 7.0% improved by2.1 percentage points in 2004 at constantexchange rates and 2.0 percentage pointsat reported exchange rates. It has risensequentially in each half year since thebeginning of 2003. All divisions recordedyear-on-year rises in return on sales.
The fastest growing and most profitableregion for the Group continued to be Asia-Pacific which accounted for 24% of theGroup’s customer base in 2004 and 47%of operating profit. The USA remained theGroup’s largest region in terms of turnover,representing 30% of the total in 2004. Therewas a major improvement in profitability inthis region where rationalisation initiativesthat had commenced in 2003 and 2004began to bear fruit.
Divisional performanceCeramics divisionKnown in its markets as Vesuvius,Cookson’s Ceramics division is the worldleader in the supply of advanced flowcontrol refractory products to the iron andsteel industry. It is also a leading supplier of refractory linings and speciality refractoryproducts for iron and steelmaking, the glassindustry, ferrous and non-ferrous foundriesand other industrial processes.
Market overviewThe Ceramics division benefited fromimproved market conditions in its majormarkets that began to take hold in thesecond half of 2003 and continuedthroughout 2004.
The division’s largest sector is Iron and Steel, resulting in some two-thirds ofits sales and profits being linked to steelproduction volumes. In 2004 global steelproduction rose by almost 9%, surpassingone billion tonnes for the first time. Chinaconfirmed its position as the world’s leadingsteel producer with year-on-year growth of 23% and accounted for over 25% of the
world’s total production in 2004. ExcludingChina, global production was 4.5% higher in2004 with the USA, the EU, Russia, Ukraineand Brazil each growing by around 5%,whilst Japan and South Korea were some3% higher. Steel prices rose strongly in 2004,strengthening the industry’s financial position.
The steel industry continued to consolidatein 2004. Mittal Steel – formerly LNM – isnow the world’s largest steelmaker withcapacity of some 70 million tonnes across14 countries. The world’s top six producersrepresented 23% of global steel output in2004, up from 19% in the previous year.
The end markets of the Foundry, Glassand Industrial Products sectors are generallylinked to GDP growth and thereforebenefited from a year of overall globaleconomic growth. The most importantmarkets for these sectors are constructionand automotive, both of which experiencedimproving market conditions in 2004.
Divisional performance and initiativesThe Ceramics division recorded a strongoverall performance in 2004 as a result ofthe buoyant global steel industry and stableconditions in its other markets. Turnover for the year of £739 million, excluding joint ventures, was 5% higher than 2003 at reported exchange rates and 11% higherat constant exchange rates. Operatingprofit grew by 14% at reported exchangerates to £56.8 million and was up 23% at constant exchange rates. Return onsales was 7.7%, up from 6.9% at constantexchange rates in the previous year. Thefourth quarter was particularly strong withsales at record levels.
8
6
2
4
0
H204
H104
H203
H103
75
50
25
0
H204
H104
H203
H103
900
600
300
0
H204
H104
H203
H103
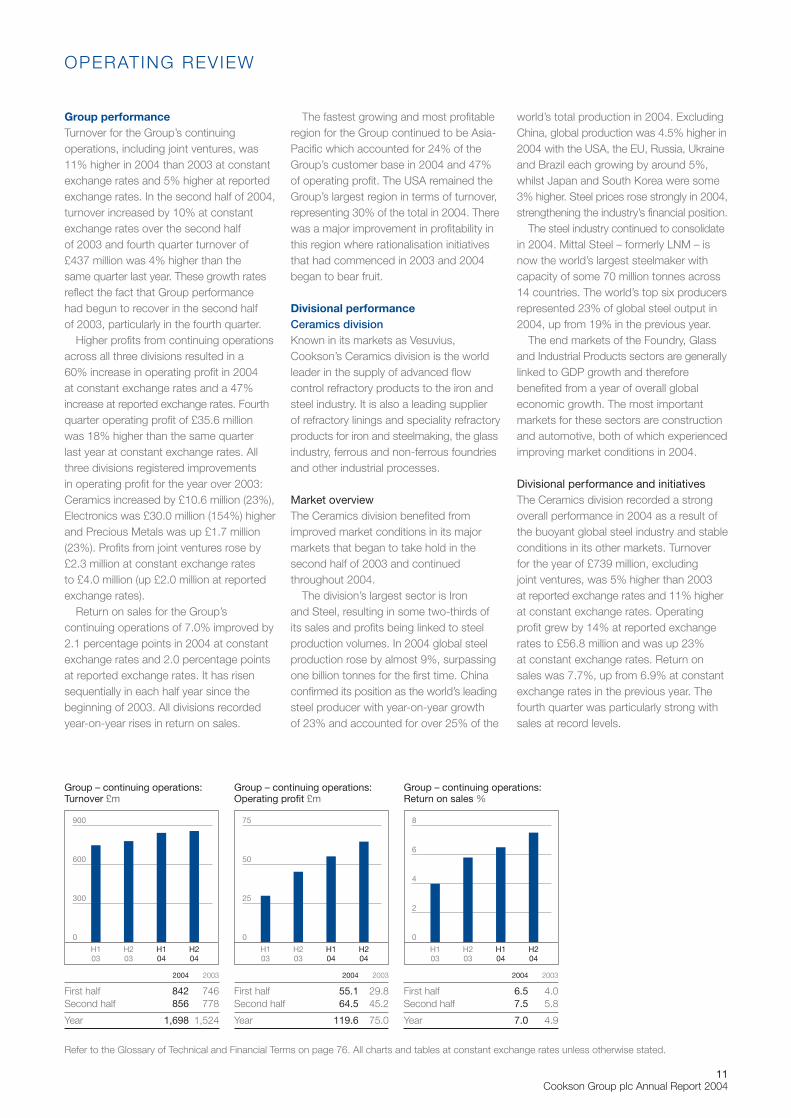
2004 2003
First half 842 746Second half 856 778
Year 1,698 1,524
Group – continuing operations: Turnover £m
2004 2003
First half 55.1 29.8Second half 64.5 45.2
Year 119.6 75.0
Group – continuing operations: Operating profit £m
2004 2003
First half 6.5 4.0Second half 7.5 5.8
Year 7.0 4.9
Group – continuing operations: Return on sales %
Refer to the Glossary of Technical and Financial Terms on page 76. All charts and tables at constant exchange rates unless otherwise stated.
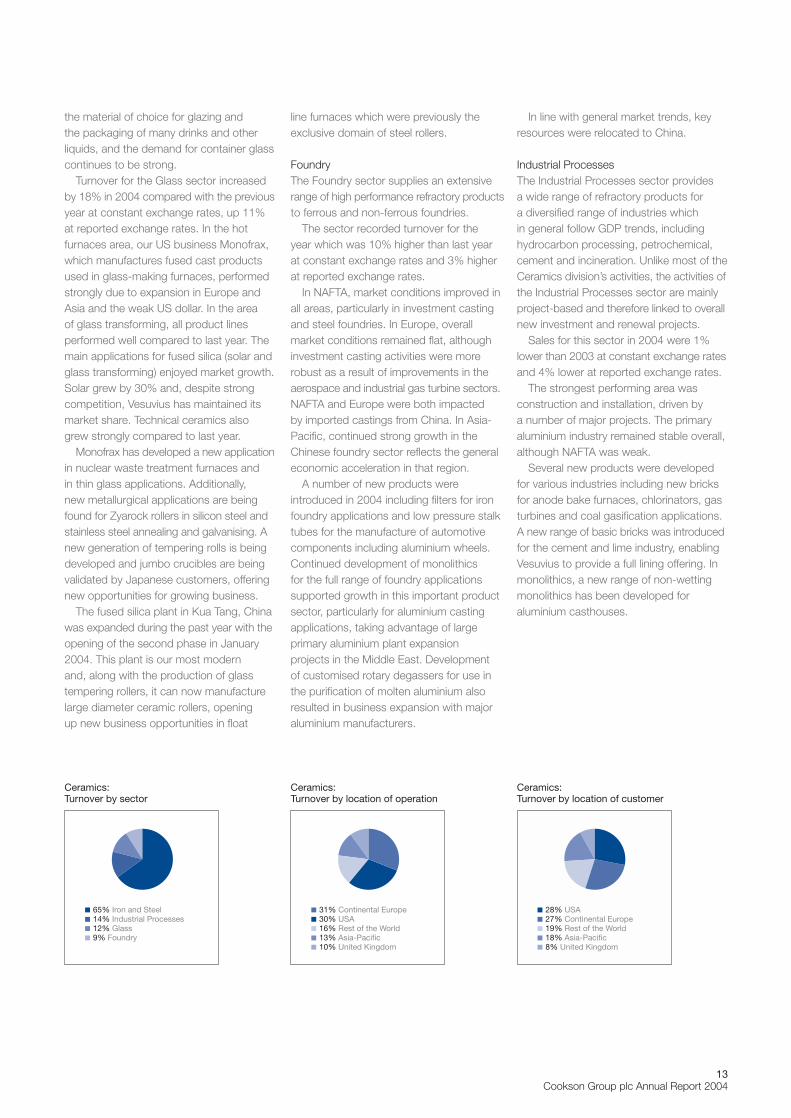
The Iron and Steel sector accounted for 65% of turnover for the year, the Glasssector accounted for 12% and the Foundryand Industrial Processes sectors 9% and14% respectively.
Regionally, Europe (including the UK) wasthe division’s largest region, accounting for41% of turnover. The USA contributed 30%of turnover, Asia-Pacific 13% and the Restof the World 16%.
Two plants based in Belgium and Germanywhich made bricks used in glass-makingfurnaces were divested during 2004.
Sector performanceIron and SteelThe Iron and Steel sector principally suppliestwo kinds of products to steelmakers: liningsin the form of either bricks or monolithicswhich are used to line the main steelmakingvessels; and flow control products whichcontrol and protect the stream of moltenmetal as it passes through the steelmakingprocess, particularly during continuouscasting, the most important of which areVISO products and slide gate systems.
Strong industry conditions resulted in a 13% increase in turnover for 2004 atconstant exchange rates, an increase of6% at reported exchange rates. Sales ofthe high technology, higher margin flowcontrol products were some 7% higherthan last year whilst lining and constructionrelated sales increased by 15%.
Regionally, the sector’s performancereflected the trends seen in its served markets.
Steel production in Asia increased by13% from 2003 to 2004. The sector’s sales showed a 42% increase year-on-
year. Chinese production remained strongdespite government attempts to slowgrowth. With its expanding VISO and slidegate plants in Suzhou, Vesuvius is wellpositioned to take advantage of futureopportunities in China in spite of increasinglocal competition. The Indian marketcontinued to grow in line with spending oninfrastructure projects. Thailand outperformedits SE Asian neighbours, which remainedfairly static. The Australian, Japanese,Korean and Taiwanese markets were stable.
The enlarged 25-member EU reported5% growth in steel production in 2004,with Poland, Spain and Italy recording the biggest increases. Outside the EU,Turkey, Russia and Ukraine all increasedtheir production. The division’s sales inEurope remained stable in the maturemarkets and showed a stronger increase in the emerging markets of Central Europe.
2004 was clearly a year of marketrecovery in NAFTA after several disappointingyears, with an overall increase of 5% in steelproduction, led by a 5% increase in the USAand a 10% increase in Mexico. The sector’ssales grew in line with these strongerproduction levels.
2004 saw several price increases in rawmaterials. In addition, there were adverseprice moves in oil, energy and transportation.As a result, Vesuvius has embarked upon amajor price increase programme, with effectfrom January 2005.
The Iron and Steel sector introduced anumber of new products during the year.The introduction of a new range of robust,user-friendly, low maintenance slide gatemechanisms has been completed; the
four new gates cover the full range fromvery small mini mill ladles to very largeintegrated steel shop ladles and replace 28existing models. A new sprayable insulationproduct, known as Thermacoat, has beensuccessfully launched with equivalentproperties to fibre material.
An in-depth review of NAFTA plantsresulted in a decision to upgrade the VISO facilities at Charleston, Illinois andMonterrey, Mexico and to cease operations at the Hillsboro, Texas facility. In China, it was decided to increase the Group’sshare of the slide gate joint venture withWuhan Iron & Steel from 25% to 50% witheffect from 2005 and efficiency improvementmeasures are being implemented. Investmentis also being made to increase VISO capacityat the Suzhou plant.
In Poland, in order to support thegrowing Central European market, VISOproduction capacity is being increased andthe slide gate refractory line modernised to enable Vesuvius Poland to manufacturethe latest slide gate refractory technology.
GlassThe Glass sector supplies a wide range of refractories used in the glass-makingindustry and specialist ceramic productsused in glass processing.
Demand for flat glass is primarily dependentupon conditions in the construction andautomotive industries, as a result of which itis prone to a reasonable degree of cyclicality.After a number of challenging years, the lasttwo years have experienced recovery on a global scale. Despite competition fromplastics and other materials, glass remains
12Cookson Group plc Annual Report 2004
OPERATING REVIEW CONTINUED
10
6
8
2
4
0
H204
H104
H203
H103
35
25
30
15
20
5
10
0
H204
H104
H203
H103
400
300
200
100
0
H204
H104
H203
H103
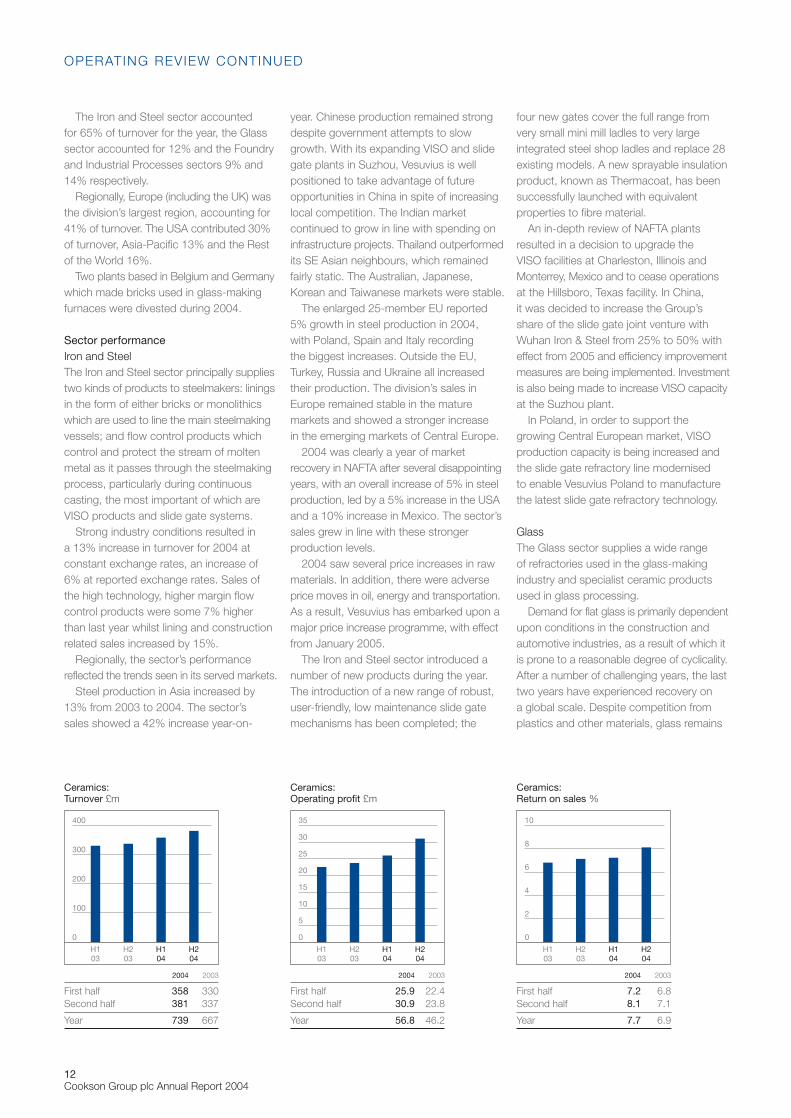
2004 2003
First half 358 330Second half 381 337
Year 739 667
Ceramics: Turnover £m
2004 2003
First half 25.9 22.4Second half 30.9 23.8
Year 56.8 46.2
Ceramics: Operating profit £m
2004 2003
First half 7.2 6.8Second half 8.1 7.1
Year 7.7 6.9
Ceramics: Return on sales %
13Cookson Group plc Annual Report 2004
the material of choice for glazing and the packaging of many drinks and otherliquids, and the demand for container glasscontinues to be strong.
Turnover for the Glass sector increasedby 18% in 2004 compared with the previousyear at constant exchange rates, up 11%at reported exchange rates. In the hotfurnaces area, our US business Monofrax,which manufactures fused cast productsused in glass-making furnaces, performedstrongly due to expansion in Europe andAsia and the weak US dollar. In the area of glass transforming, all product linesperformed well compared to last year. Themain applications for fused silica (solar andglass transforming) enjoyed market growth.Solar grew by 30% and, despite strongcompetition, Vesuvius has maintained itsmarket share. Technical ceramics alsogrew strongly compared to last year.
Monofrax has developed a new applicationin nuclear waste treatment furnaces and in thin glass applications. Additionally, new metallurgical applications are beingfound for Zyarock rollers in silicon steel andstainless steel annealing and galvanising. Anew generation of tempering rolls is beingdeveloped and jumbo crucibles are beingvalidated by Japanese customers, offeringnew opportunities for growing business.
The fused silica plant in Kua Tang, Chinawas expanded during the past year with theopening of the second phase in January2004. This plant is our most modern and, along with the production of glasstempering rollers, it can now manufacturelarge diameter ceramic rollers, opening up new business opportunities in float
line furnaces which were previously theexclusive domain of steel rollers.
FoundryThe Foundry sector supplies an extensiverange of high performance refractory productsto ferrous and non-ferrous foundries.
The sector recorded turnover for the year which was 10% higher than last yearat constant exchange rates and 3% higherat reported exchange rates.
In NAFTA, market conditions improved inall areas, particularly in investment castingand steel foundries. In Europe, overallmarket conditions remained flat, althoughinvestment casting activities were morerobust as a result of improvements in theaerospace and industrial gas turbine sectors.NAFTA and Europe were both impacted by imported castings from China. In Asia-Pacific, continued strong growth in theChinese foundry sector reflects the generaleconomic acceleration in that region.
A number of new products wereintroduced in 2004 including filters for ironfoundry applications and low pressure stalktubes for the manufacture of automotivecomponents including aluminium wheels.Continued development of monolithics for the full range of foundry applicationssupported growth in this important productsector, particularly for aluminium castingapplications, taking advantage of largeprimary aluminium plant expansion projects in the Middle East. Developmentof customised rotary degassers for use in the purification of molten aluminium alsoresulted in business expansion with majoraluminium manufacturers.
In line with general market trends, keyresources were relocated to China.
Industrial ProcessesThe Industrial Processes sector provides a wide range of refractory products for a diversified range of industries which in general follow GDP trends, includinghydrocarbon processing, petrochemical,cement and incineration. Unlike most of theCeramics division’s activities, the activities ofthe Industrial Processes sector are mainlyproject-based and therefore linked to overallnew investment and renewal projects.
Sales for this sector in 2004 were 1%lower than 2003 at constant exchange ratesand 4% lower at reported exchange rates.
The strongest performing area wasconstruction and installation, driven by a number of major projects. The primaryaluminium industry remained stable overall,although NAFTA was weak.
Several new products were developedfor various industries including new bricksfor anode bake furnaces, chlorinators, gasturbines and coal gasification applications.A new range of basic bricks was introducedfor the cement and lime industry, enablingVesuvius to provide a full lining offering. Inmonolithics, a new range of non-wettingmonolithics has been developed foraluminium casthouses.
31% Continental Europe30% USA16% Rest of the World13% Asia-Pacific10% United Kingdom
Ceramics: Turnover by location of operation
65% Iron and Steel14% Industrial Processes12% Glass9% Foundry
Ceramics: Turnover by sector
28% USA27% Continental Europe19% Rest of the World18% Asia-Pacific8% United Kingdom
Ceramics: Turnover by location of customer
Electronics divisionOverview2004 was a year of change for theElectronics division with importantdevelopments in terms of both leadershipand focus.
Steve Corbett became Chief Executiveof the division in October, succeeding Ray Sharpe who resigned in May. Stevejoined Cookson in 1990 and prior to thisappointment had been Chief Executive of the Chemistry sector since 2002. Steve has initially assumed responsibilityfor the Chemistry and Assembly Materialssectors as well as divisional staff and R&D functions.
Changing customer attitudes towardssuppliers of materials for PCB fabricationand assembly resulted in a realignment ofthe division’s product and service offerings.Customers no longer value the “one stopshop” approach which the division’selectronics materials businesses had pursuedin recent years. Instead, they prefer to retaina competitive market throughout the supplychain. The Electronics division has thereforesought to unbundle its PCB-orientedproducts and services, in particularLaminates and Chemistry. This has enabledthe Chemistry sector to reposition resourcesto its important industrial markets – whichaccount for 50% of its business – andallowed Laminates to focus on returning to and then maintaining profitability.
Market overviewThe improved market conditions thatbecame evident in the last quarter of 2003 continued throughout 2004 for much of the global electronics industry.
Amongst the industry’s end markets, the established market drivers of PCs andmobile handsets grew strongly. WorldwidePC shipments grew by nearly 12% in 2004,accelerated by better performance andwireless accessibility. Mobile handsetvolumes were nearly 30% higher than in 2003 and recorded the highest evershipment level in the fourth quarter of 2004.Hard disk drive unit volumes grew by 24%versus 2003, fuelled by soaring demand for DVD recorders, game consoles andMP3 players. Consumer electronic devicescontinue to drive the electronics industry toan ever-increasing degree.
Regionally, Asia-Pacific experienced thestrongest industry growth in terms of bothproduction and local end market demand.PC shipments, for example, grew by 16%over 2003, driven in particular by growth in China and India. North America alsoexhibited good year-on-year growth whileEurope was more subdued.
The transition to lead-free productsaccelerated in 2004 in line with newregulations in Japan and the EU whichcome into force in 2005-2006. The use oflead-free products is a significant change,not just for the Assembly Materials sectorwhose solder products have traditionallycontained lead. Non-lead solders melt at higher temperatures and so all otherPCB components, including laminates and fabrication chemistries, must also be able to withstand these temperatures.
Divisional performance and initiativesThe Electronics division’s turnover andprofits grew significantly over the previousyear in 2004 as a result of more favourable
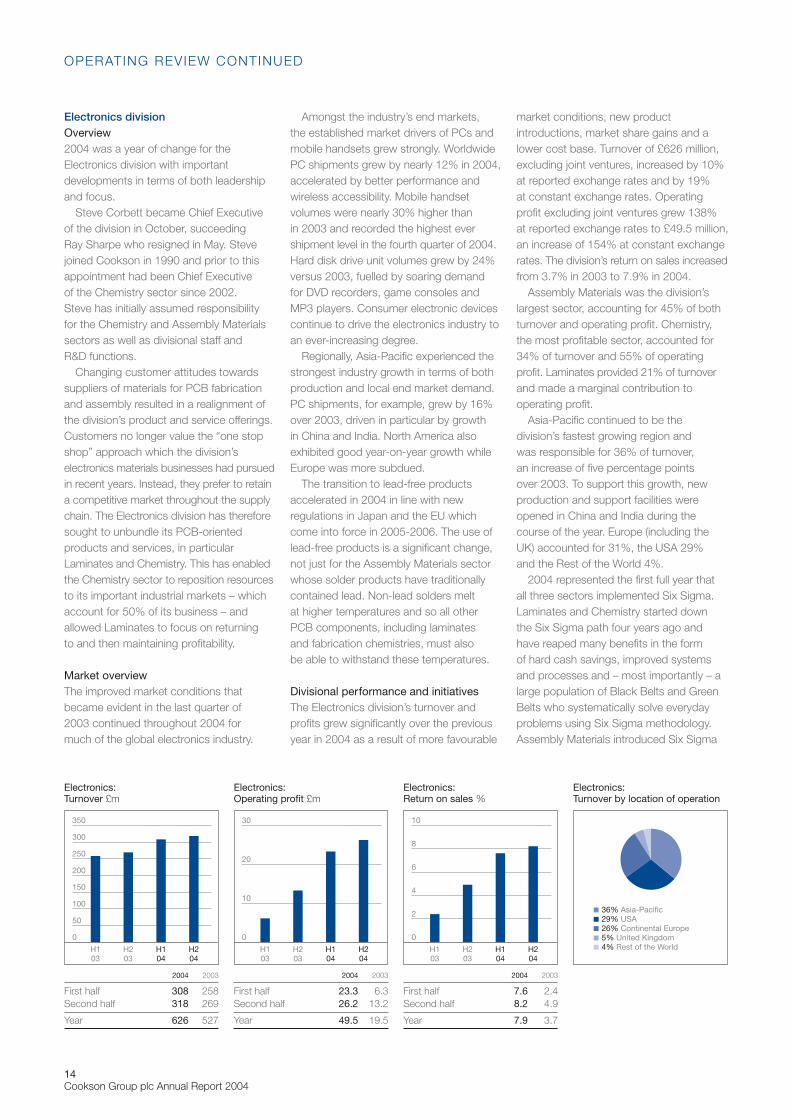
market conditions, new productintroductions, market share gains and alower cost base. Turnover of £626 million,excluding joint ventures, increased by 10%at reported exchange rates and by 19% at constant exchange rates. Operating profit excluding joint ventures grew 138% at reported exchange rates to £49.5 million, an increase of 154% at constant exchangerates. The division’s return on sales increasedfrom 3.7% in 2003 to 7.9% in 2004.
Assembly Materials was the division’slargest sector, accounting for 45% of bothturnover and operating profit. Chemistry,the most profitable sector, accounted for34% of turnover and 55% of operatingprofit. Laminates provided 21% of turnoverand made a marginal contribution tooperating profit.
Asia-Pacific continued to be thedivision’s fastest growing region and was responsible for 36% of turnover, an increase of five percentage points over 2003. To support this growth, newproduction and support facilities wereopened in China and India during thecourse of the year. Europe (including theUK) accounted for 31%, the USA 29% and the Rest of the World 4%.
2004 represented the first full year thatall three sectors implemented Six Sigma.Laminates and Chemistry started down the Six Sigma path four years ago andhave reaped many benefits in the form of hard cash savings, improved systemsand processes and – most importantly – alarge population of Black Belts and GreenBelts who systematically solve everydayproblems using Six Sigma methodology.Assembly Materials introduced Six Sigma
14Cookson Group plc Annual Report 2004
OPERATING REVIEW CONTINUED
36% Asia-Pacific29% USA26% Continental Europe5% United Kingdom4% Rest of the World
Electronics: Turnover by location of operation
10
6
8
2
4
0
H204
H104
H203
H103
30
20
10
0
H204
H104
H203
H103
350
200
250
100
150
50
0
300
H204
H104
H203
H103
2004 2003
First half 308 258Second half 318 269
Year 626 527
Electronics: Turnover £m
2004 2003
First half 23.3 6.3Second half 26.2 13.2
Year 49.5 19.5
Electronics: Operating profit £m
2004 2003
First half 7.6 2.4Second half 8.2 4.9
Year 7.9 3.7
Electronics: Return on sales %
15Cookson Group plc Annual Report 2004
early in 2004 and has already graduated a population of certified Black and GreenBelts. The Six Sigma culture is now firmlyestablished within the Electronics divisionfor the benefit of our own businesses andthose of our suppliers and customers.
Sector performanceAssembly MaterialsThe electronics industry accounts forapproximately 70% of Assembly Materials’turnover, with the remaining 30% going intoa variety of industrial and medical applications.
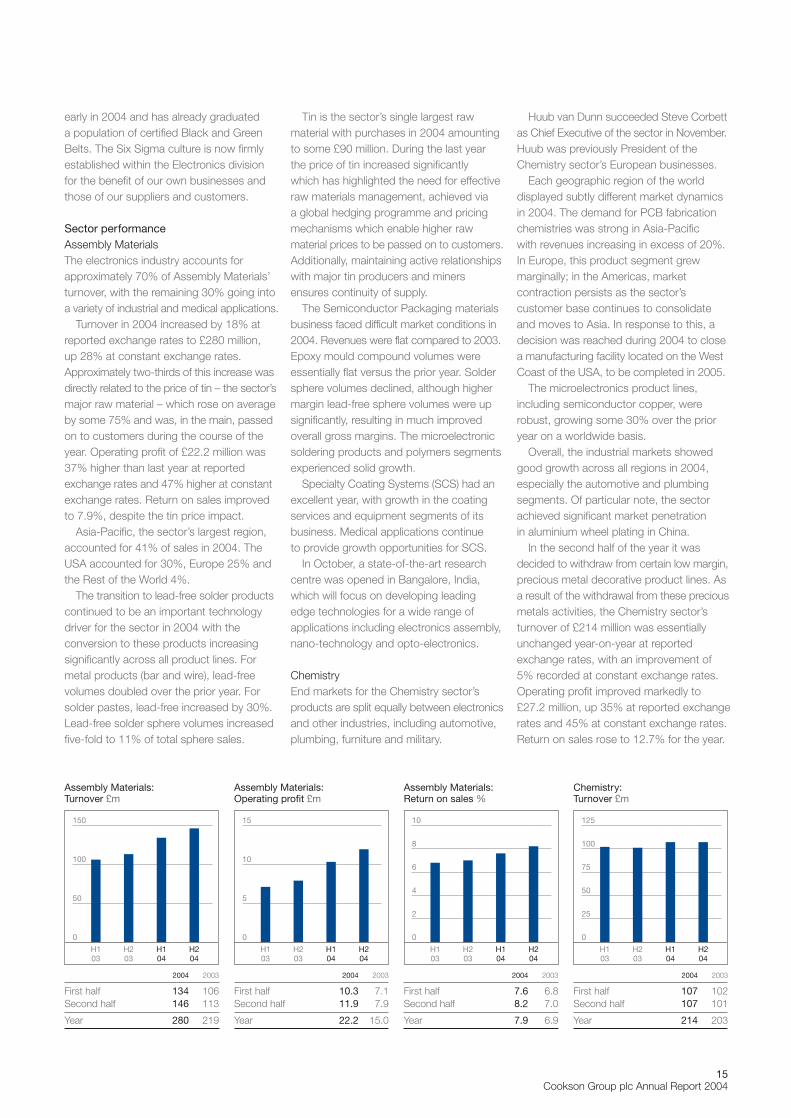
Turnover in 2004 increased by 18% atreported exchange rates to £280 million, up 28% at constant exchange rates.Approximately two-thirds of this increase wasdirectly related to the price of tin – the sector’smajor raw material – which rose on averageby some 75% and was, in the main, passedon to customers during the course of theyear. Operating profit of £22.2 million was37% higher than last year at reportedexchange rates and 47% higher at constantexchange rates. Return on sales improvedto 7.9%, despite the tin price impact.
Asia-Pacific, the sector’s largest region,accounted for 41% of sales in 2004. TheUSA accounted for 30%, Europe 25% andthe Rest of the World 4%.
The transition to lead-free solder productscontinued to be an important technologydriver for the sector in 2004 with theconversion to these products increasingsignificantly across all product lines. Formetal products (bar and wire), lead-freevolumes doubled over the prior year. Forsolder pastes, lead-free increased by 30%.Lead-free solder sphere volumes increasedfive-fold to 11% of total sphere sales.
Tin is the sector’s single largest rawmaterial with purchases in 2004 amountingto some £90 million. During the last year the price of tin increased significantly which has highlighted the need for effectiveraw materials management, achieved via a global hedging programme and pricingmechanisms which enable higher rawmaterial prices to be passed on to customers.Additionally, maintaining active relationshipswith major tin producers and minersensures continuity of supply.
The Semiconductor Packaging materialsbusiness faced difficult market conditions in2004. Revenues were flat compared to 2003.Epoxy mould compound volumes wereessentially flat versus the prior year. Soldersphere volumes declined, although highermargin lead-free sphere volumes were upsignificantly, resulting in much improvedoverall gross margins. The microelectronicsoldering products and polymers segmentsexperienced solid growth.
Specialty Coating Systems (SCS) had anexcellent year, with growth in the coatingservices and equipment segments of itsbusiness. Medical applications continue to provide growth opportunities for SCS.
In October, a state-of-the-art researchcentre was opened in Bangalore, India,which will focus on developing leadingedge technologies for a wide range ofapplications including electronics assembly,nano-technology and opto-electronics.
ChemistryEnd markets for the Chemistry sector’sproducts are split equally between electronicsand other industries, including automotive,plumbing, furniture and military.
Huub van Dunn succeeded Steve Corbettas Chief Executive of the sector in November.Huub was previously President of theChemistry sector’s European businesses.
Each geographic region of the worlddisplayed subtly different market dynamicsin 2004. The demand for PCB fabricationchemistries was strong in Asia-Pacific with revenues increasing in excess of 20%.In Europe, this product segment grewmarginally; in the Americas, marketcontraction persists as the sector’scustomer base continues to consolidateand moves to Asia. In response to this, adecision was reached during 2004 to closea manufacturing facility located on the WestCoast of the USA, to be completed in 2005.
The microelectronics product lines,including semiconductor copper, wererobust, growing some 30% over the prioryear on a worldwide basis.
Overall, the industrial markets showedgood growth across all regions in 2004,especially the automotive and plumbingsegments. Of particular note, the sectorachieved significant market penetration in aluminium wheel plating in China.
In the second half of the year it wasdecided to withdraw from certain low margin,precious metal decorative product lines. Asa result of the withdrawal from these preciousmetals activities, the Chemistry sector’sturnover of £214 million was essentiallyunchanged year-on-year at reportedexchange rates, with an improvement of 5% recorded at constant exchange rates.Operating profit improved markedly to£27.2 million, up 35% at reported exchangerates and 45% at constant exchange rates.Return on sales rose to 12.7% for the year.
10
6
8
2
4
0
H204
H104
H203
H103
15
10
5
0
H204
H104
H203
H103
150
100
50
0
H204
H104
H203
H103
2004 2003
First half 134 106Second half 146 113
Year 280 219
Assembly Materials: Turnover £m
2004 2003
First half 10.3 7.1Second half 11.9 7.9
Year 22.2 15.0
Assembly Materials: Operating profit £m
2004 2003
First half 7.6 6.8Second half 8.2 7.0
Year 7.9 6.9
Assembly Materials: Return on sales %
125
75
100
50
25
0
H204
H104
H203
H103
2004 2003
First half 107 102Second half 107 101
Year 214 203
Chemistry: Turnover £m
Geographically, the sector’s largest regionwas Europe, which also has the largestproportion of non-electronics activities, and accounted for 42% of the sector’sturnover for 2004. The USA provided 29%of turnover, Asia-Pacific 23% and the Restof the World 6%.
Investment during the course of the yearlargely focused on two areas. Firstly, theunbundling of the Laminates and Chemistrysectors’ offering to PCB fabricators allowedChemistry to reallocate resources to itsimportant non-electronics industrial marketsand products. These include: plating onplastic, an exciting development withparticular use in automotive applications;environmentally friendly products includinghexavalent chromium-free, lead-free andcadmium-free; and improved corrosion and wear resistant coatings.
Secondly, the sector continued to buildits global presence in line with customerneeds. In particular, the business continuesto develop in Asia-Pacific with significantadditions to the region’s technicalsalesforce made during 2004. To supportthis growth, a technical centre was openedin Shenzhen, China and a divisional salesand technical support laboratory wasestablished in Shanghai. Elsewhere,activities in Mexico have been expanded.
During the course of 2004, theChemistry business was challenged by rising raw material costs. In particular,nickel prices increased significantly as didraw materials and packaging materialslinked to petrochemical precursors. Priceincreases were implemented to pass along the increased raw material costswhere possible.
Competition continues to drivecommoditisation in the PCB fabricationmarket, particularly in primary imaging. All major competitors are targeting theexplosive growth in Asia and are investingin facilities and support personnel.
LaminatesLaminates, the only one of the division’sthree sectors whose products are soldexclusively into the electronics industry,continued to recover in 2004 from thethree-year industry downturn it hadexperienced since 2001. In October, the sector’s Chief Operating Officer Rick Richesin replaced Joe Santolucito as Chief Executive.
General market conditions improvedsignificantly during 2004, with demand forproducts related to high reliability serverapplications and lead-free assembly fuellinggrowth. Markets for specialised substratesin automotive and high-frequency applicationswere also strong.
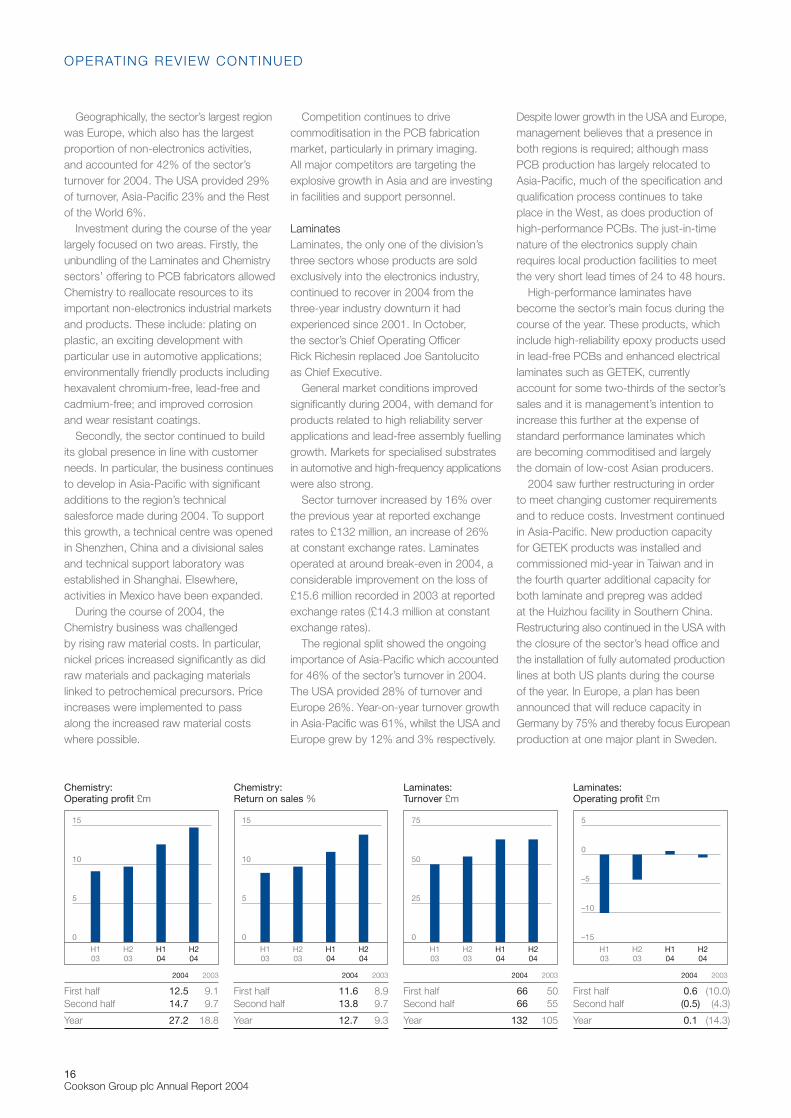
Sector turnover increased by 16% overthe previous year at reported exchangerates to £132 million, an increase of 26% at constant exchange rates. Laminatesoperated at around break-even in 2004, aconsiderable improvement on the loss of£15.6 million recorded in 2003 at reportedexchange rates (£14.3 million at constantexchange rates).
The regional split showed the ongoingimportance of Asia-Pacific which accountedfor 46% of the sector’s turnover in 2004.The USA provided 28% of turnover andEurope 26%. Year-on-year turnover growthin Asia-Pacific was 61%, whilst the USA andEurope grew by 12% and 3% respectively.
Despite lower growth in the USA and Europe,management believes that a presence inboth regions is required; although massPCB production has largely relocated toAsia-Pacific, much of the specification andqualification process continues to takeplace in the West, as does production ofhigh-performance PCBs. The just-in-timenature of the electronics supply chainrequires local production facilities to meetthe very short lead times of 24 to 48 hours.
High-performance laminates havebecome the sector’s main focus during thecourse of the year. These products, whichinclude high-reliability epoxy products usedin lead-free PCBs and enhanced electricallaminates such as GETEK, currentlyaccount for some two-thirds of the sector’ssales and it is management’s intention toincrease this further at the expense ofstandard performance laminates which are becoming commoditised and largelythe domain of low-cost Asian producers.
2004 saw further restructuring in order to meet changing customer requirementsand to reduce costs. Investment continuedin Asia-Pacific. New production capacity for GETEK products was installed andcommissioned mid-year in Taiwan and inthe fourth quarter additional capacity forboth laminate and prepreg was added at the Huizhou facility in Southern China.Restructuring also continued in the USA withthe closure of the sector’s head office andthe installation of fully automated productionlines at both US plants during the course of the year. In Europe, a plan has beenannounced that will reduce capacity inGermany by 75% and thereby focus Europeanproduction at one major plant in Sweden.
16Cookson Group plc Annual Report 2004
OPERATING REVIEW CONTINUED
5
0
–10
–5
–15
H204
H104
H203
H103
75
50
25
0
H204
H104
H203
H103
2004 2003
First half 66 50Second half 66 55
Year 132 105
Laminates: Turnover £m
2004 2003
First half 0.6 (10.0)Second half (0.5) (4.3)
Year 0.1 (14.3)
Laminates: Operating profit £m
15
10
5
0
H204
H104
H203
H103
2004 2003
First half 12.5 9.1Second half 14.7 9.7
Year 27.2 18.8
Chemistry: Operating profit £m
2004 2003
First half 11.6 8.9Second half 13.8 9.7
Year 12.7 9.3
Chemistry: Return on sales %
15
10
5
0
H204
H104
H203
H103
17Cookson Group plc Annual Report 2004
Raw material costs increased sharply for two of the sector’s main commodities,copper foil and woven glass cloth. Epoxyresin prices also increased, driven byescalating oil prices. Shortages of bothcopper and glass cloth were evident duringthe first half of 2004 as suppliers restrictedcapacity in order to drive up prices. Thesecosts were passed on to customers throughprogrammed price increases during thefirst three quarters of the year.
Significant market share increases wereachieved in both the USA and Asia. Newmulti-year supply agreements with threemajor PCB manufacturers were successfullycompleted, owing to our advanced productportfolio and global geographic presence.
Precious Metals divisionMarket overviewIn 2004, the Precious Metals division facedchallenges in both its leading markets, theUSA and Europe. Demand for finishedjewellery products is influenced to a largeextent by both consumer confidence andconsumer preferences. The fourth quarteris the most important for many retailbusinesses and consumer confidence was depressed in the USA and Europethroughout much of this period. This wasreflected in the experience of retailers in general in these regions where thenormal Christmas shopping season began later and was shorter in durationthan anticipated, leading to disappointingresults across the retail sector.
The preference of buyers and wearers of jewellery for white metals and gemstonejewellery rather than yellow gold items, whichhad been noted in 2003, continued in 2004.
The price of precious metals – particularlygold – also has an impact on jewellerydemand as retailers are reluctant to holdinventory when prices are high. Goldtraded in a range from $375/ounce to$455/ounce during the year, reaching itspeak in early December. The price of silverreached a high for the year of $8.22 in earlyApril before falling to its low point of $5.44in mid-May.
The major destocking programme, ledby US giant Wal-Mart, which took place in the first half of 2003, was not repeatedduring 2004.
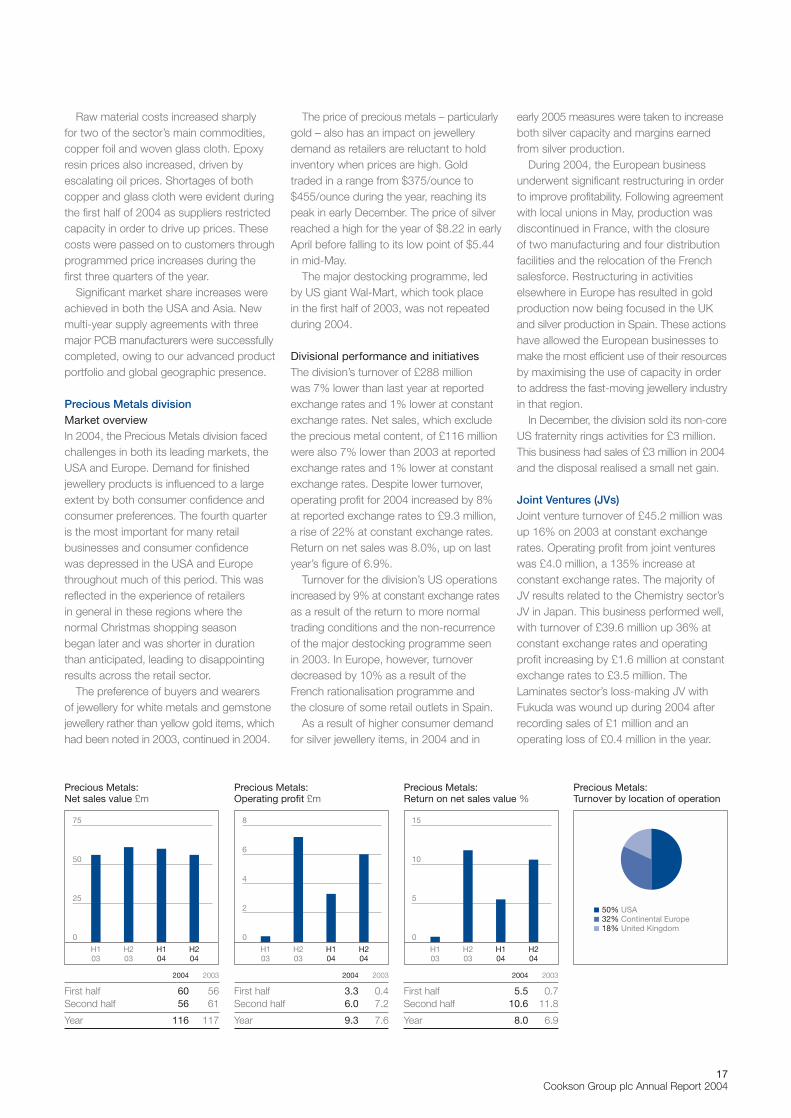
Divisional performance and initiativesThe division’s turnover of £288 million was 7% lower than last year at reportedexchange rates and 1% lower at constantexchange rates. Net sales, which excludethe precious metal content, of £116 millionwere also 7% lower than 2003 at reportedexchange rates and 1% lower at constantexchange rates. Despite lower turnover,operating profit for 2004 increased by 8%at reported exchange rates to £9.3 million,a rise of 22% at constant exchange rates.Return on net sales was 8.0%, up on lastyear’s figure of 6.9%.
Turnover for the division’s US operationsincreased by 9% at constant exchange ratesas a result of the return to more normaltrading conditions and the non-recurrenceof the major destocking programme seenin 2003. In Europe, however, turnoverdecreased by 10% as a result of theFrench rationalisation programme and the closure of some retail outlets in Spain.
As a result of higher consumer demandfor silver jewellery items, in 2004 and in
early 2005 measures were taken to increaseboth silver capacity and margins earnedfrom silver production.
During 2004, the European businessunderwent significant restructuring in orderto improve profitability. Following agreementwith local unions in May, production wasdiscontinued in France, with the closure of two manufacturing and four distributionfacilities and the relocation of the Frenchsalesforce. Restructuring in activitieselsewhere in Europe has resulted in goldproduction now being focused in the UKand silver production in Spain. These actionshave allowed the European businesses tomake the most efficient use of their resourcesby maximising the use of capacity in orderto address the fast-moving jewellery industryin that region.
In December, the division sold its non-coreUS fraternity rings activities for £3 million.This business had sales of £3 million in 2004and the disposal realised a small net gain.
Joint Ventures (JVs)Joint venture turnover of £45.2 million wasup 16% on 2003 at constant exchangerates. Operating profit from joint ventureswas £4.0 million, a 135% increase atconstant exchange rates. The majority ofJV results related to the Chemistry sector’sJV in Japan. This business performed well,with turnover of £39.6 million up 36% atconstant exchange rates and operatingprofit increasing by £1.6 million at constantexchange rates to £3.5 million. TheLaminates sector’s loss-making JV withFukuda was wound up during 2004 afterrecording sales of £1 million and anoperating loss of £0.4 million in the year.
75
50
25
0
H204
H104
H203
H103
8
4
6
2
0
H204
H104
H203
H103
15
5
10
0
H204
H104
H203
H103
2004 2003
First half 60 56Second half 56 61
Year 116 117
Precious Metals: Net sales value £m
2004 2003
First half 3.3 0.4Second half 6.0 7.2
Year 9.3 7.6
Precious Metals: Operating profit £m
2004 2003
First half 5.5 0.7Second half 10.6 11.8
Year 8.0 6.9
Precious Metals: Return on net sales value %
50% USA32% Continental Europe18% United Kingdom
Precious Metals: Turnover by location of operation
18Cookson Group plc Annual Report 2004
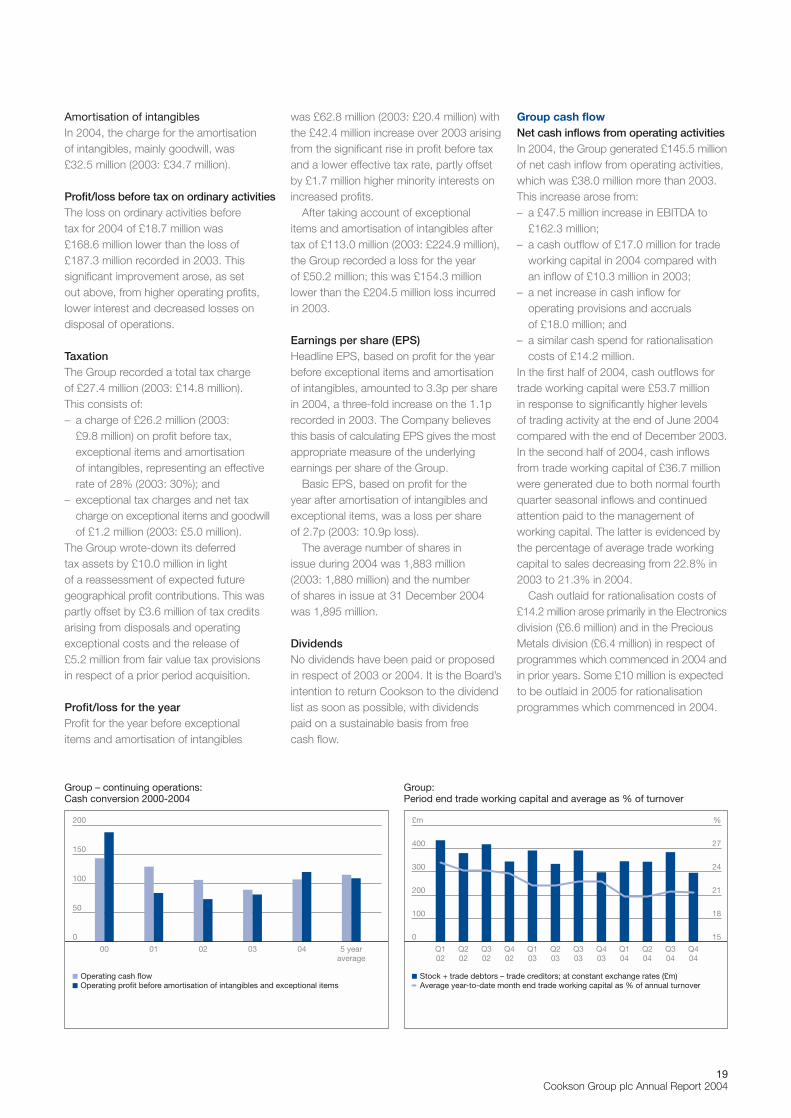
Group profit and loss Profit before tax, exceptional items and amortisation of intangiblesGroup profit before tax, exceptional items and amortisation of intangibles was £93.1 million for 2004, which was£60.5 million higher than 2003. This increasearose as follows: – £44.6 million (60%) increase in operating
profit from continuing operations atconstant exchange rates;
– eradication of losses of £17.0 million that were incurred by operationsdiscontinued in 2003, predominantlySpeedline;
– £5.1 million decrease in interest; and– £6.2 million adverse exchange rate
translation variance for operating profit of continuing operations.
The adverse exchange rate translationeffect arose mainly as a consequence of the weakness of the US dollar and its “tracking” currencies versus sterling.
The decrease in interest in 2004 from£31.6 million to £26.5 million arose primarilyfrom a lower charge for the amortisation ofrefinancing fees and a favourable exchangerate impact of £2.8 million. The averageinterest rate on drawn borrowings, excluding
the amortisation of refinancing fees and thedeferred income from interest rate swaps,was 6.8%, similar to that of 2003. Themargins on the new bank facility arrangedin March 2005 are at a lower level than theprevious facilities.
Exceptional items and amortisation of intangibles Operating exceptional itemsIn 2004, operating exceptional charges of £22.7 million (2003: £22.2 million) arose,consisting of £7.9 million of asset write-offsand £14.8 million of cash-related costs. Ofthe total charge for 2004:– £2.9 million arose in the Ceramics
division for the rationalisation of threemanufacturing facilities in the USA;
– £9.9 million related to programmes tooptimise the manufacturing capacity andproduct offering of the Laminates sectorof the Electronics division in the USA andEurope and to reorganise the divisionaland sector management structures; and
– £9.9 million arose in respect of theprogramme to reorganise the PreciousMetals division’s European operations.
An exceptional interest charge of £2.4 millionarose in 2003; no charge arose in 2004.
Net loss on disposal of operationsA net loss on disposal of operations of £39.8 million arose in 2004 (2003:£165.7 million), consisting of a net lossbefore goodwill of £27.5 million and awrite-back/off of goodwill of £12.3 million,primarily from the following:– sale of two brickmaking plants in
Europe in the Ceramics division (£33.2 million); and
– winding up of the Cookson Fukuda joint venture in the UK in which theGroup had a 50% share (£7.4 million).
The net loss in 2003 of £165.7 million wasmainly in respect of the sale of Speedlineand the Precision Products businesses.
Net (loss)/profit on fixed assetsA net loss of £16.8 million in 2004 (2003: £5.1 million profit) was due primarily to a £17.9 million write-down in the value of the Group’s investment in a revenue sharing arrangement put in place in 1998 with ELI Inc. over a fibre optic cable network in the USA.
F INANCIAL REVIEW
Dennis Millard Group Finance Director
2004 2003
Continuing operations 119.6 81.2– Ceramics 56.8 49.8– Electronics 49.5 20.8– Precious Metals 9.3 8.6– Joint ventures 4.0 2.0Discontinued operations – (17.0)
Group operating profit 119.6 64.2Interest (26.5) (31.6)
Profit before tax 93.1 32.6
Group: Profit before tax £m
2004 2003
First half 42.0 5.5Second half 51.1 27.1
Year 93.1 32.6
Group: Profit before tax £m
60
40
20
0
H204
H104
H203
H103
200
150
100
50
0
0403020100
Group: Profit before tax £m 2000-2004
All charts and tables at constant exchange rates unless otherwise stated.
19Cookson Group plc Annual Report 2004
Amortisation of intangiblesIn 2004, the charge for the amortisation of intangibles, mainly goodwill, was £32.5 million (2003: £34.7 million).
Profit/loss before tax on ordinary activitiesThe loss on ordinary activities before tax for 2004 of £18.7 million was £168.6 million lower than the loss of£187.3 million recorded in 2003. Thissignificant improvement arose, as set out above, from higher operating profits,lower interest and decreased losses ondisposal of operations.
TaxationThe Group recorded a total tax charge of £27.4 million (2003: £14.8 million). This consists of:– a charge of £26.2 million (2003:
£9.8 million) on profit before tax,exceptional items and amortisation of intangibles, representing an effectiverate of 28% (2003: 30%); and
– exceptional tax charges and net taxcharge on exceptional items and goodwillof £1.2 million (2003: £5.0 million).
The Group wrote-down its deferred tax assets by £10.0 million in light of a reassessment of expected futuregeographical profit contributions. This waspartly offset by £3.6 million of tax creditsarising from disposals and operatingexceptional costs and the release of £5.2 million from fair value tax provisions in respect of a prior period acquisition.
Profit/loss for the year Profit for the year before exceptional items and amortisation of intangibles
was £62.8 million (2003: £20.4 million) withthe £42.4 million increase over 2003 arisingfrom the significant rise in profit before taxand a lower effective tax rate, partly offsetby £1.7 million higher minority interests onincreased profits.
After taking account of exceptional items and amortisation of intangibles aftertax of £113.0 million (2003: £224.9 million),the Group recorded a loss for the year of £50.2 million; this was £154.3 millionlower than the £204.5 million loss incurredin 2003.
Earnings per share (EPS)Headline EPS, based on profit for the yearbefore exceptional items and amortisationof intangibles, amounted to 3.3p per sharein 2004, a three-fold increase on the 1.1precorded in 2003. The Company believesthis basis of calculating EPS gives the mostappropriate measure of the underlyingearnings per share of the Group.
Basic EPS, based on profit for the year after amortisation of intangibles andexceptional items, was a loss per share of 2.7p (2003: 10.9p loss).
The average number of shares in issue during 2004 was 1,883 million (2003: 1,880 million) and the number of shares in issue at 31 December 2004was 1,895 million.
DividendsNo dividends have been paid or proposedin respect of 2003 or 2004. It is the Board’sintention to return Cookson to the dividendlist as soon as possible, with dividendspaid on a sustainable basis from free cash flow.
Group cash flowNet cash inflows from operating activitiesIn 2004, the Group generated £145.5 millionof net cash inflow from operating activities,which was £38.0 million more than 2003.This increase arose from: – a £47.5 million increase in EBITDA to
£162.3 million;– a cash outflow of £17.0 million for trade
working capital in 2004 compared withan inflow of £10.3 million in 2003;
– a net increase in cash inflow foroperating provisions and accruals of £18.0 million; and
– a similar cash spend for rationalisationcosts of £14.2 million.
In the first half of 2004, cash outflows fortrade working capital were £53.7 million in response to significantly higher levels of trading activity at the end of June 2004compared with the end of December 2003.In the second half of 2004, cash inflowsfrom trade working capital of £36.7 millionwere generated due to both normal fourthquarter seasonal inflows and continuedattention paid to the management ofworking capital. The latter is evidenced bythe percentage of average trade workingcapital to sales decreasing from 22.8% in2003 to 21.3% in 2004.
Cash outlaid for rationalisation costs of£14.2 million arose primarily in the Electronicsdivision (£6.6 million) and in the PreciousMetals division (£6.4 million) in respect ofprogrammes which commenced in 2004 andin prior years. Some £10 million is expectedto be outlaid in 2005 for rationalisationprogrammes which commenced in 2004.
200
150
100
50
0
5 yearaverage
02 03 040100
Operating cash flowOperating profit before amortisation of intangibles and exceptional items
Group – continuing operations:Cash conversion 2000-2004
£m
400
300
200
100
0
%
27
24
21
18
15
Q404
Q302
Q402
Q103
Q203
Q303
Q403
Q104
Q204
Q304
Q202
Q102
Stock + trade debtors – trade creditors; at constant exchange rates (£m)Average year-to-date month end trade working capital as % of annual turnover
Group: Period end trade working capital and average as % of turnover
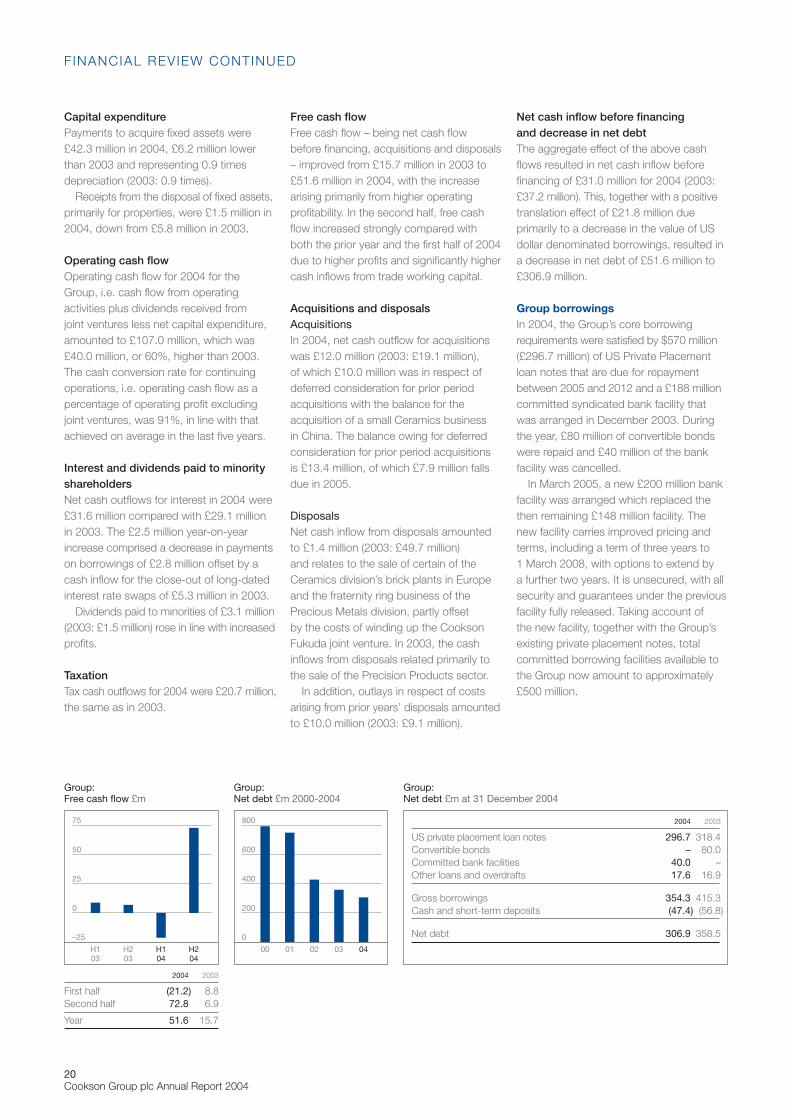
20Cookson Group plc Annual Report 2004
Capital expenditurePayments to acquire fixed assets were£42.3 million in 2004, £6.2 million lowerthan 2003 and representing 0.9 timesdepreciation (2003: 0.9 times).
Receipts from the disposal of fixed assets,primarily for properties, were £1.5 million in2004, down from £5.8 million in 2003.
Operating cash flowOperating cash flow for 2004 for theGroup, i.e. cash flow from operatingactivities plus dividends received from joint ventures less net capital expenditure,amounted to £107.0 million, which was£40.0 million, or 60%, higher than 2003.The cash conversion rate for continuingoperations, i.e. operating cash flow as apercentage of operating profit excludingjoint ventures, was 91%, in line with thatachieved on average in the last five years.
Interest and dividends paid to minorityshareholdersNet cash outflows for interest in 2004 were£31.6 million compared with £29.1 millionin 2003. The £2.5 million year-on-yearincrease comprised a decrease in paymentson borrowings of £2.8 million offset by acash inflow for the close-out of long-datedinterest rate swaps of £5.3 million in 2003.
Dividends paid to minorities of £3.1 million(2003: £1.5 million) rose in line with increasedprofits.
TaxationTax cash outflows for 2004 were £20.7 million,the same as in 2003.
Free cash flowFree cash flow – being net cash flow before financing, acquisitions and disposals– improved from £15.7 million in 2003 to£51.6 million in 2004, with the increasearising primarily from higher operatingprofitability. In the second half, free cashflow increased strongly compared withboth the prior year and the first half of 2004due to higher profits and significantly highercash inflows from trade working capital.
Acquisitions and disposalsAcquisitionsIn 2004, net cash outflow for acquisitionswas £12.0 million (2003: £19.1 million), of which £10.0 million was in respect ofdeferred consideration for prior periodacquisitions with the balance for theacquisition of a small Ceramics business in China. The balance owing for deferredconsideration for prior period acquisitionsis £13.4 million, of which £7.9 million fallsdue in 2005.
DisposalsNet cash inflow from disposals amountedto £1.4 million (2003: £49.7 million) and relates to the sale of certain of theCeramics division’s brick plants in Europeand the fraternity ring business of thePrecious Metals division, partly offset by the costs of winding up the CooksonFukuda joint venture. In 2003, the cashinflows from disposals related primarily tothe sale of the Precision Products sector.
In addition, outlays in respect of costsarising from prior years’ disposals amountedto £10.0 million (2003: £9.1 million).
Net cash inflow before financing and decrease in net debt The aggregate effect of the above cashflows resulted in net cash inflow beforefinancing of £31.0 million for 2004 (2003:£37.2 million). This, together with a positivetranslation effect of £21.8 million dueprimarily to a decrease in the value of USdollar denominated borrowings, resulted ina decrease in net debt of £51.6 million to£306.9 million.
Group borrowingsIn 2004, the Group’s core borrowingrequirements were satisfied by $570 million(£296.7 million) of US Private Placementloan notes that are due for repaymentbetween 2005 and 2012 and a £188 millioncommitted syndicated bank facility thatwas arranged in December 2003. Duringthe year, £80 million of convertible bondswere repaid and £40 million of the bankfacility was cancelled.
In March 2005, a new £200 million bankfacility was arranged which replaced thethen remaining £148 million facility. Thenew facility carries improved pricing andterms, including a term of three years to 1 March 2008, with options to extend by a further two years. It is unsecured, with allsecurity and guarantees under the previousfacility fully released. Taking account of the new facility, together with the Group’sexisting private placement notes, totalcommitted borrowing facilities available tothe Group now amount to approximately£500 million.
F INANCIAL REVIEW CONTINUED
2004 2003
US private placement loan notes 296.7 318.4Convertible bonds – 80.0Committed bank facilities 40.0 –Other loans and overdrafts 17.6 16.9
Gross borrowings 354.3 415.3Cash and short-term deposits (47.4) (56.8)
Net debt 306.9 358.5
Group: Net debt £m at 31 December 2004
Group: Free cash flow £m
75
0
50
25
–25
H204
H104
H203
H103
2004 2003
First half (21.2) 8.8Second half 72.8 6.9
Year 51.6 15.7
800
400
200
0
600
0402 030100
Group:Net debt £m 2000-2004
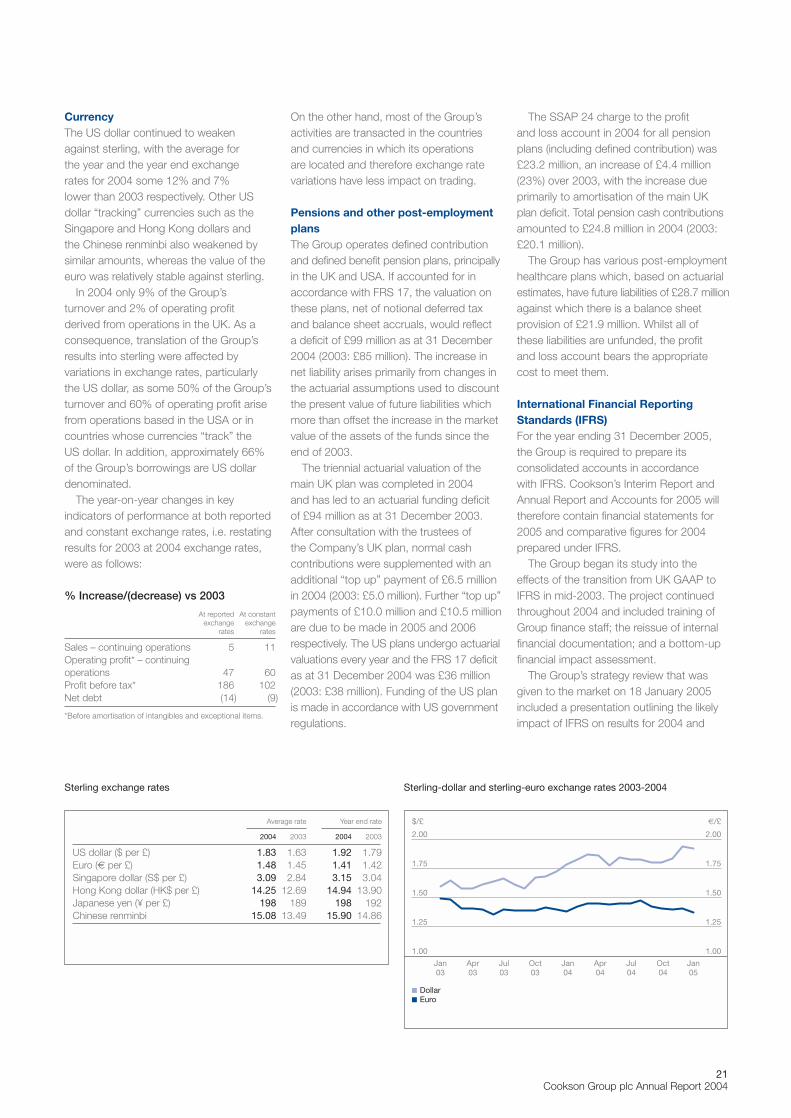
21Cookson Group plc Annual Report 2004
CurrencyThe US dollar continued to weaken against sterling, with the average for the year and the year end exchange rates for 2004 some 12% and 7% lower than 2003 respectively. Other USdollar “tracking” currencies such as theSingapore and Hong Kong dollars and the Chinese renminbi also weakened bysimilar amounts, whereas the value of theeuro was relatively stable against sterling.
In 2004 only 9% of the Group’s turnover and 2% of operating profit derived from operations in the UK. As aconsequence, translation of the Group’sresults into sterling were affected byvariations in exchange rates, particularlythe US dollar, as some 50% of the Group’sturnover and 60% of operating profit arisefrom operations based in the USA or incountries whose currencies “track” the US dollar. In addition, approximately 66%of the Group’s borrowings are US dollardenominated.
The year-on-year changes in keyindicators of performance at both reportedand constant exchange rates, i.e. restatingresults for 2003 at 2004 exchange rates,were as follows:
% Increase/(decrease) vs 2003
At reported At constantexchange exchange
rates rates
Sales – continuing operations 5 11Operating profit* – continuing operations 47 60Profit before tax* 186 102Net debt (14) (9)
*Before amortisation of intangibles and exceptional items.
On the other hand, most of the Group’sactivities are transacted in the countriesand currencies in which its operations are located and therefore exchange ratevariations have less impact on trading.
Pensions and other post-employmentplansThe Group operates defined contributionand defined benefit pension plans, principallyin the UK and USA. If accounted for inaccordance with FRS 17, the valuation onthese plans, net of notional deferred taxand balance sheet accruals, would reflect a deficit of £99 million as at 31 December2004 (2003: £85 million). The increase innet liability arises primarily from changes inthe actuarial assumptions used to discountthe present value of future liabilities whichmore than offset the increase in the marketvalue of the assets of the funds since theend of 2003.
The triennial actuarial valuation of themain UK plan was completed in 2004 and has led to an actuarial funding deficitof £94 million as at 31 December 2003.After consultation with the trustees of the Company’s UK plan, normal cashcontributions were supplemented with anadditional “top up” payment of £6.5 millionin 2004 (2003: £5.0 million). Further “top up”payments of £10.0 million and £10.5 millionare due to be made in 2005 and 2006respectively. The US plans undergo actuarialvaluations every year and the FRS 17 deficitas at 31 December 2004 was £36 million(2003: £38 million). Funding of the US planis made in accordance with US governmentregulations.
The SSAP 24 charge to the profit and loss account in 2004 for all pensionplans (including defined contribution) was£23.2 million, an increase of £4.4 million(23%) over 2003, with the increase dueprimarily to amortisation of the main UKplan deficit. Total pension cash contributionsamounted to £24.8 million in 2004 (2003:£20.1 million).
The Group has various post-employmenthealthcare plans which, based on actuarialestimates, have future liabilities of £28.7 millionagainst which there is a balance sheetprovision of £21.9 million. Whilst all of these liabilities are unfunded, the profit and loss account bears the appropriate cost to meet them.
International Financial ReportingStandards (IFRS)For the year ending 31 December 2005,the Group is required to prepare itsconsolidated accounts in accordance with IFRS. Cookson’s Interim Report andAnnual Report and Accounts for 2005 willtherefore contain financial statements for2005 and comparative figures for 2004prepared under IFRS.
The Group began its study into theeffects of the transition from UK GAAP toIFRS in mid-2003. The project continuedthroughout 2004 and included training ofGroup finance staff; the reissue of internalfinancial documentation; and a bottom-upfinancial impact assessment.
The Group’s strategy review that wasgiven to the market on 18 January 2005included a presentation outlining the likelyimpact of IFRS on results for 2004 and
Average rate Year end rate
2004 2003 2004 2003
US dollar ($ per £) 1.83 1.63 1.92 1.79Euro (€ per £) 1.48 1.45 1.41 1.42Singapore dollar (S$ per £) 3.09 2.84 3.15 3.04Hong Kong dollar (HK$ per £) 14.25 12.69 14.94 13.90Japanese yen (¥ per £) 198 189 198 192Chinese renminbi 15.08 13.49 15.90 14.86
Sterling exchange rates
Jan03
Apr03
Jul03
Oct03
Jan04
Apr04
Jul04
Oct04
Jan05
1.00
1.50
1.25
1.75
2.00
$/£
1.00
1.50
1.25
1.75
2.00
€/£
DollarEuro
Sterling-dollar and sterling-euro exchange rates 2003-2004
22Cookson Group plc Annual Report 2004
2005. This is available on the Companywebsite at www.cooksongroup.co.uk. A summary of the main IFRS differencesimpacting the Group covered in thepresentation is shown below. Thisinformation is preliminary and unaudited.
Deferred income on interest rate swapsIn 2000, the Group entered into a series of “fixed-to-floating” interest rate swaps in respect of its $570 million senior loannotes. Between 2001 and 2004 these swapswere closed-out for total cash proceedsand a surplus of £43.7 million. Under UKGAAP, this surplus was accounted for as deferred interest income and released to profit over the remaining life of theunderlying loan notes to which the swapshad related. As set out in note 17(iv) onpage 61, the Company had unreleaseddeferred interest income of £22.3 millionrecorded within “Other creditors” in its UKGAAP balance sheet as at 31 December2004. In 2004, £5.4 million of the deferredincome was released as a credit to netinterest and a further £4.1 million wasscheduled to be released in 2005.
Under IAS 39 “Financial Instruments:Recognition and Measurement”, thesurplus on the above close-outs of swapswould be recognised immediately. As IAS39 is only being implemented with effectfrom 1 January 2005, the £5.4 million creditto interest in 2004 will remain in the Group’s2004 IFRS profit and loss account, but the unreleased deferred interest income of £22.3 million will be credited to openingreserves in 2005.
Share option chargeUnder IFRS, all share option awards attracta “fair value” charge to the profit and lossaccount. Under UK GAAP, the majority of the Group’s share options attracted nocharge as they were issued at or above the prevailing market price. It is estimatedthat the awards outstanding during 2004would have attracted a charge of £2 millionunder IFRS.
Pensions and other post-retirement benefitsThe Group operates a number of pensionand other post-employment plans, as setout in note 30 on page 67, which includesthe appropriate FRS 17 disclosures.
Accounting for pension and other post-employment plans under IFRS is governedby IAS 19 “Employee Benefits”. Althoughthe full IAS 19 actuarial results are not yetfinalised, the total deficit brought on to theIFRS balance sheet at 31 December 2004will be broadly equivalent to the FRS 17deficit at 31 December 2003 (£161.9 million).Of this amount, £35.6 million was alreadyaccrued in the UK GAAP balance sheet at31 December 2003. Hence the net effecton shareholders’ funds on the transition to IFRS would be £126.3 million.
Joint venture accountingJoint venture results are currently reportedusing the “gross equity” method under UKGAAP. The Group presents its share of jointventure sales, operating profit, interest, taxand exceptional items in the profit and lossaccount, and its share of gross assets andliabilities in the balance sheet.
Under IFRS, the Group has decided it will record its share of joint venture netprofit after tax, to be included in “operatingprofit” in the profit and loss account and its share of joint venture net assets in thebalance sheet. The equivalent 2004 IFRSprofit and loss account would thereforeexclude joint venture sales of £45.2 millionand operating profit would be reduced by£1.7 million (see note 7 on page 54).
Goodwill amortisationUK GAAP requires goodwill to beamortised over its useful economic life, to amaximum of 20 years, with annual tests forimpairment. Under IFRS, goodwill would be“frozen” at its UK GAAP value on 1 January2004 (£505.6 million – see note 10, page55). Goodwill amortisation would no longerbe applied and thus the charge booked in 2004 of £31.7 million would be reversedin the 2004 IFRS profit and loss account.
In addition, the £317.8 million of pre-1998 goodwill previously written-off to reserves under UK GAAP will be written-off permanently.
Financial instrumentsAs stated above, the IFRS standard onfinancial instruments IAS 39 (and its relateddisclosure standard IAS 32) are only beingimplemented on 1 January 2005. Apartfrom the treatment of deferred income oninterest rate swaps, the Group expects littleimpact from the implementation of thesestandards, since:– it has few derivative contracts;– hedging activity is primarily sourced and
controlled by the Group Treasury function;– operations only take out short-dated
forward foreign exchange contracts;– commodity purchase contracts are
generally outside the scope of IAS 39; and– no significant embedded derivatives
have been identified.
OtherThe other IFRS transition differences that have been identified are as follows:– holiday pay accruals of c.£3 million
will be brought on to the balance sheetas a transitional adjustment as at 1 January 2004;
– finance leases under IFRS currentlyclassified as operating leases under UK GAAP will bring c.£5 million ofadditional debt and fixed assets on to the IFRS balance sheet as at 31 December 2004; and
– “marking to market” of available-for-sale investments will increase the carrying value of investments by c.£2 million as a transitionaladjustment as at 1 January 2004.
Dennis Millard Group Finance Director15 March 2005
F INANCIAL REVIEW CONTINUED
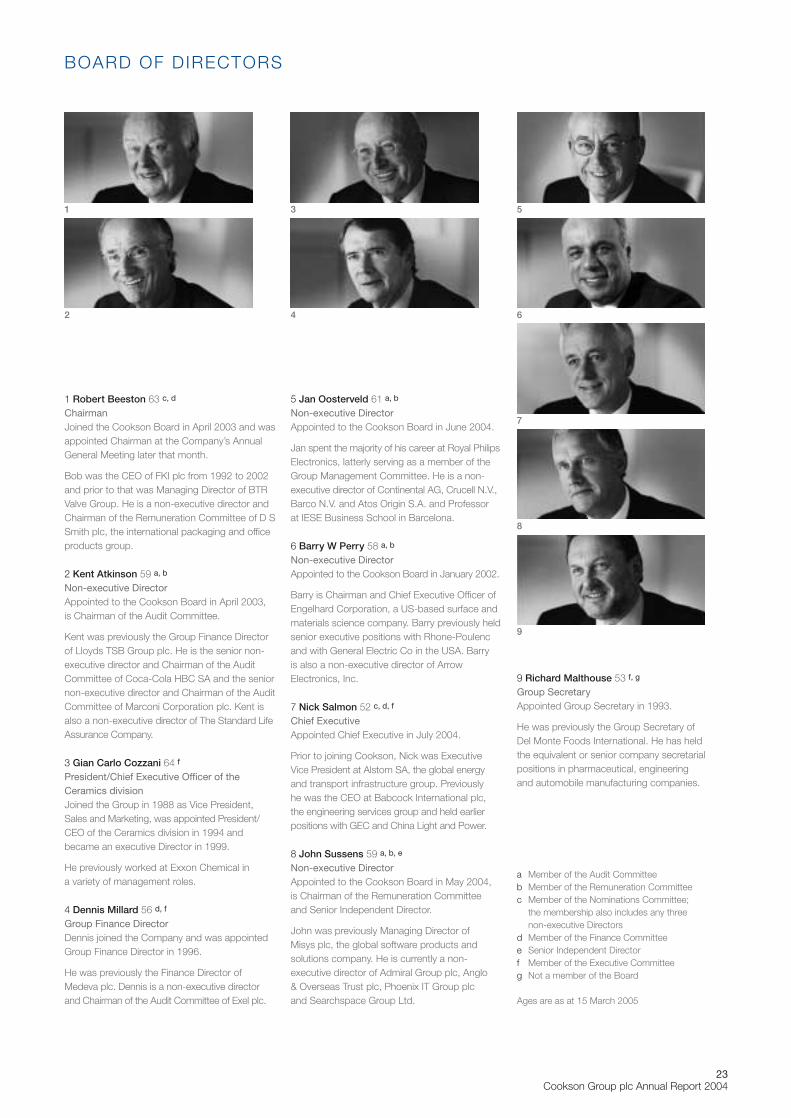
23Cookson Group plc Annual Report 2004
1 Robert Beeston 63 c, d
ChairmanJoined the Cookson Board in April 2003 and wasappointed Chairman at the Company’s AnnualGeneral Meeting later that month.
Bob was the CEO of FKI plc from 1992 to 2002and prior to that was Managing Director of BTRValve Group. He is a non-executive director andChairman of the Remuneration Committee of D SSmith plc, the international packaging and officeproducts group.
2 Kent Atkinson 59 a, b
Non-executive DirectorAppointed to the Cookson Board in April 2003, is Chairman of the Audit Committee.
Kent was previously the Group Finance Directorof Lloyds TSB Group plc. He is the senior non-executive director and Chairman of the AuditCommittee of Coca-Cola HBC SA and the seniornon-executive director and Chairman of the AuditCommittee of Marconi Corporation plc. Kent isalso a non-executive director of The Standard LifeAssurance Company.
3 Gian Carlo Cozzani 64 f
President/Chief Executive Officer of theCeramics divisionJoined the Group in 1988 as Vice President,Sales and Marketing, was appointed President/CEO of the Ceramics division in 1994 andbecame an executive Director in 1999.
He previously worked at Exxon Chemical in a variety of management roles.
4 Dennis Millard 56 d, f
Group Finance DirectorDennis joined the Company and was appointedGroup Finance Director in 1996.
He was previously the Finance Director ofMedeva plc. Dennis is a non-executive directorand Chairman of the Audit Committee of Exel plc.
5 Jan Oosterveld 61 a, b
Non-executive DirectorAppointed to the Cookson Board in June 2004.
Jan spent the majority of his career at Royal PhilipsElectronics, latterly serving as a member of theGroup Management Committee. He is a non-executive director of Continental AG, Crucell N.V.,Barco N.V. and Atos Origin S.A. and Professor at IESE Business School in Barcelona.
6 Barry W Perry 58 a, b
Non-executive DirectorAppointed to the Cookson Board in January 2002.
Barry is Chairman and Chief Executive Officer ofEngelhard Corporation, a US-based surface andmaterials science company. Barry previously heldsenior executive positions with Rhone-Poulencand with General Electric Co in the USA. Barry is also a non-executive director of ArrowElectronics, Inc.
7 Nick Salmon 52 c, d, f
Chief ExecutiveAppointed Chief Executive in July 2004.
Prior to joining Cookson, Nick was ExecutiveVice President at Alstom SA, the global energyand transport infrastructure group. Previously he was the CEO at Babcock International plc,the engineering services group and held earlierpositions with GEC and China Light and Power.
8 John Sussens 59 a, b, e
Non-executive DirectorAppointed to the Cookson Board in May 2004, is Chairman of the Remuneration Committee and Senior Independent Director.
John was previously Managing Director of Misys plc, the global software products andsolutions company. He is currently a non-executive director of Admiral Group plc, Anglo & Overseas Trust plc, Phoenix IT Group plc and Searchspace Group Ltd.
9 Richard Malthouse 53 f, g
Group SecretaryAppointed Group Secretary in 1993.
He was previously the Group Secretary of Del Monte Foods International. He has held the equivalent or senior company secretarialpositions in pharmaceutical, engineering and automobile manufacturing companies.
a Member of the Audit Committeeb Member of the Remuneration Committeec Member of the Nominations Committee;
the membership also includes any threenon-executive Directors
d Member of the Finance Committeee Senior Independent Directorf Member of the Executive Committeeg Not a member of the Board
Ages are as at 15 March 2005
BOARD OF DIRECTORS
1
2
3
4
5
6
7
8
9
24Cookson Group plc Annual Report 2004
The Directors submit their annual report together with the auditedaccounts of the Group and of the Company, Cookson Group plc,for the year ended 31 December 2004.
Principal activitiesCookson Group is a leading materials science company whichprovides materials, processes and services to customers worldwide.The Group operates as three divisions – Ceramics, Electronics andPrecious Metals. The Ceramics division is a world leading supplierof advanced flow control and refractory products and systems to the iron and steel industry and also supplies refractory liningmaterials for iron and steelmaking and other industrial processes.The Electronics division is a leading manufacturer and supplier ofmaterials and services to the electronics industry, primarily servingfabricators and assemblers of printed circuit boards, assemblers ofsemiconductor packaging and the electrical and industrial markets.The Precious Metals division is a leading supplier to the jewelleryindustry of fabricated precious metals products.
Review of 2004A review of Cookson’s results, the major developments occurringduring 2004 within each of its three divisions and of the Group’sfinancial position at the end of 2004 is given on pages 1 to 22.Events affecting the Group since the end of the year and likelyfuture developments are also referred to on those pages.
Group profit before tax, exceptional items and amortisation ofintangibles for 2004 was £93.1 million (2003: £32.6 million). Retainedprofit for the year before exceptional items and amortisation ofintangibles was £62.8 million (2003: £20.4 million) and a loss of£50.2 million (2003: loss of £204.5 million) after exceptional itemsand amortisation of intangibles.
During 2004, Cookson paid £12.0 million in respect of acquisitions of subsidiaries, joint ventures and other intangible assets anddisposed of interests in subsidiaries and joint ventures for a netconsideration of £1.4 million. Further details of these interestsacquired and sold during the year are given in note 24 on page 65.Capital expenditure by Group companies in 2004 amounted to£42.3 million (2003: £48.5 million). Further details of the Group’stangible fixed assets are given in note 11 on page 56.
Details of Cookson’s charitable donations made in the year are given in note 28 on page 66. In accordance with Companypolicy, no political donations were made in either 2004 or 2003.
The financial statements have been prepared on the goingconcern basis as the Directors consider that the Company and the Group have adequate resources to continue in operation forthe foreseeable future.
DividendsNo dividends were paid in 2004 or 2003 or are proposed for 2004. In January 2005, the Board stated that it intended to return tosustained dividend payment as soon as possible and that dividendswould be funded through cash flow and would be linked to theGroup’s underlying earnings.
Corporate governanceDetails are set out in the narrative below of the Company’s corporategovernance procedures and application of the principles of theCombined Code on Corporate Governance issued by the Financial
Reporting Council in July 2003 (“the Code”). The Company hascomplied with the provisions of the Code throughout the year ended31 December 2004. The Company also continues to monitor theintroduction of the US Sarbanes-Oxley Act 2002 and the regulationsthat relate to it. In this regard, the Company complies with itsrequirements insofar as they currently stand.
The Board Ultimate responsibility for the management of Cookson rests withthe Board of Directors. The Board primarily focuses upon strategicand policy issues. It approves the Group’s strategy and overseesthe allocation of resources and monitors the performance of theGroup in pursuit of this.
The Board currently has eight Directors, comprising the non-executive Chairman, the Chief Executive, two other executiveDirectors and four non-executive Directors. The Board considerseach of the non-executive Directors, Messrs M K Atkinson, J P Oosterveld, B W Perry and J G Sussens, to be independent of management and free from any business or other relationshipwhich could affect the exercise of their independent judgement. The Company has reviewed the availability of the non-executiveDirectors and considers that each of them is able to devote thenecessary amount of time to the Company’s business. The Boardnominates one of the non-executive Directors to act as SeniorIndependent Director and provide an alternative contact at Boardlevel, other than the Chairman, to whom shareholder matters can be addressed. During the year, Mr M K Atkinson held thisposition. Following the announcement that he has decided to step down from the Board with effect from 15 April 2005 to devotemore time to his other commitments, the Board has appointed Mr J G Sussens to be Senior Independent Director with immediateeffect. The Board is in the process of recruiting an additional non-executive Director, who in due course will succeed Mr Atkinson as Chairman of the Audit Committee.The biographical details ofindividual Directors are set out on page 23.
Mr D H Millard has also informed the Board of his intention to stepdown from the Board and leave the Company during the course of2005. Mr Millard has been Group Finance Director since 1996. Theprocess of recruiting a successor has commenced and Mr Millardhas agreed to continue in his role until such time as an appointmenthas been made and an appropriate transition effected.
The Articles of Association of the Company require that Directorsshould submit themselves for re-election at least every three years.Messrs G C Cozzani, B W Perry and D H Millard will therefore beretiring and offering themselves for re-election at this year’s AGMas set out in the Notice of AGM and on page 29. Mr Millard muststand for re-election even though he intends to leave the Companylater in the year.
The Board has a formal schedule of matters reserved to it anddelegates certain matters to committees as outlined below. TheBoard met as a full Board on seven scheduled occasions during2004. One of these meetings was held at a Cookson site andanother was combined with an off-site Strategy Day. In addition,the Chairman and the non-executive Directors meet routinely ontheir own without the executive Directors present and at least oncea year the non-executive Directors meet without the Chairmanpresent to discuss matters such as the Chairman’s performance.
D IRECTORS’ REPORT
25Cookson Group plc Annual Report 2004
Specific matters reserved for the Board include: reviewing Groupand divisional performance; approving significant transactionsincluding acquisitions, divestments and capital expenditure; settingand approving the Group’s strategy and annual budget; approvingthe Group’s financing and treasury policy; and approving Boardappointments and the remuneration of the non-executive Directors.In addition the Board considers research and development, andhealth, safety and environmental matters and reviews the Group’srisk management processes.
The division of responsibilities between the Chairman and the ChiefExecutive has been agreed by the Board and is set out in writing.The Chairman leads the Board and meets routinely with the ChiefExecutive and Group Secretary to discuss matters relating to itsefficient functioning. The Chairman continues to serve as a non-executive director and Chairman of the Remuneration Committeeof D S Smith plc. He has not acquired any further significantcommitments during the year.
The attendance of Directors at Board and principal Committeemeetings during the year was as follows:
Audit Remuneration NominationsBoard Committee Committee Committee
Chairman (non-executive)R G Beeston 7 (7) n/a n/a 2 (2)
Executive DirectorsG C Cozzani 7 (7) n/a n/a n/aD H Millard 7 (7) n/a n/a n/aN R Salmon (from 19/07/04) 4 (4) n/a n/a 1 (1)
Non-executive DirectorsM K Atkinson 7 (7) 4 (4) 6 (6) 2 (2)J P Oosterveld (from 15/06/04) 4 (5) 1 (2) 2 (3) 1 (1)B W Perry 6 (7) 3 (4) 3 (6) 2 (2)J G Sussens (from 01/05/04) 5 (6) 3 (3) 4 (4) 2 (2)
Directors retiring in 2004A G L Alexander (to 14/05/04) 2 (2) 2 (2) 3 (3) 1 (1)J F de Moller (to 01/10/04) 4 (5) 3 (3) 4 (4) 1 (1)S L Howard (to 04/11/04) 4 (6) n/a n/a 0 (1)R P Sharpe (to 19/05/04) 2 (2) n/a n/a n/a
NoteFigures in brackets indicate maximum number of meetings in the period when theindividual was a Board member.
Papers are provided to the Directors in advance of the relevantBoard or Committee meeting to enable them to make furtherenquiries about any matters prior to the meeting should they sowish. The Group Secretary oversees the distribution of these papersand ensures that there is an appropriate level of communicationbetween the Board and its Committees and between seniormanagement and non-executive Directors. He also keeps the Boardapprised of all relevant developments in corporate governance.
Performance evaluationThe Board evaluates its own performance and effectiveness andassesses the performance of its Committees and individual memberson an annual basis. In 2004 this process again involved the use of a questionnaire, designed with the assistance of an independent
adviser, being completed by each Director, thereby providing aframework for year-on-year comparison. In addition, a series ofone-to-one meetings between the Chairman and each member ofthe Board was held. The performance of the Chairman was in turnreviewed by the Senior Independent Director following consultationwith other members of the Board. The results of the evaluationswere collated by the independent adviser and then presented to theBoard for review. In general, it was concluded that the Board andits Committees operated effectively and that each individual Directorcontinued to contribute in full and demonstrated commitment to their role. A number of areas of potential improvement for theBoard were identified and follow-up action was then taken asnecessary, including increasing the proportion of the Board’s timespent on strategy and rescheduling the Board and Committeemeeting calendar to permit more time for Committee meetings. In addition it is proposed that going forward the Board will ensurethat it has greater visibility of managerial talent below the level of the Main Board and that the number of Board meetings held at operating units be increased. These last two measures areintended to assist the Board – and especially members of theNominations Committee – in strengthening the successionplanning process for the Group’s senior management positions.
Training and inductionThe Company ensures that all Directors are provided with detailsof seminars and training courses relevant to their role. They areencouraged to attend these as they consider appropriate and aresupported by the Company in so doing. Where a general trainingneed is identified, in-house training is provided to the full Board.The Group Secretary ensures that a full induction programme isprovided to all new Directors, including visits to manufacturingfacilities, meetings with key Group executives and introductions to the Company’s principal external advisers.
Relations with shareholdersThe Group reports its financial results to shareholders twice a year,with the publication of its Annual and Interim Reports. In conjunctionwith these announcements it gives presentations to institutionalinvestors and analysts, copies of which are posted on the Group’swebsite: www.cooksongroup.co.uk. In addition, the Group publishestrading statements after the first and third quarters giving salientunaudited financial figures. The Group maintains a regular dialogue with major institutional investors and regular updates on shareholder issues and discussions are provided to the Board.Board members also receive copies of significant analysts’ notesissued on the Company. All Directors normally attend the Group’sAGM, providing shareholders with the opportunity to questionthem about issues relating to the Group, either formally during the meeting or informally afterwards.
Board CommitteesThe principal Committees of the Board are the Audit, Remunerationand Nominations Committees. Each Committee has written termsof reference agreed by the Board. These are available to view onthe Company’s website.
The Audit Committee members are the non-executive Directors,namely Mr M K Atkinson, Mr J P Oosterveld, Mr B W Perry and Mr J G Sussens. During the year the Committee was chaired by Mr Atkinson, who the Board believes possesses the relevant
26Cookson Group plc Annual Report 2004
financial experience, as described by the Code. The Board is inthe process of recruiting a new non-executive Director with theintention that this person be appointed to succeed Mr Atkinson as Chairman of the Audit Committee.
The Group Finance Director, the Group Head of Internal Audit and the Company’s Auditor KPMG Audit Plc are normally invited to attend meetings and other executives are invited to attend asand when appropriate. The Committee meets regularly with theCompany’s Auditor without any executives being present.
The principal roles of the Committee are:
– assisting the Board in the discharge of its responsibilities inrespect of statutory and other financial reporting and in respectof its review of the effectiveness of the Group’s internal controlsand risk management systems;
– monitoring and reviewing the effectiveness of the Company’sinternal audit function;
– making recommendations to the Board on the appointment and dismissal of the Auditor;
– approving the remuneration and terms of engagement of the Auditor;
– monitoring and reviewing the Auditor’s independence, objectivityand effectiveness, taking into account professional and regulatoryrequirements; and
– helping to strengthen the independent position of the Auditor byproviding a direct channel of communication between them andthe non-executive Directors.
The Committee has established procedures for the receipt, retentionand treatment of complaints received by the Company includingaccounting, internal controls, auditing matters and confidentialcommunications from employees.
The Group Head of Internal Audit reports directly to the CommitteeChairman and the Committee reviews and approves the internalaudit work programme for each year.
During the year under review, the Committee met four times and reviewed, amongst other matters, the Company’s publishedfinancial results; updates on the Group’s International FinancialReporting Standards conversion project; updates on the Company’spreparedness for complying with the requirements of Section 404of the Sarbanes-Oxley Act; internal audit reports and managementcontrol issues; the scope of the external audit and its costeffectiveness; and the extent to which the Auditor’s remunerationfor non-audit services might affect their independence and objectivityin carrying out the audit.
More specifically, the responsibilities of the Committee weredischarged as follows:
– at its meetings in July 2004 and February 2005, the Committee reviewed the Company’s Interim Report andpreliminary announcement/Annual Report and Accounts,respectively. On both occasions, the Committee receivedreports from the Auditor identifying any accounting orjudgemental issues thereon requiring its attention;
– at its meeting in May 2004, the Committee reviewed theCompany’s Annual Report on Form 20-F, which is filed eachyear with the US Securities and Exchange Commission, togetherwith a report from the Auditor identifying any accounting orjudgemental issues thereon requiring its attention;
– a quarterly report from the Group Head of Internal Audit was presented at each of the four meetings. In addition, at the December 2004 meeting, the Group Head of Internal Audit submitted the function’s internal audit plans for 2005;
– the Auditor presented their audit plans at the December 2004 meeting;
– reports were presented at each of the four meetings detailingthe Company’s preparations to comply with the requirements of International Financial Reporting Standards and Section 404of the Sarbanes-Oxley Act together with, where appropriate,reports from the Auditor in order to allow the Committee toconsider any matters which required a Board decision in relation to either project;
– from time to time, executives were required to make presentationsto the Committee or to the full Board on the subject of risk, itsidentification, management and control; and
– as a matter of routine, the Committee was presented withinformation on significant litigation involving the Company.
As noted above, one of the duties of the Committee is to makerecommendations to the Board in relation to the appointment ofthe Auditor. A number of factors concerning the Auditor are takeninto account by the Committee in assessing whether to recommendthem for re-appointment. These include:
– the quality both of reports provided to the Committee and theBoard and of advice given;
– the level of understanding demonstrated of the Company’sbusinesses; and
– the objectivity of the Auditor’s views on the controls around theCompany and their ability to coordinate a global audit workingto tight deadlines.
The Committee has put in place safeguards to ensure that theindependence of the external audit is not compromised. Suchsafeguards include:
– seeking confirmation that the Auditor is independent of theCompany in their own professional judgement; and
– considering all the relationships between the Auditor and theCompany, including those relating to the provision of non-auditservices and whether this impairs, or appears to impair, theAuditor’s judgement or independence.
The Company has a policy governing the conduct of non-auditwork by the Auditor. Under that policy the Auditor is prohibitedfrom performing services where they:
– may be required to audit their own work;
– participate in activities that would normally be undertaken by management;
D IRECTORS’ REPORT CONTINUED
27Cookson Group plc Annual Report 2004
– are remunerated through a “success fee” structure, where successis dependent upon the audit; or
– act in an advocacy role for the Company.
Other than the above, the Company does not impose an automaticban on the Auditor undertaking non-audit work. The Auditor ispermitted to provide non-audit services that are not, or are notperceived to be, in conflict with auditor independence, providing theyhave the skill, competence and integrity to carry out the work in thebest interests of the Company. Services above a de minimis levelare submitted to the Committee for approval prior to engagementand all services are subsequently monitored by the Committee.
Details of the amounts paid to the Auditor during the year for auditand other services are set out in note 3 on page 52.
The Remuneration Committee members are the non-executiveDirectors, namely Mr M K Atkinson, Mr J P Oosterveld and Mr B W Perry and the Committee is chaired by Mr J G Sussens. The Committee’s principal roles are to recommend and monitorthe level and structure of remuneration for senior management and to set the appropriate remuneration for the Group Chairman,executive Directors and Group Secretary. Further details of theactivities of the Remuneration Committee are provided in theDirectors’ Remuneration Report on pages 31 to 39.
The Nominations Committee advises the Board on appointmentsto and retirements and resignations from the Board. The membersof the Committee are the Group Chairman, the Chief Executiveand any three non-executive Directors. The Committee meets as and when required and is chaired by the Group Chairman or a non-executive Director. The Group Chairman would not act asChairman of the Committee where the Committee was dealingwith the appointment of a successor to the Chairmanship. Formalmeetings are held to discuss relevant matters and there is also asignificant level of ongoing discussion between members of theCommittee, particularly when a recruitment exercise is taking place.
During the year under review a new Chief Executive and two new non-executive Directors were appointed to the Board. Whenconsidering the appointment of new Directors, the Committee drawsup specifications, taking into consideration the existing balance of skills, knowledge and experience on the Board and the ongoingrequirements of the Group. It utilises the services of an externalrecruitment consultancy to identify appropriate candidates, interviewsthose short-listed and then makes recommendations for eachappointment to the full Board. Care is taken to ensure that allproposed appointees have sufficient time available to devote to the role. Following the announcement of the resignations ofMessrs Atkinson and Millard, the Committee has commenced the process for recruiting a new non-executive Director and a new Group Finance Director.
The Nominations Committee also met during the year to review the Company’s succession plans. The Board as a wholeconsidered the Committee’s conclusions. As part of the Board’sperformance evaluation process, Directors identified a number of potential areas for improvement in the Board’s composition. The Committee will take account of these in recruiting for any new appointments.
The Board delegates certain responsibilities on an ad hoc basis to the Finance and Share Schemes Committees.
The Finance Committee is chaired by the Group Chairman, itsother members being the Chief Executive, Group Finance Directorand Group Treasurer. The Committee meets as and when requiredto consider approval for treasury-related matters.
The Share Schemes Committee’s membership consists of any twoDirectors. It meets as and when required to undertake administrativematters in relation to the Company’s share schemes.
In addition to the Committees of the Board described above, the Group has an Executive Committee which supports the Chief Executive in addressing Group-wide issues, reviewingperformance and determining Group operational policies andinitiatives. This Committee is chaired by the Chief Executive andcomprises the Group Finance Director, the Group Secretary, theChief Executives of each of the Group’s three divisions and thePresident of Cookson America Inc.
Formal authority is also designated to the Central Executivecomprising the Chief Executive, Group Finance Director and Group Secretary. The Central Executive is responsible for reviewingand approving capital expenditure, acquisitions and disposals at certain levels as determined by the Board. Responsibility forday-to-day operational management is delegated to the divisionalChief Executives.
Accountability and auditA responsibility statement of the Directors and a statement by the Auditor about their reporting responsibilities can be found onpages 42 and 43, respectively. There is no relevant informationthat has not been disclosed to the Auditor throughout the year.The Directors fulfil the responsibilities set out in their statementwithin the context of an overall control environment of centralstrategic direction and decentralised operating autonomy.
AuditorResolutions for the re-appointment of KPMG Audit Plc as Auditorof the Company and to authorise the Directors to determine theirremuneration are to be proposed at the AGM.
Internal control The Directors are responsible for the establishment and maintenanceof the Group’s system of internal control.
The Company has complied with the provisions of the Code on internal control which require that the Directors review theeffectiveness of the Group’s system of internal controls, includingfinancial, operational and compliance controls, and risk managementsystems. Whilst no system of internal control can provide absoluteassurance against material misstatement or loss, the Group’ssystem is designed to provide the Directors with reasonableassurance that problems are identified on a timely basis and aredealt with appropriately. Subject thereto, based on their review ofthe Group’s system of internal controls, which include disclosurecontrols and procedures, the Directors consider them to beeffective. Since the date of the review, there have been nosignificant changes in internal controls or other matters whichcould significantly affect them.
28Cookson Group plc Annual Report 2004
There is a continuous process for identifying, evaluating andmanaging the significant risks faced by Cookson.
The Group operates a risk management process designed to identify the key risks facing each business and reports to the Audit Committee on how those risks are being managed. As a basis for this report, each of the Group’s major business units produces a “risk map” which identifies their key risks andassesses the likelihood of those risks occurring, their impact if they do occur and the actions being taken to manage those risks to a desired level.
The internal control system is monitored and supported by theGroup’s internal audit function, which operates on a global basis.This function assists management and the Board in the effectivedischarge of their responsibility for internal control by conductingreviews of Cookson businesses and reporting objectively both onthe adequacy and effectiveness of the system of internal control in place, with a particular emphasis on financial controls, and as to whether those businesses are in compliance with applicableGroup policies and procedures. The Group Head of Internal Auditis responsible for developing the function, within the framework of common Group policies and standards, and for carrying outassignments in accordance with an annual audit plan approved bythe Audit Committee. The Audit Committee receives reports fromthe Group Head of Internal Audit on a regular basis and reports tothe Board on the results of its review.
As part of the Board’s process for reviewing the effectiveness ofthe system of internal control, it delegates the following matters to the Audit Committee to be carried out during the year:
– review of external and internal audit work plans;
– consideration of reports from management and internal audit on the system of internal control and any material controlweaknesses; and
– discussions with management on the actions taken on problemareas identified by Board members, in internal audit reports or in external audit management letters.
The Chairman of the Audit Committee reports the outcome of theAudit Committee meetings to the Board and the Board receivesthe agenda, papers and minutes of Audit Committee meetings.
In addition to the above, the Board considers significant financingand investment decisions concerning the Group, including thegiving of guarantees and indemnities, and monitors policy andcontrol mechanisms for managing treasury risk. The Board alsoreviews the role of insurance and other measures used in managingrisks across the Group, receives regular reports on any major issuesthat have arisen during the year and makes an annual assessmentof how the risks have changed over the period under review.
At the year end, the Board, through the Audit Committee, reviewsthe results of the risk management exercise conducted by seniorbusiness management, including the self-certification exercise bywhich they certify the effectiveness of the system of internal controlswithin the businesses for which they are responsible, together with their compliance throughout the year with the Group’s policiesand procedures.
Remuneration of the Chairman and non-executive Directors The Board considers the remuneration policy for the non-executiveDirectors. Non-executive Directors’ fees have not been increasedduring the year and remain at £30,000 per annum, with asupplementary fee payable to the Chairman of the Audit Committee,which remains at £15,000 per annum.
The Chairman of the Remuneration Committee receives an additionalfee of £10,000 per annum. A supplementary fee of £5,000 per annumis paid to the Senior Independent Director. The Group Chairman’sremuneration is determined by the Remuneration Committee. It is subject to periodic review. Neither the Group Chairman, who is not an executive Director, nor the other non-executive Directorsare members of the Group’s pension plans, nor do they participatein the Group’s incentive schemes.
Legal matters All Directors have access to the advice and services of the GroupSecretary. There is also an agreed procedure in place for Directors,in the furtherance of their duties, to take independent legal adviceif necessary, at the Company’s expense.
Remuneration matters The Directors’ Remuneration Report appears on pages 31 to 39.
Corporate responsibility A statement on corporate responsibility is shown on page 40,which includes details of Cookson’s Code of Conduct.
Health, Safety and Environmental matters A report on Cookson’s policy and management of health, safetyand environmental matters is shown on page 41.
Treasury managementTreasury policy Cookson’s treasury policy seeks to ensure that adequate financialresources are available for the development of the Group’s businesseswhilst managing its currency, interest rate and counterparty risks.Cookson’s policy in respect of the major areas of treasury activityis set out below.
Currency translation exposure The results of the Group’s foreign subsidiaries are translated intosterling at the average exchange rates for the period concerned.The balance sheets of foreign subsidiaries are translated into sterlingat the closing exchange rates. Any gains and losses resulting fromtranslation are recorded in reserves where they are matched withthe gains and losses on borrowings, foreign exchange contracts or currency swaps taken out in the same currencies to hedge thenet assets of subsidiaries. The Group aims to hedge a reasonableproportion of its non-sterling assets in this way.
The Group does not currently hedge translation exposures arisingon unremitted non-UK earnings.
Currency transaction exposure This arises where actual sales and purchases are made by abusiness unit in a currency other than its own functional currency. It is Cookson policy that material foreign currency transactionexposures are hedged using appropriate instruments such asforward foreign exchange contracts.
D IRECTORS’ REPORT CONTINUED
29Cookson Group plc Annual Report 2004
Interest rate risk Cookson’s policy is to borrow a mix of fixed and floating rate debt.Where appropriate, the Group will manage its interest rate exposuresusing interest rate swap agreements or other instruments. Significantinterest rate and currency hedging programmes require the approvalof the Finance Committee or the Board.
Credit risk Cash deposits and other financial instruments give rise to credit risk,which represents the loss that would be recognised if a counterpartyfailed to perform as contracted. The counterparties to the Group’sfinancial instruments are reputable financial institutions and thecredit rating of these counterparties is monitored on a regular basisin accordance with Board approved guidelines.
Further information relating to the Group’s financial risk managementcan be found in note 17 on pages 60 and 61.
Creditor payment policyEach operating company in the Group is responsible for agreeingthe terms and conditions under which business transactions withtheir suppliers are conducted. It is Group policy that payments tosuppliers are made in accordance with these terms, provided thatthe supplier is also complying with all relevant terms and conditions.In the accounts of the Company at 31 December 2004, the numberof days’ purchases outstanding was 28 (2003: 26 days).
Employment policiesA fundamental concept embodied in the Company’s Code ofConduct is that Cookson’s goals and vision can only be metthrough the efforts of its employees. Cookson recognises that jobsatisfaction requires working environments that motivate employeesto be productive and innovative and provide opportunities foremployee training and development to maximise personal potentialand develop careers within the Group.
Cookson is managed on a decentralised basis and within eachdivision it is the responsibility of the relevant divisional ChiefExecutive to adopt employment policies and practices that bestsuit the size, style and geographical location of their operations.This allows the Group’s operations to respond competitively tochanges in the marketplace and to develop and retain a strongsense of identity whilst benefiting from being a part of a majorinternational group.
Cookson values the involvement of its employees and keeps them informed on matters affecting them as employees andfactors relevant to the performance of the Group. The Boardencourages greater employee involvement in the Group’s financialperformance through participation in Company share ownershipschemes. Such schemes have been established in the UK, otherEuropean countries and in North America, affording employees atall levels the opportunity to acquire Company shares on favourableterms, in line with local revenue authority regulations. Approximately570 of Cookson’s shareholders are employees and a significantnumber of employees also participate in the Company’s shareoption schemes.
It is established policy throughout Cookson that decisions onrecruitment, career development, training, promotion and otheremployment related issues are made solely on grounds of individual
ability, achievement, expertise and conduct. These principles areoperated on a non-discriminatory basis. Cookson gives full and fair consideration to applications for employment from disabledpersons. Should an employee become disabled during theiremployment with Cookson, every effort will be made to enablethem to continue their service with the Company.
PensionsIn each country in which the Group operates, the pensionarrangements in place are considered to be consistent with good employment practice in that particular area. During the year, a defined contribution pension plan was implemented for futureUK employees; the Group’s principal defined benefit pension plansremain for current and past UK employees and for employees inthe USA. Independent advisers are used to ensure that definedbenefit plan assets are invested in the best interests of the planmembers. Group policy prohibits investment of pension fund assetsin its own businesses. Outside the UK and the USA, the majority of pension plans in the Group are of a defined contribution nature.
In the UK, a trustee board is appointed by the Company for eacharrangement. For the main UK plan this comprises employees,former employees and an independent trustee. This structure has been accepted by the plan membership under the regulationsconcerning Member Nominated Trustees. The administration ofthe main UK plan is outsourced.
All US retirement plan assets are held in trust for the exclusivebenefit of plan participants and their beneficiaries. An independentfinancial institution acts as the trustee. The trust assets are protectedby law and by Federal Government Regulation and are subject toannual audit by an independent accountant, the Internal RevenueService and the Department of Labor.
Further details of pension arrangements are given in note 30 onpages 67 to 71.
DirectorsBiographical information for the current Directors of the Companyis given on page 23.
Mr A G L Alexander, formerly Senior Independent Director, retiredfrom the Board on 14 May 2004 at the Company’s 2004 AGM.Mrs J F de Moller, non-executive Director and former Chair of theRemuneration Committee, retired from the Board on 1 October2004. Mr S L Howard, formerly Group Chief Executive, resignedfrom the Board on 4 November 2004 and Mr R P Sharpe, formerexecutive Director and Chief Executive of the Electronics division,resigned on 19 May 2004.
Mr G C Cozzani, Mr D H Millard and Mr B W Perry will retire at theAGM and will offer themselves for re-election. Mr J P Oosterveld,Mr N R Salmon and Mr J G Sussens will also retire at the AGMand will offer themselves for election. Further information on theservice agreements of the executive Directors, including MessrsCozzani, Millard and Salmon, is given on pages 33 and 34. Thenon-executive Directors, including Mr Perry who is standing forre-election and Messrs Oosterveld and Sussens who are standingfor election, do not have such agreements.
The interests of Directors and their related parties in the ordinaryshares of the Company, all of which are beneficial, as disclosed in
30Cookson Group plc Annual Report 2004
accordance with the Companies Act 1985, are as set out on page37 and details of the Directors’ MTI awards, LTIP allocations andshare options are set out on pages 37 to 39.
Share capitalDetails of movements in the Company’s issued share capitalduring the year are given in note 21 on page 63. In 2002 Cookson’sshares were subdivided and converted from one existing ordinaryshare of 50p into one ordinary share of 1p and one deferred share of 49p. This resulted in 727.6 million ordinary shares and727.6 million deferred shares being created under a share capitalreorganisation. As at 31 December 2004, the Company’s issuedequity share capital amounted to £375.5 million and comprised1,895.5 million ordinary shares of 1p with an aggregate nominalvalue of £19.0 million and 727.6 million deferred shares of 49pwith an aggregate nominal value of £356.5 million.
Each ordinary share of 1p has the same rights (including voting anddividend rights and rights on a return of capital) as each ordinaryshare of 50p did prior to the share capital reorganisation. As thedeferred shares carry no rights to dividends or voting and are notlisted, they are rendered effectively worthless.
Since the year end, 467,265 ordinary shares have been issued asa result of exercises of options granted under the Company’s shareoption schemes. Resolutions giving the Directors the authority toallot further shares and make allotments of shares to persons otherthan existing shareholders in certain circumstances will again beproposed at the AGM.
Authority for purchase of own shares At the 2004 AGM, shareholders gave the Company renewedauthority to make market purchases of up to a maximum of 10% at that time of the Company’s issued ordinary share capital(189.5 million shares). As at the date of this report, the Companyhas made no such purchases under this authority. The Directorsbelieve it advisable to seek renewal of this authority at the AGM.
Substantial interests As at the date of this report, the Company has been notified inaccordance with sections 198-208 of the Companies Act 1985 ofthe following interests of 3% or more in its issued ordinary shares.
%
Schroder Investment Management 11.13%Fidelity Investments Ltd 6.67%Hermes Administration Services Limited 6.37%Standard Life Investments 6.02%Aviva plc 5.25%Barclays Global Investors 3.93%Legal & General Investment Management Ltd 3.01%
By Order of the Board
Richard M H Malthouse Group Secretary15 March 2005
DIRECTORS’ REPORT CONTINUED
31Cookson Group plc Annual Report 2004
The Remuneration Committee (the “Committee”) is responsible for recommending and monitoring the level and structure of remunerationfor senior management, being the first layer of management below Board level, and setting the appropriate remuneration for the GroupChairman, the executive Directors and the Group Secretary. A copy of the Committee’s Terms of Reference is available on the Company’swebsite at: www.cooksongroup.co.uk.
The current members of the Committee are all the non-executive Directors, namely Mr M K Atkinson, Mr J P Oosterveld, Mr B W Perry andMr J G Sussens, who also chairs the Committee. All the members of the Committee are independent. Mr A G L Alexander and Mrs J F de Moller(former chair of the Committee) also served as members of the Committee during the year. The two former Directors resigned from theCommittee when they retired from the Company. The Chairman, Chief Executive and Group Finance Director are invited to attend Committeemeetings as appropriate.
In formulating its policies and deciding individual remuneration levels, the Committee was advised during the year by the current and formerChief Executives (Messrs Salmon and Howard), the Group Secretary (Mr Malthouse) and by the external advisers New Bridge StreetConsultants LLP (“NBS”), Ernst & Young LLP (“E&Y”) and the law firms McDermott, Will & Emery UK LLP (“MWE”) and Clifford ChanceLLP (“CC”). NBS and MWE were appointed directly by the Committee and CC and E&Y were appointed by the Company on its behalf.NBS, MWE, E&Y and CC also provide other limited advice to the Group, in their specialist areas of remuneration practice, employmentlaw, general accounting services (including tax) and share schemes respectively.
Remuneration policy for executive DirectorsThe Committee has established employment and remuneration practices for the Company’s executive Directors aimed at fostering soundethical behaviour within a culture focused upon high performance. In formulating remuneration policy, the Committee has regard to theinternational scale and nature of the Group’s operations. The remuneration packages of executive Directors have been designed to ensurethat a substantial proportion of remuneration is linked to performance. Prior to implementation of the new remuneration programme during2004, consideration was given to the size of potential rewards under the various elements, as modelled by NBS, to confirm that thesewere in line with market practice and were appropriate given the nature of the performance that was being sought. Overall, the objectiveof the policy is to align Directors’ interests with those of shareholders generally in maximising shareholder value.
Annual salary and benefits Base salary is set by reference to market rates in the relevant country for jobs of similar complexity and responsibility. The salaries of theChairman, Chief Executive and Group Finance Director are benchmarked against the median salaries of a comparator group which takesinto account the Company’s size in terms of turnover, its business activity and the international nature of the Company. This comparatorgroup currently includes the following companies: AMEC, Aggregate Industries, Bodycote International, BPB, British Vita, Enodis, GKN,Invensys, Kidde, Morgan Crucible Company, Novar, Rexam, Smiths Group, Spectris, Spirax-Sarco Engineering, Tomkins, Weir Groupand the John Wood Group. Given the complexities of matching the role of Mr Cozzani, an expatriate based in Belgium, additional Belgian,UK and US data sources are used to benchmark this salary.
The salaries of individual executive Directors are normally reviewed on 1 January each year. With effect from 1 January 2005 Messrs Millard andSalmon were given increases of 3% following a review of market data and in line with increases given to other senior managers in the Group.
Pension and life assurance benefits provided for executive Directors reflect market practice in the countries in which they are employed.Medical and disability insurance, company car allowances and other benefits are also provided to the executive Directors. The executiveDirectors are also eligible to participate in the Group’s savings-related share option schemes.
Variable remunerationThe remuneration programme is structured such that variable, performance related remuneration potentially represents more than half of total remuneration.
Annual incentiveIn line with the Group’s other senior executives, the executive Directors are eligible to receive an annual incentive calculated as apercentage of base salary and based on achievement against specified financial targets. Each year the Committee establishes thefinancial performance criteria for the forthcoming year. These criteria are set by reference to Group budgets.
For 2004, the executive Directors’ annual incentive awards were based on Group profit before tax, amortisation of intangibles and non-operating exceptional items. Messrs Howard, Millard and Salmon were all assessed solely against this criterion. The divisional CEOs,Messrs Cozzani and Sharpe, had half of their incentive based upon Group profit and the remainder based upon the performance of theirdivisions – Ceramics and Electronics respectively. 70% of that portion of their bonus based on divisional performance was assessedagainst their divisions’ operating profit targets and 30% against their divisions’ operating cash flow targets.
The Annual Incentive has a Threshold level of performance below which no award is paid, a Target level at which executive Directors areentitled to a payment equal to 50% of their base salary and a Maximum performance level at which a maximum award worth 100% ofbase salary is earned. The former Chief Executive Mr Howard was entitled to a payment of 62.5% of base salary at Target and a Maximumaward of 125% of base salary.
D IRECTORS’ REMUNERATION REPORT
32Cookson Group plc Annual Report 2004
For 2004, the Group as a whole, the Ceramics and the Electronics divisions all reached the Maximum level of performance target withrespect to both profit and cash flow objectives. This level of achievement of annual incentive targets is reflected in the annual bonusespayable to the executive Directors in 2004, which are recorded in the Directors’ remuneration table on page 36.
The Remuneration Committee has determined that for 2005 the executive Directors’ annual incentive will be based on Group profitbefore tax, amortisation of intangibles and all exceptional items. Mr Cozzani’s bonus will once again be based half on this Group profitobjective and half on the performance of the Ceramics division. This latter divisional element will be based on divisional operating profitadjusted for performance against key operating cash flow targets.
Long-term incentive At the 2004 AGM, shareholders approved a new Long-Term Incentive Plan (“LTIP”) to replace both the existing Mid-Term Incentive Plan(the “MTI Plan”) and executive share option schemes. The LTIP rewards executives for delivering superior Total Shareholder Return(“TSR” – defined as the increase in the value of a share including reinvested dividends) and is intended to align executive remunerationmore closely with shareholders’ interests.
The LTIP has two elements. Firstly, executive Directors are eligible to receive a conditional annual award of shares worth up to 100% of base salary (“Performance Shares”). Secondly, executive Directors can elect to invest all or part of their annual incentive in ordinaryshares of the Company (“Bonus Investment Shares”) in return for which they receive a conditional award of ordinary shares equal in value to the pre-tax equivalent of the annual incentive so invested (“Matching Shares”).
Performance Shares and Matching Shares vest after three years, with the proportion of shares vesting being based on the Company’sTSR performance over that three-year period relative to that of the constituent companies of its comparator group. For awards madeduring the year, the comparator group used for the Company was the FTSE Mid 250 excluding Investment Trusts. This performancemeasure was chosen to enhance the link between the interests of Directors and shareholders. It is intended that the same comparatorgroup be used for awards made in 2005.
Vesting of the Performance Shares and Matching Shares will be as follows:
TSR ranking relative to FTSE Mid 250 Matching Shares Vesting Ratio excluding Investment Trusts Performance Shares Vesting Percentage (Matching Shares: Bonus Investment Shares)
Below Median 0% 0
Median 25% 0.5:1
Upper Quintile (top 20%) 100% 2.25:1
Between Median and Upper Quintile Pro rata between 25% and 100% Pro rata between 0.5:1 and 2.25:1
An executive Director’s Matching Shares award will only vest if the Bonus Investment Shares originally purchased have been retained. No Performance Shares or Matching Shares will vest for below median performance.
To determine whether the performance conditions have been met, the TSR of each of the comparator companies will be measured.Measurement will take place over a performance period commencing on the first day of Cookson’s financial year in which the award is granted. Thus for grants made in 2004 the performance period commenced on 1 January 2004 and will end three years later, i.e.31 December 2006. TSR will be measured as the percentage increase in a return index (net of tax) between the beginning and end ofthe performance period. The return index at the beginning of the performance period is the average return index on each weekday in thethree-month period prior to the start of the performance period, and the same three-month averaging method will be used to ascertainthe return index at the end of the performance period. The companies will then be ranked, in descending order, according to their TSR. If Cookson is ranked at or above median against the comparator group then some proportion of the awards will be eligible to vest. TheCommittee will appoint an external remuneration consultant to assess whether the Company has met the performance conditions at theend of the performance period. This consultant will be asked to confirm the companies that make up the index and to ensure that theCompany’s performance has been measured in accordance with the rules of the LTIP.
Prior to the vesting of any award, the Committee has also stipulated that, as an additional hurdle, it will need to be satisfied that vestinghas been justified by the underlying financial performance of the Company over the performance period.
The Remuneration Committee determined that in 2004, the first year of the LTIP, allocations of Performance Shares to the executiveDirectors should be limited to the value of 70% of base salary. Allocations were made to these individuals in June 2004, with theexception of Mr Salmon who received an award based on his pro-rated 2004 salary upon joining the Company in July. None of theDirectors purchased shares under the Matching Share element of the LTIP in 2004.
In addition to the Board, members of the then Executive Committee, were also awarded Performance Shares under the 2004 LTIP, andgiven the opportunity to participate in the Matching Shares element. Other senior corporate executives also received Performance Sharesunder the LTIP.
For 2005, consideration is being given to broadening participation in either one or both of the Performance and Matching Share elementsof the LTIP to include senior divisional and corporate executives.
D IRECTORS’ REMUNERATION REPORT CONTINUED
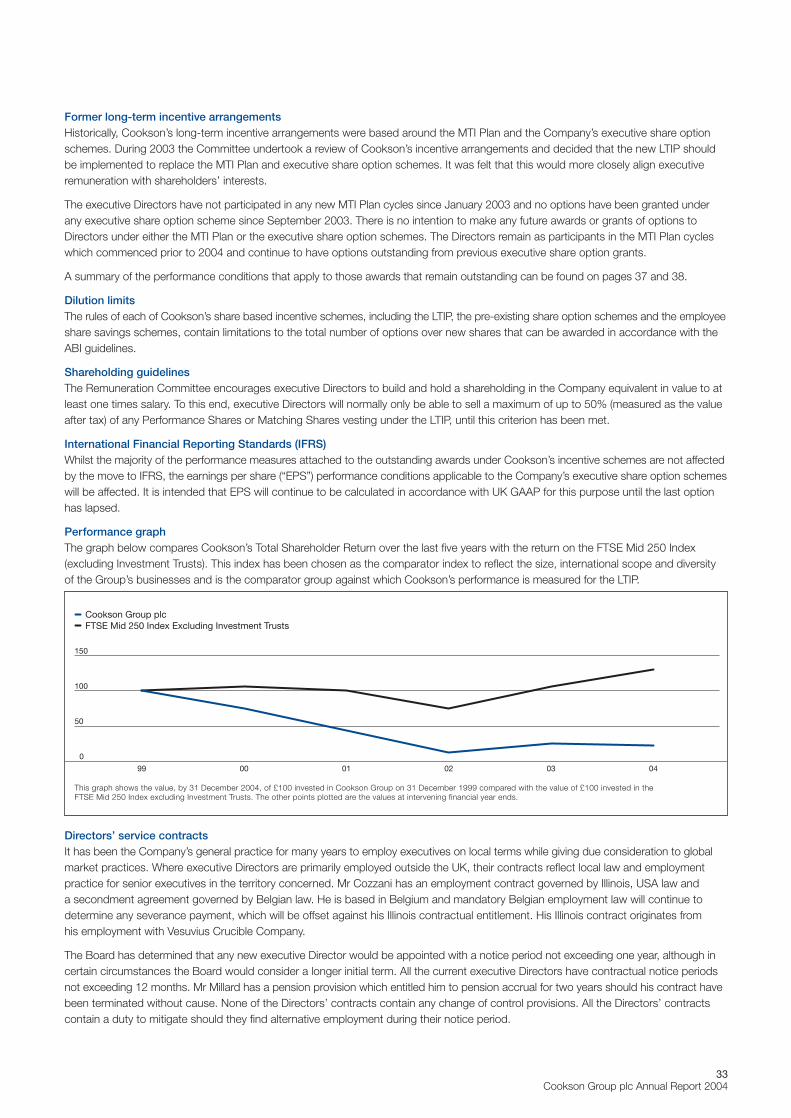
33Cookson Group plc Annual Report 2004
Former long-term incentive arrangements Historically, Cookson’s long-term incentive arrangements were based around the MTI Plan and the Company’s executive share optionschemes. During 2003 the Committee undertook a review of Cookson’s incentive arrangements and decided that the new LTIP shouldbe implemented to replace the MTI Plan and executive share option schemes. It was felt that this would more closely align executiveremuneration with shareholders’ interests.
The executive Directors have not participated in any new MTI Plan cycles since January 2003 and no options have been granted underany executive share option scheme since September 2003. There is no intention to make any future awards or grants of options toDirectors under either the MTI Plan or the executive share option schemes. The Directors remain as participants in the MTI Plan cycleswhich commenced prior to 2004 and continue to have options outstanding from previous executive share option grants.
A summary of the performance conditions that apply to those awards that remain outstanding can be found on pages 37 and 38.
Dilution limitsThe rules of each of Cookson’s share based incentive schemes, including the LTIP, the pre-existing share option schemes and the employeeshare savings schemes, contain limitations to the total number of options over new shares that can be awarded in accordance with theABI guidelines.
Shareholding guidelinesThe Remuneration Committee encourages executive Directors to build and hold a shareholding in the Company equivalent in value to atleast one times salary. To this end, executive Directors will normally only be able to sell a maximum of up to 50% (measured as the valueafter tax) of any Performance Shares or Matching Shares vesting under the LTIP, until this criterion has been met.
International Financial Reporting Standards (IFRS)Whilst the majority of the performance measures attached to the outstanding awards under Cookson’s incentive schemes are not affectedby the move to IFRS, the earnings per share (“EPS”) performance conditions applicable to the Company’s executive share option schemeswill be affected. It is intended that EPS will continue to be calculated in accordance with UK GAAP for this purpose until the last optionhas lapsed.
Performance graphThe graph below compares Cookson’s Total Shareholder Return over the last five years with the return on the FTSE Mid 250 Index(excluding Investment Trusts). This index has been chosen as the comparator index to reflect the size, international scope and diversityof the Group’s businesses and is the comparator group against which Cookson’s performance is measured for the LTIP.
Directors’ service contractsIt has been the Company’s general practice for many years to employ executives on local terms while giving due consideration to globalmarket practices. Where executive Directors are primarily employed outside the UK, their contracts reflect local law and employmentpractice for senior executives in the territory concerned. Mr Cozzani has an employment contract governed by Illinois, USA law and a secondment agreement governed by Belgian law. He is based in Belgium and mandatory Belgian employment law will continue todetermine any severance payment, which will be offset against his Illinois contractual entitlement. His Illinois contract originates from his employment with Vesuvius Crucible Company.
The Board has determined that any new executive Director would be appointed with a notice period not exceeding one year, although incertain circumstances the Board would consider a longer initial term. All the current executive Directors have contractual notice periodsnot exceeding 12 months. Mr Millard has a pension provision which entitled him to pension accrual for two years should his contract havebeen terminated without cause. None of the Directors’ contracts contain any change of control provisions. All the Directors’ contractscontain a duty to mitigate should they find alternative employment during their notice period.
99 00 01 02 03 04
0
50
100
150
This graph shows the value, by 31 December 2004, of £100 invested in Cookson Group on 31 December 1999 compared with the value of £100 invested in the FTSE Mid 250 Index excluding Investment Trusts. The other points plotted are the values at intervening financial year ends.
Cookson Group plcFTSE Mid 250 Index Excluding Investment Trusts
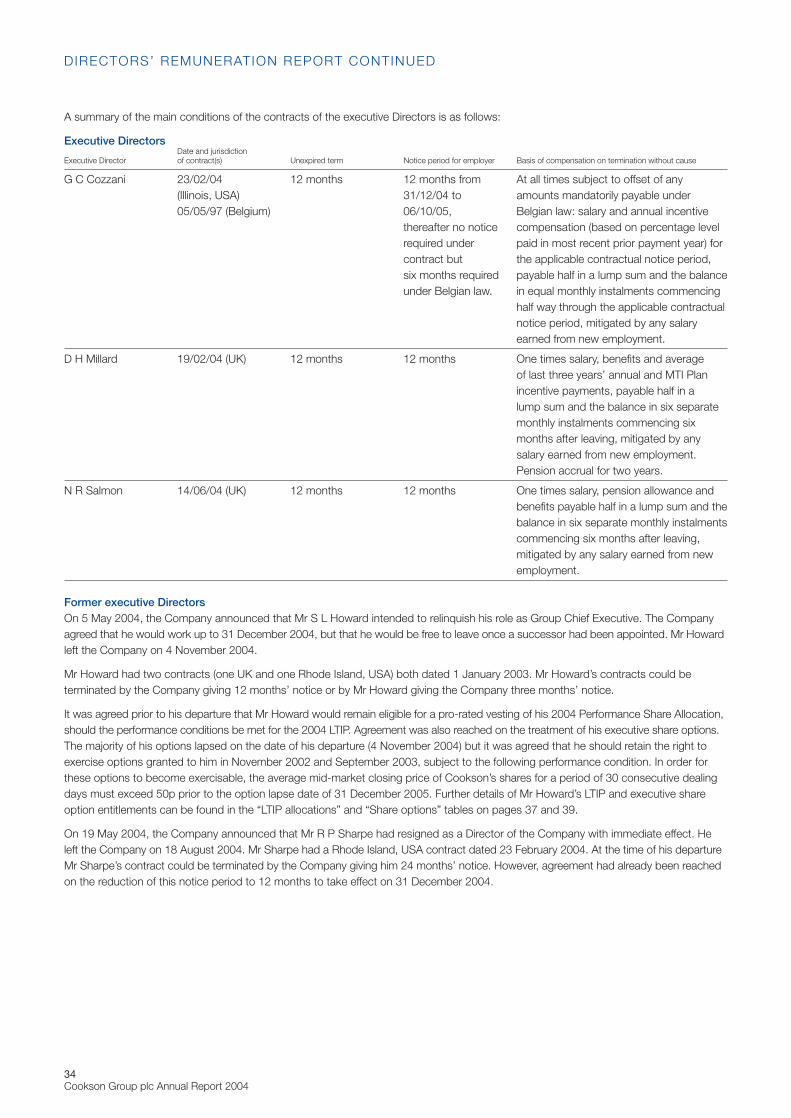
34Cookson Group plc Annual Report 2004
A summary of the main conditions of the contracts of the executive Directors is as follows:
Executive DirectorsDate and jurisdiction
Executive Director of contract(s) Unexpired term Notice period for employer Basis of compensation on termination without cause
G C Cozzani 23/02/04 12 months 12 months from At all times subject to offset of any (Illinois, USA) 31/12/04 to amounts mandatorily payable under 05/05/97 (Belgium) 06/10/05, Belgian law: salary and annual incentive
thereafter no notice compensation (based on percentage level required under paid in most recent prior payment year) for contract but the applicable contractual notice period, six months required payable half in a lump sum and the balance under Belgian law. in equal monthly instalments commencing
half way through the applicable contractualnotice period, mitigated by any salaryearned from new employment.
D H Millard 19/02/04 (UK) 12 months 12 months One times salary, benefits and average of last three years’ annual and MTI Planincentive payments, payable half in a lump sum and the balance in six separatemonthly instalments commencing sixmonths after leaving, mitigated by anysalary earned from new employment.Pension accrual for two years.
N R Salmon 14/06/04 (UK) 12 months 12 months One times salary, pension allowance andbenefits payable half in a lump sum and thebalance in six separate monthly instalmentscommencing six months after leaving,mitigated by any salary earned from newemployment.
Former executive DirectorsOn 5 May 2004, the Company announced that Mr S L Howard intended to relinquish his role as Group Chief Executive. The Companyagreed that he would work up to 31 December 2004, but that he would be free to leave once a successor had been appointed. Mr Howardleft the Company on 4 November 2004.
Mr Howard had two contracts (one UK and one Rhode Island, USA) both dated 1 January 2003. Mr Howard’s contracts could beterminated by the Company giving 12 months’ notice or by Mr Howard giving the Company three months’ notice.
It was agreed prior to his departure that Mr Howard would remain eligible for a pro-rated vesting of his 2004 Performance Share Allocation,should the performance conditions be met for the 2004 LTIP. Agreement was also reached on the treatment of his executive share options.The majority of his options lapsed on the date of his departure (4 November 2004) but it was agreed that he should retain the right toexercise options granted to him in November 2002 and September 2003, subject to the following performance condition. In order forthese options to become exercisable, the average mid-market closing price of Cookson’s shares for a period of 30 consecutive dealingdays must exceed 50p prior to the option lapse date of 31 December 2005. Further details of Mr Howard’s LTIP and executive shareoption entitlements can be found in the “LTIP allocations” and “Share options” tables on pages 37 and 39.
On 19 May 2004, the Company announced that Mr R P Sharpe had resigned as a Director of the Company with immediate effect. Heleft the Company on 18 August 2004. Mr Sharpe had a Rhode Island, USA contract dated 23 February 2004. At the time of his departureMr Sharpe’s contract could be terminated by the Company giving him 24 months’ notice. However, agreement had already been reachedon the reduction of this notice period to 12 months to take effect on 31 December 2004.
D IRECTORS’ REMUNERATION REPORT CONTINUED
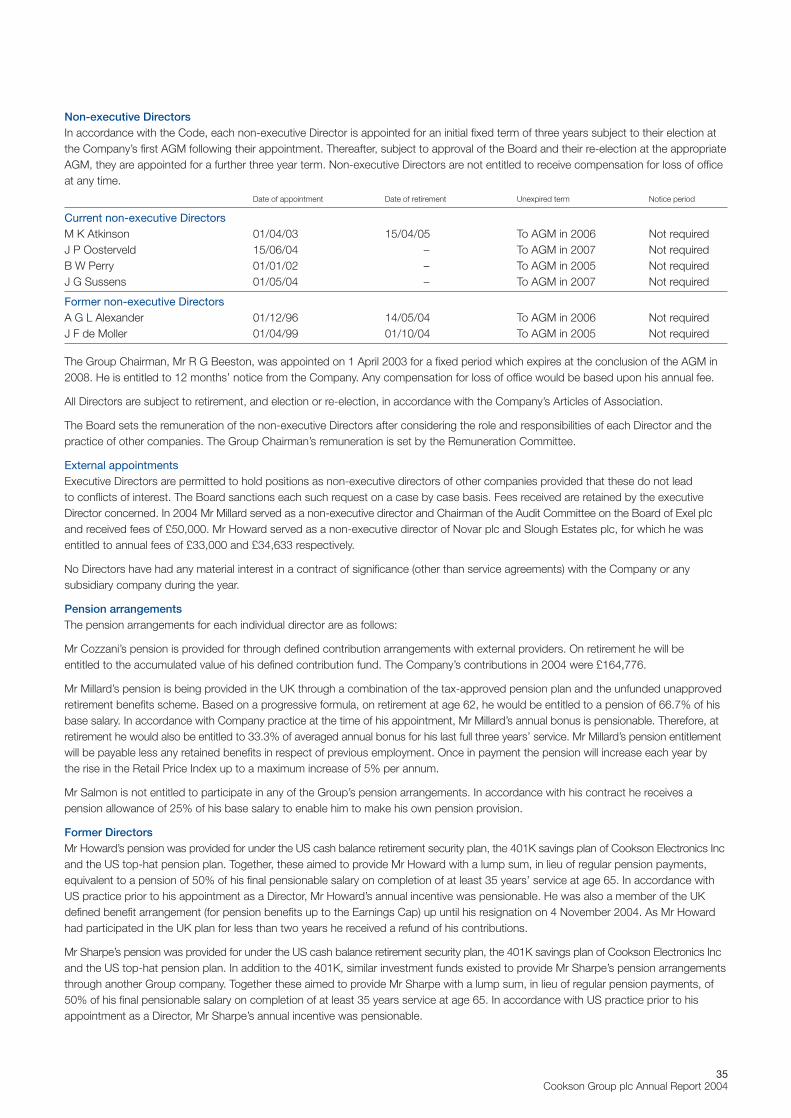
35Cookson Group plc Annual Report 2004
Non-executive DirectorsIn accordance with the Code, each non-executive Director is appointed for an initial fixed term of three years subject to their election atthe Company’s first AGM following their appointment. Thereafter, subject to approval of the Board and their re-election at the appropriateAGM, they are appointed for a further three year term. Non-executive Directors are not entitled to receive compensation for loss of officeat any time.
Date of appointment Date of retirement Unexpired term Notice period
Current non-executive DirectorsM K Atkinson 01/04/03 15/04/05 To AGM in 2006 Not requiredJ P Oosterveld 15/06/04 – To AGM in 2007 Not requiredB W Perry 01/01/02 – To AGM in 2005 Not requiredJ G Sussens 01/05/04 – To AGM in 2007 Not required
Former non-executive DirectorsA G L Alexander 01/12/96 14/05/04 To AGM in 2006 Not requiredJ F de Moller 01/04/99 01/10/04 To AGM in 2005 Not required
The Group Chairman, Mr R G Beeston, was appointed on 1 April 2003 for a fixed period which expires at the conclusion of the AGM in2008. He is entitled to 12 months’ notice from the Company. Any compensation for loss of office would be based upon his annual fee.
All Directors are subject to retirement, and election or re-election, in accordance with the Company’s Articles of Association.
The Board sets the remuneration of the non-executive Directors after considering the role and responsibilities of each Director and thepractice of other companies. The Group Chairman’s remuneration is set by the Remuneration Committee.
External appointments Executive Directors are permitted to hold positions as non-executive directors of other companies provided that these do not lead to conflicts of interest. The Board sanctions each such request on a case by case basis. Fees received are retained by the executiveDirector concerned. In 2004 Mr Millard served as a non-executive director and Chairman of the Audit Committee on the Board of Exel plcand received fees of £50,000. Mr Howard served as a non-executive director of Novar plc and Slough Estates plc, for which he wasentitled to annual fees of £33,000 and £34,633 respectively.
No Directors have had any material interest in a contract of significance (other than service agreements) with the Company or anysubsidiary company during the year.
Pension arrangements The pension arrangements for each individual director are as follows:
Mr Cozzani’s pension is provided for through defined contribution arrangements with external providers. On retirement he will be entitled to the accumulated value of his defined contribution fund. The Company’s contributions in 2004 were £164,776.
Mr Millard’s pension is being provided in the UK through a combination of the tax-approved pension plan and the unfunded unapprovedretirement benefits scheme. Based on a progressive formula, on retirement at age 62, he would be entitled to a pension of 66.7% of hisbase salary. In accordance with Company practice at the time of his appointment, Mr Millard’s annual bonus is pensionable. Therefore, atretirement he would also be entitled to 33.3% of averaged annual bonus for his last full three years’ service. Mr Millard’s pension entitlementwill be payable less any retained benefits in respect of previous employment. Once in payment the pension will increase each year by the rise in the Retail Price Index up to a maximum increase of 5% per annum.
Mr Salmon is not entitled to participate in any of the Group’s pension arrangements. In accordance with his contract he receives apension allowance of 25% of his base salary to enable him to make his own pension provision.
Former Directors Mr Howard’s pension was provided for under the US cash balance retirement security plan, the 401K savings plan of Cookson Electronics Incand the US top-hat pension plan. Together, these aimed to provide Mr Howard with a lump sum, in lieu of regular pension payments,equivalent to a pension of 50% of his final pensionable salary on completion of at least 35 years’ service at age 65. In accordance withUS practice prior to his appointment as a Director, Mr Howard’s annual incentive was pensionable. He was also a member of the UKdefined benefit arrangement (for pension benefits up to the Earnings Cap) up until his resignation on 4 November 2004. As Mr Howardhad participated in the UK plan for less than two years he received a refund of his contributions.
Mr Sharpe’s pension was provided for under the US cash balance retirement security plan, the 401K savings plan of Cookson Electronics Incand the US top-hat pension plan. In addition to the 401K, similar investment funds existed to provide Mr Sharpe’s pension arrangementsthrough another Group company. Together these aimed to provide Mr Sharpe with a lump sum, in lieu of regular pension payments, of50% of his final pensionable salary on completion of at least 35 years service at age 65. In accordance with US practice prior to hisappointment as a Director, Mr Sharpe’s annual incentive was pensionable.
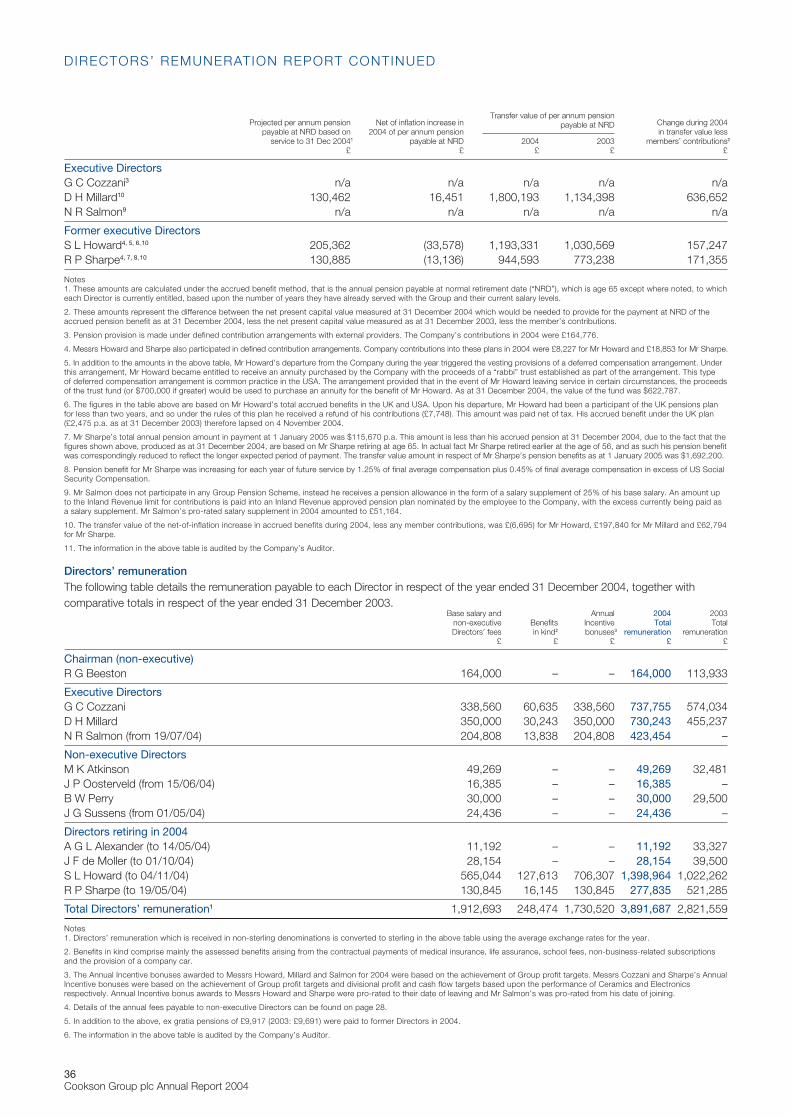
36Cookson Group plc Annual Report 2004
Projected per annum pension Net of inflation increase inTransfer value of per annum pension
Change during 2004payable at NRD based on 2004 of per annum pension
payable at NRDin transfer value less
service to 31 Dec 20041 payable at NRD 2004 2003 members’ contributions2
£ £ £ £ £
Executive DirectorsG C Cozzani3 n/a n/a n/a n/a n/aD H Millard10 130,462 16,451 1,800,193 1,134,398 636,652N R Salmon9 n/a n/a n/a n/a n/a
Former executive DirectorsS L Howard4, 5, 6,10 205,362 (33,578) 1,193,331 1,030,569 157,247R P Sharpe4, 7, 8,10 130,885 (13,136) 944,593 773,238 171,355
Notes1. These amounts are calculated under the accrued benefit method, that is the annual pension payable at normal retirement date (“NRD”), which is age 65 except where noted, to whicheach Director is currently entitled, based upon the number of years they have already served with the Group and their current salary levels.
2. These amounts represent the difference between the net present capital value measured at 31 December 2004 which would be needed to provide for the payment at NRD of theaccrued pension benefit as at 31 December 2004, less the net present capital value measured as at 31 December 2003, less the member’s contributions.
3. Pension provision is made under defined contribution arrangements with external providers. The Company’s contributions in 2004 were £164,776.
4. Messrs Howard and Sharpe also participated in defined contribution arrangements. Company contributions into these plans in 2004 were £8,227 for Mr Howard and £18,853 for Mr Sharpe.
5. In addition to the amounts in the above table, Mr Howard’s departure from the Company during the year triggered the vesting provisions of a deferred compensation arrangement. Underthis arrangement, Mr Howard became entitled to receive an annuity purchased by the Company with the proceeds of a “rabbi” trust established as part of the arrangement. This type of deferred compensation arrangement is common practice in the USA. The arrangement provided that in the event of Mr Howard leaving service in certain circumstances, the proceeds of the trust fund (or $700,000 if greater) would be used to purchase an annuity for the benefit of Mr Howard. As at 31 December 2004, the value of the fund was $622,787.
6. The figures in the table above are based on Mr Howard’s total accrued benefits in the UK and USA. Upon his departure, Mr Howard had been a participant of the UK pensions planfor less than two years, and so under the rules of this plan he received a refund of his contributions (£7,748). This amount was paid net of tax. His accrued benefit under the UK plan(£2,475 p.a. as at 31 December 2003) therefore lapsed on 4 November 2004.
7. Mr Sharpe’s total annual pension amount in payment at 1 January 2005 was $115,670 p.a. This amount is less than his accrued pension at 31 December 2004, due to the fact that thefigures shown above, produced as at 31 December 2004, are based on Mr Sharpe retiring at age 65. In actual fact Mr Sharpe retired earlier at the age of 56, and as such his pension benefitwas correspondingly reduced to reflect the longer expected period of payment. The transfer value amount in respect of Mr Sharpe’s pension benefits as at 1 January 2005 was $1,692,200.
8. Pension benefit for Mr Sharpe was increasing for each year of future service by 1.25% of final average compensation plus 0.45% of final average compensation in excess of US SocialSecurity Compensation.
9. Mr Salmon does not participate in any Group Pension Scheme, instead he receives a pension allowance in the form of a salary supplement of 25% of his base salary. An amount upto the Inland Revenue limit for contributions is paid into an Inland Revenue approved pension plan nominated by the employee to the Company, with the excess currently being paid asa salary supplement. Mr Salmon’s pro-rated salary supplement in 2004 amounted to £51,164.
10. The transfer value of the net-of-inflation increase in accrued benefits during 2004, less any member contributions, was £(6,695) for Mr Howard, £197,840 for Mr Millard and £62,794for Mr Sharpe.
11. The information in the above table is audited by the Company’s Auditor.
Directors’ remunerationThe following table details the remuneration payable to each Director in respect of the year ended 31 December 2004, together withcomparative totals in respect of the year ended 31 December 2003.
Base salary and Annual 2004 2003non-executive Benefits Incentive Total TotalDirectors’ fees in kind2 bonuses3 remuneration remuneration
£ £ £ £ £
Chairman (non-executive)R G Beeston 164,000 – – 164,000 113,933
Executive DirectorsG C Cozzani 338,560 60,635 338,560 737,755 574,034D H Millard 350,000 30,243 350,000 730,243 455,237N R Salmon (from 19/07/04) 204,808 13,838 204,808 423,454 –
Non-executive DirectorsM K Atkinson 49,269 – – 49,269 32,481J P Oosterveld (from 15/06/04) 16,385 – – 16,385 –B W Perry 30,000 – – 30,000 29,500J G Sussens (from 01/05/04) 24,436 – – 24,436 –
Directors retiring in 2004A G L Alexander (to 14/05/04) 11,192 – – 11,192 33,327J F de Moller (to 01/10/04) 28,154 – – 28,154 39,500S L Howard (to 04/11/04) 565,044 127,613 706,307 1,398,964 1,022,262R P Sharpe (to 19/05/04) 130,845 16,145 130,845 277,835 521,285
Total Directors’ remuneration1 1,912,693 248,474 1,730,520 3,891,687 2,821,559
Notes1. Directors’ remuneration which is received in non-sterling denominations is converted to sterling in the above table using the average exchange rates for the year.
2. Benefits in kind comprise mainly the assessed benefits arising from the contractual payments of medical insurance, life assurance, school fees, non-business-related subscriptionsand the provision of a company car.
3. The Annual Incentive bonuses awarded to Messrs Howard, Millard and Salmon for 2004 were based on the achievement of Group profit targets. Messrs Cozzani and Sharpe’s AnnualIncentive bonuses were based on the achievement of Group profit targets and divisional profit and cash flow targets based upon the performance of Ceramics and Electronicsrespectively. Annual Incentive bonus awards to Messrs Howard and Sharpe were pro-rated to their date of leaving and Mr Salmon’s was pro-rated from his date of joining.
4. Details of the annual fees payable to non-executive Directors can be found on page 28.
5. In addition to the above, ex gratia pensions of £9,917 (2003: £9,691) were paid to former Directors in 2004.
6. The information in the above table is audited by the Company’s Auditor.
D IRECTORS’ REMUNERATION REPORT CONTINUED
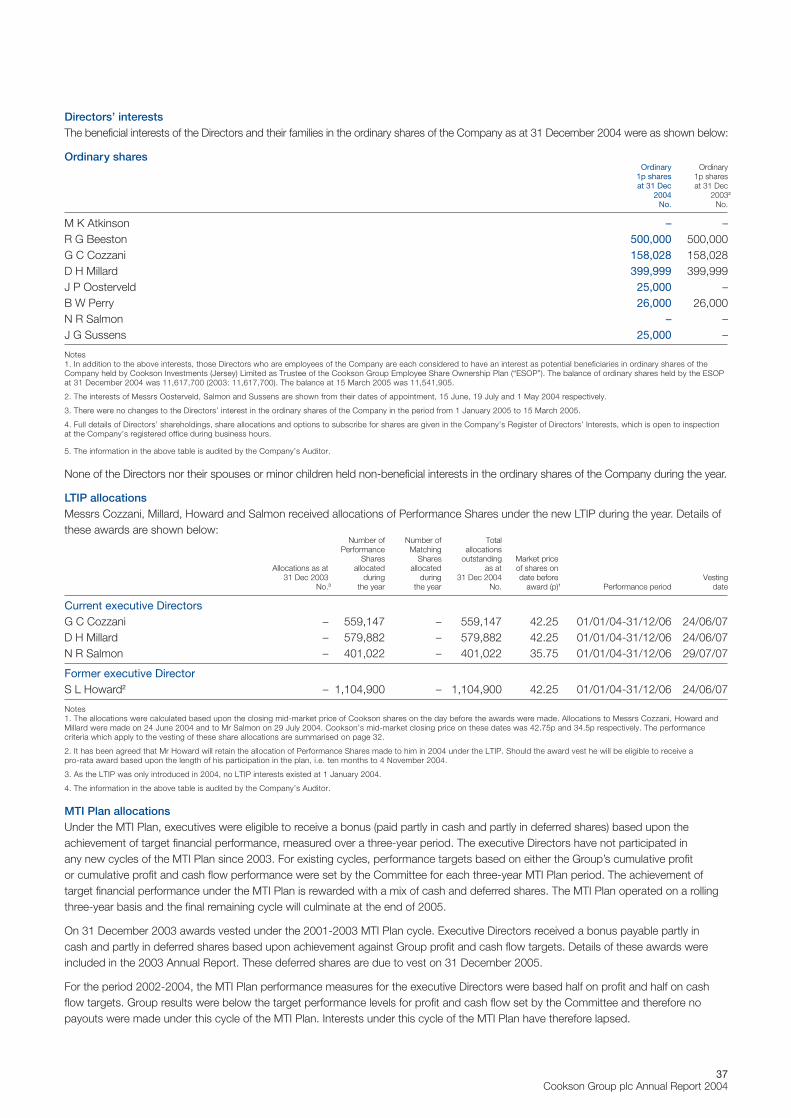
37Cookson Group plc Annual Report 2004
Directors’ interests The beneficial interests of the Directors and their families in the ordinary shares of the Company as at 31 December 2004 were as shown below:
Ordinary sharesOrdinary Ordinary
1p shares 1p sharesat 31 Dec at 31 Dec
2004 20032
No. No.
M K Atkinson – –R G Beeston 500,000 500,000G C Cozzani 158,028 158,028D H Millard 399,999 399,999J P Oosterveld 25,000 –B W Perry 26,000 26,000N R Salmon – –J G Sussens 25,000 –
Notes1. In addition to the above interests, those Directors who are employees of the Company are each considered to have an interest as potential beneficiaries in ordinary shares of theCompany held by Cookson Investments (Jersey) Limited as Trustee of the Cookson Group Employee Share Ownership Plan (“ESOP”). The balance of ordinary shares held by the ESOPat 31 December 2004 was 11,617,700 (2003: 11,617,700). The balance at 15 March 2005 was 11,541,905.
2. The interests of Messrs Oosterveld, Salmon and Sussens are shown from their dates of appointment, 15 June, 19 July and 1 May 2004 respectively.
3. There were no changes to the Directors’ interest in the ordinary shares of the Company in the period from 1 January 2005 to 15 March 2005.
4. Full details of Directors’ shareholdings, share allocations and options to subscribe for shares are given in the Company’s Register of Directors’ Interests, which is open to inspectionat the Company’s registered office during business hours.
5. The information in the above table is audited by the Company’s Auditor.
None of the Directors nor their spouses or minor children held non-beneficial interests in the ordinary shares of the Company during the year.
LTIP allocationsMessrs Cozzani, Millard, Howard and Salmon received allocations of Performance Shares under the new LTIP during the year. Details ofthese awards are shown below:
Number of Number of TotalPerformance Matching allocations
Shares Shares outstanding Market priceAllocations as at allocated allocated as at of shares on
31 Dec 2003 during during 31 Dec 2004 date before VestingNo.3 the year the year No. award (p)1 Performance period date
Current executive DirectorsG C Cozzani – 559,147 – 559,147 42.25 01/01/04-31/12/06 24/06/07D H Millard – 579,882 – 579,882 42.25 01/01/04-31/12/06 24/06/07N R Salmon – 401,022 – 401,022 35.75 01/01/04-31/12/06 29/07/07
Former executive DirectorS L Howard2 – 1,104,900 – 1,104,900 42.25 01/01/04-31/12/06 24/06/07
Notes1. The allocations were calculated based upon the closing mid-market price of Cookson shares on the day before the awards were made. Allocations to Messrs Cozzani, Howard andMillard were made on 24 June 2004 and to Mr Salmon on 29 July 2004. Cookson’s mid-market closing price on these dates was 42.75p and 34.5p respectively. The performancecriteria which apply to the vesting of these share allocations are summarised on page 32.
2. It has been agreed that Mr Howard will retain the allocation of Performance Shares made to him in 2004 under the LTIP. Should the award vest he will be eligible to receive a pro-rata award based upon the length of his participation in the plan, i.e. ten months to 4 November 2004.
3. As the LTIP was only introduced in 2004, no LTIP interests existed at 1 January 2004.
4. The information in the above table is audited by the Company’s Auditor.
MTI Plan allocationsUnder the MTI Plan, executives were eligible to receive a bonus (paid partly in cash and partly in deferred shares) based upon theachievement of target financial performance, measured over a three-year period. The executive Directors have not participated in any new cycles of the MTI Plan since 2003. For existing cycles, performance targets based on either the Group’s cumulative profit or cumulative profit and cash flow performance were set by the Committee for each three-year MTI Plan period. The achievement oftarget financial performance under the MTI Plan is rewarded with a mix of cash and deferred shares. The MTI Plan operated on a rollingthree-year basis and the final remaining cycle will culminate at the end of 2005.
On 31 December 2003 awards vested under the 2001-2003 MTI Plan cycle. Executive Directors received a bonus payable partly in cash and partly in deferred shares based upon achievement against Group profit and cash flow targets. Details of these awards wereincluded in the 2003 Annual Report. These deferred shares are due to vest on 31 December 2005.
For the period 2002-2004, the MTI Plan performance measures for the executive Directors were based half on profit and half on cashflow targets. Group results were below the target performance levels for profit and cash flow set by the Committee and therefore nopayouts were made under this cycle of the MTI Plan. Interests under this cycle of the MTI Plan have therefore lapsed.
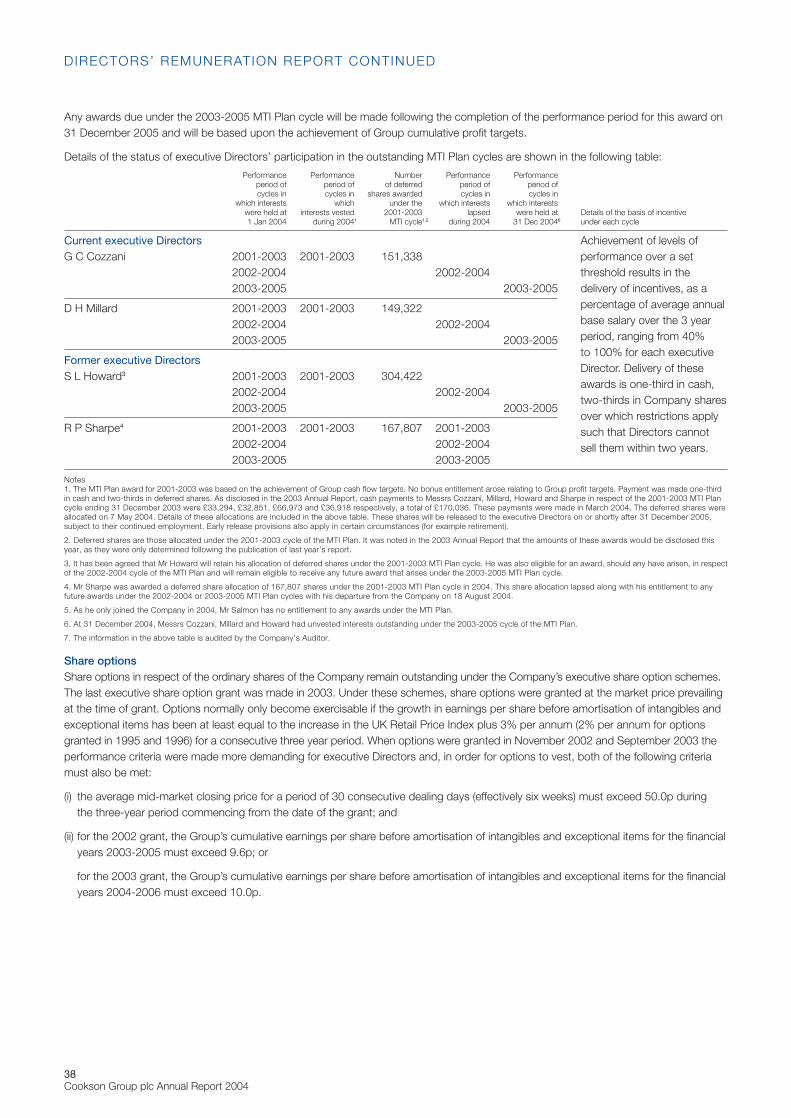
38Cookson Group plc Annual Report 2004
Any awards due under the 2003-2005 MTI Plan cycle will be made following the completion of the performance period for this award on31 December 2005 and will be based upon the achievement of Group cumulative profit targets.
Details of the status of executive Directors’ participation in the outstanding MTI Plan cycles are shown in the following table:
Performance Performance Number Performance Performanceperiod of period of of deferred period of period ofcycles in cycles in shares awarded cycles in cycles in
which interests which under the which interests which interestswere held at interests vested 2001-2003 lapsed were held at Details of the basis of incentive 1 Jan 2004 during 20041 MTI cycle1,2 during 2004 31 Dec 20046 under each cycle
Current executive DirectorsG C Cozzani 2001-2003 2001-2003 151,338
2002-2004 2002-20042003-2005 2003-2005
D H Millard 2001-2003 2001-2003 149,3222002-2004 2002-20042003-2005 2003-2005
Former executive DirectorsS L Howard3 2001-2003 2001-2003 304,422
2002-2004 2002-20042003-2005 2003-2005
R P Sharpe4 2001-2003 2001-2003 167,807 2001-20032002-2004 2002-20042003-2005 2003-2005
Notes1. The MTI Plan award for 2001-2003 was based on the achievement of Group cash flow targets. No bonus entitlement arose relating to Group profit targets. Payment was made one-thirdin cash and two-thirds in deferred shares. As disclosed in the 2003 Annual Report, cash payments to Messrs Cozzani, Millard, Howard and Sharpe in respect of the 2001-2003 MTI Plancycle ending 31 December 2003 were £33,294, £32,851, £66,973 and £36,918 respectively, a total of £170,036. These payments were made in March 2004. The deferred shares wereallocated on 7 May 2004. Details of these allocations are included in the above table. These shares will be released to the executive Directors on or shortly after 31 December 2005,subject to their continued employment. Early release provisions also apply in certain circumstances (for example retirement).
2. Deferred shares are those allocated under the 2001-2003 cycle of the MTI Plan. It was noted in the 2003 Annual Report that the amounts of these awards would be disclosed thisyear, as they were only determined following the publication of last year’s report.
3. It has been agreed that Mr Howard will retain his allocation of deferred shares under the 2001-2003 MTI Plan cycle. He was also eligible for an award, should any have arisen, in respectof the 2002-2004 cycle of the MTI Plan and will remain eligible to receive any future award that arises under the 2003-2005 MTI Plan cycle.
4. Mr Sharpe was awarded a deferred share allocation of 167,807 shares under the 2001-2003 MTI Plan cycle in 2004. This share allocation lapsed along with his entitlement to anyfuture awards under the 2002-2004 or 2003-2005 MTI Plan cycles with his departure from the Company on 18 August 2004.
5. As he only joined the Company in 2004, Mr Salmon has no entitlement to any awards under the MTI Plan.
6. At 31 December 2004, Messrs Cozzani, Millard and Howard had unvested interests outstanding under the 2003-2005 cycle of the MTI Plan.
7. The information in the above table is audited by the Company’s Auditor.
Share optionsShare options in respect of the ordinary shares of the Company remain outstanding under the Company’s executive share option schemes.The last executive share option grant was made in 2003. Under these schemes, share options were granted at the market price prevailingat the time of grant. Options normally only become exercisable if the growth in earnings per share before amortisation of intangibles andexceptional items has been at least equal to the increase in the UK Retail Price Index plus 3% per annum (2% per annum for optionsgranted in 1995 and 1996) for a consecutive three year period. When options were granted in November 2002 and September 2003 theperformance criteria were made more demanding for executive Directors and, in order for options to vest, both of the following criteriamust also be met:
(i) the average mid-market closing price for a period of 30 consecutive dealing days (effectively six weeks) must exceed 50.0p during the three-year period commencing from the date of the grant; and
(ii) for the 2002 grant, the Group’s cumulative earnings per share before amortisation of intangibles and exceptional items for the financialyears 2003-2005 must exceed 9.6p; or
for the 2003 grant, the Group’s cumulative earnings per share before amortisation of intangibles and exceptional items for the financialyears 2004-2006 must exceed 10.0p.
Achievement of levels ofperformance over a setthreshold results in thedelivery of incentives, as apercentage of average annualbase salary over the 3 yearperiod, ranging from 40% to 100% for each executiveDirector. Delivery of theseawards is one-third in cash,two-thirds in Company sharesover which restrictions applysuch that Directors cannotsell them within two years.
D IRECTORS’ REMUNERATION REPORT CONTINUED
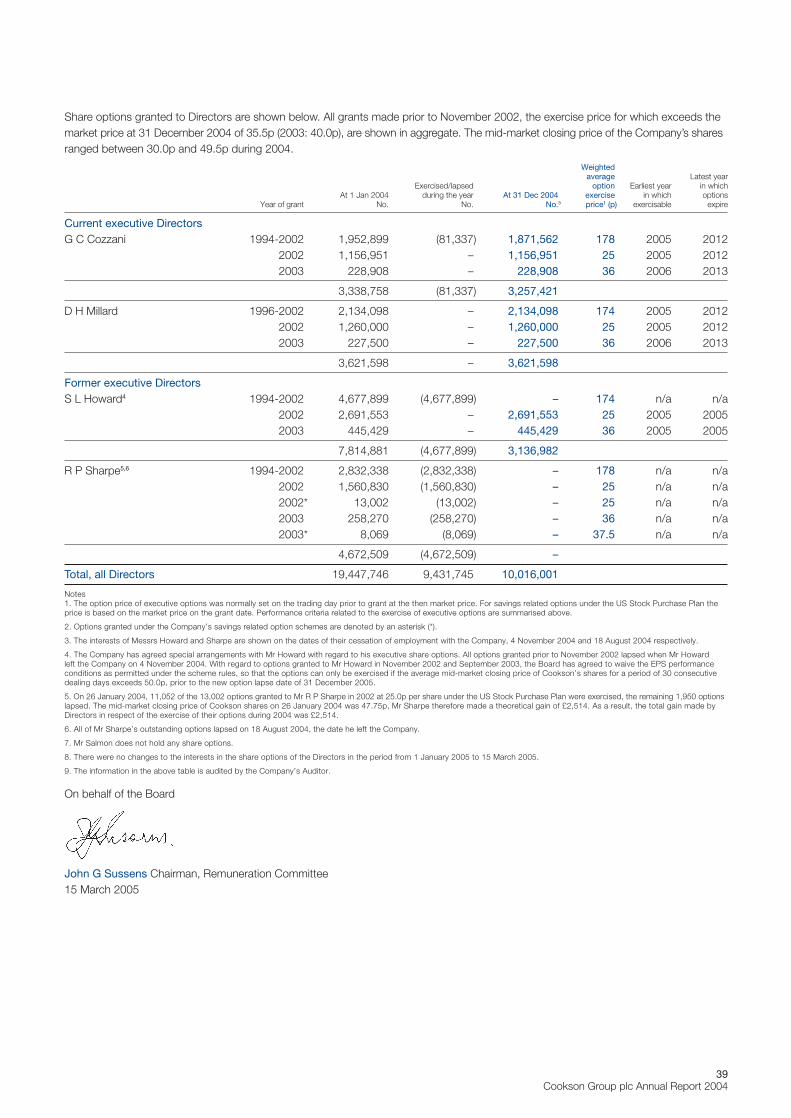
39Cookson Group plc Annual Report 2004
Share options granted to Directors are shown below. All grants made prior to November 2002, the exercise price for which exceeds themarket price at 31 December 2004 of 35.5p (2003: 40.0p), are shown in aggregate. The mid-market closing price of the Company’s sharesranged between 30.0p and 49.5p during 2004.
Weightedaverage Latest year
Exercised/lapsed option Earliest year in whichAt 1 Jan 2004 during the year At 31 Dec 2004 exercise in which options
Year of grant No. No. No.3 price1 (p) exercisable expire
Current executive DirectorsG C Cozzani 1994-2002 1,952,899 (81,337) 1,871,562 178 2005 2012
2002 1,156,951 – 1,156,951 25 2005 20122003 228,908 – 228,908 36 2006 2013
3,338,758 (81,337) 3,257,421
D H Millard 1996-2002 2,134,098 – 2,134,098 174 2005 20122002 1,260,000 – 1,260,000 25 2005 20122003 227,500 – 227,500 36 2006 2013
3,621,598 – 3,621,598
Former executive DirectorsS L Howard4 1994-2002 4,677,899 (4,677,899) – 174 n/a n/a
2002 2,691,553 – 2,691,553 25 2005 20052003 445,429 – 445,429 36 2005 2005
7,814,881 (4,677,899) 3,136,982
R P Sharpe5,6 1994-2002 2,832,338 (2,832,338) – 178 n/a n/a2002 1,560,830 (1,560,830) – 25 n/a n/a2002* 13,002 (13,002) – 25 n/a n/a2003 258,270 (258,270) – 36 n/a n/a2003* 8,069 (8,069) – 37.5 n/a n/a
4,672,509 (4,672,509) –
Total, all Directors 19,447,746 9,431,745 10,016,001
Notes1. The option price of executive options was normally set on the trading day prior to grant at the then market price. For savings related options under the US Stock Purchase Plan theprice is based on the market price on the grant date. Performance criteria related to the exercise of executive options are summarised above.
2. Options granted under the Company’s savings related option schemes are denoted by an asterisk (*).
3. The interests of Messrs Howard and Sharpe are shown on the dates of their cessation of employment with the Company, 4 November 2004 and 18 August 2004 respectively.
4. The Company has agreed special arrangements with Mr Howard with regard to his executive share options. All options granted prior to November 2002 lapsed when Mr Howard left the Company on 4 November 2004. With regard to options granted to Mr Howard in November 2002 and September 2003, the Board has agreed to waive the EPS performanceconditions as permitted under the scheme rules, so that the options can only be exercised if the average mid-market closing price of Cookson’s shares for a period of 30 consecutivedealing days exceeds 50.0p, prior to the new option lapse date of 31 December 2005.
5. On 26 January 2004, 11,052 of the 13,002 options granted to Mr R P Sharpe in 2002 at 25.0p per share under the US Stock Purchase Plan were exercised, the remaining 1,950 optionslapsed. The mid-market closing price of Cookson shares on 26 January 2004 was 47.75p, Mr Sharpe therefore made a theoretical gain of £2,514. As a result, the total gain made byDirectors in respect of the exercise of their options during 2004 was £2,514.
6. All of Mr Sharpe’s outstanding options lapsed on 18 August 2004, the date he left the Company.
7. Mr Salmon does not hold any share options.
8. There were no changes to the interests in the share options of the Directors in the period from 1 January 2005 to 15 March 2005.
9. The information in the above table is audited by the Company’s Auditor.
On behalf of the Board
John G Sussens Chairman, Remuneration Committee15 March 2005
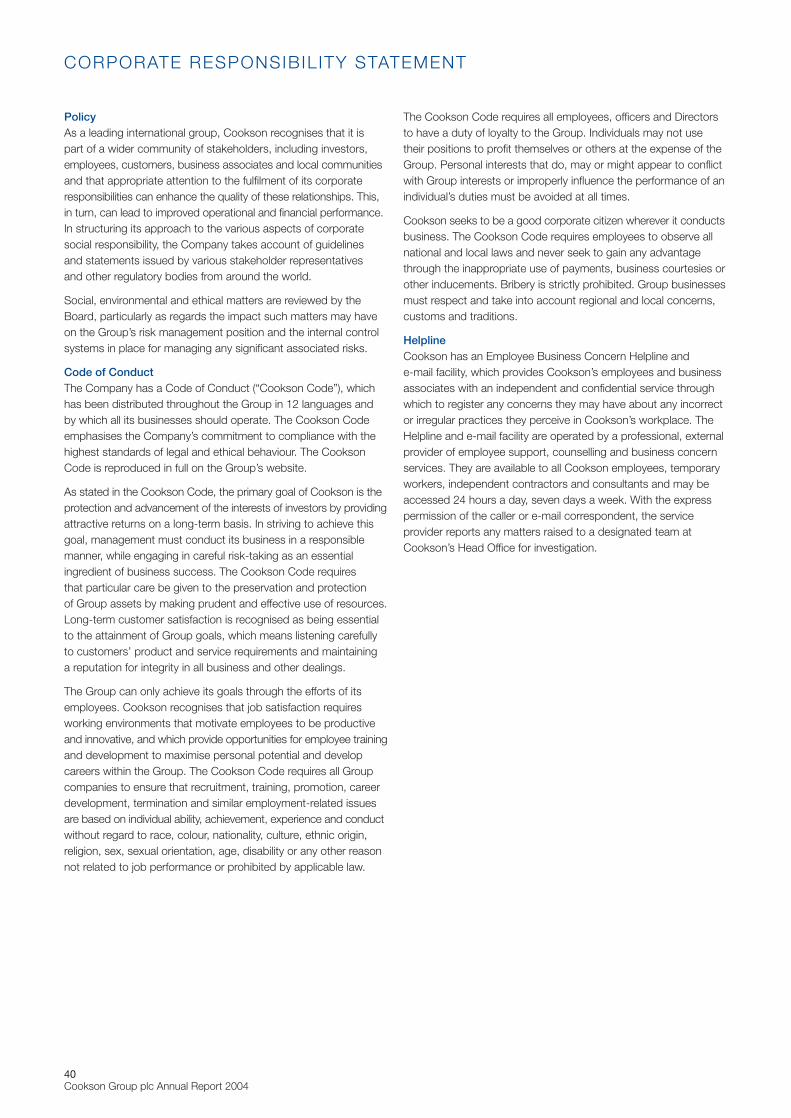
40Cookson Group plc Annual Report 2004
Policy As a leading international group, Cookson recognises that it is part of a wider community of stakeholders, including investors,employees, customers, business associates and local communitiesand that appropriate attention to the fulfilment of its corporateresponsibilities can enhance the quality of these relationships. This,in turn, can lead to improved operational and financial performance.In structuring its approach to the various aspects of corporatesocial responsibility, the Company takes account of guidelines and statements issued by various stakeholder representatives and other regulatory bodies from around the world.
Social, environmental and ethical matters are reviewed by theBoard, particularly as regards the impact such matters may haveon the Group’s risk management position and the internal controlsystems in place for managing any significant associated risks.
Code of Conduct The Company has a Code of Conduct (“Cookson Code”), whichhas been distributed throughout the Group in 12 languages and by which all its businesses should operate. The Cookson Codeemphasises the Company’s commitment to compliance with thehighest standards of legal and ethical behaviour. The CooksonCode is reproduced in full on the Group’s website.
As stated in the Cookson Code, the primary goal of Cookson is theprotection and advancement of the interests of investors by providingattractive returns on a long-term basis. In striving to achieve thisgoal, management must conduct its business in a responsiblemanner, while engaging in careful risk-taking as an essentialingredient of business success. The Cookson Code requires that particular care be given to the preservation and protection of Group assets by making prudent and effective use of resources.Long-term customer satisfaction is recognised as being essentialto the attainment of Group goals, which means listening carefullyto customers’ product and service requirements and maintaining a reputation for integrity in all business and other dealings.
The Group can only achieve its goals through the efforts of itsemployees. Cookson recognises that job satisfaction requiresworking environments that motivate employees to be productiveand innovative, and which provide opportunities for employee trainingand development to maximise personal potential and developcareers within the Group. The Cookson Code requires all Groupcompanies to ensure that recruitment, training, promotion, careerdevelopment, termination and similar employment-related issuesare based on individual ability, achievement, experience and conductwithout regard to race, colour, nationality, culture, ethnic origin,religion, sex, sexual orientation, age, disability or any other reasonnot related to job performance or prohibited by applicable law.
The Cookson Code requires all employees, officers and Directorsto have a duty of loyalty to the Group. Individuals may not use their positions to profit themselves or others at the expense of theGroup. Personal interests that do, may or might appear to conflictwith Group interests or improperly influence the performance of anindividual’s duties must be avoided at all times.
Cookson seeks to be a good corporate citizen wherever it conductsbusiness. The Cookson Code requires employees to observe allnational and local laws and never seek to gain any advantagethrough the inappropriate use of payments, business courtesies orother inducements. Bribery is strictly prohibited. Group businessesmust respect and take into account regional and local concerns,customs and traditions.
Helpline Cookson has an Employee Business Concern Helpline and e-mail facility, which provides Cookson’s employees and businessassociates with an independent and confidential service throughwhich to register any concerns they may have about any incorrector irregular practices they perceive in Cookson’s workplace. TheHelpline and e-mail facility are operated by a professional, externalprovider of employee support, counselling and business concernservices. They are available to all Cookson employees, temporaryworkers, independent contractors and consultants and may beaccessed 24 hours a day, seven days a week. With the expresspermission of the caller or e-mail correspondent, the serviceprovider reports any matters raised to a designated team atCookson’s Head Office for investigation.
CORPORATE RESPONSIBIL ITY STATEMENT
41Cookson Group plc Annual Report 2004
Policy Cookson has a Health, Safety and Environment (“HS&E”) Policy(“the Policy”), the content and effectiveness of which are reviewedregularly. It sets out how Cookson is organised to manage HS&Ematters. The Policy is reproduced in full on the Group’s website.
The Policy is based on the principle that Cookson should operatein a manner which preserves health, safety and a sound environmentand that it is important to secure the involvement and commitmentof everyone in the organisation. For Cookson companies worldwide,the minimum acceptable standard is to meet their legal HS&Eobligations. The aim throughout the Group is to improve HS&Eperformance continually.
Organisation and responsibilities Cookson regards HS&E matters as mainstream managementresponsibilities. Executives and line managers at all levels are directlyresponsible through the normal management structure for HS&Ematters in the operations under their control. All employees have a responsibility to take reasonable care of themselves and otherswhile at work and to participate positively in the task of preservingworkplace health and safety and a sound environment.
Each of Cookson’s major businesses has a nominated seniorexecutive with special responsibility for monitoring HS&Eperformance. Advice and support is available from the corporateHS&E function. The Group Head of HS&E leads the function at acorporate level, oversees the Group’s HS&E activities and reportson these matters to the Executive Committee and the Board.
Management systems The Board ultimately assumes overall responsibility for the Policy.The Corporate HS&E team works closely with executives, linemanagers, HS&E specialists and co-ordinators throughout theGroup. A reporting system is in place to collect, collate and reporton key performance indicators. Summary performance reviewreports are compiled and presented to the Executive Committeeand other senior executives quarterly and annually to the Board.The Corporate team co-ordinates policy, strategy and planning. It also monitors performance, which includes site reviews, andprovides assistance and advice for Group businesses.
Cookson’s operations each have their own HS&E managementsystems in place. The adoption of externally monitored formalmanagement systems is encouraged where appropriate. A number of companies have achieved certification to theinternational environmental management system ISO 14001, withother companies working towards achieving compliance with thisstandard. At present, 36 locations have ISO 14001 certification in place, with 50 implementing or considering certification. Somelocations are also implementing OHSAS 18001, the internationalstandard for health and safety management systems. Sevenlocations have received certification, while over 50 others areimplementing or considering the health and safety system.
Performance Cookson companies operate from over 120 facilities in more than30 countries and all of these facilities are subject to local regulatory,environmental and occupational safety and health requirements. It is Group policy that compliance with these requirements is theminimum standard for these operations. In the few instances wheregovernment enforcement actions were taken during 2004, Groupcompanies took prompt corrective actions and the penaltiesassessed by the authorities were minor.
A number of Group companies in the USA are named as potentiallyresponsible parties in connection with certain waste disposal sitesowned and operated by third parties which have been designatedas superfund sites, although the majority of these cases have nowbeen settled or are no longer active. Where similar cases havebeen settled, the Group’s share of the costs has not been material.Although the potential levels of costs to be incurred by the Groupfor the currently active cases will depend on many factors, they are expected to be settled within the amounts already provided.Like many manufacturers, some Group companies have potentialenvironmental liabilities because of past operations at their currentor former sites.
Initiatives Companies throughout the Group are involved in initiatives to improve performance in HS&E areas, including many which involve collaboration with customers and suppliers. The aim is toimprove the efficiency of products and manufacturing processes,whilst maintaining or improving their compliance with relevantregulatory requirements.
Cookson has put in place a worldwide safety programme aimed atincreasing employee safety awareness and commitment throughoutthe Group and reducing injuries in Group plants around the world.A team of safety experts throughout the Group spearheads thiseffort and an advisory panel of business and operations managers,under the leadership of the Chief Executive, has been assembled toprovide a broader perspective. As part of this effort, Cooksonadopts Group-wide safety targets and programmes to achieve them,including minimum safety standards for all Cookson operations. Theworldwide safety programme is based on lessons and techniquesthat have been successful in reducing occupational injuries andassociated costs in US operations over the past six years. Theworldwide programme has been in place for three years and Cookson’soccupational injury rates have improved by over 35% in that time.
In 2004, Cookson began a new programme to further reduceenergy use as a way to reduce emissions of carbon dioxide andother pollutants. This programme includes training employees tounderstand energy use and conservation principles. It also includesenergy audits to assist high-use sites in identifying and implementingconservation measures.
Additional information on health, safety and environmental matterscan be found on the Group’s website, www.cooksongroup.co.uk.
HEALTH, SAFETY AND ENVIRONMENTAL REPORT
42Cookson Group plc Annual Report 2004
To the shareholders of Cookson Group plcUK legislation requires that your Directors prepare annual accountswhich give a true and fair view of the state of affairs of the Companyand the Group as at the end of each financial year and of the profitor loss for that period.
In complying with these requirements your Directors acknowledgetheir responsibility for ensuring that adequate accounting recordsare maintained and for safeguarding the assets of the Companyand of the Group, including the provision of a system of controlssuch as would be reasonably expected to prevent and detectfraud and other irregularities.
We confirm that, in our opinion, these accounts have beenprepared using suitable accounting policies which have beenconsistently applied and supported by reasonable and prudentjudgements. It is our belief that the accounts of the Company andof the Group have been prepared in accordance with all applicableaccounting standards.
The financial statements have been prepared on the goingconcern basis as the Directors consider that the Company and the Group have adequate resources to continue in operation forthe foreseeable future.
Risks associated with forward looking statements The Directors’ Report and Accounts contains certain forward lookingstatements about Cookson. Although the Company believes itsexpectations are based on reasonable assumptions, any suchstatements may be influenced by factors that could cause actualoutcomes and results to be materially different from those predicted.These forward looking statements are subject to numerous risksand uncertainties that could cause actual results to differ materiallyfrom those in such statements, certain of which are beyond thecontrol of Cookson, including, among other things: changes ingeneral economic conditions; exchange rate fluctuations; the impactof trading conditions in those markets in which Cookson’s businessesoperate, including those related to competition, price controls andprice reductions; exposure to environmental liability; and the risksrelated to the integration of large business acquisitions.
On behalf of the Board
Dennis Millard Group Finance Director15 March 2005
DIRECTORS’ RESPONSIBIL ITY STATEMENT
43Cookson Group plc Annual Report 2004
Report of the independent auditor to the members ofCookson Group plcWe have audited the financial statements on pages 44 to 71. Wehave also audited the information in the Directors’ RemunerationReport that is described as having been audited.
This report is made solely to the Company’s members, as a body,in accordance with section 235 of the Companies Act 1985. Our audit work has been undertaken so that we might state to the Company’s members those matters we are required to state tothem in an auditor’s report and for no other purpose. To the fullestextent permitted by law, we do not accept or assume responsibilityto anyone other than the Company and the Company’s membersas a body, for our audit work, for this report, or for the opinions we have formed.
Respective responsibilities of directors and auditorThe Directors are responsible for preparing the Annual Report and the Directors’ Remuneration Report. As described on page 42, this includes responsibility for preparing the financialstatements in accordance with applicable United Kingdom law and accounting standards. Our responsibilities, as independentauditor, are established in the United Kingdom by statute, theAuditing Practices Board, the Listing Rules of the FinancialServices Authority, and by our profession’s ethical guidance.
We report to you our opinion as to whether the financial statementsgive a true and fair view and whether the financial statements andthe part of the Directors’ Remuneration Report to be audited havebeen properly prepared in accordance with the Companies Act1985. We also report to you if, in our opinion, the Directors’ Reportis not consistent with the financial statements, if the Company hasnot kept proper accounting records, if we have not received all theinformation and explanations we require for our audit, or if informationspecified by law regarding Directors’ remuneration and transactionswith the Group is not disclosed.
We review whether the corporate governance statement on page 24reflects the Company’s compliance with the nine provisions of the2003 FRC Code specified for our review by the Listing Rules, andwe report if it does not. We are not required to consider whetherthe Board’s statements on internal control cover all risks and controls,or form an opinion on the effectiveness of the Group’s corporategovernance procedures or its risk and control procedures.
We read the other information contained in the Annual Report,including the corporate governance statement and the unauditedpart of the Directors’ Remuneration Report, and consider whether it is consistent with the audited financial statements. We consider the implications for our report if we become aware of any apparent misstatements or material inconsistencies with the financial statements.
Basis of audit opinionWe conducted our audit in accordance with Auditing Standardsissued by the Auditing Practices Board. An audit includesexamination, on a test basis, of evidence relevant to the amountsand disclosures in the financial statements and the part of theDirectors’ Remuneration Report to be audited. It also includes anassessment of the significant estimates and judgements made bythe Directors in the preparation of the financial statements, and of whether the accounting policies are appropriate to the Group’scircumstances, consistently applied and adequately disclosed.
We planned and performed our audit so as to obtain all theinformation and explanations which we considered necessary in order to provide us with sufficient evidence to give reasonableassurance that the financial statements and the part of the Directors’Remuneration Report to be audited are free from materialmisstatement, whether caused by fraud or other irregularity or error.In forming our opinion we also evaluated the overall adequacy ofthe presentation of information in the financial statements and thepart of the Directors’ Remuneration Report to be audited.
OpinionIn our opinion:
– the financial statements give a true and fair view of the state ofaffairs of the Company and the Group as at 31 December 2004and of the loss of the Group for the year then ended; and
– the financial statements and the part of the Directors’Remuneration Report to be audited have been properlyprepared in accordance with the Companies Act 1985.
KPMG Audit PlcChartered Accountants Registered Auditor
15 March 2005
AUDITOR’S REPORT
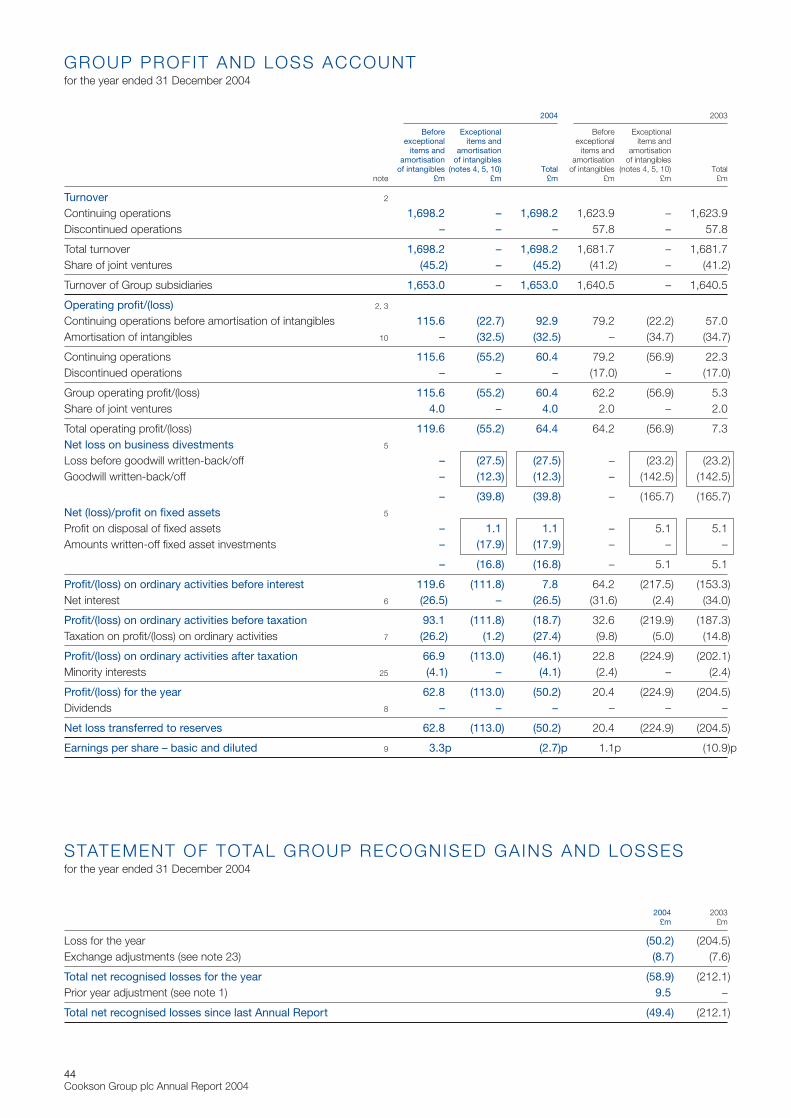
44Cookson Group plc Annual Report 2004
2004 2003
Before Exceptional Before Exceptionalexceptional items and exceptional items and
items and amortisation items and amortisationamortisation of intangibles amortisation of intangibles
of intangibles (notes 4, 5, 10) Total of intangibles (notes 4, 5, 10) Totalnote £m £m £m £m £m £m
Turnover 2
Continuing operations 1,698.2 – 1,698.2 1,623.9 – 1,623.9Discontinued operations – – – 57.8 – 57.8
Total turnover 1,698.2 – 1,698.2 1,681.7 – 1,681.7Share of joint ventures (45.2) – (45.2) (41.2) – (41.2)
Turnover of Group subsidiaries 1,653.0 – 1,653.0 1,640.5 – 1,640.5
Operating profit/(loss) 2, 3
Continuing operations before amortisation of intangibles 115.6 (22.7) 92.9 79.2 (22.2) 57.0Amortisation of intangibles 10 – (32.5) (32.5) – (34.7) (34.7)
Continuing operations 115.6 (55.2) 60.4 79.2 (56.9) 22.3Discontinued operations – – – (17.0) – (17.0)
Group operating profit/(loss) 115.6 (55.2) 60.4 62.2 (56.9) 5.3Share of joint ventures 4.0 – 4.0 2.0 – 2.0
Total operating profit/(loss) 119.6 (55.2) 64.4 64.2 (56.9) 7.3Net loss on business divestments 5
Loss before goodwill written-back/off – (27.5) (27.5) – (23.2) (23.2)Goodwill written-back/off – (12.3) (12.3) – (142.5) (142.5)
– (39.8) (39.8) – (165.7) (165.7)Net (loss)/profit on fixed assets 5
Profit on disposal of fixed assets – 1.1 1.1 – 5.1 5.1Amounts written-off fixed asset investments – (17.9) (17.9) – – –
– (16.8) (16.8) – 5.1 5.1
Profit/(loss) on ordinary activities before interest 119.6 (111.8) 7.8 64.2 (217.5) (153.3)Net interest 6 (26.5) – (26.5) (31.6) (2.4) (34.0)
Profit/(loss) on ordinary activities before taxation 93.1 (111.8) (18.7) 32.6 (219.9) (187.3)Taxation on profit/(loss) on ordinary activities 7 (26.2) (1.2) (27.4) (9.8) (5.0) (14.8)
Profit/(loss) on ordinary activities after taxation 66.9 (113.0) (46.1) 22.8 (224.9) (202.1)Minority interests 25 (4.1) – (4.1) (2.4) – (2.4)
Profit/(loss) for the year 62.8 (113.0) (50.2) 20.4 (224.9) (204.5)Dividends 8 – – – – – –
Net loss transferred to reserves 62.8 (113.0) (50.2) 20.4 (224.9) (204.5)
Earnings per share – basic and diluted 9 3.3p (2.7)p 1.1p (10.9)p
STATEMENT OF TOTAL GROUP RECOGNISED GAINS AND LOSSESfor the year ended 31 December 2004
2004 2003£m £m
Loss for the year (50.2) (204.5)Exchange adjustments (see note 23) (8.7) (7.6)
Total net recognised losses for the year (58.9) (212.1)Prior year adjustment (see note 1) 9.5 –
Total net recognised losses since last Annual Report (49.4) (212.1)
GROUP PROFIT AND LOSS ACCOUNTfor the year ended 31 December 2004
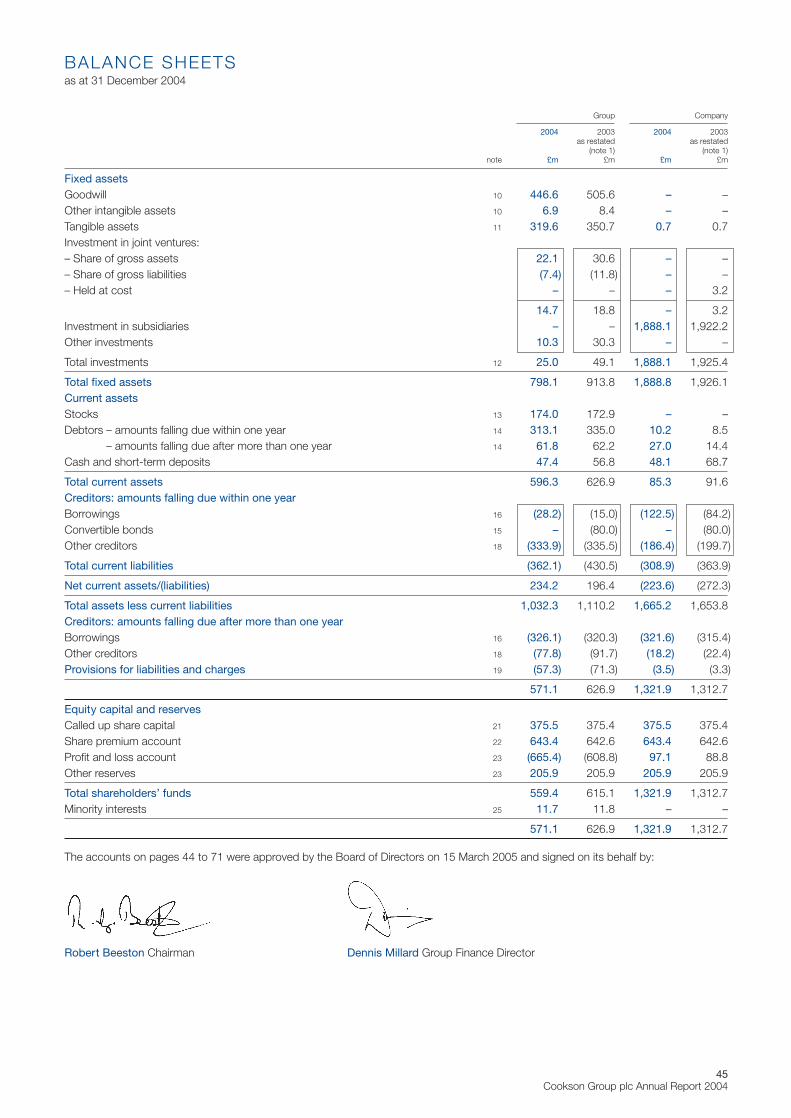
45Cookson Group plc Annual Report 2004
Group Company
2004 2003 2004 2003as restated as restated
(note 1) (note 1)note £m £m £m £m
Fixed assetsGoodwill 10 446.6 505.6 – –Other intangible assets 10 6.9 8.4 – –Tangible assets 11 319.6 350.7 0.7 0.7Investment in joint ventures:– Share of gross assets 22.1 30.6 – –– Share of gross liabilities (7.4) (11.8) – –– Held at cost – – – 3.2
14.7 18.8 – 3.2Investment in subsidiaries – – 1,888.1 1,922.2Other investments 10.3 30.3 – –
Total investments 12 25.0 49.1 1,888.1 1,925.4
Total fixed assets 798.1 913.8 1,888.8 1,926.1Current assetsStocks 13 174.0 172.9 – –Debtors – amounts falling due within one year 14 313.1 335.0 10.2 8.5
– amounts falling due after more than one year 14 61.8 62.2 27.0 14.4Cash and short-term deposits 47.4 56.8 48.1 68.7
Total current assets 596.3 626.9 85.3 91.6Creditors: amounts falling due within one yearBorrowings 16 (28.2) (15.0) (122.5) (84.2)Convertible bonds 15 – (80.0) – (80.0)Other creditors 18 (333.9) (335.5) (186.4) (199.7)
Total current liabilities (362.1) (430.5) (308.9) (363.9)
Net current assets/(liabilities) 234.2 196.4 (223.6) (272.3)
Total assets less current liabilities 1,032.3 1,110.2 1,665.2 1,653.8Creditors: amounts falling due after more than one yearBorrowings 16 (326.1) (320.3) (321.6) (315.4)Other creditors 18 (77.8) (91.7) (18.2) (22.4)Provisions for liabilities and charges 19 (57.3) (71.3) (3.5) (3.3)
571.1 626.9 1,321.9 1,312.7
Equity capital and reservesCalled up share capital 21 375.5 375.4 375.5 375.4Share premium account 22 643.4 642.6 643.4 642.6Profit and loss account 23 (665.4) (608.8) 97.1 88.8Other reserves 23 205.9 205.9 205.9 205.9
Total shareholders’ funds 559.4 615.1 1,321.9 1,312.7Minority interests 25 11.7 11.8 – –
571.1 626.9 1,321.9 1,312.7
The accounts on pages 44 to 71 were approved by the Board of Directors on 15 March 2005 and signed on its behalf by:
Robert Beeston Chairman Dennis Millard Group Finance Director
BALANCE SHEETSas at 31 December 2004
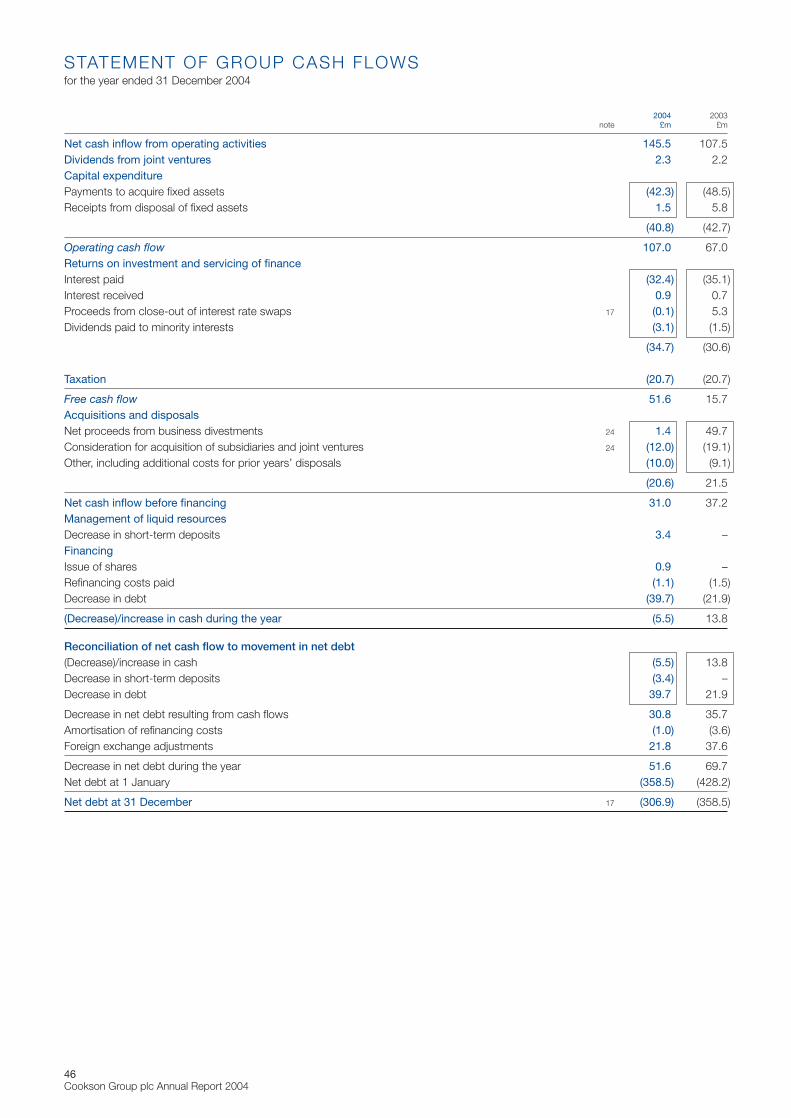
46Cookson Group plc Annual Report 2004
2004 2003note £m £m
Net cash inflow from operating activities 145.5 107.5Dividends from joint ventures 2.3 2.2Capital expenditurePayments to acquire fixed assets (42.3) (48.5)Receipts from disposal of fixed assets 1.5 5.8
(40.8) (42.7)
Operating cash flow 107.0 67.0Returns on investment and servicing of financeInterest paid (32.4) (35.1)Interest received 0.9 0.7Proceeds from close-out of interest rate swaps 17 (0.1) 5.3Dividends paid to minority interests (3.1) (1.5)
(34.7) (30.6)
Taxation (20.7) (20.7)
Free cash flow 51.6 15.7Acquisitions and disposalsNet proceeds from business divestments 24 1.4 49.7Consideration for acquisition of subsidiaries and joint ventures 24 (12.0) (19.1)Other, including additional costs for prior years’ disposals (10.0) (9.1)
(20.6) 21.5
Net cash inflow before financing 31.0 37.2Management of liquid resourcesDecrease in short-term deposits 3.4 –FinancingIssue of shares 0.9 –Refinancing costs paid (1.1) (1.5)Decrease in debt (39.7) (21.9)
(Decrease)/increase in cash during the year (5.5) 13.8
Reconciliation of net cash flow to movement in net debt(Decrease)/increase in cash (5.5) 13.8Decrease in short-term deposits (3.4) –Decrease in debt 39.7 21.9
Decrease in net debt resulting from cash flows 30.8 35.7Amortisation of refinancing costs (1.0) (3.6)Foreign exchange adjustments 21.8 37.6
Decrease in net debt during the year 51.6 69.7Net debt at 1 January (358.5) (428.2)
Net debt at 31 December 17 (306.9) (358.5)
STATEMENT OF GROUP CASH FLOWSfor the year ended 31 December 2004
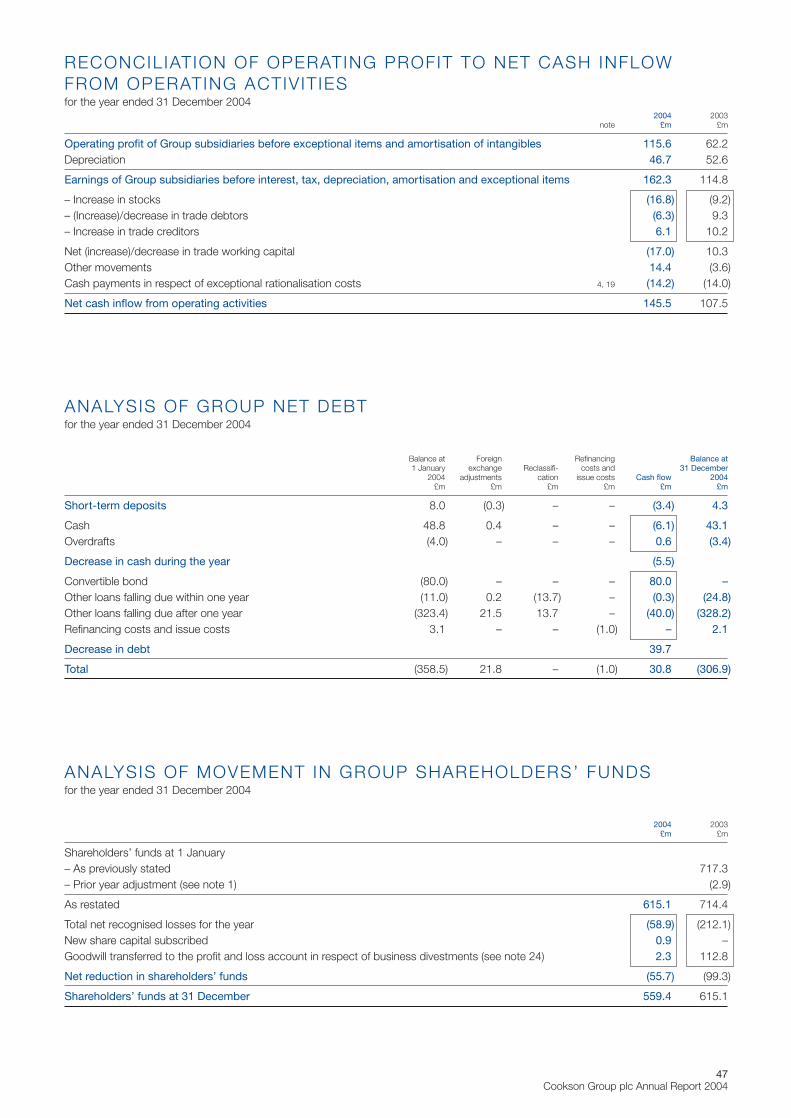
47Cookson Group plc Annual Report 2004
2004 2003note £m £m
Operating profit of Group subsidiaries before exceptional items and amortisation of intangibles 115.6 62.2Depreciation 46.7 52.6
Earnings of Group subsidiaries before interest, tax, depreciation, amortisation and exceptional items 162.3 114.8
– Increase in stocks (16.8) (9.2)– (Increase)/decrease in trade debtors (6.3) 9.3– Increase in trade creditors 6.1 10.2
Net (increase)/decrease in trade working capital (17.0) 10.3Other movements 14.4 (3.6)Cash payments in respect of exceptional rationalisation costs 4, 19 (14.2) (14.0)
Net cash inflow from operating activities 145.5 107.5
ANALYSIS OF GROUP NET DEBTfor the year ended 31 December 2004
Balance at Foreign Refinancing Balance at1 January exchange Reclassifi- costs and 31 December
2004 adjustments cation issue costs Cash flow 2004£m £m £m £m £m £m
Short-term deposits 8.0 (0.3) – – (3.4) 4.3
Cash 48.8 0.4 – – (6.1) 43.1Overdrafts (4.0) – – – 0.6 (3.4)
Decrease in cash during the year (5.5)
Convertible bond (80.0) – – – 80.0 –Other loans falling due within one year (11.0) 0.2 (13.7) – (0.3) (24.8)Other loans falling due after one year (323.4) 21.5 13.7 – (40.0) (328.2)Refinancing costs and issue costs 3.1 – – (1.0) – 2.1
Decrease in debt 39.7
Total (358.5) 21.8 – (1.0) 30.8 (306.9)
ANALYSIS OF MOVEMENT IN GROUP SHAREHOLDERS’ FUNDSfor the year ended 31 December 2004
2004 2003£m £m
Shareholders’ funds at 1 January– As previously stated 717.3– Prior year adjustment (see note 1) (2.9)
As restated 615.1 714.4
Total net recognised losses for the year (58.9) (212.1)New share capital subscribed 0.9 –Goodwill transferred to the profit and loss account in respect of business divestments (see note 24) 2.3 112.8
Net reduction in shareholders’ funds (55.7) (99.3)
Shareholders’ funds at 31 December 559.4 615.1
RECONCIL IATION OF OPERATING PROFIT TO NET CASH INFLOWFROM OPERATING ACTIV IT IESfor the year ended 31 December 2004
48Cookson Group plc Annual Report 2004
1 Accounting policies and critical accounting estimatesAccounting policiesThe following principal accounting policies have been applied consistently when dealing with all items which are material in relation to the Group’s accounts.
Accounting conventionThe accounts on pages 44 to 71 are prepared in accordance with the Companies Act 1985 and under the historical cost convention.The Group and Company accounts have been prepared in accordance with applicable accounting standards.
Change in accounting policyThe Company adopted, in 2004, the requirements of Urgent Issues Task Force (UITF) Abstract 38 “Accounting for ESOP Trusts”. UITFAbstract 38 gives rise to a prior year adjustment, details of which are given in note 23. As required by Financial Reporting Standard (FRS) 3“Reporting Financial Performance”, comparative figures for 2003 have been restated.
Basis of consolidationFor the purpose of the preparation of the Group accounts, references made to Group subsidiaries relate to subsidiary undertakings ofthe Group, as defined by the Companies Act 1989. A joint venture is an undertaking in which the Group has a long-term interest andover which it exercises joint control. The Group accounts consolidate the accounts of the Company and its subsidiaries and include, onthe gross equity method, the Group’s share of the net assets, turnover and profits or losses of joint ventures. The Group accounts include,from the date of acquisition, the results of subsidiaries and joint ventures acquired during the year. Where appropriate, adjustments aremade on consolidation in order that the Group accounts are presented on a consistent basis.
A separate profit and loss account dealing with the results of the Company only has not been presented, as permitted by Section 230 (4)of the Companies Act 1985.
TurnoverTurnover represents the invoice value of goods delivered and services provided to third parties less returns, excluding value added taxes.
Research and developmentSuch expenditure is charged to the profit and loss account in the year in which it is incurred.
Foreign currenciesProfit and loss accounts and cash flows of overseas companies are translated at average exchange rates for the year. Assets and liabilitiesdenominated in foreign currencies are translated into sterling at rates prevailing at the balance sheet date. Differences arising from thetranslation, at closing rates, of the net investment in overseas subsidiaries and joint ventures, less the applicable foreign currency borrowingsraised to finance such investments, are taken to reserves. Exchange differences on trading and other items are taken to the profit andloss account.
GoodwillGoodwill arising on consolidation is the amount by which the cost of shares in subsidiaries or joint ventures exceeds the fair value of theGroup’s share of their net assets at the date of acquisition.
Goodwill arising after 1997 is capitalised and amortised to nil by equal annual instalments over its estimated useful life of up to 20 years.Should the value of this goodwill become recognised as impaired, an impairment charge would be made against operating profit. Anyunamortised goodwill relating to businesses sold or terminated is written-off through the profit and loss account as part of the profit orloss on business divestments.
Goodwill arising before 1998 was written-off to reserves in the year of acquisition. It remains written-off to reserves even if it is subsequentlyrecognised as having become impaired, in compliance with FRS 10 “Goodwill and Intangible Assets”. Such goodwill relating to businessessold or terminated, whether recognised as having become impaired or not, is written-off through the profit and loss account as part ofthe profit or loss on business divestments.
Further details of goodwill at the year end and movements in the year are given in note 10.
Tangible fixed assetsDetails of the Group’s accounting policies and bases are given in note 11.
NOTES TO THE ACCOUNTS
49Cookson Group plc Annual Report 2004
1 Accounting policies and critical accounting estimates continuedFixed asset investmentsShares in Group subsidiaries are stated at cost less any impairment in value in the Company balance sheet. The Group’s joint venturesare incorporated into the Group accounts using the gross equity method of accounting, such that the Group’s share of their profit or lossis included in the Group profit and loss account and, in the Group balance sheet, investments in joint ventures are included at the Group’sshare of the net assets of each joint venture. The accounting policies of joint ventures are similar in all material aspects to those of theCompany and its subsidiaries. Further details of fixed asset investments at the year end and movements in the year are given in note 12.
StocksAll stocks stated in the Group balance sheet are valued at the lower of cost (using the first in first out method) and net realisable value.Cost comprises expenditure directly incurred in purchasing or manufacturing stocks together with, where appropriate, attributableoverheads based on normal activity levels. Provision is made for obsolete and slow moving items.
In addition to the stocks recorded in the balance sheet, the Group holds precious metals under consignment arrangements, furtherdetails of which are given in note 13.
Financial instrumentsThe Group primarily uses forward foreign currency contracts and interest rate swaps to manage the exposure to fluctuations in foreignexchange and interest rates in its borrowings. These instruments are accounted for as hedges when designated as such at the inceptionof contracts and, as a result, gains and losses on these foreign exchange contracts are offset against the foreign exchange gains andlosses on the related financial assets and liabilities. Interest rate swaps are not revalued to fair value or shown in the Group balance sheetat the year end, but the fair value is disclosed in note 17(v). Interest differentials under the contracts are recognised by accruing the netinterest payable as it becomes due. Gains or losses arising on hedging instruments which are cancelled due to the termination of theunderlying exposure are immediately taken to the profit and loss account or balance sheet as appropriate.
Translational hedges of foreign currency investments are taken to reserves. Finance costs associated with debt issuances are charged to the profit and loss account over the life of those instruments.
Deferred taxationDeferred taxation is recognised without discounting in respect of all timing differences that have originated, but not reversed, at the balancesheet date, with the exception that deferred taxation assets are only recognised if it is considered more likely than not that there will besuitable future profits from which the reversal of the underlying timing differences can be deducted. Provision is made for the tax thatwould arise on remittance of the retained earnings of overseas subsidiaries only to the extent that, at the balance sheet date, dividendshave been accrued as receivable.
Critical accounting estimatesCookson’s principal accounting policies are set out on pages 48 and 49. The application of certain of these policies requires assumptionsor subjective judgements by management, which are based on past experience and other relevant information. Estimates made by applyingthese assumptions and judgements are sometimes based on the outcome of future events and can affect both reported annual profitand Group assets and liabilities at the balance sheet date. Actual results may differ from the estimates.
The following are the critical policies where assumptions and judgements made by management could have a significant impact on theGroup’s consolidated financial statements.
Goodwill It is the Group’s policy that, for goodwill arising from the acquisition of businesses after 1997, such goodwill is capitalised and amortisedover a period up to 20 years. Management uses its judgement to determine the extent to which this goodwill has a value that will benefitthe performance of the Group over future periods. To assist in making this judgement, management carries out an assessment, at leastannually, of the carrying value of the Group’s capitalised goodwill, using discounted cash flow forecasts. Changes to the assumptions anddiscount rates used in making these forecasts could significantly alter management’s assessment of the carrying value of this goodwill.Any change in the asset lives applied to capitalised goodwill would have an impact on Group profit.
Tangible fixed assets It is Group policy to depreciate tangible fixed assets, except land, on a straight line basis over their estimated useful lives. This applies an appropriate matching of the revenue earned with the capital costs of production and delivery of goods and services. A key element of this policy is the estimate of the useful life applied to each category of fixed assets which, in turn, determines the annual depreciationcharge. Variations in asset lives could impact Group profit through an increase or decrease in the depreciation charge.
50Cookson Group plc Annual Report 2004
1 Accounting policies and critical accounting estimates continuedCurrent asset provisionsIn the course of normal trading activities, management uses its judgement to establish the net realisable value of various elements ofworking capital – principally stocks and trade debtors.
Provisions are established for obsolete or slow moving stocks, bad or doubtful debts and product warranties. Provision requirements are based on the facts available to management and are also determined by using profiles, based on past practice, applied to certainaged inventory and debtor categories.
In estimating the collectability of trade debtors, judgement is required in assessing their likely realisation, including the current credit-worthiness of each customer and related ageing of the past due balances. Specific accounts are assessed in situations where acustomer may not be able to meet its financial obligations due to a deterioration of its financial condition, credit ratings or bankruptcy.
Environmental provisionsIn certain parts of the business, mainly in the USA, the Group has obligations to carry out environmental clean-ups at former and currentproduction sites. Many of these obligations will not arise for a number of years and the costs are difficult to predict accurately. Managementuses its judgement and experience to provide an appropriate amount for the likely cost of such clean-ups.
Pensions and other post-employment benefitsThe Group’s results include costs relating to the obligations associated with the provision of pension and other post-employment benefitsto current and former employees. It is management’s responsibility to set the assumptions used in determining the key elements of thecosts of meeting such future obligations. These assumptions are set after consultation with the Group’s actuaries and include those usedto determine regular service costs and the financing elements related to the plans’ assets and liabilities. Whilst management believes thatthe assumptions used are appropriate, a change in the assumptions used would affect Group profit.
Deferred taxationThe Group has recognised deferred tax assets in respect of unutilised losses and other timing differences arising in certain of the Group’sbusinesses, primarily in the USA. Account has been taken of future forecasts of taxable profit in arriving at the values at which these assetsare recognised. If these forecast profits do not materialise or change, or there are changes in tax rates or to the period over which thelosses or timing difference might be recognised, then the value of the deferred tax asset will need to be revised downwards or upwardsin a future period.
The Group has losses and other timing differences for which no value has been recognised for deferred tax purposes in these financialstatements. These can arise in loss-making subsidiaries where the future economic benefit of these timing differences is uncertain. It canalso arise where the timing differences are of such a nature that their value is dependent only on certain types of profit being earned, suchas capital profits. If trading or other appropriate profits are earned in future in these companies, the timing differences may yield benefit to the Group in the form of reduced tax charge.
See note 20 for further details of the deferred tax assets which have been recognised and not recognised in these financial statements.
2 Segmental analysesIn each of the following analyses, the costs and net assets of the Group’s corporate activities have been allocated primarily according to the relative turnover contribution of each continuing operating segment to the total. Inter-segment sales are not material in relation to total Group turnover, whether analysed by division or by geographic location of operations. Of the results of continuing operations, the contribution from acquisitions to turnover and operating profit in 2004 and 2003 was not material.
Certain small divestments were made in 2004 which were not sufficiently material to warrant disclosure as a separate discontinuedoperation. Further details of these divestments, and their results for the year ended 31 December 2004, are shown in note 24.
The results reported for 2003 as discontinued operations mainly comprise the Electronics division’s Speedline businesses. Speedline waslargely based in the USA, with satellite operations in Europe and Asia. Other disposals in 2003 included the Precision Products sector ofthe Precious Metals division which was sold in January 2003 and largely based in the USA, three non-core European businesses in theCeramics and Precious Metals divisions and a non-core Asia-Pacific joint venture in the Electronics division. These discontinued operationspreviously formed part of the Group’s continuing operations.
The total amount for net assets included below is arrived at after adding back to Group assets less Group liabilities of £571.1m (2003: £626.9m)borrowings of £354.3m (2003: £415.3m) and deducting cash and investments, other than those in joint ventures, of £57.7m (2003: £87.1mafter restatement – see note 1).
NOTES TO THE ACCOUNTS CONTINUED
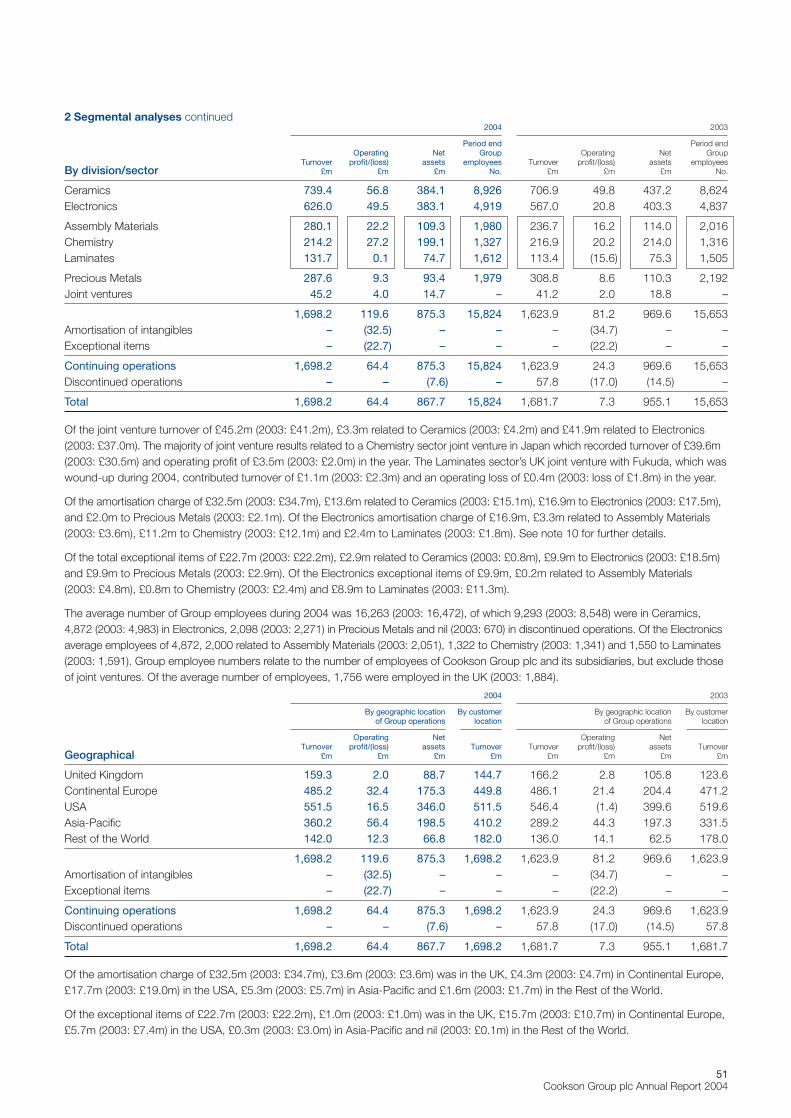
51Cookson Group plc Annual Report 2004
2 Segmental analyses continued2004 2003
Period end Period endOperating Net Group Operating Net Group
Turnover profit/(loss) assets employees Turnover profit/(loss) assets employeesBy division/sector £m £m £m No. £m £m £m No.
Ceramics 739.4 56.8 384.1 8,926 706.9 49.8 437.2 8,624Electronics 626.0 49.5 383.1 4,919 567.0 20.8 403.3 4,837
Assembly Materials 280.1 22.2 109.3 1,980 236.7 16.2 114.0 2,016Chemistry 214.2 27.2 199.1 1,327 216.9 20.2 214.0 1,316Laminates 131.7 0.1 74.7 1,612 113.4 (15.6) 75.3 1,505
Precious Metals 287.6 9.3 93.4 1,979 308.8 8.6 110.3 2,192Joint ventures 45.2 4.0 14.7 – 41.2 2.0 18.8 –
1,698.2 119.6 875.3 15,824 1,623.9 81.2 969.6 15,653Amortisation of intangibles – (32.5) – – – (34.7) – –Exceptional items – (22.7) – – – (22.2) – –
Continuing operations 1,698.2 64.4 875.3 15,824 1,623.9 24.3 969.6 15,653Discontinued operations – – (7.6) – 57.8 (17.0) (14.5) –
Total 1,698.2 64.4 867.7 15,824 1,681.7 7.3 955.1 15,653
Of the joint venture turnover of £45.2m (2003: £41.2m), £3.3m related to Ceramics (2003: £4.2m) and £41.9m related to Electronics(2003: £37.0m). The majority of joint venture results related to a Chemistry sector joint venture in Japan which recorded turnover of £39.6m(2003: £30.5m) and operating profit of £3.5m (2003: £2.0m) in the year. The Laminates sector’s UK joint venture with Fukuda, which waswound-up during 2004, contributed turnover of £1.1m (2003: £2.3m) and an operating loss of £0.4m (2003: loss of £1.8m) in the year.
Of the amortisation charge of £32.5m (2003: £34.7m), £13.6m related to Ceramics (2003: £15.1m), £16.9m to Electronics (2003: £17.5m),and £2.0m to Precious Metals (2003: £2.1m). Of the Electronics amortisation charge of £16.9m, £3.3m related to Assembly Materials(2003: £3.6m), £11.2m to Chemistry (2003: £12.1m) and £2.4m to Laminates (2003: £1.8m). See note 10 for further details.
Of the total exceptional items of £22.7m (2003: £22.2m), £2.9m related to Ceramics (2003: £0.8m), £9.9m to Electronics (2003: £18.5m)and £9.9m to Precious Metals (2003: £2.9m). Of the Electronics exceptional items of £9.9m, £0.2m related to Assembly Materials (2003: £4.8m), £0.8m to Chemistry (2003: £2.4m) and £8.9m to Laminates (2003: £11.3m).
The average number of Group employees during 2004 was 16,263 (2003: 16,472), of which 9,293 (2003: 8,548) were in Ceramics,4,872 (2003: 4,983) in Electronics, 2,098 (2003: 2,271) in Precious Metals and nil (2003: 670) in discontinued operations. Of the Electronicsaverage employees of 4,872, 2,000 related to Assembly Materials (2003: 2,051), 1,322 to Chemistry (2003: 1,341) and 1,550 to Laminates(2003: 1,591). Group employee numbers relate to the number of employees of Cookson Group plc and its subsidiaries, but exclude thoseof joint ventures. Of the average number of employees, 1,756 were employed in the UK (2003: 1,884).
2004 2003
By geographic location By customer By geographic location By customerof Group operations location of Group operations location
Operating Net Operating NetTurnover profit/(loss) assets Turnover Turnover profit/(loss) assets Turnover
Geographical £m £m £m £m £m £m £m £m
United Kingdom 159.3 2.0 88.7 144.7 166.2 2.8 105.8 123.6Continental Europe 485.2 32.4 175.3 449.8 486.1 21.4 204.4 471.2USA 551.5 16.5 346.0 511.5 546.4 (1.4) 399.6 519.6Asia-Pacific 360.2 56.4 198.5 410.2 289.2 44.3 197.3 331.5Rest of the World 142.0 12.3 66.8 182.0 136.0 14.1 62.5 178.0
1,698.2 119.6 875.3 1,698.2 1,623.9 81.2 969.6 1,623.9Amortisation of intangibles – (32.5) – – – (34.7) – –Exceptional items – (22.7) – – – (22.2) – –
Continuing operations 1,698.2 64.4 875.3 1,698.2 1,623.9 24.3 969.6 1,623.9Discontinued operations – – (7.6) – 57.8 (17.0) (14.5) 57.8
Total 1,698.2 64.4 867.7 1,698.2 1,681.7 7.3 955.1 1,681.7
Of the amortisation charge of £32.5m (2003: £34.7m), £3.6m (2003: £3.6m) was in the UK, £4.3m (2003: £4.7m) in Continental Europe,£17.7m (2003: £19.0m) in the USA, £5.3m (2003: £5.7m) in Asia-Pacific and £1.6m (2003: £1.7m) in the Rest of the World.
Of the exceptional items of £22.7m (2003: £22.2m), £1.0m (2003: £1.0m) was in the UK, £15.7m (2003: £10.7m) in Continental Europe,£5.7m (2003: £7.4m) in the USA, £0.3m (2003: £3.0m) in Asia-Pacific and nil (2003: £0.1m) in the Rest of the World.
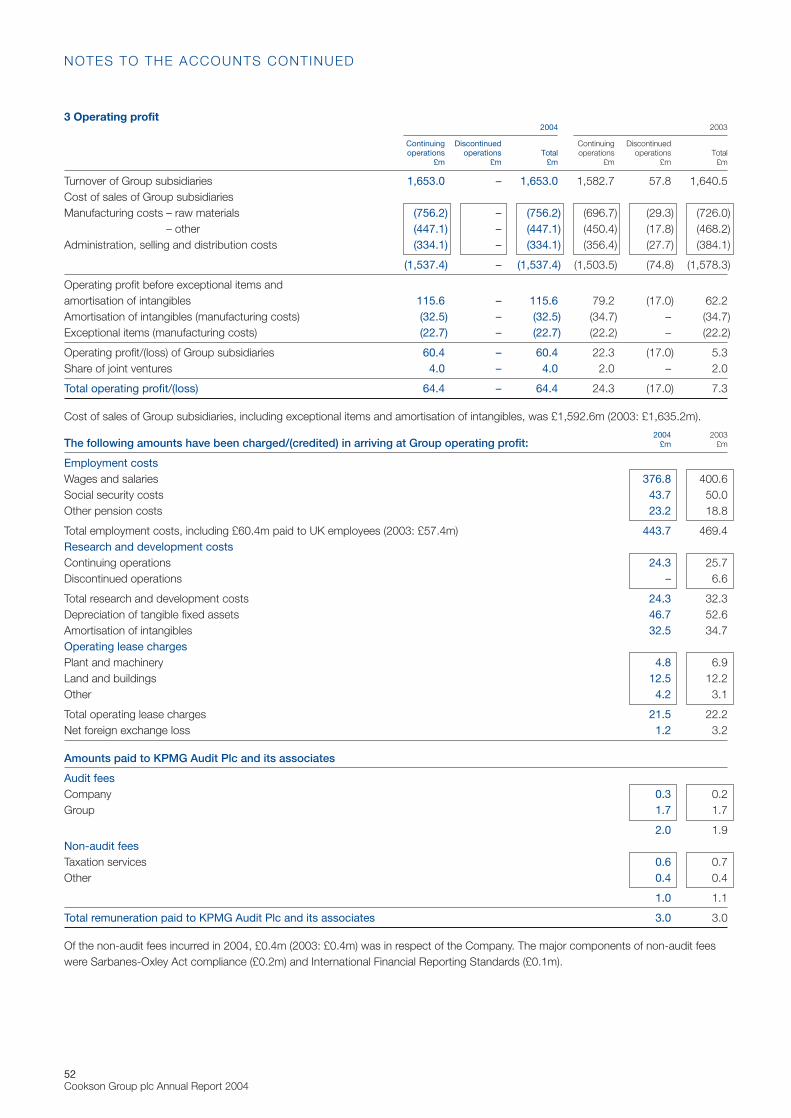
52Cookson Group plc Annual Report 2004
3 Operating profit2004 2003
Continuing Discontinued Continuing Discontinuedoperations operations Total operations operations Total
£m £m £m £m £m £m
Turnover of Group subsidiaries 1,653.0 – 1,653.0 1,582.7 57.8 1,640.5Cost of sales of Group subsidiariesManufacturing costs – raw materials (756.2) – (756.2) (696.7) (29.3) (726.0)
– other (447.1) – (447.1) (450.4) (17.8) (468.2)Administration, selling and distribution costs (334.1) – (334.1) (356.4) (27.7) (384.1)
(1,537.4) – (1,537.4) (1,503.5) (74.8) (1,578.3)
Operating profit before exceptional items andamortisation of intangibles 115.6 – 115.6 79.2 (17.0) 62.2Amortisation of intangibles (manufacturing costs) (32.5) – (32.5) (34.7) – (34.7)Exceptional items (manufacturing costs) (22.7) – (22.7) (22.2) – (22.2)
Operating profit/(loss) of Group subsidiaries 60.4 – 60.4 22.3 (17.0) 5.3Share of joint ventures 4.0 – 4.0 2.0 – 2.0
Total operating profit/(loss) 64.4 – 64.4 24.3 (17.0) 7.3
Cost of sales of Group subsidiaries, including exceptional items and amortisation of intangibles, was £1,592.6m (2003: £1,635.2m).
2004 2003The following amounts have been charged/(credited) in arriving at Group operating profit: £m £m
Employment costsWages and salaries 376.8 400.6Social security costs 43.7 50.0Other pension costs 23.2 18.8
Total employment costs, including £60.4m paid to UK employees (2003: £57.4m) 443.7 469.4Research and development costsContinuing operations 24.3 25.7Discontinued operations – 6.6
Total research and development costs 24.3 32.3Depreciation of tangible fixed assets 46.7 52.6Amortisation of intangibles 32.5 34.7Operating lease chargesPlant and machinery 4.8 6.9Land and buildings 12.5 12.2Other 4.2 3.1
Total operating lease charges 21.5 22.2Net foreign exchange loss 1.2 3.2
Amounts paid to KPMG Audit Plc and its associates
Audit feesCompany 0.3 0.2Group 1.7 1.7
2.0 1.9Non-audit feesTaxation services 0.6 0.7Other 0.4 0.4
1.0 1.1
Total remuneration paid to KPMG Audit Plc and its associates 3.0 3.0
Of the non-audit fees incurred in 2004, £0.4m (2003: £0.4m) was in respect of the Company. The major components of non-audit feeswere Sarbanes-Oxley Act compliance (£0.2m) and International Financial Reporting Standards (£0.1m).
NOTES TO THE ACCOUNTS CONTINUED
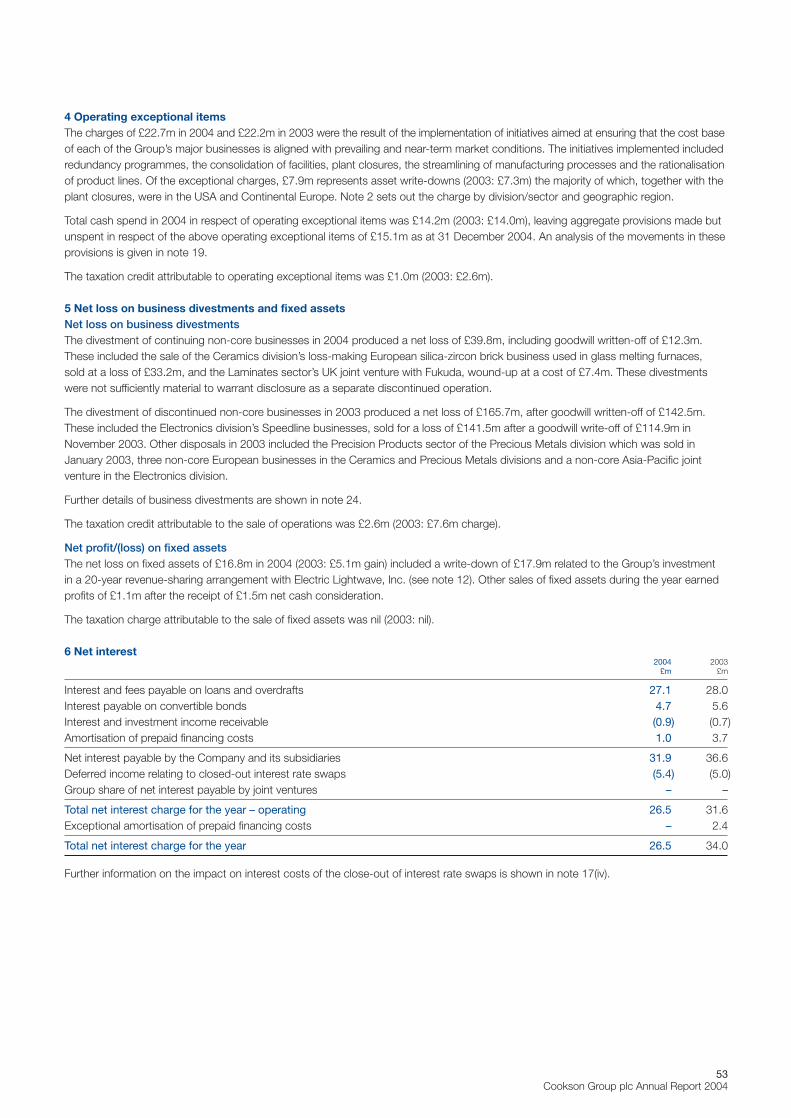
53Cookson Group plc Annual Report 2004
4 Operating exceptional itemsThe charges of £22.7m in 2004 and £22.2m in 2003 were the result of the implementation of initiatives aimed at ensuring that the cost baseof each of the Group’s major businesses is aligned with prevailing and near-term market conditions. The initiatives implemented includedredundancy programmes, the consolidation of facilities, plant closures, the streamlining of manufacturing processes and the rationalisationof product lines. Of the exceptional charges, £7.9m represents asset write-downs (2003: £7.3m) the majority of which, together with theplant closures, were in the USA and Continental Europe. Note 2 sets out the charge by division/sector and geographic region.
Total cash spend in 2004 in respect of operating exceptional items was £14.2m (2003: £14.0m), leaving aggregate provisions made butunspent in respect of the above operating exceptional items of £15.1m as at 31 December 2004. An analysis of the movements in theseprovisions is given in note 19.
The taxation credit attributable to operating exceptional items was £1.0m (2003: £2.6m).
5 Net loss on business divestments and fixed assetsNet loss on business divestmentsThe divestment of continuing non-core businesses in 2004 produced a net loss of £39.8m, including goodwill written-off of £12.3m.These included the sale of the Ceramics division’s loss-making European silica-zircon brick business used in glass melting furnaces, sold at a loss of £33.2m, and the Laminates sector’s UK joint venture with Fukuda, wound-up at a cost of £7.4m. These divestmentswere not sufficiently material to warrant disclosure as a separate discontinued operation.
The divestment of discontinued non-core businesses in 2003 produced a net loss of £165.7m, after goodwill written-off of £142.5m.These included the Electronics division’s Speedline businesses, sold for a loss of £141.5m after a goodwill write-off of £114.9m inNovember 2003. Other disposals in 2003 included the Precision Products sector of the Precious Metals division which was sold inJanuary 2003, three non-core European businesses in the Ceramics and Precious Metals divisions and a non-core Asia-Pacific jointventure in the Electronics division.
Further details of business divestments are shown in note 24.
The taxation credit attributable to the sale of operations was £2.6m (2003: £7.6m charge).
Net profit/(loss) on fixed assetsThe net loss on fixed assets of £16.8m in 2004 (2003: £5.1m gain) included a write-down of £17.9m related to the Group’s investment in a 20-year revenue-sharing arrangement with Electric Lightwave, Inc. (see note 12). Other sales of fixed assets during the year earnedprofits of £1.1m after the receipt of £1.5m net cash consideration.
The taxation charge attributable to the sale of fixed assets was nil (2003: nil).
6 Net interest2004 2003
£m £m
Interest and fees payable on loans and overdrafts 27.1 28.0Interest payable on convertible bonds 4.7 5.6Interest and investment income receivable (0.9) (0.7)Amortisation of prepaid financing costs 1.0 3.7
Net interest payable by the Company and its subsidiaries 31.9 36.6Deferred income relating to closed-out interest rate swaps (5.4) (5.0)Group share of net interest payable by joint ventures – –
Total net interest charge for the year – operating 26.5 31.6Exceptional amortisation of prepaid financing costs – 2.4
Total net interest charge for the year 26.5 34.0
Further information on the impact on interest costs of the close-out of interest rate swaps is shown in note 17(iv).
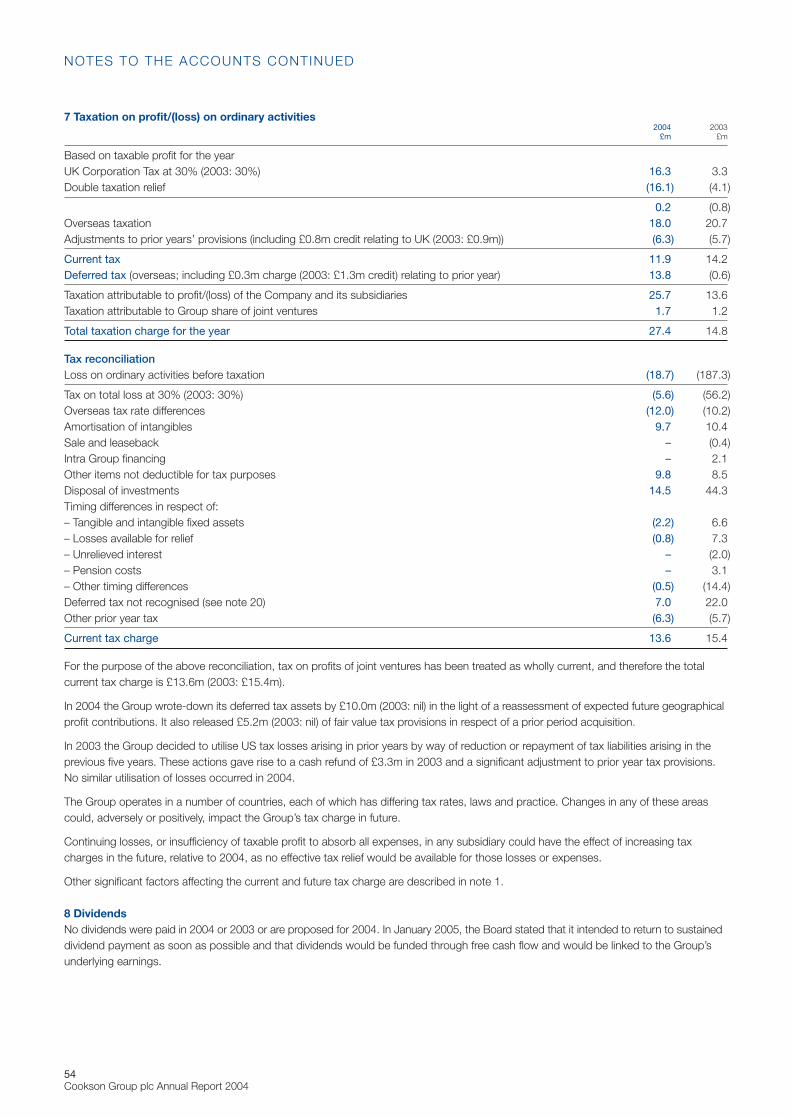
54Cookson Group plc Annual Report 2004
7 Taxation on profit/(loss) on ordinary activities2004 2003
£m £m
Based on taxable profit for the yearUK Corporation Tax at 30% (2003: 30%) 16.3 3.3Double taxation relief (16.1) (4.1)
0.2 (0.8)Overseas taxation 18.0 20.7Adjustments to prior years’ provisions (including £0.8m credit relating to UK (2003: £0.9m)) (6.3) (5.7)
Current tax 11.9 14.2Deferred tax (overseas; including £0.3m charge (2003: £1.3m credit) relating to prior year) 13.8 (0.6)
Taxation attributable to profit/(loss) of the Company and its subsidiaries 25.7 13.6Taxation attributable to Group share of joint ventures 1.7 1.2
Total taxation charge for the year 27.4 14.8
Tax reconciliationLoss on ordinary activities before taxation (18.7) (187.3)
Tax on total loss at 30% (2003: 30%) (5.6) (56.2)Overseas tax rate differences (12.0) (10.2)Amortisation of intangibles 9.7 10.4Sale and leaseback – (0.4)Intra Group financing – 2.1Other items not deductible for tax purposes 9.8 8.5Disposal of investments 14.5 44.3Timing differences in respect of:– Tangible and intangible fixed assets (2.2) 6.6– Losses available for relief (0.8) 7.3– Unrelieved interest – (2.0)– Pension costs – 3.1– Other timing differences (0.5) (14.4)Deferred tax not recognised (see note 20) 7.0 22.0Other prior year tax (6.3) (5.7)
Current tax charge 13.6 15.4
For the purpose of the above reconciliation, tax on profits of joint ventures has been treated as wholly current, and therefore the totalcurrent tax charge is £13.6m (2003: £15.4m).
In 2004 the Group wrote-down its deferred tax assets by £10.0m (2003: nil) in the light of a reassessment of expected future geographicalprofit contributions. It also released £5.2m (2003: nil) of fair value tax provisions in respect of a prior period acquisition.
In 2003 the Group decided to utilise US tax losses arising in prior years by way of reduction or repayment of tax liabilities arising in theprevious five years. These actions gave rise to a cash refund of £3.3m in 2003 and a significant adjustment to prior year tax provisions.No similar utilisation of losses occurred in 2004.
The Group operates in a number of countries, each of which has differing tax rates, laws and practice. Changes in any of these areascould, adversely or positively, impact the Group’s tax charge in future.
Continuing losses, or insufficiency of taxable profit to absorb all expenses, in any subsidiary could have the effect of increasing taxcharges in the future, relative to 2004, as no effective tax relief would be available for those losses or expenses.
Other significant factors affecting the current and future tax charge are described in note 1.
8 DividendsNo dividends were paid in 2004 or 2003 or are proposed for 2004. In January 2005, the Board stated that it intended to return to sustaineddividend payment as soon as possible and that dividends would be funded through free cash flow and would be linked to the Group’sunderlying earnings.
NOTES TO THE ACCOUNTS CONTINUED
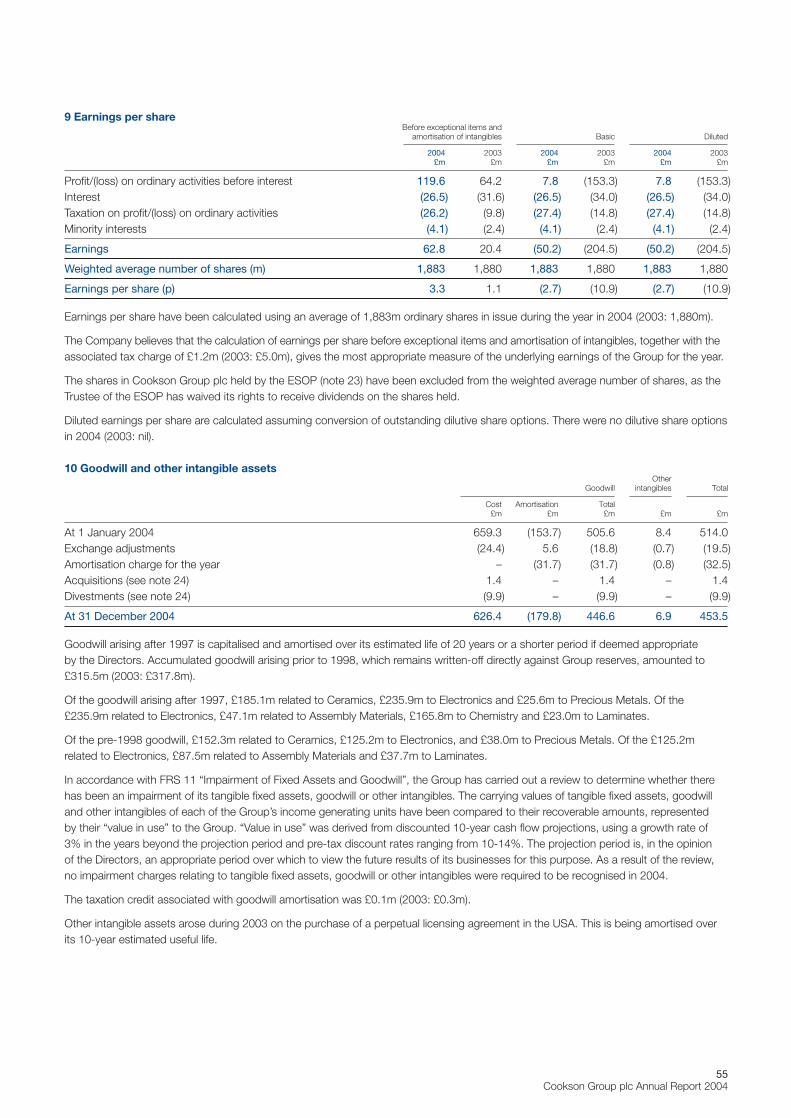
55Cookson Group plc Annual Report 2004
9 Earnings per shareBefore exceptional items and
amortisation of intangibles Basic Diluted
2004 2003 2004 2003 2004 2003£m £m £m £m £m £m
Profit/(loss) on ordinary activities before interest 119.6 64.2 7.8 (153.3) 7.8 (153.3)Interest (26.5) (31.6) (26.5) (34.0) (26.5) (34.0)Taxation on profit/(loss) on ordinary activities (26.2) (9.8) (27.4) (14.8) (27.4) (14.8)Minority interests (4.1) (2.4) (4.1) (2.4) (4.1) (2.4)
Earnings 62.8 20.4 (50.2) (204.5) (50.2) (204.5)
Weighted average number of shares (m) 1,883 1,880 1,883 1,880 1,883 1,880
Earnings per share (p) 3.3 1.1 (2.7) (10.9) (2.7) (10.9)
Earnings per share have been calculated using an average of 1,883m ordinary shares in issue during the year in 2004 (2003: 1,880m).
The Company believes that the calculation of earnings per share before exceptional items and amortisation of intangibles, together with theassociated tax charge of £1.2m (2003: £5.0m), gives the most appropriate measure of the underlying earnings of the Group for the year.
The shares in Cookson Group plc held by the ESOP (note 23) have been excluded from the weighted average number of shares, as theTrustee of the ESOP has waived its rights to receive dividends on the shares held.
Diluted earnings per share are calculated assuming conversion of outstanding dilutive share options. There were no dilutive share optionsin 2004 (2003: nil).
10 Goodwill and other intangible assetsOther
Goodwill intangibles Total
Cost Amortisation Total£m £m £m £m £m
At 1 January 2004 659.3 (153.7) 505.6 8.4 514.0Exchange adjustments (24.4) 5.6 (18.8) (0.7) (19.5)Amortisation charge for the year – (31.7) (31.7) (0.8) (32.5)Acquisitions (see note 24) 1.4 – 1.4 – 1.4Divestments (see note 24) (9.9) – (9.9) – (9.9)
At 31 December 2004 626.4 (179.8) 446.6 6.9 453.5
Goodwill arising after 1997 is capitalised and amortised over its estimated life of 20 years or a shorter period if deemed appropriate by the Directors. Accumulated goodwill arising prior to 1998, which remains written-off directly against Group reserves, amounted to£315.5m (2003: £317.8m).
Of the goodwill arising after 1997, £185.1m related to Ceramics, £235.9m to Electronics and £25.6m to Precious Metals. Of the£235.9m related to Electronics, £47.1m related to Assembly Materials, £165.8m to Chemistry and £23.0m to Laminates.
Of the pre-1998 goodwill, £152.3m related to Ceramics, £125.2m to Electronics, and £38.0m to Precious Metals. Of the £125.2mrelated to Electronics, £87.5m related to Assembly Materials and £37.7m to Laminates.
In accordance with FRS 11 “Impairment of Fixed Assets and Goodwill”, the Group has carried out a review to determine whether therehas been an impairment of its tangible fixed assets, goodwill or other intangibles. The carrying values of tangible fixed assets, goodwilland other intangibles of each of the Group’s income generating units have been compared to their recoverable amounts, represented by their “value in use” to the Group. “Value in use” was derived from discounted 10-year cash flow projections, using a growth rate of 3% in the years beyond the projection period and pre-tax discount rates ranging from 10-14%. The projection period is, in the opinion of the Directors, an appropriate period over which to view the future results of its businesses for this purpose. As a result of the review,no impairment charges relating to tangible fixed assets, goodwill or other intangibles were required to be recognised in 2004.
The taxation credit associated with goodwill amortisation was £0.1m (2003: £0.3m).
Other intangible assets arose during 2003 on the purchase of a perpetual licensing agreement in the USA. This is being amortised overits 10-year estimated useful life.
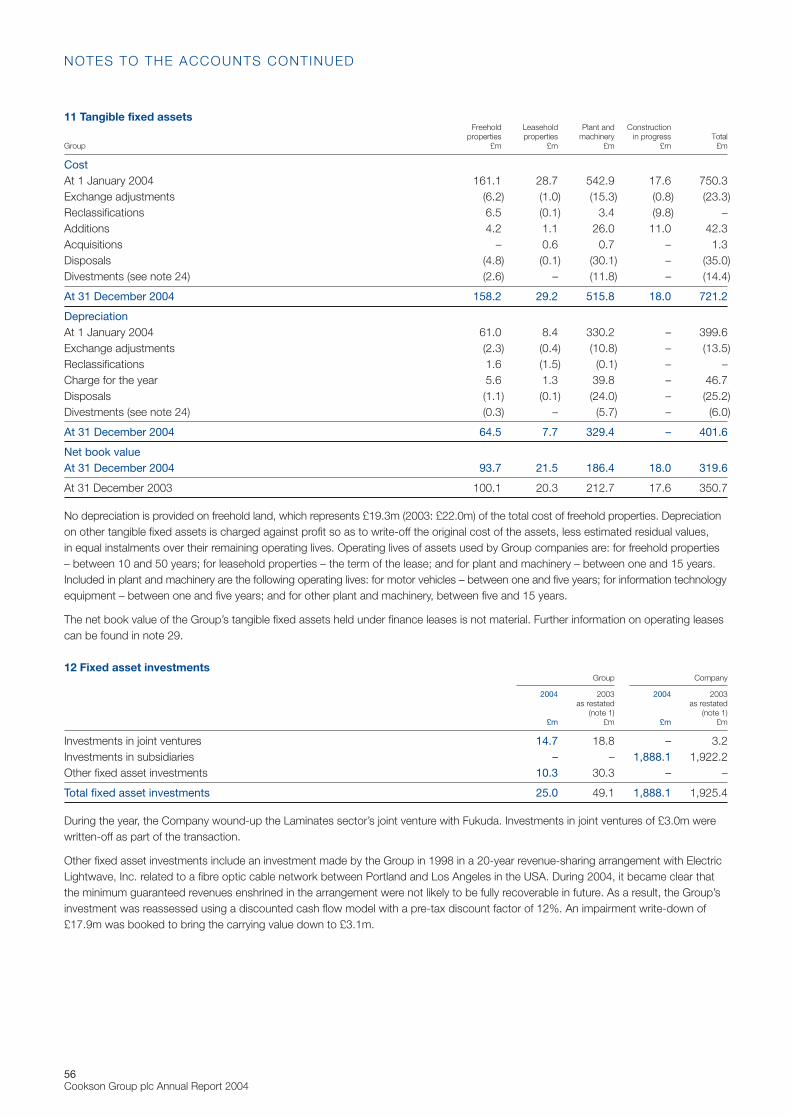
56Cookson Group plc Annual Report 2004
11 Tangible fixed assetsFreehold Leasehold Plant and Construction
properties properties machinery in progress TotalGroup £m £m £m £m £m
CostAt 1 January 2004 161.1 28.7 542.9 17.6 750.3Exchange adjustments (6.2) (1.0) (15.3) (0.8) (23.3)Reclassifications 6.5 (0.1) 3.4 (9.8) –Additions 4.2 1.1 26.0 11.0 42.3Acquisitions – 0.6 0.7 – 1.3Disposals (4.8) (0.1) (30.1) – (35.0)Divestments (see note 24) (2.6) – (11.8) – (14.4)
At 31 December 2004 158.2 29.2 515.8 18.0 721.2
DepreciationAt 1 January 2004 61.0 8.4 330.2 – 399.6Exchange adjustments (2.3) (0.4) (10.8) – (13.5)Reclassifications 1.6 (1.5) (0.1) – –Charge for the year 5.6 1.3 39.8 – 46.7Disposals (1.1) (0.1) (24.0) – (25.2)Divestments (see note 24) (0.3) – (5.7) – (6.0)
At 31 December 2004 64.5 7.7 329.4 – 401.6
Net book valueAt 31 December 2004 93.7 21.5 186.4 18.0 319.6
At 31 December 2003 100.1 20.3 212.7 17.6 350.7
No depreciation is provided on freehold land, which represents £19.3m (2003: £22.0m) of the total cost of freehold properties. Depreciationon other tangible fixed assets is charged against profit so as to write-off the original cost of the assets, less estimated residual values, in equal instalments over their remaining operating lives. Operating lives of assets used by Group companies are: for freehold properties– between 10 and 50 years; for leasehold properties – the term of the lease; and for plant and machinery – between one and 15 years.Included in plant and machinery are the following operating lives: for motor vehicles – between one and five years; for information technologyequipment – between one and five years; and for other plant and machinery, between five and 15 years.
The net book value of the Group’s tangible fixed assets held under finance leases is not material. Further information on operating leasescan be found in note 29.
12 Fixed asset investmentsGroup Company
2004 2003 2004 2003as restated as restated
(note 1) (note 1)£m £m £m £m
Investments in joint ventures 14.7 18.8 – 3.2Investments in subsidiaries – – 1,888.1 1,922.2Other fixed asset investments 10.3 30.3 – –
Total fixed asset investments 25.0 49.1 1,888.1 1,925.4
During the year, the Company wound-up the Laminates sector’s joint venture with Fukuda. Investments in joint ventures of £3.0m werewritten-off as part of the transaction.
Other fixed asset investments include an investment made by the Group in 1998 in a 20-year revenue-sharing arrangement with ElectricLightwave, Inc. related to a fibre optic cable network between Portland and Los Angeles in the USA. During 2004, it became clear thatthe minimum guaranteed revenues enshrined in the arrangement were not likely to be fully recoverable in future. As a result, the Group’sinvestment was reassessed using a discounted cash flow model with a pre-tax discount factor of 12%. An impairment write-down of£17.9m was booked to bring the carrying value down to £3.1m.
NOTES TO THE ACCOUNTS CONTINUED
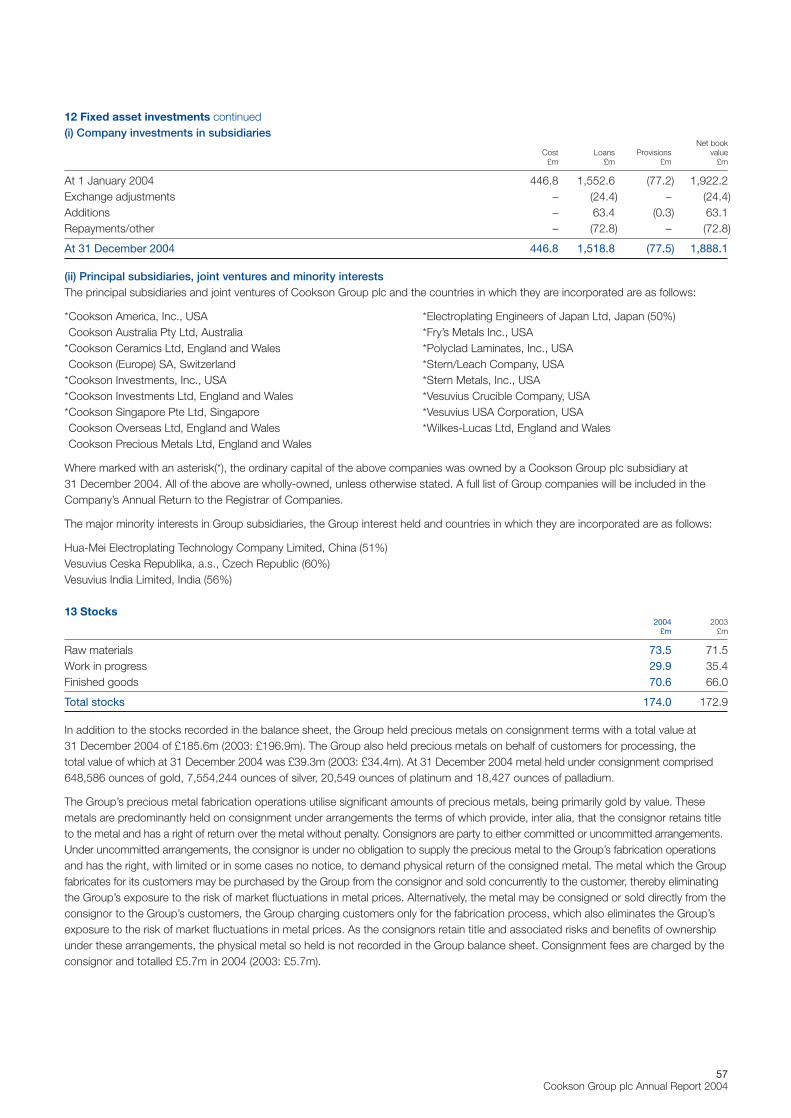
57Cookson Group plc Annual Report 2004
12 Fixed asset investments continued(i) Company investments in subsidiaries
Net bookCost Loans Provisions value
£m £m £m £m
At 1 January 2004 446.8 1,552.6 (77.2) 1,922.2Exchange adjustments – (24.4) – (24.4)Additions – 63.4 (0.3) 63.1Repayments/other – (72.8) – (72.8)
At 31 December 2004 446.8 1,518.8 (77.5) 1,888.1
(ii) Principal subsidiaries, joint ventures and minority interestsThe principal subsidiaries and joint ventures of Cookson Group plc and the countries in which they are incorporated are as follows:
*Cookson America, Inc., USA *Electroplating Engineers of Japan Ltd, Japan (50%)Cookson Australia Pty Ltd, Australia *Fry’s Metals Inc., USA
*Cookson Ceramics Ltd, England and Wales *Polyclad Laminates, Inc., USACookson (Europe) SA, Switzerland *Stern/Leach Company, USA
*Cookson Investments, Inc., USA *Stern Metals, Inc., USA*Cookson Investments Ltd, England and Wales *Vesuvius Crucible Company, USA*Cookson Singapore Pte Ltd, Singapore *Vesuvius USA Corporation, USACookson Overseas Ltd, England and Wales *Wilkes-Lucas Ltd, England and WalesCookson Precious Metals Ltd, England and Wales
Where marked with an asterisk(*), the ordinary capital of the above companies was owned by a Cookson Group plc subsidiary at31 December 2004. All of the above are wholly-owned, unless otherwise stated. A full list of Group companies will be included in theCompany’s Annual Return to the Registrar of Companies.
The major minority interests in Group subsidiaries, the Group interest held and countries in which they are incorporated are as follows:
Hua-Mei Electroplating Technology Company Limited, China (51%)Vesuvius Ceska Republika, a.s., Czech Republic (60%)Vesuvius India Limited, India (56%)
13 Stocks2004 2003
£m £m
Raw materials 73.5 71.5Work in progress 29.9 35.4Finished goods 70.6 66.0
Total stocks 174.0 172.9
In addition to the stocks recorded in the balance sheet, the Group held precious metals on consignment terms with a total value at31 December 2004 of £185.6m (2003: £196.9m). The Group also held precious metals on behalf of customers for processing, the total value of which at 31 December 2004 was £39.3m (2003: £34.4m). At 31 December 2004 metal held under consignment comprised648,586 ounces of gold, 7,554,244 ounces of silver, 20,549 ounces of platinum and 18,427 ounces of palladium.
The Group’s precious metal fabrication operations utilise significant amounts of precious metals, being primarily gold by value. Thesemetals are predominantly held on consignment under arrangements the terms of which provide, inter alia, that the consignor retains titleto the metal and has a right of return over the metal without penalty. Consignors are party to either committed or uncommitted arrangements.Under uncommitted arrangements, the consignor is under no obligation to supply the precious metal to the Group’s fabrication operationsand has the right, with limited or in some cases no notice, to demand physical return of the consigned metal. The metal which the Groupfabricates for its customers may be purchased by the Group from the consignor and sold concurrently to the customer, thereby eliminatingthe Group’s exposure to the risk of market fluctuations in metal prices. Alternatively, the metal may be consigned or sold directly from theconsignor to the Group’s customers, the Group charging customers only for the fabrication process, which also eliminates the Group’sexposure to the risk of market fluctuations in metal prices. As the consignors retain title and associated risks and benefits of ownershipunder these arrangements, the physical metal so held is not recorded in the Group balance sheet. Consignment fees are charged by theconsignor and totalled £5.7m in 2004 (2003: £5.7m).
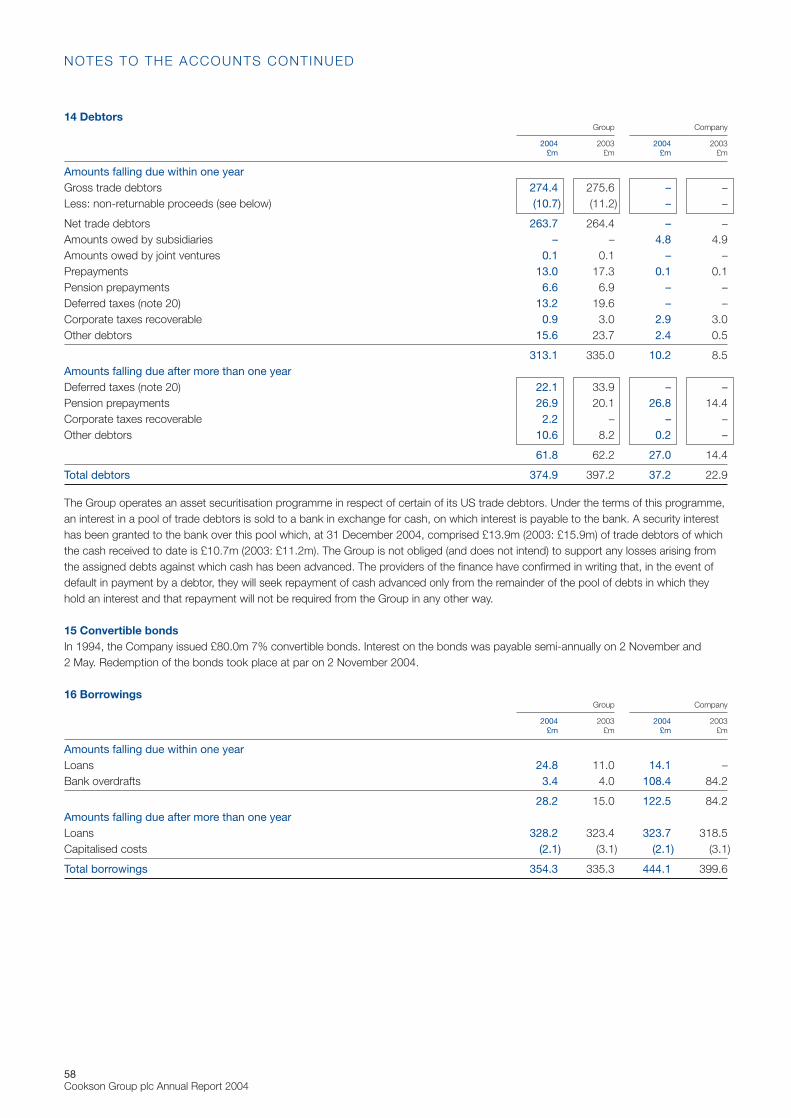
58Cookson Group plc Annual Report 2004
14 DebtorsGroup Company
2004 2003 2004 2003£m £m £m £m
Amounts falling due within one yearGross trade debtors 274.4 275.6 – –Less: non-returnable proceeds (see below) (10.7) (11.2) – –
Net trade debtors 263.7 264.4 – –Amounts owed by subsidiaries – – 4.8 4.9Amounts owed by joint ventures 0.1 0.1 – –Prepayments 13.0 17.3 0.1 0.1Pension prepayments 6.6 6.9 – –Deferred taxes (note 20) 13.2 19.6 – –Corporate taxes recoverable 0.9 3.0 2.9 3.0Other debtors 15.6 23.7 2.4 0.5
313.1 335.0 10.2 8.5Amounts falling due after more than one yearDeferred taxes (note 20) 22.1 33.9 – –Pension prepayments 26.9 20.1 26.8 14.4Corporate taxes recoverable 2.2 – – –Other debtors 10.6 8.2 0.2 –
61.8 62.2 27.0 14.4
Total debtors 374.9 397.2 37.2 22.9
The Group operates an asset securitisation programme in respect of certain of its US trade debtors. Under the terms of this programme,an interest in a pool of trade debtors is sold to a bank in exchange for cash, on which interest is payable to the bank. A security interesthas been granted to the bank over this pool which, at 31 December 2004, comprised £13.9m (2003: £15.9m) of trade debtors of whichthe cash received to date is £10.7m (2003: £11.2m). The Group is not obliged (and does not intend) to support any losses arising fromthe assigned debts against which cash has been advanced. The providers of the finance have confirmed in writing that, in the event ofdefault in payment by a debtor, they will seek repayment of cash advanced only from the remainder of the pool of debts in which theyhold an interest and that repayment will not be required from the Group in any other way.
15 Convertible bondsIn 1994, the Company issued £80.0m 7% convertible bonds. Interest on the bonds was payable semi-annually on 2 November and2 May. Redemption of the bonds took place at par on 2 November 2004.
16 BorrowingsGroup Company
2004 2003 2004 2003£m £m £m £m
Amounts falling due within one yearLoans 24.8 11.0 14.1 –Bank overdrafts 3.4 4.0 108.4 84.2
28.2 15.0 122.5 84.2Amounts falling due after more than one yearLoans 328.2 323.4 323.7 318.5Capitalised costs (2.1) (3.1) (2.1) (3.1)
Total borrowings 354.3 335.3 444.1 399.6
NOTES TO THE ACCOUNTS CONTINUED
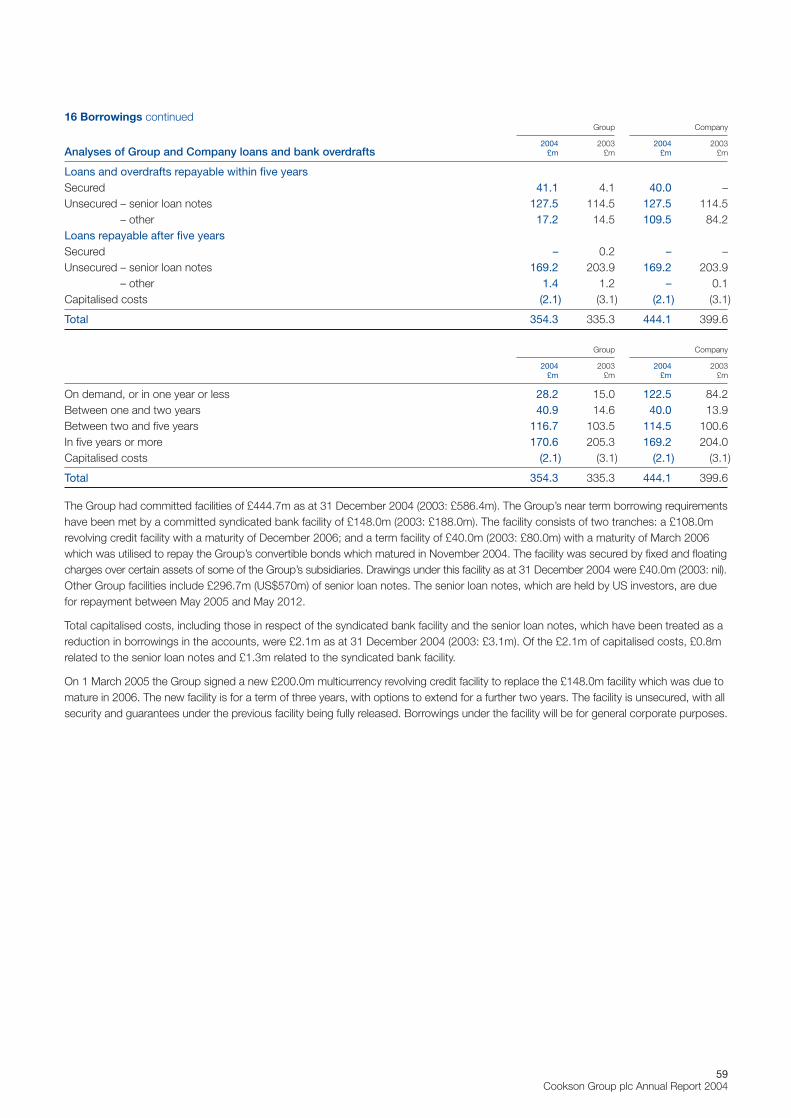
59Cookson Group plc Annual Report 2004
16 Borrowings continuedGroup Company
2004 2003 2004 2003Analyses of Group and Company loans and bank overdrafts £m £m £m £m
Loans and overdrafts repayable within five yearsSecured 41.1 4.1 40.0 –Unsecured – senior loan notes 127.5 114.5 127.5 114.5
– other 17.2 14.5 109.5 84.2Loans repayable after five yearsSecured – 0.2 – –Unsecured – senior loan notes 169.2 203.9 169.2 203.9
– other 1.4 1.2 – 0.1Capitalised costs (2.1) (3.1) (2.1) (3.1)
Total 354.3 335.3 444.1 399.6
Group Company
2004 2003 2004 2003£m £m £m £m
On demand, or in one year or less 28.2 15.0 122.5 84.2Between one and two years 40.9 14.6 40.0 13.9Between two and five years 116.7 103.5 114.5 100.6In five years or more 170.6 205.3 169.2 204.0Capitalised costs (2.1) (3.1) (2.1) (3.1)
Total 354.3 335.3 444.1 399.6
The Group had committed facilities of £444.7m as at 31 December 2004 (2003: £586.4m). The Group’s near term borrowing requirementshave been met by a committed syndicated bank facility of £148.0m (2003: £188.0m). The facility consists of two tranches: a £108.0mrevolving credit facility with a maturity of December 2006; and a term facility of £40.0m (2003: £80.0m) with a maturity of March 2006which was utilised to repay the Group’s convertible bonds which matured in November 2004. The facility was secured by fixed and floatingcharges over certain assets of some of the Group’s subsidiaries. Drawings under this facility as at 31 December 2004 were £40.0m (2003: nil).Other Group facilities include £296.7m (US$570m) of senior loan notes. The senior loan notes, which are held by US investors, are duefor repayment between May 2005 and May 2012.
Total capitalised costs, including those in respect of the syndicated bank facility and the senior loan notes, which have been treated as areduction in borrowings in the accounts, were £2.1m as at 31 December 2004 (2003: £3.1m). Of the £2.1m of capitalised costs, £0.8mrelated to the senior loan notes and £1.3m related to the syndicated bank facility.
On 1 March 2005 the Group signed a new £200.0m multicurrency revolving credit facility to replace the £148.0m facility which was due tomature in 2006. The new facility is for a term of three years, with options to extend for a further two years. The facility is unsecured, with allsecurity and guarantees under the previous facility being fully released. Borrowings under the facility will be for general corporate purposes.
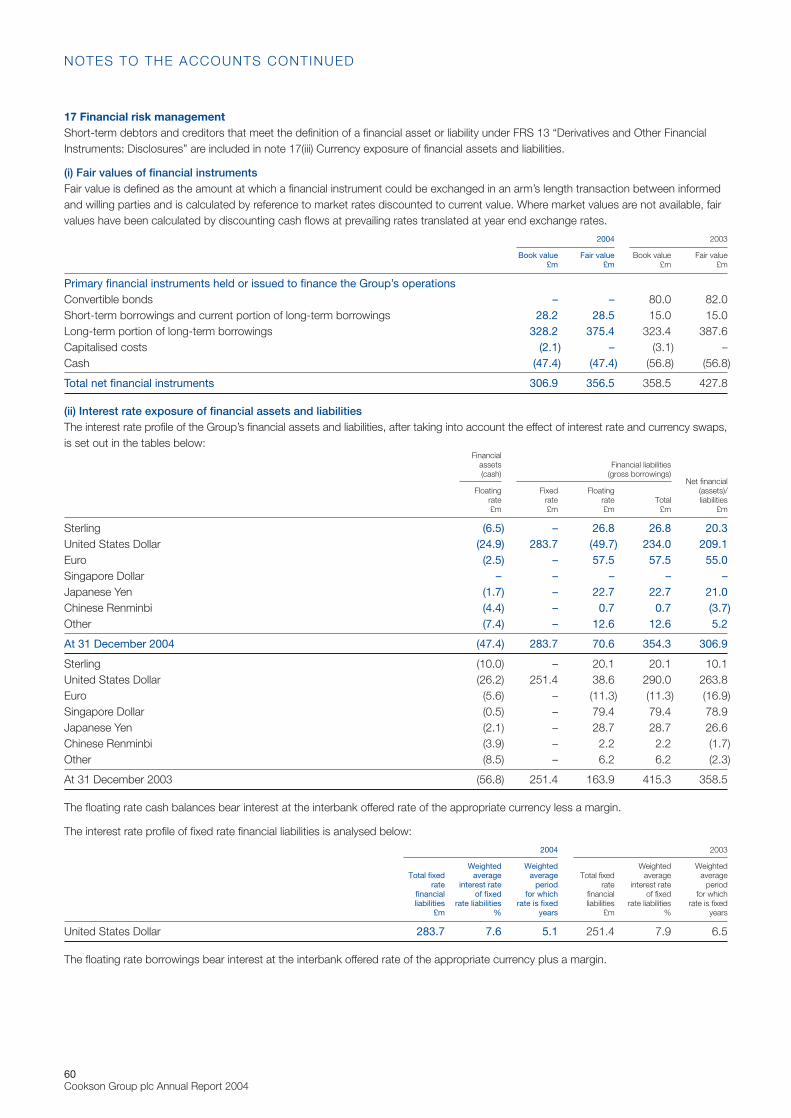
60Cookson Group plc Annual Report 2004
17 Financial risk managementShort-term debtors and creditors that meet the definition of a financial asset or liability under FRS 13 “Derivatives and Other FinancialInstruments: Disclosures” are included in note 17(iii) Currency exposure of financial assets and liabilities.
(i) Fair values of financial instrumentsFair value is defined as the amount at which a financial instrument could be exchanged in an arm’s length transaction between informedand willing parties and is calculated by reference to market rates discounted to current value. Where market values are not available, fairvalues have been calculated by discounting cash flows at prevailing rates translated at year end exchange rates.
2004 2003
Book value Fair value Book value Fair value£m £m £m £m
Primary financial instruments held or issued to finance the Group’s operationsConvertible bonds – – 80.0 82.0Short-term borrowings and current portion of long-term borrowings 28.2 28.5 15.0 15.0Long-term portion of long-term borrowings 328.2 375.4 323.4 387.6Capitalised costs (2.1) – (3.1) –Cash (47.4) (47.4) (56.8) (56.8)
Total net financial instruments 306.9 356.5 358.5 427.8
(ii) Interest rate exposure of financial assets and liabilitiesThe interest rate profile of the Group’s financial assets and liabilities, after taking into account the effect of interest rate and currency swaps,is set out in the tables below:
Financial assets Financial liabilities(cash) (gross borrowings)
Net financialFloating Fixed Floating (assets)/
rate rate rate Total liabilities£m £m £m £m £m
Sterling (6.5) – 26.8 26.8 20.3United States Dollar (24.9) 283.7 (49.7) 234.0 209.1Euro (2.5) – 57.5 57.5 55.0Singapore Dollar – – – – –Japanese Yen (1.7) – 22.7 22.7 21.0Chinese Renminbi (4.4) – 0.7 0.7 (3.7)Other (7.4) – 12.6 12.6 5.2
At 31 December 2004 (47.4) 283.7 70.6 354.3 306.9
Sterling (10.0) – 20.1 20.1 10.1United States Dollar (26.2) 251.4 38.6 290.0 263.8Euro (5.6) – (11.3) (11.3) (16.9)Singapore Dollar (0.5) – 79.4 79.4 78.9Japanese Yen (2.1) – 28.7 28.7 26.6Chinese Renminbi (3.9) – 2.2 2.2 (1.7)Other (8.5) – 6.2 6.2 (2.3)
At 31 December 2003 (56.8) 251.4 163.9 415.3 358.5
The floating rate cash balances bear interest at the interbank offered rate of the appropriate currency less a margin.
The interest rate profile of fixed rate financial liabilities is analysed below:
2004 2003
Weighted Weighted Weighted WeightedTotal fixed average average Total fixed average average
rate interest rate period rate interest rate periodfinancial of fixed for which financial of fixed for which liabilities rate liabilities rate is fixed liabilities rate liabilities rate is fixed
£m % years £m % years
United States Dollar 283.7 7.6 5.1 251.4 7.9 6.5
The floating rate borrowings bear interest at the interbank offered rate of the appropriate currency plus a margin.
NOTES TO THE ACCOUNTS CONTINUED
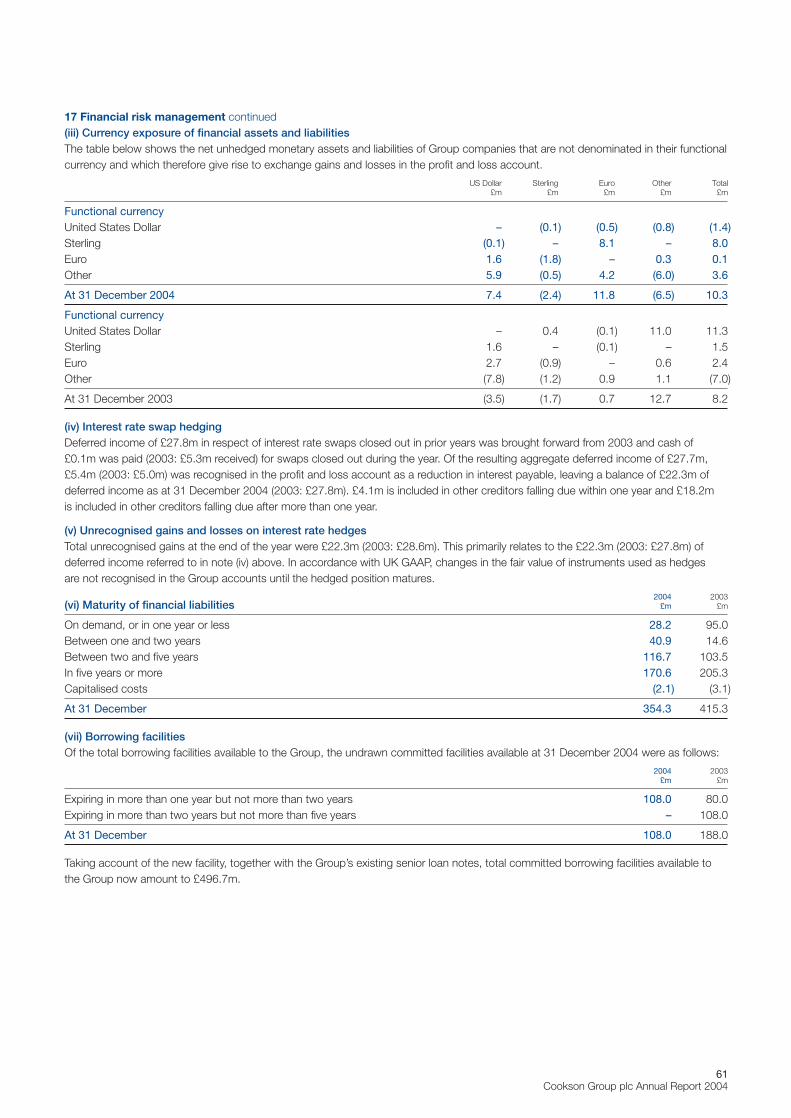
61Cookson Group plc Annual Report 2004
17 Financial risk management continued(iii) Currency exposure of financial assets and liabilitiesThe table below shows the net unhedged monetary assets and liabilities of Group companies that are not denominated in their functionalcurrency and which therefore give rise to exchange gains and losses in the profit and loss account.
US Dollar Sterling Euro Other Total£m £m £m £m £m
Functional currencyUnited States Dollar – (0.1) (0.5) (0.8) (1.4)Sterling (0.1) – 8.1 – 8.0Euro 1.6 (1.8) – 0.3 0.1Other 5.9 (0.5) 4.2 (6.0) 3.6
At 31 December 2004 7.4 (2.4) 11.8 (6.5) 10.3
Functional currencyUnited States Dollar – 0.4 (0.1) 11.0 11.3Sterling 1.6 – (0.1) – 1.5Euro 2.7 (0.9) – 0.6 2.4Other (7.8) (1.2) 0.9 1.1 (7.0)
At 31 December 2003 (3.5) (1.7) 0.7 12.7 8.2
(iv) Interest rate swap hedgingDeferred income of £27.8m in respect of interest rate swaps closed out in prior years was brought forward from 2003 and cash of £0.1m was paid (2003: £5.3m received) for swaps closed out during the year. Of the resulting aggregate deferred income of £27.7m,£5.4m (2003: £5.0m) was recognised in the profit and loss account as a reduction in interest payable, leaving a balance of £22.3m ofdeferred income as at 31 December 2004 (2003: £27.8m). £4.1m is included in other creditors falling due within one year and £18.2m is included in other creditors falling due after more than one year.
(v) Unrecognised gains and losses on interest rate hedgesTotal unrecognised gains at the end of the year were £22.3m (2003: £28.6m). This primarily relates to the £22.3m (2003: £27.8m) ofdeferred income referred to in note (iv) above. In accordance with UK GAAP, changes in the fair value of instruments used as hedges are not recognised in the Group accounts until the hedged position matures.
2004 2003(vi) Maturity of financial liabilities £m £m
On demand, or in one year or less 28.2 95.0Between one and two years 40.9 14.6Between two and five years 116.7 103.5In five years or more 170.6 205.3Capitalised costs (2.1) (3.1)
At 31 December 354.3 415.3
(vii) Borrowing facilitiesOf the total borrowing facilities available to the Group, the undrawn committed facilities available at 31 December 2004 were as follows:
2004 2003£m £m
Expiring in more than one year but not more than two years 108.0 80.0Expiring in more than two years but not more than five years – 108.0
At 31 December 108.0 188.0
Taking account of the new facility, together with the Group’s existing senior loan notes, total committed borrowing facilities available tothe Group now amount to £496.7m.
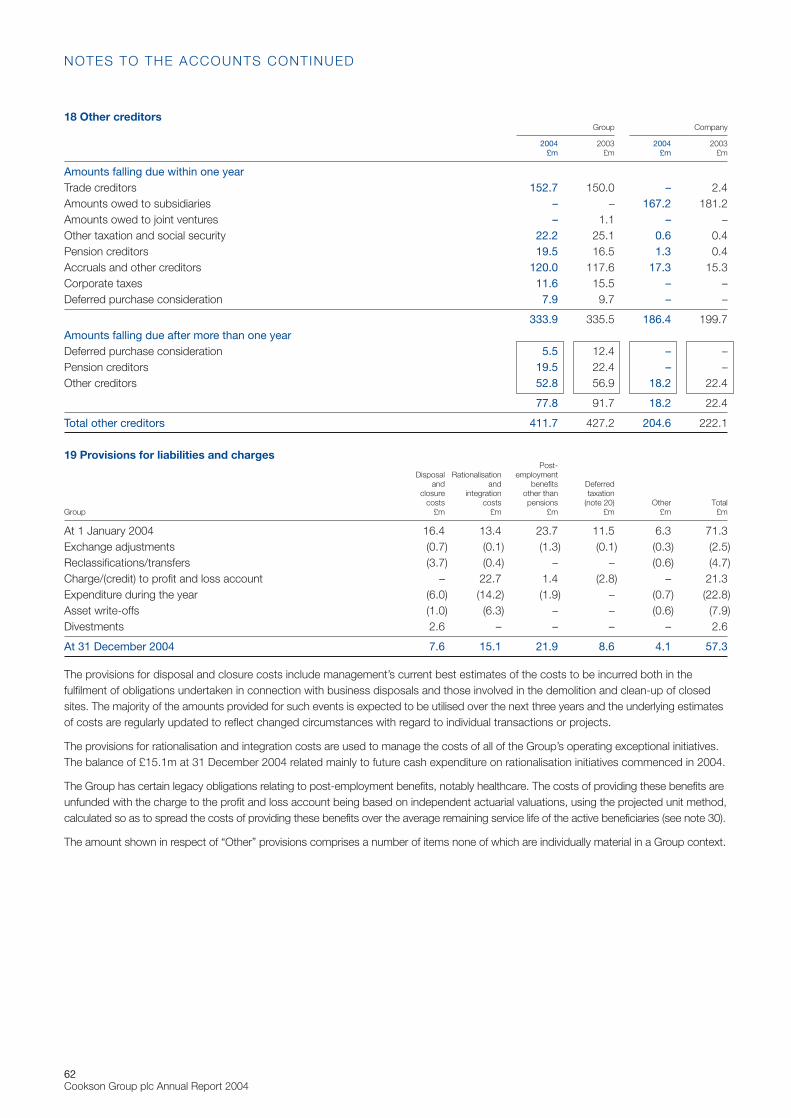
62Cookson Group plc Annual Report 2004
18 Other creditorsGroup Company
2004 2003 2004 2003£m £m £m £m
Amounts falling due within one yearTrade creditors 152.7 150.0 – 2.4Amounts owed to subsidiaries – – 167.2 181.2Amounts owed to joint ventures – 1.1 – –Other taxation and social security 22.2 25.1 0.6 0.4Pension creditors 19.5 16.5 1.3 0.4Accruals and other creditors 120.0 117.6 17.3 15.3Corporate taxes 11.6 15.5 – –Deferred purchase consideration 7.9 9.7 – –
333.9 335.5 186.4 199.7Amounts falling due after more than one yearDeferred purchase consideration 5.5 12.4 – –Pension creditors 19.5 22.4 – –Other creditors 52.8 56.9 18.2 22.4
77.8 91.7 18.2 22.4
Total other creditors 411.7 427.2 204.6 222.1
19 Provisions for liabilities and chargesPost-
Disposal Rationalisation employmentand and benefits Deferred
closure integration other than taxationcosts costs pensions (note 20) Other Total
Group £m £m £m £m £m £m
At 1 January 2004 16.4 13.4 23.7 11.5 6.3 71.3Exchange adjustments (0.7) (0.1) (1.3) (0.1) (0.3) (2.5)Reclassifications/transfers (3.7) (0.4) – – (0.6) (4.7)Charge/(credit) to profit and loss account – 22.7 1.4 (2.8) – 21.3Expenditure during the year (6.0) (14.2) (1.9) – (0.7) (22.8)Asset write-offs (1.0) (6.3) – – (0.6) (7.9)Divestments 2.6 – – – – 2.6
At 31 December 2004 7.6 15.1 21.9 8.6 4.1 57.3
The provisions for disposal and closure costs include management’s current best estimates of the costs to be incurred both in thefulfilment of obligations undertaken in connection with business disposals and those involved in the demolition and clean-up of closedsites. The majority of the amounts provided for such events is expected to be utilised over the next three years and the underlying estimatesof costs are regularly updated to reflect changed circumstances with regard to individual transactions or projects.
The provisions for rationalisation and integration costs are used to manage the costs of all of the Group’s operating exceptional initiatives.The balance of £15.1m at 31 December 2004 related mainly to future cash expenditure on rationalisation initiatives commenced in 2004.
The Group has certain legacy obligations relating to post-employment benefits, notably healthcare. The costs of providing these benefits areunfunded with the charge to the profit and loss account being based on independent actuarial valuations, using the projected unit method,calculated so as to spread the costs of providing these benefits over the average remaining service life of the active beneficiaries (see note 30).
The amount shown in respect of “Other” provisions comprises a number of items none of which are individually material in a Group context.
NOTES TO THE ACCOUNTS CONTINUED
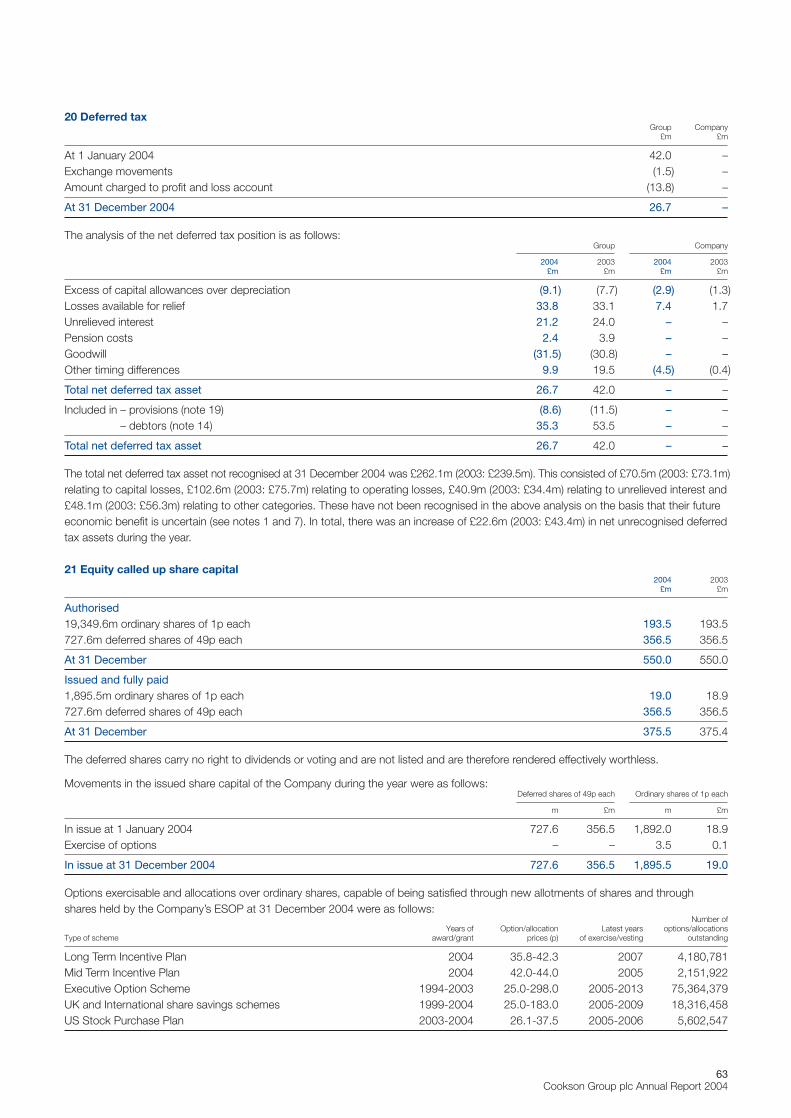
63Cookson Group plc Annual Report 2004
20 Deferred taxGroup Company
£m £m
At 1 January 2004 42.0 –Exchange movements (1.5) –Amount charged to profit and loss account (13.8) –
At 31 December 2004 26.7 –
The analysis of the net deferred tax position is as follows:Group Company
2004 2003 2004 2003£m £m £m £m
Excess of capital allowances over depreciation (9.1) (7.7) (2.9) (1.3)Losses available for relief 33.8 33.1 7.4 1.7Unrelieved interest 21.2 24.0 – –Pension costs 2.4 3.9 – –Goodwill (31.5) (30.8) – –Other timing differences 9.9 19.5 (4.5) (0.4)
Total net deferred tax asset 26.7 42.0 – –
Included in – provisions (note 19) (8.6) (11.5) – –– debtors (note 14) 35.3 53.5 – –
Total net deferred tax asset 26.7 42.0 – –
The total net deferred tax asset not recognised at 31 December 2004 was £262.1m (2003: £239.5m). This consisted of £70.5m (2003: £73.1m)relating to capital losses, £102.6m (2003: £75.7m) relating to operating losses, £40.9m (2003: £34.4m) relating to unrelieved interest and£48.1m (2003: £56.3m) relating to other categories. These have not been recognised in the above analysis on the basis that their futureeconomic benefit is uncertain (see notes 1 and 7). In total, there was an increase of £22.6m (2003: £43.4m) in net unrecognised deferredtax assets during the year.
21 Equity called up share capital2004 2003
£m £m
Authorised19,349.6m ordinary shares of 1p each 193.5 193.5727.6m deferred shares of 49p each 356.5 356.5
At 31 December 550.0 550.0
Issued and fully paid1,895.5m ordinary shares of 1p each 19.0 18.9727.6m deferred shares of 49p each 356.5 356.5
At 31 December 375.5 375.4
The deferred shares carry no right to dividends or voting and are not listed and are therefore rendered effectively worthless.
Movements in the issued share capital of the Company during the year were as follows:Deferred shares of 49p each Ordinary shares of 1p each
m £m m £m
In issue at 1 January 2004 727.6 356.5 1,892.0 18.9Exercise of options – – 3.5 0.1
In issue at 31 December 2004 727.6 356.5 1,895.5 19.0
Options exercisable and allocations over ordinary shares, capable of being satisfied through new allotments of shares and throughshares held by the Company’s ESOP at 31 December 2004 were as follows:
Number of Years of Option/allocation Latest years options/allocations
Type of scheme award/grant prices (p) of exercise/vesting outstanding
Long Term Incentive Plan 2004 35.8-42.3 2007 4,180,781Mid Term Incentive Plan 2004 42.0-44.0 2005 2,151,922Executive Option Scheme 1994-2003 25.0-298.0 2005-2013 75,364,379UK and International share savings schemes 1999-2004 25.0-183.0 2005-2009 18,316,458US Stock Purchase Plan 2003-2004 26.1-37.5 2005-2006 5,602,547
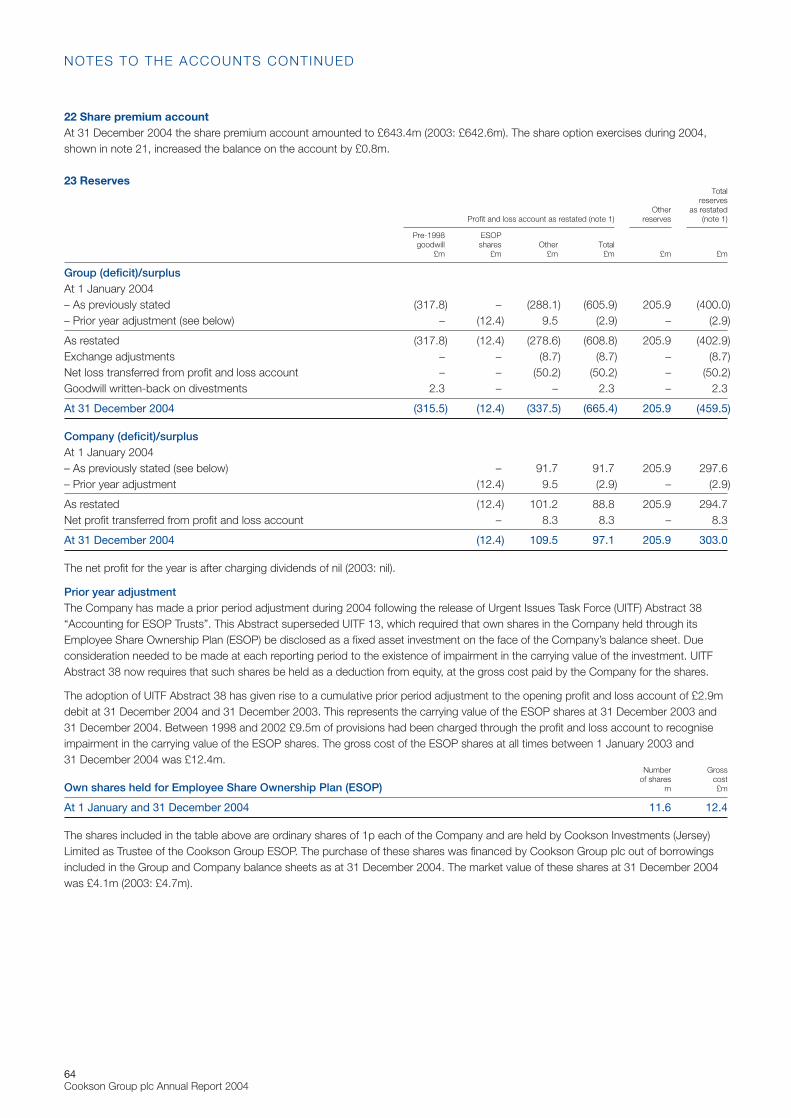
64Cookson Group plc Annual Report 2004
22 Share premium accountAt 31 December 2004 the share premium account amounted to £643.4m (2003: £642.6m). The share option exercises during 2004,shown in note 21, increased the balance on the account by £0.8m.
23 ReservesTotal
reservesOther as restated
Profit and loss account as restated (note 1) reserves (note 1)
Pre-1998 ESOPgoodwill shares Other Total
£m £m £m £m £m £m
Group (deficit)/surplusAt 1 January 2004– As previously stated (317.8) – (288.1) (605.9) 205.9 (400.0)– Prior year adjustment (see below) – (12.4) 9.5 (2.9) – (2.9)
As restated (317.8) (12.4) (278.6) (608.8) 205.9 (402.9)Exchange adjustments – – (8.7) (8.7) – (8.7)Net loss transferred from profit and loss account – – (50.2) (50.2) – (50.2)Goodwill written-back on divestments 2.3 – – 2.3 – 2.3
At 31 December 2004 (315.5) (12.4) (337.5) (665.4) 205.9 (459.5)
Company (deficit)/surplusAt 1 January 2004– As previously stated (see below) – 91.7 91.7 205.9 297.6– Prior year adjustment (12.4) 9.5 (2.9) – (2.9)
As restated (12.4) 101.2 88.8 205.9 294.7Net profit transferred from profit and loss account – 8.3 8.3 – 8.3
At 31 December 2004 (12.4) 109.5 97.1 205.9 303.0
The net profit for the year is after charging dividends of nil (2003: nil).
Prior year adjustmentThe Company has made a prior period adjustment during 2004 following the release of Urgent Issues Task Force (UITF) Abstract 38“Accounting for ESOP Trusts”. This Abstract superseded UITF 13, which required that own shares in the Company held through itsEmployee Share Ownership Plan (ESOP) be disclosed as a fixed asset investment on the face of the Company’s balance sheet. Dueconsideration needed to be made at each reporting period to the existence of impairment in the carrying value of the investment. UITFAbstract 38 now requires that such shares be held as a deduction from equity, at the gross cost paid by the Company for the shares.
The adoption of UITF Abstract 38 has given rise to a cumulative prior period adjustment to the opening profit and loss account of £2.9mdebit at 31 December 2004 and 31 December 2003. This represents the carrying value of the ESOP shares at 31 December 2003 and31 December 2004. Between 1998 and 2002 £9.5m of provisions had been charged through the profit and loss account to recogniseimpairment in the carrying value of the ESOP shares. The gross cost of the ESOP shares at all times between 1 January 2003 and31 December 2004 was £12.4m.
Number Grossof shares cost
Own shares held for Employee Share Ownership Plan (ESOP) m £m
At 1 January and 31 December 2004 11.6 12.4
The shares included in the table above are ordinary shares of 1p each of the Company and are held by Cookson Investments (Jersey)Limited as Trustee of the Cookson Group ESOP. The purchase of these shares was financed by Cookson Group plc out of borrowingsincluded in the Group and Company balance sheets as at 31 December 2004. The market value of these shares at 31 December 2004was £4.1m (2003: £4.7m).
NOTES TO THE ACCOUNTS CONTINUED
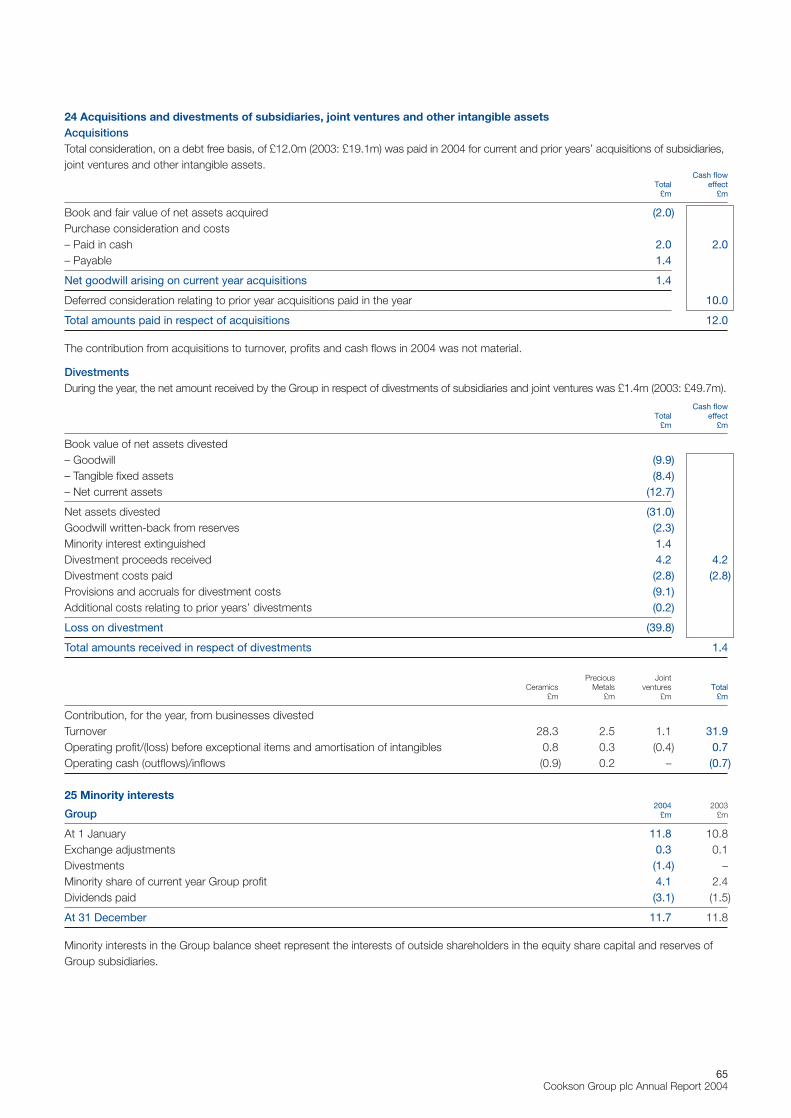
65Cookson Group plc Annual Report 2004
24 Acquisitions and divestments of subsidiaries, joint ventures and other intangible assetsAcquisitionsTotal consideration, on a debt free basis, of £12.0m (2003: £19.1m) was paid in 2004 for current and prior years’ acquisitions of subsidiaries,joint ventures and other intangible assets.
Cash flowTotal effect
£m £m
Book and fair value of net assets acquired (2.0)Purchase consideration and costs– Paid in cash 2.0 2.0– Payable 1.4
Net goodwill arising on current year acquisitions 1.4
Deferred consideration relating to prior year acquisitions paid in the year 10.0
Total amounts paid in respect of acquisitions 12.0
The contribution from acquisitions to turnover, profits and cash flows in 2004 was not material.
DivestmentsDuring the year, the net amount received by the Group in respect of divestments of subsidiaries and joint ventures was £1.4m (2003: £49.7m).
Cash flowTotal effect
£m £m
Book value of net assets divested– Goodwill (9.9)– Tangible fixed assets (8.4)– Net current assets (12.7)
Net assets divested (31.0)Goodwill written-back from reserves (2.3)Minority interest extinguished 1.4Divestment proceeds received 4.2 4.2Divestment costs paid (2.8) (2.8)Provisions and accruals for divestment costs (9.1)Additional costs relating to prior years’ divestments (0.2)
Loss on divestment (39.8)
Total amounts received in respect of divestments 1.4
Precious JointCeramics Metals ventures Total
£m £m £m £m
Contribution, for the year, from businesses divestedTurnover 28.3 2.5 1.1 31.9Operating profit/(loss) before exceptional items and amortisation of intangibles 0.8 0.3 (0.4) 0.7Operating cash (outflows)/inflows (0.9) 0.2 – (0.7)
25 Minority interests2004 2003
Group £m £m
At 1 January 11.8 10.8Exchange adjustments 0.3 0.1Divestments (1.4) –Minority share of current year Group profit 4.1 2.4Dividends paid (3.1) (1.5)
At 31 December 11.7 11.8
Minority interests in the Group balance sheet represent the interests of outside shareholders in the equity share capital and reserves ofGroup subsidiaries.
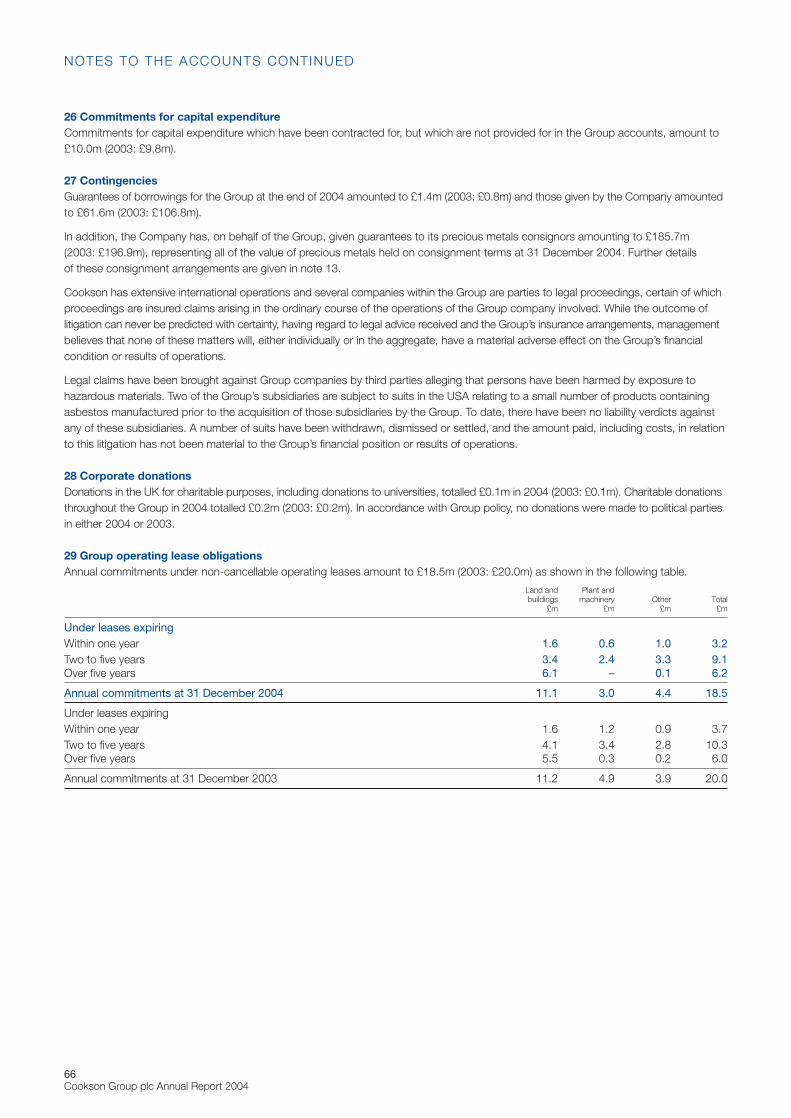
66Cookson Group plc Annual Report 2004
26 Commitments for capital expenditureCommitments for capital expenditure which have been contracted for, but which are not provided for in the Group accounts, amount to£10.0m (2003: £9.8m).
27 ContingenciesGuarantees of borrowings for the Group at the end of 2004 amounted to £1.4m (2003: £0.8m) and those given by the Company amountedto £61.6m (2003: £106.8m).
In addition, the Company has, on behalf of the Group, given guarantees to its precious metals consignors amounting to £185.7m (2003: £196.9m), representing all of the value of precious metals held on consignment terms at 31 December 2004. Further details of these consignment arrangements are given in note 13.
Cookson has extensive international operations and several companies within the Group are parties to legal proceedings, certain of whichproceedings are insured claims arising in the ordinary course of the operations of the Group company involved. While the outcome oflitigation can never be predicted with certainty, having regard to legal advice received and the Group’s insurance arrangements, managementbelieves that none of these matters will, either individually or in the aggregate, have a material adverse effect on the Group’s financialcondition or results of operations.
Legal claims have been brought against Group companies by third parties alleging that persons have been harmed by exposure tohazardous materials. Two of the Group’s subsidiaries are subject to suits in the USA relating to a small number of products containingasbestos manufactured prior to the acquisition of those subsidiaries by the Group. To date, there have been no liability verdicts againstany of these subsidiaries. A number of suits have been withdrawn, dismissed or settled, and the amount paid, including costs, in relationto this litigation has not been material to the Group’s financial position or results of operations.
28 Corporate donationsDonations in the UK for charitable purposes, including donations to universities, totalled £0.1m in 2004 (2003: £0.1m). Charitable donationsthroughout the Group in 2004 totalled £0.2m (2003: £0.2m). In accordance with Group policy, no donations were made to political partiesin either 2004 or 2003.
29 Group operating lease obligationsAnnual commitments under non-cancellable operating leases amount to £18.5m (2003: £20.0m) as shown in the following table.
Land and Plant andbuildings machinery Other Total
£m £m £m £m
Under leases expiringWithin one year 1.6 0.6 1.0 3.2Two to five years 3.4 2.4 3.3 9.1Over five years 6.1 – 0.1 6.2
Annual commitments at 31 December 2004 11.1 3.0 4.4 18.5
Under leases expiringWithin one year 1.6 1.2 0.9 3.7Two to five years 4.1 3.4 2.8 10.3Over five years 5.5 0.3 0.2 6.0
Annual commitments at 31 December 2003 11.2 4.9 3.9 20.0
NOTES TO THE ACCOUNTS CONTINUED
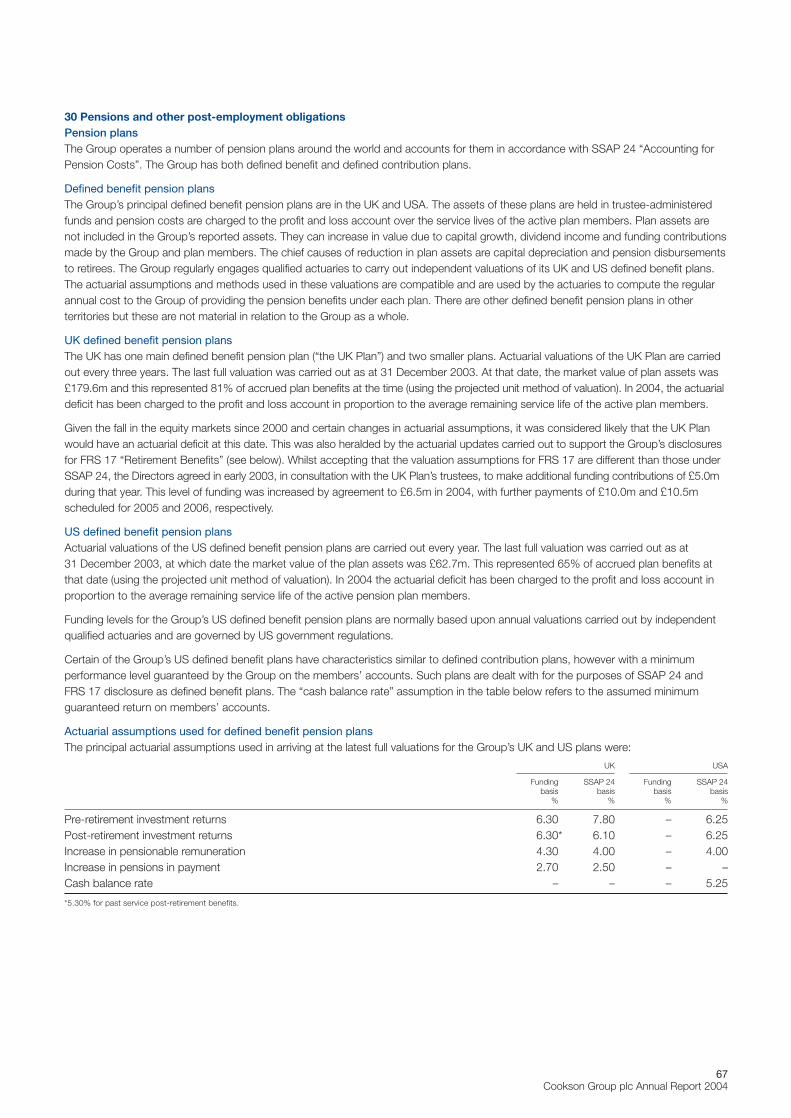
67Cookson Group plc Annual Report 2004
30 Pensions and other post-employment obligationsPension plansThe Group operates a number of pension plans around the world and accounts for them in accordance with SSAP 24 “Accounting forPension Costs”. The Group has both defined benefit and defined contribution plans.
Defined benefit pension plansThe Group’s principal defined benefit pension plans are in the UK and USA. The assets of these plans are held in trustee-administeredfunds and pension costs are charged to the profit and loss account over the service lives of the active plan members. Plan assets arenot included in the Group’s reported assets. They can increase in value due to capital growth, dividend income and funding contributionsmade by the Group and plan members. The chief causes of reduction in plan assets are capital depreciation and pension disbursementsto retirees. The Group regularly engages qualified actuaries to carry out independent valuations of its UK and US defined benefit plans.The actuarial assumptions and methods used in these valuations are compatible and are used by the actuaries to compute the regularannual cost to the Group of providing the pension benefits under each plan. There are other defined benefit pension plans in otherterritories but these are not material in relation to the Group as a whole.
UK defined benefit pension plansThe UK has one main defined benefit pension plan (“the UK Plan”) and two smaller plans. Actuarial valuations of the UK Plan are carriedout every three years. The last full valuation was carried out as at 31 December 2003. At that date, the market value of plan assets was£179.6m and this represented 81% of accrued plan benefits at the time (using the projected unit method of valuation). In 2004, the actuarialdeficit has been charged to the profit and loss account in proportion to the average remaining service life of the active plan members.
Given the fall in the equity markets since 2000 and certain changes in actuarial assumptions, it was considered likely that the UK Planwould have an actuarial deficit at this date. This was also heralded by the actuarial updates carried out to support the Group’s disclosuresfor FRS 17 “Retirement Benefits” (see below). Whilst accepting that the valuation assumptions for FRS 17 are different than those underSSAP 24, the Directors agreed in early 2003, in consultation with the UK Plan’s trustees, to make additional funding contributions of £5.0mduring that year. This level of funding was increased by agreement to £6.5m in 2004, with further payments of £10.0m and £10.5mscheduled for 2005 and 2006, respectively.
US defined benefit pension plansActuarial valuations of the US defined benefit pension plans are carried out every year. The last full valuation was carried out as at31 December 2003, at which date the market value of the plan assets was £62.7m. This represented 65% of accrued plan benefits atthat date (using the projected unit method of valuation). In 2004 the actuarial deficit has been charged to the profit and loss account inproportion to the average remaining service life of the active pension plan members.
Funding levels for the Group’s US defined benefit pension plans are normally based upon annual valuations carried out by independentqualified actuaries and are governed by US government regulations.
Certain of the Group’s US defined benefit plans have characteristics similar to defined contribution plans, however with a minimumperformance level guaranteed by the Group on the members’ accounts. Such plans are dealt with for the purposes of SSAP 24 andFRS 17 disclosure as defined benefit plans. The “cash balance rate” assumption in the table below refers to the assumed minimumguaranteed return on members’ accounts.
Actuarial assumptions used for defined benefit pension plansThe principal actuarial assumptions used in arriving at the latest full valuations for the Group’s UK and US plans were:
UK USA
Funding SSAP 24 Funding SSAP 24basis basis basis basis
% % % %
Pre-retirement investment returns 6.30 7.80 – 6.25Post-retirement investment returns 6.30* 6.10 – 6.25Increase in pensionable remuneration 4.30 4.00 – 4.00Increase in pensions in payment 2.70 2.50 – –Cash balance rate – – – 5.25
*5.30% for past service post-retirement benefits.
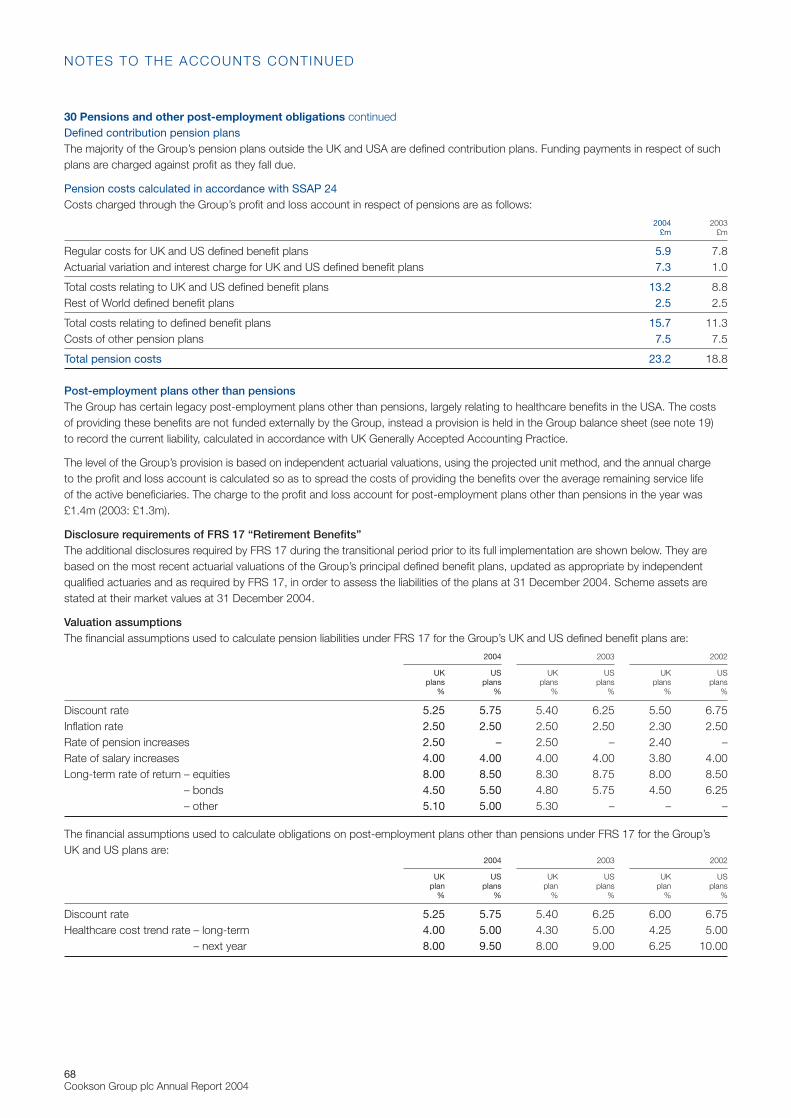
68Cookson Group plc Annual Report 2004
30 Pensions and other post-employment obligations continuedDefined contribution pension plansThe majority of the Group’s pension plans outside the UK and USA are defined contribution plans. Funding payments in respect of suchplans are charged against profit as they fall due.
Pension costs calculated in accordance with SSAP 24Costs charged through the Group’s profit and loss account in respect of pensions are as follows:
2004 2003£m £m
Regular costs for UK and US defined benefit plans 5.9 7.8Actuarial variation and interest charge for UK and US defined benefit plans 7.3 1.0
Total costs relating to UK and US defined benefit plans 13.2 8.8Rest of World defined benefit plans 2.5 2.5
Total costs relating to defined benefit plans 15.7 11.3Costs of other pension plans 7.5 7.5
Total pension costs 23.2 18.8
Post-employment plans other than pensionsThe Group has certain legacy post-employment plans other than pensions, largely relating to healthcare benefits in the USA. The costsof providing these benefits are not funded externally by the Group, instead a provision is held in the Group balance sheet (see note 19) to record the current liability, calculated in accordance with UK Generally Accepted Accounting Practice.
The level of the Group’s provision is based on independent actuarial valuations, using the projected unit method, and the annual charge to the profit and loss account is calculated so as to spread the costs of providing the benefits over the average remaining service life of the active beneficiaries. The charge to the profit and loss account for post-employment plans other than pensions in the year was£1.4m (2003: £1.3m).
Disclosure requirements of FRS 17 “Retirement Benefits”The additional disclosures required by FRS 17 during the transitional period prior to its full implementation are shown below. They arebased on the most recent actuarial valuations of the Group’s principal defined benefit plans, updated as appropriate by independentqualified actuaries and as required by FRS 17, in order to assess the liabilities of the plans at 31 December 2004. Scheme assets arestated at their market values at 31 December 2004.
Valuation assumptionsThe financial assumptions used to calculate pension liabilities under FRS 17 for the Group’s UK and US defined benefit plans are:
2004 2003 2002
UK US UK US UK USplans plans plans plans plans plans
% % % % % %
Discount rate 5.25 5.75 5.40 6.25 5.50 6.75Inflation rate 2.50 2.50 2.50 2.50 2.30 2.50Rate of pension increases 2.50 – 2.50 – 2.40 –Rate of salary increases 4.00 4.00 4.00 4.00 3.80 4.00Long-term rate of return – equities 8.00 8.50 8.30 8.75 8.00 8.50
– bonds 4.50 5.50 4.80 5.75 4.50 6.25– other 5.10 5.00 5.30 – – –
The financial assumptions used to calculate obligations on post-employment plans other than pensions under FRS 17 for the Group’sUK and US plans are:
2004 2003 2002
UK US UK US UK USplan plans plan plans plan plans
% % % % % %
Discount rate 5.25 5.75 5.40 6.25 6.00 6.75Healthcare cost trend rate – long-term 4.00 5.00 4.30 5.00 4.25 5.00
– next year 8.00 9.50 8.00 9.00 6.25 10.00
NOTES TO THE ACCOUNTS CONTINUED
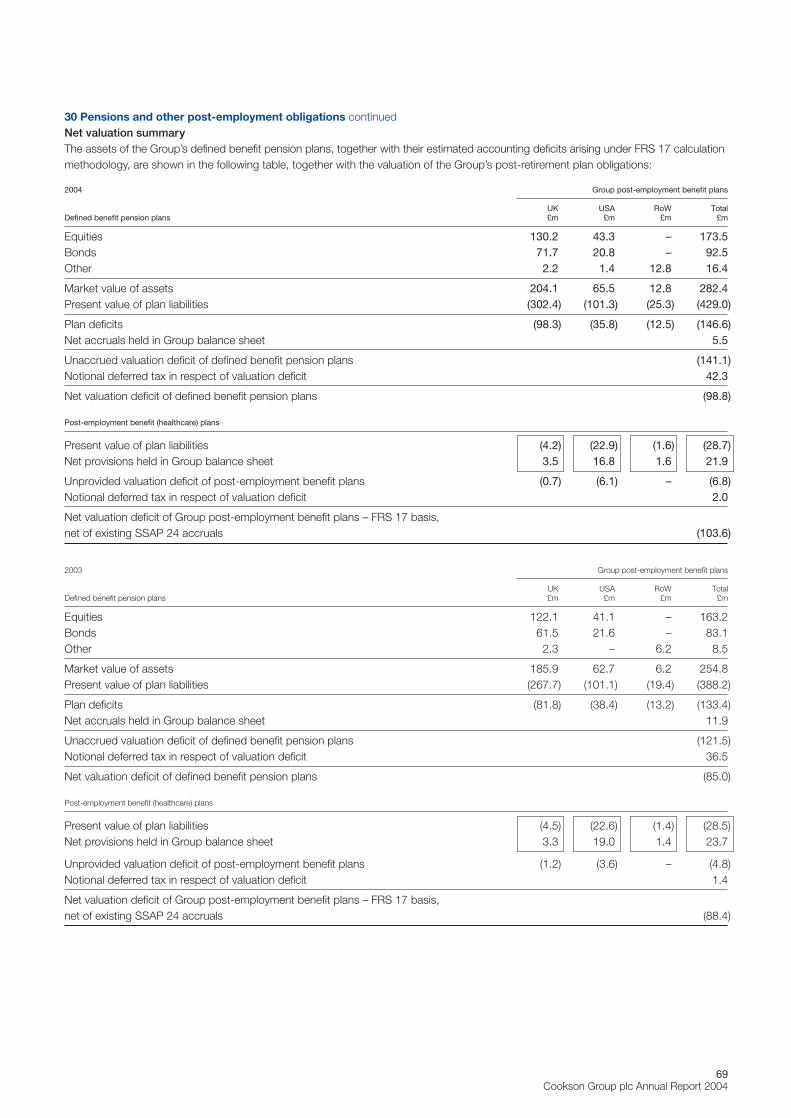
69Cookson Group plc Annual Report 2004
30 Pensions and other post-employment obligations continuedNet valuation summaryThe assets of the Group’s defined benefit pension plans, together with their estimated accounting deficits arising under FRS 17 calculationmethodology, are shown in the following table, together with the valuation of the Group’s post-retirement plan obligations:
2004 Group post-employment benefit plans
UK USA RoW TotalDefined benefit pension plans £m £m £m £m
Equities 130.2 43.3 – 173.5Bonds 71.7 20.8 – 92.5Other 2.2 1.4 12.8 16.4
Market value of assets 204.1 65.5 12.8 282.4Present value of plan liabilities (302.4) (101.3) (25.3) (429.0)
Plan deficits (98.3) (35.8) (12.5) (146.6)Net accruals held in Group balance sheet 5.5
Unaccrued valuation deficit of defined benefit pension plans (141.1)Notional deferred tax in respect of valuation deficit 42.3
Net valuation deficit of defined benefit pension plans (98.8)
Post-employment benefit (healthcare) plans
Present value of plan liabilities (4.2) (22.9) (1.6) (28.7)Net provisions held in Group balance sheet 3.5 16.8 1.6 21.9
Unprovided valuation deficit of post-employment benefit plans (0.7) (6.1) – (6.8)Notional deferred tax in respect of valuation deficit 2.0
Net valuation deficit of Group post-employment benefit plans – FRS 17 basis, net of existing SSAP 24 accruals (103.6)
2003 Group post-employment benefit plans
UK USA RoW TotalDefined benefit pension plans £m £m £m £m
Equities 122.1 41.1 – 163.2Bonds 61.5 21.6 – 83.1Other 2.3 – 6.2 8.5
Market value of assets 185.9 62.7 6.2 254.8Present value of plan liabilities (267.7) (101.1) (19.4) (388.2)
Plan deficits (81.8) (38.4) (13.2) (133.4)Net accruals held in Group balance sheet 11.9
Unaccrued valuation deficit of defined benefit pension plans (121.5)Notional deferred tax in respect of valuation deficit 36.5
Net valuation deficit of defined benefit pension plans (85.0)
Post-employment benefit (healthcare) plans
Present value of plan liabilities (4.5) (22.6) (1.4) (28.5)Net provisions held in Group balance sheet 3.3 19.0 1.4 23.7
Unprovided valuation deficit of post-employment benefit plans (1.2) (3.6) – (4.8)Notional deferred tax in respect of valuation deficit 1.4
Net valuation deficit of Group post-employment benefit plans – FRS 17 basis, net of existing SSAP 24 accruals (88.4)
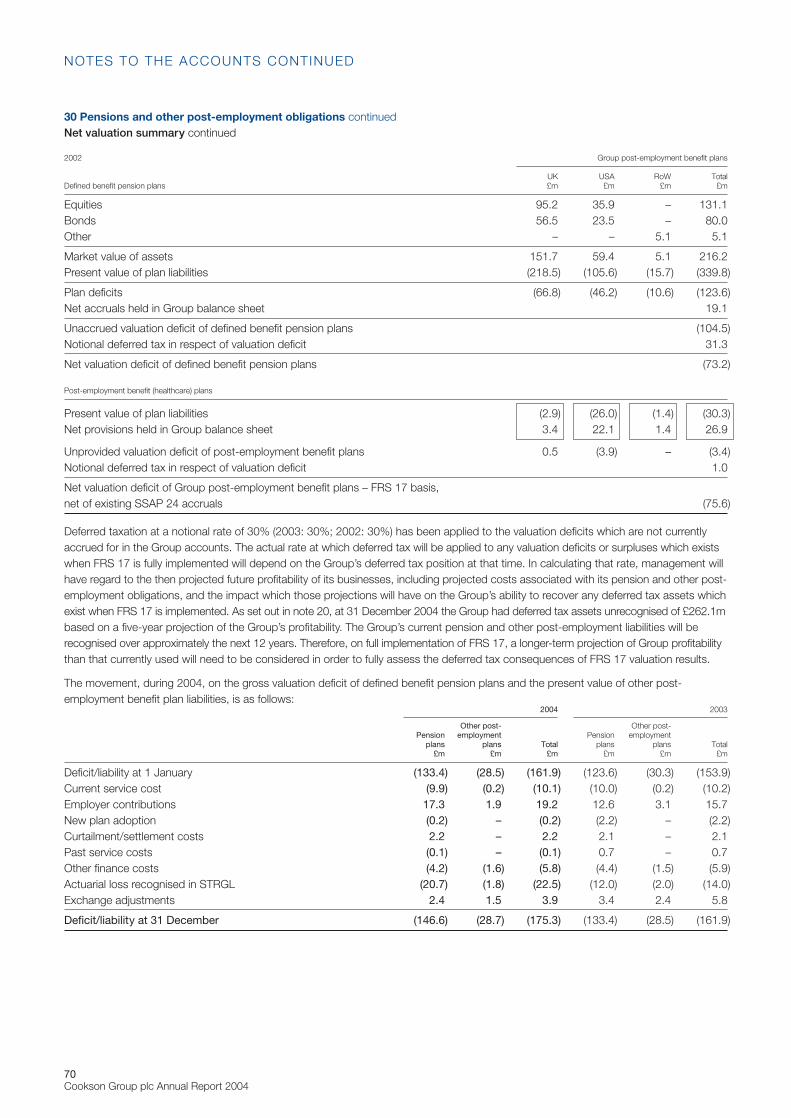
70Cookson Group plc Annual Report 2004
30 Pensions and other post-employment obligations continuedNet valuation summary continued
2002 Group post-employment benefit plans
UK USA RoW TotalDefined benefit pension plans £m £m £m £m
Equities 95.2 35.9 – 131.1Bonds 56.5 23.5 – 80.0Other – – 5.1 5.1
Market value of assets 151.7 59.4 5.1 216.2Present value of plan liabilities (218.5) (105.6) (15.7) (339.8)
Plan deficits (66.8) (46.2) (10.6) (123.6)Net accruals held in Group balance sheet 19.1
Unaccrued valuation deficit of defined benefit pension plans (104.5)Notional deferred tax in respect of valuation deficit 31.3
Net valuation deficit of defined benefit pension plans (73.2)
Post-employment benefit (healthcare) plans
Present value of plan liabilities (2.9) (26.0) (1.4) (30.3)Net provisions held in Group balance sheet 3.4 22.1 1.4 26.9
Unprovided valuation deficit of post-employment benefit plans 0.5 (3.9) – (3.4)Notional deferred tax in respect of valuation deficit 1.0
Net valuation deficit of Group post-employment benefit plans – FRS 17 basis, net of existing SSAP 24 accruals (75.6)
Deferred taxation at a notional rate of 30% (2003: 30%; 2002: 30%) has been applied to the valuation deficits which are not currentlyaccrued for in the Group accounts. The actual rate at which deferred tax will be applied to any valuation deficits or surpluses which existswhen FRS 17 is fully implemented will depend on the Group’s deferred tax position at that time. In calculating that rate, management willhave regard to the then projected future profitability of its businesses, including projected costs associated with its pension and other post-employment obligations, and the impact which those projections will have on the Group’s ability to recover any deferred tax assets whichexist when FRS 17 is implemented. As set out in note 20, at 31 December 2004 the Group had deferred tax assets unrecognised of £262.1mbased on a five-year projection of the Group’s profitability. The Group’s current pension and other post-employment liabilities will berecognised over approximately the next 12 years. Therefore, on full implementation of FRS 17, a longer-term projection of Group profitabilitythan that currently used will need to be considered in order to fully assess the deferred tax consequences of FRS 17 valuation results.
The movement, during 2004, on the gross valuation deficit of defined benefit pension plans and the present value of other post-employment benefit plan liabilities, is as follows:
2004 2003
Other post- Other post-Pension employment Pension employment
plans plans Total plans plans Total£m £m £m £m £m £m
Deficit/liability at 1 January (133.4) (28.5) (161.9) (123.6) (30.3) (153.9)Current service cost (9.9) (0.2) (10.1) (10.0) (0.2) (10.2)Employer contributions 17.3 1.9 19.2 12.6 3.1 15.7New plan adoption (0.2) – (0.2) (2.2) – (2.2)Curtailment/settlement costs 2.2 – 2.2 2.1 – 2.1Past service costs (0.1) – (0.1) 0.7 – 0.7Other finance costs (4.2) (1.6) (5.8) (4.4) (1.5) (5.9)Actuarial loss recognised in STRGL (20.7) (1.8) (22.5) (12.0) (2.0) (14.0)Exchange adjustments 2.4 1.5 3.9 3.4 2.4 5.8
Deficit/liability at 31 December (146.6) (28.7) (175.3) (133.4) (28.5) (161.9)
NOTES TO THE ACCOUNTS CONTINUED
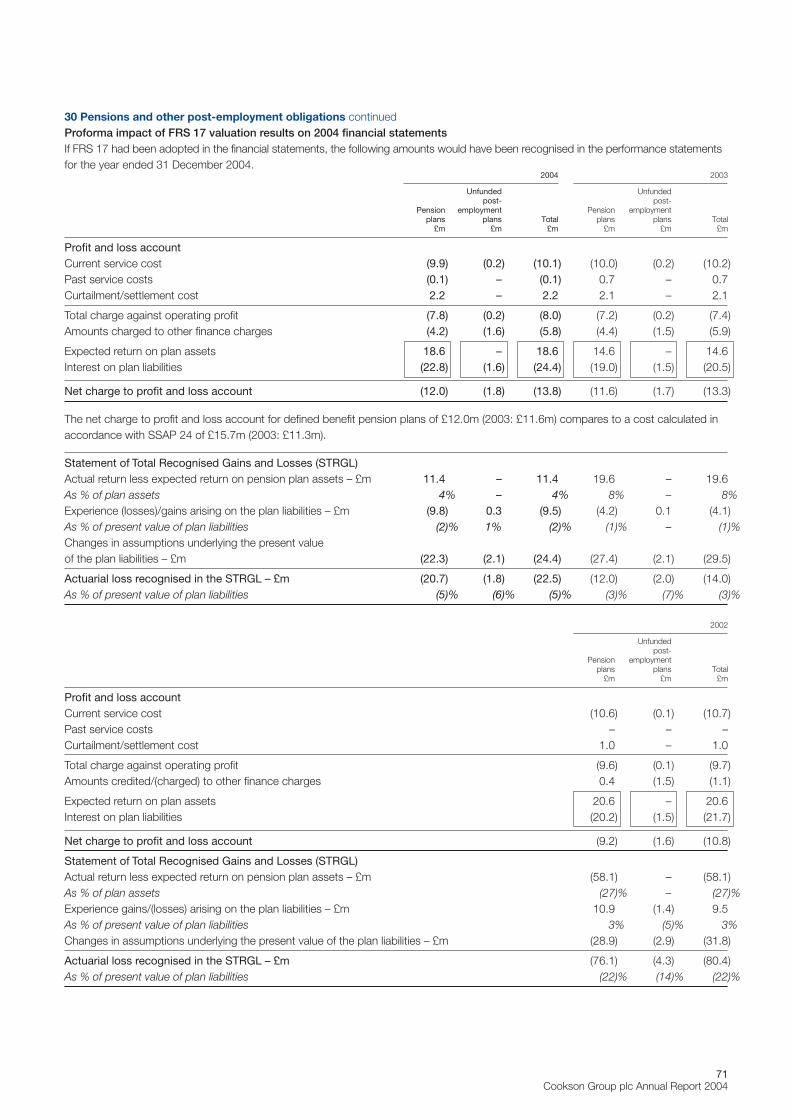
71Cookson Group plc Annual Report 2004
30 Pensions and other post-employment obligations continuedProforma impact of FRS 17 valuation results on 2004 financial statementsIf FRS 17 had been adopted in the financial statements, the following amounts would have been recognised in the performance statementsfor the year ended 31 December 2004.
2004 2003
Unfunded Unfundedpost- post-
Pension employment Pension employmentplans plans Total plans plans Total
£m £m £m £m £m £m
Profit and loss accountCurrent service cost (9.9) (0.2) (10.1) (10.0) (0.2) (10.2)Past service costs (0.1) – (0.1) 0.7 – 0.7Curtailment/settlement cost 2.2 – 2.2 2.1 – 2.1
Total charge against operating profit (7.8) (0.2) (8.0) (7.2) (0.2) (7.4)Amounts charged to other finance charges (4.2) (1.6) (5.8) (4.4) (1.5) (5.9)
Expected return on plan assets 18.6 – 18.6 14.6 – 14.6Interest on plan liabilities (22.8) (1.6) (24.4) (19.0) (1.5) (20.5)
Net charge to profit and loss account (12.0) (1.8) (13.8) (11.6) (1.7) (13.3)
The net charge to profit and loss account for defined benefit pension plans of £12.0m (2003: £11.6m) compares to a cost calculated inaccordance with SSAP 24 of £15.7m (2003: £11.3m).
Statement of Total Recognised Gains and Losses (STRGL)Actual return less expected return on pension plan assets – £m 11.4 – 11.4 19.6 – 19.6As % of plan assets 4% – 4% 8% – 8%Experience (losses)/gains arising on the plan liabilities – £m (9.8) 0.3 (9.5) (4.2) 0.1 (4.1)As % of present value of plan liabilities (2)% 1% (2)% (1)% – (1)%Changes in assumptions underlying the present value of the plan liabilities – £m (22.3) (2.1) (24.4) (27.4) (2.1) (29.5)
Actuarial loss recognised in the STRGL – £m (20.7) (1.8) (22.5) (12.0) (2.0) (14.0)As % of present value of plan liabilities (5)% (6)% (5)% (3)% (7)% (3)%
2002
Unfundedpost-
Pension employmentplans plans Total
£m £m £m
Profit and loss accountCurrent service cost (10.6) (0.1) (10.7)Past service costs – – –Curtailment/settlement cost 1.0 – 1.0
Total charge against operating profit (9.6) (0.1) (9.7)Amounts credited/(charged) to other finance charges 0.4 (1.5) (1.1)
Expected return on plan assets 20.6 – 20.6Interest on plan liabilities (20.2) (1.5) (21.7)
Net charge to profit and loss account (9.2) (1.6) (10.8)
Statement of Total Recognised Gains and Losses (STRGL)Actual return less expected return on pension plan assets – £m (58.1) – (58.1)As % of plan assets (27)% – (27)%Experience gains/(losses) arising on the plan liabilities – £m 10.9 (1.4) 9.5As % of present value of plan liabilities 3% (5)% 3%Changes in assumptions underlying the present value of the plan liabilities – £m (28.9) (2.9) (31.8)
Actuarial loss recognised in the STRGL – £m (76.1) (4.3) (80.4)As % of present value of plan liabilities (22)% (14)% (22)%
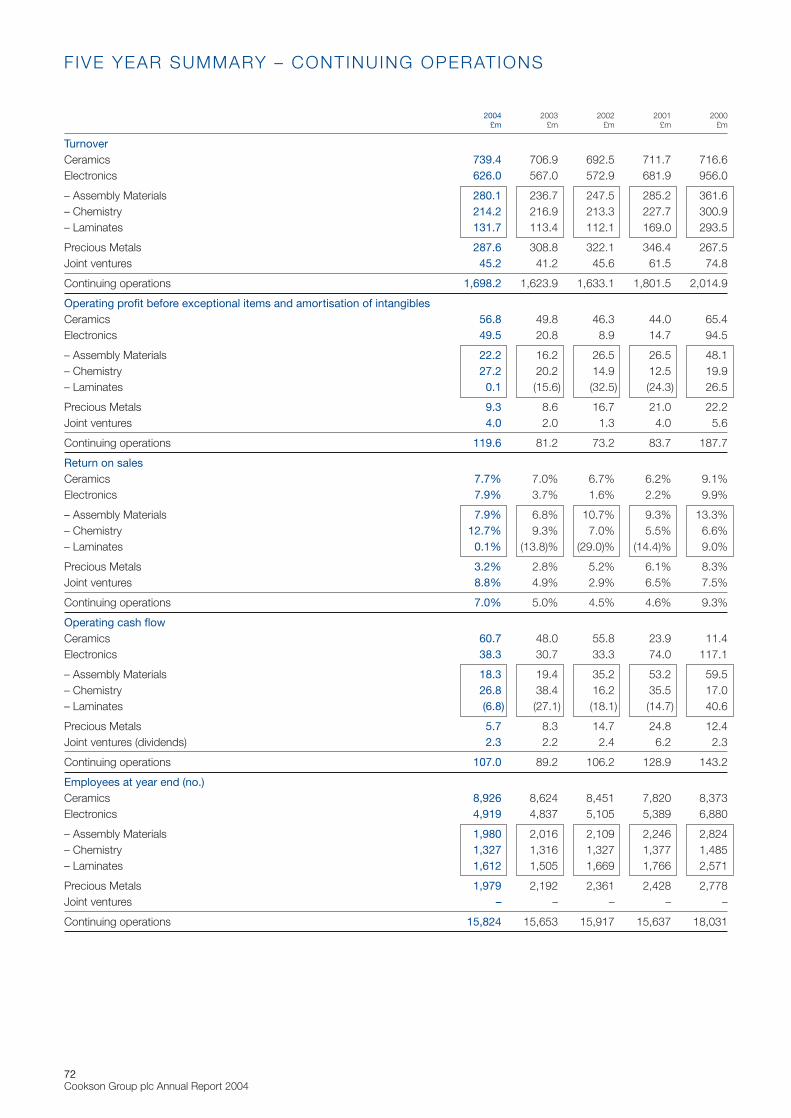
72Cookson Group plc Annual Report 2004
2004 2003 2002 2001 2000£m £m £m £m £m
TurnoverCeramics 739.4 706.9 692.5 711.7 716.6Electronics 626.0 567.0 572.9 681.9 956.0
– Assembly Materials 280.1 236.7 247.5 285.2 361.6– Chemistry 214.2 216.9 213.3 227.7 300.9– Laminates 131.7 113.4 112.1 169.0 293.5
Precious Metals 287.6 308.8 322.1 346.4 267.5Joint ventures 45.2 41.2 45.6 61.5 74.8
Continuing operations 1,698.2 1,623.9 1,633.1 1,801.5 2,014.9
Operating profit before exceptional items and amortisation of intangiblesCeramics 56.8 49.8 46.3 44.0 65.4Electronics 49.5 20.8 8.9 14.7 94.5
– Assembly Materials 22.2 16.2 26.5 26.5 48.1– Chemistry 27.2 20.2 14.9 12.5 19.9– Laminates 0.1 (15.6) (32.5) (24.3) 26.5
Precious Metals 9.3 8.6 16.7 21.0 22.2Joint ventures 4.0 2.0 1.3 4.0 5.6
Continuing operations 119.6 81.2 73.2 83.7 187.7
Return on salesCeramics 7.7% 7.0% 6.7% 6.2% 9.1%Electronics 7.9% 3.7% 1.6% 2.2% 9.9%
– Assembly Materials 7.9% 6.8% 10.7% 9.3% 13.3%– Chemistry 12.7% 9.3% 7.0% 5.5% 6.6%– Laminates 0.1% (13.8)% (29.0)% (14.4)% 9.0%
Precious Metals 3.2% 2.8% 5.2% 6.1% 8.3%Joint ventures 8.8% 4.9% 2.9% 6.5% 7.5%
Continuing operations 7.0% 5.0% 4.5% 4.6% 9.3%
Operating cash flowCeramics 60.7 48.0 55.8 23.9 11.4Electronics 38.3 30.7 33.3 74.0 117.1
– Assembly Materials 18.3 19.4 35.2 53.2 59.5– Chemistry 26.8 38.4 16.2 35.5 17.0– Laminates (6.8) (27.1) (18.1) (14.7) 40.6
Precious Metals 5.7 8.3 14.7 24.8 12.4Joint ventures (dividends) 2.3 2.2 2.4 6.2 2.3
Continuing operations 107.0 89.2 106.2 128.9 143.2
Employees at year end (no.)Ceramics 8,926 8,624 8,451 7,820 8,373Electronics 4,919 4,837 5,105 5,389 6,880
– Assembly Materials 1,980 2,016 2,109 2,246 2,824– Chemistry 1,327 1,316 1,327 1,377 1,485– Laminates 1,612 1,505 1,669 1,766 2,571
Precious Metals 1,979 2,192 2,361 2,428 2,778Joint ventures – – – – –
Continuing operations 15,824 15,653 15,917 15,637 18,031
F IVE YEAR SUMMARY – CONTINUING OPERATIONS
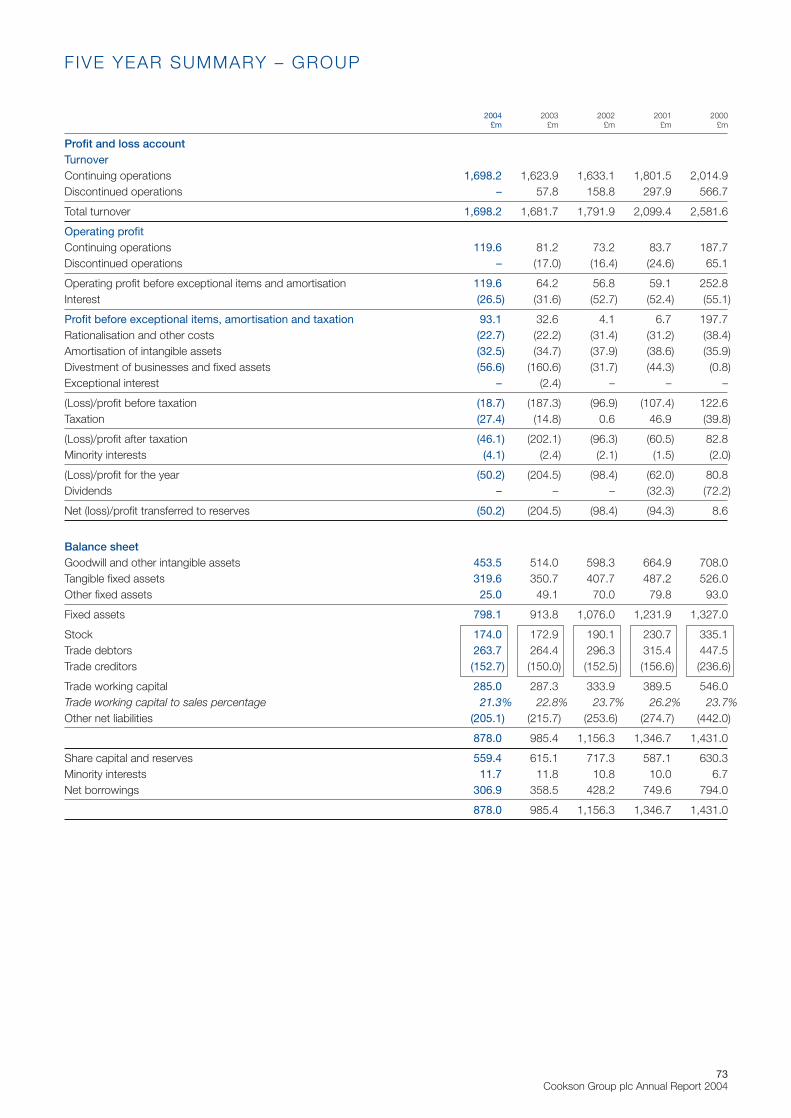
73Cookson Group plc Annual Report 2004
2004 2003 2002 2001 2000£m £m £m £m £m
Profit and loss accountTurnoverContinuing operations 1,698.2 1,623.9 1,633.1 1,801.5 2,014.9Discontinued operations – 57.8 158.8 297.9 566.7
Total turnover 1,698.2 1,681.7 1,791.9 2,099.4 2,581.6
Operating profitContinuing operations 119.6 81.2 73.2 83.7 187.7Discontinued operations – (17.0) (16.4) (24.6) 65.1
Operating profit before exceptional items and amortisation 119.6 64.2 56.8 59.1 252.8Interest (26.5) (31.6) (52.7) (52.4) (55.1)
Profit before exceptional items, amortisation and taxation 93.1 32.6 4.1 6.7 197.7Rationalisation and other costs (22.7) (22.2) (31.4) (31.2) (38.4)Amortisation of intangible assets (32.5) (34.7) (37.9) (38.6) (35.9)Divestment of businesses and fixed assets (56.6) (160.6) (31.7) (44.3) (0.8)Exceptional interest – (2.4) – – –
(Loss)/profit before taxation (18.7) (187.3) (96.9) (107.4) 122.6Taxation (27.4) (14.8) 0.6 46.9 (39.8)
(Loss)/profit after taxation (46.1) (202.1) (96.3) (60.5) 82.8Minority interests (4.1) (2.4) (2.1) (1.5) (2.0)
(Loss)/profit for the year (50.2) (204.5) (98.4) (62.0) 80.8Dividends – – – (32.3) (72.2)
Net (loss)/profit transferred to reserves (50.2) (204.5) (98.4) (94.3) 8.6
Balance sheetGoodwill and other intangible assets 453.5 514.0 598.3 664.9 708.0Tangible fixed assets 319.6 350.7 407.7 487.2 526.0Other fixed assets 25.0 49.1 70.0 79.8 93.0
Fixed assets 798.1 913.8 1,076.0 1,231.9 1,327.0
Stock 174.0 172.9 190.1 230.7 335.1Trade debtors 263.7 264.4 296.3 315.4 447.5Trade creditors (152.7) (150.0) (152.5) (156.6) (236.6)
Trade working capital 285.0 287.3 333.9 389.5 546.0Trade working capital to sales percentage 21.3% 22.8% 23.7% 26.2% 23.7%Other net liabilities (205.1) (215.7) (253.6) (274.7) (442.0)
878.0 985.4 1,156.3 1,346.7 1,431.0
Share capital and reserves 559.4 615.1 717.3 587.1 630.3Minority interests 11.7 11.8 10.8 10.0 6.7Net borrowings 306.9 358.5 428.2 749.6 794.0
878.0 985.4 1,156.3 1,346.7 1,431.0
F IVE YEAR SUMMARY – GROUP
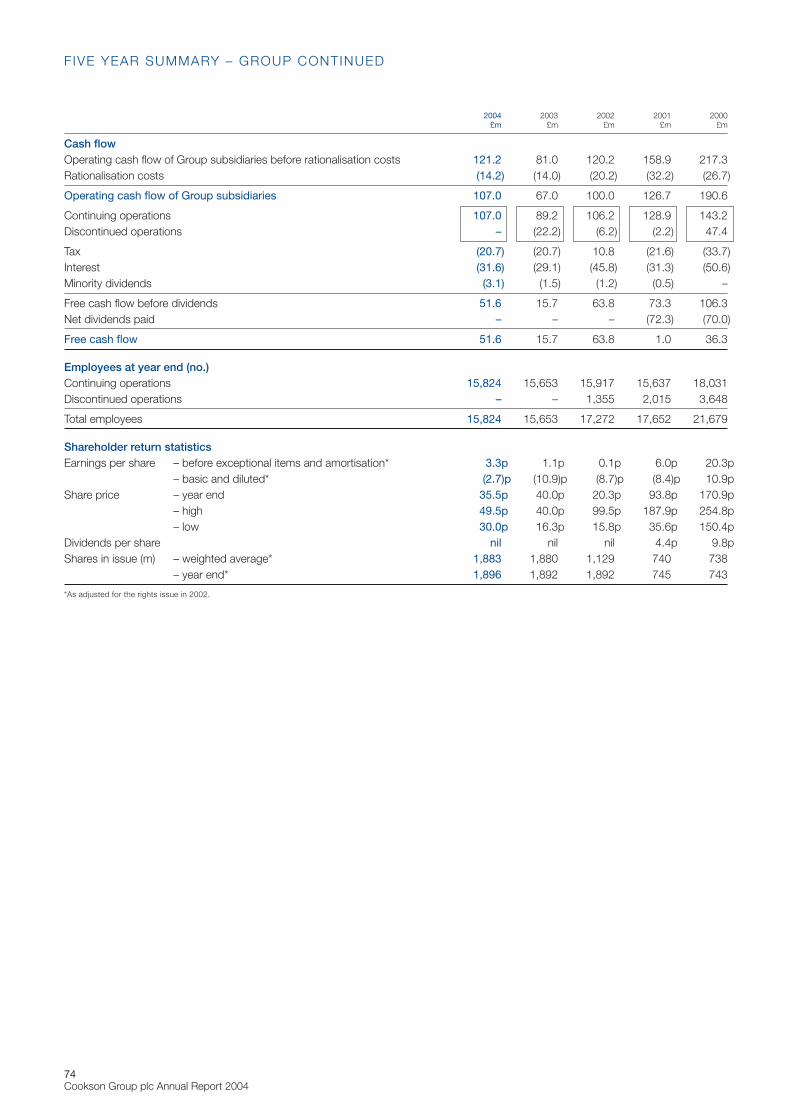
74Cookson Group plc Annual Report 2004
2004 2003 2002 2001 2000£m £m £m £m £m
Cash flowOperating cash flow of Group subsidiaries before rationalisation costs 121.2 81.0 120.2 158.9 217.3Rationalisation costs (14.2) (14.0) (20.2) (32.2) (26.7)
Operating cash flow of Group subsidiaries 107.0 67.0 100.0 126.7 190.6
Continuing operations 107.0 89.2 106.2 128.9 143.2Discontinued operations – (22.2) (6.2) (2.2) 47.4
Tax (20.7) (20.7) 10.8 (21.6) (33.7)Interest (31.6) (29.1) (45.8) (31.3) (50.6)Minority dividends (3.1) (1.5) (1.2) (0.5) –
Free cash flow before dividends 51.6 15.7 63.8 73.3 106.3Net dividends paid – – – (72.3) (70.0)
Free cash flow 51.6 15.7 63.8 1.0 36.3
Employees at year end (no.)Continuing operations 15,824 15,653 15,917 15,637 18,031Discontinued operations – – 1,355 2,015 3,648
Total employees 15,824 15,653 17,272 17,652 21,679
Shareholder return statisticsEarnings per share – before exceptional items and amortisation* 3.3p 1.1p 0.1p 6.0p 20.3p
– basic and diluted* (2.7)p (10.9)p (8.7)p (8.4)p 10.9pShare price – year end 35.5p 40.0p 20.3p 93.8p 170.9p
– high 49.5p 40.0p 99.5p 187.9p 254.8p– low 30.0p 16.3p 15.8p 35.6p 150.4p
Dividends per share nil nil nil 4.4p 9.8pShares in issue (m) – weighted average* 1,883 1,880 1,129 740 738
– year end* 1,896 1,892 1,892 745 743
*As adjusted for the rights issue in 2002.
F IVE YEAR SUMMARY – GROUP CONTINUED
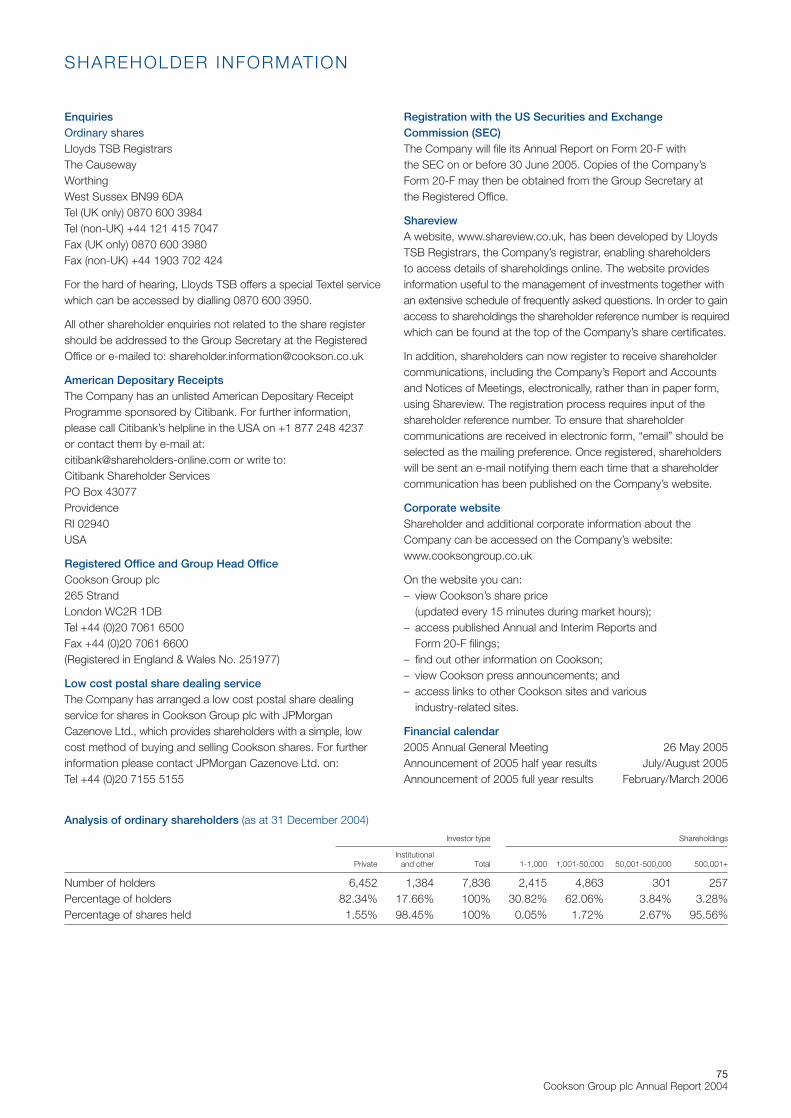
75Cookson Group plc Annual Report 2004
EnquiriesOrdinary sharesLloyds TSB RegistrarsThe CausewayWorthingWest Sussex BN99 6DA Tel (UK only) 0870 600 3984Tel (non-UK) +44 121 415 7047Fax (UK only) 0870 600 3980Fax (non-UK) +44 1903 702 424
For the hard of hearing, Lloyds TSB offers a special Textel servicewhich can be accessed by dialling 0870 600 3950.
All other shareholder enquiries not related to the share registershould be addressed to the Group Secretary at the RegisteredOffice or e-mailed to: [email protected]
American Depositary ReceiptsThe Company has an unlisted American Depositary ReceiptProgramme sponsored by Citibank. For further information, please call Citibank’s helpline in the USA on +1 877 248 4237 or contact them by e-mail at:[email protected] or write to:Citibank Shareholder ServicesPO Box 43077ProvidenceRI 02940USA
Registered Office and Group Head OfficeCookson Group plc265 StrandLondon WC2R 1DBTel +44 (0)20 7061 6500Fax +44 (0)20 7061 6600 (Registered in England & Wales No. 251977)
Low cost postal share dealing serviceThe Company has arranged a low cost postal share dealingservice for shares in Cookson Group plc with JPMorgan Cazenove Ltd., which provides shareholders with a simple, low cost method of buying and selling Cookson shares. For furtherinformation please contact JPMorgan Cazenove Ltd. on:Tel +44 (0)20 7155 5155
Registration with the US Securities and ExchangeCommission (SEC)The Company will file its Annual Report on Form 20-F with the SEC on or before 30 June 2005. Copies of the Company’sForm 20-F may then be obtained from the Group Secretary at the Registered Office.
ShareviewA website, www.shareview.co.uk, has been developed by LloydsTSB Registrars, the Company’s registrar, enabling shareholders to access details of shareholdings online. The website providesinformation useful to the management of investments together withan extensive schedule of frequently asked questions. In order to gainaccess to shareholdings the shareholder reference number is requiredwhich can be found at the top of the Company’s share certificates.
In addition, shareholders can now register to receive shareholdercommunications, including the Company’s Report and Accountsand Notices of Meetings, electronically, rather than in paper form,using Shareview. The registration process requires input of theshareholder reference number. To ensure that shareholdercommunications are received in electronic form, “email” should beselected as the mailing preference. Once registered, shareholderswill be sent an e-mail notifying them each time that a shareholdercommunication has been published on the Company’s website.
Corporate websiteShareholder and additional corporate information about theCompany can be accessed on the Company’s website:www.cooksongroup.co.uk
On the website you can:– view Cookson’s share price
(updated every 15 minutes during market hours);– access published Annual and Interim Reports and
Form 20-F filings;– find out other information on Cookson;– view Cookson press announcements; and– access links to other Cookson sites and various
industry-related sites.
Financial calendar2005 Annual General Meeting 26 May 2005Announcement of 2005 half year results July/August 2005Announcement of 2005 full year results February/March 2006
SHAREHOLDER INFORMATION
Analysis of ordinary shareholders (as at 31 December 2004)
Investor type Shareholdings
InstitutionalPrivate and other Total 1-1,000 1,001-50,000 50,001-500,000 500,001+
Number of holders 6,452 1,384 7,836 2,415 4,863 301 257Percentage of holders 82.34% 17.66% 100% 30.82% 62.06% 3.84% 3.28%Percentage of shares held 1.55% 98.45% 100% 0.05% 1.72% 2.67% 95.56%
76Cookson Group plc Annual Report 2004
constant exchange rates2003 results expressed at 2004 exchange rates. Provides a moremeaningful comparison of underlying trading performance.
continuous castingMethod of pouring steel directly from its molten form into a slab,thereby avoiding the need for secondary processing. Enables rapidsolidification which results in more even chemical composition andmechanical properties. Steel is poured from a ladle into a tundishon top of the continuous caster. As it flows from the tundish downinto the caster’s mould, it solidifies into a ribbon of red-hot steel. At the bottom of the caster, torches cut the continuously flowingsteel to form slabs.
findingsJewellery components such as pins, clasps, posts and clips.
FR4The most commonly used insulating base material for PCBs made from woven glass fibres bonded together with an epoxy.
float lineProduction method for flat glass: raw materials are melted in afurnace to form molten glass which then flows over a bath ofmolten tin.
headline earnings per shareEarnings before exceptional items and amortisation of intangibles.
laminateBase material for a PCB comprising a layer of prepreg bondedbetween sheets of copper foil.
monolithicsRefractory mixes in the form of castables, plastics and sprayedrefractories used principally as a protective lining for ladles andtundishes. Join-free application reduces heat loss, gas permeabilityand thermal stress forces.
operating profitAll references are to operating profit before exceptional items andamortisation of intangibles.
PCB assemblyProcess by which components (such as semiconductors) areattached to a PCB.
prepregNon-conducting semi-cured layers of FR4 used to separateconducting layers in a multilayer circuit board.
printed circuit board (PCB)A type of circuit board which has conducting tracks superimposedor “printed” on one or both sides. May refer to a board eitherbefore or after the assembly process.
refractory productsProducts which provide a heat and chemical buffer in devicessuch as steelmaking vessels, furnaces, kilns and ovens, allowingthe process to operate at extremely high temperatures withoutdamaging the outer shell. Also protect the installation againstdamage caused by abrasion, pressure, chemical attack and rapidchanges in temperature as well as facilitating heat retention, thusallowing the unit to operate more efficiently without major heat loss.
reported exchange rates2003 results expressed at 2003 exchange rates, i.e. as reported in the 2003 Annual Report and Accounts.
Six SigmaA disciplined, data-driven business improvement system designedto eliminate defects from a process.
slide gate refractoriesFlow control refractories used as a valve between steelmakingvessels. They consist of two parts: a slide gate mechanism and a replaceable ceramic plate.
solar crucibleA highly specialised crucible used to cast wafer-grade silicon foruse in the manufacture of photovoltaic cells.
solderAn alloy of tin and other metals with a comparatively low meltingpoint used to join less fusible metals.
VISOBrand name for isostatically pressed products manufactured by the Ceramics division to control the flow of molten metal in continuous casting. Includes ladle shrouds, subentry nozzlesand tube changers.
ZyarockBrand name for high performance ceramic products used in theglass tempering industry.
GLOSSARY OF TECHNICAL AND F INANCIAL TERMS

Designed and produced by cgi-london.com
Board photography by Ric Gemmell and Mike Goldwater
‘Around your world’ Shanghai and New York photography by Mike Goldwater
Printed by The Midas Press
Paper supplied by M-real UK Ltd. Printed on Ikono Silk 250gsm, 170gsm and 130gsm
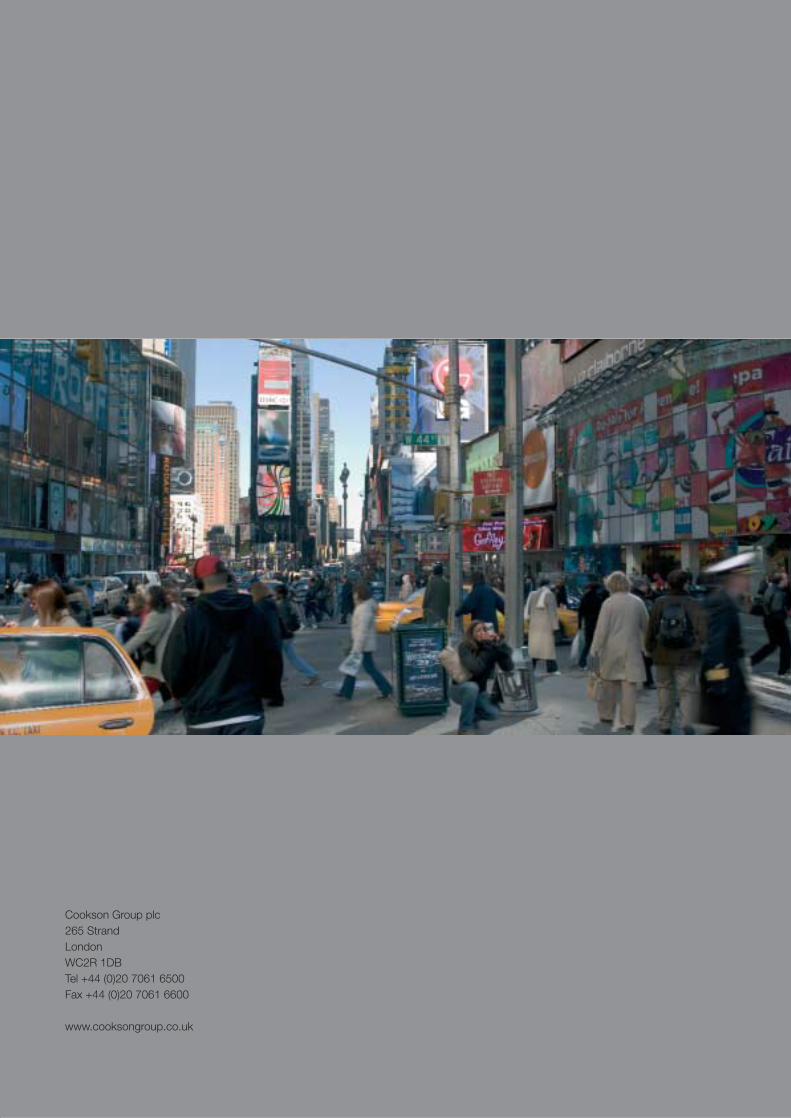
Cookson Group plc265 StrandLondonWC2R 1DBTel +44 (0)20 7061 6500Fax +44 (0)20 7061 6600
www.cooksongroup.co.uk