Groundwater Study For Malad and Bear Rivers Drainages, Box Elder County
PEBBLE PROJECT ENVIRONMENTAL BASELINE DOCUMENT
2004 through 2008
CHAPTER 31. SURFACE WATER HYDROLOGY
Cook Inlet Drainages
PREPARED BY: KNIGHT PIESOLD LTD

SURFACE WATER HYDROLOGY—COOK INLET DRAINAGES
31-i 04/14/2011
TABLE OF CONTENTS
TABLE OF CONTENTS .......................................................................................................................... 31-i
LIST OF TABLES ................................................................................................................................... 31-ii
LIST OF FIGURES ................................................................................................................................. 31-ii
PHOTOGRAPHS .................................................................................................................................... 31-ii
LIST OF APPENDICES .......................................................................................................................... 31-ii
ACRONYMS AND ABBREVIATIONS ............................................................................................... 31-iii
31. SURFACE WATER HYDROLOGY ................................................................................................ 31-1
31.1. Introduction ............................................................................................................................. 31-1
31.2. Study Objectives ...................................................................................................................... 31-1
31.3. Study Area ............................................................................................................................... 31-1
31.4. Previous Studies ...................................................................................................................... 31-2
31.5. Scope of Work ......................................................................................................................... 31-2
31.6. Methods ................................................................................................................................... 31-3
31.6.1. Basin Analysis and Field Work .................................................................................. 31-3
31.6.1.1. Basin Characteristics ................................................................................ 31-3 31.6.1.2. Gage Station Installation ........................................................................... 31-3 31.6.1.3. Stream Discharge Measurement ............................................................... 31-4 31.6.1.4. Stage-Discharge Rating Curves ................................................................ 31-4 31.6.1.5. Photographic Documentation ................................................................... 31-4 31.6.1.6. Stream Classification ................................................................................ 31-4
31.7. Regional Analysis .................................................................................................................... 31-5
31.8. Results and Discussion ............................................................................................................ 31-5
31.8.1. Basin Analysis and Field Work .................................................................................. 31-5
31.8.2. Regional Analysis ....................................................................................................... 31-5
31.9. Summary .................................................................................................................................. 31-6
31.10. References ......................................................................................................................... 31-6

PEBBLE PROJECT, ENVIRONMENTAL BASELINE DOCUMENT, 2004 THROUGH 2008
31-ii 04/14/2011
LIST OF TABLES
Table 31-1, Basin Characteristics File Data
Table 31-2, Gage Station Installation Data
Table 31-3, Gage Station Basin Characteristics – Transportation Corridor Study Area
Table 31-4, Instantaneous Discharge Measurements
Table 31-5, Estimated Monthly Low-Duration Streamflows at Gage Stations based on USGS Streamflow Analysis Region 3 and 4 Regression Equations
Table 31-6, Flow Duration of Observed Flows, August 2005
Table 31-7, Estimated Annual High-Duration Streamflows at Gage Stations based on USGS Regional Regression Equations
Table 31-8, Estimated Peak Streamflows at Gage Stations based on USGS Regional Regression Equations
LIST OF FIGURES
Figure 31-1, Surface Water Gage Stations, Transportation Corridor, Cook Inlet Study Area, 2004-2005
Figure 31-2, USGS Streamflow Analysis Regions of Alaska
PHOTOGRAPHS
LIST OF APPENDICES
Appendix 31A, Gage Station Files, Transportation Corridor Study Area

SURFACE WATER HYDROLOGY—COOK INLET DRAINAGES
31-iii 04/14/2011
ACRONYMS AND ABBREVIATIONS
°F degree(s) Fahrenheit.
ADF&G Alaska Department of Fish and Game
ADNR Alaska Department of Natural Resources
ADOT&PF Alaska Department of Transportation and Public Facilities
BEESC Bristol Environmental & Engineering Services Corporation
cfs cubic feet per second
GS gaging station
KPL Knight Piésold Ltd.
mi2 square miles
NDM Northern Dynasty Mines Inc.
NOAA National Oceanographic and Atmospheric Administration
OHMP Office of Habitat Management and Permitting
USFWS U.S. Fish and Wildlife Service
USGS U.S. Geological Survey
WRIR water-resources investigations report

SURFACE WATER HYDROLOGY—COOK INLET DRAINAGES
31-1 04/14/2011
31. SURFACE WATER HYDROLOGY
31.1. Introduction
This section presents the findings of the baseline surface-water hydrology studies for the transportation corridor study area within the Cook Inlet drainage. These studies consisted of a field component to characterize stream channels crossing the linear study area and to collect spot measurements of instantaneous discharge, a basin analysis component to characterize the drainage basins of the study streams, and a regional analysis component to estimate high and low flow statistics for each stream based on published guidelines and regression analyses.
The field studies were completed by Bristol Environmental & Engineering Services Corporation (BEESC) between July 2004 and October 2005. BEESC also led the basin analysis and regional analysis tasks, and prepared a draft report. Knight Piésold Ltd. (KPL) produced the final report.
31.2. Study Objectives
The objectives of the surface-water hydrology studies within the transportation corridor study area are to:
Characterize annual streamflows in the anadromous fish-bearing stream channels that cross the transportation corridor study area.
Estimate maximum and minimum flow statistics, and other index flows required for aquatic habitat studies, in these channels.
31.3. Study Area
The transportation corridor study area in the Cook Inlet drainages extends from the drainage divide between Bristol Bay and Cook Inlet in the west, along Williams Creek, across the head of Iliamna Bay, to the headland (Knoll Head) between Iliamna Bay and Iniskin Bay on Cook Inlet. These features are shown on Figure 31-1.
The two main streams in the study area are Williams Creek and an unnamed stream that flows within a valley unofficially known as “Y Valley.” Williams Creek flows eastward from the drainage divide between Bristol Bay and Cook Inlet. It flows into Iliamna Bay at the town of Williamsport. The Y Valley is located on the peninsula between Iliamna Bay and Iniskin Bay. The Y Valley stream flows southward into Cook Inlet near the headland between the two bays.
The transportation corridor study area currently has one “Title 16” stream – the unnamed stream in the Y Valley – as designated by Alaska Statute (AS) 16.05.871 and managed by the Alaska Department of Fish and Game (ADF&G), Habitat Division in the Cook Inlet drainages study area. Title 16 streams are so designated because they support anadromous fish.

PEBBLE PROJECT, ENVIRONMENTAL BASELINE DOCUMENT, 2004 THROUGH 2008
31-2 04/14/2011
The terrain in the study area is characterized by steep rugged mountains with shrubby vegetation and thin soil cover. Topographic elevations vary from sea level to greater than 4,000 feet, in many instances covering this range in a span of a few miles. Many of the drainage basins in the Cook Inlet drainages study area have little, if any, storage in the form of ponds or lakes.
The study area is located within Streamflow Analysis Region 4, as defined by the U.S. Geological Survey (USGS) and shown on Figure 31-2. Region 4 has a transitional climate between the more maritime Region 3, which is located along the exposed southern coast of Alaska and the eastern coast of the Alaska Peninsula (Aleutian Range), and the more continental Region 6, which covers the interior of Alaska. The study area lies close to the boundary between Regions 3 and 4.
The estimated mean annual precipitation in the study area is between 60 and 80 inches, according to a state precipitation map (Jones and Fahl, 1994).
There are no long-term climate stations or streamflow gaging stations located within the study area.
31.4. Previous Studies
The USGS conducted studies throughout Alaska to determine regional regression equations for estimating various local hydrologic flows based on limited regional data. These were published as Water Resources Investigations Reports (WRIRs) 03-4114 and 03-4188. WRIR 03-4114 (Wiley and Curran, 2003) provides estimates of annual high-flow statistics and monthly and seasonal low-flow statistics for ungaged sites. WRIR 4188 (Curran et al., 2003) provides estimates of peak flow magnitude and frequency for ungaged sites. Regression equations have been developed to predict various return frequency flows for ungaged streams in each region based on precipitation, climate, and terrain factors.
31.5. Scope of Work
Basin characteristics and streamflow measurements were compiled at two sites in the study area: Williams Creek and the unnamed stream in the Y Valley. A crest gage was installed in the Y Valley in 2004, and a crest gage was installed in Williams Creek in 2005. Monthly discharge measurements were collected in the Y Valley in both years, while discharge measurements in Williams Creek were limited to 2005. Figure 31-1 shows the gage locations for the 2004 and 2005 data collection.
The baseline study has been conducted according to the approach described in Chapter 4, Surface Water Hydrology, of the consolidated study program for Pebble Project (a copy of which is provided in Appendix E of this environmental baseline document). The study was designed to account for the wide range in climatic conditions and stream types encountered in the study area. Chapter 4 of the Draft Environmental Baseline Studies, 2004 Progress Reports (NDM, 2005) described the preliminary findings in 2004 and provided the necessary tools to support the environmental process. The primary focus of the work in 2004 was on the Bristol Bay drainages and selection of corridor-wide hydrologic models.

SURFACE WATER HYDROLOGY—COOK INLET DRAINAGES
31-3 04/14/2011
31.6. Methods
31.6.1. Basin Analysis and Field Work
31.6.1.1. Basin Characteristics
Basin characteristic files were created for each watershed in the study area. The files catalogued information on the physical and climatic nature of each basin. Drainage basin areas were defined for each stream in the study area using USGS topographic maps overlain with watershed boundaries from the Alaska Watershed and Stream Hydrologic Enhanced Datasets (USGS, 2002). Maps were imported into AutoCAD format and enhanced using ArcGIS mapping objects. Watershed maps for each drainage basin included in this study are presented in Appendix 31A.
USGS topographic information was supplemented by aerial photography (1978, 2002, and 2003) to create basin characteristic files for each proposed gaging station. The basin characteristics files include the information summarized in Table 31-1. A digital version of the state precipitation map by Jones and Fahl (1994) was used to determine average basin precipitation. The basin characteristic files are used in the USGS regional regression analyses to predict characteristic flows in each stream. Basin characteristic data for each gage station are presented in Appendix 31A.
31.6.1.2. Gage Station Installation
Prior to actual field data collection, a review of available information from sources including the Alaska Department of Fish and Game (ADF&G), the ADNR-OHMP, the Alaska Department of Transportation and Public Facilities (ADOT&PF), the U.S. Fish and Wildlife Service (USFWS), the National Oceanographic and Atmospheric Administration (NOAA) River Forecast Center, as well as existing aerial photography from 1978, 2002, and 2003, was used to plan the proposed gaging network.
Field data were collected in accordance with the standards set forth in the National Handbook of Recommended Methods for Water-data Acquisition (USGS, 1977 plus updates). Crest gages were installed at each selected gaging location to record high water levels occurring between monitoring events. A crest gage is designed to measure the maximum instantaneous flood crest under conditions of transitory or transient flow.
The crest gages were constructed of 2-inch galvanized pipe containing a wooden staff held in a fixed position relative to a datum (an assumed datum of 100 was used on all crest gages). Care was taken to ensure the proper placement of intake holes in the bottom of the pipe to minimize the nonhydrostatic drawdown or super elevation of the water levels. A typical crest-gage installation is shown in Photo 31-1.
The crest gage is a simple device intended to measure peak flow stages. The gage includes granulated cork stored in the bottom of the capped pipe. As a transitory flood wave passes, the water rises in the pipe, and the cork floats on the water surface. As the water recedes, the cork adheres to the staff inside the pipe (Photo 31-2), thereby retaining a record of the crest stage of flood. The height of the flood peak is obtained by measuring the elevation of the flood mark relative to an established reference point on the pipe.

PEBBLE PROJECT, ENVIRONMENTAL BASELINE DOCUMENT, 2004 THROUGH 2008
31-4 04/14/2011
During installation of the gage, stream cross-sections were surveyed at the gage location starting at a rebar driven into the bank just beyond the ordinary high-water mark and proceeding across the river perpendicular to the stream channel, as shown in Photo 31-3. Survey measurements were taken generally 100 feet upstream and downstream to record the stream-channel slope at the crest gage. Types of data collected during installation of the gages are summarized in Table 31-2.
31.6.1.3. Stream Discharge Measurement
Stream discharge data were collected during monthly site visits. For each data collection event, the current water-surface elevation, stream discharge, and hydraulic slope upstream and downstream were measured at each gaging location. The crest-gage reading was also collected to determine peak flow stages that had occurred between monitoring events.
The methodology for measuring discharge is described in the document Discharge Measurements at Gaging Stations (Buchanan and Somers, 1969) and in Chapter 7.3. A discharge measurement in progress is shown in Photo 31-4.
31.6.1.4. Stage-Discharge Rating Curves
The stream discharge measurements were mostly collected during relatively low flow conditions. Stage-discharge rating curves could not be developed due to the limited range of flow conditions measured. Therefore, the crest gage observations cannot be related to rating curves to estimate the corresponding peak discharges. Similarly, the channel cross-section surveys and slope measurements were not used to develop rating curves based on Manning’s equation due to the lack of high flow measurements to guide the estimation of Manning’s coefficient (“n”).
31.6.1.5. Photographic Documentation
During installation of the crest gages and at seasonal high- and low-flow events, photographs were taken. Photographs also were taken upstream and downstream of each crest gage. High-water marks from past flood events were identified and photographed. The photographs depict conditions that were experienced as the study progressed. The photographs of each gage are shown with the individual gage data in Appendix 31A.
31.6.1.6. Stream Classification
The basin characteristic files contain a row in the spreadsheet with a listing of the “Stream classification at gage site (Montgomery method).” The Montgomery and Buffington method for channel-reach morphology in mountain drainage basins is currently the State of Alaska’s preferred method for stream classification (Montgomery and Buffington, 1997). The stream classification used in this analysis is based on a Level 1 assessment. The Level 1 assessment characterizes the types of channels that occur only within the study area corridor and describes the channel morphology near the gage station. The Alaska Highway Drainage Manual describes stream classification in a similar methodology (ADOT&PF, 2004).

SURFACE WATER HYDROLOGY—COOK INLET DRAINAGES
31-5 04/14/2011
31.7. Regional Analysis
Regional regression equations published in the USGS publications WRIR 03-4114 (Wiley and Curran, 2003) and WRIR 03-4188 (Curran et al., 2003) are used to estimate characteristic flows in ungaged streams in Alaska. These equations require inputs of basin characteristic data for each stream of interest. The regional regression equations for Region 4, in which the study area is located, were developed on the basis of USGS streamflow data recorded at a relatively sparse gaging station network within a large region with diverse physiographic and climatic conditions. As such, the regression equations contain considerable uncertainty. The eastern part of the transportation corridor study area lies close to Region 3 and may be better represented by the USGS gaging stations used in the Region 3 regression analysis, so the regression equations for both Regions 3 and 4 have been used to estimate high-duration flows and peak flows in the study area. For low-duration flows, Regions 3 and 4 were combined for the USGS regression analysis, so a single set of equations represents both regions. The regional regression equations are provided in Chapter 7.
31.8. Results and Discussion
31.8.1. Basin Analysis and Field Work
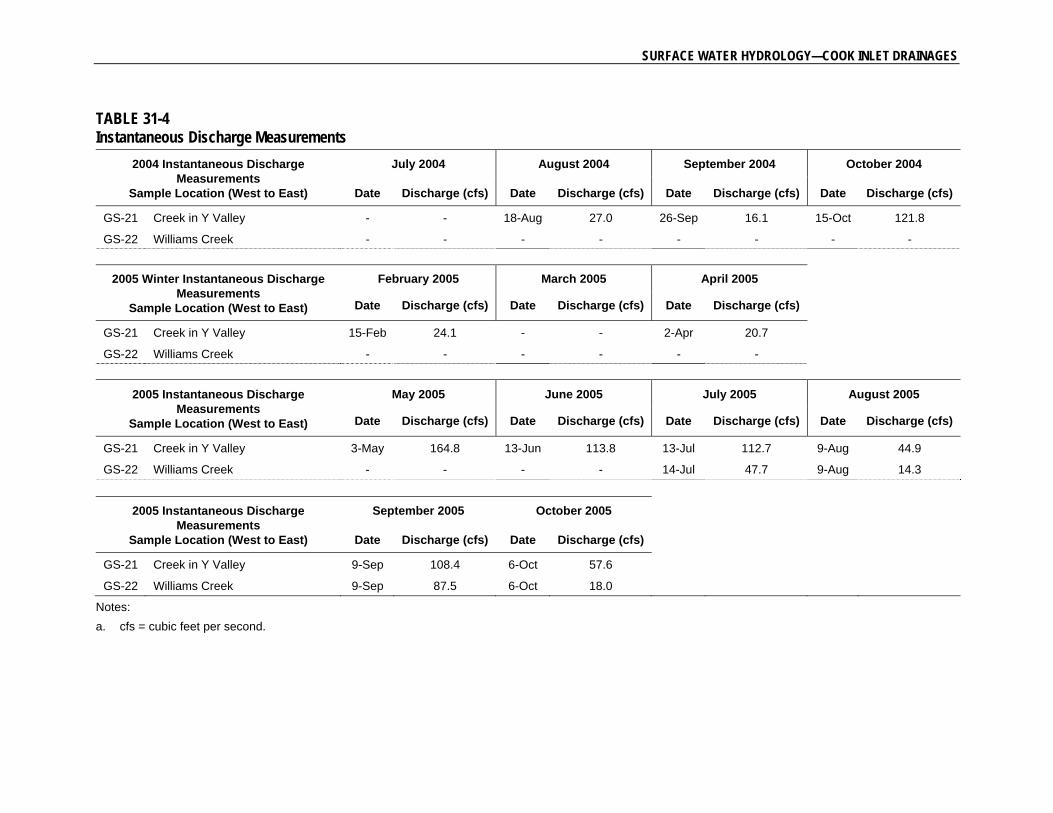
The 2004 through 2005 study program developed information on basin and channel characteristics and limited data on streamflows. The observations and conclusions presented in this report are based on less than 1 year of data for most streams in the study area. Furthermore, the autumn rainy season was late arriving in 2004, so the streamflow measurements collected in August and September 2004 were lower than would normally be expected for that time of year.
The basin characteristics data required for input to the USGS regional regression equations are presented in Table 31-3. Additional information on each basin is provided in Appendix 31A, including tables with additional basin characteristics data, a description of the channel where it crosses the study area, and site photographs.
The instantaneous discharge measurements collected at each gage station are presented in Table 31-4. Additional information related to the discharge measurements is provided in Appendix 31A, including the water surface elevation at the time of measurement and the crest gage readings indicating maximum water level since the previous site visit.
31.8.2. Regional Analysis
The estimated monthly low-duration flows at each gage station for the months of July, August, and September—based on the USGS regression equations for Regions 3 and 4 combined—are presented in Table 31-5. Measured flows in August 2005 are compared to the regional estimates in Table 31-6. The measured flows have exceedence durations of greater than 95 percent.
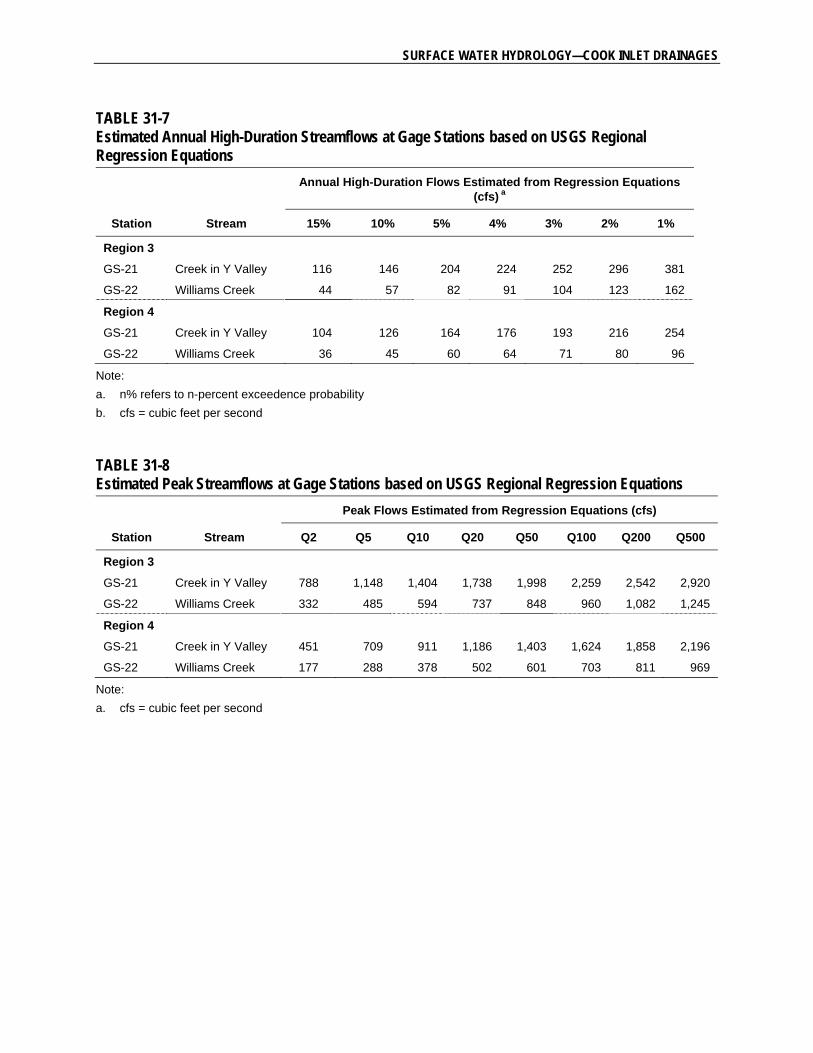
The estimated annual high-duration flows at each gage station, based on the USGS Region 3 and Region 4 regression equations, are presented in Table 31-7. The Region 3 equations generally predict larger discharges for specified high-flow durations, ranging from an average of 1.2 times larger than the
PEBBLE PROJECT, ENVIRONMENTAL BASELINE DOCUMENT, 2004 THROUGH 2008
31-6 04/14/2011
Region 4 estimates for the 15 percent exceedence duration, to 1.6 times greater than the Region 4 estimates for the 1 percent exceedence duration.
The estimated peak streamflow values at each gage station for recurrence intervals of 2 through 500 years, based on the USGS Region 3 and Region 4 regression equations, are presented in Table 31-8. The Region 3 equations predict larger discharges for shorter recurrence intervals and similar discharges for longer recurrence intervals, ranging from an average of 1.8 times larger than the Region 4 estimates for the 2-year flood, to 1.3 times greater than the Region 4 estimates for the 500-year flood.
31.9. Summary
The transportation corridor study area in the Cook Inlet drainages is generally characterized by rugged mountainous terrain and a climate influenced by the maritime coastal exposure of Cook Inlet.
Basin and channel characteristics and spot discharge measurements were compiled in 2004 and 2005 on two streams within the study area: Williams Creek and the unnamed stream in the “Y Valley,” which is located on the peninsula between Iliamna and Iniskin Bays. Crest gages were installed to record instantaneous stage peaks, but stage-discharge rating curves were not developed and peak discharge estimates associated with the stage peaks are not presented.
Streamflow statistics have been estimated at the two study sites using regional regression equations developed by the USGS. The low-duration estimates indicate that the measured flows in August 2005 had exceedence durations of greater than 95 percent. High-duration flows and peak flows were also estimated, but no field data or USGS gage data were available for comparison.
31.10. References
Buchanan, T.J., and W.P. Somers. 1969. “Discharge Measurements at Gaging Stations.” Book 3, Chapter A8, in: Techniques of Water Resources Investigations, Applications of Hydraulics. U.S. Geological Survey.
Curran, J.H., D.F. Meyer, and G.D. Tasker. 2003. Estimating the Magnitude and Frequency of Peak Streamflows for Ungaged Sites on Streams in Alaska and Conterminous Basins. Water Resources Investigations Report 03-4188. U.S. Geological Survey.
Jones, S.H., and C.B. Fahl. 1994. Magnitude and Frequency of Floods in Alaska and Conterminous Basins of Canada. U.S. Geological Survey – Water-Resources Investigations Report (WRIR) 93-4179.
Montgomery, D.R., and J.M. Buffington. 1997. Channel-reach morphology in mountain drainage basins. Geological Society of America Bulletin 109:596-611.
Northern Dynasty Mines Inc. (NDM). 2005. Draft Environmental Baseline Studies, 2004 Progress Report.
U.S. Geological Survey (USGS). 1977. National Handbook of Recommended Methods for Water-data Acquisition. Chapters 1.B.2.b.4 and 1.B.2.d.3.

SURFACE WATER HYDROLOGY—COOK INLET DRAINAGES
31-7 04/14/2011
Wiley, J.B., and J.H. Curran. 2003. Estimating Annual High-flow Statistics and Monthly and Seasonal Low-flow Statistics for Ungaged Sites on Streams in Alaska and Conterminous Basins in Canada. Water Resources Investigations Report 03-4114. U.S. Geological Survey.

SURFACE WATER HYDROLOGY—COOK INLET DRAINAGES
TABLES

SURFACE WATER HYDROLOGY—COOK INLET DRAINAGES
TABLE 31-1 Basin Characteristics File Data
Parameter Variable Unit
Drainage area Da mi2
Storage area (lakes and ponds) St mi2
Glacier area Gl mi2
Forested area Fr mi2
Mean basin elevation El feet
Main channel slope Sl %
Main channel length C miles
Mean annual precipitation Pr inches
Mean minimum January temperature T °F
Notes:
a. °F = degree(s) Fahrenheit, mi2 = square miles.
TABLE 31-2 Gage Station Installation Data
Parameter Description Method
Location Latitude and longitude in degrees/minutes/seconds Global positioning system
Stream cross-section Hydraulic cross-section perpendicular to flow Rod and transit survey
Skew of flow Cosine of the perpendicular to the hydraulic cross-sections in feet
Rod and transit survey
Gage datum Elevation of reference point on crest gage Assumed datum of 100 feet except for Iliamna River station with USGS-established datum
Crest-gage reading Flow height above datum Measured by gage
Mean velocity Average velocity through wetted cross-section In-stream flow meter and area average method
Hydraulic slope Average slope of right and left banks up- and downstream of gaging station, or slope between high-water marks using slope-area method of computing peak discharge in feet per feet
Rod and transit survey
High-water marks Evidence of major flood events at a given site Visual observation
Ordinary high water Legally defined by Alaska Statutes Titles 16 and 41 as the line on the bank established by fluctuations of water and indicated by physical characteristics such as a clear, natural line impressed on the bank, shelving, changes in the character of soil, destruction of terrestrial vegetation, the presence of litter and debris, or other appropriate means that consider the characteristics of the surrounding areas
Visual observation
Water temperature Degrees Fahrenheit Hand-held thermometer
Photographic documentation
Upstream and downstream conditions, streambed materials Digital camera

SURFACE WATER HYDROLOGY—COOK INLET DRAINAGES
TABLE 31-3 Gage Station Basin Characteristics - Transportation Corridor Study Area
Station Stream Period of Record
Drainage Basin Characteristics
Basin Area
Lake &
Pond Area
Lake &
Pond Area
Mean Basin Elev.
Mean Annual Precipitation
Mean January
Minimum Temp.
(mi2) (mi2) (%) (feet) (inches) (°F)
GS-21 Creek in Y Valley 2004-05 12.39 0 0.0 1165 70 12
GS-22 Williams Creek 2004-05 4.60 0 0.0 1775 70 11
Notes:
a. °F = degree(s) Fahrenheit, mi2 = square miles.
SURFACE WATER HYDROLOGY—COOK INLET DRAINAGES
TABLE 31-4 Instantaneous Discharge Measurements
2004 Instantaneous Discharge Measurements
Sample Location (West to East)
July 2004 August 2004 September 2004 October 2004
Date Discharge (cfs) Date Discharge (cfs) Date Discharge (cfs) Date Discharge (cfs)
GS-21 Creek in Y Valley - - 18-Aug 27.0 26-Sep 16.1 15-Oct 121.8
GS-22 Williams Creek - - - - - - - -
2005 Winter Instantaneous Discharge Measurements
Sample Location (West to East)
February 2005 March 2005 April 2005
Date Discharge (cfs) Date Discharge (cfs) Date Discharge (cfs)
GS-21 Creek in Y Valley 15-Feb 24.1 - - 2-Apr 20.7
GS-22 Williams Creek - - - - - -
2005 Instantaneous Discharge Measurements
Sample Location (West to East)
May 2005 June 2005 July 2005 August 2005
Date Discharge (cfs) Date Discharge (cfs) Date Discharge (cfs) Date Discharge (cfs)
GS-21 Creek in Y Valley 3-May 164.8 13-Jun 113.8 13-Jul 112.7 9-Aug 44.9
GS-22 Williams Creek - - - - 14-Jul 47.7 9-Aug 14.3
2005 Instantaneous Discharge Measurements
Sample Location (West to East)
September 2005 October 2005
Date Discharge (cfs) Date Discharge (cfs)
GS-21 Creek in Y Valley 9-Sep 108.4 6-Oct 57.6
GS-22 Williams Creek 9-Sep 87.5 6-Oct 18.0
Notes:
a. cfs = cubic feet per second.

SURFACE WATER HYDROLOGY—COOK INLET DRAINAGES
TABLE 31-5 Estimated Monthly Low-Duration Streamflows at Gage Stations based on USGS Region 3 and 4 Regression Equations
Station Stream
Low-Duration Flows Estimated from Regression Equations (cfs) a
98% 95% 90% 85% 80% 70% 60% 50%
July
GS-21 Creek in Y Valley 25.5 30.0 35.0 39.2 42.7 49.0 55.6 62.4
GS-22 Williams Creek 11.1 12.9 15.4 17.2 18.9 21.8 24.8 27.9
August
GS-21 Creek in Y Valley 18.4 21.8 25.2 28.1 30.7 36.2 41.7 48.1
GS-22 Williams Creek 7.4 8.8 10.2 11.4 12.5 14.8 17.1 19.7
September
GS-21 Creek in Y Valley 16.4 19.9 24.6 28.1 31.4 37.8 44.8 53.2
GS-22 Williams Creek 5.4 6.5 8.2 9.4 10.5 12.8 15.3 18.3
Note:
a. n% refers to n-percent exceedence probability.
b. cfs = cubic feet per second.
TABLE 31-6 Flow Duration of Observed Flows, August 2005
Station Stream Observed Flow (cfs) Approximate Flow Duration a
GS-21 Creek in Y Valley 21.4 98% - 95%
GS-22 Williams Creek 7.1 >98%
Note:
a. Flow durations estimated from Table 31-5.
b. cfs = cubic feet per second
SURFACE WATER HYDROLOGY—COOK INLET DRAINAGES
TABLE 31-7 Estimated Annual High-Duration Streamflows at Gage Stations based on USGS Regional Regression Equations
Station Stream
Annual High-Duration Flows Estimated from Regression Equations (cfs) a
15% 10% 5% 4% 3% 2% 1%
Region 3
GS-21 Creek in Y Valley 116 146 204 224 252 296 381
GS-22 Williams Creek 44 57 82 91 104 123 162
Region 4
GS-21 Creek in Y Valley 104 126 164 176 193 216 254
GS-22 Williams Creek 36 45 60 64 71 80 96
Note:
a. n% refers to n-percent exceedence probability
b. cfs = cubic feet per second
TABLE 31-8 Estimated Peak Streamflows at Gage Stations based on USGS Regional Regression Equations
Station Stream
Peak Flows Estimated from Regression Equations (cfs)
Q2 Q5 Q10 Q20 Q50 Q100 Q200 Q500
Region 3
GS-21 Creek in Y Valley 788 1,148 1,404 1,738 1,998 2,259 2,542 2,920
GS-22 Williams Creek 332 485 594 737 848 960 1,082 1,245
Region 4
GS-21 Creek in Y Valley 451 709 911 1,186 1,403 1,624 1,858 2,196
GS-22 Williams Creek 177 288 378 502 601 703 811 969
Note:
a. cfs = cubic feet per second

SURFACE WATER HYDROLOGY—COOK INLET DRAINAGES
FIGURES

Canada
ARCTIC OCEAN
MapLocation
GUL F O F A LASKA
Russia
BERING SEA
!.
!.
!.
!.
!.
!.
!(
!(!.
!.
!(
GS21
Iliamna
IGIUGIG
Kokhanok
Newhalen
Nondalton
Pedro Bay
PORT ALSWORTH
Pile Bay
Knoll Head
GS22
1,400,000
1,400,000
1,450,000
1,450,000
1,500,000
1,500,000
1,550,000
1,550,000
1,600,000
1,600,000
1,650,000
1,650,000
1,700,000
1,700,000
1,750,000
1,750,000
2,000
,000
2,050
,000
2,100
,000
2,150
,000
2,200
,000
2,250
,000
Alaska State Plane Zone 5 (units feet)1983 North American Datum
0 4 8 12 16Miles
1:363,852Scale0 5 10 15 20
Kilometers³Date: March 28, 2011Author: BEESC-ME
File: Hydro_EBD1b_V07.mxdVersion: 7
Figure 31-1Surface Water Gage Stations
Transportation CorridorCook Inlet Study Area
2004-2005Lake Clark
Iliamna Lake
Cook In
let
Iliamna Bay
Iniskin BayWilliamsport
Newh
alen R
iver
Legend!( Surface Water Gage Station (Pebble Project)
Existing RoadsGeneral Deposit LocationBristol Bay/Cook Inlet Drainage Boundary
GS21: Example of Pebble Project Surface WaterGage Station Identification Number!( Knoll Head!. Communities

SURFACE WATER HYDROLOGY—COOK INLET DRAINAGES
FIGURE 31-2 USGS Streamflow Analysis Regions of Alaska Source: Curran et al., 2003.
Approximate Location of Mine and Transportation Corridor Study Areas
Cook Inlet

SURFACE WATER HYDROLOGY—COOK INLET DRAINAGES
PHOTOGRAPHS

SURFACE WATER HYDROLOGY—COOK INLET DRAINAGES
PHOTO 31-1: Example of newly installed crest gage at No-Name Creek near North Head (Y Valley).
PHOTO 31-2: Checking staff inside crest gage for peak flood data at No-Name Creek near North Head (Y Valley).

SURFACE WATER HYDROLOGY—COOK INLET DRAINAGES
PHOTO 31-3: Example of survey for stream cross section.
PHOTO 31-4: Field crew taking a discharge measurement using the wading method on Williams Creek.

SURFACE WATER HYDROLOGY—COOK INLET DRAINAGES
APPENDICES
SURFACE WATER HYDROLOGY—COOK INLET DRAINAGES
APPENDIX 31A
Gage Station Files
Transportation Corridor Study Area

SURFACE WATER HYDROLOGY—COOK INLET DRAINAGES APPENDIX 31A
i 04/14/2011
TABLE OF CONTENTS
LIST OF ATTACHMENTS ......................................................................................................................... ii
ACRONYMS AND ABBREVIATIONS .................................................................................................... iii
Gage Station Files, Transportation Corridor Study Area .............................................................................. 1
1. Introduction ............................................................................................................................................ 1
2. Results .................................................................................................................................................... 1
2.1 Gage Station GS-21, Creek in Y Valley ....................................................................................... 1
2.2 Gage Station GS-22, Williams Creek ........................................................................................... 1

SURFACE WATER HYDROLOGY—COOK INLET DRAINAGES APPENDIX 31A
ii 04/14/2011
LIST OF ATTACHMENTS
Attachment 1; Gaging Station GS-21, Creek in Y Valley
Attachment 2; Gaging Station GS-22, Williams Creek

SURFACE WATER HYDROLOGY—COOK INLET DRAINAGES APPENDIX 31A
iii 04/14/2011
ACRONYMS AND ABBREVIATIONS
cfs cubic feet per second ft foot (feet) °F degrees Fahrenheit mi2 square mile(s)
SURFACE WATER HYDROLOGY—COOK INLET DRAINAGES APPENDIX 31A
1 04/14/2011
GAGE STATION FILES, TRANSPORTATION CORRIDOR STUDY AREA
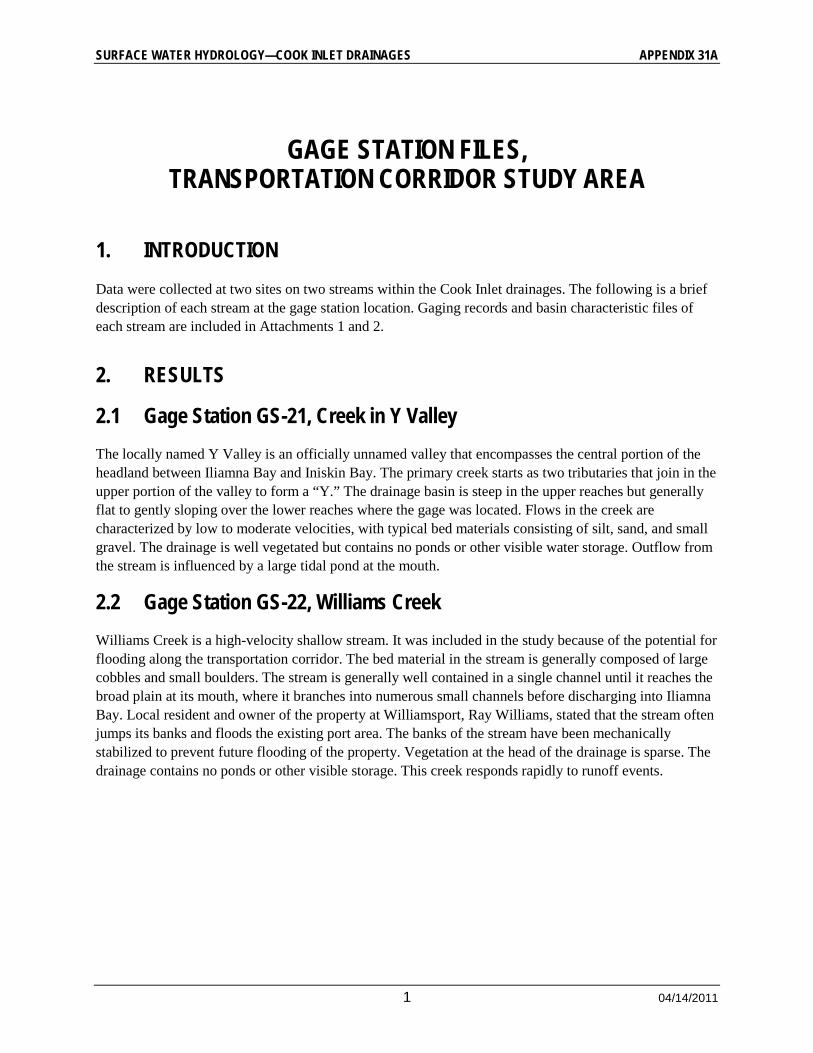
1. INTRODUCTION
Data were collected at two sites on two streams within the Cook Inlet drainages. The following is a brief description of each stream at the gage station location. Gaging records and basin characteristic files of each stream are included in Attachments 1 and 2.
2. RESULTS
2.1 Gage Station GS-21, Creek in Y Valley
The locally named Y Valley is an officially unnamed valley that encompasses the central portion of the headland between Iliamna Bay and Iniskin Bay. The primary creek starts as two tributaries that join in the upper portion of the valley to form a “Y.” The drainage basin is steep in the upper reaches but generally flat to gently sloping over the lower reaches where the gage was located. Flows in the creek are characterized by low to moderate velocities, with typical bed materials consisting of silt, sand, and small gravel. The drainage is well vegetated but contains no ponds or other visible water storage. Outflow from the stream is influenced by a large tidal pond at the mouth.
2.2 Gage Station GS-22, Williams Creek
Williams Creek is a high-velocity shallow stream. It was included in the study because of the potential for flooding along the transportation corridor. The bed material in the stream is generally composed of large cobbles and small boulders. The stream is generally well contained in a single channel until it reaches the broad plain at its mouth, where it branches into numerous small channels before discharging into Iliamna Bay. Local resident and owner of the property at Williamsport, Ray Williams, stated that the stream often jumps its banks and floods the existing port area. The banks of the stream have been mechanically stabilized to prevent future flooding of the property. Vegetation at the head of the drainage is sparse. The drainage contains no ponds or other visible storage. This creek responds rapidly to runoff events.

SURFACE WATER HYDROLOGY—COOK INLET DRAINAGES APPENDIX 31A
ATTACHMENTS

ATTACHMENT 1—GS-21 CREEK IN Y VALLEY
ATTACHMENT 1
Gaging Station GS-21 Creek in Y Valley

ATTACHMENT 1—GS-21 CREEK IN Y VALLEY
LIST OF TABLES
Table 1, GS-21 – Creek in Y Valley: Basin Characteristic File Data
Table 2, GS-21 – Creek in Y Valley: Monthly Discharge
LIST OF FIGURES
Figure 31A1-1, Transportation Corridor, Cook Inlet Drainages, GS-21 Drainage Basin, Y Valley

ATTACHMENT 1—GS-21 CREEK IN Y VALLEY
TABLES

ATTACHMENT 1—GS-21 CREEK IN Y VALLEY
TABLE 1 GS-21 - Creek in Y Valley: Basin Characteristic File Data
Parameter Variable Unit Value
Latitude Lat ddmmss 59° 38' 30''
Longitude Long ddmmss 153° 31' 48''
Drainage area Da Square miles 12.39 mi2
Storage area (lakes and ponds) St Square miles 0.0 mi2
Glacier area Gl Square miles 0.0 mi2
Forested area Fr Square miles 6.32 mi2
Mean basin elevation El Feet 1,165 ft
Main channel slope Sl % 6%
Main channel length C Miles 5.48 mi
Mean annual precipitation Pr Inches 70 in
Mean minimum January temperature T °Fahrenheit 12°F
Stream classification at gage site (Montgomery method)
Level 1 Description 3b; unstable; overbank flow
TABLE 2 GS-21 - Creek in Y Valley: Monthly Discharge
Date Water Year
Peak Gage
Reading
Water Surface
Elevation (ft)
Stream Width
(ft)
Number of
Sections
Total Discharge
(cfs) Comment
18-Aug 2004 New Set 97.60 32.9 16 27.01
26-Sep 2004 0 97.48 32.0 8 16.12
15-Oct 2004 9" 98.72 51.0 9 121.83 Estimated discharge-partial measure
15-Feb 2005 0 97.00 41.5 18 24.12 Estimated discharge-partial measure
2-Apr 2005 0 - 32.3 20 20.692
3-May 2005 0 98.92 68.0 31 164.841 New location for discharge measurement -300' upstream, rebar set
13-Jun 2005 5" 98.60 65.4 16 113.756
13-Jul 2005 Down 97.40 59.0 30 112.693 Water surface taken at rebar
9-Aug 2005 Down 95.02 52.8 27 44.924 Water surface taken at rebar
9-Sep 2005 Down 97.32 58.3 15 108.345 Water surface taken at rebar
6-Oct 2005 Down 95.68 59.0 31 57.572 Water surface taken at rebar
Notes: a. ft = feet, cfs = cubic feet per second.

ATTACHMENT 1—GS-21 CREEK IN Y VALLEY
FIGURE

Canada
ARCTIC OCEAN
MapLocation
GUL F O F A LASKA
Russia
BERING SEA
!.!( WilliamsportGS-22
Alaska State Plane Zone 5 (units feet)1983 North American Datum
Date: March 28, 2011Author: BEESC-ME
File: Hydro_EBDao_V6.mxdVersion: 6
Figure 31A1-1Transportation CorridorCook Inlet Drainages
GS-21 Drainage BasinY Valley
0 0.25 0.5 0.75 1Miles
1:38,890Scale0 0.25 0.5 0.75 1
Kilometers ³
Legend
!( Surface Water Gage Station!. Communities
Existing RoadsBristol Bay/Cook Inlet Drainages BoundaryDrainage Basin GS-21
Cook Inlet
DrainagesBrist
ol Bay
Drainages
!(GS-21
GS-21 - Gage Station at Y ValleyParameter ValueLatitude 59° 38' 30''Longitude 153° 31' 48''Drainage area 12.39 square milesStorage area (lakes and ponds) 0.00 square milesGlacier area 0.0 square milesForested area 6.32 square milesMean basin elevation 1165 feetMain channel slope 6%Main channel length 5.48 miles

ATTACHMENT 2—GS-22 WILLIAMS CREEK
ATTACHMENT 2
Gaging Station GS-22 Williams Creek

ATTACHMENT 2— GS-22 WILLIAMS CREEK
LIST OF TABLES
Table 1, GS-22 – Williams Creek: Basin Characteristic File Data
Table 2, GS-22 – Williams Creek: Monthly Discharge
LIST OF FIGURES
Figure 31A2-1, Transportation Corridor, Cook Inlet Drainages, GS-22 Drainage Basin, Williams Creek
ATTACHMENT 2— GS-22 WILLIAMS CREEK
TABLES
ATTACHMENT 2— GS-22 WILLIAMS CREEK
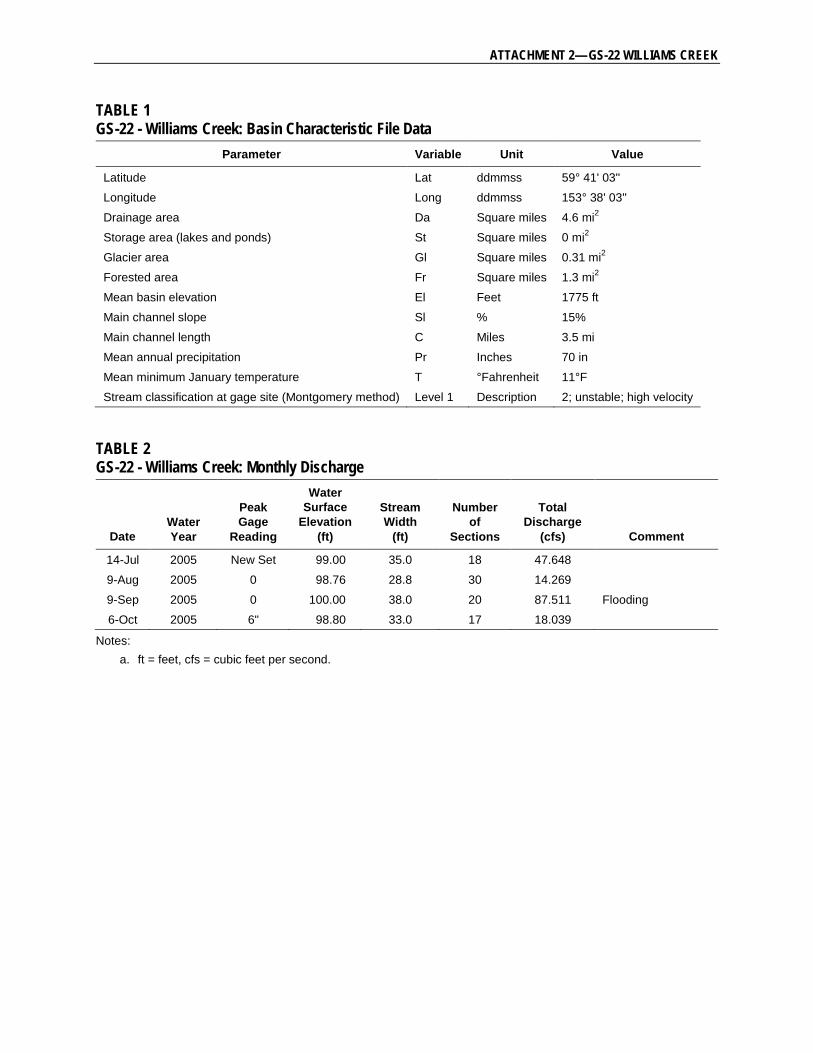
TABLE 1 GS-22 - Williams Creek: Basin Characteristic File Data
Parameter Variable Unit Value
Latitude Lat ddmmss 59° 41' 03''
Longitude Long ddmmss 153° 38' 03''
Drainage area Da Square miles 4.6 mi2
Storage area (lakes and ponds) St Square miles 0 mi2
Glacier area Gl Square miles 0.31 mi2
Forested area Fr Square miles 1.3 mi2
Mean basin elevation El Feet 1775 ft
Main channel slope Sl % 15%
Main channel length C Miles 3.5 mi
Mean annual precipitation Pr Inches 70 in
Mean minimum January temperature T °Fahrenheit 11°F
Stream classification at gage site (Montgomery method) Level 1 Description 2; unstable; high velocity
TABLE 2 GS-22 - Williams Creek: Monthly Discharge
Date Water Year
Peak Gage
Reading
Water Surface
Elevation (ft)
Stream Width
(ft)
Number of
Sections
Total Discharge
(cfs) Comment
14-Jul 2005 New Set 99.00 35.0 18 47.648
9-Aug 2005 0 98.76 28.8 30 14.269
9-Sep 2005 0 100.00 38.0 20 87.511 Flooding
6-Oct 2005 6" 98.80 33.0 17 18.039
Notes: a. ft = feet, cfs = cubic feet per second.

ATTACHMENT 2— GS-22 WILLIAMS CREEK
FIGURE

Canada
ARCTIC OCEAN
MapLocation
GUL F O F A LASKA
Russia
BERING SEA
!.!(
WilliamsportGS-22
1,700,000
1,700,000
Alaska State Plane Zone 5 (units feet)1983 North American Datum
Date: March 28, 2011Author: BEESC-ME
File: Hydro_EBDap_V6.mxdVersion: 6
0 0.25 0.5 0.75 1Miles
1:21,544Scale0 0.25 0.5 0.75 1
Kilometers ³
Legend
!( Surface Water Gage Station
!. CommunitiesExisting RoadsBristol Bay/Cook Inlet Drainages BoundaryDrainage Basin GS-22
GS-22 - Williams CreekParameter ValueLatitude 59° 41' 03''Longitude 153° 38' 03''Drainage area 4.60 square milesStorage area (lakes and ponds) 0.00 square milesGlacier area 0.31 square milesForested area 1.30 square milesMean basin elevation 1775 feetMain channel slope 15%Main channel length 3.50 miles
Cook InletDrainages
Bristol BayDrainages
Figure 31A2-1Transportation CorridorCook Inlet Drainages
GS-22 Drainage BasinWilliams Creek