conversion of waste methane to electrical energy High ...
17
Supporting information High-performance fuel cell designed for coking-resistance and efficient conversion of waste methane to electrical energy Tao Li 1 , Xuekun Lu 2 , Mohamad F. Rabuni 1,4 , Bo Wang 1 , Nicholas M. Farandos 3 , Geoff H. Kelsall 3 , Dan J. L. Brett 2 , Paul R. Shearing 2 , Mengzheng Ouyang 5 , Nigel P. Brandon 5 and Kang Li 1 * 1 Barrer Center, Department of Chemical Engineering, Imperial College London, London SW7 2AZ, UK 2 Electrochemical Innovation Lab, Department of Chemical Engineering, University College London, London WC1E 7JE, UK 3 Department of Chemical Engineering, Imperial College London, London SW7 2AZ, UK 4 Deppartment of Chemical Engineering, University of Malaya, 50603 Kuala Lumpur, Malaysia 5 Deparrtment of Earth Science and Engineering, Imperial College London, London SW7 2AZ, UK Method Preparation of micro-monolithic ceramic fuel cell The 6-channel, micro-monolithic anode support was prepared via a phase inversion-assisted extrusion technique (Supplementary Fig. 1), the details of which have been described elsewhere 20 . Yttria-stabilized zirconia (8 mol% YSZ), gadolinium-doped ceria (10 mol% GDC), nickel oxide (NiO) and lanthanum strontium cobalt ferrite (La 0.6 Sr 0.4 Co 0.2 Fe 0.8 O 3−δ , LSCF) were purchased from Fuel Cell Materials (USA) and used as supplied. Poly (methyl methacrylate) (Acrypet-PMMA, Mitsubishi Rayon Co. Ltd), 30-dipolyhydroxystearate (Arlacel P135, Uniqema), and N-methyl-2-pyrrolidone (NMP, HPLC grade, VWR) were applied as the polymer binder, dispersant and solvent, respectively. The mixture of deionized (DI) water and ethanol (VWR International) was used as internal coagulant. Generally, ceramic powders, solvent and organic additives were mixed and ball-milled (SFM-1 Desk- top Miller, MTI Corporation, USA) for 4 days to obtain a homogeneous spinning suspension, which was latter degassed under vacuum to eliminate air bubbles prior to the extrusion process. The extrusion rates of various components were precisely controlled by syringe pumps (Harvard Electronic Supplementary Material (ESI) for Energy & Environmental Science. This journal is © The Royal Society of Chemistry 2020
Transcript of conversion of waste methane to electrical energy High ...

Supporting information
High-performance fuel cell designed for coking-resistance and efficient
conversion of waste methane to electrical energy
Tao Li1, Xuekun Lu2, Mohamad F. Rabuni1,4, Bo Wang1, Nicholas M. Farandos3, Geoff H. Kelsall3, Dan J. L. Brett2, Paul R. Shearing2, Mengzheng Ouyang5, Nigel P. Brandon5 and Kang Li1*1 Barrer Center, Department of Chemical Engineering, Imperial College London, London SW7 2AZ, UK2 Electrochemical Innovation Lab, Department of Chemical Engineering, University College London, London WC1E 7JE, UK3 Department of Chemical Engineering, Imperial College London, London SW7 2AZ, UK4 Deppartment of Chemical Engineering, University of Malaya, 50603 Kuala Lumpur, Malaysia5 Deparrtment of Earth Science and Engineering, Imperial College London, London SW7 2AZ, UK
Method
Preparation of micro-monolithic ceramic fuel cell
The 6-channel, micro-monolithic anode support was prepared via a phase inversion-assisted
extrusion technique (Supplementary Fig. 1), the details of which have been described elsewhere 20.
Yttria-stabilized zirconia (8 mol% YSZ), gadolinium-doped ceria (10 mol% GDC), nickel oxide (NiO) and
lanthanum strontium cobalt ferrite (La0.6Sr0.4Co0.2Fe0.8O3−δ, LSCF) were purchased from Fuel Cell
Materials (USA) and used as supplied. Poly (methyl methacrylate) (Acrypet-PMMA, Mitsubishi Rayon
Co. Ltd), 30-dipolyhydroxystearate (Arlacel P135, Uniqema), and N-methyl-2-pyrrolidone (NMP, HPLC
grade, VWR) were applied as the polymer binder, dispersant and solvent, respectively. The mixture
of deionized (DI) water and ethanol (VWR International) was used as internal coagulant.
Generally, ceramic powders, solvent and organic additives were mixed and ball-milled (SFM-1 Desk-
top Miller, MTI Corporation, USA) for 4 days to obtain a homogeneous spinning suspension, which
was latter degassed under vacuum to eliminate air bubbles prior to the extrusion process. The
extrusion rates of various components were precisely controlled by syringe pumps (Harvard
Electronic Supplementary Material (ESI) for Energy & Environmental Science.This journal is © The Royal Society of Chemistry 2020

PHD22/200 HPsi). A weight ratio of 70/30 was selected for the water-ethanol internal coagulant to
ensure the optimized morphology in the resultant anode precursor, which was subsequently dried
and straightened at room temperature.
YSZ-GDC dual-layer electrolyte was dip-coated onto the anode precursor, while preventing it
accessing the channels in the anode by sealing using PTFE film. After both layers of electrolyte
coating were dried, they were co-sintered at 1400 °C in ambient air for 6 hours. Finally, the LSCF-GDC
cathode with a length of 10 mm was dip-coated onto the sintered half-cell that had been cut to a
length of 50 mm and subsequently sintered at 1000 °C for 1 h. The thickness of the cathode layer was
approximately 25 µm.
X-ray computed tomography
Non-destructive X-ray computed tomographic imaging of the fabricated micro-monolithic anode was
conducted on a Zeiss Xradia Versa 520 X-ray microscope at the Electrochemical Innovation Lab (EIL),
University College London. 2001 X-ray projections with a voxel size of 1.55 m were collected with an
exposure time of 18 seconds during the angular rotation of 360 degrees. These radiographic
projections were then reconstructed by a proprietary Feldkamp-Davis-Kress (FDK) algorithm in the
Zeiss Xradia XMReconstructor software. Post-processing of the reconstructed CT data was conducted
using Avizo 9.4 (Thermo Fisher Scientific, UK).
Computational fluid dynamics (CFD) simulation
The reconstructed 3D volume of the monolithic anode was firstly segmented into solid and pore
phases using standard thresholding method based on the grayscale difference. A 260 m thick disc
with half of the geometry was then meshed and imported into the commercial CFD software Star
CCM+ (CD-adapco Inc., London) for image-based simulation. Two types of inlet boundary conditions
were set: pure H2 and 20 % H2 + 80 % inert diluent to compare the mass transport performance at
different operating conditions. At the outlet, a negative source flux corresponding to the current
density of 1, 2 and 4 A cm-2 was set respectively to mimic the consumption of reactants at the EAR

near the electrode/electrolyte interface. In a porous electrode, the molar flux density can be
expressed by the modified Fick’s law, exemplified in 1D as:
(S1) 𝐽𝐻2
=‒𝜀𝜏
𝐷𝑑𝐶𝑑𝑥
where JH2 represents the hydrogen molar flux density (mol m-2 s-1), ε and τ the porosity and tortuosity
factor, D the diffusion coefficient, C the local concentration (mol m-3), and x the coordinate along
permeate direction (m). The CT-resolved micro-channels were modelled as the fluid domain and the
solid phase was modelled as the porous medium, with the porosity (29.2 %) and tortuosity factor
(8.9) taken from previous measurements 21.
Morphological and electrochemical characterizations
The morphology of the micro-monolithic cell was determined using field-emission scanning electron
microscopy (FE-SEM, Gemini LEO 1525) under secondary electrons imaging (SEI) mode.
Prior to the electrochemical experiments, current collectors were applied by wrapping silver wires
(0.25 mm diameter, 99.99 % purity, Advent Materials Ltd, UK) along the cathode and on the exposed
part of the anode. Silver paste was employed to enhance the electric contact between wires and
electrode surfaces. A complete single cell with a typical length of 50 mm was then sealed into
alumina support tubes with ceramic sealant (Aremco Ceramic Sealant 552, USA) to construct a
complete reactor. Wires from both electrodes were connected to a PGSTAT302 N potentiostat with
with Nova 1.10.2 software (Metrohm Autolab B.V., Netherlands). The base case study was conducted
between 650-800 °C, with 50 cm3 min-1 of dry H2 fuel fed to the anode and ambient air to the
cathode. For measurements with simulated LCVGs, dry hydrogen was replaced by a mixture of CH4
and CO2 (total flow rate 50 cm3 min-1, CH4 concentration of 10, 15 and 20 %). Electrochemical
impedance spectroscopy (EIS, 10 mV p-p amplitude) was conducted under open-circuit conditions
over the frequency range of 105-10-2 Hz.
Techno-economic evaluation
Outline: The techno-economic analysis was conducted using a model developed previously [1]. In
general, various types of costs, including the fixed cost (capital expenditure (CAPEX), auxiliary
equipment, maintenance) and operating expenditure (OPEX) (reactant cost, heating and electrical
energy input) were estimated together with the profit of generated electricity. To achieve a
profitable operation, an electricity price threshold should be first determined, at which the revenue
generated from electricity sales will exceed the costs of running the plant.

Plant overview: There are various sources of LCVGs. For example, the Natuna field in Indonesia is the
largest gas field in south Asia, with approximately 1.2 trillion cubic metres of reserves and CO2
content up to 87 % [Journal of Natural Gas Chemistry 21(2012)7–10]. The daily production rate of an
exemplar natural gas well is set at 2 million metric cubic feet (MMCF) in this model.
Supplementary Figure S2 shows the proposed plant layout for using LCVGs as the fuel in a ceramic
fuel cell (without external reformer). Plant specifications, operating conditions and assumptions are
outlined in Supplementary Table S2.
Capital equipment costing: The ceramic fuel cell stack was sized based on its ‘reacted’ LCVG molar
throughput of 6.32 kmol hr-1 resulting in a required reactor area (Areactor, m2) of 135.5 m2 using
equation (S2),
(S2)𝐴𝑟𝑒𝑎𝑐𝑡𝑜𝑟 = 8𝐹
𝑑𝑛𝑑𝑡
×1𝑗
where F is the Faraday’s constant (96485 s A mol-1), dn/dt is the molar flow rates and j the current
density of the cell.
The purchase cost of equipment that is industrially available (i.e. blowers, heat exchangers and
furnace) was determined using cost correlations [3, 4]. The blowers (BA and BC, where A and C
denote the anode and cathode side, respectively) were sized according to the volumetric flow rates
of fuel and oxidants. The cost of ceramic fuel cell stack was estimated by doubling the material cost.
The mass of individual component, including yttria-stabilised zirconia (YSZ), nickel oxide, gadolinium-
doped ceria (GDC) and lanthanum strontium cobalt ferrite (LSCF), was calculated based on the
dimensions shown in Figure 1. Silver wires were selected to estimate the cost of current collector
(0.25 mm diameter). Using raw material prices of 71.6 $ kg-1, 1500 $ kg-1, 1000 $ kg-1, 74 $ kg-1 and
0.245 $ m-1 for YSZ, GDC, LSCF, NiO and silver wire respectively [5], the costs for SOFC stack
manufacture were estimated to be ca. $ 4100 m-2. CAPEX for all units installed was estimated using
Hand Factors (multiplying factor applied to the purchase costs), which are 2.5, 3.5, 2.5 and 2.0 for
fuel cell, heat exchangers, blowers and furnaces, respectively [3]. Thus, operating for 7500 years over
10 years, the capital expenditure (CAPEX) per tonne of LCVG was ca. $ 8.2, 69% of the CAPEX were
associated with the fuel cell stack.
Determining operating expenditure (OPEX): Maintenance cost was set at 10% of the CAPEX [6];
hence, $ 0.95 per tonne of LCVG. Energy required for fuel/oxidant blowers and furnaces were
estimated based on the change in specific heat of the streams per hour. Assumption was made that
unreacted effluent from anode (CO, H2 and CO2) to be burnt to provide energy that maintains
furnace temperature. The price of oxidant (compressed air) is $ 0.02 per cubic meters.

Supplementary figures
Supplementary Figure 1. a schematic diagram of the fabrication procedure of micro-monolithic
anode support; b optical microscope image of 6-nozzle spinneret and the formation of micro-
channels during phase inversion.

Supplementary Figure 2: Plant layout for ceramic fuel cells operating on LCVGs and air. (HX = heat
exchanger and B = blower)
Supplementary Figure 3. SEM photomicrographs of the anode/electrolyte/cathode interface.

Supplementary Figure 4. Fitted impedance spectra at (a) to (d): 550 to 700 °C with dry H2 as the fuel
and ambient air as oxidant, using the an equivalent circuit LRs(R1||CPE1)(R2||CPE2).

Supplementary Figure 5. CFD modelling of hydrogen molar fraction profile under current densities of
1, 2, and 4 A cm-2. a-c. 100% hydrogen feed; d-f. 20% hydrogen feed 80% inert diluent.

Supplementary Figure 6. (Approximate) Effect of temperature on Gibbs energy change and
equilibrium constant (KT) of DRM reaction

Supplementary Figure 7. (Approximate) Effects of temperature on Gibbs energy change and
equilibrium constants (KT) of side reactions: a Boudouard reaction, b methane pyrolysis, c carbon
gasification.

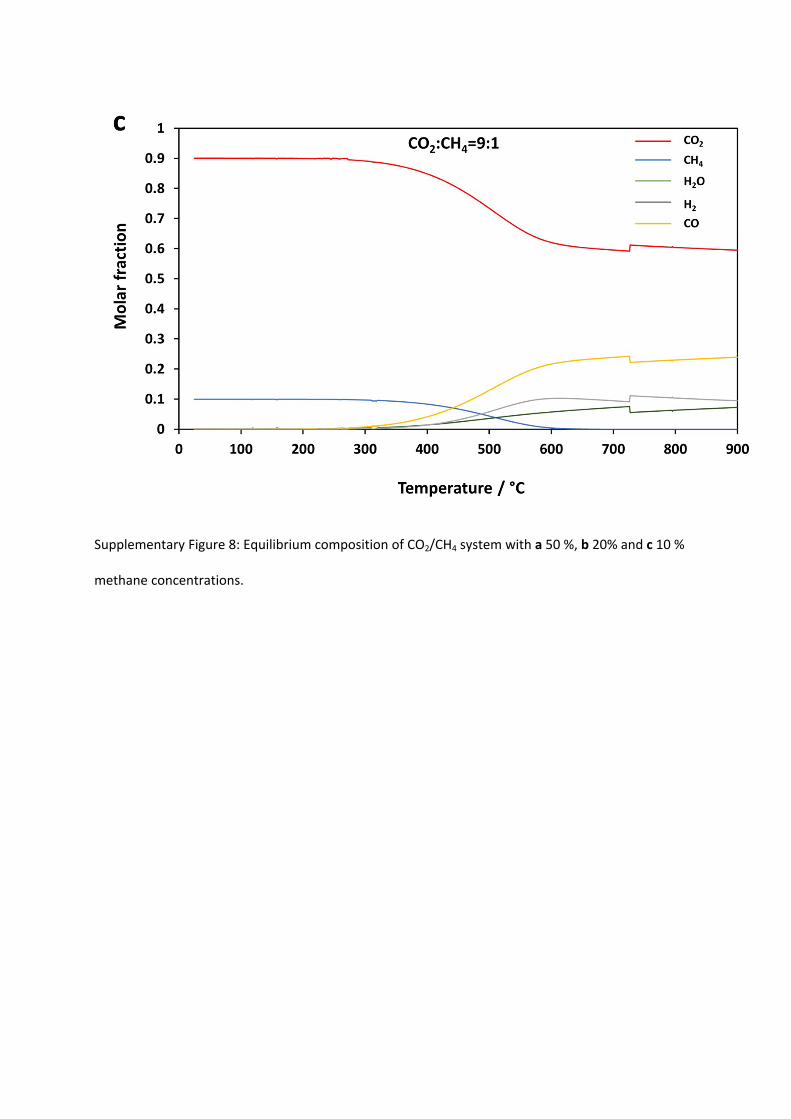
Supplementary Figure 8: Equilibrium composition of CO2/CH4 system with a 50 %, b 20% and c 10 %
methane concentrations.
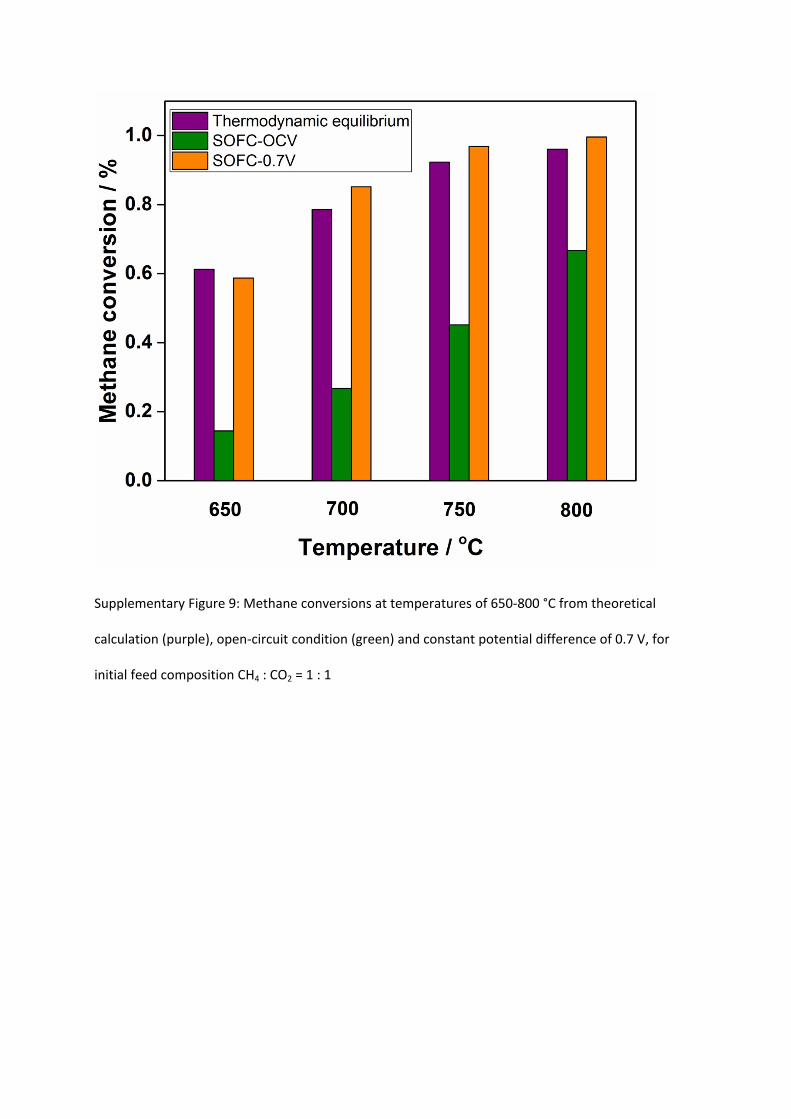
Supplementary Figure 9: Methane conversions at temperatures of 650-800 °C from theoretical
calculation (purple), open-circuit condition (green) and constant potential difference of 0.7 V, for
initial feed composition CH4 : CO2 = 1 : 1

Supplementary Figure 10: Effect of electricity price on profitability for electrical energy generation
using ceramic fuel cells fuelled by LCVGs and air as oxidant, operated at 750 °C and 0.75 W cm-2.

Supplementary Figure 11: j-U curves for three identical cells operated at (a)650 °C with H2 fuel and
(b) 700 °C with LCVG (20% CH4) fuel.
.

Supplementary tables
Supplementary Table 1. Suspension compositions and fabrication conditions of micro-monolithic anode substrates
Ceramic (wt.%) 66.3 (NiO:YSZ=3:2)
Solvent (wt.%) 26.5
PMMA (wt.%) 6.6
Suspension
compositions
Additive (wt.%) 0.5
Extrusion rate (cm3
min-1)9
Bore liquid rate
(cm3 min-1)13
Fabrication
parameters
Air gap (mm) 5
Temperature (°C) 1400Sintering conditions
Dwell time (h) 6
Supplementary Table 2. The fitted results of EIS in Fig. 2 (b) using LRs(R1||CPE1)(R2||CPE2), as the equivalent circuit
Temperature
(°C)Rs (Ω cm2) R1 (Ω cm2) CPE-T1 CPE-P1 R2 (Ω cm2) CPE-T2 CPE-P2
550 0.69 1.53 0.00329 0.65 0.16 0.164 0.92
600 0.37 0.92 0.00347 0.67 0.15 0.139 0.95
650 0.29 0.59 0.00468 0.66 0.16 0.112 1.06
700 0.18 0.40 0.00651 0.65 0.16 0.129 1.06

Supplementary Table 3. Plant Specifications for 4 tonne of LCVG treated per hour
Operating conditions Values Reference and comments
Temperature 750 °C
Cell potential difference 0.75 V Peak-power density (0.75 W cm-2)
Current density 1 A cm-2 Peak-power density (0.75 W cm-2)
CH4 conversion 99 %
Utilisation of LCVGs 60 % off-gases are burnt to pre-heat the gases and maintain the temperature within the furnace.
Reactant gases supply temperatures
25 °C Gases are pre-heated before entering the stack using heat exchangers and furnace.
Pressure 0.1 MPa
Plant life-time 10 years With a SOFC stack life of 5 years, operating for 7500 hours a year.
References
[1] Li, T. et al. A highly-robust solid oxide fuel cell (SOFC): simultaneous greenhouse gas treatment
and clean energy generation. Energy Environ. Sci. 9, 3682-3686, doi:10.1039/c6ee02562e (2016).
[2] L. S. Tan. Et al. Removal of high concentration CO2 from natural gas at elevated pressure via
absorption process in packed column. Journal of natural Gas Chemistry, 21, 7-10, (2012)
[3] R. Sinnott and G. Towler, Chemical Engineering Design, 5th Edition, Oxford, UK, Butterworth-
Heinemann, 2009.
[4] Matches, ‘Matches’ Process Equipment Cost Estimates’,
http://www.matche.com/equipcost/Default.html , 2014 (accessed 12/08/2016).
[5] L. Kleiminger, ‘Solid oxide electrochemical reactors and processes for CO2 and H2O splitting’, Ph.D
Thesis, Imperial College London, UK, 2015.