CONVERSION OF FLOTATION PROCESSING USING …scindeks-clanci.ceon.rs/data/pdf/2334-8836/2015/... ·...
16
No. 2, 2015 Mining & Metallurgy Engineering Bor 13 MINING AND METALLURGY INSTITUTE BOR ISSN: 2334-8836 (Štampano izdanje) UDK: 622 ISSN: 2406-1395 (Online) UDK: 66.061:330.1(045)=111 DOI:10.5937/MMEB1502013V Zoran Vaduvesković * , Daniel Kržanović * , Nenad Vušović ** CONVERSION OF FLOTATION PROCESSING USING THE HEAP LEACHING METHOD IN THE MINE CEMENTACIJA – KRAKU BUGARESKU IN THE COPPER MINE BOR *** Abstract RTB Bor is planning to expand the capacity of mining and processing at the Cementacija Kraku Bugaresku site from the current 2.5 million tons per year to 5.5 million. The current processing techno- logy - the classic flotation of the entire excavated ore, without the separation of oxide and sulfide ores, due to the low copper recovery from oxide ore, has achieved the modest financial results. This article discusses an alternative method of copper obtaining using the hydrometallurgical heap leaching and SX / EW extraction method from leach solutions, in terms of economics, i.e. comparative analysis of cash flow and discounted cash flow for both cases (scenarios). The analysis is performed in a software for strategic planning and design in mining - Whittle Fx , with the input techno-economic data for both cases [7]. Due to the frequent breakdowns and causing the accidental situations on the current infrastructure installations of the processing plants, pipeline for pulp-hydro transport from the site to the flotation plant, in conclusion, to emphasize the comparative advantages of hydrometallurgical processing are emphasized in the conclusion not only in terms of the economy but also the environmental protection. In the world, the world's largest copper producers have a tendency to make, besides copper is necessary and valuable metal, also the "green" metal. Keywords: heap leaching, hydrometallurgy, oxide ore, sulfide ore, long-term dynamics of produc- tion, cash flow, discounted cash flow * Mining and Metallurgy Institute Bor, Zeleni bulevar 35,Srbija ** Technical Faculty Bor, University in Belgrade, Vojske Jugoslavije 12, 19210 Bor, Serbia *** This work is within the Projects of technological development TR33038 “Improving Technology of Exploitation and Processing of Copper Ore with Monitoring the Living and Working Environment in the RTB Bor Group” and TR34004 “The New Production Line for Copper Production by Solvent Extraction of Mine Water”, funded by the Ministry of Education, Science and Technological Deve- lopment of the Republic of Serbia 1 INTRODUCTION The deposit Cementacija Kraku Buga- resku has begun the exploitation in 1990 by the investment works in stripping the deposit at the site Cementacija 1. The name of the ore body and complex of ore bodies consis- ting of Cementacija 1, 2, 3 and 4 talks about the nature of theses ore bodies. It is a cemen- tation zone of secondary enrichment with about 40% of oxide ore, mostly at levels near the surface, which is relatively poor to the flotation process. Flotation copper re- covery from the ore has shown in the previ- ous work a slightly higher level than 50%. Combining the processing methods - flota- tion of sulfide ore with maximum 10% of oxide (considered not have a negative effect on the recovery coefficient in the flotation) will achieve a significantly better economic effects [1], but the problem is in the possibi- lity of selective excavation and separation of the aforementioned types of ore - sulphide and oxide.
Transcript of CONVERSION OF FLOTATION PROCESSING USING …scindeks-clanci.ceon.rs/data/pdf/2334-8836/2015/... ·...
No. 2, 2015 Mining & Metallurgy Engineering Bor 13
MINING AND METALLURGY INSTITUTE BOR ISSN: 2334-8836 (Štampano izdanje)
UDK: 622 ISSN: 2406-1395 (Online)
UDK: 66.061:330.1(045)=111 DOI:10.5937/MMEB1502013V
Zoran Vaduvesković*, Daniel Kržanović*, Nenad Vušović**
CONVERSION OF FLOTATION PROCESSING USING
THE HEAP LEACHING METHOD IN THE MINE CEMENTACIJA –
KRAKU BUGARESKU IN THE COPPER MINE BOR***
Abstract
RTB Bor is planning to expand the capacity of mining and processing at the Cementacija Kraku Bugaresku site from the current 2.5 million tons per year to 5.5 million. The current processing techno-logy - the classic flotation of the entire excavated ore, without the separation of oxide and sulfide ores, due to the low copper recovery from oxide ore, has achieved the modest financial results. This article discusses an alternative method of copper obtaining using the hydrometallurgical heap leaching and SX / EW extraction method from leach solutions, in terms of economics, i.e. comparative analysis of cash flow and discounted cash flow for both cases (scenarios). The analysis is performed in a software for strategic planning and design in mining - Whittle Fx , with the input techno-economic data for both cases [7].
Due to the frequent breakdowns and causing the accidental situations on the current infrastructure
installations of the processing plants, pipeline for pulp-hydro transport from the site to the flotation
plant, in conclusion, to emphasize the comparative advantages of hydrometallurgical processing are
emphasized in the conclusion not only in terms of the economy but also the environmental protection. In
the world, the world's largest copper producers have a tendency to make, besides copper is necessary
and valuable metal, also the "green" metal.
Keywords: heap leaching, hydrometallurgy, oxide ore, sulfide ore, long-term dynamics of produc-
tion, cash flow, discounted cash flow
* Mining and Metallurgy Institute Bor, Zeleni bulevar 35,Srbija
** Technical Faculty Bor, University in Belgrade, Vojske Jugoslavije 12, 19210 Bor, Serbia
*** This work is within the Projects of technological development TR33038 “Improving Technology of
Exploitation and Processing of Copper Ore with Monitoring the Living and Working Environment
in the RTB Bor Group” and TR34004 “The New Production Line for Copper Production by Solvent
Extraction of Mine Water”, funded by the Ministry of Education, Science and Technological Deve-
lopment of the Republic of Serbia
1 INTRODUCTION
The deposit Cementacija Kraku Buga-resku has begun the exploitation in 1990 by the investment works in stripping the deposit at the site Cementacija 1. The name of the ore body and complex of ore bodies consis-ting of Cementacija 1, 2, 3 and 4 talks about the nature of theses ore bodies. It is a cemen-tation zone of secondary enrichment with about 40% of oxide ore, mostly at levels near the surface, which is relatively poor to the flotation process. Flotation copper re-
covery from the ore has shown in the previ-ous work a slightly higher level than 50%. Combining the processing methods - flota-tion of sulfide ore with maximum 10% of oxide (considered not have a negative effect on the recovery coefficient in the flotation) will achieve a significantly better economic effects [1], but the problem is in the possibi-lity of selective excavation and separation of the aforementioned types of ore - sulphide and oxide.

No. 2, 2015 Mining & Metallurgy Engineering Bor 14
2 DESCRIPTION OF THE PROBLEM
The major problem is in fact that the
flotation processing on the deposit is only
to the level of pulp obtaining, i.e. grinding
and then concentration, and then thepulp
is transported by hydrotransport for fur-
ther processing in the Flotation Plant
Veliki Krivelj. In addition to the increased
costs of flotation process, this processing
method is also very unfavorable from the
aspect of environmental protection due to
the frequent accidents on the pipeline and
consequences for the environment. (The
last one happened in mid-April 2014).
As with the opening of mine, the manner
and type of processing were influenced by a
lobby for "environmental protection" The
decision on the processing method was so
made without the expert analyses, not taking
into account the nature of the deposit (con-
tent over 40% of oxide ore). According to
the leaching method, not only due to its po-
tential impact on the environment, but with-
out a detailed knowledge of these matters, an
animosity was created even to mention the
acid, or cyanide, which are, by their nature,
toxic. During the current exploitation a part
of deposit, it was proved that the adopted
and applied method does not give good eco-
nomic effects, but also is a major polluter of
the environment.
One example of the total conversion of
pyrometallurgical process - flotation method
of concentration and classical smelting of
concentrate with electrolytic anode disso-
ciation, hydrometallurgical process, i.e. heap
leaching in combination with the "in situ"
leaching assisted by bacterial leaching was
applied to the mine Morenci of the Phelps
Dodge company, Arizona [7] in early 2001.
The existing facilities for concentration were
put into a "stand by" condition while the
smelter was previously relocated to a place
Chino, Mexico.
In addition to this example, where the
daily processing is about 75,000 tons of ore
(about 360,000 tons of copper a year), the
examples of total conversion of pyrometa-
llurgical process are are in Cerro Verde,
(1993 - 15,000 t/d), Zaldivar (1992 - 20,000
t/d) in Peru, and Kuebrada Blanca (1,993 to
17,300 t/d) in Chile, and many other mines.
The benefits are multiple, the significant
energy savings through reducing the total
cost of production per tone of copper, whose
purity is 99.99%, to the "clear sky" or
environmental protection. It is also a way
that the activities of copper exploitation and
production leave behind them waste as less
as possible.
3 COMPARATIVE ANALYSIS OF
THE ECONOMIC EFFICIENCY OF
CLASSICAL METHOD AND
LEACHING METHOD WITH
SX/EW EXTRACTION MODE
The analysis was carried out based on
the literature techno-economic data for the
"heap leaching" method and hydrometal-
lurgical extraction process SX/EW, but
bearing in mind the specificity of the ce-
mentation deposit Kraku Bugaresku both
from the aspect of ore mineralogy in the
deposit and the possibility of using this
method, and from the aspect of a com-
parative cost data in relation to the classi-
cal processing method for which the rele-
vant (known) data were used.
The following Table presents the techno-
economic data with which the analysis was
carried out in software for strategic planning
in mining, Whittle Fx, whose working prin-
ciple is based on the Lerch Grosmmann
algorithm.

No. 2, 2015 Mining & Metallurgy Engineering Bor 15
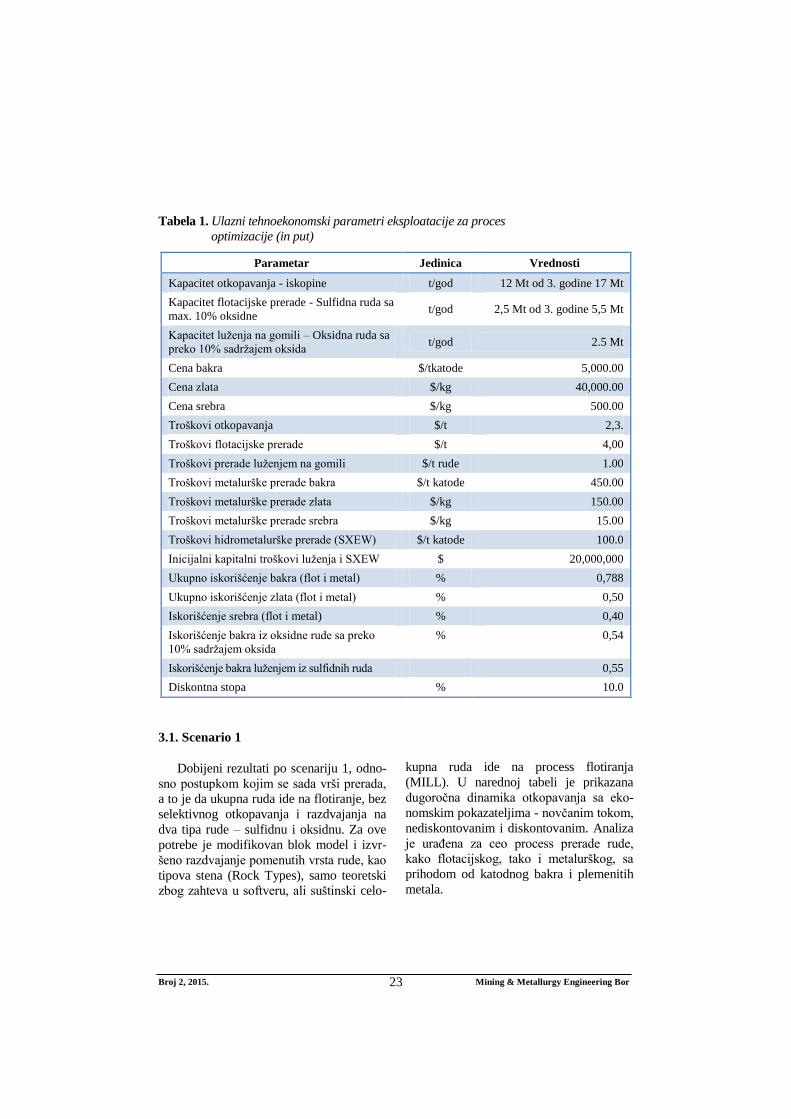
Table 1 Input techno-economic parameters of exploitation for the
optimization process
Parameter Unit Values
Excavation capacity - excavations t/year 12 Mt from 3rd year 17 Mt
Capacity of flotation processing – Sulfide
ore with max. 10% oxide t/year 2.5 Mt from 3rd year 5.5 Mt
Capacity of heap leaching – Oxide ore with
over 10% of oxide content t/year 2.5 Mt
Copper price $/t cathode 5,000.00
Gold price $/kg 40,000.00
Silver price $/kg 500.00
Excavation costs $/t 2,3.
Costs of flotation processing $/t 4,00
Processing costs of heap leaching $/t ore 1.00
Costs of metallurgical copper treatment $/t cathode 450.00
Costs of metallurgical gold treatment $/kg 150.00
Costs of metallurgical silver treatment $/kg 15.00
Costs of hydrometallurgical processing
(SXEW) $/t cathode 100.0
Initial capital costs of leaching and SXEW $ 20,000,000
Total copper recovery (flot,and metallurgy) % 0.788
Total gold recovery (flot,and metallurgy) % 0.50
Silver recovery (flot,and metallurgy) % 0.40
Copper recovery from oxide ore with over
10% of oxide content % 0.54
Copper recovery by leaching from sulfide ore 0.55
Discount rate % 10.0
3.1 Scenario 1
The obtained results by Scenario 1, or
the current processing process, i.e. total ore
undergoes to the flotation, without selective
excavation and separation on two types of
ore - sulphide and oxide. For this purpose,
a block model was modified and the
aforementioned types of ore were separat-
ed, as well as rock types only theoretical
due to the demands in the software, but
essentially the whole ore undergoes to the
flotation process (mill). Table below shows
the long-term dynamics of excavation with
the economic indicators - cash flow, undis-
counted and discounted. The analysis was
done for the whole process of ore pro-
cessing, both flotation and metallurgical,
with the revenue of cathode copper and
precious metals.

No. 2, 2015 Mining & Metallurgy Engineering Bor 16
Table 2 Long-term dynamics of excavation by Scenario 1, analyzed in the software
Whittle Fx
Figure 1 Graphical presentation of the long-term dynamics of excavation by
Scenario 1 – flotation processing
3.2 Scenario 2
According to the second Scenario, due to
the above given facts and plans of RTB Bor
Group – Copper Mine Bor, which owns the
concerned mine, to increase the capacity of
excavation at this site for the flotation
processing to 5,500,000 t, is the use of
leaching method for processing of these
amounts [7]. The oxide ore with oxide con-
tent of up to 10% during leaching was con-
sidered with the recovery coefficient of 0.7,
PB: 19, 26,35
Units Units
tonne input Grade tonne input Grade Grade Grade Grade Grade Open pit Open pit
tonne Waste Strip input RSUL input input ROXD input input input input input cashflow cashflow
Period input tonne ratio RSUL CU CUS ROXD CU CUOX CU PRCU AU AG $ $ disc
x 100 x100
1 2,497,779 9,502,221 3.8 601,834 241,726 0.2449 1,895,945 462,625 0.0413 0.282 15.4797 0.0753 1.1065 -9,847,862 -8,952,602
2 2,499,693 9,500,307 3.8 917,321 451,536 0.3076 1,582,372 426,201 0.0484 0.3511 15.7806 0.0802 1.0753 -3,387,689 -2,799,743
3 5,495,999 11,504,001 2.09 1,769,556 816,733 0.2808 3,726,443 952,774 0.0458 0.322 16.0559 0.0718 1.0124 6,867,290 5,159,496
4 5,499,999 6,315,358 1.15 1,462,051 427,596 0.2038 4,037,947 887,950 0.0393 0.2392 16.1273 0.0693 1.1278 3,452,064 2,357,806
5 5,500,000 3,586,533 0.65 1,785,345 533,392 0.2303 3,714,655 929,696 0.0397 0.266 14.6026 0.0791 1.1537 15,477,799 9,610,495
6 5,500,000 2,599,697 0.47 2,570,586 823,796 0.2542 2,929,414 753,057 0.0361 0.2867 13.4667 0.0727 1.0313 20,814,587 11,749,292
7 5,500,000 1,403,682 0.26 3,146,090 1,044,249 0.2634 2,353,910 553,530 0.0301 0.2905 11.1239 0.0848 1.0792 28,194,533 14,468,253
8 5,499,999 1,557,531 0.28 4,021,808 1,109,667 0.2397 1,478,191 300,803 0.0186 0.2564 7.6091 0.0862 1.0487 23,064,615 10,759,813
9 5,500,000 1,263,215 0.23 5,082,426 1,282,422 0.2367 417,573 85,504 0.0133 0.2487 5.3879 0.0827 1.031 21,474,074 9,107,104
10 5,500,000 605,505 0.11 4,879,546 1,326,078 0.252 620,454 125,263 0.0133 0.2639 5.2266 0.0996 1.2105 27,995,708 10,793,557
11 5,500,000 271,792 0.05 5,017,944 1,395,811 0.2582 482,056 88,229 0.0129 0.2698 5.0344 0.0848 1.3015 28,542,461 10,003,959
12 2,969,102 34,036 0.01 2,916,661 803,531 0.2654 52,440 12,601 0.0105 0.2749 3.7942 0.0994 1.3529 17,194,580 5,724,357
57,462,571 48,143,878 34,171,168 23,291,400 179,842,160 77,981,787
SCENARIO 1_ SHEDULE GRAPPH
-$15,000,000
-$10,000,000
-$5,000,000
$0
$5,000,000
$10,000,000
$15,000,000
$20,000,000
$25,000,000
$30,000,000
$35,000,000
0
2,000,000
4,000,000
6,000,000
8,000,000
10,000,000
12,000,000
14,000,000
16,000,000
18,000,000
1 2 3 4 5 6 7 8 9 10 11 12
Cas
h F
low
w
Ton
nag
e (
t)
Period
SCENARIO 1 -Shedule graph
Waste tonne tonne input RSUL
input ROXD tonne input
Open pit cashflow $ Open pit cashflow $ disc
No. 2, 2015 Mining & Metallurgy Engineering Bor 17
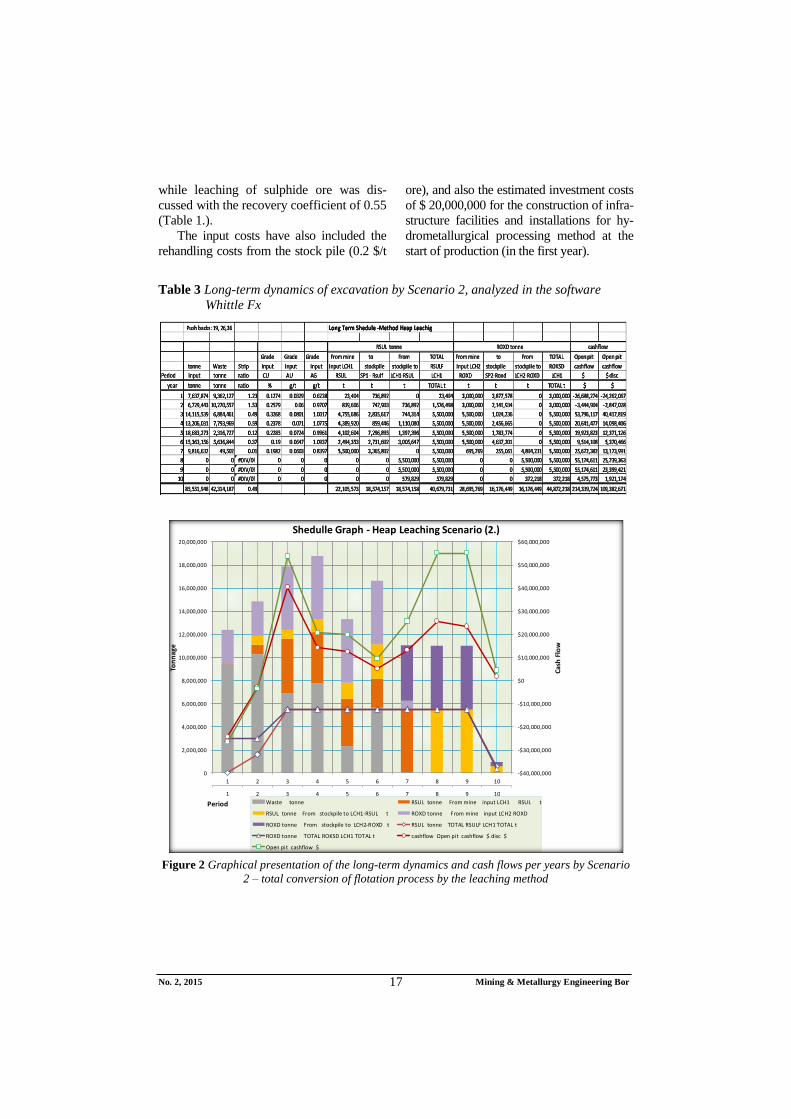
while leaching of sulphide ore was dis-
cussed with the recovery coefficient of 0.55
(Table 1.).
The input costs have also included the
rehandling costs from the stock pile (0.2 $/t
ore), and also the estimated investment costs
of $ 20,000,000 for the construction of infra-
structure facilities and installations for hy-
drometallurgical processing method at the
start of production (in the first year).
Table 3 Long-term dynamics of excavation by Scenario 2, analyzed in the software
Whittle Fx
Figure 2 Graphical presentation of the long-term dynamics and cash flows per years by Scenario
2 – total conversion of flotation process by the leaching method
Long Term Shedule -Method Heap Leachig
Grade Grade Grade From mine to From TOTAL From mine to From TOTAL Open pit Open pit
tonne Waste Strip input input input input LCH1 stockpile stockpile to RSULF input LCH2 stockpile stockpile to ROKSD cashflow cashflow
Period input tonne ratio CU AU AG RSUL SP1 - Rsulf LCH1-RSUL LCH1 ROXD SP2-Roxd LCH2-ROXD LCH1 $ $ disc
year tonne tonne ratio % g/t g/t t t t TOTAL t t t t TOTAL t $ $
1 7,637,874 9,362,127 1.23 0.1274 0.0329 0.6228 23,404 736,892 0 23,404 3,000,000 3,877,578 0 3,000,000 -26,688,274 -24,262,067
2 6,729,443 10,270,557 1.53 0.2579 0.06 0.9707 839,606 747,903 736,892 1,576,498 3,000,000 2,141,934 0 3,000,000 -3,444,904 -2,847,028
3 14,115,539 6,884,461 0.49 0.3268 0.0801 1.0017 4,755,686 2,835,617 744,314 5,500,000 5,500,000 1,024,236 0 5,500,000 53,796,117 40,417,819
4 13,206,031 7,793,969 0.59 0.2378 0.071 1.0775 4,389,920 859,446 1,110,080 5,500,000 5,500,000 2,456,665 0 5,500,000 20,641,477 14,098,406
5 18,683,273 2,316,727 0.12 0.2285 0.0724 0.9961 4,102,604 7,296,895 1,397,396 5,500,000 5,500,000 1,783,774 0 5,500,000 19,923,823 12,371,126
6 15,363,156 5,636,844 0.37 0.19 0.0647 1.0937 2,494,353 2,731,602 3,005,647 5,500,000 5,500,000 4,637,201 0 5,500,000 9,514,108 5,370,466
7 9,816,632 49,502 0.01 0.1982 0.0603 0.8397 5,500,000 3,365,802 0 5,500,000 695,769 255,061 4,804,231 5,500,000 25,672,382 13,173,991
8 0 0 #DIV/0! 0 0 0 0 0 5,500,000 5,500,000 0 0 5,500,000 5,500,000 55,174,611 25,739,363
9 0 0 #DIV/0! 0 0 0 0 0 5,500,000 5,500,000 0 0 5,500,000 5,500,000 55,174,611 23,399,421
10 0 0 #DIV/0! 0 0 0 0 0 579,829 579,829 0 0 372,218 372,218 4,575,773 1,921,174
85,551,948 42,314,187 0.49 22,105,573 18,574,157 18,574,158 40,679,731 28,695,769 16,176,449 16,176,449 44,872,218 214,339,724 109,382,671
Push backs: 19, 26,36
RSUL tonne ROXD tonne cashflow
1 2 3 4 5 6 7 8 9 10
-$40,000,000
-$30,000,000
-$20,000,000
-$10,000,000
$0
$10,000,000
$20,000,000
$30,000,000
$40,000,000
$50,000,000
$60,000,000
0
2,000,000
4,000,000
6,000,000
8,000,000
10,000,000
12,000,000
14,000,000
16,000,000
18,000,000
20,000,000
1 2 3 4 5 6 7 8 9 10
Cash
Flo
w
Ton
nag
e
Period
Shedulle Graph - Heap Leaching Scenario (2.)
Waste tonne RSUL tonne From mine input LCH1 RSUL t
RSUL tonne From stockpile to LCH1-RSUL t ROXD tonne From mine input LCH2 ROXD
ROXD tonne From stockpile to LCH2-ROXD t RSUL tonne TOTAL RSULF LCH1 TOTAL t
ROXD tonne TOTAL ROKSD LCH1 TOTAL t cashflow Open pit cashflow $ disc $
Open pit cashflow $

No. 2, 2015 Mining & Metallurgy Engineering Bor 18
Figure 3 Pie graph of sulphide and oxide ore participation in the leaching process
The obtained results by Scenario 2 are
with the use of storage technology (stock
pile), which serve as a buffer for the planned
processing capacity, but also have the option
of conducting the leaching time and shorten-
ing the period of total exploitation of the
planned long-term dynamics. It is important
to note that in recent years, when practically
the excavation at the open pit was complet-
ed, the leaching time and leaching capacity
can be adapted to the needs. Therefore,
whether the ore from the stock pile will be
processed for the time provided for the long-
term plan or shorter, depending on the input
of particle size distribution of ore, or from
the surface of openness of mineral grains
and thereby the leaching rate.
4 CONCLUSION
It can be seen from the following Fig-
ure 3, Tables and Graphs of the compara-
tive analysis results by Scenation 1 or
Scenatio 2, as well as from Tables 2 and 3
and Graphs 1 and 2 that:
1. Calculated Cash flow by the second
scenario is higher than by the first
(by which any capital costs are not
included for the capacity expansion);
2. That the exploitation period at the
open pit (mining period) by the se-
cond scenario is almost half shorter
than the first. The extended years of
the second scenario is the processing
of already excavated ore from the
stock pile. It certainly brings savings
that can be seen from the comparison
with the economy by scenario 1;
TOTA
L OR
E INP
UT FR
OM
MIN
E
From mine input LCH1 RSUL
To stockpile SP1 - Rsulf
From stockpile to LCH1-
RSUL
TOTAL RSULF LCH1
From mine input LCH2 ROXD
To stockpile SP2-Roxd
From stockpile to LCH2-ROXD
TOTAL ROKSD LCH1
PIE GRAPH - ORE INPUT TO PROCESS
No. 2, 2015 Mining & Metallurgy Engineering Bor 19
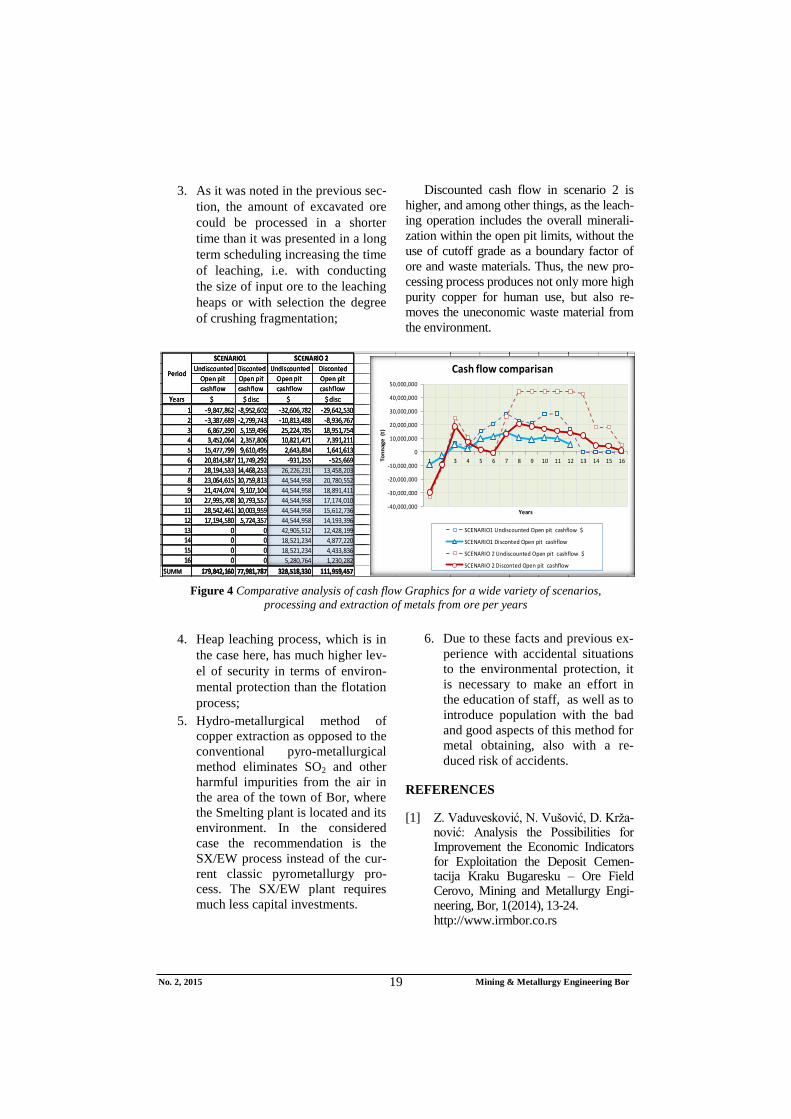
3. As it was noted in the previous sec-
tion, the amount of excavated ore
could be processed in a shorter
time than it was presented in a long
term scheduling increasing the time
of leaching, i.e. with conducting
the size of input ore to the leaching
heaps or with selection the degree
of crushing fragmentation;
Discounted cash flow in scenario 2 is
higher, and among other things, as the leach-
ing operation includes the overall minerali-
zation within the open pit limits, without the
use of cutoff grade as a boundary factor of
ore and waste materials. Thus, the new pro-
cessing process produces not only more high
purity copper for human use, but also re-
moves the uneconomic waste material from
the environment.
Figure 4 Comparative analysis of cash flow Graphics for a wide variety of scenarios,
processing and extraction of metals from ore per years
4. Heap leaching process, which is in
the case here, has much higher lev-
el of security in terms of environ-
mental protection than the flotation
process;
5. Hydro-metallurgical method of
copper extraction as opposed to the
conventional pyro-metallurgical
method eliminates SO2 and other
harmful impurities from the air in
the area of the town of Bor, where
the Smelting plant is located and its
environment. In the considered
case the recommendation is the
SX/EW process instead of the cur-
rent classic pyrometallurgy pro-
cess. The SX/EW plant requires
much less capital investments.
6. Due to these facts and previous ex-
perience with accidental situations
to the environmental protection, it
is necessary to make an effort in
the education of staff, as well as to
introduce population with the bad
and good aspects of this method for
metal obtaining, also with a re-
duced risk of accidents.
REFERENCES
[1] Z. Vaduvesković, N. Vušović, D. Krža-nović: Analysis the Possibilities for Improvement the Economic Indicators for Exploitation the Deposit Cemen-tacija Kraku Bugaresku – Ore Field Cerovo, Mining and Metallurgy Engi-neering, Bor, 1(2014), 13-24. http://www.irmbor.co.rs
Undiscounted Disconted Undiscounted Disconted
Open pit Open pit Open pit Open pit
cashflow cashflow cashflow cashflow
Years $ $ disc $ $ disc
1 -9,847,862 -8,952,602 -32,606,782 -29,642,530
2 -3,387,689 -2,799,743 -10,813,488 -8,936,767
3 6,867,290 5,159,496 25,224,785 18,951,754
4 3,452,064 2,357,806 10,821,471 7,391,211
5 15,477,799 9,610,495 2,643,834 1,641,613
6 20,814,587 11,749,292 -931,255 -525,669
7 28,194,533 14,468,253 26,226,231 13,458,203
8 23,064,615 10,759,813 44,544,958 20,780,552
9 21,474,074 9,107,104 44,544,958 18,891,411
10 27,995,708 10,793,557 44,544,958 17,174,010
11 28,542,461 10,003,959 44,544,958 15,612,736
12 17,194,580 5,724,357 44,544,958 14,193,396
13 0 0 42,905,512 12,428,199
14 0 0 18,521,234 4,877,220
15 0 0 18,521,234 4,433,836
16 0 0 5,280,764 1,230,282
SUMM 179,842,160 77,981,787 328,518,330 111,959,457
SCENARIO 2SCENARIO1
Period
-40,000,000
-30,000,000
-20,000,000
-10,000,000
0
10,000,000
20,000,000
30,000,000
40,000,000
50,000,000
1 2 3 4 5 6 7 8 9 10 11 12 13 14 15 16To
nn
ag
e (
t)
Years
Cash flow comparisan
SCENARIO1 Undiscounted Open pit cashflow $
SCENARIO1 Disconted Open pit cashflow
SCENARIO 2 Undiscounted Open pit cashflow $
SCENARIO 2 Disconted Open pit cashflow
No. 2, 2015 Mining & Metallurgy Engineering Bor 20
[2] William H. Dreshe: How Hydrometa-
llurgy and the SX/EW Process Made
Copper the "Green" Metal, Copper
Applications in Mining & Metallurgy
http://www.copper.org/publications/ne
wsletters,innovations, A copper
Alliance member.
[3] J. Peacey, GUO Xian-Jian, E. Robles:
Copper Hydrometallurgy-Current
Status, Preliminary Economics, Future
Direction and Positioning Versus
Smelting, Hatch Associates Ltd., 2800
Speakman Drive, Mississauga, Ontario
L5K 2R7,Canada; Hatch Ingenierosy
Consultores Ltd., San Sebastian 283,
Piso 9, Los Condes, Santiago 6760226,
Chile.
http://www. d.wanfangdata.com.cn
[4] J. F. Lupo: Design and Operation of
Heap Leach Pads by, Ph.D.Golder
Asociates. The Jornal of the Soutern
Institute of Mining and Metallurgy,
Decembar, 2012, Vol. 112.
www.ausimm.com.au/co
.
[5] Carlos Avendaño Varas: Review on
Heap Leaching of Copper Ores, LX
Users Conferencea Chile, La Serena,
Junio 2004. Chemical Engenieer,
Sociedad Terral S.A.
[6] R. Denis, M. Marcotte:1,7 Million
Square Meters PVC Heap Leach Pad
Case History, Solmax International
Inc., Varennes, Qc., Canada, Genivar,
Montreal, Draft paper submitted for
publication GeoAfrica 2009.
[7] Phelps Dodge Morenci Has Converted
All Copper Production to Mine-for-
Leach, Copper Applications in Mining
& MetallurgyBy William H. Dresher,
Ph.D.,.E.P.E.
http://www.copper.org/publications/ne
wsletters,innovations.
[8] Whittle Strategic Mine Planning,
Gemcom Whittle™ Copyright © 2012
Gemcom Software International Inc.
[9] G. Hovanec, Review the Basic Eco-
nomic Aspects of Copper Production
by the Process of Acid Leaching,
Research Associate for mineral pro-
cessing materials in the Mining
Institute, Belgrade.

Broj 2, 2015. Mining & Metallurgy Engineering Bor 21
INSTITUT ZA RUDARSTVO I METALURGIJU BOR ISSN: 2334-8836 (Štampano izdanje)
UDK: 622 ISSN: 2406-1395 (Online)
UDK: 66.061:330.1(045)=163.41 DOI:10.5937/MMEB1502013V
Zoran Vaduvesković*, Daniel Kržanović*, Nenad Vušović**
KONVERZIJA FLOTACIJSKE PRERADE POSTUPKOM
LUŽENJA NA GOMILI NA RUDNIKU CEMENTACIJA –
KRAKU BUGARESKU U RUDNIKU BAKRA BOR***
Izvod
RTB Bor planira proširenje kapaciteta otkopavanja i prerade na ležištu Cementacija Kraku
Bugaresku sa sadašnjih 2,5 miliona tona godišnje, na 5,5 miliona. Postojećom tehnologijom prerade,
klasičnim flotiranjem celokupne otkopane rude, bez selektivnog otkopavanja i razdvanja sulfidne od
oksidne, zbog niskog iskorišćenja metala iz rude, postižu se skromni finansijski efekti. Rad razmatra
kompletnu konverziju sadašnjeg načina eksploatacije, hidrometalurškim dobijanjem bakra luženjem
na gomili i SX/EW metodom ekstrakcije iz lužnog rastvora, sa aspekta ekonomije, uporednom anali-
zom novčanog i diskontovanog novčanog toka za oba slučaja (scenarija - sadašnji način flotiranjem i
alternativni - luženjem). Analiza je urađena u softveru za strateško planiranje u rudarstvu-Whittle Fx,
sa ulaznim tehnoekonomskim podacima za jedan i drugi slučaj [7].
Zbog učestalih havarija i izazivanja akcedentnih situacija na postojećim infrastrukturnim instala-
cijama postrojenja prerade, cevovodu za hidrotransport pulpe, u zaključku se ističu i komparativne
prednosti hidrometalurške prerade ne samo sa aspekta ekonomije nego i zaštite životne sredine. U
svetu, kod najvećih svetskih proizvođača bakra, tendencija je da se bakar učini pored skupocenog i
“zelenim” metalom.
Ključne reči: luženje na gomili, hidrometalurgija, oksidna ruda, sulfidna ruda, dugoročna dina-
mika proizvodnje, novčani tok, diskontovani novčani tok
* Institut za rudarstvo i metalurgiju Bor, Zeleni bulevar 35,Srbija
** Tehnički fakultet Bor, Univerziteta u Beogradu, Vojske Jugoslavije 12, 19210 Bor, Srbija
*** Članak je u sklopu projekata tehnološkog razvoja TR 33038 “Usavršavanje tehnologija eksploa-
tacije i prerade rude bakra sa monitoringom životne i radne sredine u RTB Bor Grupa” i TR 34004
“Nova proizvodna linija za dobijanje bakra solventnom ekstrakcijom rudničkih voda”, koji su
finansirani od strane Ministarstva prosvete, nauke i tehnološkog razvoja Republike Srbije
1. UVOD
Ležište Cementacija Kraku Bugaresku je
započelo sa eksploatacijom 1990. godine,
investicionim radovima na raskrivanju
ležištu, na lokaciji Cementacija 1. Sam naziv
rudnog tela i kompleksa rudnih tela koji se
sastoji od Cementacije 1, 2, 3 i 4, govori o
prirodi ovih rudnih tela. Radi se o cementa-
cionoj zoni sekundarnog obogaćenja, sa oko
40% oksidne rude, najviše na nivoima bli-
žim površini, koja se relativno slabo flotira.
Flotacijsko iskorišćenje bakra iz rude je,
pokazalo se u dosadašnjem radu, nivoa nešto
većeg od 50%. Kombinacijom metoda pre-
rade - flotiranjem sulfidne rude sa maksi-
malno 10% oksidne (smatra se da se pri
tome ne utiče negativno na koeficijent
iskorišćenja u flotaciji) postigli bi se znatno
bolji ekonomski efekti [1], međutim prob-
lem je u mogućnostima selektivnog otkopa-
vanja i izdvajanju pomenutih tipova rude –
sulfidne i oksidne.

Broj 2, 2015. Mining & Metallurgy Engineering Bor 22
2. OPIS PROBLEMATIKE
Veliki problem je i što je na samom
ležištu flotacijska prerada samo do nivoa
dobijanja pulpe, tj. mlevenja i nakon toga
zgušnjavanja, a zatim se hidrotransportom
pulpa transportuje na dalju preradu u flota-
ciju Veliki Krivelj. Osim povećanih troško-
va flotiranja, ovakav način prerade je vrlo
nepovoljan i sa aspekta zaštite životne
sredine zbog čestih akcidenata na cevovodu
i posledica po okolinu. (Poslednji takav
desio se polovinom aprila 2014. godine).
Kao i prilikom otvaranja rudnika, na
način i vrstu prerade veliki uticaj je imao
lobi za “zaštitu životne sredine” Odluka o
metodi prerade je tako donešena bez stru-
čnih analiza, ne vodeći računa o prirodi
ležišta (sadržaj preko 40% oksidne rude).
Prema metodi luženja, ne samo zbog njenog
eventualnog uticaja na životnu sredinu, ali
bez detaljnog poznavanja ove problematike,
stvoren je animozitet čak zbog same pomene
kiseline, odnosno cijanida koji su, po svojoj
prirodi, otrovni. Tokom dosadašnje eksploa-
tacije dela ležišta, pokazalo se da usvojena i
primenjena metoda ne samo da ne daje
dobre ekonomske efekte, nego je i veliki
zagađivač okoline.
Jedan od primera totalne konverzije piro-
metalurškog procesa – flotacijske metode
koncentracije i klasičnog topljenja koncen-
trata sa elektrolitičkom disocijacijom anode,
hidrometalurškim procesom tj. luženjem na
gomili u kombinaciji sa “in situ” luženjem
potpomognutim bakterijskim luženjem, pri-
menjen je na rudniku, Morenci kompanije
Phelps Dodge, Arizona [7], početkom 2001.
godine. Postojeći objekti za koncentraciju su
stavljeni u stanje “stand by”, dok je topio-
nica prethodno izmeštena u mesto Chino, u
Meksiku.
Osim ovog primera, gde se dnevno
prerađuje o ko 75.000 t rude (oko 360.000 t
bakra godišnje), primeri totalne konverzije
pirometalurškog procesa su još u Cerro
Verde (1993 - 15.000 t/d), Zaldivar (1992 -
~ 20.000 t/d) u Peru-u, i Kuebrada Blanka
(1993 - 17.300 t/d) u Čileu, i mnogi drugi
rudnici.
Koristi su višestruke, od značajne uštede
energije, preko smanjenja ukupnih troškova
proizvodnje po toni bakra, čija je čistoća
99,99%, do “čistog neba” odnosno zaštite
životne sredine. To je takođe način da
aktivnosti eksploatacije i dobijanja bakra, iza
sebe ostavljaju što manje otpada.
3. UPOREDNA ANALIZA
EKONOMSKE EFIKASNOSTI
KLASIČNE METODE I METODE
LUŽENJA SA SX/EW NAČINOM
EKSTRAKCIJE
Analiza je sprovedena na bazi litera-
turnih tehnoekonomskih podataka za meto-
du “Heap Leaching” i hidrometalurški
proces ekstrakcije SX/EW, ali imajući u
vidu specifičnosti ležišta cementacija Kraku
Bugaresku, kako sa aspekta mineralogije
rude u ležištu i mogućnosti primene ove
metode, tako i sa aspekta uporednih
troškovnih podataka u odnosu na klasičan
način prerade, za koji su korišćeni relevantni
(poznati) podaci.
U sledećoj tabeli prikazani su tehno-
ekonomski podaci sa kojima je analiza
urađena u softveru za strateško planiranje u
rudarstvu, Whittle Fx, čiji je princip rada na
osnovu Lerch Grosmmann algoritma.
Broj 2, 2015. Mining & Metallurgy Engineering Bor 23
Tabela 1. Ulazni tehnoekonomski parametri eksploatacije za proces
optimizacije (in put)
Parametar Jedinica Vrednosti
Kapacitet otkopavanja - iskopine t/god 12 Mt od 3. godine 17 Mt
Kapacitet flotacijske prerade - Sulfidna ruda sa
max. 10% oksidne t/god 2,5 Mt od 3. godine 5,5 Mt
Kapacitet luženja na gomili – Oksidna ruda sa
preko 10% sadržajem oksida t/god 2.5 Mt
Cena bakra $/tkatode 5,000.00
Cena zlata $/kg 40,000.00
Cena srebra $/kg 500.00
Troškovi otkopavanja $/t 2,3.
Troškovi flotacijske prerade $/t 4,00
Troškovi prerade luženjem na gomili $/t rude 1.00
Troškovi metalurške prerade bakra $/t katode 450.00
Troškovi metalurške prerade zlata $/kg 150.00
Troškovi metalurške prerade srebra $/kg 15.00
Troškovi hidrometalurške prerade (SXEW) $/t katode 100.0
Inicijalni kapitalni troškovi luženja i SXEW $ 20,000,000
Ukupno iskorišćenje bakra (flot i metal) % 0,788
Ukupno iskorišćenje zlata (flot i metal) % 0,50
Iskorišćenje srebra (flot i metal) % 0,40
Iskorišćenje bakra iz oksidne rude sa preko
10% sadržajem oksida
% 0,54
Iskorišćenje bakra luženjem iz sulfidnih ruda 0,55
Diskontna stopa % 10.0
3.1. Scenario 1
Dobijeni rezultati po scenariju 1, odno-
sno postupkom kojim se sada vrši prerada,
a to je da ukupna ruda ide na flotiranje, bez
selektivnog otkopavanja i razdvajanja na
dva tipa rude – sulfidnu i oksidnu. Za ove
potrebe je modifikovan blok model i izvr-
šeno razdvajanje pomenutih vrsta rude, kao
tipova stena (Rock Types), samo teoretski
zbog zahteva u softveru, ali suštinski celo-
kupna ruda ide na process flotiranja
(MILL). U narednoj tabeli je prikazana
dugoročna dinamika otkopavanja sa eko-
nomskim pokazateljima - novčanim tokom,
nediskontovanim i diskontovanim. Analiza
je urađena za ceo process prerade rude,
kako flotacijskog, tako i metalurškog, sa
prihodom od katodnog bakra i plemenitih
metala.
Broj 2, 2015. Mining & Metallurgy Engineering Bor 24
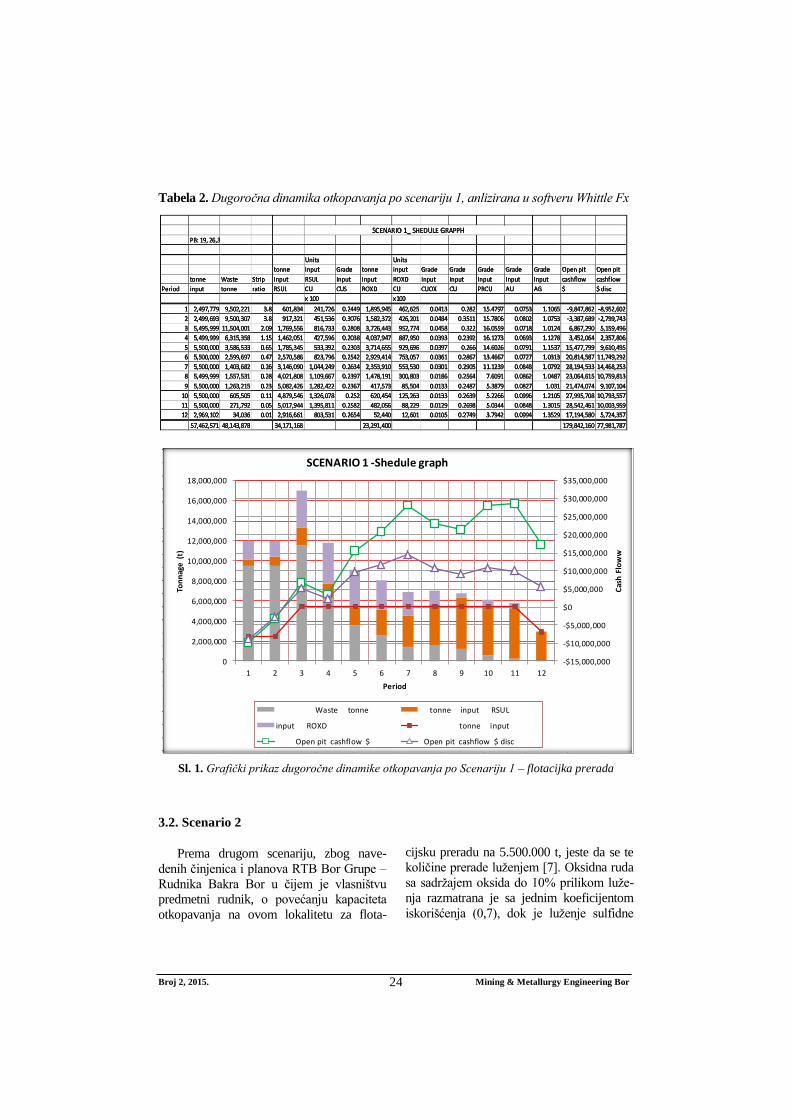
Tabela 2. Dugoročna dinamika otkopavanja po scenariju 1, anlizirana u softveru Whittle Fx
Sl. 1. Grafički prikaz dugoročne dinamike otkopavanja po Scenariju 1 – flotacijka prerada
3.2. Scenario 2
Prema drugom scenariju, zbog nave-
denih činjenica i planova RTB Bor Grupe –
Rudnika Bakra Bor u čijem je vlasništvu
predmetni rudnik, o povećanju kapaciteta
otkopavanja na ovom lokalitetu za flota-
cijsku preradu na 5.500.000 t, jeste da se te
količine prerade luženjem [7]. Oksidna ruda
sa sadržajem oksida do 10% prilikom luže-
nja razmatrana je sa jednim koeficijentom
iskorišćenja (0,7), dok je luženje sulfidne
PB: 19, 26,35
Units Units
tonne input Grade tonne input Grade Grade Grade Grade Grade Open pit Open pit
tonne Waste Strip input RSUL input input ROXD input input input input input cashflow cashflow
Period input tonne ratio RSUL CU CUS ROXD CU CUOX CU PRCU AU AG $ $ disc
x 100 x100
1 2,497,779 9,502,221 3.8 601,834 241,726 0.2449 1,895,945 462,625 0.0413 0.282 15.4797 0.0753 1.1065 -9,847,862 -8,952,602
2 2,499,693 9,500,307 3.8 917,321 451,536 0.3076 1,582,372 426,201 0.0484 0.3511 15.7806 0.0802 1.0753 -3,387,689 -2,799,743
3 5,495,999 11,504,001 2.09 1,769,556 816,733 0.2808 3,726,443 952,774 0.0458 0.322 16.0559 0.0718 1.0124 6,867,290 5,159,496
4 5,499,999 6,315,358 1.15 1,462,051 427,596 0.2038 4,037,947 887,950 0.0393 0.2392 16.1273 0.0693 1.1278 3,452,064 2,357,806
5 5,500,000 3,586,533 0.65 1,785,345 533,392 0.2303 3,714,655 929,696 0.0397 0.266 14.6026 0.0791 1.1537 15,477,799 9,610,495
6 5,500,000 2,599,697 0.47 2,570,586 823,796 0.2542 2,929,414 753,057 0.0361 0.2867 13.4667 0.0727 1.0313 20,814,587 11,749,292
7 5,500,000 1,403,682 0.26 3,146,090 1,044,249 0.2634 2,353,910 553,530 0.0301 0.2905 11.1239 0.0848 1.0792 28,194,533 14,468,253
8 5,499,999 1,557,531 0.28 4,021,808 1,109,667 0.2397 1,478,191 300,803 0.0186 0.2564 7.6091 0.0862 1.0487 23,064,615 10,759,813
9 5,500,000 1,263,215 0.23 5,082,426 1,282,422 0.2367 417,573 85,504 0.0133 0.2487 5.3879 0.0827 1.031 21,474,074 9,107,104
10 5,500,000 605,505 0.11 4,879,546 1,326,078 0.252 620,454 125,263 0.0133 0.2639 5.2266 0.0996 1.2105 27,995,708 10,793,557
11 5,500,000 271,792 0.05 5,017,944 1,395,811 0.2582 482,056 88,229 0.0129 0.2698 5.0344 0.0848 1.3015 28,542,461 10,003,959
12 2,969,102 34,036 0.01 2,916,661 803,531 0.2654 52,440 12,601 0.0105 0.2749 3.7942 0.0994 1.3529 17,194,580 5,724,357
57,462,571 48,143,878 34,171,168 23,291,400 179,842,160 77,981,787
SCENARIO 1_ SHEDULE GRAPPH
-$15,000,000
-$10,000,000
-$5,000,000
$0
$5,000,000
$10,000,000
$15,000,000
$20,000,000
$25,000,000
$30,000,000
$35,000,000
0
2,000,000
4,000,000
6,000,000
8,000,000
10,000,000
12,000,000
14,000,000
16,000,000
18,000,000
1 2 3 4 5 6 7 8 9 10 11 12
Cas
h F
low
w
Ton
nag
e (
t)
Period
SCENARIO 1 -Shedule graph
Waste tonne tonne input RSUL
input ROXD tonne input
Open pit cashflow $ Open pit cashflow $ disc

Broj 2, 2015. Mining & Metallurgy Engineering Bor 25
rude razmatrano sa koeficijentom iskori-
šćenja od 0,55 (Tabela 1.).
U ulazne troškove uračunati su i re-
handling troškovi sa skladišta (0,2 $/t
rude), a uzeti su u obzir i procenjeni
investicioni troškovi od 20.000.000 $ za
izgradnju infrastrukturnih objekata i insta-
lacija za hidrometaluršku metodu prerade,
i to na samom startu proizvodnje (u prvoj
godini).
Tabela 3. Dugoročna dinamika otkopavanja po scenariju 2, anlizirana u softveru Whittle Fx
Sl. 2. Grafik dugoročne dinamike i novčanih tokova po godinama po Scenariju 2. - totalna
konverzija flotiranja metodom luženja
Long Term Shedule -Method Heap Leachig
Grade Grade Grade From mine to From TOTAL From mine to From TOTAL Open pit Open pit
tonne Waste Strip input input input input LCH1 stockpile stockpile to RSULF input LCH2 stockpile stockpile to ROKSD cashflow cashflow
Period input tonne ratio CU AU AG RSUL SP1 - Rsulf LCH1-RSUL LCH1 ROXD SP2-Roxd LCH2-ROXD LCH1 $ $ disc
year tonne tonne ratio % g/t g/t t t t TOTAL t t t t TOTAL t $ $
1 7,637,874 9,362,127 1.23 0.1274 0.0329 0.6228 23,404 736,892 0 23,404 3,000,000 3,877,578 0 3,000,000 -26,688,274 -24,262,067
2 6,729,443 10,270,557 1.53 0.2579 0.06 0.9707 839,606 747,903 736,892 1,576,498 3,000,000 2,141,934 0 3,000,000 -3,444,904 -2,847,028
3 14,115,539 6,884,461 0.49 0.3268 0.0801 1.0017 4,755,686 2,835,617 744,314 5,500,000 5,500,000 1,024,236 0 5,500,000 53,796,117 40,417,819
4 13,206,031 7,793,969 0.59 0.2378 0.071 1.0775 4,389,920 859,446 1,110,080 5,500,000 5,500,000 2,456,665 0 5,500,000 20,641,477 14,098,406
5 18,683,273 2,316,727 0.12 0.2285 0.0724 0.9961 4,102,604 7,296,895 1,397,396 5,500,000 5,500,000 1,783,774 0 5,500,000 19,923,823 12,371,126
6 15,363,156 5,636,844 0.37 0.19 0.0647 1.0937 2,494,353 2,731,602 3,005,647 5,500,000 5,500,000 4,637,201 0 5,500,000 9,514,108 5,370,466
7 9,816,632 49,502 0.01 0.1982 0.0603 0.8397 5,500,000 3,365,802 0 5,500,000 695,769 255,061 4,804,231 5,500,000 25,672,382 13,173,991
8 0 0 #DIV/0! 0 0 0 0 0 5,500,000 5,500,000 0 0 5,500,000 5,500,000 55,174,611 25,739,363
9 0 0 #DIV/0! 0 0 0 0 0 5,500,000 5,500,000 0 0 5,500,000 5,500,000 55,174,611 23,399,421
10 0 0 #DIV/0! 0 0 0 0 0 579,829 579,829 0 0 372,218 372,218 4,575,773 1,921,174
85,551,948 42,314,187 0.49 22,105,573 18,574,157 18,574,158 40,679,731 28,695,769 16,176,449 16,176,449 44,872,218 214,339,724 109,382,671
Push backs: 19, 26,36
RSUL tonne ROXD tonne cashflow
1 2 3 4 5 6 7 8 9 10
-$40,000,000
-$30,000,000
-$20,000,000
-$10,000,000
$0
$10,000,000
$20,000,000
$30,000,000
$40,000,000
$50,000,000
$60,000,000
0
2,000,000
4,000,000
6,000,000
8,000,000
10,000,000
12,000,000
14,000,000
16,000,000
18,000,000
20,000,000
1 2 3 4 5 6 7 8 9 10
Cash
Flo
w
Ton
nag
e
Period
Shedulle Graph - Heap Leaching Scenario (2.)
Waste tonne RSUL tonne From mine input LCH1 RSUL t
RSUL tonne From stockpile to LCH1-RSUL t ROXD tonne From mine input LCH2 ROXD
ROXD tonne From stockpile to LCH2-ROXD t RSUL tonne TOTAL RSULF LCH1 TOTAL t
ROXD tonne TOTAL ROKSD LCH1 TOTAL t cashflow Open pit cashflow $ disc $
Open pit cashflow $

Broj 2, 2015. Mining & Metallurgy Engineering Bor 26
Sl. 3. Pie grafik učešća sulfidne i oksidne rude rude u procesu luženja
Dobijeni rezultati po Scenariju 2 su sa
tehnologijom korišćenja skladišta (Stock
pile), koji služe kao bafer za planirani
kapacitet prerade, ali stoji i mogućnost
dirigovanja vremenom luženja i skraćenjem
perioda ukupne eksploatacije predviđenog
dugoročnom dinamikom. Bitno je napome-
nuti i da se u poslednjim godinama, kada je
praktično otkopavanje na kopu završeno
može vreme luženja, time i kapacitet luže-
nja prilagoditi potrebama. Dakle, da li će se
ruda sa skladišta prerađivati za vreme
predviđeno dugoročnim planom ili kraće,
zavisi od ulaznog granulometrijskog sastava
rude, odnosno od površine otvorenosti
mineralnih zrna i time brzine izluživanja.
ZAKLJUČAK
Na sledećoj slici 4 – Tabela i dijagram
uporednih rezultata analize po jednom i
drugom scenariju, kao i iz Tabela 2 i 3,
odnosno grafika 1 i 2, vidi se:
1. Sračunati Cash flow po drugom sce-
nariju je veći nego po prvom (po
kome nisu uračunati nikakvi investi-
cioni troškovi za povećanje kapa-
citeta);
2. Da je vek eksploatacije na kopu
(otkopavanja) po drugom scenariju
upola kraći nego po prvom. Preosta-
lih godina po drugom scenariju je
prerada sa već otkopanom rudom –
rudom sa skladišta. To svakako
donosi uštede koje se vide iz upore-
đenja sa ekonomijom po scenariju 1.
TOTA
L OR
E INP
UT FR
OM
MIN
E
From mine input LCH1 RSUL
To stockpile SP1 - Rsulf
From stockpile to LCH1-
RSUL
TOTAL RSULF LCH1
From mine input LCH2 ROXD
To stockpile SP2-Roxd
From stockpile to LCH2-ROXD
TOTAL ROKSD LCH1
PIE GRAPH - ORE INPUT TO PROCESS

Broj 2, 2015. Mining & Metallurgy Engineering Bor 27
3. Kao sto je u prethodnom poglavlju
napomenuto, otkopana ruda se
može preraditi i ukraćem vremenu
nego što je predstavljeno u dugo-
ročnoj dinamici, smanjujući potre-
bno vreme izluživanja po osnovu
veličine ulazne granulacije rudena
gomile za luženje, odnosno izbo-
rom stepena drobljenja;
Diskontovani novčani tok po scenariju 2.
je veći pored ostalog, izbog toga što se pro-
cesom luženja zahvata celokupna mine-
ralizacija u granicama kopa, bez korišćenja
graničnog sadržaja kao faktora razgra-
ničenja rude i jalovine. Dakle, novi proces
prerade stvara ne samo više bakra visoke
čistoće za ljudsku upotrebu, već takođe ukla-
nja neekonomični otpad iz životne sredine.
Sl. 4. Grafik uporedne analize novčanih tokova za razlišite scenarije prerade i ekstrakcije
metala iz rude, po godinama
4. Proces luženja na gomili, o kome se
ovde radi, je sa mnogo većim stepe-
nom sigurnosti sa aspekta zaštite
životne sredine nego što je process
flotiranaja;
5. Prerada ove rude za razliku od kla-
sične prerade topljenjem, eliminiše
SO2 i druge štetne primese iz vaz-
duha na području topionice, odnosno
grada Bora i okoline. Ovde se ume-
sto klasičnog pirometaluršog pro-
cesa, primenjuje SX/EW process.
Postrojenje zahteva mnogo i manja
kapitalna ulaganja.
6. Zbog navedenih činjenica, i dosa-
dašnjih iskustava saakcedentnim
situacijamapo zaštitu životne sredine,
potrebno je uložiti napor kako u
edukaciju kadrova, tako i u upozna-
vanje stanovništva sa lošim i dobrim
stranama ovakve metode dobijanja
metala, takođe sa smanjenim rizikom
od akcidenata.
LITERATURA
[1] Z. Vaduvesković, N. Vušović, D. Krža-
nović: Analiza mogućnosti poboljšanja
ekonomskih pokazatelja eksploatacije
ležišta Cementacija Kraku Bugaresku–
rudno polje Cerovo, Mining and Me-
tallurgy Engineering Bor, 1/2014,
str. 25-36, http://www.irmbor.co.rs
Undiscounted Disconted Undiscounted Disconted
Open pit Open pit Open pit Open pit
cashflow cashflow cashflow cashflow
Years $ $ disc $ $ disc
1 -9,847,862 -8,952,602 -32,606,782 -29,642,530
2 -3,387,689 -2,799,743 -10,813,488 -8,936,767
3 6,867,290 5,159,496 25,224,785 18,951,754
4 3,452,064 2,357,806 10,821,471 7,391,211
5 15,477,799 9,610,495 2,643,834 1,641,613
6 20,814,587 11,749,292 -931,255 -525,669
7 28,194,533 14,468,253 26,226,231 13,458,203
8 23,064,615 10,759,813 44,544,958 20,780,552
9 21,474,074 9,107,104 44,544,958 18,891,411
10 27,995,708 10,793,557 44,544,958 17,174,010
11 28,542,461 10,003,959 44,544,958 15,612,736
12 17,194,580 5,724,357 44,544,958 14,193,396
13 0 0 42,905,512 12,428,199
14 0 0 18,521,234 4,877,220
15 0 0 18,521,234 4,433,836
16 0 0 5,280,764 1,230,282
SUMM 179,842,160 77,981,787 328,518,330 111,959,457
SCENARIO 2SCENARIO1
Period
-40,000,000
-30,000,000
-20,000,000
-10,000,000
0
10,000,000
20,000,000
30,000,000
40,000,000
50,000,000
1 2 3 4 5 6 7 8 9 10 11 12 13 14 15 16To
nn
ag
e (
t)
Years
Cash flow comparisan
SCENARIO1 Undiscounted Open pit cashflow $
SCENARIO1 Disconted Open pit cashflow
SCENARIO 2 Undiscounted Open pit cashflow $
SCENARIO 2 Disconted Open pit cashflow

Broj 2, 2015. Mining & Metallurgy Engineering Bor 28
[2] William H. Dresher: How Hydromet-
allurgy and the SX/EW Process Made
Copper the "Green" Metal, Copper
Applications in Mining & Metallurgy
http://www.copper.org/publications/ne
wsletters, innovations, A copper Alli-
ance member
[3] J. Peacey, GUO Xian-Jian, E. Robles:
Copper hydrometallurgy-currentstatus,
preliminary economics, future direc-
tion and positioning versus smelting,.
Hatch Associates Ltd., 2800 Speakman
Drive, Mississauaga, Ontario L5K
2R7, Canada; 2Hatch Ingenierosy
Consultores Ltda., San Sebastian 283,
Piso 9, Los Condes, Santiago 6760226,
Chile.
http://www. d.wanfangdata.com.cn
[4] J. F. Lupo: Design and Operation of
Heap Leach Pads, By Ph.D. Golder
Asociates. The Jornal of The Soutern
Institute of Mining and Metallurgy,
Decembar, 2012. Vol. 112.
[5] Carlos Avendaño Varas: Review on
heap leaching of copper ores, LX
Users Conferencea Chile, La Serena,
Junio 2004., Sociedad Terral S.A
[6] R. Denis, M. Marcotte: 1,7 Million
Square Meters PVC Heap Leach Pad
Case History, Solmax International
Inc., Varennes, Qc., Canada, Genivar,
Montreal, Qc., Canada, Draft paper
submitted for publication GeoAfrica
2009;
[7] William H. Dresher: Phelps Dodge
Morenci Has Converted All Copper
Production to Mine-for-Leach, Copper
Applications in Mining & Metallurgy,
http://www.copper.org/publications/ne
wsletters,innovations
[8] Whittle Strategic Mine Planning,
Gemcom Whittle™ Copyright © 2012
Gemcom Software International Inc.
[9] G. Hovanec: Osvrt na osnovne eko-
nomske aspekte proizvodnje bakra
primenom postupka kiselinskog lu-
ženja, Rudarski institut Beograd.