Convergent evolution of tree hydraulic traits in Amazonian ...
15
Convergent evolution of tree hydraulic traits in Amazonian habitats: implications for community assemblage and vulnerability to drought Clarissa G. Fontes 1,9 , Paul V. A. Fine 1 , Florian Wittmann 2,3 , Paulo R. L. Bittencourt 4 , Maria Teresa Fernandez Piedade 5 , Niro Higuchi 6 , Jeffrey Q. Chambers 7,8 and Todd E. Dawson 1 1 Department of Integrative Biology, University of California, Berkeley, Berkeley, CA 94720, USA; 2 Department of Wetland Ecology, Institute of Geography and Geoecology, Karlsruhe Institute of Technology – KIT, Josefstr.1, Rastatt D-76437, Germany; 3 Biogeochemistry, Max Planck Institute for Chemistry, Hahn-Meitner Weg 1, Mainz 55128, Germany; 4 College of Life and Environmental Sciences, University of Exeter, Exeter, EX4 4RJ, UK; 5 Coordenac ß~ ao de Din^ amica Ambiental, Instituto Nacional de Pesquisas da Amaz^ onia – INPA, Av. Andr e Ara ujo, Petr opolis, Manaus, AM 2936, 69067-375, Brazil; 6 Ci ^ encias de Florestas Tropicais, Instituto Nacional de Pesquisas da Amaz^ onia (INPA), Manaus, AM 69067-375, Brazil; 7 Climate Science Department, Climate and Ecosystem Sciences Division, Lawrence Berkeley National Laboratory, One Cyclotron Road, Building 74, Berkeley, CA 94720, USA; 8 Department of Geography, University of California Berkeley, 507 McCone Hall #4740, Berkeley, CA 94720, USA; 9 Department of Ecology, Evolution and Behavior, University of Minnesota, 1479 Gortner Avenue, Saint Paul, MN 55108, USA Author for correspondence: Clarissa G. Fontes Tel: +1 510 725 9120 Email: [email protected] Received: 13 December 2019 Accepted: 10 May 2020 New Phytologist (2020) doi: 10.1111/nph.16675 Key words: drought vulnerability, functional ecology, hydraulic safety margin, hydraulic traits, species distribution, tropical forest. Summary Amazonian droughts are increasing in frequency and severity. However, little is known about how this may influence species-specific vulnerability to drought across different ecosys- tem types. We measured 16 functional traits for 16 congeneric species from six families and eight gen- era restricted to floodplain, swamp, white-sand or plateau forests of Central Amazonia. We investigated whether habitat distributions can be explained by species hydraulic strategies, and if habitat specialists differ in their vulnerability to embolism that would make water trans- port difficult during drought periods. We found strong functional differences among species. Nonflooded species had higher wood specific gravity and lower stomatal density, whereas flooded species had wider vessels, and higher leaf and xylem hydraulic conductivity. The P 50 values (water potential at 50% loss of hydraulic conductivity) of nonflooded species were significantly more negative than flooded species. However, we found no differences in hydraulic safety margin among species, suggesting that all trees may be equally likely to experience hydraulic failure during severe droughts. Water availability imposes a strong selection leading to differentiation of plant hydraulic strategies among species and may underlie patterns of adaptive radiation in many tropical tree genera. Our results have important implications for modeling species distribution and resilience under future climate scenarios. Introduction The Amazon Basin occupies an area of c. 7 million km 2 and is the largest and most biodiverse tropical rainforest in the world (Ribeiro et al., 1999). The main vegetation types found in the Amazon Basin are mature terra-firme forests (plateau/upland, val- ley and slope forests; approx. 63% of Amazon Basin), woodland savanna (c. 22%), floodplain/inundated forests (c. 10%), sec- ondary forest and white-sand areas (c. 5%; Saatchi et al., 2007; Adeney et al., 2016; Wittmann & Junk, 2016). These distinct habitats differ mainly in soil type, plant water availability, and topography. This great environmental heterogeneity has been proposed as one of the main explanations for the high diversity of tree species in Amazonian tropical ecosystems (Connell, 1978; Smith et al., 1997; ter Steege et al., 2000). Environmental hetero- geneity can promote ecologically-mediated speciation and habitat specialization, and thus increase beta-diversity among areas (Tuomisto et al., 2003; Fine & Kembel, 2011; Wittmann et al., 2013; Fine, 2015; Leibold & Chase, 2017). Indeed, several stud- ies have reported high tree species turnover in the different Ama- zonian habitats (e.g. ter Steege et al., 2000; Valencia et al., 2004; Stropp et al., 2011; Schietti et al., 2014; Assis et al., 2015). More- over, a large number of studies have tested for edaphic and topo- graphic habitat specialization among tropical trees (e.g. Phillips et al., 2003; Fine & Kembel, 2011; Damasco et al., 2013; Toledo et al., 2017). However, despite the strong differences in plant Ó 2020 The Authors New Phytologist Ó 2020 New Phytologist Trust New Phytologist (2020) 1 www.newphytologist.com Research
Transcript of Convergent evolution of tree hydraulic traits in Amazonian ...
Convergent evolution of tree hydraulic traits in Amazonianhabitats: implications for community assemblage andvulnerability to drought
Clarissa G. Fontes1,9 , Paul V. A. Fine1 , Florian Wittmann2,3 , Paulo R. L. Bittencourt4 ,
Maria Teresa Fernandez Piedade5 , Niro Higuchi6 , Jeffrey Q. Chambers7,8 and Todd E. Dawson1
1Department of Integrative Biology, University of California, Berkeley, Berkeley, CA 94720, USA; 2Department of Wetland Ecology, Institute of Geography and Geoecology, Karlsruhe
Institute of Technology – KIT, Josefstr.1, Rastatt D-76437, Germany; 3Biogeochemistry, Max Planck Institute for Chemistry, Hahn-Meitner Weg 1, Mainz 55128, Germany; 4College of Life
and Environmental Sciences, University of Exeter, Exeter, EX4 4RJ, UK; 5Coordenac�~ao de Dinamica Ambiental, Instituto Nacional de Pesquisas da Amazonia – INPA, Av. Andr�e Ara�ujo,
Petr�opolis, Manaus, AM 2936, 69067-375, Brazil; 6Ciencias de Florestas Tropicais, Instituto Nacional de Pesquisas da Amazonia (INPA), Manaus, AM 69067-375, Brazil; 7Climate Science
Department, Climate and Ecosystem Sciences Division, Lawrence Berkeley National Laboratory, One Cyclotron Road, Building 74, Berkeley, CA 94720, USA; 8Department of Geography,
University of California Berkeley, 507 McCone Hall #4740, Berkeley, CA 94720, USA; 9Department of Ecology, Evolution and Behavior, University of Minnesota, 1479 Gortner Avenue,
Saint Paul, MN 55108, USA
Author for correspondence:Clarissa G. FontesTel: +1 510 725 9120
Email: [email protected]
Received: 13 December 2019Accepted: 10 May 2020
New Phytologist (2020)doi: 10.1111/nph.16675
Key words: drought vulnerability, functionalecology, hydraulic safety margin, hydraulictraits, species distribution, tropical forest.
Summary
� Amazonian droughts are increasing in frequency and severity. However, little is known
about how this may influence species-specific vulnerability to drought across different ecosys-
tem types.� We measured 16 functional traits for 16 congeneric species from six families and eight gen-
era restricted to floodplain, swamp, white-sand or plateau forests of Central Amazonia. We
investigated whether habitat distributions can be explained by species hydraulic strategies,
and if habitat specialists differ in their vulnerability to embolism that would make water trans-
port difficult during drought periods.� We found strong functional differences among species. Nonflooded species had higher
wood specific gravity and lower stomatal density, whereas flooded species had wider vessels,
and higher leaf and xylem hydraulic conductivity. The P50 values (water potential at 50% loss
of hydraulic conductivity) of nonflooded species were significantly more negative than
flooded species. However, we found no differences in hydraulic safety margin among species,
suggesting that all trees may be equally likely to experience hydraulic failure during severe
droughts.� Water availability imposes a strong selection leading to differentiation of plant hydraulic
strategies among species and may underlie patterns of adaptive radiation in many tropical tree
genera. Our results have important implications for modeling species distribution and
resilience under future climate scenarios.
Introduction
The Amazon Basin occupies an area of c. 7 million km2 and isthe largest and most biodiverse tropical rainforest in the world(Ribeiro et al., 1999). The main vegetation types found in theAmazon Basin are mature terra-firme forests (plateau/upland, val-ley and slope forests; approx. 63% of Amazon Basin), woodlandsavanna (c. 22%), floodplain/inundated forests (c. 10%), sec-ondary forest and white-sand areas (c. 5%; Saatchi et al., 2007;Adeney et al., 2016; Wittmann & Junk, 2016). These distincthabitats differ mainly in soil type, plant water availability, andtopography. This great environmental heterogeneity has beenproposed as one of the main explanations for the high diversity of
tree species in Amazonian tropical ecosystems (Connell, 1978;Smith et al., 1997; ter Steege et al., 2000). Environmental hetero-geneity can promote ecologically-mediated speciation and habitatspecialization, and thus increase beta-diversity among areas(Tuomisto et al., 2003; Fine & Kembel, 2011; Wittmann et al.,2013; Fine, 2015; Leibold & Chase, 2017). Indeed, several stud-ies have reported high tree species turnover in the different Ama-zonian habitats (e.g. ter Steege et al., 2000; Valencia et al., 2004;Stropp et al., 2011; Schietti et al., 2014; Assis et al., 2015). More-over, a large number of studies have tested for edaphic and topo-graphic habitat specialization among tropical trees (e.g. Phillipset al., 2003; Fine & Kembel, 2011; Damasco et al., 2013; Toledoet al., 2017). However, despite the strong differences in plant
� 2020 The Authors
New Phytologist� 2020 New Phytologist Trust
New Phytologist (2020) 1www.newphytologist.com
Research
water availability among these diverse Amazonian habitats, rela-tively little attention has been paid to how water availability canbe linked to tree species distribution in Amazonian forests (butsee Schietti et al., 2014; Oliveira et al., 2019), which is particu-larly important to understand in face of the rapid climatic andland-use change currently taking place in the Amazon Basin.
Extreme drought events are becoming more frequent andintense in the Amazon (Marengo et al., 2011; Fu et al.,2013; Stocker et al., 2013), and many studies have linkedwarmer and drier conditions to increased levels of tree physio-logical stress in tropical areas (Doughty & Goulden, 2008;Bonal et al., 2016; Tng et al., 2018; Fontes et al., 2018b).Overall precipitation also is predicted to decrease across theAmazonian region (Stocker et al., 2013; Marengo et al.,2018), and this would have profound effects on the wateravailability for trees. Contrasting environments with distinctwater availabilities may select on species hydraulic strategies,resulting in water-driven distributions of plant communities(Engelbrecht et al., 2007; Blackman et al., 2014; Cosmeet al., 2017). Furthermore, some studies have suggested thatspecies from Amazonian floodplain forests inundated byblack-water rivers may be more vulnerable to drought thanplateau species (Parolin & Wittmann, 2010; Zuleta et al.,2017; Oliveira et al., 2019). However, the physiologicalmechanism for this assertion has not been fully explored andthe drought vulnerability of species from different Amazonianhabitats has yet to be tested. Thus, to understand the effectof future climate in the world’s largest tropical forest, it is ofparamount importance to know how water limitation mayshape species distributions in the contrasting Amazonianecosystems, and how these communities differ in their vulner-ability to predicted water deficit.
Hydraulic traits such as P50 (the water potential at whichplants lose 50% of their hydraulic conductivity) and stem safetymargin (SM =minimum water potential measured in the field –P50) are used widely to assess vulnerability and response of plantsto drought (Choat et al., 2012; Skelton et al., 2015; Fontes et al.,2018b). P50 is a measure of how vulnerable xylem vessels are toembolism; embolism resistance has been shown to have a positiverelationship with the intensity of drought stress experienced byplants across many terrestrial ecosystems (Choat et al., 2012;Blackman et al., 2014; Oliveira et al., 2019). By contrast, SMindicates how close plants operate to the point of xylem disfunc-tion (Meinzer et al., 2009; Klein et al., 2014; Bucci et al., 2016).At the global scale, SM has been shown to be independent ofwater availability and plant species from contrasting ecosystems(e.g. desert vs tropical forest) may have similar SM values (Choatet al., 2012), which is consistent with the idea that plants from abroad range of environments converge in operating close to theirhydraulic limit as a way of maximizing carbon uptake. However,it is still unclear if these patterns also are found at local scales,and, to our knowledge, this has never been tested within differenttropical ecosystems. Furthermore, hydraulic trait variation acrosstropical rainforest tree taxa remains poorly resolved. Therefore,the Amazon is still under-represented in global hydraulic traitdatasets, likely because of the high species diversity, the
inaccessibility of remote sites, and the time-consuming quantifi-cation of plant hydraulic traits.
We measured 16 leaf, wood and hydraulic traits of 16 treespecies from eight genera exhibiting contrasting distributionsacross four main Amazonian habitats, making this the most com-prehensive study to date on plant hydraulic strategies in the Ama-zon. All habitats are under the same climatic regime and anydifferences in water availability are likely due to soil type, topog-raphy and/or ground water amounts. We sampled two habitats(flooded habitats) where water is constantly available throughoutthe year (a periodically flooded black-water floodplain forestalong a low-order river and a permanently saturated swamp forestin the catchment area of a high-order creek) and another twohabitats (nonflooded habitats) where water is markedly limitedduring the dry season (white-sand and plateau forests) to test thefollowing hypotheses: (H1) flooded habitat species (floodplainand swamp forests) will be more vulnerable to xylem embolismthan species from nonflooded (drier) habitats (plateau and white-sand forest) in the Amazon; (H2) if the same pattern of hydraulicsafety margin (SM) reported at global scales – convergence to lowSM – is observed at local scales, we hypothesize that independentof site water availability, Amazonian trees will operate with simi-lar hydraulic safety margin, in a way of maximize carbon uptake;(H3) congeneric species from contrasting environments in theAmazon will differ in their leaf, wood and hydraulic traits, consis-tent with the hypothesis that these trait differences have evolvedrepeatedly and independently in the distinct close phylogeneticlineages probably due to selective environmental pressure (habi-tat-mediated ecological speciation).
Materials and Methods
Study site
Our two study sites are located at Reserva Biol�ogica do Cuieiras/Estac�~ao Experimental de Silvicultura Tropical, also known asZF-2 (lat. 2°36033″S, long. 60°12033″W), and at the Uatum~aSustainable Development Reserve (USDR), where the AmazonTall Tower Observatory, ATTO, is situated (lat. 2°08038″S,long. 58°59059″W). The ZF-2 and ATTO are located, respec-tively, c. 90 km NW and c. 150 km NE of the city of Manaus-AM, Brazil. The ZF-2 site is covered by 31 000 ha of densehumid terra-firme forest, with a mean canopy height of c. 28 m(Roberts et al., 1996; Kunert et al., 2017). The mean annual pre-cipitation between 2002 and 2016 was 2140 mm, and the meanannual temperature was 28°C (Fontes et al., 2018b). The USDR(ATTO site) consists of different forested ecosystems, whichinclude dense, nonflooded upland forests (terra-firme), white-sand forests and seasonally flooded black-water floodplain forestalong the Uatum~a River and several smaller tributaries. Theannual average precipitation and temperature between 2012 and2014 were 2376 mm and 28�C, respectively. The dry season forboth areas is from July to September when precipitation generallyis < 100 mm. For a detailed description of the ZF-2 site, refer to(Fontes et al., 2018a,b) and for ATTO see (Andreae et al., 2015;Targhetta et al., 2015).
New Phytologist (2020) � 2020 The Authors
New Phytologist� 2020 New Phytologist Trustwww.newphytologist.com
Research
NewPhytologist2
Environmental variables
We used soil texture (percentage of clay and sand fraction), andwater table depth (minimum and maximum) to characterize soiland water availability in each of the plots where the trees werecollected. Water table depth for the ZF-2 site from 2014 to 2016was provided by the LBA Hydrology group. The raw data areavailable upon request from the LBA Hydrology Group from:http://lba2.inpa.gov.br/index.php/dados-hidrologicos.html. Thetopsoil texture data for ZF-2 were obtained from (Ferraz et al.,1998), where they analyzed soil texture in the first 30 cm of thesoil. For the ATTO site, data of water table depth and topsoiltexture were extracted from previous studies (Andreae et al.,2015; Targhetta et al., 2015). Soil texture was obtained from thefirst 20cm of the soil and water table depth was collected between2009 and 2011 (Targhetta et al., 2015). A detailed characteriza-tion of the water availability and soil texture of each location/habitat type that we sampled can be found in the section below.
Habitat types
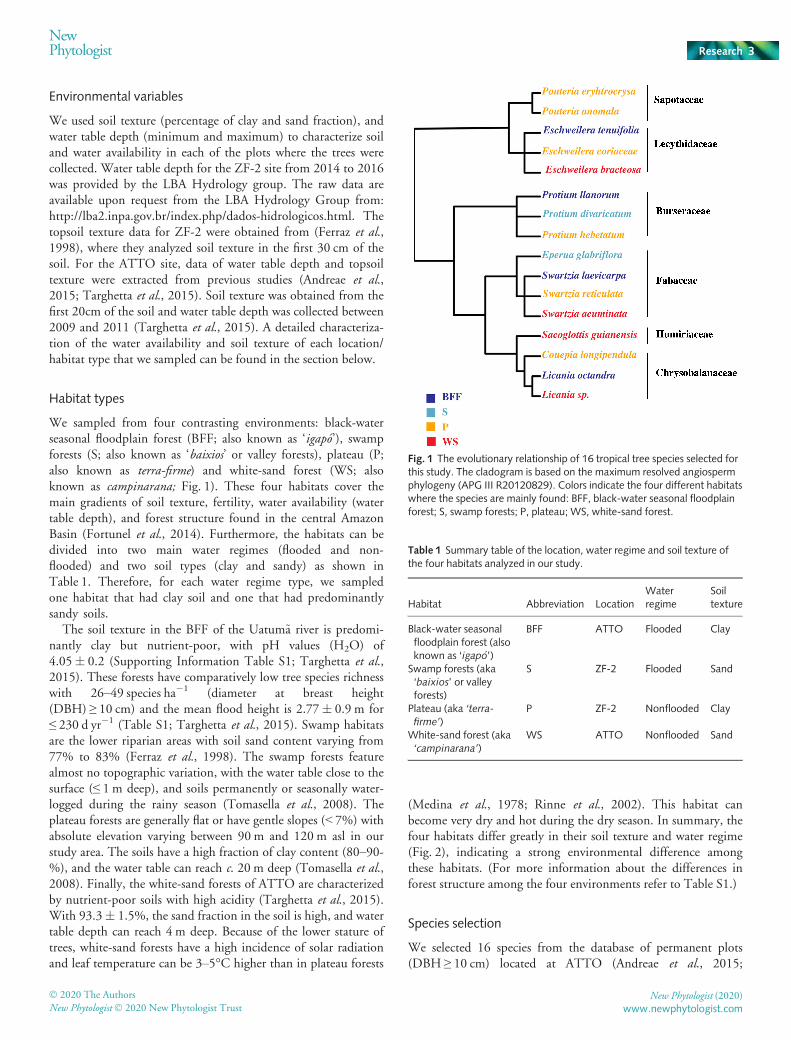
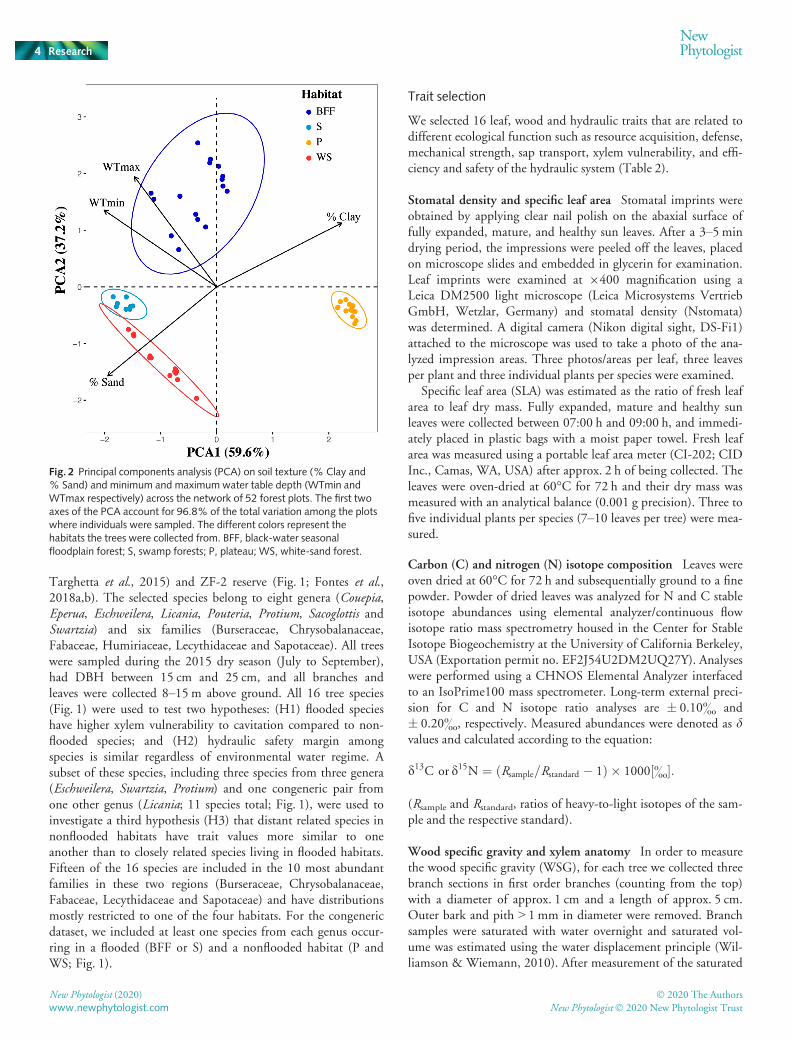
We sampled from four contrasting environments: black-waterseasonal floodplain forest (BFF; also known as ‘igap�o’), swampforests (S; also known as ‘baixios’ or valley forests), plateau (P;also known as terra-firme) and white-sand forest (WS; alsoknown as campinarana; Fig. 1). These four habitats cover themain gradients of soil texture, fertility, water availability (watertable depth), and forest structure found in the central AmazonBasin (Fortunel et al., 2014). Furthermore, the habitats can bedivided into two main water regimes (flooded and non-flooded) and two soil types (clay and sandy) as shown inTable 1. Therefore, for each water regime type, we sampledone habitat that had clay soil and one that had predominantlysandy soils.
The soil texture in the BFF of the Uatum~a river is predomi-nantly clay but nutrient-poor, with pH values (H2O) of4.05� 0.2 (Supporting Information Table S1; Targhetta et al.,2015). These forests have comparatively low tree species richnesswith 26–49 species ha�1 (diameter at breast height(DBH) ≥ 10 cm) and the mean flood height is 2.77� 0.9 m for≤ 230 d yr�1 (Table S1; Targhetta et al., 2015). Swamp habitatsare the lower riparian areas with soil sand content varying from77% to 83% (Ferraz et al., 1998). The swamp forests featurealmost no topographic variation, with the water table close to thesurface (≤ 1 m deep), and soils permanently or seasonally water-logged during the rainy season (Tomasella et al., 2008). Theplateau forests are generally flat or have gentle slopes (< 7%) withabsolute elevation varying between 90 m and 120 m asl in ourstudy area. The soils have a high fraction of clay content (80–90-%), and the water table can reach c. 20 m deep (Tomasella et al.,2008). Finally, the white-sand forests of ATTO are characterizedby nutrient-poor soils with high acidity (Targhetta et al., 2015).With 93.3� 1.5%, the sand fraction in the soil is high, and watertable depth can reach 4 m deep. Because of the lower stature oftrees, white-sand forests have a high incidence of solar radiationand leaf temperature can be 3–5°C higher than in plateau forests
(Medina et al., 1978; Rinne et al., 2002). This habitat canbecome very dry and hot during the dry season. In summary, thefour habitats differ greatly in their soil texture and water regime(Fig. 2), indicating a strong environmental difference amongthese habitats. (For more information about the differences inforest structure among the four environments refer to Table S1.)
Species selection
We selected 16 species from the database of permanent plots(DBH ≥ 10 cm) located at ATTO (Andreae et al., 2015;
Fig. 1 The evolutionary relationship of 16 tropical tree species selected forthis study. The cladogram is based on the maximum resolved angiospermphylogeny (APG III R20120829). Colors indicate the four different habitatswhere the species are mainly found: BFF, black-water seasonal floodplainforest; S, swamp forests; P, plateau; WS, white-sand forest.
Table 1 Summary table of the location, water regime and soil texture ofthe four habitats analyzed in our study.
Habitat Abbreviation LocationWaterregime
Soiltexture
Black-water seasonalfloodplain forest (alsoknown as ‘igap�o’)
BFF ATTO Flooded Clay
Swamp forests (aka‘baixios’ or valleyforests)
S ZF-2 Flooded Sand
Plateau (aka ‘terra-firme’)
P ZF-2 Nonflooded Clay
White-sand forest (aka‘campinarana’)
WS ATTO Nonflooded Sand
� 2020 The Authors
New Phytologist� 2020 New Phytologist TrustNew Phytologist (2020)
www.newphytologist.com
NewPhytologist Research 3
Targhetta et al., 2015) and ZF-2 reserve (Fig. 1; Fontes et al.,2018a,b). The selected species belong to eight genera (Couepia,Eperua, Eschweilera, Licania, Pouteria, Protium, Sacoglottis andSwartzia) and six families (Burseraceae, Chrysobalanaceae,Fabaceae, Humiriaceae, Lecythidaceae and Sapotaceae). All treeswere sampled during the 2015 dry season (July to September),had DBH between 15 cm and 25 cm, and all branches andleaves were collected 8–15 m above ground. All 16 tree species(Fig. 1) were used to test two hypotheses: (H1) flooded specieshave higher xylem vulnerability to cavitation compared to non-flooded species; and (H2) hydraulic safety margin amongspecies is similar regardless of environmental water regime. Asubset of these species, including three species from three genera(Eschweilera, Swartzia, Protium) and one congeneric pair fromone other genus (Licania; 11 species total; Fig. 1), were used toinvestigate a third hypothesis (H3) that distant related species innonflooded habitats have trait values more similar to oneanother than to closely related species living in flooded habitats.Fifteen of the 16 species are included in the 10 most abundantfamilies in these two regions (Burseraceae, Chrysobalanaceae,Fabaceae, Lecythidaceae and Sapotaceae) and have distributionsmostly restricted to one of the four habitats. For the congenericdataset, we included at least one species from each genus occur-ring in a flooded (BFF or S) and a nonflooded habitat (P andWS; Fig. 1).
Trait selection
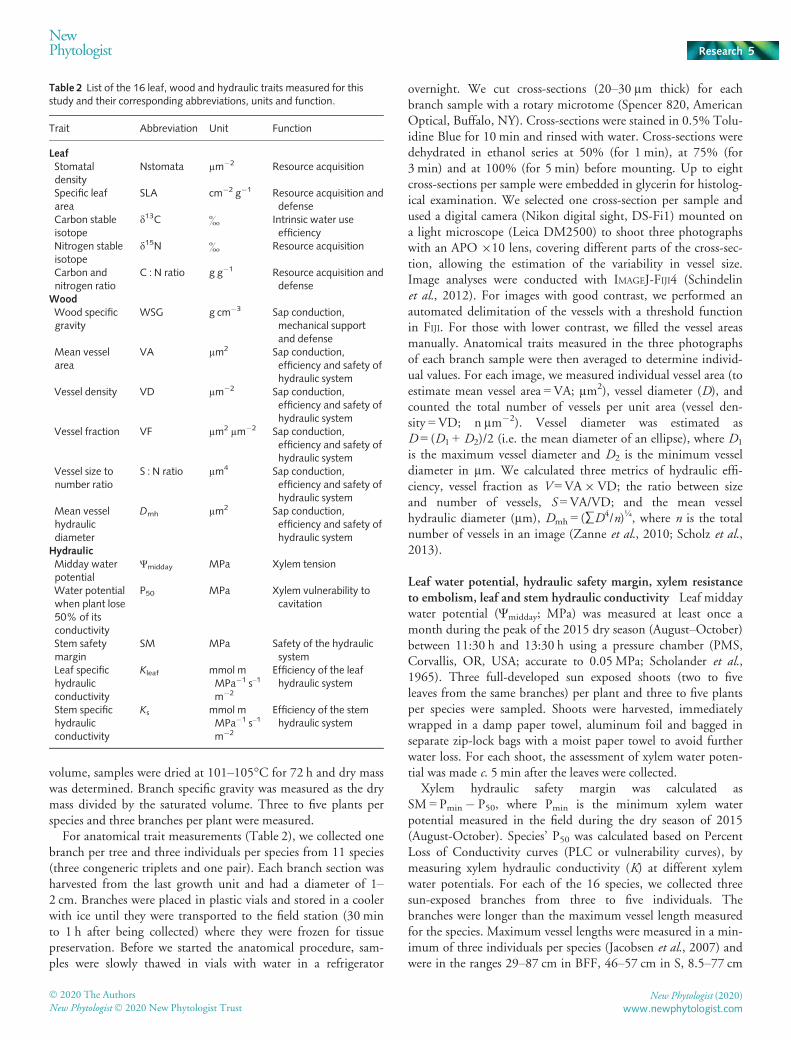
We selected 16 leaf, wood and hydraulic traits that are related todifferent ecological function such as resource acquisition, defense,mechanical strength, sap transport, xylem vulnerability, and effi-ciency and safety of the hydraulic system (Table 2).
Stomatal density and specific leaf area Stomatal imprints wereobtained by applying clear nail polish on the abaxial surface offully expanded, mature, and healthy sun leaves. After a 3–5 mindrying period, the impressions were peeled off the leaves, placedon microscope slides and embedded in glycerin for examination.Leaf imprints were examined at 9400 magnification using aLeica DM2500 light microscope (Leica Microsystems VertriebGmbH, Wetzlar, Germany) and stomatal density (Nstomata)was determined. A digital camera (Nikon digital sight, DS-Fi1)attached to the microscope was used to take a photo of the ana-lyzed impression areas. Three photos/areas per leaf, three leavesper plant and three individual plants per species were examined.
Specific leaf area (SLA) was estimated as the ratio of fresh leafarea to leaf dry mass. Fully expanded, mature and healthy sunleaves were collected between 07:00 h and 09:00 h, and immedi-ately placed in plastic bags with a moist paper towel. Fresh leafarea was measured using a portable leaf area meter (CI-202; CIDInc., Camas, WA, USA) after approx. 2 h of being collected. Theleaves were oven-dried at 60°C for 72 h and their dry mass wasmeasured with an analytical balance (0.001 g precision). Three tofive individual plants per species (7–10 leaves per tree) were mea-sured.
Carbon (C) and nitrogen (N) isotope composition Leaves wereoven dried at 60°C for 72 h and subsequentially ground to a finepowder. Powder of dried leaves was analyzed for N and C stableisotope abundances using elemental analyzer/continuous flowisotope ratio mass spectrometry housed in the Center for StableIsotope Biogeochemistry at the University of California Berkeley,USA (Exportation permit no. EF2J54U2DM2UQ27Y). Analyseswere performed using a CHNOS Elemental Analyzer interfacedto an IsoPrime100 mass spectrometer. Long-term external preci-sion for C and N isotope ratio analyses are � 0.10& and� 0.20&, respectively. Measured abundances were denoted as dvalues and calculated according to the equation:
d13C or d15N ¼ ðRsample=Rstandard � 1Þ � 1000½&�:
(Rsample and Rstandard, ratios of heavy-to-light isotopes of the sam-ple and the respective standard).
Wood specific gravity and xylem anatomy In order to measurethe wood specific gravity (WSG), for each tree we collected threebranch sections in first order branches (counting from the top)with a diameter of approx. 1 cm and a length of approx. 5 cm.Outer bark and pith > 1 mm in diameter were removed. Branchsamples were saturated with water overnight and saturated vol-ume was estimated using the water displacement principle (Wil-liamson & Wiemann, 2010). After measurement of the saturated
Fig. 2 Principal components analysis (PCA) on soil texture (% Clay and% Sand) and minimum and maximum water table depth (WTmin andWTmax respectively) across the network of 52 forest plots. The first twoaxes of the PCA account for 96.8% of the total variation among the plotswhere individuals were sampled. The different colors represent thehabitats the trees were collected from. BFF, black-water seasonalfloodplain forest; S, swamp forests; P, plateau; WS, white-sand forest.
New Phytologist (2020) � 2020 The Authors
New Phytologist� 2020 New Phytologist Trustwww.newphytologist.com
Research
NewPhytologist4
volume, samples were dried at 101–105°C for 72 h and dry masswas determined. Branch specific gravity was measured as the drymass divided by the saturated volume. Three to five plants perspecies and three branches per plant were measured.
For anatomical trait measurements (Table 2), we collected onebranch per tree and three individuals per species from 11 species(three congeneric triplets and one pair). Each branch section washarvested from the last growth unit and had a diameter of 1–2 cm. Branches were placed in plastic vials and stored in a coolerwith ice until they were transported to the field station (30 minto 1 h after being collected) where they were frozen for tissuepreservation. Before we started the anatomical procedure, sam-ples were slowly thawed in vials with water in a refrigerator
overnight. We cut cross-sections (20–30 µm thick) for eachbranch sample with a rotary microtome (Spencer 820, AmericanOptical, Buffalo, NY). Cross-sections were stained in 0.5% Tolu-idine Blue for 10 min and rinsed with water. Cross-sections weredehydrated in ethanol series at 50% (for 1 min), at 75% (for3 min) and at 100% (for 5 min) before mounting. Up to eightcross-sections per sample were embedded in glycerin for histolog-ical examination. We selected one cross-section per sample andused a digital camera (Nikon digital sight, DS-Fi1) mounted ona light microscope (Leica DM2500) to shoot three photographswith an APO 910 lens, covering different parts of the cross-sec-tion, allowing the estimation of the variability in vessel size.Image analyses were conducted with IMAGEJ-FIJI4 (Schindelinet al., 2012). For images with good contrast, we performed anautomated delimitation of the vessels with a threshold functionin FIJI. For those with lower contrast, we filled the vessel areasmanually. Anatomical traits measured in the three photographsof each branch sample were then averaged to determine individ-ual values. For each image, we measured individual vessel area (toestimate mean vessel area = VA; µm2), vessel diameter (D), andcounted the total number of vessels per unit area (vessel den-sity =VD; n µm�2). Vessel diameter was estimated asD = (D1+D2)/2 (i.e. the mean diameter of an ellipse), where D1
is the maximum vessel diameter and D2 is the minimum vesseldiameter in µm. We calculated three metrics of hydraulic effi-ciency, vessel fraction as V =VA9 VD; the ratio between sizeand number of vessels, S =VA/VD; and the mean vesselhydraulic diameter (µm), Dmh = (∑D4/n)¼, where n is the totalnumber of vessels in an image (Zanne et al., 2010; Scholz et al.,2013).
Leaf water potential, hydraulic safety margin, xylem resistanceto embolism, leaf and stem hydraulic conductivity Leaf middaywater potential (Ψmidday; MPa) was measured at least once amonth during the peak of the 2015 dry season (August–October)between 11:30 h and 13:30 h using a pressure chamber (PMS,Corvallis, OR, USA; accurate to 0.05MPa; Scholander et al.,1965). Three full-developed sun exposed shoots (two to fiveleaves from the same branches) per plant and three to five plantsper species were sampled. Shoots were harvested, immediatelywrapped in a damp paper towel, aluminum foil and bagged inseparate zip-lock bags with a moist paper towel to avoid furtherwater loss. For each shoot, the assessment of xylem water poten-tial was made c. 5 min after the leaves were collected.
Xylem hydraulic safety margin was calculated asSM = Pmin� P50, where Pmin is the minimum xylem waterpotential measured in the field during the dry season of 2015(August-October). Species’ P50 was calculated based on PercentLoss of Conductivity curves (PLC or vulnerability curves), bymeasuring xylem hydraulic conductivity (K) at different xylemwater potentials. For each of the 16 species, we collected threesun-exposed branches from three to five individuals. Thebranches were longer than the maximum vessel length measuredfor the species. Maximum vessel lengths were measured in a min-imum of three individuals per species (Jacobsen et al., 2007) andwere in the ranges 29–87 cm in BFF, 46–57 cm in S, 8.5–77 cm
Table 2 List of the 16 leaf, wood and hydraulic traits measured for thisstudy and their corresponding abbreviations, units and function.
Trait Abbreviation Unit Function
LeafStomataldensity
Nstomata µm�2 Resource acquisition
Specific leafarea
SLA cm�2 g�1 Resource acquisition anddefense
Carbon stableisotope
d13C & Intrinsic water useefficiency
Nitrogen stableisotope
d15N & Resource acquisition
Carbon andnitrogen ratio
C : N ratio g g�1 Resource acquisition anddefense
WoodWood specificgravity
WSG g cm�3 Sap conduction,mechanical supportand defense
Mean vesselarea
VA µm2 Sap conduction,efficiency and safety ofhydraulic system
Vessel density VD µm�2 Sap conduction,efficiency and safety ofhydraulic system
Vessel fraction VF µm2 µm�2 Sap conduction,efficiency and safety ofhydraulic system
Vessel size tonumber ratio
S : N ratio µm4 Sap conduction,efficiency and safety ofhydraulic system
Mean vesselhydraulicdiameter
Dmh µm2 Sap conduction,efficiency and safety ofhydraulic system
HydraulicMidday waterpotential
Ψmidday MPa Xylem tension
Water potentialwhen plant lose50% of itsconductivity
P50 MPa Xylem vulnerability tocavitation
Stem safetymargin
SM MPa Safety of the hydraulicsystem
Leaf specifichydraulicconductivity
Kleaf mmol mMPa�1 s–1
m�2
Efficiency of the leafhydraulic system
Stem specifichydraulicconductivity
Ks mmol mMPa�1 s–1
m�2
Efficiency of the stemhydraulic system
� 2020 The Authors
New Phytologist� 2020 New Phytologist TrustNew Phytologist (2020)
www.newphytologist.com
NewPhytologist Research 5
in P and 18–56 cm in WS forests. Different water potentials wereobtained using the bench dehydration method (Sperry et al.,1988) and K was measured using an ultra-low-flow meter firstproposed by Tyree et al. (2002) and adapted by Pereira & Maz-zafera (2012). To avoid cutting artifacts: we collected branches atleast two-fold longer than the maximum vessel length measuredfor the species; they were wrapped in dark plastic bags togetherwith wet paper towels for transportation; branches were re-cutunder water several times; and branch samples were trimmedwith a sharp wood-carving knife as suggested by Beikircher &Mayr (2015). Also, the tension of the branches was relaxed beforeexcising the segment on which measurements were performed. Inbrief, branches were collected early in the morning (05:30 h–06:30 h local time), placed in plastic bags to prevent desiccationand transported to the field station 30–60 min after being col-lected. Branches were bench-dried for different durations (0 minto 3 h) and placed in dark plastic bags for 2–8 h so leaf and xylemwater potential would equilibrate. A total of two to three leavesfrom each branch were used to estimate the water potential. Thebranches were then recut in water to relax tension in the xylem,ensuring that the final recut sample was still longer than the max-imum vessel length. Finally, the branches, longer than the maxi-mum vessel length, were recut under water into five segments(each 4–5 cm long and approx. 1 cm shaved off each end), con-nected in series to the hydraulic apparatus and initial conduc-tance was measured (Pereira & Mazzafera, 2012). Branches werethen flushed for c. 25 min at 100 kPa with 20 mM KCl solution,filtered to 0.1-µm (inline filter; GE Water and Process Technolo-gies, Trevose, PA, USA) and vacuum-degassed for ≥ 1 h. Afterflushing, the maximum conductivity of the same branch seg-ments was assessed. We accounted for the influence of back-ground flow and water temperature (to account for waterviscosity change) on all conductance measurements. The PLCwas calculated for each of the segments using the hydraulic con-ductance measurements taken before and after the flushing.
The same apparatus, solution and protocol for branch sam-pling used to assess hydraulic vulnerability curves (Tyree et al.,2002; Pereira & Mazzafera, 2012) were employed to measurenative stem specific hydraulic conductivity and leaf specific con-ductivity (Ks and Kleaf, respectively). To determine Ks and Kleaf,we air-collected (branches were not submerged in water beforecutting from tree) one branch per tree and three individuals perspecies from 11 species. Branches 2–39 longer than the maxi-mum vessel length measured were collected at predawn andimmediately placed in double plastic bags containing wet tissuepaper to minimize post-cutting dehydration. Branches were cutunder water, trimmed, connected to the hydraulic apparatus andstem flow was measured (Pereira & Mazzafera, 2012). The lengthof the branch segments attached to the apparatus was longer thanthe maximum vessel length measured for the species. K was calcu-lated as the ratio between water flux through the branch segmentand the pressure gradient causing that flow (Cruiziat et al., 2002).Hydraulic conductivity (Kh) was calculated as K divided by thecross-section xylem area of the sample. Ks was then calculated asKh multiplied by sample length (Cruiziat et al., 2002).The distaldiameter of these segments varied from 2–4 mm and they were
0.4–1.10 m in length. All leaves located distally from the mea-sured branch were collected and their area was calculated using aportable leaf area meter (CI-202; CID Inc.). Kleaf was calculatedas Kh divided by the total leaf area of the branch (Venturas et al.,2016).
Statistical analysis
In order to evaluate if species occurring in contrasting habitatsdiffered in their vulnerability to xylem embolism formation (P50values; H1), we used a fixed-effect model. We used a linearmixed-effect model, with species as a random effect on intercept,to test if habitat type affected xylem vulnerability to hydraulicfailure (SM values; H2). Student’s t-test was used to compare theSM values found in this study with the angiosperms’ SM globalmean (c. 0.5MPa) reported by Choat et al. (2012).
In order to investigate if congeneric species from contrastinghabitats differed in their leaf, wood and hydraulic traits (H3), weused linear mixed-effect models (genera as a random effect onintercept) to determine the effect of soil texture (clay vs sandy)and water regime (flooded and nonflooded) on species’ func-tional traits. A principal component analysis (PCA) was used toassess the patterns of correlation between traits and to describehydraulic strategies of species in different habitats. Linear mixed-effect models (species as a random effect on intercept) were usedto determine the importance of habitat type on plant’s hydraulicstrategies (using score values of PCA axes 1 and 2 as the depen-dent variables). Only the congeneric data (11 species from thegenus Eschweilera, Licania, Protium and Swartzia) were used inthe analyses for testing H3. Only traits that were significantly dif-ferent between habitats (according to the mixed-effect modelresults) were used for the PCA-trait analysis.
In order to validate the linear mixed-effect models, we verifiedvisually if residuals were homogeneous and if there was any over-influential observation, using Cook’s distance as recommendedby Thomas et al. (2015). We also checked for normality of thefitted coefficients of the random terms. The residuals of the traitsthat did not meet the assumptions of a normal distribution (SLA,Ψmidday, P50, VA, VD, S : N ratio, Dmh, C : N ratio, Kleaf and ks)were log-transformed before analysis.
We also tested for a phylogenetic signal of all traits using theBlomberg K (Blomberg et al., 2003) and Pagel lambda (Pagel,1999), with significance tested by 999 permutations. We built aphylogenetic tree for our species using the backbone phylogenyof APG III (R201208029) available in PHYLOMATIC v.3 (Webb &Donoghue, 2005). Branch-lengths were estimated using Grafen’stransformation (Grafen, 1992). For all statistical analyses, weused R v.3.3.0 with base packages (R Core Team, 2016).
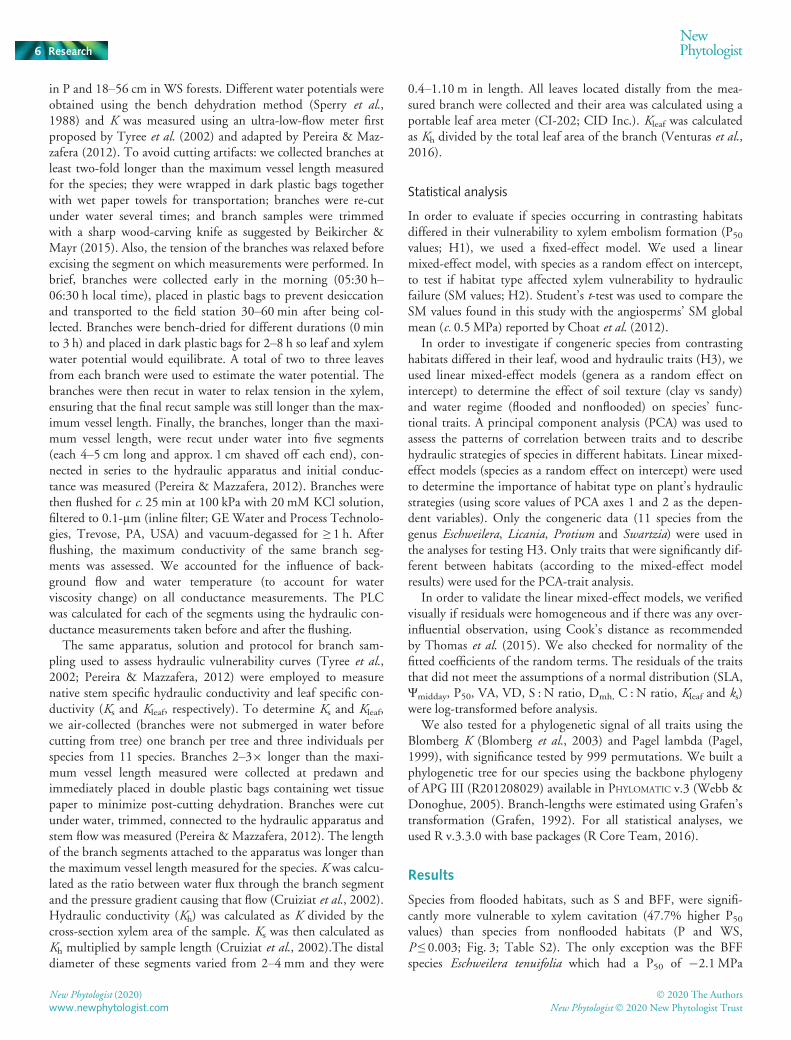
Results
Species from flooded habitats, such as S and BFF, were signifi-cantly more vulnerable to xylem cavitation (47.7% higher P50values) than species from nonflooded habitats (P and WS,P ≤ 0.003; Fig. 3; Table S2). The only exception was the BFFspecies Eschweilera tenuifolia which had a P50 of �2.1MPa
New Phytologist (2020) � 2020 The Authors
New Phytologist� 2020 New Phytologist Trustwww.newphytologist.com
Research
NewPhytologist6
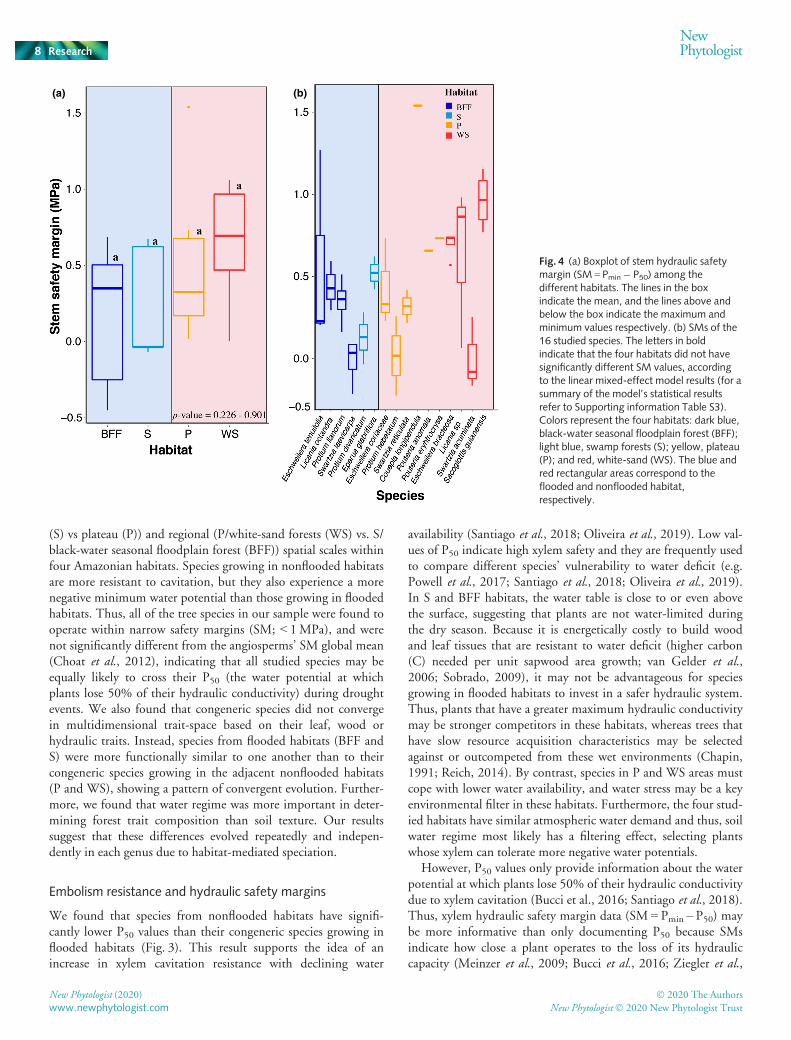
(Fig. 3b). These differences in P50 values were due mainly toenvironmental water regime (flooded vs nonflooded) and notspecifically to the habitat (BFF, S, P, WS) where the species werefound (Fig. 3a; Table S2). Despite the differences in embolismformation between flooded and nonflooded habitats, xylemhydraulic SM across the four habitats were not significantly dif-ferent (P = 0.226–0.901; Fig. 4; Table S3). We also found thatall species in this study operated with very narrow (< 1MPa) SMand were not significantly different from the angiosperms’ SMglobal mean (c. 0.5 MPa) reported by Choat et al. (2012)(t =�1.41, df = 46, P = 0.163). These results indicate that treesgrowing in the different Amazonian habitats may be equallylikely to cross their P50 or P88 (SMP88 = Pmin – P88) duringextreme droughts.
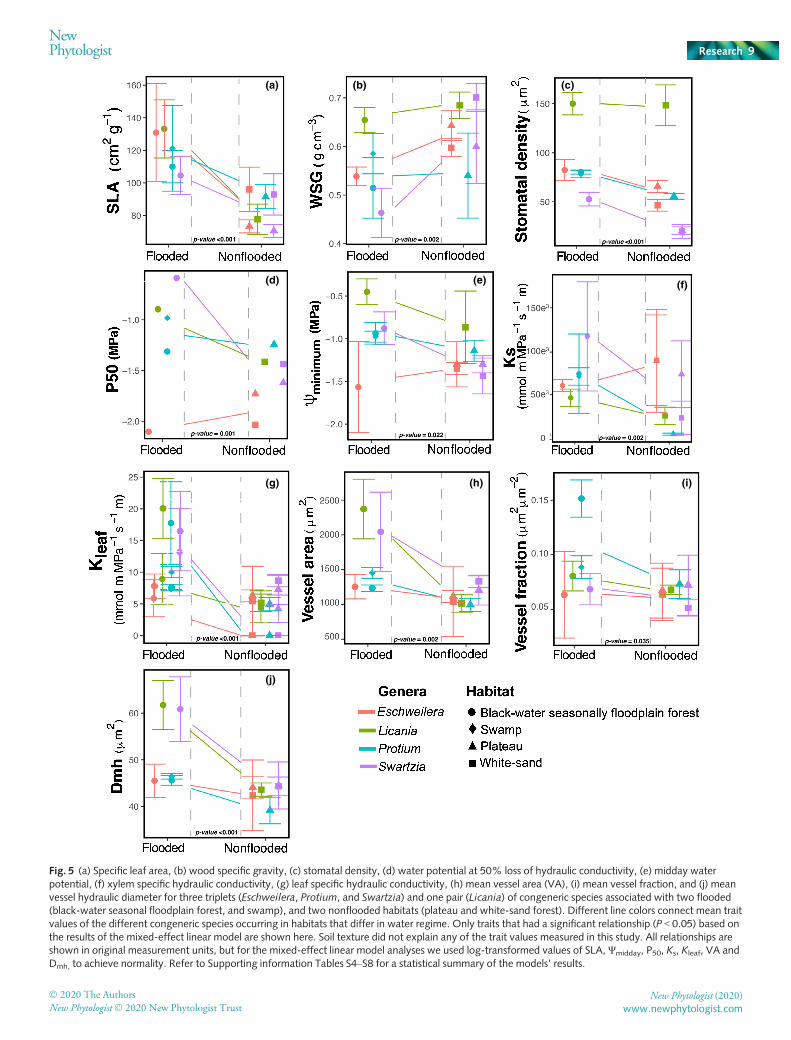
Species from flooded (BFF and S) and nonflooded habitats (Pand WS) showed significant differences in 10 of the 16 leaf, woodand hydraulic traits measured (Fig. 5; Tables S4–S7). These dif-ferences were explained primarily by water regime and not by soiltexture (Table S4–S7), supporting that water is probably a veryimportant factor shaping species distribution in the Amazon.Flooded habitat species had significantly higher mean values ofSLA (33.8%), Nstomata (37.9%), Ψmin (25.75%), P50 (46.4%),Kleaf (154.6%), Ks (27.1%), VA (39.3%), VF (33.8%) and Dmh(18.7%), whereas species from nonflooded habitats demonstratedhigher value of WSG (13.6%; Fig. 5). Vessel density, vessel size:number ratio, xylem SM, leaf C : N ratio, d13C and d15N did notdiffer significantly between the congeneric species occurring inthe four contrasting habitats (Tables S4–S7). Species mean, mini-mum and maximum values of the 16 functional traits are shownin Table S8.
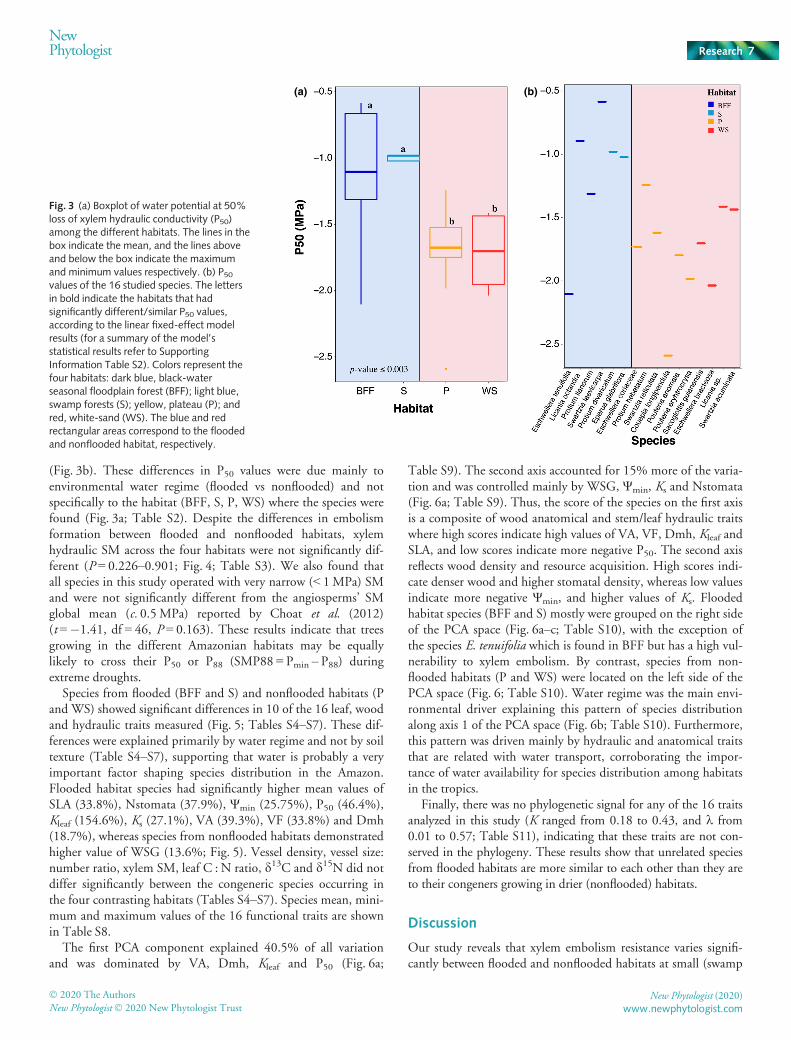
The first PCA component explained 40.5% of all variationand was dominated by VA, Dmh, Kleaf and P50 (Fig. 6a;
Table S9). The second axis accounted for 15% more of the varia-tion and was controlled mainly by WSG, Ψmin, Ks and Nstomata(Fig. 6a; Table S9). Thus, the score of the species on the first axisis a composite of wood anatomical and stem/leaf hydraulic traitswhere high scores indicate high values of VA, VF, Dmh, Kleaf andSLA, and low scores indicate more negative P50. The second axisreflects wood density and resource acquisition. High scores indi-cate denser wood and higher stomatal density, whereas low valuesindicate more negative Ψmin, and higher values of Ks. Floodedhabitat species (BFF and S) mostly were grouped on the right sideof the PCA space (Fig. 6a–c; Table S10), with the exception ofthe species E. tenuifolia which is found in BFF but has a high vul-nerability to xylem embolism. By contrast, species from non-flooded habitats (P and WS) were located on the left side of thePCA space (Fig. 6; Table S10). Water regime was the main envi-ronmental driver explaining this pattern of species distributionalong axis 1 of the PCA space (Fig. 6b; Table S10). Furthermore,this pattern was driven mainly by hydraulic and anatomical traitsthat are related with water transport, corroborating the impor-tance of water availability for species distribution among habitatsin the tropics.
Finally, there was no phylogenetic signal for any of the 16 traitsanalyzed in this study (K ranged from 0.18 to 0.43, and k from0.01 to 0.57; Table S11), indicating that these traits are not con-served in the phylogeny. These results show that unrelated speciesfrom flooded habitats are more similar to each other than they areto their congeners growing in drier (nonflooded) habitats.
Discussion
Our study reveals that xylem embolism resistance varies signifi-cantly between flooded and nonflooded habitats at small (swamp
(a) (b)
Fig. 3 (a) Boxplot of water potential at 50%loss of xylem hydraulic conductivity (P50)among the different habitats. The lines in thebox indicate the mean, and the lines aboveand below the box indicate the maximumand minimum values respectively. (b) P50values of the 16 studied species. The lettersin bold indicate the habitats that hadsignificantly different/similar P50 values,according to the linear fixed-effect modelresults (for a summary of the model’sstatistical results refer to SupportingInformation Table S2). Colors represent thefour habitats: dark blue, black-waterseasonal floodplain forest (BFF); light blue,swamp forests (S); yellow, plateau (P); andred, white-sand (WS). The blue and redrectangular areas correspond to the floodedand nonflooded habitat, respectively.
� 2020 The Authors
New Phytologist� 2020 New Phytologist TrustNew Phytologist (2020)
www.newphytologist.com
NewPhytologist Research 7
(S) vs plateau (P)) and regional (P/white-sand forests (WS) vs. S/black-water seasonal floodplain forest (BFF)) spatial scales withinfour Amazonian habitats. Species growing in nonflooded habitatsare more resistant to cavitation, but they also experience a morenegative minimum water potential than those growing in floodedhabitats. Thus, all of the tree species in our sample were found tooperate within narrow safety margins (SM; < 1MPa), and werenot significantly different from the angiosperms’ SM global mean(Choat et al., 2012), indicating that all studied species may beequally likely to cross their P50 (the water potential at whichplants lose 50% of their hydraulic conductivity) during droughtevents. We also found that congeneric species did not convergein multidimensional trait-space based on their leaf, wood orhydraulic traits. Instead, species from flooded habitats (BFF andS) were more functionally similar to one another than to theircongeneric species growing in the adjacent nonflooded habitats(P and WS), showing a pattern of convergent evolution. Further-more, we found that water regime was more important in deter-mining forest trait composition than soil texture. Our resultssuggest that these differences evolved repeatedly and indepen-dently in each genus due to habitat-mediated speciation.
Embolism resistance and hydraulic safety margins
We found that species from nonflooded habitats have signifi-cantly lower P50 values than their congeneric species growing inflooded habitats (Fig. 3). This result supports the idea of anincrease in xylem cavitation resistance with declining water
availability (Santiago et al., 2018; Oliveira et al., 2019). Low val-ues of P50 indicate high xylem safety and they are frequently usedto compare different species’ vulnerability to water deficit (e.g.Powell et al., 2017; Santiago et al., 2018; Oliveira et al., 2019).In S and BFF habitats, the water table is close to or even abovethe surface, suggesting that plants are not water-limited duringthe dry season. Because it is energetically costly to build woodand leaf tissues that are resistant to water deficit (higher carbon(C) needed per unit sapwood area growth; van Gelder et al.,2006; Sobrado, 2009), it may not be advantageous for speciesgrowing in flooded habitats to invest in a safer hydraulic system.Thus, plants that have a greater maximum hydraulic conductivitymay be stronger competitors in these habitats, whereas trees thathave slow resource acquisition characteristics may be selectedagainst or outcompeted from these wet environments (Chapin,1991; Reich, 2014). By contrast, species in P and WS areas mustcope with lower water availability, and water stress may be a keyenvironmental filter in these habitats. Furthermore, the four stud-ied habitats have similar atmospheric water demand and thus, soilwater regime most likely has a filtering effect, selecting plantswhose xylem can tolerate more negative water potentials.
However, P50 values only provide information about the waterpotential at which plants lose 50% of their hydraulic conductivitydue to xylem cavitation (Bucci et al., 2016; Santiago et al., 2018).Thus, xylem hydraulic safety margin data (SM = Pmin – P50) maybe more informative than only documenting P50 because SMsindicate how close a plant operates to the loss of its hydrauliccapacity (Meinzer et al., 2009; Bucci et al., 2016; Ziegler et al.,
(a) (b)
Fig. 4 (a) Boxplot of stem hydraulic safetymargin (SM = Pmin� P50) among thedifferent habitats. The lines in the boxindicate the mean, and the lines above andbelow the box indicate the maximum andminimum values respectively. (b) SMs of the16 studied species. The letters in boldindicate that the four habitats did not havesignificantly different SM values, accordingto the linear mixed-effect model results (for asummary of the model’s statistical resultsrefer to Supporting information Table S3).Colors represent the four habitats: dark blue,black-water seasonal floodplain forest (BFF);light blue, swamp forests (S); yellow, plateau(P); and red, white-sand (WS). The blue andred rectangular areas correspond to theflooded and nonflooded habitat,respectively.
New Phytologist (2020) � 2020 The Authors
New Phytologist� 2020 New Phytologist Trustwww.newphytologist.com
Research
NewPhytologist8
(a) (b) (c)
(d) (e)
(g)
(j)
(h) (i)
(f)
Fig. 5 (a) Specific leaf area, (b) wood specific gravity, (c) stomatal density, (d) water potential at 50% loss of hydraulic conductivity, (e) midday waterpotential, (f) xylem specific hydraulic conductivity, (g) leaf specific hydraulic conductivity, (h) mean vessel area (VA), (i) mean vessel fraction, and (j) meanvessel hydraulic diameter for three triplets (Eschweilera, Protium, and Swartzia) and one pair (Licania) of congeneric species associated with two flooded(black-water seasonal floodplain forest, and swamp), and two nonflooded habitats (plateau and white-sand forest). Different line colors connect mean traitvalues of the different congeneric species occurring in habitats that differ in water regime. Only traits that had a significant relationship (P < 0.05) based onthe results of the mixed-effect linear model are shown here. Soil texture did not explain any of the trait values measured in this study. All relationships areshown in original measurement units, but for the mixed-effect linear model analyses we used log-transformed values of SLA, Ψmidday, P50, Ks, Kleaf, VA andDmh, to achieve normality. Refer to Supporting information Tables S4–S8 for a statistical summary of the models’ results.
� 2020 The Authors
New Phytologist� 2020 New Phytologist TrustNew Phytologist (2020)
www.newphytologist.com
NewPhytologist Research 9
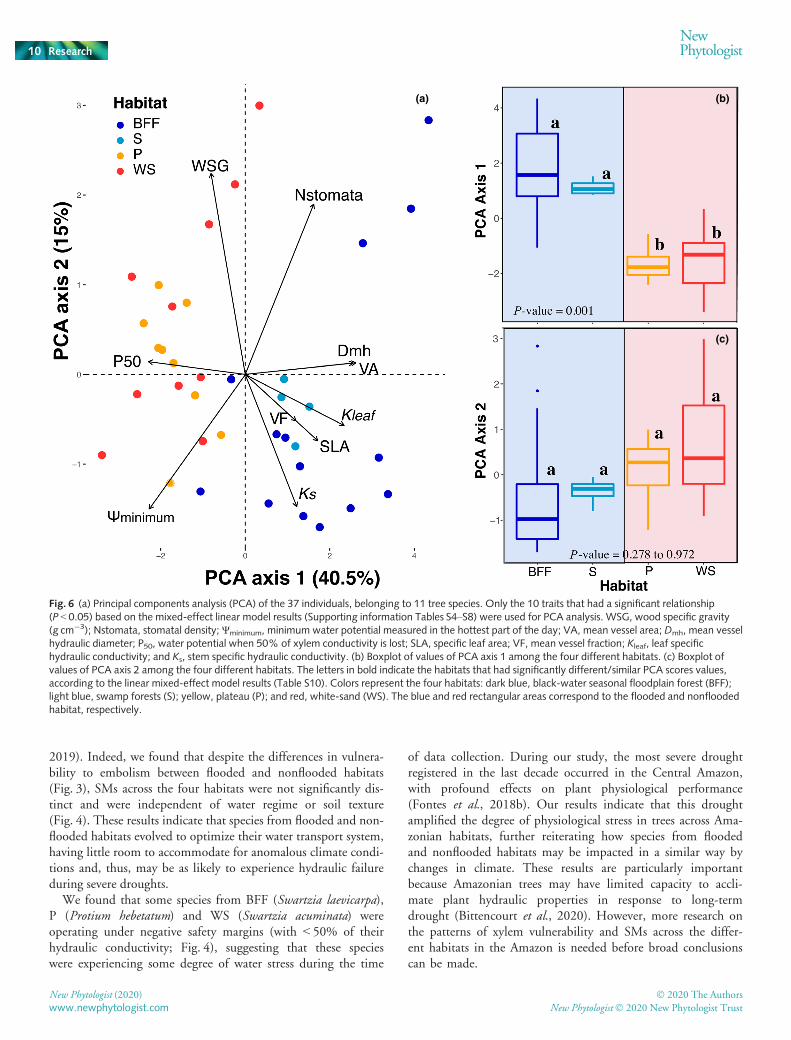
2019). Indeed, we found that despite the differences in vulnera-bility to embolism between flooded and nonflooded habitats(Fig. 3), SMs across the four habitats were not significantly dis-tinct and were independent of water regime or soil texture(Fig. 4). These results indicate that species from flooded and non-flooded habitats evolved to optimize their water transport system,having little room to accommodate for anomalous climate condi-tions and, thus, may be as likely to experience hydraulic failureduring severe droughts.
We found that some species from BFF (Swartzia laevicarpa),P (Protium hebetatum) and WS (Swartzia acuminata) wereoperating under negative safety margins (with < 50% of theirhydraulic conductivity; Fig. 4), suggesting that these specieswere experiencing some degree of water stress during the time
of data collection. During our study, the most severe droughtregistered in the last decade occurred in the Central Amazon,with profound effects on plant physiological performance(Fontes et al., 2018b). Our results indicate that this droughtamplified the degree of physiological stress in trees across Ama-zonian habitats, further reiterating how species from floodedand nonflooded habitats may be impacted in a similar way bychanges in climate. These results are particularly importantbecause Amazonian trees may have limited capacity to accli-mate plant hydraulic properties in response to long-termdrought (Bittencourt et al., 2020). However, more research onthe patterns of xylem vulnerability and SMs across the differ-ent habitats in the Amazon is needed before broad conclusionscan be made.
(a) (b)
(c)
Fig. 6 (a) Principal components analysis (PCA) of the 37 individuals, belonging to 11 tree species. Only the 10 traits that had a significant relationship(P < 0.05) based on the mixed-effect linear model results (Supporting information Tables S4–S8) were used for PCA analysis. WSG, wood specific gravity(g cm�3); Nstomata, stomatal density; Ψminimum, minimum water potential measured in the hottest part of the day; VA, mean vessel area; Dmh, mean vesselhydraulic diameter; P50, water potential when 50% of xylem conductivity is lost; SLA, specific leaf area; VF, mean vessel fraction; Kleaf, leaf specifichydraulic conductivity; and Ks, stem specific hydraulic conductivity. (b) Boxplot of values of PCA axis 1 among the four different habitats. (c) Boxplot ofvalues of PCA axis 2 among the four different habitats. The letters in bold indicate the habitats that had significantly different/similar PCA scores values,according to the linear mixed-effect model results (Table S10). Colors represent the four habitats: dark blue, black-water seasonal floodplain forest (BFF);light blue, swamp forests (S); yellow, plateau (P); and red, white-sand (WS). The blue and red rectangular areas correspond to the flooded and nonfloodedhabitat, respectively.
New Phytologist (2020) � 2020 The Authors
New Phytologist� 2020 New Phytologist Trustwww.newphytologist.com
Research
NewPhytologist10
Leaf, wood and hydraulic traits across contrastingAmazonian habitats
We found strong trait variation between flooded (BFF and S)and nonflooded (P and WS) Amazonian habitats. Species from Pand WS forests were more functionally similar to each other thanto their congeneric species growing in neighboring BFF or Sareas. This result was surprising, especially because WS and Pforests are very different habitats and therefore could be expectedto select for very different hydraulic strategies. Plateau soils havemuch higher clay fraction, compared to Brazilian WS, havehigher nutrient availability, trees are taller (canopy heightapprox. 30 m), and the understory has lower solar radiation andhigher relative humidity (Fine et al., 2006; Baraloto et al., 2011;Stropp et al., 2011, 2014; Fortunel et al., 2012; Damasco et al.,2013). Thus, the fact that P and WS forests were not significantlydifferent in any of the hydraulic traits measured in this studyreinforces the idea that water regime, specially access to ground-water, can be a strong predictor of species hydraulic functionalcomposition (Fortunel et al., 2013; Cosme et al., 2017; Chitra-Tarak et al., 2018; Medeiros et al., 2019).
Species from nonflooded habitats had a higher leaf mass perunit area (lower SLA) and higher wood specific gravity (denserwood) than their congeneric species from flooded areas (Fig. 5a,b). These results suggest that nonflooded habitat species mayinvest more in tissue quality to enhance the retention of capturedresources, protection against herbivores, mechanical strengthand/or longer leaf lifespans (Reich et al., 1997; Westoby, 1998;Fortunel et al., 2013; Kunstler et al., 2016) than their congenericspecies from flooded habitats. In contrast, species from floodedareas had a larger vessel area and wider vessel hydraulic diameters(Fig. 5h,j). Wider vessels can transport water, oxygen and nutri-ents more efficiently, and allow plants to achieve higher maxi-mum hydraulic conductivity; however, it also can make themmore vulnerable to water stress (higher risk of xylem cavitation;Fig. 5c–h; Sperry et al., 2006; Gleason et al., 2016; Hacke et al.,2017). Neither VD, vessel size (S) : number (N) ratio, xylem SM,leaf C : nitrogen (N) ratio, d13C nor d15N differed significantlybetween the congeneric species occurring in the four contrastingenvironments (Tables S4–S7). These results are consistent withthe findings of Cosme et al.(2017) who reported similar traitcombinations for species associated with swamp (valley) vsplateau forests. Therefore, our results suggest that species fromthe studied flooded Amazonian habitats have a tendency towards‘fast-resource-acquisition strategies’, sensu Reich (2014), whereastrees in the nonflooded areas have traits that enhance resistanceand resource conservation.
We acknowledge that the traits measured in this study maynot represent all of the most important traits underlying habitatpartitioning (Fortunel et al., 2013; Fortunel et al., 2014; D�ıazet al., 2016; Cosme et al., 2017). However, we were able to detecta combination of traits that could restrict flooded habitat speciesfrom establishing in nonflooded areas of the Amazon forest. Also,our study provides further evidence that tropical tree communi-ties are not randomly assembled. Instead, niche-based processes,such as competition and environmental filtering, are key
processes shaping community assemblage in these megadiversesystems (Baraloto et al., 2012; Fortunel et al., 2013; Cosme et al.,2017; Oliveira et al., 2019). All of the wood, leaf and hydraulictraits that we measured showed strong signals of convergent evo-lution to environmental drivers rather than phylogenetic conser-vatism. Thus, functional traits within flooded vs nonfloodedenvironments in the Amazon are similar in unrelated tree species,and these trait combinations have either evolved repeatedly andindependently across many different phylogenetic lineages oradjusted morphologically (through plasticity) to the local envi-ronment. These patterns can be explained by convergent evolu-tion in functional traits along life-history trade-off axes, incombination with local environmental sorting processes (For-tunel et al., 2013; Gleason et al., 2016; Leibold & Chase, 2017).Moreover, the different environmental conditions found in theAmazon may be a key factor in promoting local speciation byimposing strong environmental selective pressure in local popula-tions (Leibold & Chase, 2017). Other studies have pointed outthat habitat specialists in the Amazonian flora have evolved mul-tiple times in many different lineages (e.g. Fine & Baraloto,2016). Here, we provide empirical results showing that oneimportant mechanism to explain how habitat specializationevolves, is likely related to hydraulic traits measured in our study.Moreover, the fact that species within the genera which we stud-ied are restricted to only a subset of the four major habitats,strongly suggests that hydraulic traits are labile but become fixedat the species level, probably due to the trade-offs inherent inbeing successful in a flooded or nonflooded habitat. Such habi-tat-mediated trade-offs would select against intermediate pheno-types, driving the evolution of habitat-specific hydraulic traits. Inaddition, phenotypic plasticity in hydraulic traits is unlikely to bean alternative strategy because we find such consistent patternsamong unrelated plant lineages.
Much of the variation that we found in hydraulic and anatom-ical traits was related with PCA axis 1, which was also the axisresponsible for the clear separation between flooded and non-flooded habitats in the PCA space (Fig. 6). These results highlightthe importance of hydraulic-related traits in species segregationamong the habitats and have strong implications for modelingtropical species response to changes in climate. Recently, newermodels such as TFS-Hydro (Christoffersen et al., 2016), Com-munity Land Model v.5 (CLM5) and Ecosystem Demographymodel 2 (ED2; Xu et al., 2016) have incorporated planthydraulic traits, making substantial improvements in the predic-tions of vegetation response to changes in temperature and wateravailability (Anderegg et al., 2016; Eller et al., 2018).
To the best of our knowledge, the present study is the first toassess plant anatomical (e.g. mean vessel hydraulic diameter(Dmh) and vessel area (VA)) and hydraulic traits (e.g. P50, SM,specific hydraulic conductivity and leaf specific conductivity (Ks
and Kleaf)) in the four main forested habitats of the AmazonBasin. We show for the first time that, based on their SM values,trees from flooded and nonflooded habitats may be impacted in asimilar way by future drought events and that water regime atlocal scales is important for explaining trait variability in Amazo-nian forests. Although such findings help us understand the
� 2020 The Authors
New Phytologist� 2020 New Phytologist TrustNew Phytologist (2020)
www.newphytologist.com
NewPhytologist Research 11
processes shaping community assemblages in the tropics, furtherchallenges remain. An exciting and expanding area of study is therole of trait plasticity and acclimation in species survival in dryerand warmer conditions (e.g. Drake et al., 2018). Also, studies likethe one presented here would benefit by adding similar data andanalyses from reciprocal transplant experiments among the con-trasting Amazonian habitats to test for local adaptation in tropi-cal tree species’ lineages (e.g. Fine et al., 2006; Fortunel et al.,2016). Finally, understanding how hydraulic traits vary amonghabitats (locally and regionally) combined with an improvedunderstanding of their role in species distribution will improveour ability to accurately predict how plant communities in theAmazon will be impacted by future climatic events.
Acknowledgements
The data collection was supported by the Next GenerationEcosystem Experiment-Tropics project, Department of Energy,Office of Science – contract no. DE-AC02-05CH11231. Addi-tional funding for this research was provided by the University ofCalifornia at Berkeley, Department of Integrative Biologythrough the Research Grant. CGF received a PhD scholarshipfrom the Science Without Boarders Program – Brazil (award no.99999.001262/2013-00), through the Coordenac�~ao de Aper-feic�oamento de Pessoal de N�ıvel Superior (CAPES). PRLBacknowledges the Royal Society for its Newton International Fel-lowship (NF170370). We thank the Forest Management Labora-tory (LMF) at Instituto Nacional de Pesquisas da Amazonia(INPA) and the Large-Scale Biosphere-Atmosphere Program(LBA) – INPA for contributing with climatic data, scientific and/or logistical support. We thank all Dawson Laboratory membersand the two anonymous reviewers for insightful feedback thatenhanced the manuscript.
Author contributions
CGF, PVAF, TED and JQC planned and designed the research;CFG performed measurements and conducted fieldwork; CFGperformed statistical analyses and wrote the manuscript; CFG,PVAF, PRLB, FW, NH, MTFP, JQC and TED revised and pro-vided comments on the manuscript; and FW, NH, MTFP andJQC provided financial and/or logistical support.
ORCID
Paulo R. L. Bittencourt https://orcid.org/0000-0002-1618-9077Jeffrey Q. Chambers https://orcid.org/0000-0003-3983-7847Todd E. Dawson https://orcid.org/0000-0002-6871-3440Paul V. A. Fine https://orcid.org/0000-0002-0550-5628Clarissa G. Fontes https://orcid.org/0000-0003-4712-3764Niro Higuchi https://orcid.org/0000-0002-1203-4502Maria Teresa Fernandez Piedade https://orcid.org/0000-0002-7320-0498Florian Wittmann https://orcid.org/0000-0001-9180-356X
References
Adeney JM, Christensen NL, Vicentini A, Cohn-Haft M. 2016.White-sand
ecosystems in Amazonia. Biotropica 48: 7–23.Anderegg WR, Klein T, Bartlett M, Sack L, Pellegrini AF, Choat B, Jansen S.
2016.Meta-analysis reveals that hydraulic traits explain cross-species patterns
of drought-induced tree mortality across the globe. Proceedings of the NationalAcademy of Sciences, USA 113: 5024–5029.
Andreae M, Acevedo O, Ara�ujo A, Artaxo P, Barbosa C, Barbosa H, Brito J,
Carbone S, Chi X, Cintra B et al. 2015. The Amazon Tall Tower Observatory
(ATTO): overview of pilot measurements on ecosystem ecology, meteorology,
trace gases, and aerosols. Atmospheric Chemistry and Physics 15: 10723–10776.Assis RL, Wittmann F, Piedade MTF, Haugaasen T. 2015. Effects of
hydroperiod and substrate properties on tree alpha diversity and composition in
Amazonian floodplain forests. Plant Ecology 216: 41–54.Baraloto C, Hardy OJ, Paine C, Dexter KG, Cruaud C, Dunning LT, Gonzalez
MA, Molino JF, Sabatier D, Savolainen V et al. 2012. Using functional traits
and phylogenetic trees to examine the assembly of tropical tree communities.
Journal of Ecology 100: 690–701.Baraloto C, Rabaud S, Molto Q, Blanc L, Fortunel C, Herault B, Davila N,
Mesones I, Rios M, Valderrama E. 2011. Disentangling stand and
environmental correlates of aboveground biomass in Amazonian forests. GlobalChange Biology 17: 2677–2688.
Beikircher B, Mayr S. 2015. Avoidance of harvesting and sampling artefacts in
hydraulic analyses: a protocol tested on Malus domestica. Tree Physiology 36:797–803.
Bittencourt PRL, Oliveira RS, da Costa ACL, Giles AL, Coughlin I, Costa
PB, Bartholomew DC, Ferreira LV, Vasconcelos SS, Barros FV. 2020.
Amazonian trees have limited capacity to acclimate plant hydraulic
properties in response to long-term drought. Global Change Biology 1–16.doi: 10.1111/gcb.15040.
Blackman CJ, Gleason SM, Chang Y, Cook AM, Laws C, Westoby M. 2014.
Leaf hydraulic vulnerability to drought is linked to site water availability across
a broad range of species and climates. Annals of botany 114: 435–440.Blomberg SP, Garland T Jr, Ives AR. 2003. Testing for phylogenetic signal in
comparative data: behavioral traits are more labile. Evolution 57: 717–745.Bonal D, Burban B, Stahl C, Wagner F, H�erault B. 2016. The response oftropical rainforests to drought—lessons from recent research and future
prospects. Annals of Forest Science 73: 27–44.Bucci SJ, Goldstein G, Scholz FG, Meinzer FC. 2016. Physiological significance
of hydraulic segmentation, nocturnal transpiration and capacitance in tropical
trees: Paradigms revisited. In: Goldstein G, Santiago L, eds. Tropical treephysiology. Tree physiology 6. Cham: Springer.
Chapin FS. 1991. Integrated responses of plants to stress. BioScience 41: 29–36.Chitra-Tarak R, Ruiz L, Dattaraja HS, Mohan Kumar MS, Riotte J, Suresh HS,
McMahon SM, Sukumar R. 2018. The roots of the drought: Hydrology and
water uptake strategies mediate forest-wide demographic response to
precipitation. Journal of Ecology 106: 1495–1507.Choat B, Jansen S, Brodribb TJ, Cochard H, Delzon S, Bhaskar R, Bucci SJ,
Feild TS, Gleason SM, Hacke UG et al. 2012. Global convergence in the
vulnerability of forests to drought. Nature 491: 752–755.Christoffersen BO, Gloor M, Fauset S, Fyllas NM, Galbraith DR, Baker TR,
Kruijt B, Rowland L, Fisher RA, Binks OJ. 2016. Linking hydraulic traits to
tropical forest function in a size-structured and trait-driven model (TFS v. 1-
Hydro). Geoscientific Model Development 9: 4227.Connell JH. 1978. Diversity in tropical rain forests and coral reefs. Science 199:1302–1310.
Cosme LH, Schietti J, Costa FR, Oliveira RS. 2017. The importance of
hydraulic architecture to the distribution patterns of trees in a central
Amazonian forest. New Phytologist 215: 113–125.Cruiziat P, Cochard H, Amglio T. 2002.Hydraulic architecture of trees: main
concepts and results. Annals of Forest Science 59: 723–752.Damasco G, Vicentini A, Castilho CV, Pimentel TP, Nascimento HE. 2013.
Disentangling the role of edaphic variability, flooding regime and topography
of Amazonian white-sand vegetation. Journal of Vegetation Science 24: 384–394.
New Phytologist (2020) � 2020 The Authors
New Phytologist� 2020 New Phytologist Trustwww.newphytologist.com
Research
NewPhytologist12
D�ıaz S, Kattge J, Cornelissen JH, Wright IJ, Lavorel S, Dray S, Reu B, Kleyer
M, Wirth C, Prentice IC et al. 2016. The global spectrum of plant form and
function. Nature 529: 167.Doughty CE, Goulden ML. 2008. Are tropical forests near a high temperature
threshold? Journal of Geophysical Research: Biogeosciences 113: 1–12.Drake JE, Tjoelker MG, V�arhammar A, Medlyn BE, Reich PB, Leigh A,
Pfautsch S, Blackman CJ, L�opez R, Aspinwall MJ et al. 2018. Trees toleratean extreme heatwave via sustained transpirational cooling and increased leaf
thermal tolerance. Global Change Biology 24: 2390–2402.Eller CB, Rowland L, Oliveira RS, Bittencourt PRL, Barros FV, da Costa ACL,
Meir P, Friend AD, Mencuccini M, Sitch S. 2018.Modelling tropical forest
responses to drought and El Ni~no with a stomatal optimization model based on
xylem hydraulics. Philosophical Transactions of the Royal Society of London. SeriesB: Biological Sciences 373: 20170315.
Engelbrecht BM, Comita LS, Condit R, Kursar TA, Tyree MT, Turner BL,
Hubbell SP. 2007. Drought sensitivity shapes species distribution patterns in
tropical forests. Nature 447: 80–82.Ferraz J, Ohta S, Sales Pd. 1998. Distribuic�~ao dos solos ao longo de doistransectos em floresta prim�aria ao norte de Manaus (AM). In: Higuchi N,
Campos MAA, Sampaio PTB, Santos J, eds. Pesquisas Florestais para aConservac�~ao da Floresta e Reabilitac�~ao de �Areas Degradadas da Amazonia.Manaus, Amazonas: Instituto Nacional de Pesquisas da Amazonia, 110–143.
Fine PV. 2015. Ecological and evolutionary drivers of geographic variation in
species diversity. Annual Review of Ecology, Evolution, and Systematics 46: 369–392.
Fine PV, Baraloto C. 2016.Habitat endemism in white-sand forests: insights into
the mechanisms of lineage diversification and community assembly of the
Neotropical flora. Biotropica 48: 24–33.Fine PV, Kembel SW. 2011. Phylogenetic community structure and
phylogenetic turnover across space and edaphic gradients in western
Amazonian tree communities. Ecography 34: 552–565.Fine PV, Miller ZJ, Mesones I, Irazuzta S, Appel HM, Stevens MHH,
S€a€aksj€arvi I, Schultz JC, Coley PD. 2006. The growth–defense trade-off andhabitat specialization by plants in Amazonian forests. Ecology 87: S150–S162.
Fontes CG, Chambers JQ, Higuchi N. 2018a. Revealing the causes and temporal
distribution of tree mortality in Central Amazonia. Forest Ecology andManagement 424: 177–183.
Fontes CG, Dawson TE, Jardine K, McDowell N, Gimenez BO, Anderegg L,
Negr�on-Ju�arez R, Higuchi N, Fine PV, Ara�ujo AC. 2018b. Dry and hot: the
hydraulic consequences of a climate change–type drought for Amazonian trees.
Philosophical Transactions of the Royal Society of London. Series B: BiologicalSciences 373: 20180209.
Fortunel C, Fine PVA, Baraloto C, Dalling J. 2012. Leaf, stem and root tissue
strategies across 758 Neotropical tree species. Functional Ecology 26(5): 1153–1161.
Fortunel C, Paine CET, Fine PVA, Kraft NJB, Baraloto C, De Deyn G. 2014.
Environmental factors predict community functional composition in
Amazonian forests. Journal of Ecology 102: 145–155.Fortunel C, Paine CT, Fine PV, Mesones I, Goret JY, Burban B, Cazal J,
Baraloto C. 2016. There’s no place like home: seedling mortality contributes to
the habitat specialisation of tree species across Amazonia. Ecology Letters 19:1256–1266.
Fortunel C, Ruelle J, Beauchene J, Fine PV, Baraloto C. 2013.Wood specific
gravity and anatomy of branches and roots in 113 Amazonian rainforest tree
species across environmental gradients. New Phytologist 202: 79–94.Fu R, Yin L, Li W, Arias PA, Dickinson RE, Huang L, Chakraborty S,
Fernandes K, Liebmann B, Fisher R et al. 2013. Increased dry-season length
over southern Amazonia in recent decades and its implication for future climate
projection. Proceedings of the National Academy of Sciences, USA 110: 18110–18115.
van Gelder H, Poorter L, Sterck F. 2006.Wood mechanics, allometry, and life-
history variation in a tropical rain forest tree community. New Phytologist 171:367–378.
Gleason SM, Westoby M, Jansen S, Choat B, Hacke UG, Pratt RB, Bhaskar R,
Brodribb TJ, Bucci SJ, Cao KF et al. 2016.Weak tradeoff between xylem
safety and xylem-specific hydraulic efficiency across the world’s woody plant
species. New Phytologist 209: 123–136.
Grafen A. 1992. The uniqueness of the phylogenetic regression. Journal ofTheoretical Biology 156: 405–423.
Hacke UG, Spicer R, Schreiber SG, Plavcov�a L. 2017. An ecophysiological and
developmental perspective on variation in vessel diameter. Plant, Cell &Environment 40: 831–845.
Jacobsen AL, Pratt RB, Davis SD, Ewers FW. 2007. Cavitation resistance and
seasonal hydraulics differ among three arid Californian plant communities.
Plant, Cell & Environment 30: 1599–1609.Klein T, Yakir D, Buchmann N, Gr€unzweig JM. 2014. Towards an advanced
assessment of the hydrological vulnerability of forests to climate change-
induced drought. New Phytologist 201: 712–716.Kunert N, Aparecido LMT, Wolff S, Higuchi N, dos Santos J, de Araujo AC,
Trumbore S. 2017. A revised hydrological model for the Central Amazon: the
importance of emergent canopy trees in the forest water budget. Agriculturaland Forest Meteorology 239: 47–57.
Kunstler G, Falster D, Coomes DA, Hui F, Kooyman RM, Laughlin DC,
Poorter L, Vanderwel M, Vieilledent G, Wright SJ et al. 2016. Plantfunctional traits have globally consistent effects on competition. Nature 529:204.
Leibold MA, Chase JM. 2017.Metacommunity ecology. Princeton, NJ, USA:
Princeton University Press.
Marengo JA, Souza CA, Thonicke K, Burton C, Halladay K, Betts RA, Soares
WR. 2018. Changes in climate and land use over the Amazon Region: current
and future variability and trends. Frontiers in Earth Science 6: 228.Marengo JA, Tomasella J, Alves LM, Soares WR, Rodriguez DA. 2011. The
drought of 2010 in the context of historical droughts in the Amazon region.
Geophysical Research Letters 38: 1–5. https://doi.org/10.1029/2011GL047436.
Medeiros CD, Scoffoni C, John GP, Bartlett MK, Inman-Narahari F, Ostertag
R, Cordell S, Giardina C, Sack L. 2019. An extensive suite of functional traits
distinguishes Hawaiian wet and dry forests and enables prediction of species
vital rates. Functional Ecology 33: 712–734.Medina E, Sobrado M, Herrera R. 1978. Significance of leaf orientation for leaf
temperature in an Amazonian sclerophyll vegetation. Radiation andEnvironmental Biophysics 15: 131–140.
Meinzer FC, Johnson DM, Lachenbruch B, McCulloh KA, Woodruff DR.
2009. Xylem hydraulic safety margins in woody plants: coordination of
stomatal control of xylem tension with hydraulic capacitance. FunctionalEcology 23: 922–930.
Oliveira RS, Costa FR, van Baalen E, de Jonge A, Bittencourt PR, Almanza Y,
Barros FdV, Cordoba EC, Fagundes MV, Garcia S. 2019. Embolism
resistance drives the distribution of Amazonian rainforest tree species along
hydro-topographic gradients. New Phytologist 221: 1457–1465.Pagel M. 1999. Inferring the historical patterns of biological evolution. Nature401: 877.
Parolin P, Wittmann F. 2010. Struggle in the flood: tree responses to flooding
stress in four tropical floodplain systems. AoB Plants 2010: 1–19.Pereira L, Mazzafera P. 2012. A low cost apparatus for measuring the xylem
hydraulic conductance in plants. Bragantia 71: 583–587.Phillips OL, Vargas PN, Monteagudo AL, Cruz AP, Zans MEC, S�anchez WG,
Yli-Halla M, Rose S. 2003.Habitat association among Amazonian tree species:
a landscape-scale approach. Journal of Ecology 91: 757–775.Powell TL, Wheeler JK, de Oliveira AAR, da Costa ACL, Saleska SR, Meir P,
Moorcroft PR. 2017. Differences in xylem and leaf hydraulic traits explain
differences in drought tolerance among mature Amazon rainforest trees. GlobalChange Biology 23: 4280–4293.
R Core Team. 2016. R: A language and environment for statistical com-puting.Vienna, Austria: R Foundation for Statistical Computing. [WWW document]
URL https://www.R-project.org/.
Reich PB. 2014. The world-wide ‘fast-slow’ plant economics spectrum: a traits
manifesto. Journal of Ecology 102: 275–301.Reich PB, Walters MB, Ellsworth DS. 1997. From tropics to tundra: global
convergence in plant functioning. Proceedings of the National Academy ofSciences, USA 94: 13730–13734.
Ribeiro J, Hopkins M, Vicentini A, Sothers C, Costa MdS, Brito Jd, Souza Md,
Martins L, Lohmann L, Assunc�~ao P. 1999. Flora da reserva Ducke: Flora dareserva Ducke: Flora da reserva Ducke: guia de identificac�~ao de plantas vasculares
� 2020 The Authors
New Phytologist� 2020 New Phytologist TrustNew Phytologist (2020)
www.newphytologist.com
NewPhytologist Research 13
de uma floresta de terra-firme na Amazonia Central. Manaus, Amazonas:
Instituto Nacional de Pesquisas da Amazonia.
Rinne H, Guenther A, Greenberg J, Harley P. 2002. Isoprene and monoterpene
fluxes measured above Amazonian rainforest and their dependence on light and
temperature. Atmospheric Environment 36: 2421–2426.Roberts J, Cabral OM, Costa Jd, McWilliam A, S�a TdA. 1996. An overview of
the leaf area index and physiological measurements during ABRACOS. In:
Gash JHC, Nobre CA, Roberts JM, Victoria RL, eds. Amazonian deforestationand climate. Chichester, UK: John Wiley & Sons.
Saatchi SS, Houghton RA, Dos Santos Alval�A RC, Soares JV, Yu Y. 2007.
Distribution of aboveground live biomass in the Amazon basin. Global ChangeBiology 13: 816–837.
Santiago LS, De Guzman ME, Baraloto C, Vogenberg JE, Brodie M, H�erault B,
Fortunel C, Bonal D. 2018. Coordination and trade-offs among hydraulic
safety, efficiency and drought avoidance traits in Amazonian rainforest canopy
tree species. New Phytologist 218: 1015–1024.Schietti J, Emilio T, Renn�o CD, Drucker DP, Costa FR, Nogueira A, Baccaro
FB, Figueiredo F, Castilho CV, Kinupp V. 2014. Vertical distance from
drainage drives floristic composition changes in an Amazonian rainforest. PlantEcology & Diversity 7: 241–253.
Schindelin J, Arganda-Carreras I, Frise E, Kaynig V, Longair M, Pietzsch T,
Preibisch S, Rueden C, Saalfeld S, Schmid B et al. 2012. Fiji: an open-source
platform for biological-image analysis. Nature Methods 9: 676.Scholander PF, Hammel H, Bradstreet ED, Hemmingsen E. 1965. Sap pressure
in vascular plants. Science 148: 339–346.Scholz A, Klepsch M, Karimi Z, Jansen S. 2013.How to quantify conduits in
wood? Frontiers in Plant Science 4: 56.Skelton RP, West AG, Dawson TE. 2015. Predicting plant vulnerability to
drought in biodiverse regions using functional traits. Proceedings of the NationalAcademy of Sciences, USA 112: 5744–5749.
Smith TB, Wayne RK, Girman DJ, Bruford MW. 1997. A role for ecotones in
generating rainforest biodiversity. Science 276: 1855–1857.Sobrado M. 2009. Leaf tissue water relations and hydraulic properties of
sclerophyllous vegetation on white sands of the upper Rio Negro in the
Amazon region. Journal of Tropical Ecology 25: 271–280.Sperry J, Donnelly J, Tyree M. 1988. A method for measuring hydraulic
conductivity and embolism in xylem. Plant, Cell & Environment 11: 35–40.Sperry JS, Hacke UG, Pittermann J. 2006. Size and function in conifer tracheids
and angiosperm vessels. American Journal of Botany 93: 1490–1500.ter Steege H, Sabatier D, Castellanos H, Van Andel T, Duivenvoorden J, De
Oliveira AA, Ek R, Lilwah R, Maas P, Mori S. 2000. An analysis of the
floristic composition and diversity of Amazonian forests including those of the
Guiana Shield. Journal of Tropical Ecology 16: 801–828.Stocker TF, Qin D, Plattner G-K, Tignor M, Allen SK, Boschung J, Nauels A,
Xia Y, Bex B, Midgley B. 2013. IPCC, 2013: climate change 2013: the physicalscience basis. Contribution of working group I to the fifth assessment report of theintergovernmental panel on climate change. Cambridge, UK: Cambridge
University Press.
Stropp J, van der Sleen P, Assunc�~ao PA, Silva AL, Steege HT. 2011. Tree
communities of white-sand and terra-firme forests of the upper Rio Negro. ActaAmazonica 41: 521–544.
Stropp J, van der Sleen P, Quesada CA, ter Steege H. 2014.Herbivory and
habitat association of tree seedlings in lowland evergreen rainforest on white-
sand and terra-firme in the upper Rio Negro. Plant Ecology & Diversity 7: 255–265.
Targhetta N, Kesselmeier J, Wittmann F. 2015. Effects of the hydroedaphic
gradient on tree species composition and aboveground wood biomass of
oligotrophic forest ecosystems in the central Amazon basin. Folia Geobotanica50: 185–205.
Thomas R, Lello J, Medeiros R, Pollard A, Robinson P, Seward A, Smith J,
Vafidis J, Vaughan I. 2015. Data analysis with R statistical software: a guidebookfor scientists. Cardiff, UK: Eco-explore.
Tng DY, Apgaua DM, Ishida YF, Mencuccini M, Lloyd J, Laurance WF,
Laurance SG. 2018. Rainforest trees respond to drought by modifying
their hydraulic architecture. Ecology and Evolution 8: 12479–12491.
Toledo JJ, Castilho CV, Magnusson WE, Nascimento HE. 2017. Soil controls
biomass and dynamics of an Amazonian forest through the shifting of species
and traits. Brazilian Journal of Botany 40: 451–461.Tomasella J, Hodnett MG, Cuartas LA, Nobre AD, Waterloo MJ, Oliveira SM.
2008. The water balance of an Amazonian micro-catchment: the effect of
interannual variability of rainfall on hydrological behaviour. HydrologicalProcesses: An International Journal 22: 2133–2147.
Tuomisto H, Ruokolainen K, Yli-Halla M. 2003. Dispersal, environment, and
floristic variation of western Amazonian forests. Science 299: 241–244.Tyree MT, Vargas G, Engelbrecht BMJ, Kursar TA. 2002. Drought until death
do us part: a case study of the desiccation-tolerance of a tropical moist forest
seedling-tree, Licania platypus (Hemsl.) Fritsch. Journal of Experimental Botany53: 2239–2247.
Valencia R, Foster RB, Villa G, Condit R, Svenning JC, Hern�andez C,Romoleroux K, Losos E, Mag�ard E, Balslev H. 2004. Tree species
distributions and local habitat variation in the Amazon: large forest plot in
eastern Ecuador. Journal of Ecology 92: 214–229.Venturas MD, MacKinnon ED, Dario HL, Jacobsen AL, Pratt RB, Davis SD.
2016. Chaparral shrub hydraulic traits, size, and life history types relate to
species mortality during California’s historic drought of 2014. PLoS ONE 11:
e0159145.
Webb CO, Donoghue MJ. 2005. Phylomatic: tree assembly for applied
phylogenetics.Molecular Ecology Notes 5: 181–183.Westoby M. 1998. A leaf-height-seed (LHS) plant ecology strategy scheme. Plantand Soil 199: 213–227.
Williamson GB, Wiemann MC. 2010.Measuring wood specific gravity. . .
correctly. American Journal of Botany 97: 519–524.Wittmann F, Householder E, Piedade MTF, de Assis RL, Sch€ongart J, Parolin P,
JunkWJ. 2013.Habitat specifity, endemism and the neotropical distribution of
Amazonian white-water floodplain trees. Ecography 36: 690–707.Wittmann F, Junk WJ. 2016. The Amazon River basin. In: Finlayson CM,
Milton GR, Prentice C, Davidson NC, eds. The wetland book: II: distribution,description and conservation. Amsterdam, the Netherlands: Springer, 1–20.
Xu X, Medvigy D, Powers JS, Becknell JM, Guan K. 2016. Diversity in plant
hydraulic traits explains seasonal and inter-annual variations of vegetation
dynamics in seasonally dry tropical forests. New Phytologist 212: 80–95.Zanne AE, Westoby M, Falster DS, Ackerly DD, Loarie SR, Arnold SE,
Coomes DA. 2010. Angiosperm wood structure: global patterns in vessel
anatomy and their relation to wood density and potential conductivity.
American Journal of Botany 97: 207–215.Ziegler C, Coste S, Stahl C, Delzon S, Levionnois S, Cazal J, Cochard H,
Esquivel-Muelbert A, Goret J-Y, Heuret P et al. 2019. Large hydraulic safetymargins protect Neotropical canopy rainforest tree species against hydraulic
failure during drought. Annals of Forest Science 76: 115.Zuleta D, Duque A, Cardenas D, Muller-Landau HC, Davies SJ. 2017.
Drought-induced mortality patterns and rapid biomass recovery in a terra firme
forest in the Colombian Amazon. Ecology 98: 2538–2546.
Supporting Information
Additional Supporting Information may be found online in theSupporting Information section at the end of the article.
Table S1 Tree species richness, density, DBH and basal area forthe four habitats sampled in this study.
Table S2 Summary of the statistical results of the linear fixed-ef-fect models for P50 across the four different environments.
Table S3 A summary of the statistical results of the linear mixed-effect models for SM across the four different environments(SM = a + b (habitat) + u(species) + e).
New Phytologist (2020) � 2020 The Authors
New Phytologist� 2020 New Phytologist Trustwww.newphytologist.com
Research
NewPhytologist14
Table S4 Summary of the statistical results of the linear mixed-effect models for SLA, WSG and Nstomata (Trait = a + b (soiltype * water regime) + u(genus) + e).
Table S5 Summary of the statistical results of the linear mixed-effect models for the hydraulic traits.
Table S6 Summary of the statistical results of the linear mixed-effect models for the wood anatomy traits.
Table S7 Summary of the statistical results of the linear mixed-effect models for the stable isotope traits.
Table S8 Species mean, minimum and maximum values of thesixteen functional traits. Excel file.
Table S9 Loadings of Axis1 and Axis2 of the PCA-trait (Fig. 6).
Table S10 Summary of the statistical results of the linear mixed-effect models (PCA axis = a + b (habitat) + u(genus) + e) usingPCA axis 1 and PCA axis 2 across the four different environ-ments.
Table S11 Pagel’s lambda and Blomberg’s K for the 16 traitsanalyzed in this study.
Please note: Wiley Blackwell are not responsible for the contentor functionality of any Supporting Information supplied by theauthors. Any queries (other than missing material) should bedirected to the New Phytologist Central Office.
New Phytologist is an electronic (online-only) journal owned by the New Phytologist Trust, a not-for-profit organization dedicatedto the promotion of plant science, facilitating projects from symposia to free access for our Tansley reviews and Tansley insights.
Regular papers, Letters, Research reviews, Rapid reports and both Modelling/Theory and Methods papers are encouraged. We are committed to rapid processing, from online submission through to publication ‘as ready’ via Early View – our average timeto decision is <26 days. There are no page or colour charges and a PDF version will be provided for each article.
The journal is available online at Wiley Online Library. Visit www.newphytologist.com to search the articles and register for tableof contents email alerts.
If you have any questions, do get in touch with Central Office ([email protected]) or, if it is more convenient,our USA Office ([email protected])
For submission instructions, subscription and all the latest information visit www.newphytologist.com
� 2020 The Authors
New Phytologist� 2020 New Phytologist TrustNew Phytologist (2020)
www.newphytologist.com
NewPhytologist Research 15


![Convergent and Parallel Evolutionary Traits in Early ......International Journal of Paleobiology & Paleontology ISSN: 2642-1283 MEDI PBISHERS } u u ] © Z Convergent and Parallel Evolutionary](https://static.fdocuments.us/doc/165x107/60bb17eb08e8cd293230c8fd/convergent-and-parallel-evolutionary-traits-in-early-international-journal.jpg)