Conventional explanatory variables and bilateral trade for African countries 2000 and 2005
35
Discover the world at Leiden University Discover the world at Leiden University Conventional explanatory variables and bilateral trade for African countries 2000 and 2005 Omegal Mahabeer (1657461) | The Hague Course: Configuring the world project tutorial Group: 116 Tutor: Sebastian van Rijswijk, mPhil.
-
Upload
omegal-mahabeer -
Category
Documents
-
view
14 -
download
0
Transcript of Conventional explanatory variables and bilateral trade for African countries 2000 and 2005
Discover the world at Leiden UniversityDiscover the world at Leiden University
Conventional explanatory variables and bilateral trade for African countries 2000 and 2005
Omegal Mahabeer (1657461) | The Hague
Course: Configuring the world project tutorial Group: 116 Tutor: Sebastian van Rijswijk, mPhil.
Discover the world at Leiden University
Study structure
2
1
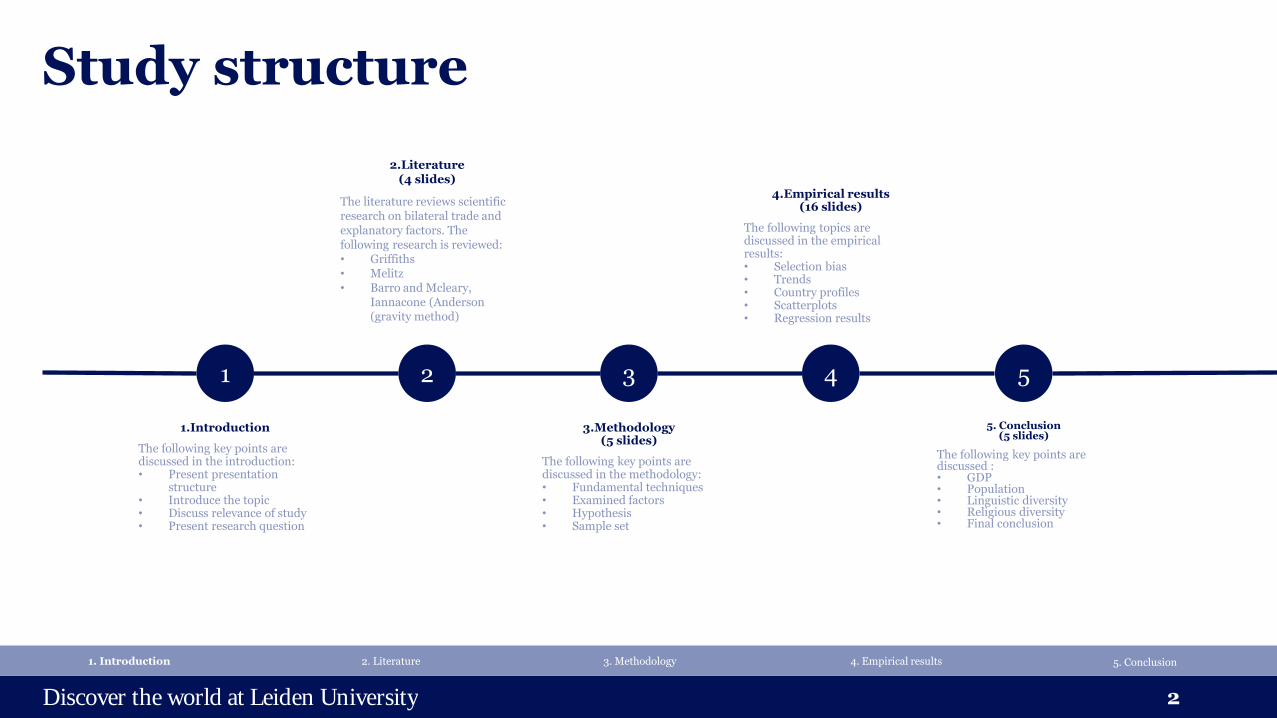
1.Introduction
The following key points are discussed in the introduction: • Present presentation
structure • Introduce the topic • Discuss relevance of study • Present research question
2
2.Literature (4 slides)
The literature reviews scientific research on bilateral trade and explanatory factors. The following research is reviewed: • Griffiths • Melitz • Barro and Mcleary,
Iannacone (Anderson (gravity method)
3
3.Methodology (5 slides)
The following key points are discussed in the methodology: • Fundamental techniques • Examined factors • Hypothesis • Sample set
4
4.Empirical results (16 slides)
The following topics are discussed in the empirical results: • Selection bias • Trends • Country profiles • Scatterplots • Regression results
5
5. Conclusion (5 slides)
The following key points are discussed : • GDP • Population • Linguistic diversity • Religious diversity • Final conclusion
1. Introduction 2. Literature 3. Methodology 4. Empirical results 5. Conclusion
Discover the world at Leiden University
Introduction
3
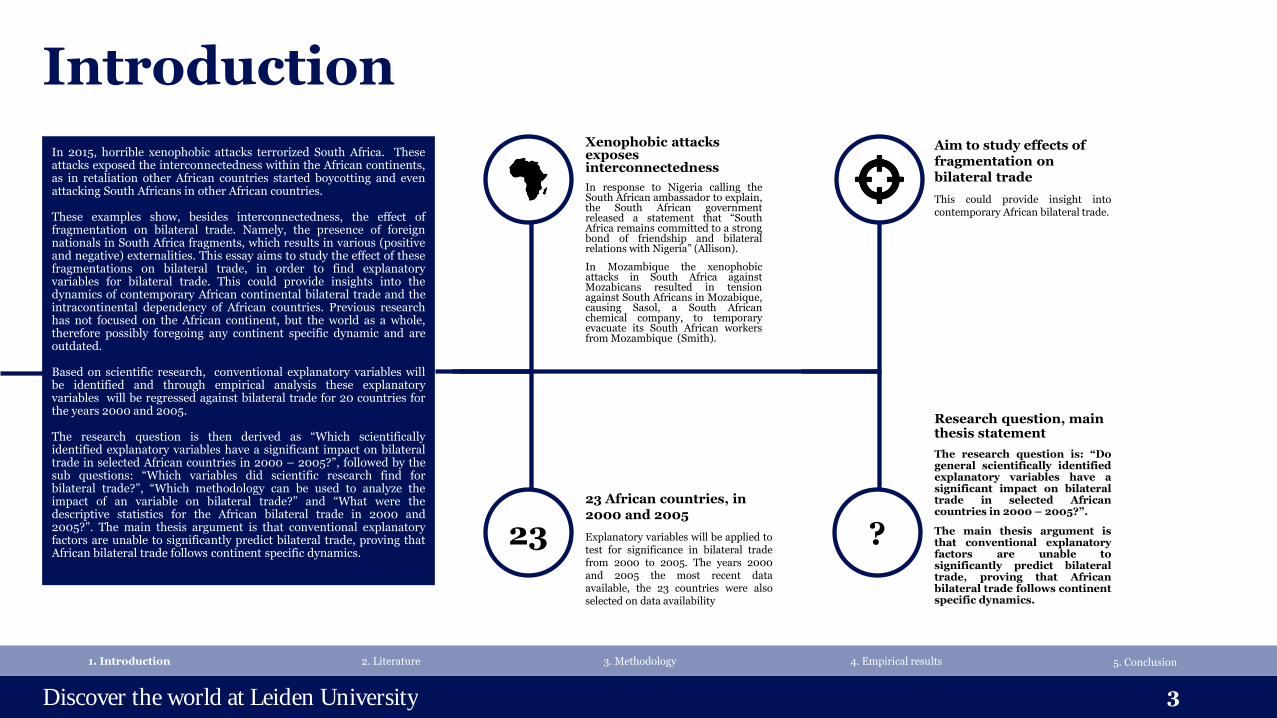
In 2015, horrible xenophobic attacks terrorized South Africa. These attacks exposed the interconnectedness within the African continents, as in retaliation other African countries started boycotting and even attacking South Africans in other African countries. These examples show, besides interconnectedness, the effect of fragmentation on bilateral trade. Namely, the presence of foreign nationals in South Africa fragments, which results in various (positive and negative) externalities. This essay aims to study the effect of these fragmentations on bilateral trade, in order to find explanatory variables for bilateral trade. This could provide insights into the dynamics of contemporary African continental bilateral trade and the intracontinental dependency of African countries. Previous research has not focused on the African continent, but the world as a whole, therefore possibly foregoing any continent specific dynamic and are outdated. Based on scientific research, conventional explanatory variables will be identified and through empirical analysis these explanatory variables will be regressed against bilateral trade for 20 countries for the years 2000 and 2005. The research question is then derived as “Which scientifically identified explanatory variables have a significant impact on bilateral trade in selected African countries in 2000 – 2005?”, followed by the sub questions: “Which variables did scientific research find for bilateral trade?”, “Which methodology can be used to analyze the impact of an variable on bilateral trade?” and “What were the descriptive statistics for the African bilateral trade in 2000 and 2005?”. The main thesis argument is that conventional explanatory factors are unable to significantly predict bilateral trade, proving that African bilateral trade follows continent specific dynamics.
Xenophobic attacks exposes interconnectedness
In response to Nigeria calling the South African ambassador to explain, the South African government released a statement that “South Africa remains committed to a strong bond of friendship and bilateral relations with Nigeria” (Allison).
In Mozambique the xenophobic attacks in South Africa against Mozabicans resulted in tension against South Africans in Mozabique, causing Sasol, a South African chemical company, to temporary evacuate its South African workers from Mozambique (Smith).
Aim to study effects of fragmentation on bilateral trade
This could provide insight into contemporary African bilateral trade.
23
23 African countries, in 2000 and 2005
Explanatory variables will be applied to test for significance in bilateral trade from 2000 to 2005. The years 2000 and 2005 the most recent data available, the 23 countries were also selected on data availability
?
Research question, main thesis statement
The research question is: “Do general scientifically identified explanatory variables have a significant impact on bilateral trade in selected African countries in 2000 – 2005?”.
The main thesis argument is that conventional explanatory factors are unable to significantly predict bilateral trade, proving that African bilateral trade follows continent specific dynamics.
1. Introduction 2. Literature 3. Methodology 4. Empirical results 5. Conclusion
Discover the world at Leiden University
Literature (1/4)
4
Griffiths
Key observations
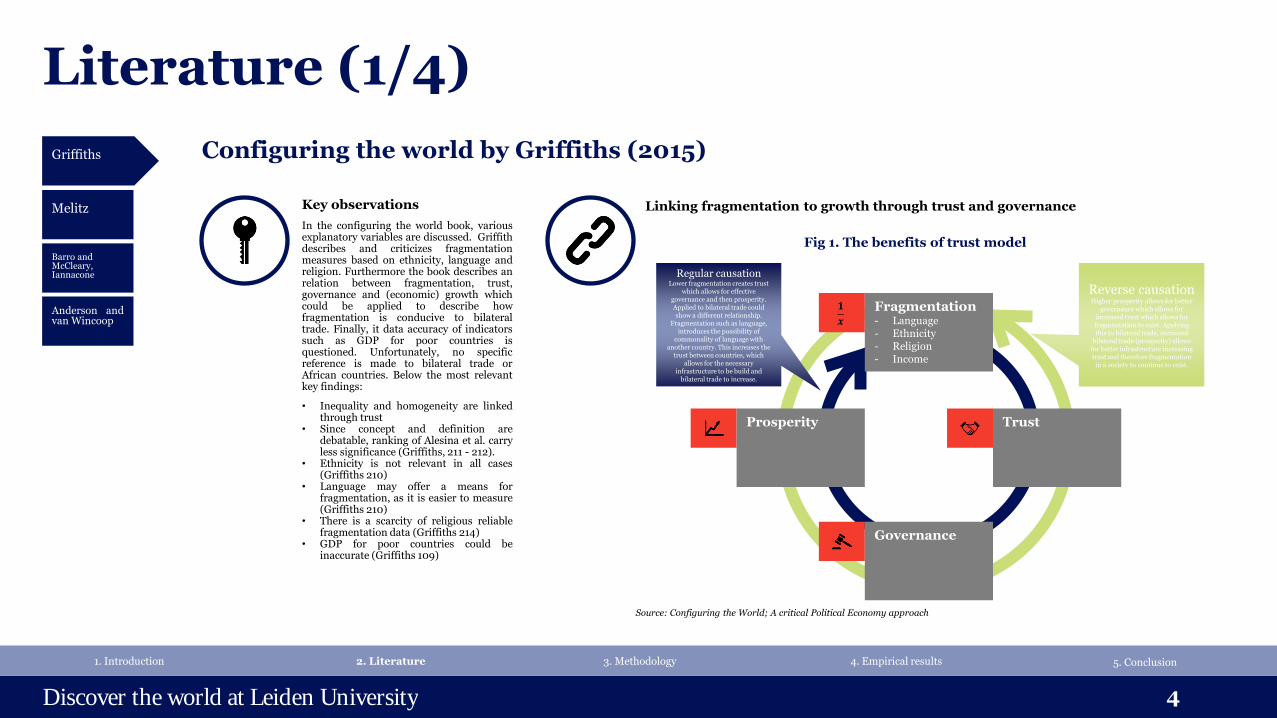
In the configuring the world book, various explanatory variables are discussed. Griffith describes and criticizes fragmentation measures based on ethnicity, language and religion. Furthermore the book describes an relation between fragmentation, trust, governance and (economic) growth which could be applied to describe how fragmentation is conducive to bilateral trade. Finally, it data accuracy of indicators such as GDP for poor countries is questioned. Unfortunately, no specific reference is made to bilateral trade or African countries. Below the most relevant key findings:
• Inequality and homogeneity are linked through trust
• Since concept and definition are debatable, ranking of Alesina et al. carry less significance (Griffiths, 211 - 212).
• Ethnicity is not relevant in all cases (Griffiths 210)
• Language may offer a means for fragmentation, as it is easier to measure (Griffiths 210)
• There is a scarcity of religious reliable fragmentation data (Griffiths 214)
• GDP for poor countries could be inaccurate (Griffiths 109)
1. Introduction 2. Literature 3. Methodology 4. Empirical results 5. Conclusion
Melitz
Barro and McCleary, Iannacone
Anderson and van Wincoop
Configuring the world by Griffiths (2015)
Linking fragmentation to growth through trust and governance
𝟏
𝒙
Fragmentation - Language - Ethnicity - Religion - Income
Trust
Governance
Prosperity
Regular causation Lower fragmentation creates trust
which allows for effective governance and then prosperity. Applied to bilateral trade could show a different relationship.
Fragmentation such as language, introduces the possibility of
commonality of language with another country. This increases the
trust between countries, which allows for the necessary
infrastructure to be build and bilateral trade to increase.
Reverse causation Higher prosperity allows for better
governance which allows for increased trust which allows for fragmentation to exist. Applying this to bilateral trade, increased
bilateral trade (prosperity) allows for better infrastructure increasing trust and therefore fragmentation in a society to continue to exist.
Source: Configuring the World; A critical Political Economy approach
Fig 1. The benefits of trust model
Discover the world at Leiden University
Literature (2/4)
5
Melitz
Key observations
Melitz finds that having a common language increases bilateral trade (BLT). To arrive to this conclusion the scholar regresses GDP, distance, adjacency, language variables, currency union, common country, free trade, ex colony, common colonizer, population, country area size, landlocked, lingual diversity, literacy and a soviet country dummy on bilateral trade for the period 1970 – 1995. Below the most relevant observations on this paper:
• Uses gravity model • Positive relationship language and BLT • Positive relationship GDP and BLT • Negative relationship distance and BLT • This paper is that it is outdated, for
example it uses a soviet dummy variable, which is irrelevant now.
• Does not specifically focus on African countries (where different dynamics could exists).
1. Introduction 2. Literature 3. Methodology 4. Empirical results 5. Conclusion
Griffiths
Barro and McCleary, Iannacone
Anderson and van Wincoop
Language and foreign trade by Melitz (2015)
The gravity model
The gravity model refers to a model in which the bilateral trade between countries is determined by the size of the countries. More specifically this means that 2 countries with larger GDP’s are more prone to engage in bilateral trade than 2 countries with smaller GDP’s. The same theory is used by Melitz for the distance and size of the country variable.
Discover the world at Leiden University
Literature (3/4)
6
Key observations
Barro and McCleary investigate the relation between religiosity and economic growth. Religiosity refers to the dedication to the religion. Religiosity was captured though variables such as church attendance, belief in heaven and hell, which was measured by surveys in 59 countries from 59 countries from 1981 – 1999. Iannaccone concluded that based on the World Religious Database and applying religion market dynamics proposed in Adam Smith’s Wealth of the Nations , the relationship between religiosity and fragmentation of the religion are country specific (Iannacconne 168 – 169). Combining these two researches the following observations are made:
• Barro and McCleary find a relationship between religiosity and economic growth.
• Ianncconne states that the relationship between religiosity and religious fragmentation is idiosyncratic
• Combining Barro and McCleary and Iannaconne, that there is probability of a relationship between economic growth and fragmentation, but this relationship would be country specific
• Criticism on both papers is that it is outdated
• Criticism Iannaccone paper is that it does not include African countries
• Criticism Iannaccone is that it used the World Christian Encyclopedia, this Encyclopedia is notorious for the bias towards keeping groups in their Christian Encyclopedia, or including villages which are not even Christian but close to Christian villages
1. Introduction 2. Literature 3. Methodology 4. Empirical results 5. Conclusion
Griffiths
Anderson
Religion and economic growth by Barro and McCleary (2003) and The consequences of religious market structure by Iannacone (1991)
Barro and McCleary, Iannacone
Melitz
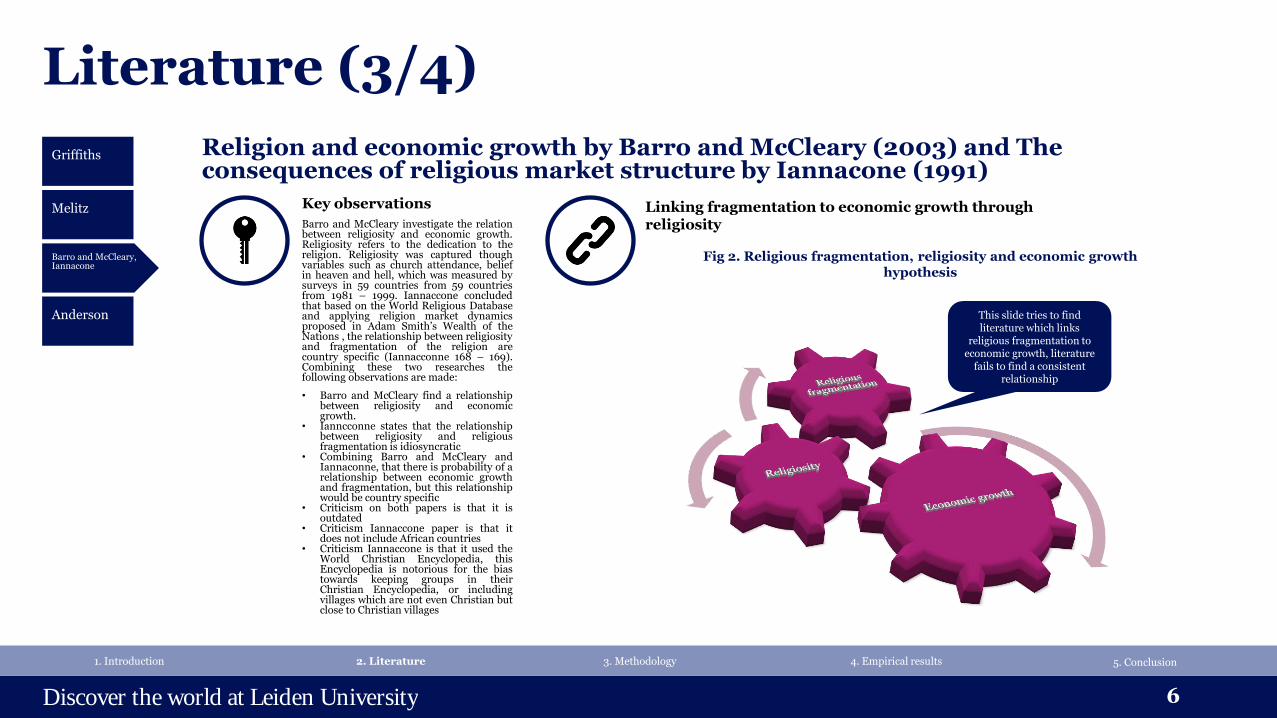
Linking fragmentation to economic growth through religiosity
This slide tries to find literature which links
religious fragmentation to economic growth, literature
fails to find a consistent relationship
Fig 2. Religious fragmentation, religiosity and economic growth hypothesis
Discover the world at Leiden University
Literature (4/4)
7
Key observations
Anderson explains the theoretical background behind the gravity model using variables GDP, population and distance to explain bilateral trade. Anderson refers to other scholars to state that these variables have been extensively proven through empirical research (Anderson 108). These are the key findings:
• The gravity model using GDP, population and distance between countries as explanatory variables have significant impact on bilateral trade, as proven through theoretical justification as well as empirical research.
• Distance impacts bilateral trade as it represents a proxy for transportation costs. Therefore the greater the distance between countries, the higher the transportation costs and therefore less bilateral trade.
• Size impacts bilateral trade as it represents a supply proxy. Therefore the greater the country the lower the price and the lower the value of the bilateral trade.
• Rearranging the Cobb – Douglas function proves how GDP affects bilateral trade.
• Criticism on the Anderson paper is that the explains the gravity model strictly based from a supply side perspective. Increase pf country size could perhaps also mean greater target market, which could increase bilateral trade.
1. Introduction 2. Literature 3. Methodology 4. Empirical results 5. Conclusion
Griffiths
A theoretical foundation for the Gravity Equation by Anderson (1979)
Melitz 𝒇(𝒙)
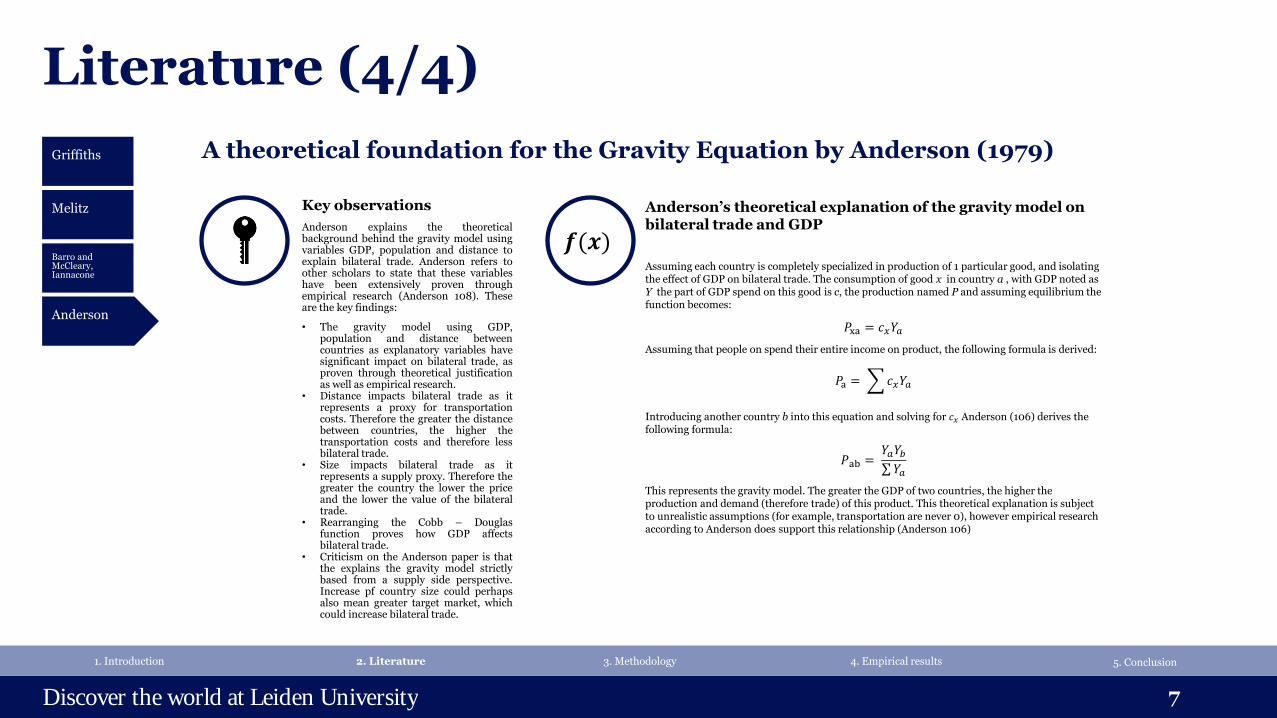
Anderson’s theoretical explanation of the gravity model on bilateral trade and GDP
Anderson
Barro and McCleary, Iannacone
Assuming each country is completely specialized in production of 1 particular good, and isolating the effect of GDP on bilateral trade. The consumption of good x in country a , with GDP noted as Y the part of GDP spend on this good is c, the production named P and assuming equilibrium the function becomes:
𝑃xa = 𝑐𝑥𝑌𝑎
Assuming that people on spend their entire income on product, the following formula is derived:
𝑃a = 𝑐𝑥𝑌𝑎
Introducing another country b into this equation and solving for 𝑐𝑥 Anderson (106) derives the following formula:
𝑃ab = 𝑌𝑎𝑌𝑏 𝑌𝑎
This represents the gravity model. The greater the GDP of two countries, the higher the production and demand (therefore trade) of this product. This theoretical explanation is subject to unrealistic assumptions (for example, transportation are never 0), however empirical research according to Anderson does support this relationship (Anderson 106)
Discover the world at Leiden University
Methodology (1/5)
8
1. Introduction 2. Literature 3. Methodology 4. Empirical results 5. Conclusion
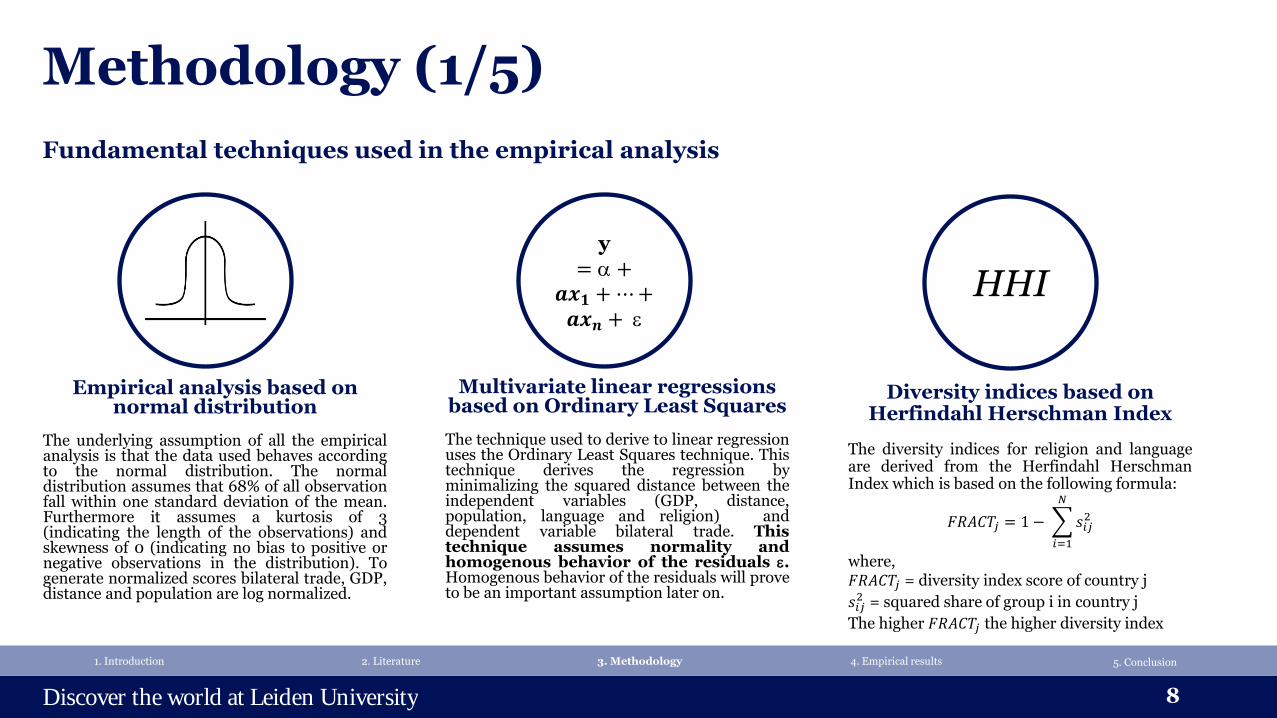
Empirical analysis based on normal distribution
The underlying assumption of all the empirical analysis is that the data used behaves according to the normal distribution. The normal distribution assumes that 68% of all observation fall within one standard deviation of the mean. Furthermore it assumes a kurtosis of 3 (indicating the length of the observations) and skewness of 0 (indicating no bias to positive or negative observations in the distribution). To generate normalized scores bilateral trade, GDP, distance and population are log normalized.
y = +𝒂𝒙𝟏 +⋯+𝒂𝒙𝒏 +
Multivariate linear regressions based on Ordinary Least Squares
The technique used to derive to linear regression uses the Ordinary Least Squares technique. This technique derives the regression by minimalizing the squared distance between the independent variables (GDP, distance, population, language and religion) and dependent variable bilateral trade. This technique assumes normality and homogenous behavior of the residuals . Homogenous behavior of the residuals will prove to be an important assumption later on.
Fundamental techniques used in the empirical analysis
HHI
Diversity indices based on Herfindahl Herschman Index
The diversity indices for religion and language are derived from the Herfindahl Herschman Index which is based on the following formula:
𝐹𝑅𝐴𝐶𝑇𝑗 = 1 − 𝑠𝑖𝑗2
𝑁
𝑖=1
where, 𝐹𝑅𝐴𝐶𝑇𝑗 = diversity index score of country j
𝑠𝑖𝑗2 = squared share of group i in country j
The higher 𝐹𝑅𝐴𝐶𝑇𝑗 the higher diversity index
Discover the world at Leiden University
Methodology (2/5)
9
1. Introduction 2. Literature 3. Methodology 4. Empirical results 5. Conclusion
GDP data from World Bank database
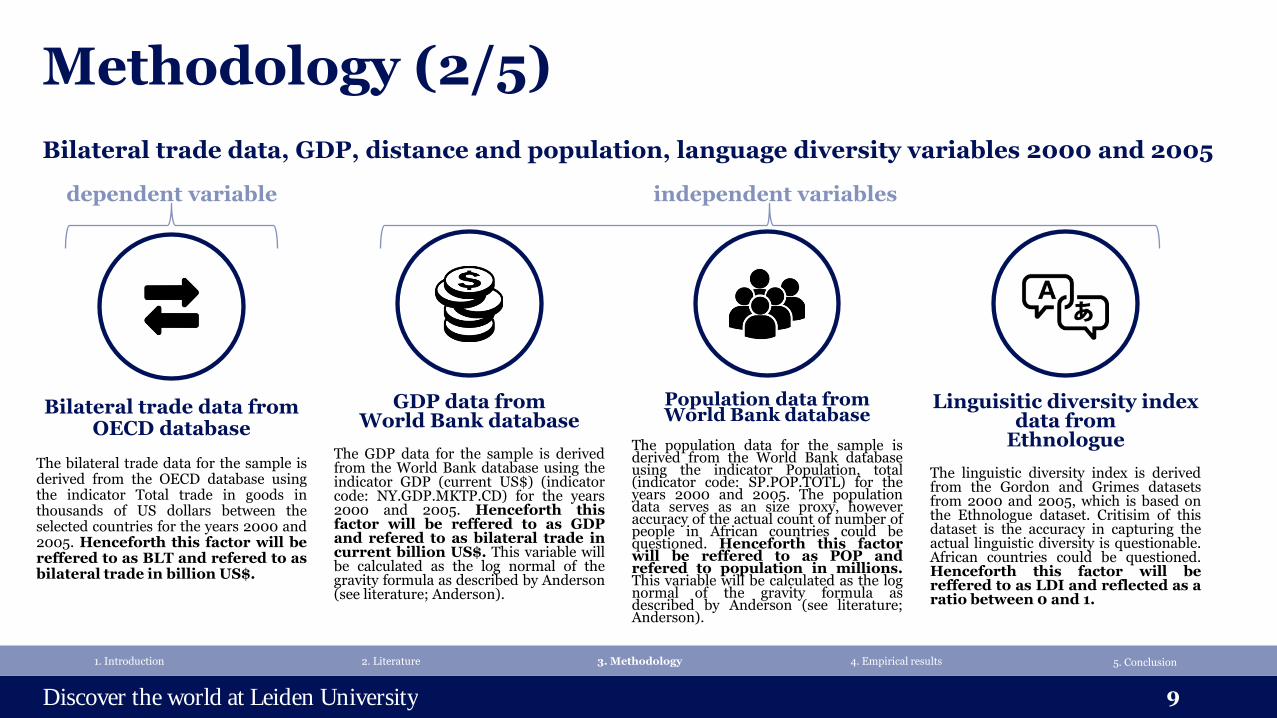
The GDP data for the sample is derived from the World Bank database using the indicator GDP (current US$) (indicator code: NY.GDP.MKTP.CD) for the years 2000 and 2005. Henceforth this factor will be reffered to as GDP and refered to as bilateral trade in current billion US$. This variable will be calculated as the log normal of the gravity formula as described by Anderson (see literature; Anderson).
Population data from World Bank database
The population data for the sample is derived from the World Bank database using the indicator Population, total (indicator code: SP.POP.TOTL) for the years 2000 and 2005. The population data serves as an size proxy, however accuracy of the actual count of number of people in African countries could be questioned. Henceforth this factor will be reffered to as POP and refered to population in millions. This variable will be calculated as the log normal of the gravity formula as described by Anderson (see literature; Anderson).
Bilateral trade data, GDP, distance and population, language diversity variables 2000 and 2005
Linguisitic diversity index data from
Ethnologue
The linguistic diversity index is derived from the Gordon and Grimes datasets from 2000 and 2005, which is based on the Ethnologue dataset. Critisim of this dataset is the accuracy in capturing the actual linguistic diversity is questionable. African countries could be questioned. Henceforth this factor will be reffered to as LDI and reflected as a ratio between 0 and 1.
Bilateral trade data from OECD database
The bilateral trade data for the sample is derived from the OECD database using the indicator Total trade in goods in thousands of US dollars between the selected countries for the years 2000 and 2005. Henceforth this factor will be reffered to as BLT and refered to as bilateral trade in billion US$.
dependent variable independent variables
Discover the world at Leiden University
Methodology (3/5)
10
1. Introduction 2. Literature 3. Methodology 4. Empirical results 5. Conclusion
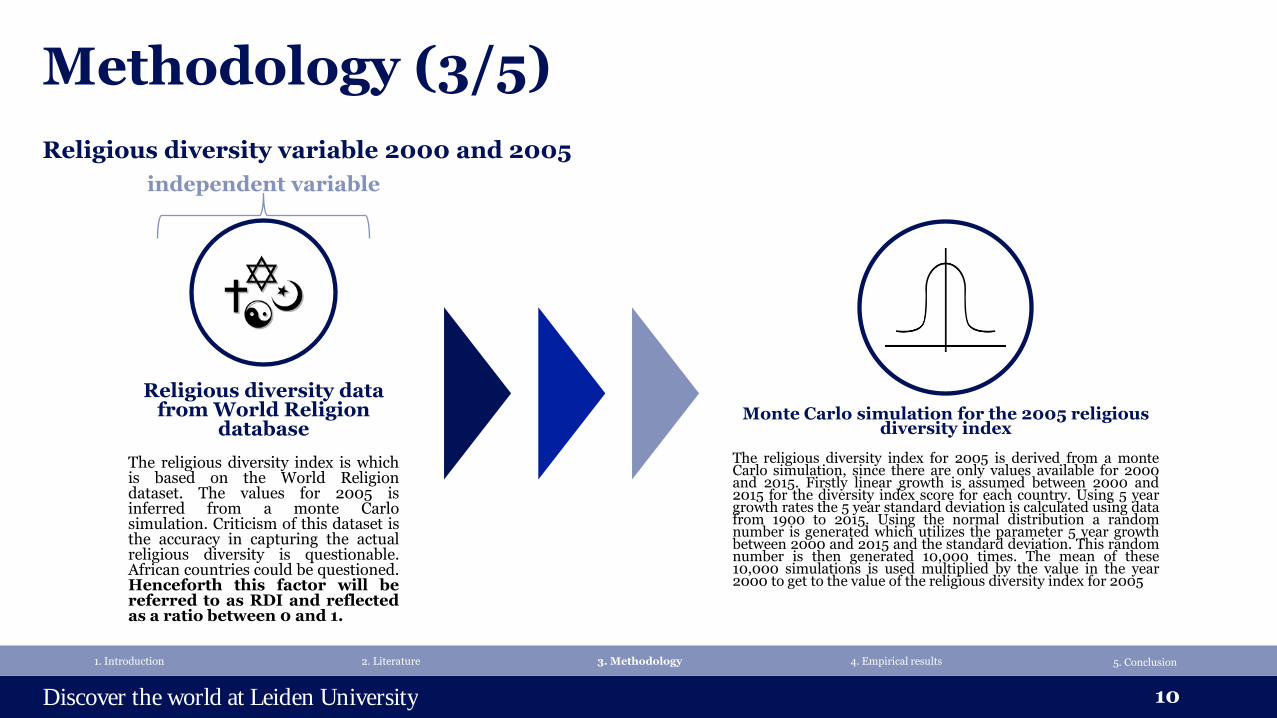
Religious diversity variable 2000 and 2005
Religious diversity data from World Religion
database
The religious diversity index is which is based on the World Religion dataset. The values for 2005 is inferred from a monte Carlo simulation. Criticism of this dataset is the accuracy in capturing the actual religious diversity is questionable. African countries could be questioned. Henceforth this factor will be referred to as RDI and reflected as a ratio between 0 and 1.
Monte Carlo simulation for the 2005 religious diversity index
The religious diversity index for 2005 is derived from a monte Carlo simulation, since there are only values available for 2000 and 2015. Firstly linear growth is assumed between 2000 and 2015 for the diversity index score for each country. Using 5 year growth rates the 5 year standard deviation is calculated using data from 1900 to 2015. Using the normal distribution a random number is generated which utilizes the parameter 5 year growth between 2000 and 2015 and the standard deviation. This random number is then generated 10,000 times. The mean of these 10,000 simulations is used multiplied by the value in the year 2000 to get to the value of the religious diversity index for 2005
independent variable
Discover the world at Leiden University
Methodology (4/5)
11
1. Introduction 2. Literature 3. Methodology 4. Empirical results 5. Conclusion
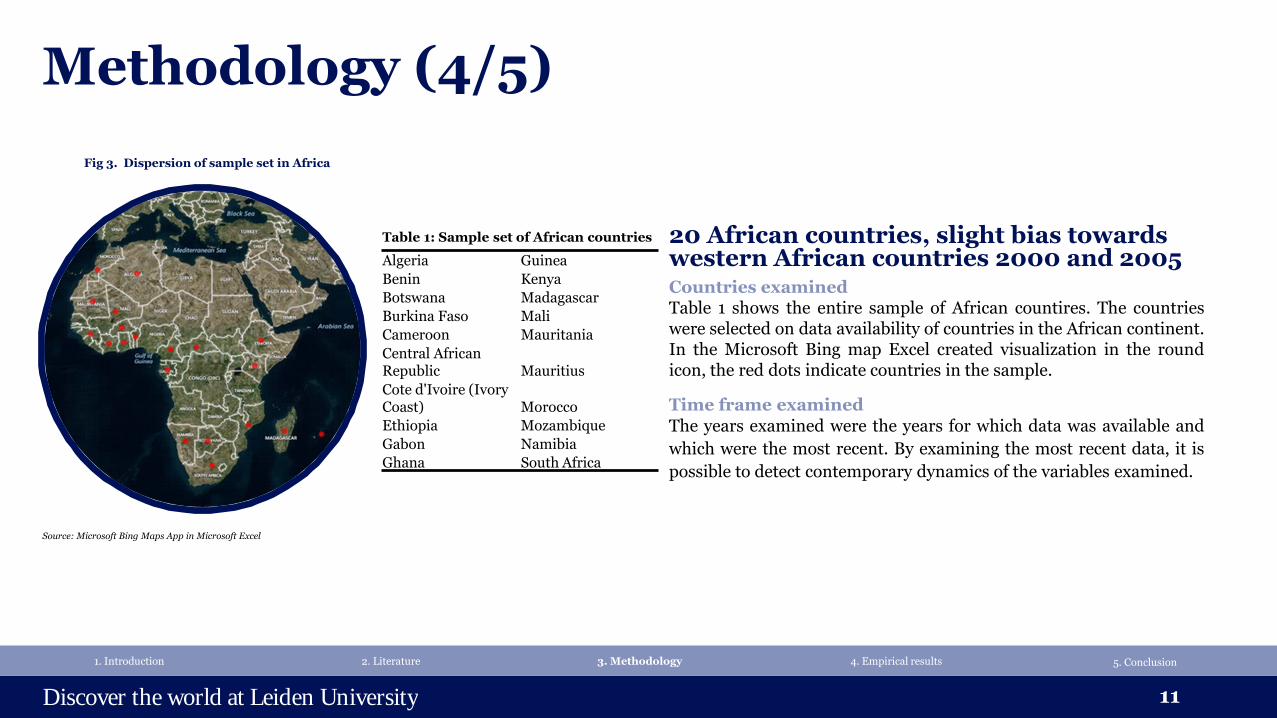
20 African countries, slight bias towards western African countries 2000 and 2005 Countries examined Table 1 shows the entire sample of African countires. The countries were selected on data availability of countries in the African continent. In the Microsoft Bing map Excel created visualization in the round icon, the red dots indicate countries in the sample.
Time frame examined
The years examined were the years for which data was available and
which were the most recent. By examining the most recent data, it is
possible to detect contemporary dynamics of the variables examined.
Algeria Guinea
Benin Kenya
Botswana Madagascar
Burkina Faso Mali
Cameroon Mauritania
Central African Republic Mauritius
Cote d'Ivoire (Ivory Coast) Morocco
Ethiopia Mozambique
Gabon Namibia
Ghana South Africa
Table 1: Sample set of African countries
Source: Microsoft Bing Maps App in Microsoft Excel
Fig 3. Dispersion of sample set in Africa
Discover the world at Leiden University
Methodology (5/5)
12
1. Introduction 2. Literature 3. Methodology 4. Empirical results 5. Conclusion
𝑯𝟎
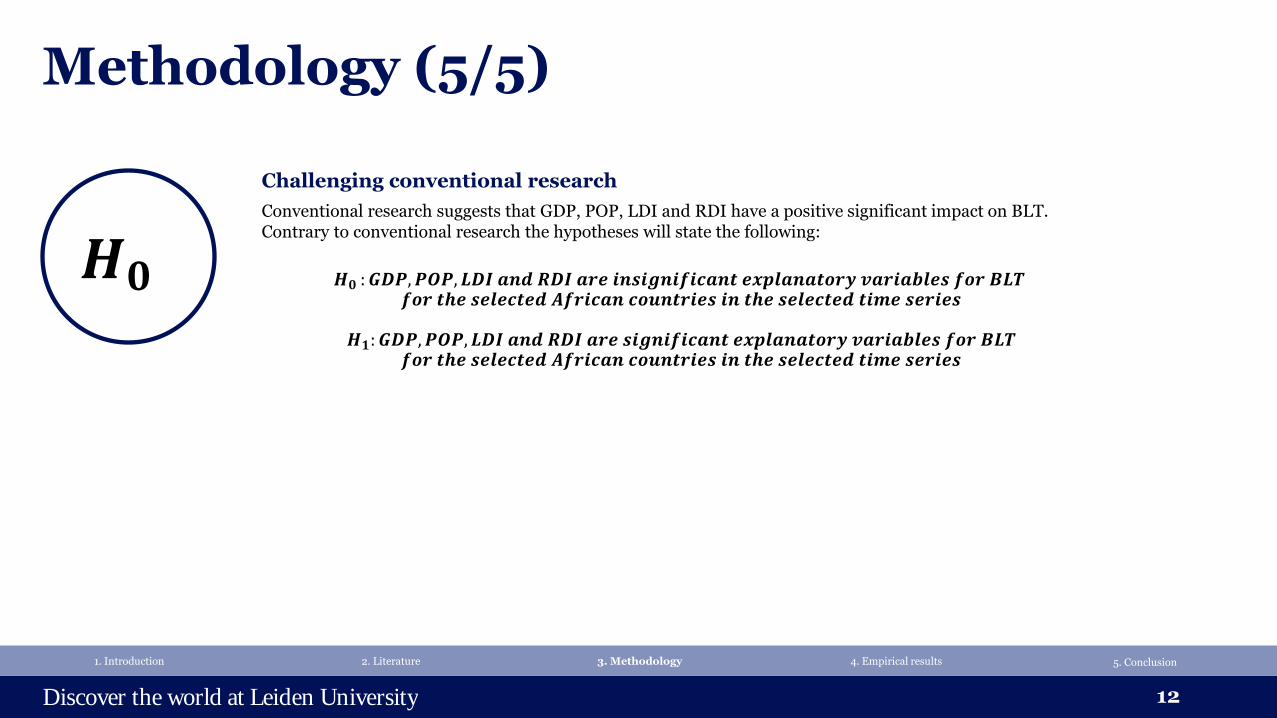
Challenging conventional research
Conventional research suggests that GDP, POP, LDI and RDI have a positive significant impact on BLT. Contrary to conventional research the hypotheses will state the following:
𝑯𝟎 : 𝑮𝑫𝑷,𝑷𝑶𝑷, 𝑳𝑫𝑰 𝒂𝒏𝒅 𝑹𝑫𝑰 𝒂𝒓𝒆 𝒊𝒏𝒔𝒊𝒈𝒏𝒊𝒇𝒊𝒄𝒂𝒏𝒕 𝒆𝒙𝒑𝒍𝒂𝒏𝒂𝒕𝒐𝒓𝒚 𝒗𝒂𝒓𝒊𝒂𝒃𝒍𝒆𝒔 𝒇𝒐𝒓 𝑩𝑳𝑻
𝒇𝒐𝒓 𝒕𝒉𝒆 𝒔𝒆𝒍𝒆𝒄𝒕𝒆𝒅 𝑨𝒇𝒓𝒊𝒄𝒂𝒏 𝒄𝒐𝒖𝒏𝒕𝒓𝒊𝒆𝒔 𝒊𝒏 𝒕𝒉𝒆 𝒔𝒆𝒍𝒆𝒄𝒕𝒆𝒅 𝒕𝒊𝒎𝒆 𝒔𝒆𝒓𝒊𝒆𝒔
𝑯𝟏: 𝑮𝑫𝑷,𝑷𝑶𝑷, 𝑳𝑫𝑰 𝒂𝒏𝒅 𝑹𝑫𝑰 𝒂𝒓𝒆 𝒔𝒊𝒈𝒏𝒊𝒇𝒊𝒄𝒂𝒏𝒕 𝒆𝒙𝒑𝒍𝒂𝒏𝒂𝒕𝒐𝒓𝒚 𝒗𝒂𝒓𝒊𝒂𝒃𝒍𝒆𝒔 𝒇𝒐𝒓 𝑩𝑳𝑻 𝒇𝒐𝒓 𝒕𝒉𝒆 𝒔𝒆𝒍𝒆𝒄𝒕𝒆𝒅 𝑨𝒇𝒓𝒊𝒄𝒂𝒏 𝒄𝒐𝒖𝒏𝒕𝒓𝒊𝒆𝒔 𝒊𝒏 𝒕𝒉𝒆 𝒔𝒆𝒍𝒆𝒄𝒕𝒆𝒅 𝒕𝒊𝒎𝒆 𝒔𝒆𝒓𝒊𝒆𝒔
Discover the world at Leiden University
Empirical results (1/16)
13
1. Introduction 2. Literature 3. Methodology 4. Empirical results 5. Conclusion
Selection bias
Trends
Countries
Scatterplots
10%
35%
25%
15%
15%
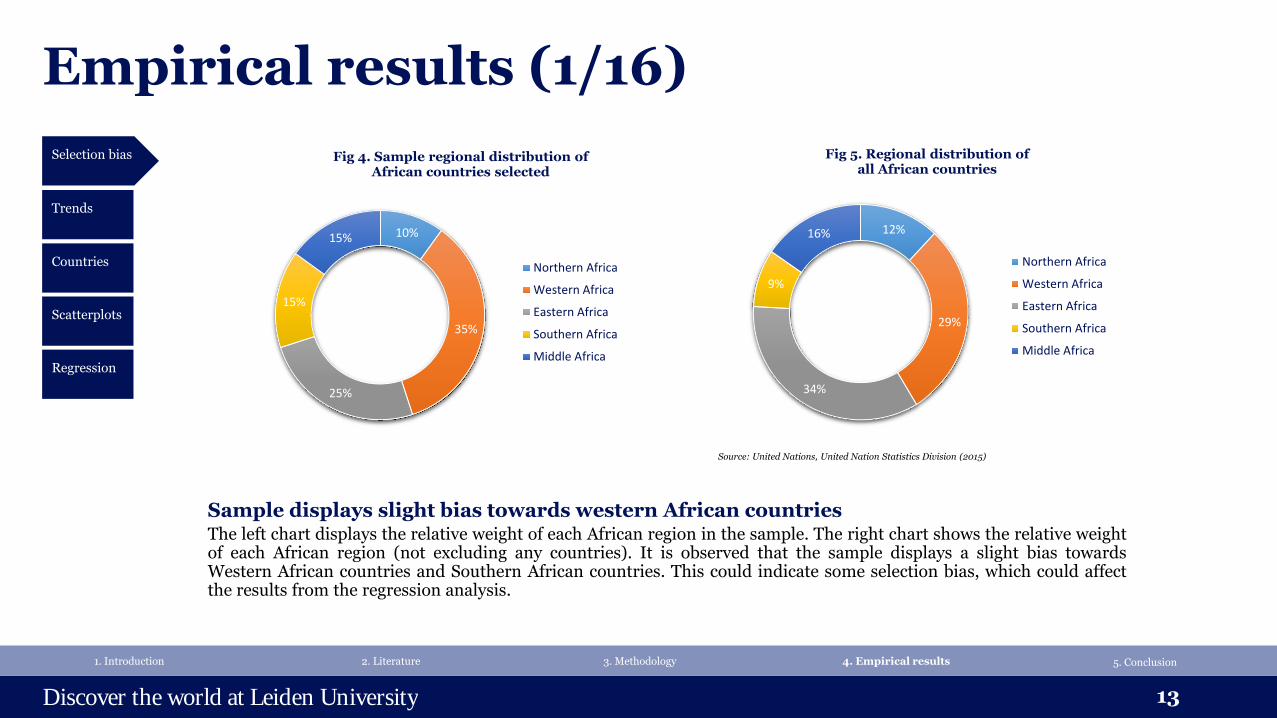
Fig 4. Sample regional distribution of African countries selected
Northern Africa
Western Africa
Eastern Africa
Southern Africa
Middle Africa
12%
29%
34%
9%
16%
Fig 5. Regional distribution of all African countries
Northern Africa
Western Africa
Eastern Africa
Southern Africa
Middle Africa
Sample displays slight bias towards western African countries The left chart displays the relative weight of each African region in the sample. The right chart shows the relative weight of each African region (not excluding any countries). It is observed that the sample displays a slight bias towards Western African countries and Southern African countries. This could indicate some selection bias, which could affect the results from the regression analysis.
Source: United Nations, United Nation Statistics Division (2015)
Regression
Discover the world at Leiden University
Empirical results (2/16)
14
1. Introduction 2. Literature 3. Methodology 4. Empirical results 5. Conclusion
Countries
Scatterplots
00
200
400
600
800
1,000
1,200
Cu
rren
t b
illio
n U
S$
Year
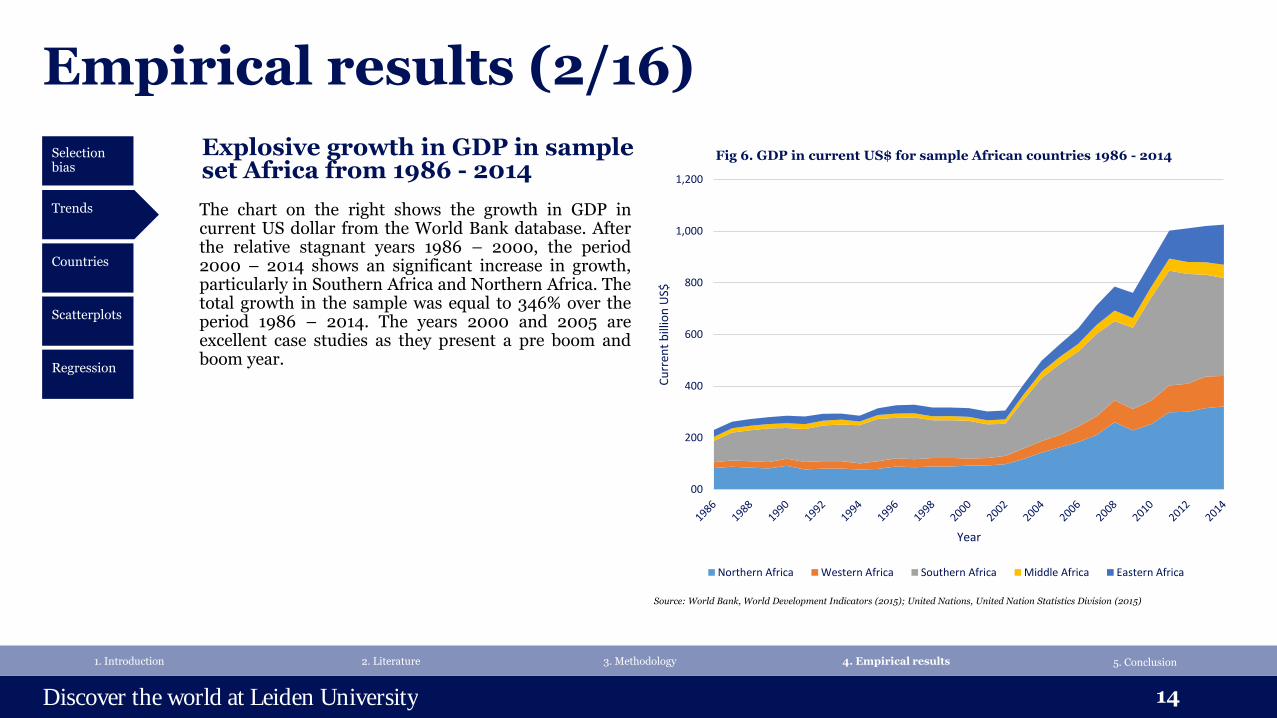
Fig 6. GDP in current US$ for sample African countries 1986 - 2014
Northern Africa Western Africa Southern Africa Middle Africa Eastern Africa
Source: World Bank, World Development Indicators (2015); United Nations, United Nation Statistics Division (2015)
Explosive growth in GDP in sample set Africa from 1986 - 2014
The chart on the right shows the growth in GDP in current US dollar from the World Bank database. After the relative stagnant years 1986 – 2000, the period 2000 – 2014 shows an significant increase in growth, particularly in Southern Africa and Northern Africa. The total growth in the sample was equal to 346% over the period 1986 – 2014. The years 2000 and 2005 are excellent case studies as they present a pre boom and boom year.
Trends
Selection bias
Regression
Discover the world at Leiden University
Empirical results (3/16)
15
1. Introduction 2. Literature 3. Methodology 4. Empirical results
5. Conclusion
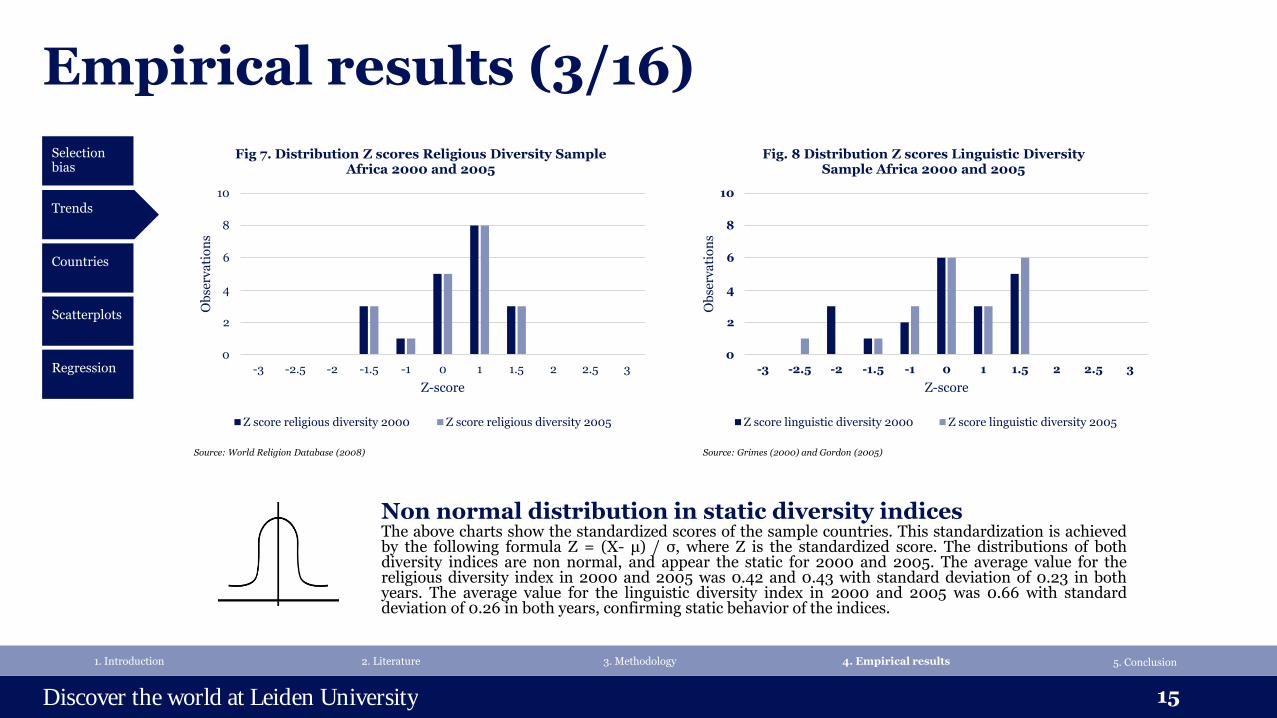
Non normal distribution in static diversity indices The above charts show the standardized scores of the sample countries. This standardization is achieved by the following formula Z = (X- μ) / σ, where Z is the standardized score. The distributions of both diversity indices are non normal, and appear the static for 2000 and 2005. The average value for the religious diversity index in 2000 and 2005 was 0.42 and 0.43 with standard deviation of 0.23 in both years. The average value for the linguistic diversity index in 2000 and 2005 was 0.66 with standard deviation of 0.26 in both years, confirming static behavior of the indices.
Countries
Scatterplots
Trends
Selection bias
0
2
4
6
8
10
-3 -2.5 -2 -1.5 -1 0 1 1.5 2 2.5 3
Ob
serv
ati
on
s
Z-score
Fig 7. Distribution Z scores Religious Diversity Sample Africa 2000 and 2005
Z score religious diversity 2000 Z score religious diversity 2005
0
2
4
6
8
10
-3 -2.5 -2 -1.5 -1 0 1 1.5 2 2.5 3
Ob
serv
ati
on
s
Z-score
Fig. 8 Distribution Z scores Linguistic Diversity Sample Africa 2000 and 2005
Z score linguistic diversity 2000 Z score linguistic diversity 2005
5. Conclusion
Regression
Source: World Religion Database (2008) Source: Grimes (2000) and Gordon (2005)
Discover the world at Leiden University
Empirical results (4/16)
16
1. Introduction 2. Literature 3. Methodology 4. Empirical results
Countries
Scatterplots
Trends
Selection bias
Benin 3%
Burkina Faso 4%
Botswana 0%
Central African Republic 1%
Cote d'Ivoire 5%
Cameroon 5%
Algeria 7%
Ethiopia 24%
Gabon 0%
Ghana 6%
Guinea 3%
Kenya 11%
Morocco 5%
Madagascar 6%
Mali 4%
Mozambique 6%
Mauritania 1%
Mauritius 0%
Namibia 1%
South Africa 10%
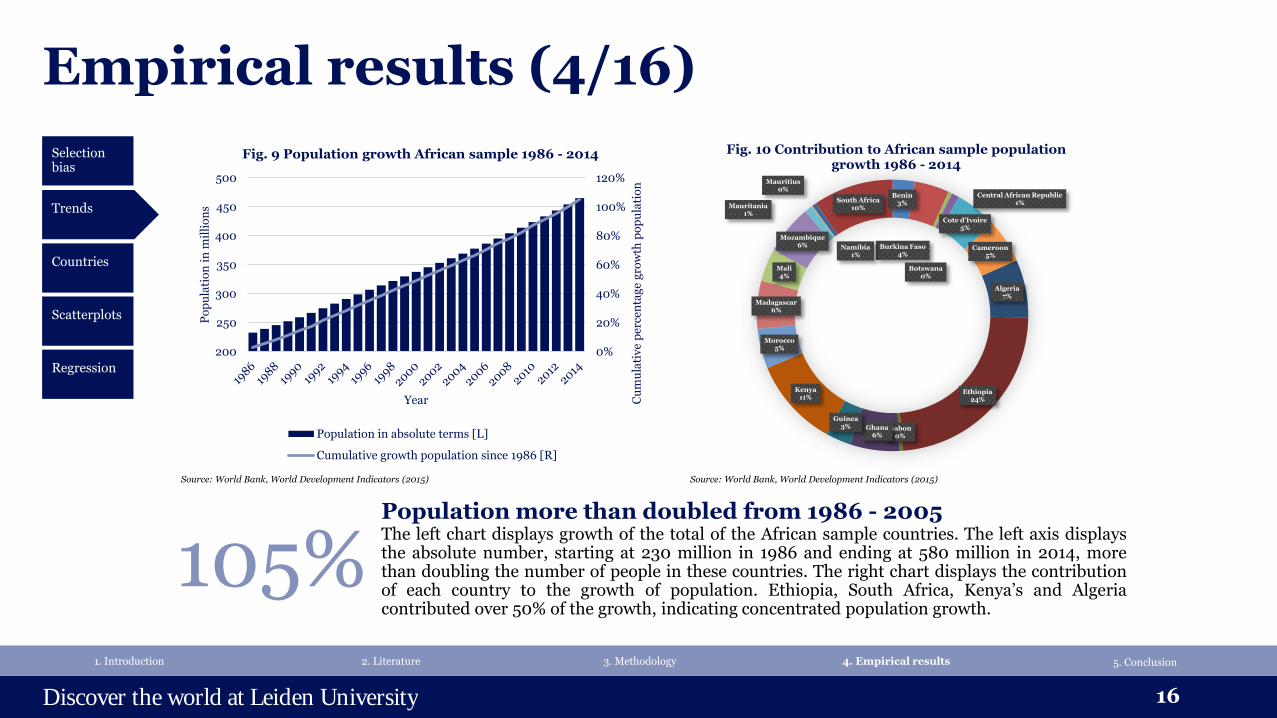
Fig. 10 Contribution to African sample population growth 1986 - 2014
0%
20%
40%
60%
80%
100%
120%
200
250
300
350
400
450
500
Cu
mu
lati
ve
per
cen
tag
e g
row
th p
op
ula
tio
n
Po
pu
lati
on
in
mil
lio
ns
Year
Fig. 9 Population growth African sample 1986 - 2014
Population in absolute terms [L]
Cumulative growth population since 1986 [R]
Population more than doubled from 1986 - 2005 The left chart displays growth of the total of the African sample countries. The left axis displays the absolute number, starting at 230 million in 1986 and ending at 580 million in 2014, more than doubling the number of people in these countries. The right chart displays the contribution of each country to the growth of population. Ethiopia, South Africa, Kenya’s and Algeria contributed over 50% of the growth, indicating concentrated population growth.
105% 5. Conclusion
Regression
Source: World Bank, World Development Indicators (2015) Source: World Bank, World Development Indicators (2015)
Discover the world at Leiden University
Empirical results (5/16)
17
1. Introduction 2. Literature 3. Methodology 4. Empirical results
5. Conclusion
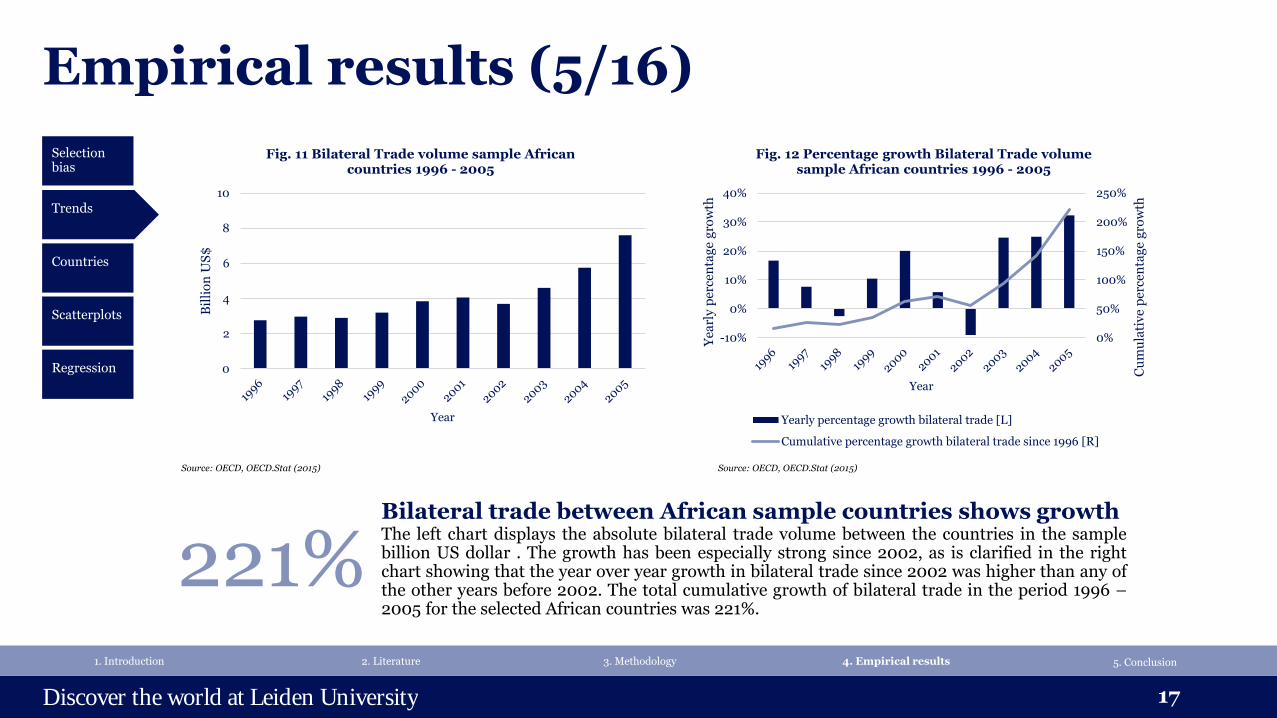
Bilateral trade between African sample countries shows growth The left chart displays the absolute bilateral trade volume between the countries in the sample billion US dollar . The growth has been especially strong since 2002, as is clarified in the right chart showing that the year over year growth in bilateral trade since 2002 was higher than any of the other years before 2002. The total cumulative growth of bilateral trade in the period 1996 – 2005 for the selected African countries was 221%.
Source: OECD, OECD.Stat (2015)
0
2
4
6
8
10B
illi
on
US
$
Year
Fig. 11 Bilateral Trade volume sample African countries 1996 - 2005
Source: OECD, OECD.Stat (2015)
0%
50%
100%
150%
200%
250%
-10%
0%
10%
20%
30%
40%
Cu
mu
lati
ve
per
cen
tag
e g
row
th
Yea
rly
per
cen
tag
e g
row
th
Year
Fig. 12 Percentage growth Bilateral Trade volume sample African countries 1996 - 2005
Yearly percentage growth bilateral trade [L]
Cumulative percentage growth bilateral trade since 1996 [R]
221%
Countries
Scatterplots
Trends
Selection bias
5. Conclusion
Regression
Discover the world at Leiden University
Empirical results (6/16)
18
1. Introduction 2. Literature 3. Methodology 4. Empirical results
Source: OECD, OECD.Stat; Microsoft Bing Maps App in Microsoft Excel
5. Conclusion
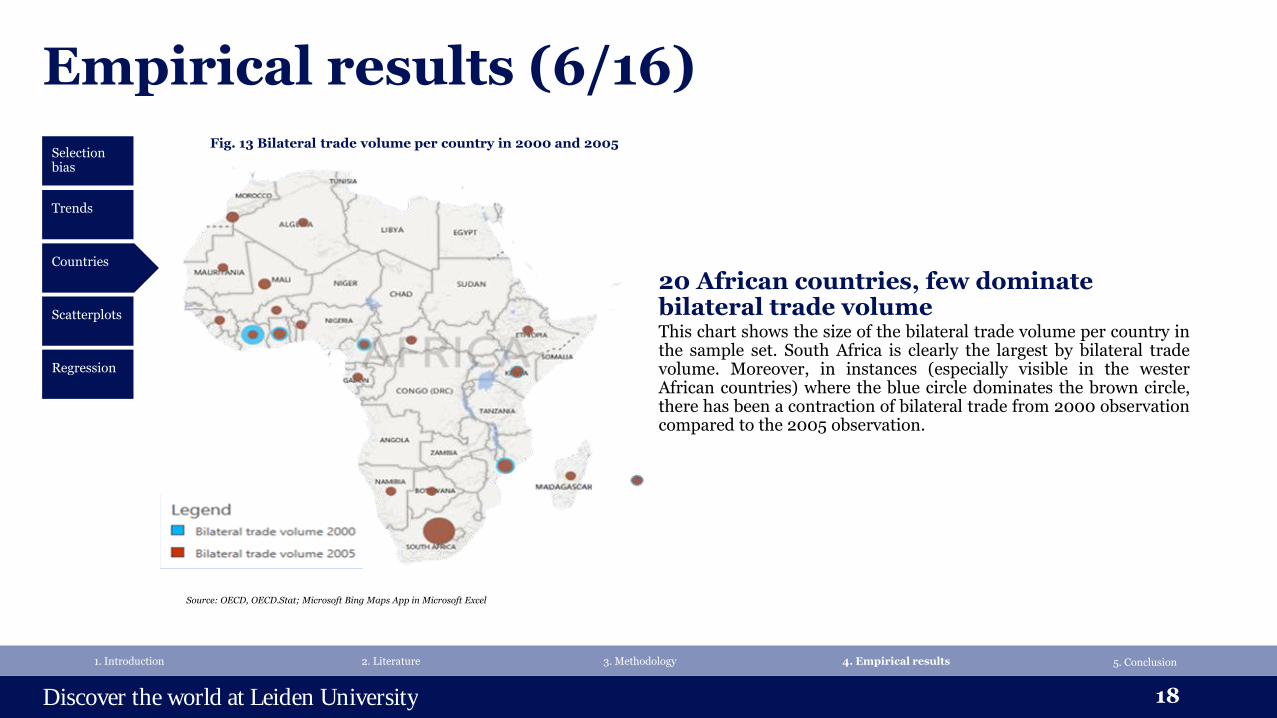
20 African countries, few dominate bilateral trade volume This chart shows the size of the bilateral trade volume per country in the sample set. South Africa is clearly the largest by bilateral trade volume. Moreover, in instances (especially visible in the wester African countries) where the blue circle dominates the brown circle, there has been a contraction of bilateral trade from 2000 observation compared to the 2005 observation.
Fig. 13 Bilateral trade volume per country in 2000 and 2005
Scatterplots
Selection bias
Countries
Trends
Regression
Discover the world at Leiden University
Empirical results (7/16)
19
1. Introduction 2. Literature 3. Methodology 4. Empirical results
Scatterplots
Selection bias
Source: World Bank, World Development Indicators (2015)
Countries
Trends
5. Conclusion
Country profile South Africa 2000 and 2005
00
50
100
150
200
250
300
2000 2005
Cu
rren
t b
illi
on
US
$
Year
Fig 14. South Africa GDP 2000 and 2005
42
43
44
45
46
47
48
2000 2005Po
pu
lati
on
in
mil
lio
n
Year
Fig. 15 South Africa Population 2000 and
2005
0
1
2
3
4
5
6
2000 2005
bil
lio
n U
S$
Year
Fig. 16 South Africa total Bilateral Trade
2000 and 2005
0.24
0.26
0.28
0.30
0.32
0.34
2000 2005
Year
Fig 17. South Africa Language Diversity
Index 2000 and 2005
0.28
0.30
0.32
0.34
0.36
0.38
2000 2005
Year
Fig. 18 South Africa Religious Diversity
Index 2000 and 2005
Regression
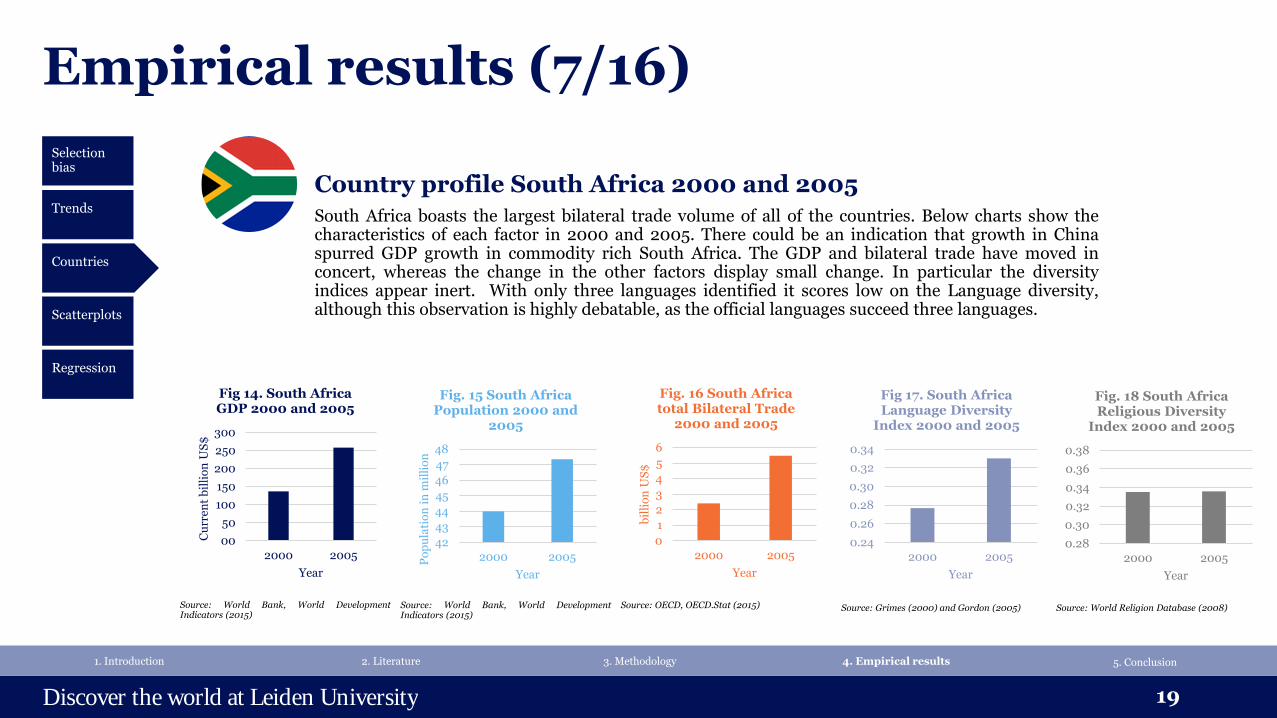
South Africa boasts the largest bilateral trade volume of all of the countries. Below charts show the characteristics of each factor in 2000 and 2005. There could be an indication that growth in China spurred GDP growth in commodity rich South Africa. The GDP and bilateral trade have moved in concert, whereas the change in the other factors display small change. In particular the diversity indices appear inert. With only three languages identified it scores low on the Language diversity, although this observation is highly debatable, as the official languages succeed three languages.
Source: World Bank, World Development Indicators (2015)
Source: OECD, OECD.Stat (2015) Source: World Religion Database (2008) Source: Grimes (2000) and Gordon (2005)
Discover the world at Leiden University
Empirical results (8/16)
20
1. Introduction 2. Literature 3. Methodology 4. Empirical results 5. Conclusion
Country profile Algeria 2000 and 2005
00
20
40
60
80
100
120
2000 2005
Cu
rren
t b
illi
on
US
$
Year
Fig 19. Algeria GDP 2000 and 2005
30
31
32
33
34
2000 2005Po
pu
lati
on
in
mil
lio
n
Year
Fig 20. Algeria Population 2000 and
2005
0.0
0.1
0.2
0.3
0.4
0.5
0.6
2000 2005
bil
lio
n U
S$
Year
Fig. 21 Algeria total Bilateral Trade 2000
and 2005
0.00
0.02
0.04
0.06
0.08
0.10
2000 2005
Year
Fig. 22 Algeria Language Diversity
Index 2000 and 2005
0.00
0.02
0.04
0.06
0.08
0.10
2000 2005
Year
Fig 23. Algeria Religious Diversity
Index 2000 and 2005
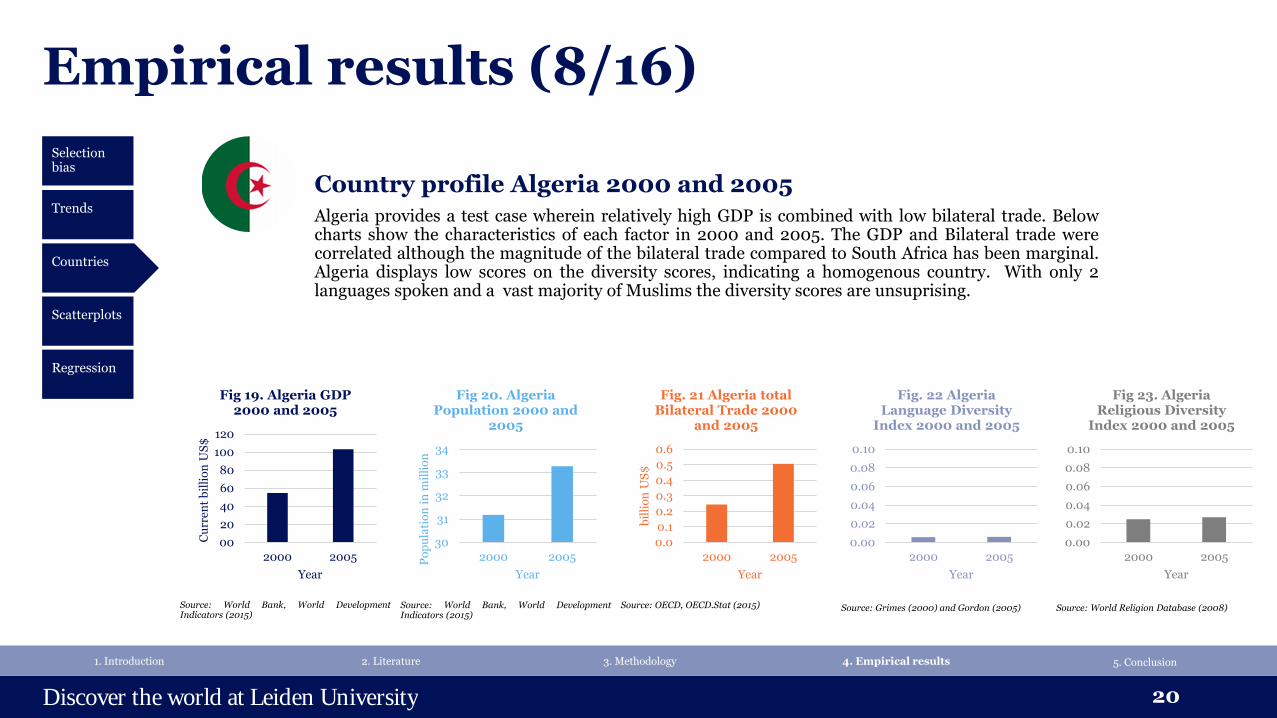
Algeria provides a test case wherein relatively high GDP is combined with low bilateral trade. Below charts show the characteristics of each factor in 2000 and 2005. The GDP and Bilateral trade were correlated although the magnitude of the bilateral trade compared to South Africa has been marginal. Algeria displays low scores on the diversity scores, indicating a homogenous country. With only 2 languages spoken and a vast majority of Muslims the diversity scores are unsuprising.
Scatterplots
Selection bias
Countries
Trends
Regression
Source: World Bank, World Development Indicators (2015)
Source: World Bank, World Development Indicators (2015)
Source: OECD, OECD.Stat (2015) Source: World Religion Database (2008) Source: Grimes (2000) and Gordon (2005)
Discover the world at Leiden University
Empirical results (9/16)
21
1. Introduction 2. Literature 3. Methodology 4. Empirical results 5. Conclusion
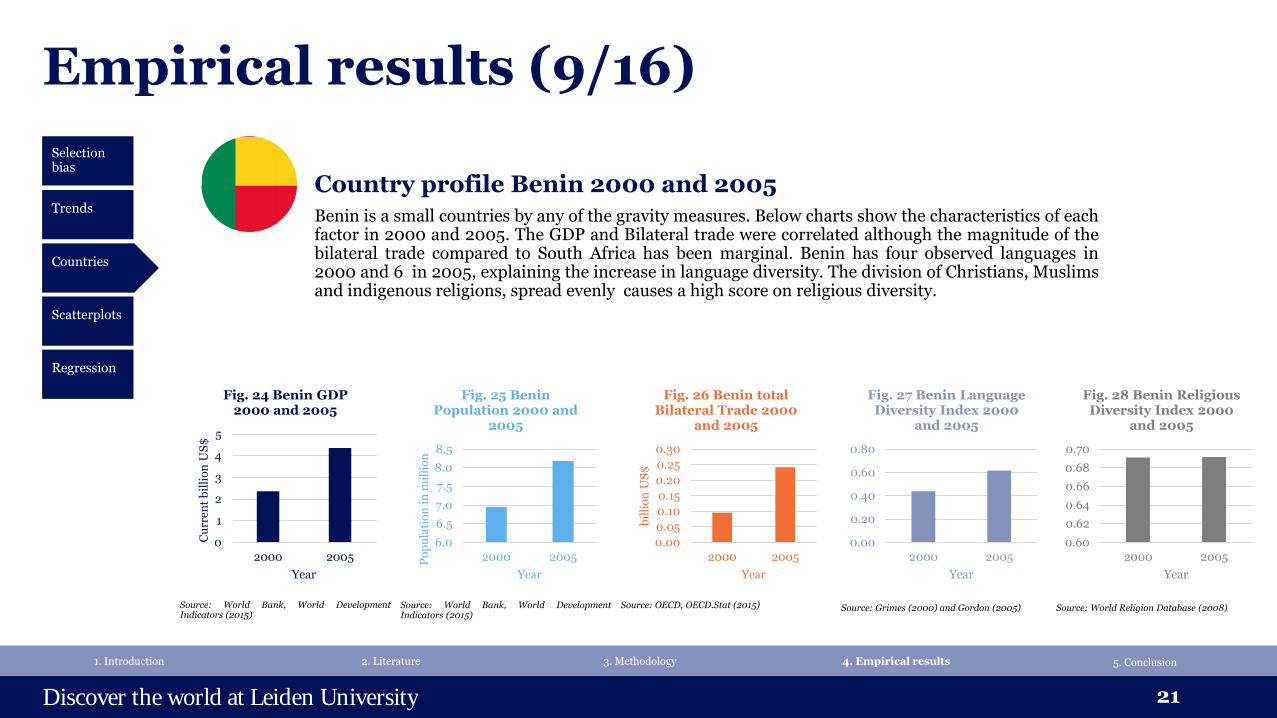
Country profile Benin 2000 and 2005
0
1
2
3
4
5
2000 2005
Cu
rren
t b
illi
on
US
$
Year
Fig. 24 Benin GDP 2000 and 2005
6.0
6.5
7.0
7.5
8.0
8.5
2000 2005Po
pu
lati
on
in
mil
lio
n
Year
Fig. 25 Benin Population 2000 and
2005
0.00
0.05
0.10
0.15
0.20
0.25
0.30
2000 2005
bil
lio
n U
S$
Year
Fig. 26 Benin total Bilateral Trade 2000
and 2005
0.00
0.20
0.40
0.60
0.80
2000 2005
Year
Fig. 27 Benin Language Diversity Index 2000
and 2005
0.60
0.62
0.64
0.66
0.68
0.70
2000 2005
Year
Fig. 28 Benin Religious Diversity Index 2000
and 2005
Benin is a small countries by any of the gravity measures. Below charts show the characteristics of each factor in 2000 and 2005. The GDP and Bilateral trade were correlated although the magnitude of the bilateral trade compared to South Africa has been marginal. Benin has four observed languages in 2000 and 6 in 2005, explaining the increase in language diversity. The division of Christians, Muslims and indigenous religions, spread evenly causes a high score on religious diversity.
Scatterplots
Selection bias
Countries
Trends
Regression
Source: World Bank, World Development Indicators (2015)
Source: World Bank, World Development Indicators (2015)
Source: OECD, OECD.Stat (2015) Source: World Religion Database (2008) Source: Grimes (2000) and Gordon (2005)
Discover the world at Leiden University
Empirical results (10/16)
22
1. Introduction 2. Literature 3. Methodology 4. Empirical results 5. Conclusion
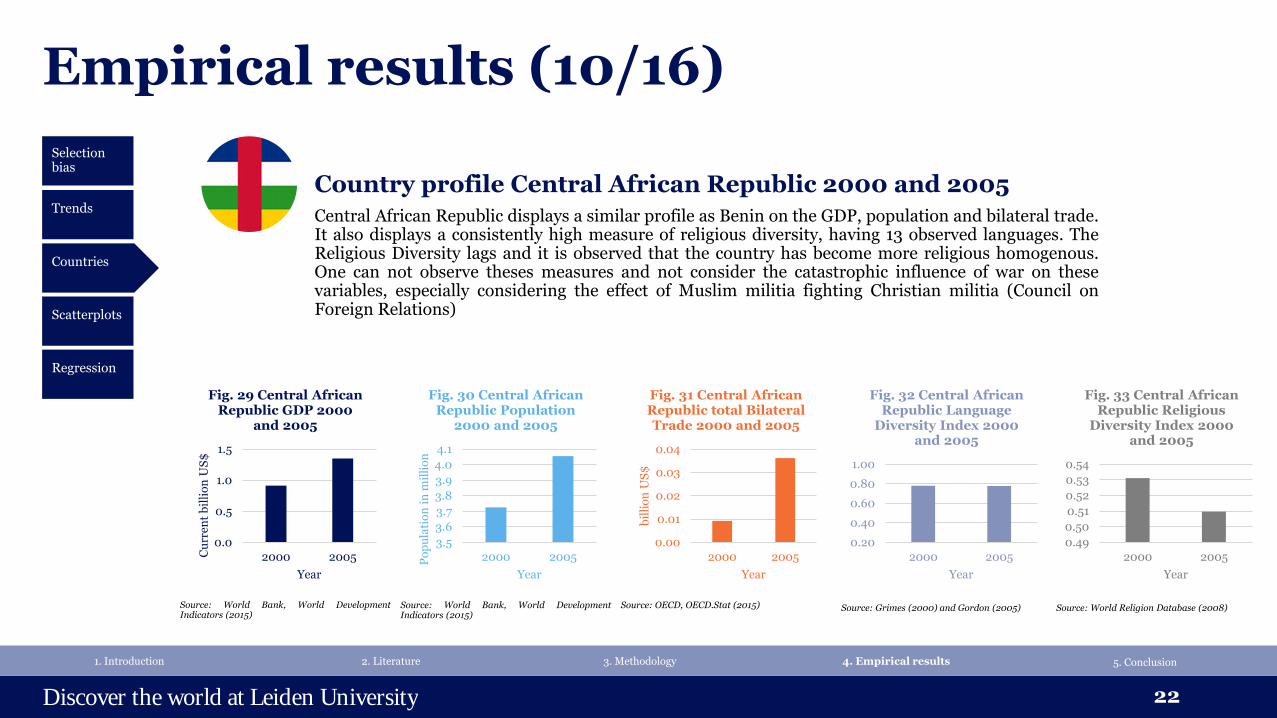
Country profile Central African Republic 2000 and 2005
0.0
0.5
1.0
1.5
2000 2005Cu
rren
t b
illi
on
US
$
Year
Fig. 29 Central African Republic GDP 2000
and 2005
3.5
3.6
3.7
3.8
3.9
4.0
4.1
2000 2005Po
pu
lati
on
in
mil
lio
n
Year
Fig. 30 Central African Republic Population
2000 and 2005
0.00
0.01
0.02
0.03
0.04
2000 2005
bil
lio
n U
S$
Year
Fig. 31 Central African Republic total Bilateral Trade 2000 and 2005
0.20
0.40
0.60
0.80
1.00
2000 2005
Year
Fig. 32 Central African Republic Language
Diversity Index 2000 and 2005
0.49
0.50
0.51
0.52
0.53
0.54
2000 2005
Year
Fig. 33 Central African Republic Religious
Diversity Index 2000 and 2005
Central African Republic displays a similar profile as Benin on the GDP, population and bilateral trade. It also displays a consistently high measure of religious diversity, having 13 observed languages. The Religious Diversity lags and it is observed that the country has become more religious homogenous. One can not observe theses measures and not consider the catastrophic influence of war on these variables, especially considering the effect of Muslim militia fighting Christian militia (Council on Foreign Relations)
Scatterplots
Selection bias
Countries
Trends
Regression
Source: World Bank, World Development Indicators (2015)
Source: World Bank, World Development Indicators (2015)
Source: OECD, OECD.Stat (2015) Source: World Religion Database (2008) Source: Grimes (2000) and Gordon (2005)
Discover the world at Leiden University
Empirical results (11/16)
23
1. Introduction 2. Literature 3. Methodology 4. Empirical results
Selection bias
Trends
5. Conclusion
Countries
Regression
Scatterplots
y = 1E-09x + 0.9128 R² = 0.0145
0
1.1
2.2
3.3
4.4
5.5
0.0 0.2 0.4 0.6 0.8 1.0
GD
P
BLT
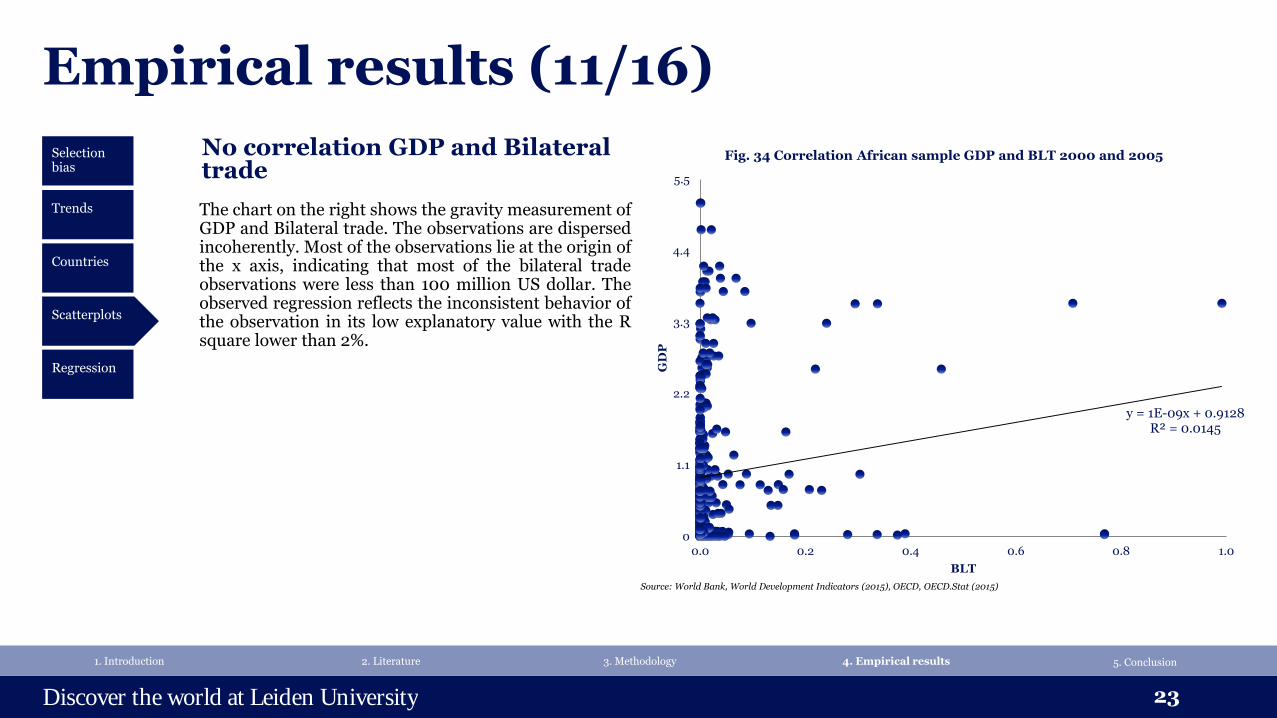
Fig. 34 Correlation African sample GDP and BLT 2000 and 2005 No correlation GDP and Bilateral trade
The chart on the right shows the gravity measurement of GDP and Bilateral trade. The observations are dispersed incoherently. Most of the observations lie at the origin of the x axis, indicating that most of the bilateral trade observations were less than 100 million US dollar. The observed regression reflects the inconsistent behavior of the observation in its low explanatory value with the R square lower than 2%.
Source: World Bank, World Development Indicators (2015), OECD, OECD.Stat (2015)
Discover the world at Leiden University
Empirical results (12/16)
24
1. Introduction 2. Literature 3. Methodology 4. Empirical results
Selection bias
Trends
5. Conclusion
Countries
Regression
Scatterplots
y = 3E-10x + 0.0475 R² = 0.0431
0
0.3
0.6
0.9
1.2
1.5
0.0 0.2 0.4 0.6 0.8 1.0
PO
P
BLT
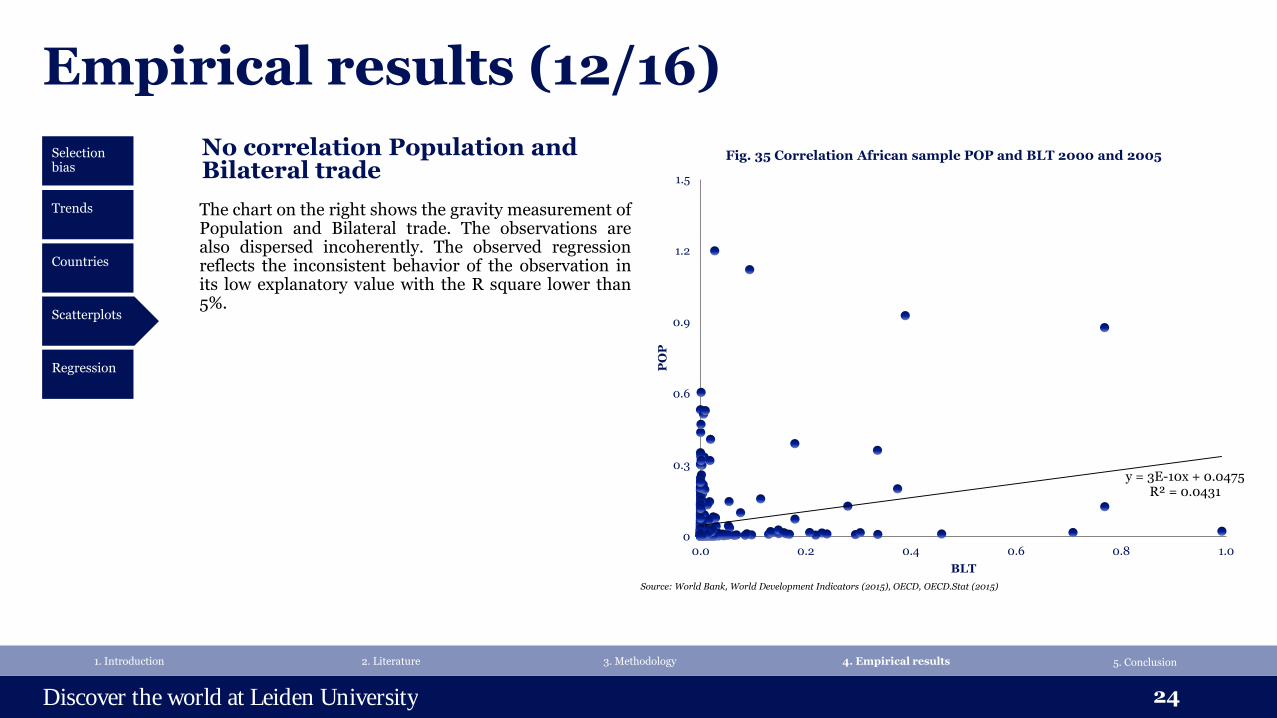
Fig. 35 Correlation African sample POP and BLT 2000 and 2005 No correlation Population and Bilateral trade
The chart on the right shows the gravity measurement of Population and Bilateral trade. The observations are also dispersed incoherently. The observed regression reflects the inconsistent behavior of the observation in its low explanatory value with the R square lower than 5%.
Source: World Bank, World Development Indicators (2015), OECD, OECD.Stat (2015)
Discover the world at Leiden University
Empirical results (13/16)
25
1. Introduction 2. Literature 3. Methodology 4. Empirical results
Selection bias
Trends
5. Conclusion
Countries
Regression
Scatterplots
y = 1E-10x + 0.6469 R² = 0.0002
0.0
1.0
2.0
3.0
4.0
5.0
0.0 0.2 0.4 0.6 0.8 1.0
LD
I
BLT
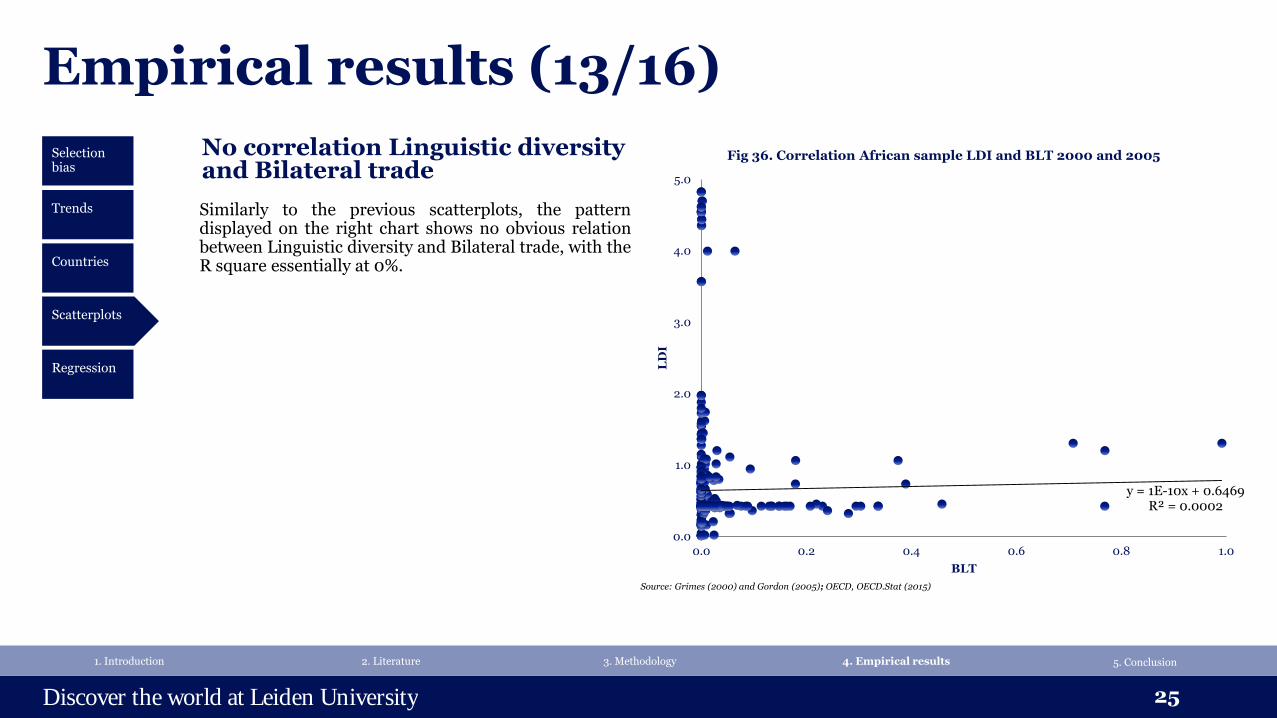
Fig 36. Correlation African sample LDI and BLT 2000 and 2005 No correlation Linguistic diversity and Bilateral trade
Similarly to the previous scatterplots, the pattern displayed on the right chart shows no obvious relation between Linguistic diversity and Bilateral trade, with the R square essentially at 0%.
Source: Grimes (2000) and Gordon (2005); OECD, OECD.Stat (2015)
Discover the world at Leiden University
Empirical results (14/16)
26
1. Introduction 2. Literature 3. Methodology 4. Empirical results
Selection bias
Trends
5. Conclusion
Countries
Regression
Scatterplots
y = -7E-10x + 1.0617 R² = 0.003
0.0
1.0
2.0
3.0
4.0
5.0
0.0 0.2 0.4 0.6 0.8 1.0
RD
I
BLT
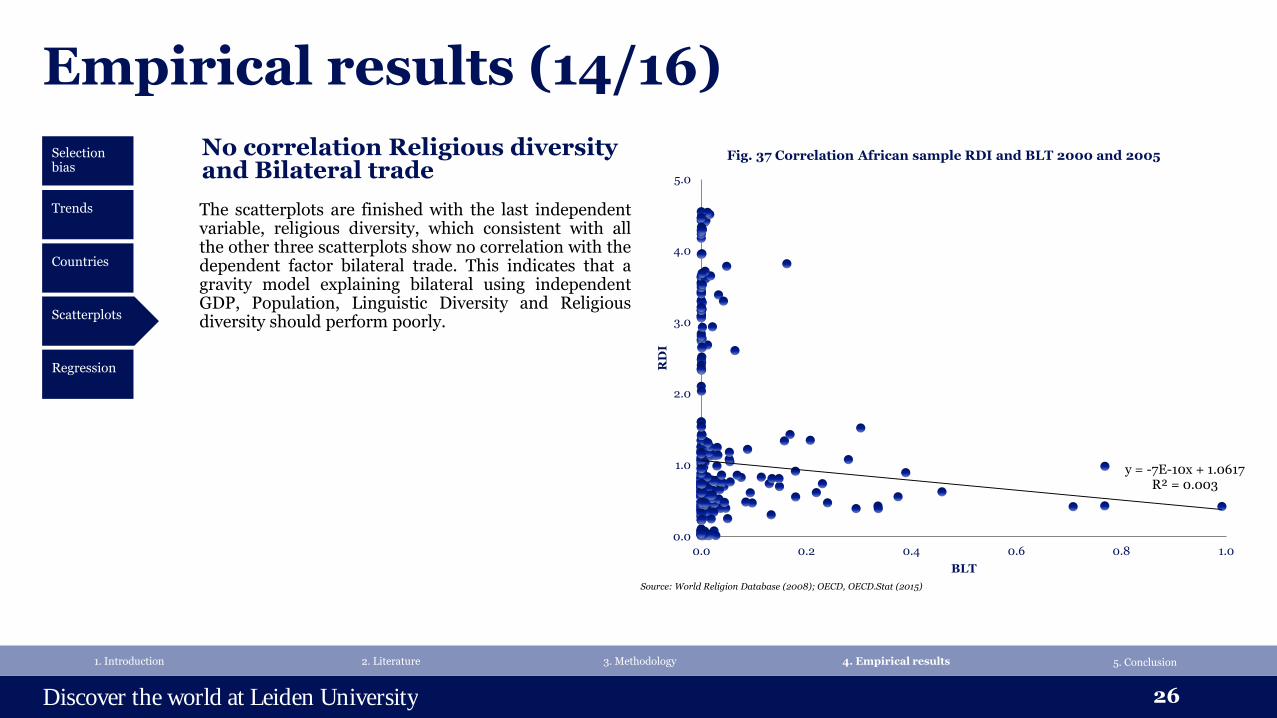
Fig. 37 Correlation African sample RDI and BLT 2000 and 2005 No correlation Religious diversity and Bilateral trade
The scatterplots are finished with the last independent variable, religious diversity, which consistent with all the other three scatterplots show no correlation with the dependent factor bilateral trade. This indicates that a gravity model explaining bilateral using independent GDP, Population, Linguistic Diversity and Religious diversity should perform poorly.
Source: World Religion Database (2008); OECD, OECD.Stat (2015)
Discover the world at Leiden University
Empirical results (15/16)
27
1. Introduction 2. Literature 3. Methodology 4. Empirical results
Selection bias
Trends
5. Conclusion
Countries
Regression
Scatterplots
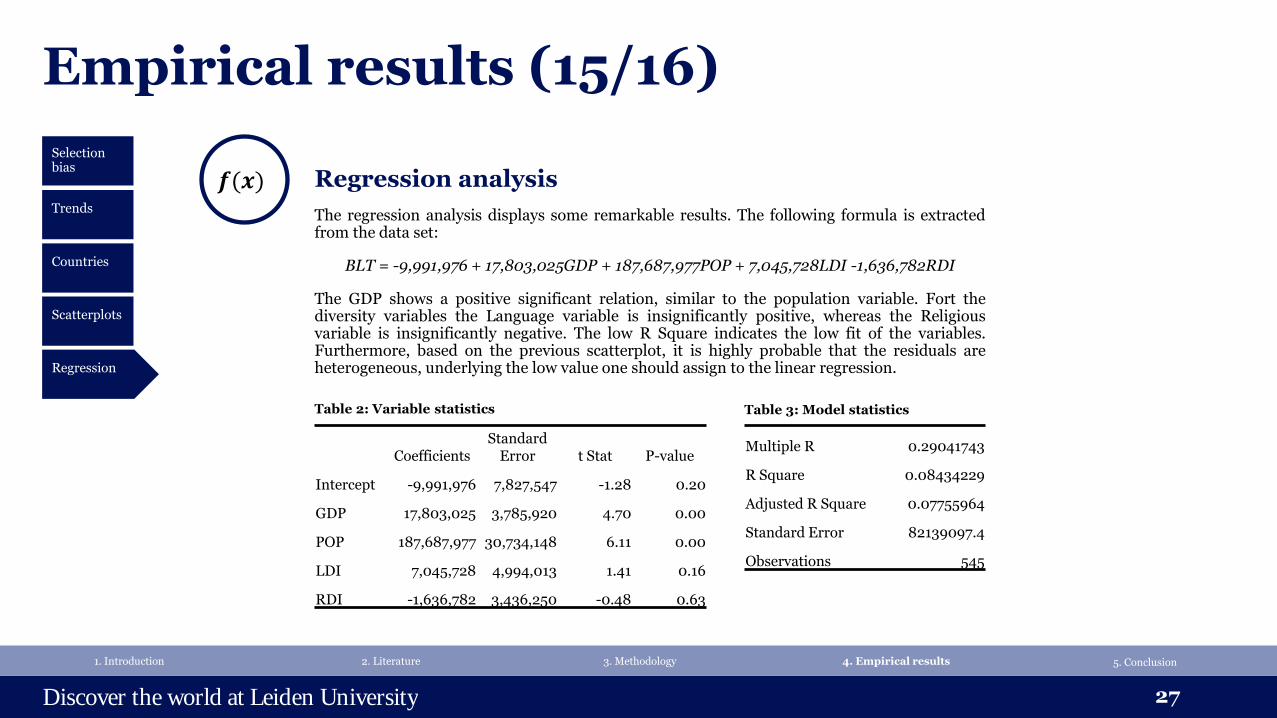
𝒇(𝒙) Regression analysis
Coefficients Standard
Error t Stat P-value
Intercept -9,991,976 7,827,547 -1.28 0.20
GDP 17,803,025 3,785,920 4.70 0.00
POP 187,687,977 30,734,148 6.11 0.00
LDI 7,045,728 4,994,013 1.41 0.16
RDI -1,636,782 3,436,250 -0.48 0.63
Multiple R 0.29041743
R Square 0.08434229
Adjusted R Square 0.07755964
Standard Error 82139097.4
Observations 545
The regression analysis displays some remarkable results. The following formula is extracted from the data set:
BLT = -9,991,976 + 17,803,025GDP + 187,687,977POP + 7,045,728LDI -1,636,782RDI
The GDP shows a positive significant relation, similar to the population variable. Fort the diversity variables the Language variable is insignificantly positive, whereas the Religious variable is insignificantly negative. The low R Square indicates the low fit of the variables. Furthermore, based on the previous scatterplot, it is highly probable that the residuals are heterogeneous, underlying the low value one should assign to the linear regression.
Table 2: Variable statistics Table 3: Model statistics
Discover the world at Leiden University
Empirical results (16/16)
28
1. Introduction 2. Literature 3. Methodology 4. Empirical results
Selection bias
Trends
5. Conclusion
Countries
Regression
Scatterplots
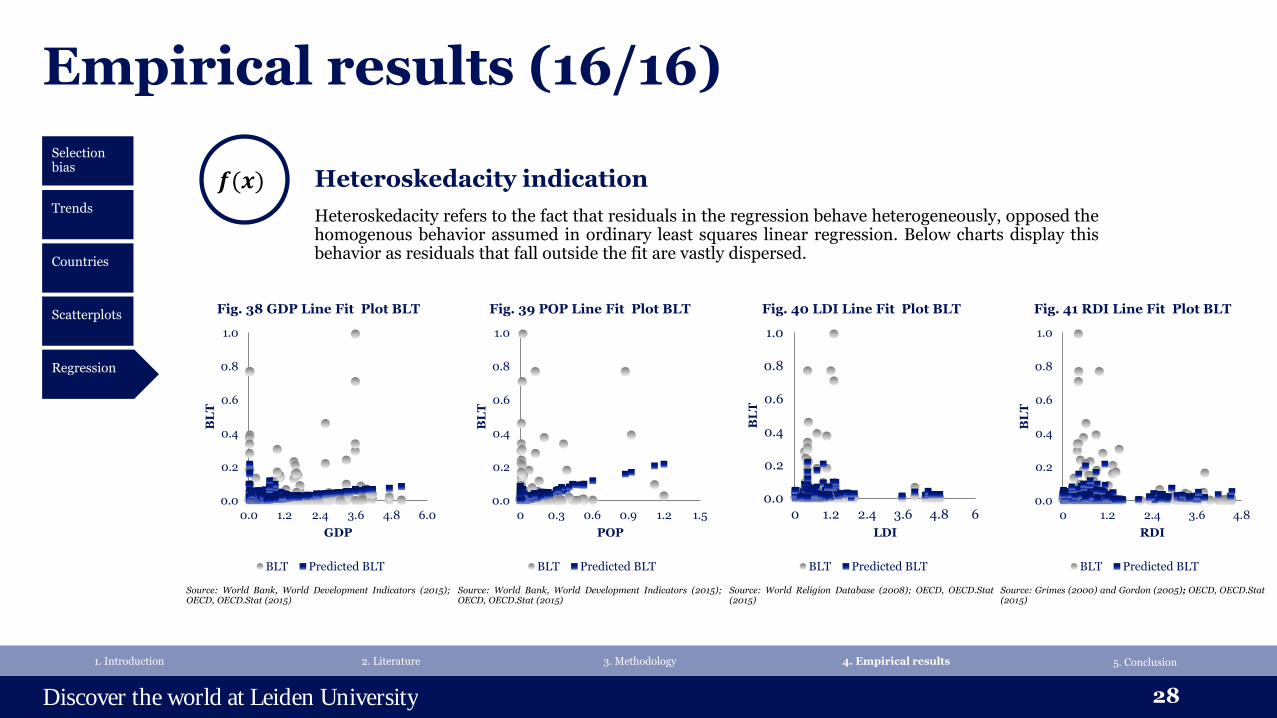
𝒇(𝒙) Heteroskedacity indication
Heteroskedacity refers to the fact that residuals in the regression behave heterogeneously, opposed the homogenous behavior assumed in ordinary least squares linear regression. Below charts display this behavior as residuals that fall outside the fit are vastly dispersed.
0.0
0.2
0.4
0.6
0.8
1.0
0.0 1.2 2.4 3.6 4.8 6.0
BL
T
GDP
Fig. 38 GDP Line Fit Plot BLT
BLT Predicted BLT
0.0
0.2
0.4
0.6
0.8
1.0
0 0.3 0.6 0.9 1.2 1.5
BL
T
POP
Fig. 39 POP Line Fit Plot BLT
BLT Predicted BLT
0.0
0.2
0.4
0.6
0.8
1.0
0 1.2 2.4 3.6 4.8 6
BL
T
LDI
Fig. 40 LDI Line Fit Plot BLT
BLT Predicted BLT
0.0
0.2
0.4
0.6
0.8
1.0
0 1.2 2.4 3.6 4.8
BL
T
RDI
Fig. 41 RDI Line Fit Plot BLT
BLT Predicted BLT
Source: World Bank, World Development Indicators (2015); OECD, OECD.Stat (2015)
Source: World Bank, World Development Indicators (2015); OECD, OECD.Stat (2015)
Source: World Religion Database (2008); OECD, OECD.Stat (2015)
Source: Grimes (2000) and Gordon (2005); OECD, OECD.Stat (2015)
Discover the world at Leiden University
Conclusion (1/5)
29
1. Introduction 2. Literature 3. Methodology 4. Empirical results 5. Conclusion
GDP
Population
GDP explanatory value on bilateral trade
Conventional scientific research finds that GDP using the gravity model has a significant positive impact on bilateral trade.
Empirical research shows that for the selected African countries, GDP has a significant positive impact on bilateral trade. This relationship is affected by heteroskedacity.
It is concluded that GDP has an positive impact on bilateral trade, however further research needs to be done to establish a positive impact of GDP on bilateral trade for African countries. Empirical research indicates a possible unconventional impact of GDP on bilateral trade.
Linguistic diversity
Religious diversity
Final conclusion
Discover the world at Leiden University
Conclusion (2/5)
30
1. Introduction 2. Literature 3. Methodology 4. Empirical results 5. Conclusion
Linguistic diversity
Population explanatory value on bilateral trade
Conventional scientific research finds that size using the gravity model has a significant positive impact on bilateral trade.
Population is used as proxy for size. Empirical research shows that for the selected African countries, Population has a significant positive impact on bilateral trade. This relationship is affected by heteroskedacity.
It is concluded that population has an positive impact on bilateral trade, however further research needs to be done to establish a positive impact of population on bilateral trade for African countries. Empirical research indicates a possible unconventional impact of size on bilateral trade.
Population
GDP
Religious diversity
Final conclusion
Discover the world at Leiden University
Conclusion (3/5)
31
1. Introduction 2. Literature 3. Methodology 4. Empirical results 5. Conclusion
Religious diversity
Linguistic diversity explanatory value on bilateral trade
Conventional scientific research finds that linguistic diversity could increase trust between actors consequently positively impact bilateral trade, however no accurate and robust measurement of linguistic diversity exists.
The linguistic diversity index from Ethnologue is used as proxy for linguistic diversity. Empirical research shows that for the selected African countries, linguistic diversity has a insignificant positive impact on bilateral trade. This relationship is affected by heteroskedacity and measurement is poor.
It is concluded that linguistic diversity does not impact bilateral trade and the Ethnologue dataset is an inaccurate tool.
GDP
Linguistic diversity
Population
Final conclusion
Discover the world at Leiden University
Conclusion (4/5)
32
1. Introduction 2. Literature 3. Methodology 4. Empirical results 5. Conclusion
Final conclusion
Religious diversity explanatory value on bilateral trade
Conventional scientific research finds that religious diversity could increase trust between actors consequently positively impact bilateral trade, however no accurate and robust measurement of religious diversity exists.
The religious diversity index from World Religion Database is used as proxy for linguistic diversity. Empirical research shows that for the selected African countries, linguistic diversity has a insignificant negative impact on bilateral trade. This relationship is affected by heteroskedacity and measurement is poor.
It is concluded that religious diversity does not impact bilateral trade and the World Religion Database dataset is an inaccurate tool.
GDP
Population
Religious diversity
Linguistic diversity
Discover the world at Leiden University
Conclusion (5/5)
33
1. Introduction 2. Literature 3. Methodology 4. Empirical results 5. Conclusion
GDP
Population
Linguistic diversity
Final conclusion
Religious diversity
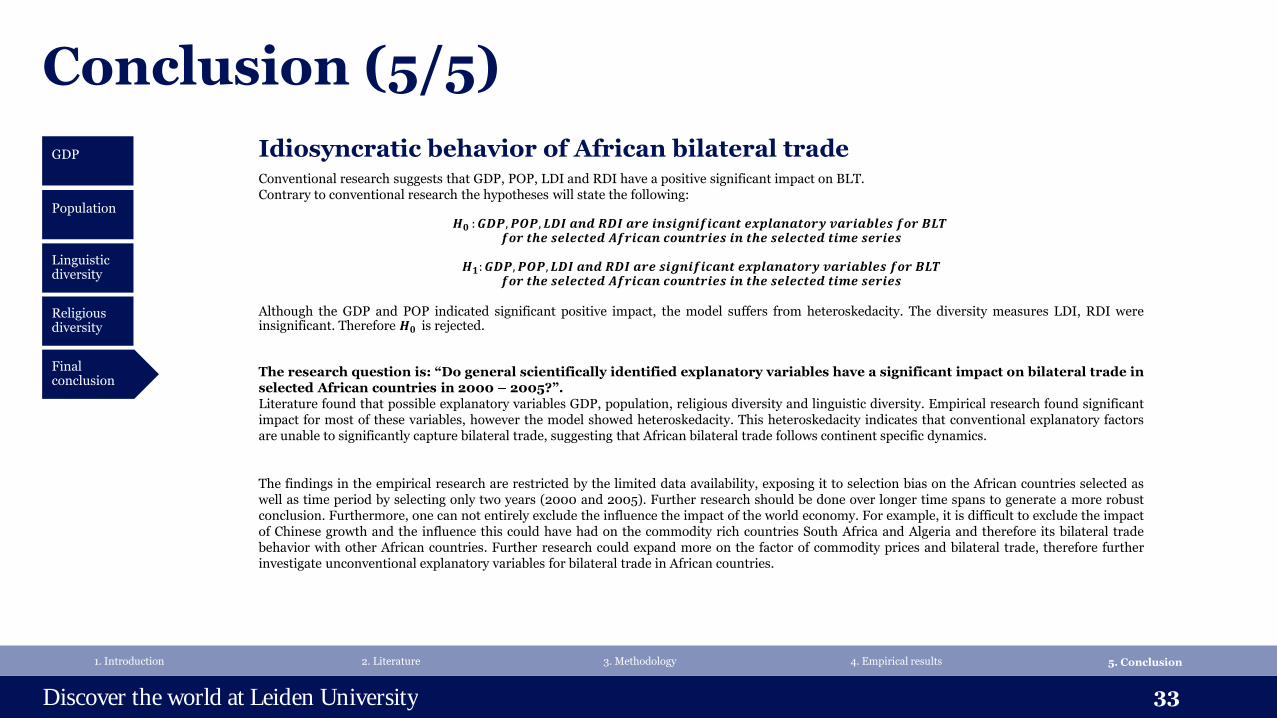
Idiosyncratic behavior of African bilateral trade Conventional research suggests that GDP, POP, LDI and RDI have a positive significant impact on BLT. Contrary to conventional research the hypotheses will state the following:
𝑯𝟎 : 𝑮𝑫𝑷, 𝑷𝑶𝑷, 𝑳𝑫𝑰 𝒂𝒏𝒅 𝑹𝑫𝑰 𝒂𝒓𝒆 𝒊𝒏𝒔𝒊𝒈𝒏𝒊𝒇𝒊𝒄𝒂𝒏𝒕 𝒆𝒙𝒑𝒍𝒂𝒏𝒂𝒕𝒐𝒓𝒚 𝒗𝒂𝒓𝒊𝒂𝒃𝒍𝒆𝒔 𝒇𝒐𝒓 𝑩𝑳𝑻 𝒇𝒐𝒓 𝒕𝒉𝒆 𝒔𝒆𝒍𝒆𝒄𝒕𝒆𝒅 𝑨𝒇𝒓𝒊𝒄𝒂𝒏 𝒄𝒐𝒖𝒏𝒕𝒓𝒊𝒆𝒔 𝒊𝒏 𝒕𝒉𝒆 𝒔𝒆𝒍𝒆𝒄𝒕𝒆𝒅 𝒕𝒊𝒎𝒆 𝒔𝒆𝒓𝒊𝒆𝒔
𝑯𝟏: 𝑮𝑫𝑷, 𝑷𝑶𝑷, 𝑳𝑫𝑰 𝒂𝒏𝒅 𝑹𝑫𝑰 𝒂𝒓𝒆 𝒔𝒊𝒈𝒏𝒊𝒇𝒊𝒄𝒂𝒏𝒕 𝒆𝒙𝒑𝒍𝒂𝒏𝒂𝒕𝒐𝒓𝒚 𝒗𝒂𝒓𝒊𝒂𝒃𝒍𝒆𝒔 𝒇𝒐𝒓 𝑩𝑳𝑻
𝒇𝒐𝒓 𝒕𝒉𝒆 𝒔𝒆𝒍𝒆𝒄𝒕𝒆𝒅 𝑨𝒇𝒓𝒊𝒄𝒂𝒏 𝒄𝒐𝒖𝒏𝒕𝒓𝒊𝒆𝒔 𝒊𝒏 𝒕𝒉𝒆 𝒔𝒆𝒍𝒆𝒄𝒕𝒆𝒅 𝒕𝒊𝒎𝒆 𝒔𝒆𝒓𝒊𝒆𝒔
Although the GDP and POP indicated significant positive impact, the model suffers from heteroskedacity. The diversity measures LDI, RDI were insignificant. Therefore 𝑯𝟎 is rejected.
The research question is: “Do general scientifically identified explanatory variables have a significant impact on bilateral trade in selected African countries in 2000 – 2005?”. Literature found that possible explanatory variables GDP, population, religious diversity and linguistic diversity. Empirical research found significant impact for most of these variables, however the model showed heteroskedacity. This heteroskedacity indicates that conventional explanatory factors are unable to significantly capture bilateral trade, suggesting that African bilateral trade follows continent specific dynamics.
The findings in the empirical research are restricted by the limited data availability, exposing it to selection bias on the African countries selected as well as time period by selecting only two years (2000 and 2005). Further research should be done over longer time spans to generate a more robust conclusion. Furthermore, one can not entirely exclude the influence the impact of the world economy. For example, it is difficult to exclude the impact of Chinese growth and the influence this could have had on the commodity rich countries South Africa and Algeria and therefore its bilateral trade behavior with other African countries. Further research could expand more on the factor of commodity prices and bilateral trade, therefore further investigate unconventional explanatory variables for bilateral trade in African countries.
Discover the world at Leiden University
Works cited (1/2)
34
Anderson, James E. "A Theoretical Foundation for the Gravity Equation." The American Economic Review (1979): 106 - 116. Print.
Barro, Robert J. and Rachel Mcleary. Religion and Economic Growth. Working Paper. Cambridge: NBER, 2003. Print.
Griffiths, Richard T. Configuring the World: A critical political economy approach. Leiden: Leiden University, 2015. Book.
Iannaccone, Laurence R. "The Consequences of Religious Market Structure; Adam Smith and the Economics of Religion." Rationality and Society (1991): 156 - 177. Print.
Melitz, Jacques. "Language and foreign trade." European Economic Review (2007): 667 - 699. Print.
Literature cited
Discover the world at Leiden University
Works cited (2/2)
35
OECD. OECD.Stat. Web. 29 Nov. 2015 http://stats.oecd.org/Index.aspx?DataSetCode=BTDIXE_I4
Gordon. Ethnologue 15th Edition (2005) Grimes, B.F. Ehnologue 14th Edition (200)
http://terralingua.org/our-work/linguistic-diversity/
Todd M. Johnson and Brian J. Grim, eds. World Religion Database (Leiden/Boston: Brill, 2008)
World Bank. World Development Indicators. Web. 29 Nov. 2015. http://data.worldbank.org/indicator/NY.GDP.MKTP.CD http://data.worldbank.org/indicator/SP.POP.TOTL
Databases cited