
ControlStrategiesforBatteryEnergy Storage System...
114
M.Sc. Thesis Master of Science in Electrical Engineering Control Strategies for Battery Energy Storage System Services Project Nordhavn Mads Blumensaat Kongens Lyngby 2016
Transcript of ControlStrategiesforBatteryEnergy Storage System...

M.Sc. ThesisMaster of Science in Electrical Engineering
Control Strategies for Battery EnergyStorage System ServicesProject Nordhavn
Mads Blumensaat
Kongens Lyngby 2016

DTU Electrical EngineeringDepartment of Electrical EngineeringTechnical University of Denmark
ØrstedspladsBuilding 3482800 Kongens Lyngby, DenmarkPhone +45 4525 [email protected]

PrefaceThis Master thesis was prepared at the department of Electrical Engineering at theTechnical University of Denmark in fulfillment of the requirements for acquiring a M.Sc.degree in Electrical Engineering.
Kongens Lyngby, February 29, 2016
Mads Blumensaats103028

ii

AcknowledgementsIn relation to the process of which this thesis has been created I would like to thankthe people surrounding me throughout this period. Firstly, I wish thank my supervisorChresten Træholt for proving to be a great sparing partner throughout this project inthe discussions surrounding the subject. Secondly, I would like to thank my supervisorfrom DONG Energy, Daniel Sandermann Jensen for dedicating so much of his time tosupervise on the project and share his deep insights on the industry, it has been highlyappreciated.

iv
AbstractThe ambitious climate goals set out by the Danish government are heavily dependent onthe continued integration of renewable energy in the Danish Power System. With theincreased penetration of renewable energy the power system faces a series of challenges,which must be solved if the TSO and subsequently DSOs are to maintain security ofsupply for their customers. The stochastic nature governing the electricity productionfrom renewable energy sources gives rise to fluctuating grid frequency, voltage issues,congestion issues and the apparent need to upgrade the grid capacity to cope with theincreasing peaks in the grid. Battery energy storage is reaching a level of maturity whichentails that they might prove able to support the distribution system in a cheap andeffective manner while facilitating the renewable energy through energy time shifting.The focus of this thesis is to investigate the potential service and control strategies gov-erning a 1MWh battery system, which is to be located in Nordhavn, an area in centralCopenhagen, Denmark, the battery will be part of a big research project, EnergyLabNordhavn where tomorrows energy solutions are demonstrated in and urban environ-ment. The DSO covering Nordhavn, DONG Energy, is a participating actively in theNordhavn project and is entity owning the battery investigated, therefore DONG Energyhas been a included in the works of this project. The analysis done is based on a MixedInteger Linear Programming (MILP) optimisation approach, where an algorithm hasbeen developed to schedule the optimum strategy seen from a DSOs perspective. Thisentail that distribution upgrade deferral is the primary motivation for installing thebattery, hence this service remains the top priority in the scheduling of the operation.Additional services synergies are therefore investigated to identify the most valuablestrategy.
DTU, January 2016

vi
ContentsPreface i
Acknowledgements iii
Abstract v
Contents vii
1 Introduction 11.1 Background . . . . . . . . . . . . . . . . . . . . . . . . . . . . . . . . . . 11.2 Research Scope . . . . . . . . . . . . . . . . . . . . . . . . . . . . . . . . 21.3 Approach and Outline . . . . . . . . . . . . . . . . . . . . . . . . . . . . 31.4 limitations . . . . . . . . . . . . . . . . . . . . . . . . . . . . . . . . . . . 3
2 EnergyLab Nordhavn 5
3 Battery Energy Storage & Applications 93.1 Bulk Energy Storage . . . . . . . . . . . . . . . . . . . . . . . . . . . . . 103.2 Distribution System Services . . . . . . . . . . . . . . . . . . . . . . . . . 113.3 Transmission Infrastructure Services . . . . . . . . . . . . . . . . . . . . 143.4 Ancillary Services . . . . . . . . . . . . . . . . . . . . . . . . . . . . . . . 143.5 Customer Energy Management Services . . . . . . . . . . . . . . . . . . . 193.6 Services for Renewable Energy Integration . . . . . . . . . . . . . . . . . 213.7 Chosen Applications . . . . . . . . . . . . . . . . . . . . . . . . . . . . . 21
4 Battery Energy Storage 234.1 Battery Chemistry . . . . . . . . . . . . . . . . . . . . . . . . . . . . . . 244.2 Battery Characteristics . . . . . . . . . . . . . . . . . . . . . . . . . . . . 244.3 Energy Technologies . . . . . . . . . . . . . . . . . . . . . . . . . . . . . 25
5 Optimisation and Control Techniques 335.1 Linear Programming . . . . . . . . . . . . . . . . . . . . . . . . . . . . . 345.2 Binary Integer Programming . . . . . . . . . . . . . . . . . . . . . . . . . 355.3 Mixed Integer Linear Programming . . . . . . . . . . . . . . . . . . . . . 365.4 Quadratic Programming . . . . . . . . . . . . . . . . . . . . . . . . . . . 385.5 Heuristic Optimisation . . . . . . . . . . . . . . . . . . . . . . . . . . . . 39
viii Contents
6 Algorithm and Modelling 436.1 MATLAB MILP - Yalmip . . . . . . . . . . . . . . . . . . . . . . . . . . 456.2 Problem Formulation . . . . . . . . . . . . . . . . . . . . . . . . . . . . . 476.3 Constraints . . . . . . . . . . . . . . . . . . . . . . . . . . . . . . . . . . 48
7 Case Analysis 537.1 Distribution Grid Upgrade Deferral . . . . . . . . . . . . . . . . . . . . . 537.2 PV Support . . . . . . . . . . . . . . . . . . . . . . . . . . . . . . . . . . 617.3 EV Charging . . . . . . . . . . . . . . . . . . . . . . . . . . . . . . . . . 687.4 FDR - Frequency Disturbance Reserve . . . . . . . . . . . . . . . . . . . 74
8 Discussion 77
9 Conclusion 819.1 Future Work . . . . . . . . . . . . . . . . . . . . . . . . . . . . . . . . . . 82
Bibliography 85
A Appendix 89A.1 MATLAB CODE . . . . . . . . . . . . . . . . . . . . . . . . . . . . . . . 89A.2 Datasheets . . . . . . . . . . . . . . . . . . . . . . . . . . . . . . . . . . . 98A.3 CleanCharge DC fastcharge datasheet . . . . . . . . . . . . . . . . . . . . 100
CHAPTER 1Introduction
This chapter explains the motivation of this Master thesis and the potential and pos-sibilities of having a grid connected Battery Energy Storage System (BESS) providingvarious power system services. Further an elaboration of the scope, limitations andoutline of the thesis is presented. The reader is assumed to have basic knowledge of elec-trical energy systems entailing an understanding of electrical components, power systemoperation, power system control and the regulation and governance surrounding thisindustry.
1.1 BackgroundIn the past years the world and particularly the EU have seen a significant increase inthe penetration of renewable energy production. Especially Denmark has set a range ofambitious goal, which culminates with the goal of being completely independent fromfossil fuels by 2050 [15]. If Denmark is to accommodate this long-term goal the en-ergy sector needs to change significantly. Traditionally the power system was drivenby centralized dispatchable power plants, which were fired by coal, oil, natural gas ormore recently biomass. However, in order to satisfy the ambitions set out for 2050,the energy sector has had to evolve significantly over the past decaded. In particular,centralised power production is being challenged as continuously more power is beingproduced by decentralised plants and distributed energy resources (DERs) at all levels ofthe power system. The introduction of DERs and their stochastic characteristics behindthe power production of such sources has provided the grid operators with additionalchallenges.The Transmission System Operator (TSO) and Distribution System Operator(DSO) will have to be more responsive when balancing the power grid [18]. This devel-opment is mainly due to increased penetration of renewable energy sources contributingto an increased forecast error, which is then remedied on the balancing market, whichis the mechanism that ensures an ongoing equilibrium between production and demand[17]. A general trend, which will only add the complexity of the system is an increasedelectrification of various industries. In the future heating is assumed to divert its sourceof heat from power plant, which are witnessing a general decrease in production, toheating being produced from renewable electricity. Moreover, the transportation sec-tor is driven by a big political incentive to bring more electric vehicles (EV’s) onto thestreet as well as electrifying public transportation. The correlation between an increasedfluctuation in production due to the stochastic nature of renewables and the immediateneed to increase the production levels, it becomes apparent that storage of renewable
2 1 Introduction
energy will have a progressively larger role in the future.
Regarding the recent technical development in the battery industry, grid sized bat-teries have reached a quality and capacity which makes them an attractive addition tothe components in the electrical infrastructure today. Their storage capabilities allow forthem to: defer grid expansions, provide ancillary services and regulation. Furthermore,having the opportunity to store renewable energy in a feasible manner is a key objectiveif Denmark is to realise its political goals for a fossil fuel independence by 2050[1].
1.2 Research ScopeThe objective of this thesis is to investigate the use and applications of a power grid con-nected BESS, located in Nordhavn Copenhagen a full scale energy development project,with the ambition to demonstrate how future energy solutions can be integrated in aresidential neighbourhood. A control algorithm, which determines the optimal hourlycontrol strategy based on several external inputs, is developed. The BESS is a part ofthe research project Energylab Nordhavn that focuses on the electrical infrastructureand how to improve the future design of such infrastructure to facilitate the produc-tion of renewable energy and to cope with fluctuations in power supply, without over-dimensioning the grid. As this thesis is being done in collaboration with DONG Energy,Customer & Markets, the biggest DSO in the Danish power system [9], the perspectiveof the investigation is from a DSOs perspective. This implies that the battery, underreal operation, is subject to the rules and regulations governing a DSO, which is reflectedin the BESS analysis and further is an integral part of the discussion throughout thisthesis.The primary objective of the battery is to defer distribution grid extensions, which ishandled through peak-shaving at hours where the grid capacity is breached. Further-more, the BESS should facilitate the use of renewable energy locally at Nordhavn andin the entire distribution system. This goal is reaches by exploring potential synergiesby having the BESS connected to a local PV system in Nordhavn and the two entitiesexchange power to secure a stable consumption. To maintain the DSO focus on theservices the possibility of having the BESS provide reserve power at times where thegrid is not facing the need for distribution grid deferral is also analysed.
The scope described above culminates in the following action points:
• Determine the necessary input for the algorithm. Review and model the proposedservices the BESS provides, in order to simulate the algorithm on a realistic back-ground.
• Develop the control strategy and algorithm for the prioritised control.
• Investigate sensitivity and robustness of the algorithm under different test condi-tions and assumptions.
1.3 Approach and Outline 3
• Identify the potential and threats of the BESS operating in a distribution gridenvironment.
1.3 Approach and OutlineIn order to cover the potential of a grid connected BESS in relation to EnergyLab Nord-havn, an overview of the electrical grid services a BESS can provide are investigated.By comparing the specifications of the battery and the main technical characterisationsthat governs batteries and their performance, the grid services best suited for the BESS,as seen from a DSO perspective, are selected and modelled in order to determine howthe BESS would operate under such conditions.
To implement the controls and simulate the BESS, MATLAB was the chosen pro-gram. In addition to MATLAB the toolbox YALMIP was integrated [25]. YALMIP isa free toolbox, which helps algorithm development, is consistent with general MATLABsyntax, but enables the developer to implement the algorithm as a high-level modelthat follows the general mathematical expressions governing Mixed Integer Linear Pro-gramming (MILP), whereas the standard MATLAB syntax for MILP uses a low-levelapproach. Because of MATLAB’s internal solvers are based on low-level modelling, theimplementation of an external solver will decrease the computation time significantly.The solver chosen to handle the mathematical optimization is called, MOSEK, which iswidely used in the financial, energy and forestry industry.
1.4 limitationsThe general scope of the thesis is to present a demonstration of how a battery couldoperate as an incorporated part of the power grid, with emphasis on the EnergyLabNordhavn project with the operations parameters reflecting the ones of a DSO. In orderto highlight the key findings connected to the BESS operation the analysis is done with arelatively holistic approach, which helps the intuitive understanding of the impact eachproposed energy service has on the system and the BESS. However, such an approachrequires a range of assumptions and limitations to be made if the analysis is to have theimpact intended in this thesis. The limitations are described below:
The EnergyLab Nordhavn project is the focal point of this analysis and many of thesynergies that hopefully are created as the research project progresses are still governedby a large degree of uncertainty. The radial of which the PV systems and EV chargersare connected to is yet to be determined, this case assumes that they are connected tothe same radial as the BESS.

4 1 Introduction
The complete specifications of the BESS have not been available in the works sur-rounding this thesis, some specifications have been delivered verbally from DONG En-ergy, and others have been estimated based on a best guess estimate originating fromthe known specifications. Along with the estimates specifications it is known that theBESS is to be delivered as a turn-key solution. This entails that all electric componentsare assumed to be delivered and functional to the intend of the applications providedby the BESS. Furthermore, the operation of the BESS would most likely be subject tovarious regulations from the TSO but in the light of this being a research project theBESS is assumed to be allowed to operate with a large degree of freedom, which givesrise to the BESS being able to demonstrate its potential to the fullest.
The created algorithm created to demonstrate the scheduled control strategy is cre-ated with the intend of demonstrating how a BESS could operate under certain knownconditions. Therefore, what the BESS would perceive as a forecasted load, PV produc-tion, EV charge pattern etc. is provided as a hind cast of known values. This is notreflecting real operations as these inputs always will be subject to a degree of uncertaintydue to the stochastic nature of the parameters. While this renders the current algorithmunreliable for real operation the final conclusions based on the analysis is regarded as ro-bust due to the knowledge of the context above, i.e. potential pitfalls are acknowledgedand with the intend of the analysis and algorithm dynamic optimisation and randomvariables does not affect the final findings.

CHAPTER 2EnergyLab Nordhavn
EnergyLab Nordhavn is an ongoing full scale urban development project in Copenhagen.The project aims to develop future energy solutions and demonstrate these in an urbanenvironment, where people are living and going about with their normal lives. Theproject is aimed at future energy solutions, which covers a broad area of research top-ics such as, smart-grids, facilitation of renewable energy, energy efficient buildings andelectric transportation. All these topics are combined into one big intelligent full scalesmart city. The project has a total budget of DKK 143m funded by the Danish EnergyTechnology Development and Demonstration Programme (EUDP), which contributes tothe cost of the project for its entire lifetime 2015-2019 [4].
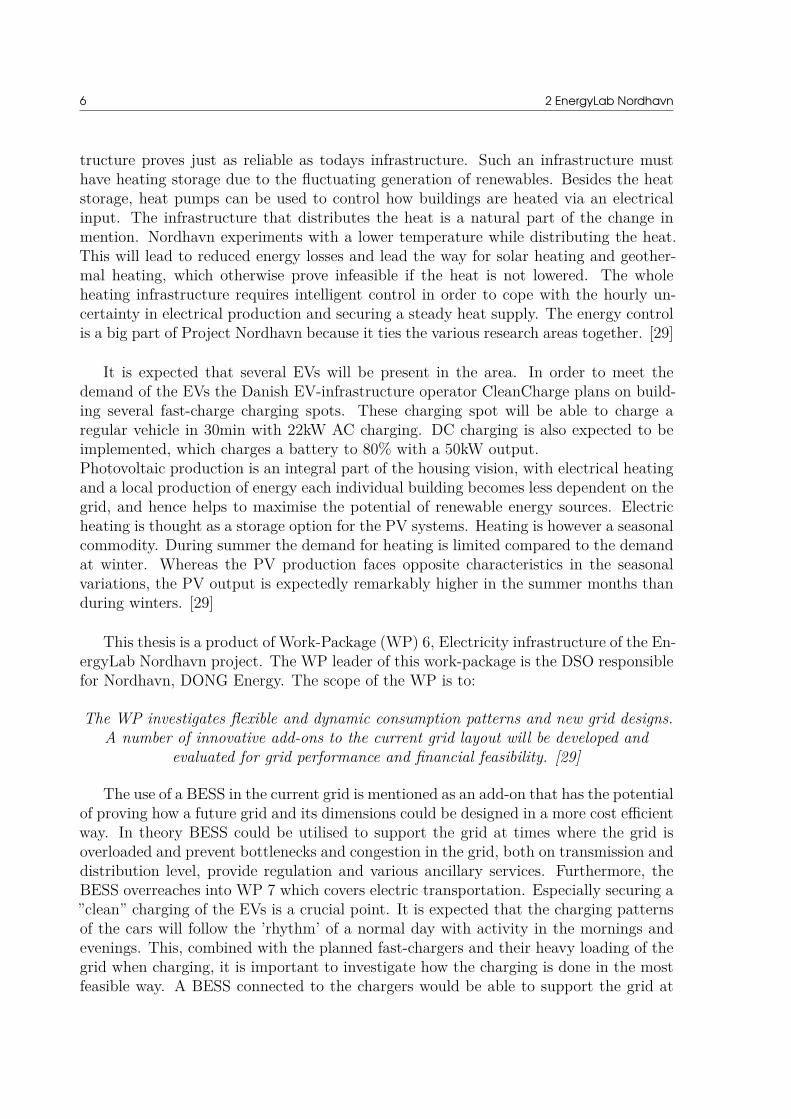
Figure 2.1: Overview of Research areas of EnergyLab Nordhavn [29].
Figure 2.1 provides an overview of all the solutions that the project aims to demon-strate. As mentioned the span in the project portfolio is wide and covers amongst otherthings, heating storage solutions where water is heated with excess electricity from re-newables instead of heat being delivered as a side-product from the conventional powerplants. With the increasing level of renewables it is apparent that we would need tofind a way to replace the heating infrastructure of today with an electrically driven heatinfrastructure. This change is mainly due to the role of conventional power plants, whichare the main source of heating, however, that role might change if an electrical infras-
6 2 EnergyLab Nordhavn
tructure proves just as reliable as todays infrastructure. Such an infrastructure musthave heating storage due to the fluctuating generation of renewables. Besides the heatstorage, heat pumps can be used to control how buildings are heated via an electricalinput. The infrastructure that distributes the heat is a natural part of the change inmention. Nordhavn experiments with a lower temperature while distributing the heat.This will lead to reduced energy losses and lead the way for solar heating and geother-mal heating, which otherwise prove infeasible if the heat is not lowered. The wholeheating infrastructure requires intelligent control in order to cope with the hourly un-certainty in electrical production and securing a steady heat supply. The energy controlis a big part of Project Nordhavn because it ties the various research areas together. [29]
It is expected that several EVs will be present in the area. In order to meet thedemand of the EVs the Danish EV-infrastructure operator CleanCharge plans on build-ing several fast-charge charging spots. These charging spot will be able to charge aregular vehicle in 30min with 22kW AC charging. DC charging is also expected to beimplemented, which charges a battery to 80% with a 50kW output.Photovoltaic production is an integral part of the housing vision, with electrical heatingand a local production of energy each individual building becomes less dependent on thegrid, and hence helps to maximise the potential of renewable energy sources. Electricheating is thought as a storage option for the PV systems. Heating is however a seasonalcommodity. During summer the demand for heating is limited compared to the demandat winter. Whereas the PV production faces opposite characteristics in the seasonalvariations, the PV output is expectedly remarkably higher in the summer months thanduring winters. [29]
This thesis is a product of Work-Package (WP) 6, Electricity infrastructure of the En-ergyLab Nordhavn project. The WP leader of this work-package is the DSO responsiblefor Nordhavn, DONG Energy. The scope of the WP is to:
The WP investigates flexible and dynamic consumption patterns and new grid designs.A number of innovative add-ons to the current grid layout will be developed and
evaluated for grid performance and financial feasibility. [29]
The use of a BESS in the current grid is mentioned as an add-on that has the potentialof proving how a future grid and its dimensions could be designed in a more cost efficientway. In theory BESS could be utilised to support the grid at times where the grid isoverloaded and prevent bottlenecks and congestion in the grid, both on transmission anddistribution level, provide regulation and various ancillary services. Furthermore, theBESS overreaches into WP 7 which covers electric transportation. Especially securing a”clean” charging of the EVs is a crucial point. It is expected that the charging patternsof the cars will follow the ’rhythm’ of a normal day with activity in the mornings andevenings. This, combined with the planned fast-chargers and their heavy loading of thegrid when charging, it is important to investigate how the charging is done in the mostfeasible way. A BESS connected to the chargers would be able to support the grid at

2 EnergyLab Nordhavn 7
hours when the power grid is overloaded or the renewable power generation is limited,this limits the impact of the EV charging on the grid and also helps in the facilitationof renewables.Lastly, the BESS is able to absorb excess PV production when the electric heatingsystems are saturated. With the vast possibilities of services that a BESS is able toprovide, it is crucial that the operating philosophy and scope of operation is closelyconsidered [29].

8
CHAPTER 3Battery Energy Storage &
ApplicationsUntil recently energy storage where restricted to facilitate the optimal output of thedominating electricity production i.e. coal, and provide services to stabilise the grid.In the US, this was done by applying hydro storage, which utilised the excess energyat times with low production to store any surplus energy in the hydro storage, anddispatching it at times with peak load. This service ensured that the output remainedstable and optimally driven at all times. Applications fitting this description are todaydefined as Time-Shifting services, which are the original motivation that led to the firstpush for battery energy storage in the 1980s. However it proved infeasible at the timedue to capacity limits in the batteries. The fast discharge capabilities of battery storageremained in focus, and with the ever increasing penetration of renewable energy, todayspower grid could benefit tremendously by the storage capabilities of an BESS.
In the 1990s Sandia National Laboratories (SNL) pinpointed 13 electric energy stor-age services that electrical energy storage technologies are able to cover. These servicesremain key drivers for maintaining a secure and stable power system all over the world[8]. These 13 services are shown in figure 3.1.
10 3 Battery Energy Storage & Applications
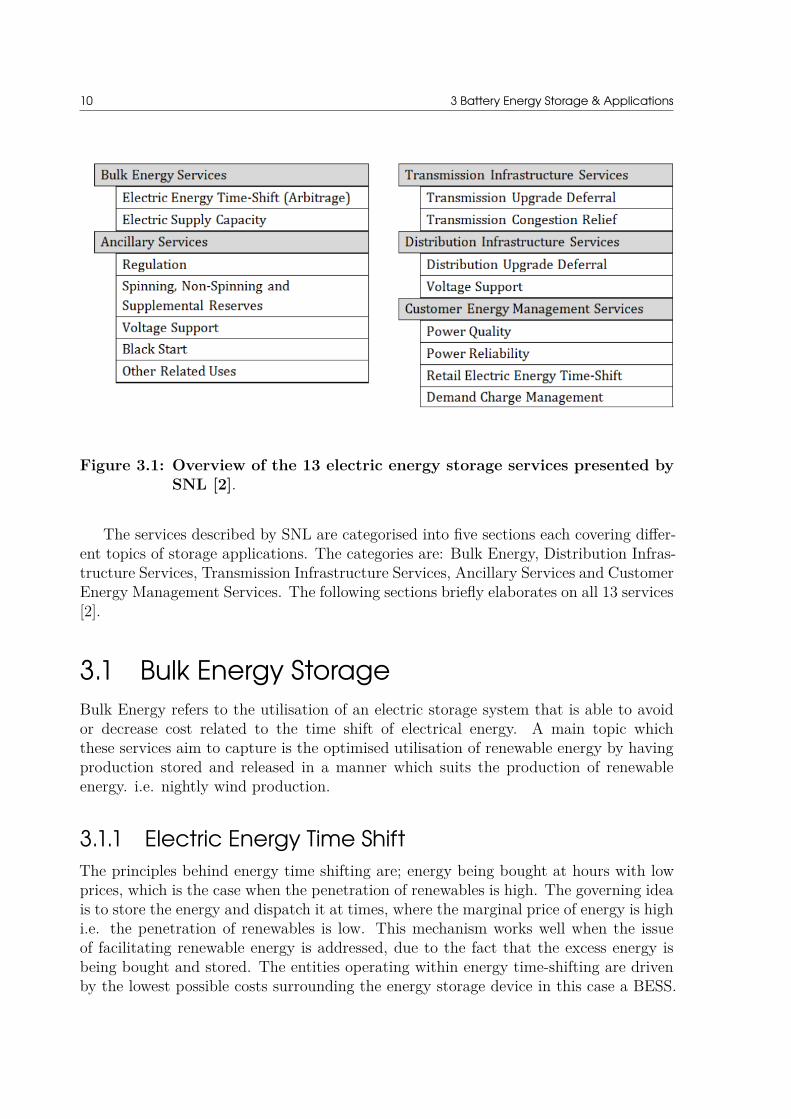
Figure 3.1: Overview of the 13 electric energy storage services presented bySNL [2].
The services described by SNL are categorised into five sections each covering differ-ent topics of storage applications. The categories are: Bulk Energy, Distribution Infras-tructure Services, Transmission Infrastructure Services, Ancillary Services and CustomerEnergy Management Services. The following sections briefly elaborates on all 13 services[2].
3.1 Bulk Energy StorageBulk Energy refers to the utilisation of an electric storage system that is able to avoidor decrease cost related to the time shift of electrical energy. A main topic whichthese services aim to capture is the optimised utilisation of renewable energy by havingproduction stored and released in a manner which suits the production of renewableenergy. i.e. nightly wind production.
3.1.1 Electric Energy Time ShiftThe principles behind energy time shifting are; energy being bought at hours with lowprices, which is the case when the penetration of renewables is high. The governing ideais to store the energy and dispatch it at times, where the marginal price of energy is highi.e. the penetration of renewables is low. This mechanism works well when the issueof facilitating renewable energy is addressed, due to the fact that the excess energy isbeing bought and stored. The entities operating within energy time-shifting are drivenby the lowest possible costs surrounding the energy storage device in this case a BESS.
3.2 Distribution System Services 11
The main drivers for reducing cost are high round-trip efficiency and energy capacity,which means that the ratio between energy stored and energy dispatched is kept as closeto unity as possible.
3.1.2 Energy Supply CapacityWhen storing energy through time shifting the conventional power plant could experiencea drop in scheduling, due to the stored energy is being prioritized before the power plant’sproduction being utilized. This again due to the economic assessment, that the marginalprice of the BESS dispatch is lower than the one offered by a conventional power plant.Currently the energy storage devices are only capable of delivering a small amount ofenergy for a short period of time relative to a power plant, whereas a power plant is muchmore reliable and can offer energy regardless of the current penetration of renewables.
3.2 Distribution System ServicesThe utilisation of BESS’s in the distribution system is the main driver in this thesis,with DONG Energy being a DSO and Project Nordhavn being within the distributiongrid. The focus of application revolves around the applications presented in this sectionas well as in Ancillary Services. Furthermore, the current state of BESS systems are interms of capacity, the physical space required to install the systems and discharge ratiomore suited for local grid expansion deferrals in weaker grids [6].
3.2.1 Distribution grid Upgrade DeferralDistribution grid upgrade deferral aims to postpone or remove completely the need forupgrading the existing grid, which would be a necessity if the grid capacity is not to beexceeded at peak periods or to prevent bottlenecks at the transformers. By installingBESSs in the system the power system could theoretically be run with a much higherefficiency while maintaining the high degree of availability, which will always remain thetop priority from a distribution and transmission perspective.
12 3 Battery Energy Storage & Applications
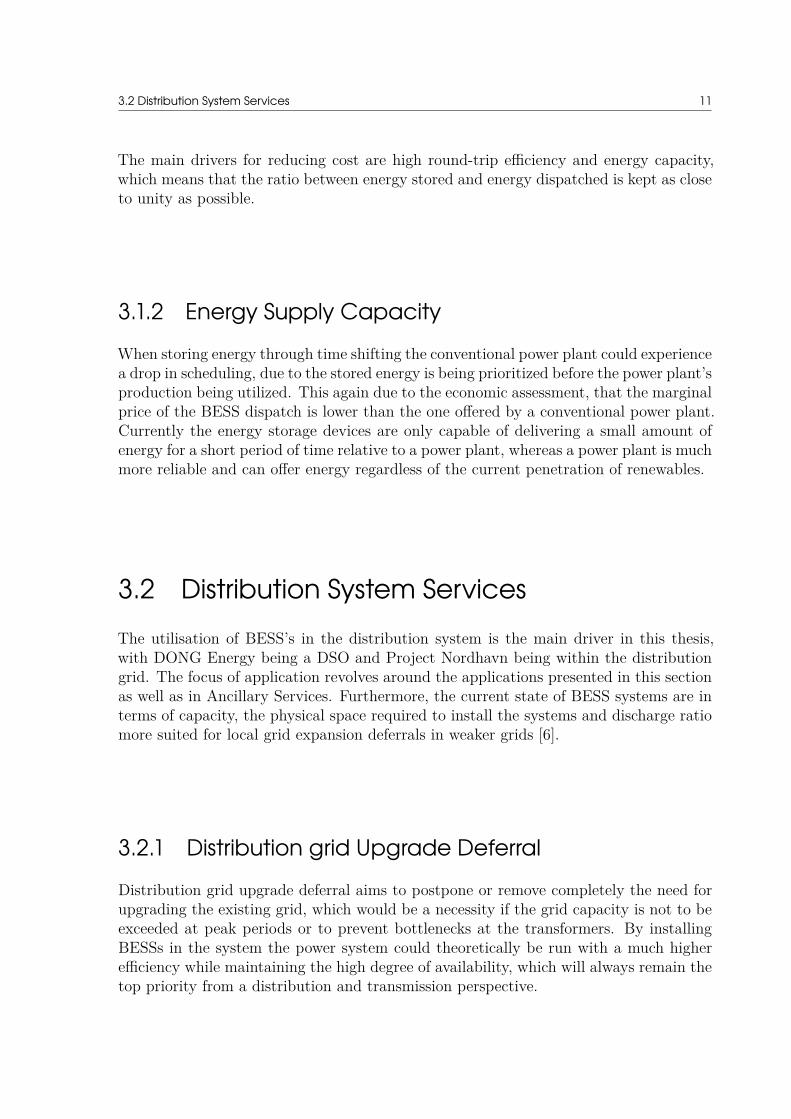
Figure 3.2: Distribution grid deferral by discharging a BESS at peak hour[2].
From figure 3.2 an example of how a storage system could support a system wherethe grid capacity threshold is about to be exceeded, is shown. On the upper figurethe peak at Wednesday evening is exceeding the local grid capacity, which would putunwanted tension on that part of the grid, resulting in a decreased lifetime of the cable.This is clearly an undesired scenario seen from the perspective of the DSO. To mitigatethe issue the excess demand relative to the threshold limit is discharged from the BESSsimultaneously as the peak occurs. This is seen on the lower part of figure 3.2, afterthe peak the BESS is recharging which generally happens at night where the demandis lowest. Furthermore, this charging pattern helps to facilitate the utilisation of renew-able energy, as wind power could potentially charge the battery at times where no otherapparent load is able to make use of the wind power. It is clear that the key issue insuch a solution is that the BESS must have capacity and discharge capabilities, whichenables the BESS to meet the demand of the DSO, in order to push the loading of thedistribution grid below the capacity limit during the entire peak period. A BESS is agood fit for deferrals in the distribution grid due to a relatively high predictability ofpeak hours and the periodic characteristics in the loads gives the BESS a reasonabletime frame to provide the service and in the post peak period recharging the battery.
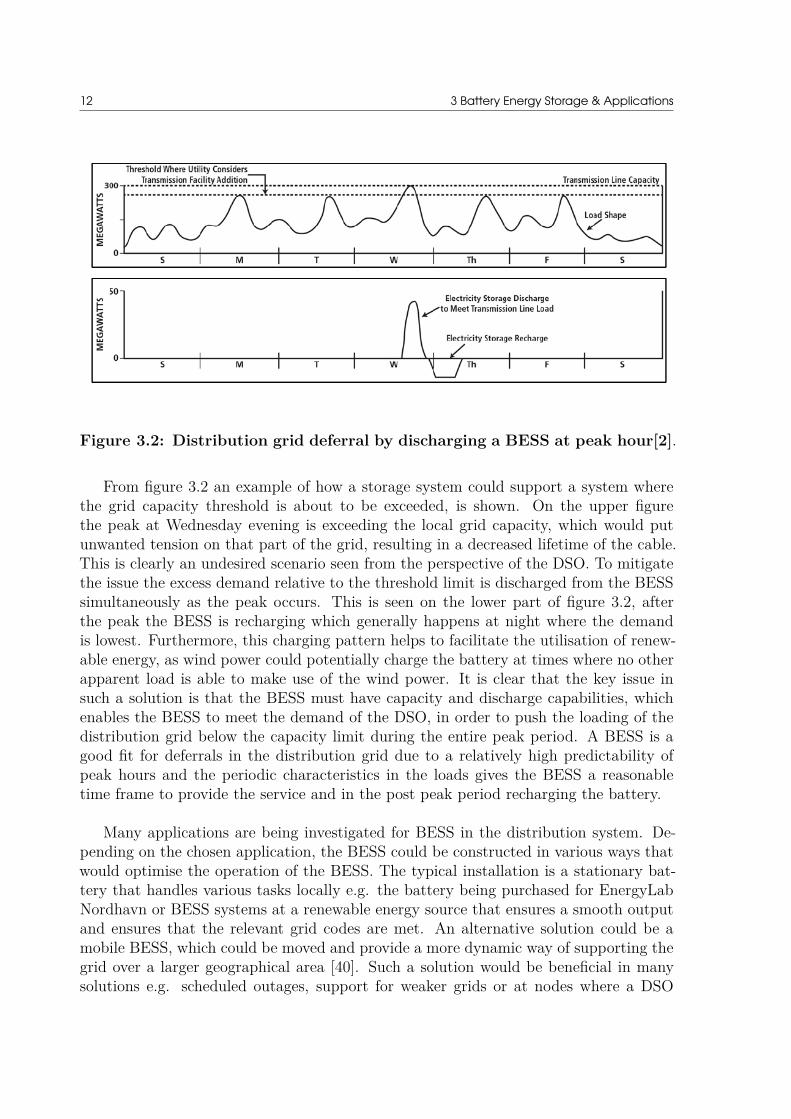
Many applications are being investigated for BESS in the distribution system. De-pending on the chosen application, the BESS could be constructed in various ways thatwould optimise the operation of the BESS. The typical installation is a stationary bat-tery that handles various tasks locally e.g. the battery being purchased for EnergyLabNordhavn or BESS systems at a renewable energy source that ensures a smooth outputand ensures that the relevant grid codes are met. An alternative solution could be amobile BESS, which could be moved and provide a more dynamic way of supporting thegrid over a larger geographical area [40]. Such a solution would be beneficial in manysolutions e.g. scheduled outages, support for weaker grids or at nodes where a DSO
3.2 Distribution System Services 13
expect a peak to arise, this could be at events, concerts etc. The utilisation methods ofBESSs is shown in figure 3.3
Figure 3.3: Different strategies of which a BESS can handle regulation[40].
14 3 Battery Energy Storage & Applications
3.3 Transmission Infrastructure ServicesTransmission services are in numerous ways similar to the services proposed in the dis-tribution grid. Transmission upgrade can be deferred or completely cancelled, due tostorage systems operating near the heavily loaded area and thereby ease the strain on thetransmission grid. Since this thesis is done in collaboration with DONG Energy, trans-mission services have been carved out from consideration due to transmission servicesnot being an area of responsibility for a DSO [5].
3.3.1 Transmission Grid Upgrade DeferralThe sole purpose of this service is to postpone grid extensions, reinforcement or otherotherwise necessary grid upgrades, which are required to maintain an acceptable opera-tion of the transmission grid in a power system. If at peak hours the transmission gridis reaching its capacity limit, the TSO would naturally be forced to reinforce the powergrid, at the node where the capacity is reached. Good industry conduct is to dimensionones transmission grid to handle peak loading. Such grid investments are substantialand would further stress the remaining system while the work is carried out. Alterna-tively the TSO could pursue an alternative solution, where a relatively small electricstorage system is integrated locally at the node where the capacity is insufficient. Thisstorage unit could then operate at peak hours resulting in a transmission grid upgradedeferral similar to figure 3.2.
3.3.2 Transmission Congestion ReliefTransmission congestion relief follows the same principles of 3.3.1. Congestion can occurthroughout the entire energy system. When cheap, scheduled power is unable to reachthe load due to the transmission capacity of the transmission line is reached, the systemwill experience congestion. This issue is purely geographical in terms of the distancebetween load, source and the transmission capacity between them. BESSs in the trans-mission grid could defer transmission grid expansions by supporting the local load athours with congestion. This operation would ease the congested area as the power flowwould decrease or be injected to other loads in the system.
3.4 Ancillary ServicesAncillary services is a term which covers several applications and services that aimsto support the power system and maintain grid security. The supportive services arequantified by looking at how they help to stabilise the system in terms of ensuring thatthe operational specifications in the local grid code are upheld.

3.4 Ancillary Services 15
3.4.1 RegulationRegulation is one of the ancillary services where the potential of a BESS could be utilisedwith the biggest impact. Regulation is the service that offsets any potential differencebetween generation and demand in the power grid. To secure grid stability, it is keythat the grid frequency is kept at the specified grid frequency to comply with the gridcodes of that region. Power generation units in operation are regulated by changingtheir output according to the change in frequency at the orders of the TSO. However,the ability of power plants to quickly change their power output is limited. This is due tothe rotating physical mass being the driver for change in the power output of the powerplant. Such a mass cannot be ramped up and down fast enough to compensate for theregulation requirements from the TSO. To cover the imbalances today gas turbines areoften used. They are quick to turn on an off and their power output is consequently veryquickly established, making gas turbines a good and responsive instrument for handlingregulation in cases of insufficient generation. Power plants are able to reduce their poweroutput in cases where the grid experiences a momentary excess production and when thepower plant is able to prepare for the change in output. Again, significant instantaneouschanges in the power plant has a negative effect in the expected lifetime of the plantdue to the material stress the turbine experiences[42].The natural characteristics governing battery energy systems. i.e. fast response time,makes them a very attractive player to include in the regulation market. Furthermore,a BESS specifically focused on the regulation market could follow the deviation muchmore accurately and provide up- and down-regulation instantaneously, whereas a con-ventional power plant or other mechanical generator would not be as responsive.
Figure 3.4: Different strategies of which a BESS can handle regulation [2].

16 3 Battery Energy Storage & Applications
Figure 4.2 provides an comparison of how a generation unit could provide regulation,compared to a BESS. It is apparent that the storage unit is able to deliver a wider rangeof regulation the generation unit i.e. power plant, can only provide additional output orlimit its existing output, whereas the BESS is able to discharge additional power to thegrid or absorb the same amount.
3.4.2 Frequency responseDepending on the local power system, the grid frequency must be kept at 50Hz inEurope and 60Hz in the US. Every time the system experiences a mismatch between theinstantaneous demand versus the instantaneous production a deviation from the nominalfrequency is seen. If demand is higher than production, the frequency decreases and viceversa. In the local grid codes an acceptable deviation band is defined, which in EU is±5%. The elasticity of the fluctuations in frequency in a power system is determined bythe inertia in the system, a high inertia system will see a smaller impact in frequencydeviation compared to a low inertia system [22].
R% = (ωNL − ωF L
ω0) · 100% (3.1)
Where R% is the percent droop with ωNL is the steady state frequency at no load,ωF L is the steady state frequency at full load and ω0 is the nominal frequency.
Figure 3.5: Steady state characteristics of droop control[22].
Figure 3.5, illustrates how the power output supplied by a generator or BESS isdependent with a change in grid frequency, when it deviates from the nominal frequencyof 50Hz. The generator will inject additional power to the system when the frequencyis below nominal and decrease generation or in the areas of BESS, stop charging. From

3.4 Ancillary Services 17
figure 3.5 it is apparent, that the power output of a generator or BESS is able to changebetween ±100% with the steady state nominal frequency ω0 as reference.
3.4.3 Voltage supportAs mentioned, when a generation unit is connected to the grid, they are required tofollow certain grid codes, which is specified by the grid operator DSO or TSO. The gridcode has a range of specifications that governs how the grid should be operated, someof the specifications are:
• Voltage levels
• Synchronism with grid
• Power factor limits
• Reactive power compensation
Voltage support is delivered by many different ways. One of the most common is bycontrolling the reactance locally at the point where the generation is supplied into thegrid. There is a direct correlation between reactive power output and the local voltagelevel, hence reactive power compensation is viable way of offering voltage support. InDenmark, the purpose of voltage support in regards to ancillary services is to maintainthe voltage between the acceptable nominal voltage level within a limit of ± 10%. Bat-tery storage systems are capable of absorbing - or injecting reactive power (VARs) intothe grid. Theoretically active power could also be used to balance the deviations, butVARs are classically used for voltage generation [22].
Voltage support service originating from storage technologies is currently neglected,due to various static and dynamic technologies, which are capable of maintaining thevoltage level required, through reactive power compensation from capacitor banks andsynchronous condensers.
3.4.4 Reserve CapacityThe physical balance of any power grid, measured in Hz, is the top priority for anypower system operator DSO or TSO. In order to secure that balance reserve capacitymust be kept available at all times, this capacity is called upon when the system facesimbalances. The term Spinning Reserve is from when conventional power plants werethe only actors on the reserve market. It implies that in order to deliver primary reservecapacity ones generator must be kept synchronous to the grid and have a power outputthat is below its nominal output. The output is defined thought the droop characteristicsfrom equation 3.1. The primary control is the first of three control protocol, which areused to maintain the balance in the electrical grid. The reaction time for the primaryspinning reserve, in DK2, has to be within 15 seconds of the imbalance [7]. The reaction
18 3 Battery Energy Storage & Applications
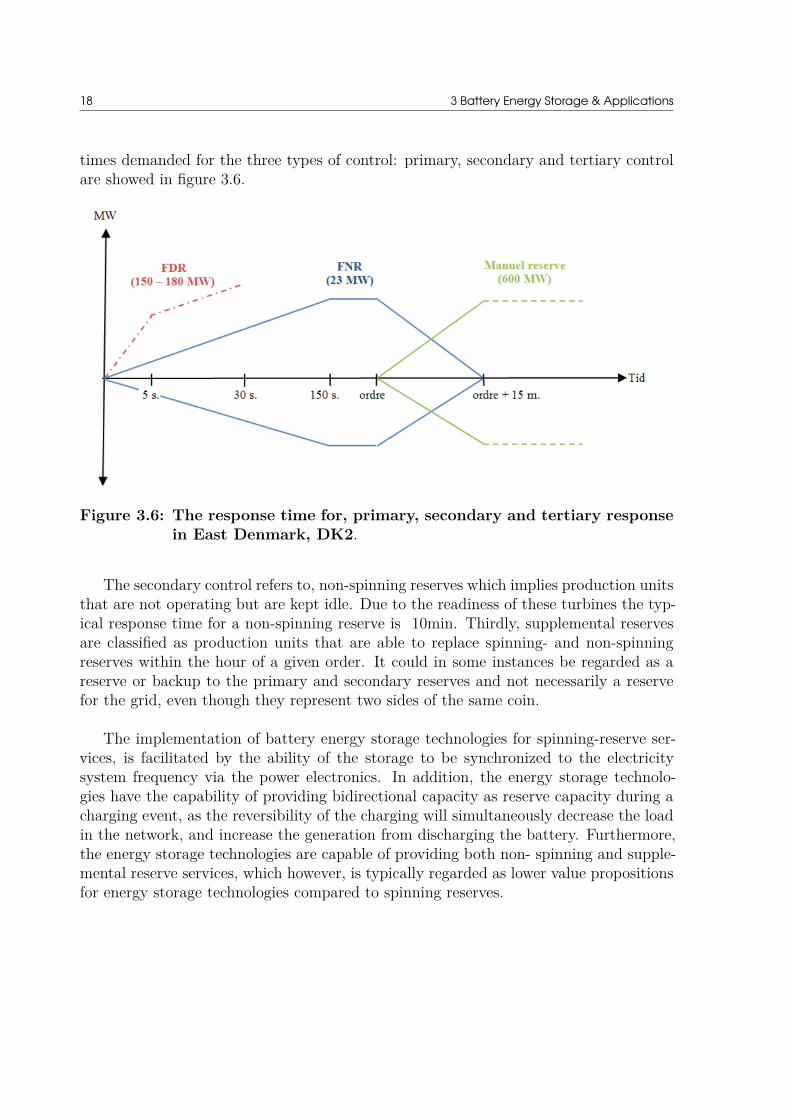
times demanded for the three types of control: primary, secondary and tertiary controlare showed in figure 3.6.
Figure 3.6: The response time for, primary, secondary and tertiary responsein East Denmark, DK2.
The secondary control refers to, non-spinning reserves which implies production unitsthat are not operating but are kept idle. Due to the readiness of these turbines the typ-ical response time for a non-spinning reserve is 10min. Thirdly, supplemental reservesare classified as production units that are able to replace spinning- and non-spinningreserves within the hour of a given order. It could in some instances be regarded as areserve or backup to the primary and secondary reserves and not necessarily a reservefor the grid, even though they represent two sides of the same coin.
The implementation of battery energy storage technologies for spinning-reserve ser-vices, is facilitated by the ability of the storage to be synchronized to the electricitysystem frequency via the power electronics. In addition, the energy storage technolo-gies have the capability of providing bidirectional capacity as reserve capacity during acharging event, as the reversibility of the charging will simultaneously decrease the loadin the network, and increase the generation from discharging the battery. Furthermore,the energy storage technologies are capable of providing both non- spinning and supple-mental reserve services, which however, is typically regarded as lower value propositionsfor energy storage technologies compared to spinning reserves.

3.5 Customer Energy Management Services 19
3.4.5 Load followingLoad following is a service where the BESS constantly changes it output in order toaccommodate the constant imbalance between load and generation locally. The varia-tion to the BESSs power output is determined by the grid frequency, more specific thedifference in momentary frequency compared to the nominal frequency of 50Hz. Tradi-tionally, the larger generation units provide load following. If the grid experiences a fallin frequency i.e. insufficient production, the generators will pick up the generation needto restore the frequency to nominal. The same goes with load following down; wherea frequency above 50Hz is seen. In such a scenario, the generators will decrease theiroutput to follow the frequency, back to 50Hz. During a normal day of operation, thegenerators follow the load up as the consumption rises in the morning and then followsit back down, when the loading decreases at night.
A storage system is a good fit to provide load following services due to several rea-sons; the fast response time of a BESS makes it able to do small instantaneous changeswhen either following the load up or down, this could increase grid integrity since thesmall fluctuations are smoothened out, a service the conventional generation unit can-not do. This is mainly due to the ramping time of the turbines, but it also strains themachinery, which decreases the lifetime of the unit.
3.4.6 Black startIn the event that a blackout occurs in the power grid, and a system collapses becauseall ancillary services have proven inadequate to maintain the integrity of the system.Black start capacity is the capacity to restart the system followed by system collapseand return it to operation. Such a capacity is typically considered a low value capacityin Denmark, due to the availability of the power system, which is among the best inthe world. Theoretically a BESSs could provide Black Start Capacity in the case of ablackout. But with the current market design of today, it would never prove to be aneconomically feasible solution due to the requirement of constant availability of 100%capacity on the BESS and the frequency of a single schedule easily being similar tothe designated lifetime of the battery, the return of investment would have a time-lineexceeding the life of the battery.
3.5 Customer Energy Management ServicesCustomer energy management services, entails services that are directly coupled to thelast step in the energy value-chain i.e. the end-users and loads. The recent trends areindicating that an increasing number of residential and commercial electricity consumers
20 3 Battery Energy Storage & Applications
are simultaneously becoming local power producers [16], mainly driven by increasing im-plementation of commercial PV systems. There is a big, uncovered potential in utilisingenergy storage on the consumer side of the distribution system. This potential is mostlikely to be explored further in the coming years. The most prominent energy servicesseen from a customer energy management perspective are described in the paragraphsbelow [37] [17] [8].
3.5.1 Power QualityA BESS has an obvious potential in securing the local power quality on a consumer gridlevel. This service could be called upon if a short term event causes the power qualityto be jeopardised, power quality, that is not able to meet the required standards canbe seen as: voltage magnitude deviating from the required nominal voltag e in the area,harmonic disturbances or a low power factor.If a BESS were to provide power quality services the energy storage would have tomonitor the instantaneous utility power quality, enabling the BESS to function as afilter that smoothens the output locally. The smoothening would be driven by theBESS’s output, which would discharge, charge or adjust its PQ output.
3.5.2 Power ReliabilityIn the event that a black-out occurs a BESS with the right dimension relative to thesize of the local load would be able to reenergise the local grid and keep it running in anisolated ‘island-mode’. Once the black-out is mitigated, the BESS has the capability ofrestoring synchronism with the grid. Obviously, power reliability of the type describedabove is only possible, with a ratio between the BESS capacity and the consumer loadthat enables the BESS to operate for a long period of time.
3.5.3 Retail Electric Energy Time-ShiftRetail energy time-shift incorporates a BESS with the local end-user energy consump-tion the aim is to lower consumers overall cost of energy. The governing concept ofretail energy time-shift is very similar to the energy time-shift presented in [8]. TheBESSs charging schedule is dependent on the energy-prices i.e. charging in periods withlow pricing and discharging at high prices. However, where the procedure of utilizingenergy storage for arbitrage is based on the discrepancy in wholesale prices throughoutthe day, the service for retail electric energy time-shift is based on the customers retailenergy prices, which requires that the consumer is able to track the price fluctuationscontinuously.
3.6 Services for Renewable Energy Integration 21
3.6 Services for Renewable EnergyIntegration
Another key potential with BESS is that such a system can support the world wide inte-gration of renewable energy. One of the main issues by the ever increasing penetrationof renewables is that they pose a challenge proportional to the amount of renewables inthe grid. BESSs could be positioned to deliver services directly to the generator in thegrid, those explicit services relates directly to renewable energy sources e.g. smootheningof a renewable energy sources output. Services relating to the grid codes of an operatorhave a potential to be very valuable since certain degree of generating losses are subjectto the requirement of the generator to be compliant with the grid-codes.
3.7 Chosen ApplicationsNumerous services explained in the sections in this chapter have the physical and techni-cal potential to provide the service in question, however, they generally are disregardeddue to: lack of relevance, no economic feasibility, not DSO relevant or does not fit theresearch scope of both Nordhavn and this thesis. The services selected for implementingas the control strategies for the algorithm are:
• Distribution Grid upgrade deferral
• FDR - Frequency Controlled Reserve
• PV optimisation
• EV charging
The reasoning behind the pursuit of these services are rooted in the apparent Best fitfor the BESSS and the philosophy behind the Nordhavn as well as the criteria defined inWP6. Lastly, through discussion with DONG Energy proposed services were discardedas the relevance to Nordhavn were deemed to have a lesser impact compared to others.The most prominent discarded services are:Voltage regulation was a service that initially were on the list of services worth pursuing.However, from discussions with DONG Energy it became apparent that the electric gridradial rarely experienced voltage issues, hence the need for reactive power control i.e.voltage regulation, is of less importance to the Nordhavn area.

22
CHAPTER 4Battery Energy Storage
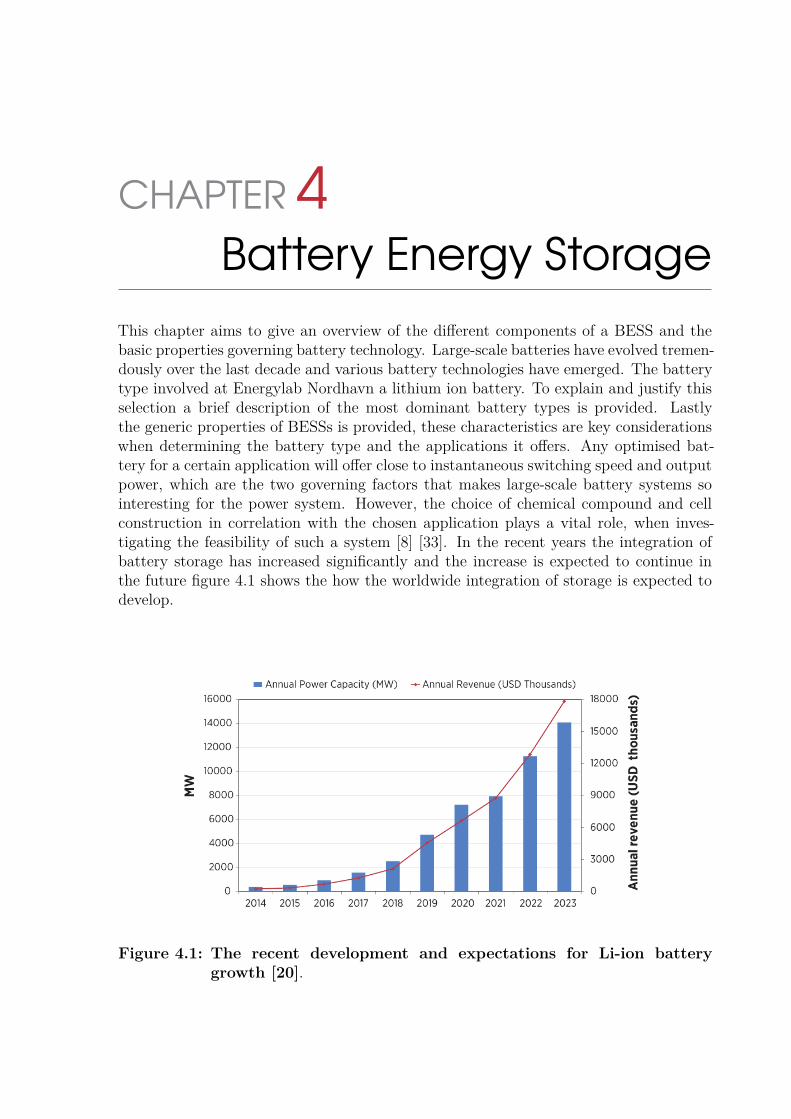
This chapter aims to give an overview of the different components of a BESS and thebasic properties governing battery technology. Large-scale batteries have evolved tremen-dously over the last decade and various battery technologies have emerged. The batterytype involved at Energylab Nordhavn a lithium ion battery. To explain and justify thisselection a brief description of the most dominant battery types is provided. Lastlythe generic properties of BESSs is provided, these characteristics are key considerationswhen determining the battery type and the applications it offers. Any optimised bat-tery for a certain application will offer close to instantaneous switching speed and outputpower, which are the two governing factors that makes large-scale battery systems sointeresting for the power system. However, the choice of chemical compound and cellconstruction in correlation with the chosen application plays a vital role, when inves-tigating the feasibility of such a system [8] [33]. In the recent years the integration ofbattery storage has increased significantly and the increase is expected to continue inthe future figure 4.1 shows the how the worldwide integration of storage is expected todevelop.
Figure 4.1: The recent development and expectations for Li-ion batterygrowth [20].
24 4 Battery Energy Storage
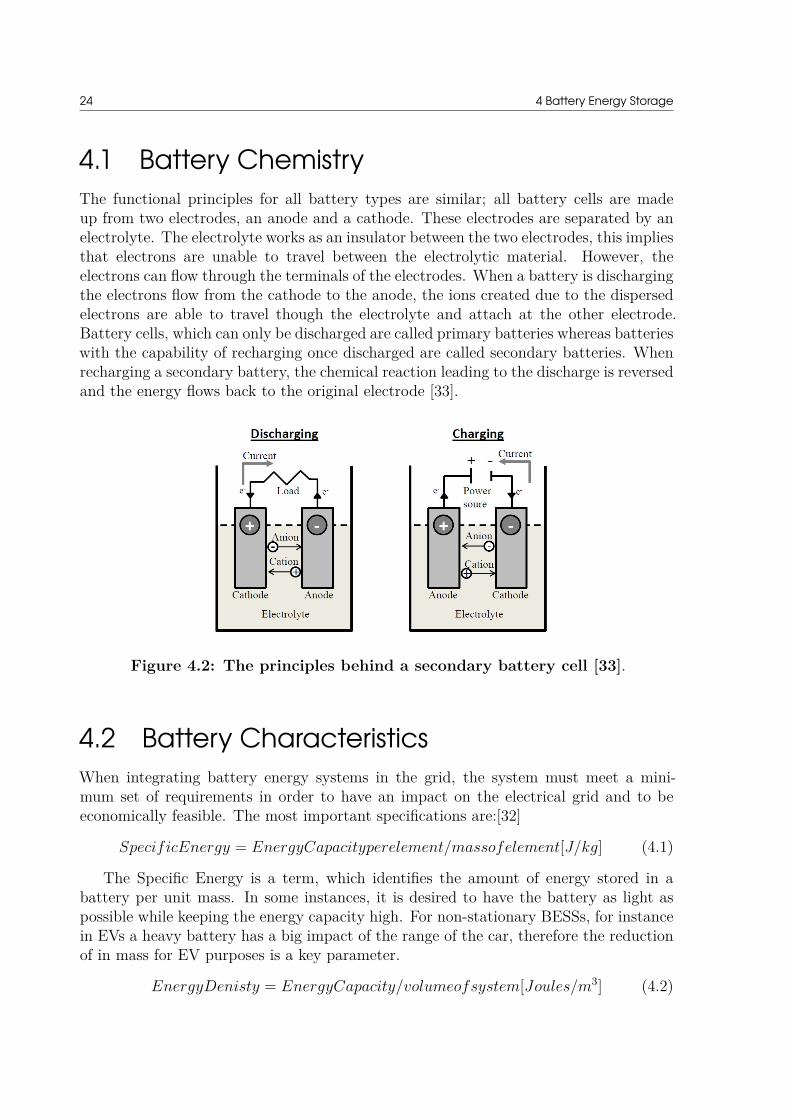
4.1 Battery ChemistryThe functional principles for all battery types are similar; all battery cells are madeup from two electrodes, an anode and a cathode. These electrodes are separated by anelectrolyte. The electrolyte works as an insulator between the two electrodes, this impliesthat electrons are unable to travel between the electrolytic material. However, theelectrons can flow through the terminals of the electrodes. When a battery is dischargingthe electrons flow from the cathode to the anode, the ions created due to the dispersedelectrons are able to travel though the electrolyte and attach at the other electrode.Battery cells, which can only be discharged are called primary batteries whereas batterieswith the capability of recharging once discharged are called secondary batteries. Whenrecharging a secondary battery, the chemical reaction leading to the discharge is reversedand the energy flows back to the original electrode [33].
Figure 4.2: The principles behind a secondary battery cell [33].
4.2 Battery CharacteristicsWhen integrating battery energy systems in the grid, the system must meet a mini-mum set of requirements in order to have an impact on the electrical grid and to beeconomically feasible. The most important specifications are:[32]
SpecificEnergy = EnergyCapacityperelement/massofelement[J/kg] (4.1)
The Specific Energy is a term, which identifies the amount of energy stored in abattery per unit mass. In some instances, it is desired to have the battery as light aspossible while keeping the energy capacity high. For non-stationary BESSs, for instancein EVs a heavy battery has a big impact of the range of the car, therefore the reductionof in mass for EV purposes is a key parameter.
EnergyDenisty = EnergyCapacity/volumeofsystem[Joules/m3] (4.2)
4.3 Energy Technologies 25
Especially in urban environments where the price of land is generally high, the spacea BESS occupies is a parameter which must be closely considered. Technically En-ergy Density has little value, however, when determining the economic feasibility of thesystem the space of which the system occupies is directly coupled to the price of theleased/bought land.State of Charge (SoC) is the term, which describes the current charged capacity relativeto the rated capacity of the BESS.
SoC = currentCapacity/ratedCapacity (4.3)
Depth of Discharge (DoD) is an alternate way of describing the current state ofthe battery. DoD is an expression which indicates the amount of energy that has beendischarged from the BESS, relative to the rated capacity.
DoD = 1 − SOC (4.4)
Two main governing measures for battery energy storage are the rated output andthe energy capacity of the system. The output is the instantaneous power, which thesystem can supply to the system, whereas the energy capacity is the total energy a BESSis able to supply over time.
4.2.1 Round-trip EfficiencyRound-trip efficiency is a term in energy storage systems, which characterises the ratiobetween the input - and output energy. It depends on the losses associated with chargingand discharging of the BESS. Specifically, when the system has charged from SOC =zero to SOC = 100% the system has been subject to various losses throughout theprocess e.g. cooling, conversion from AC/DC – DC/AC and control power. In addition,the BESS could be subject to standby losses, if the system is offering short term servicesi.e. regulation, load following etc. the overarching requirement to always be availablemust be obeyed. When the BESS is operating with long term services i.e. predetermined,scheduled services standby losses have little effect, which is the assumption governingthis project. A BESS operating with an 80% round-trip efficiency will use 1250 kWh tocharge a 1 MWh system.
4.3 Energy TechnologiesThrough conversations with DONG Energy the BESS that is to be installed in Nord-havn is very likely to be a Lithium-ion battery system. With that being determined,an in-depth description of the various storage option is not presented in this thesis,primarily due to the lack of relevance in relation to Nordhavn. However, an overviewof the landscape governing emerging storage technologies and the proven storage tech-nologies is presented. From this presentation the motivation of the selected technology,
26 4 Battery Energy Storage
Lithium-ion becomes clear. Following the overview, a detailed description of lithium iontechnology and the current developments within the technology is presented.
There are several types of storage, which all share the overarching capability ofstoring electrical energy in various ways, and releasing it when necessary. Overall thereare five different ways one could store electrical energy, each way having several specifictechnologies which handles the storage. the five types are [1]
• Mechanical
• Electrical
• Chemical
• Electrochemical
• Thermal
Mechanical storage has two types of storage, which are broadly implemented through-out the electrical grids in the world. Pumped hydro storage is widely implemented ingeographical areas with mountains. It is a very simple and elegant method of storingenergy. Pumped hydro storage pumps water up in reservoirs at times where the priceof electricity is low e.g. at times with a high penetration of renewable production or atnight where the load is low, simply storing the energy as potential energy. At high loadtimes, when there is limited renewable energy in the grid - the locks in the reservoirs areopened and the stored water flows through a turbine generating electricity. The secondform of mechanical storage is flywheels. Here the electrical energy is stored as rotationalenergy within a rotating mechanical device that spins a high velocity. When slowingdown the rotational speed of the flywheel a large amount of energy is released back intothe grid, the power is released over a short period of time.
Two types of electrical energy storage are Super capacitors and superconductingmagnetic energy storage (SMES). SMES is not developed to a point, where it is com-mercially attractive. The technology however shows great promise due to high efficiency,low maintenance and quick response. The technology demonstrates of electric energy isstored in a magnetic field that is created within a super-cooled coil. The low tempera-tures creates an environment for electric current where almost no resistance is present,hence the losses become very small and the prospect of long time storage are possible.The electricity demanded to maintain the temperature of the coil is the current break-ing point for the technology, before the issue of feasibly cooling the coil is solved thetechnology remains economically infeasible. [17] Super-capacitors utilises electrostaticfields between two conducting plates to store energy. The Super-capacitors provide ahigh power low energy service to a power grid. The discharged energy comes in shortburst, which makes them quick to react. Another positive features are high round tripefficiency (80-95%) and long life compared to conventional batteries of around 100.000
4.3 Energy Technologies 27
charge cycles. Super-capacitors are being integrated in power grids to provide voltagesupport, frequency regulation and in breaking systems in the locomotive industry.
Chemical storage is mainly based on the utilisation of Hydrogen in various forms, thetwo most dominant technologies being Hydrogen fuel cells and Hydrogen combustion.Hydrogen fuel cells are using the reversed process of electrolysis where H2O is split intoH2 and O2. The reversed process takes the two elements and produces H2O and elec-tricity via a fuel cell, which then can be fed into the grid. Despite the efficiency beingapproximately 35% fuel cell has huge focus due to the minimal environmental impactis has. Hydrogen combustion is utilising Hydrogen as a fuel. Hydrogen can be usedto drive a turbine, similar to gas-turbines that widely integrated in the power systemstoday. The combination of natural gas-turbines already well integrated in the systemand the highly explosive nature of Hydrogen makes it hard for Hydrogen- turbines topenetrate the market.
Lastly, electrochemical storage is the most versatile storage technology today. Themost dominant type of electromechanical storage are lead acid batteries, Sodium sulphos(NaS) and finally Lithium-ion. Lead acid batteries are the most mature technology andwidely integrated in the power system. The electrolytes are typically made from leadmetal and lead oxide and the electrolyte consist of sulphuric acid. Compared to otherelectrochemical technologies the DoD in lead acid batteries are comparatively smaller.In NaS batteies the electrochemical process in the battery cell occurs under high temper-atures (300 - 350 deg C). The positive electrode is molten sulphur and molten sodiumat the negative electrode. The electrolyte is made from solid ceramic alumina. NaSbatteries are costly to operate due to the high operating temperature, further, thereare few manufactures in the industry that produces NaS batteries, which is causing thedevelopment within the technology to progress slowly, due to the lack of competition.
28 4 Battery Energy Storage
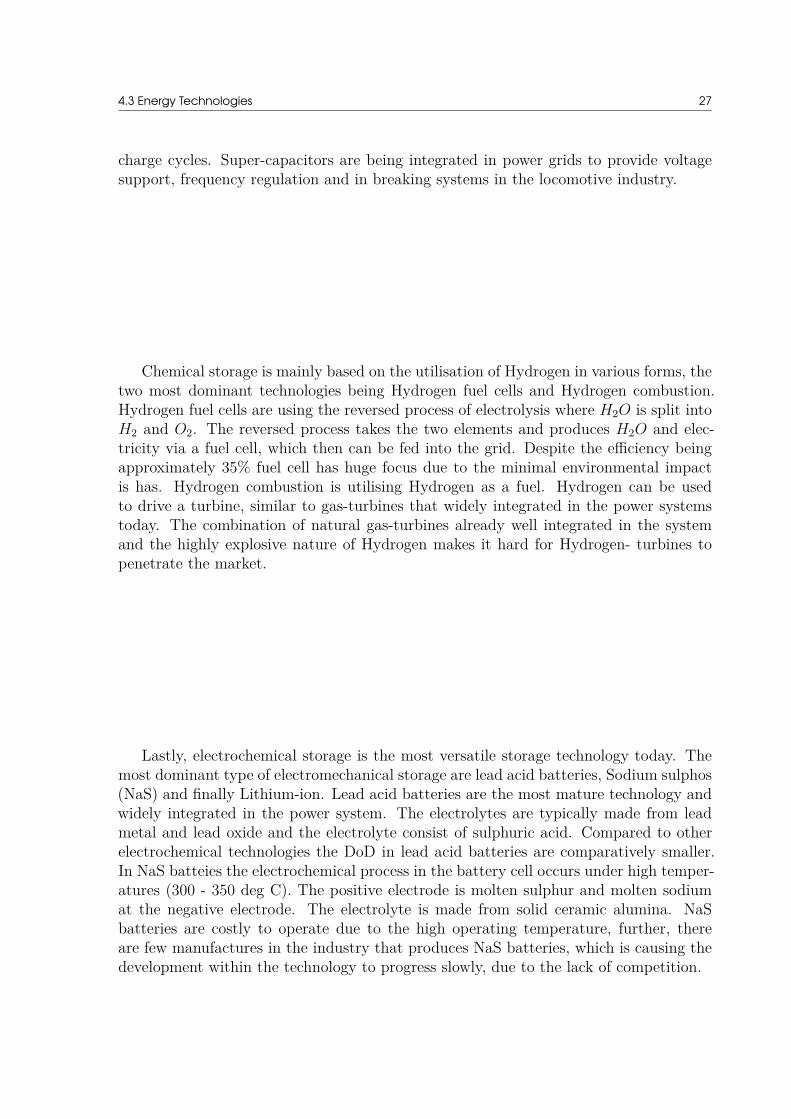
Figure 4.3: Overview of different storage technologies their efficiencies andtypical applications [1].
Figure 4.3 shows how the most prominent storage technologies compare against eachother and which applications the individual technology has the most potential. Thepotential is expressed by creating a matrix with the ’Discharge Time at Rated Power’and the rated capacity and compare how those characteristics match different energyservices presented in chapter[3]. From the figure the high versatility of lithium-ion is seen,with the opportunity to provide quick response services such as frequency regulation andthe high power discharging potential, which could be used in balancing [8].
4.3.1 Lithium IonLithium-Ion (Li-ion) battery technology has been developed and optimised for half acentury, the batteries are widely integrated in various consumer electronics today. Thebattery technology is especially attractive due to the high energy density, efficiency,lifetime and low self-discharging levels. Lithium (Li) is the main element in the batterycells, the battery characteristics are therefore mainly determined by the characteristicsof Lithium of which a high electromechanical potential and low molecular mass is themost important i.e. high power and energy density. The various implementations ofLithium ion batteries have matured the technology for consumer use. The preferred
4.3 Energy Technologies 29
battery technology in EVs have been lithium ion, which have pushed development ofthe technology towards higher capacity, better efficiency and increased lifetime. Li-ionbatteries have currently reached efficiency levels around 85-98% with lifetimes in therange of 5-15 years. Besides the technological improvements, the overall cost of Li-ionbatteries has decreased rapidly making the use of Li-ion even more promising and oneof the emerging battery technologies with the biggest potential. [32]
Figure 4.4: Lithium ion overview [NEXEON].
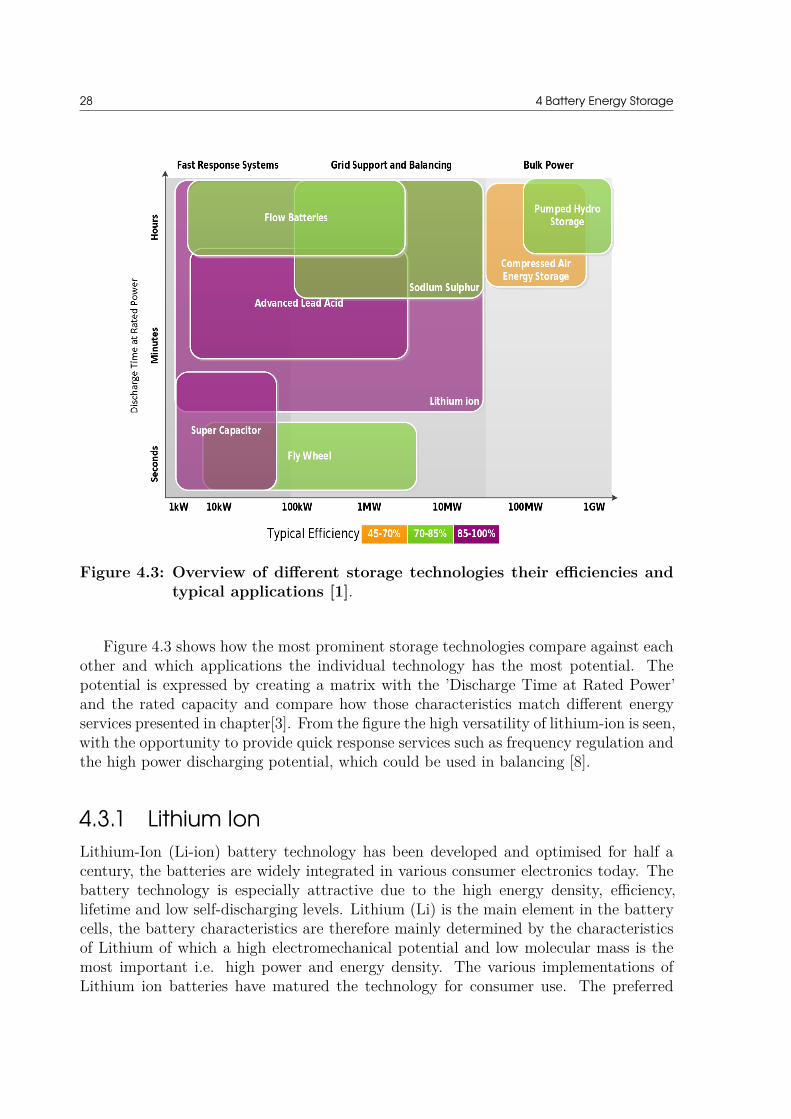
The process of charging and discharging Li-ion batteries is shown in equation.
LixC + Li1−x ⇀↽ LiMO2 + C (4.5)
From 4.4 the schematics of a Li-ion cell is presented. The Lithium ions passes throughthe electrolyte from the cathode to the anode when discharging and vice versa when thebattery is recharging. The negative electrode consists of a graphene layered structurewhereas the positive electrode is often different complex compositions of lithiated metaloxide.
The growing interest in Li-ion batteries have led to a big decrease in prices, theinterest is primarily driven by storage potential in power system and electric vehicles.Generally the global renewable agenda and the emerging interest from the electricalenergy sector are driving down cost. In Germany the price of PV related BESS droppedby 25% in 2014. This development has clear economy of scale benefits, which are adding
30 4 Battery Energy Storage
to the price reductions.
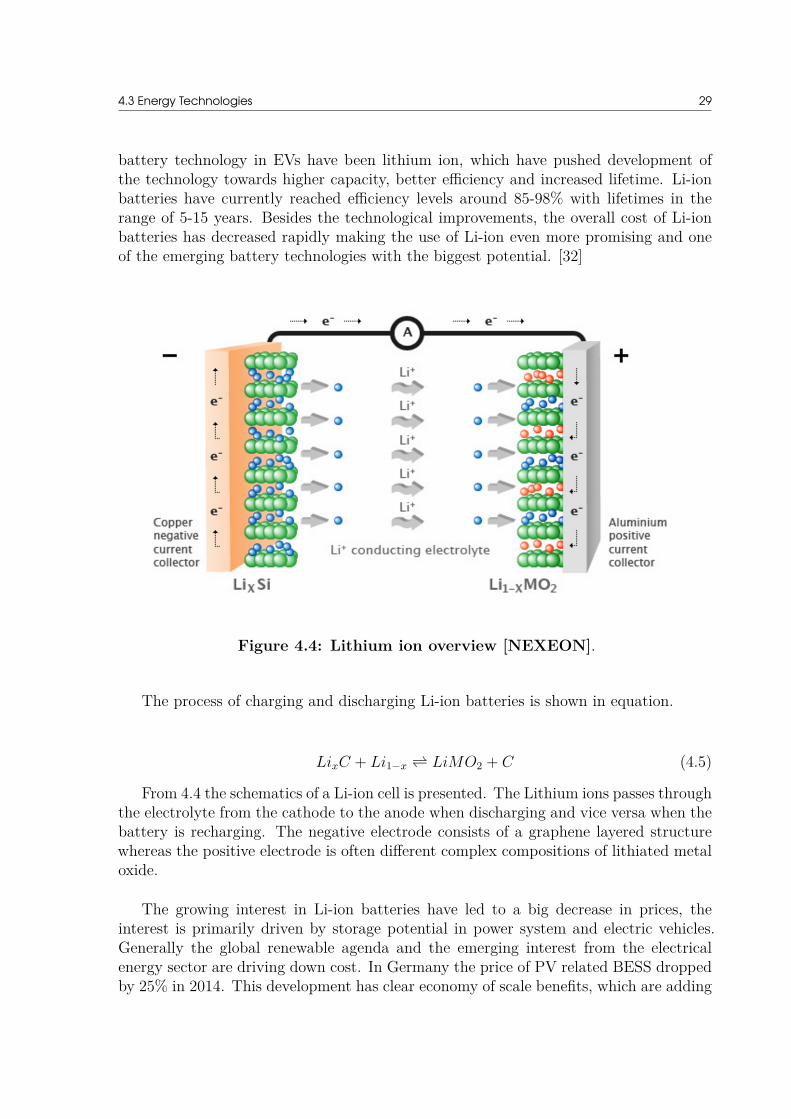
Figure 4.5: Lithium ion overview [17].
Figure 4.5 shows the projected development in price for different electrochemicaltechnologies. This shows the dramatic drop in price for Li-ion technology. The de-velopment in Li.ion prices as described above could have a negative on the remainingelectrochemical technologies since an asymmetry in competition could skew the market.This is naturally beneficial for Li-ion tech companies. However, it is crucial that techcompanies are able to demonstrate cost reductions if BESS want a real foothold in theenergy sector. A general requirement for renewable energy sources is to demonstratecost reductions in order to be independent of governmental subsidies in the future andthat trend has to follow throughout the entire industry.
4.3 Energy Technologies 31
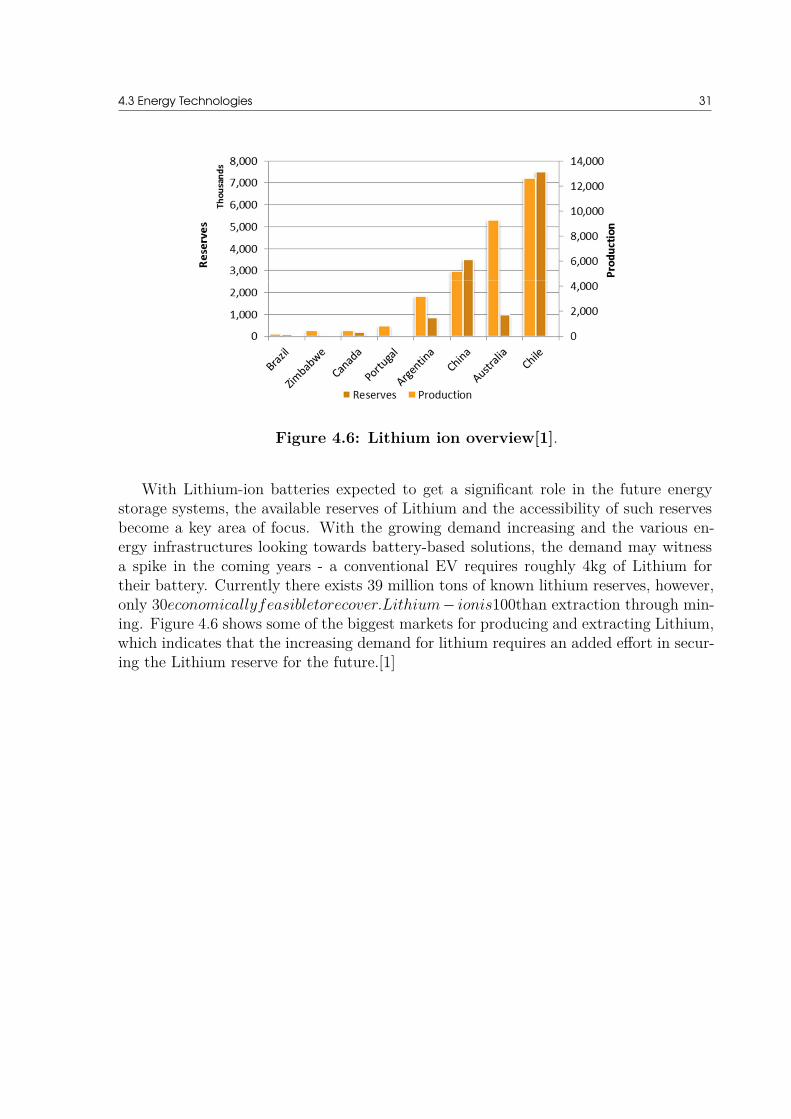
Figure 4.6: Lithium ion overview[1].
With Lithium-ion batteries expected to get a significant role in the future energystorage systems, the available reserves of Lithium and the accessibility of such reservesbecome a key area of focus. With the growing demand increasing and the various en-ergy infrastructures looking towards battery-based solutions, the demand may witnessa spike in the coming years - a conventional EV requires roughly 4kg of Lithium fortheir battery. Currently there exists 39 million tons of known lithium reserves, however,only 30economicallyfeasibletorecover.Lithium − ionis100than extraction through min-ing. Figure 4.6 shows some of the biggest markets for producing and extracting Lithium,which indicates that the increasing demand for lithium requires an added effort in secur-ing the Lithium reserve for the future.[1]

32

CHAPTER 5Optimisation and Control
TechniquesThe selected BESS applications described in chapter 3 are subject to an in-depth analy-sis of how the applications operate under real life simulations. These simulations can bedone through mathematical optimisation. By converting the BESS characteristics andapplications to constraints subject to a problem formulation. Depending on the perspec-tive of the BESS the problem formulation can be constructed in different ways. Withthis thesis being done in collaboration with the Danish DSO DONG Energy, the scopeof the problem formulation is to maximise the earning of the battery. This formula-tion includes both capital expenditure (CAPEX) and operational expenditure (OPEX).CAPEX covers the initial investments in order to get the BESS to operate i.e. batterypurchase, installation, certifications and land rights. OPEX covers the costs related tooperation of the battery i.e. maintenance, charge pricing etc. This should however beoffset by the revenue from the services provided and how often the battery is scheduled.
Mathematical optimization is a very generic tool, which has been used for decadesin many different aspects and industries. Generally, optimisation is used when multiplesolutions exists to a problem, the primary motivation behind optimisation is not to assess,whether a problem is calculated correctly this is a precondition. Optimisation workswithin the realm of solutions that satisfy an objective function i.e. the mathematicallyexpressed function, which is defines the problem where the ”best” solution must beidentified. The quality or fitness of the solution is expressed as the global maximaor minima of the function. The objective function is subject to a range of conditionsand constraints, this scopes and specifies the realm of which the problems need to beoptimised. Due to the high variety of problems, which general optimisation is ableto solve - many different optimisation techniques have been developed throughout theyears. Generally optimisation can be split into deterministic and heuristic optimisation.Deterministic optimisation aims to have the optimisation converge towards a globaloptimum. The most significant deterministic optimization techniques includes:
• Linear Programming (LP)
• Binary Integer Programming (BIP)
• Mixed Integer Linear Programming (MILP)

34 5 Optimisation and Control Techniques
• Stochastic programming
• Quadratic programming
Heuristic optimisation is searching for a global optimum, where random inputs areinserted in the algorithms that conduct the search. Examples of heuristic optimisationare:
• Evolutionary algorithms
• Genetic algorithms
• Particle swarm optimisation
• Differential evolution
Heuristic algorithms are able to search for the global optimum while analysing anon-linear function, an application deterministic algorithms are unable to handle. Thenon-linear properties and random inputs can however cause problems when determiningwhether or not the global optimum is found. The optimum could easily be a local opti-mum.
The following sections provides a brief overview of some of the most significant op-timisation techniques. The overview is not meant to provide in-depth explanation toevery technique and the reader is assumed to have a basic understanding of mathemati-cal optimisation. The overview is aimed to give insight to why the selected optimisationtechnique was chosen.
5.1 Linear ProgrammingLinear programming is one of the most valuable tools within optimisation and is thesole reason that companies and entire industries have saved millions. The fundamentalidea governing linear programming is taking a scarce resource and utilising it in waysthat maximises profit, minimises cost or generally optimises a given problem. Theextremely generic nature of the mathematics used in LP makes is usable in big varietyof problems ranging from: The travelling sales man optimising his route to customersbased on distance and profit, production companies maximising their warehouse basedon materials and demand and energy dispatch in power systems. LP has been used inseveral decades and many varieties of the optimisation process has since been discovered[11]. The standard LP formulation is seen in equation: 5.1.
5.2 Binary Integer Programming 35
maximise Z = c1x1 + c2x2 + ... + cnxn
subject toa11x1 + a12x2 + ... + a1nxn ≤ b1
a21x2 + a22x2 + ... + a2nxn ≤ b1
...
am1x1 + am2x2 + ... + amnxn ≤ b1
wherex1 ≥ 0, x2 ≥ 0, xn ≥ 0
(5.1)
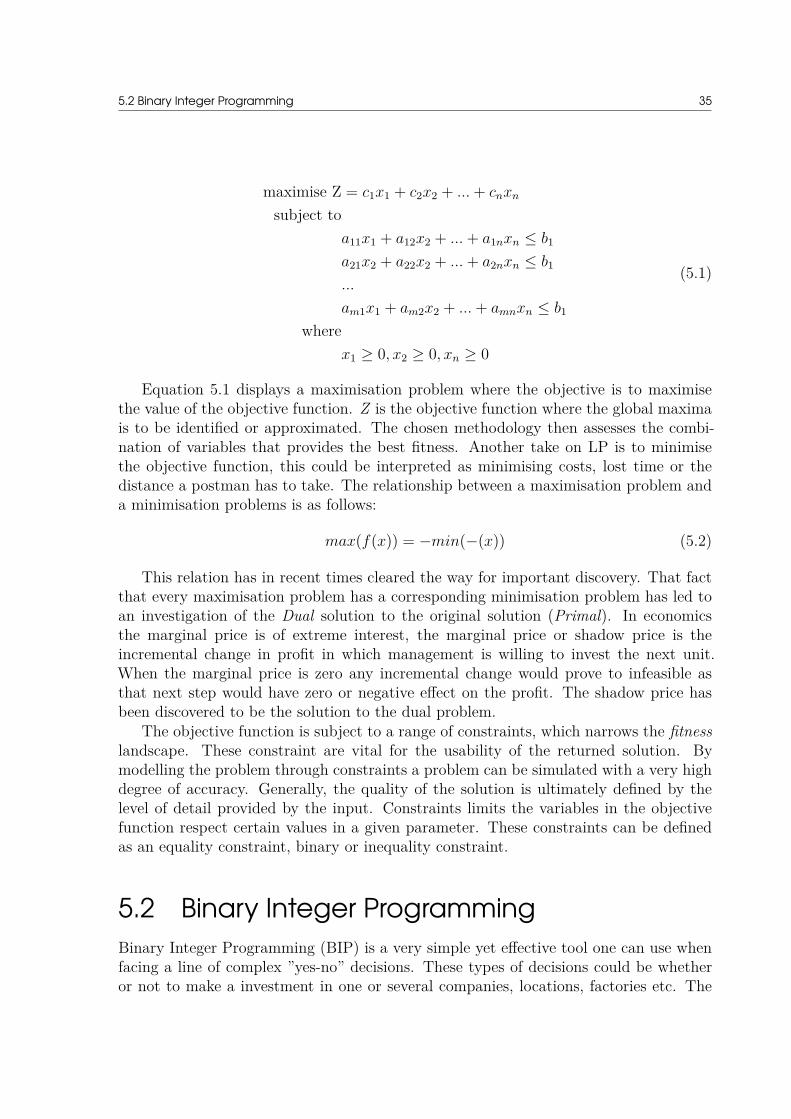
Equation 5.1 displays a maximisation problem where the objective is to maximisethe value of the objective function. Z is the objective function where the global maximais to be identified or approximated. The chosen methodology then assesses the combi-nation of variables that provides the best fitness. Another take on LP is to minimisethe objective function, this could be interpreted as minimising costs, lost time or thedistance a postman has to take. The relationship between a maximisation problem anda minimisation problems is as follows:
max(f(x)) = −min(−(x)) (5.2)
This relation has in recent times cleared the way for important discovery. That factthat every maximisation problem has a corresponding minimisation problem has led toan investigation of the Dual solution to the original solution (Primal). In economicsthe marginal price is of extreme interest, the marginal price or shadow price is theincremental change in profit in which management is willing to invest the next unit.When the marginal price is zero any incremental change would prove to infeasible asthat next step would have zero or negative effect on the profit. The shadow price hasbeen discovered to be the solution to the dual problem.
The objective function is subject to a range of constraints, which narrows the fitnesslandscape. These constraint are vital for the usability of the returned solution. Bymodelling the problem through constraints a problem can be simulated with a very highdegree of accuracy. Generally, the quality of the solution is ultimately defined by thelevel of detail provided by the input. Constraints limits the variables in the objectivefunction respect certain values in a given parameter. These constraints can be definedas an equality constraint, binary or inequality constraint.
5.2 Binary Integer ProgrammingBinary Integer Programming (BIP) is a very simple yet effective tool one can use whenfacing a line of complex ”yes-no” decisions. These types of decisions could be whetheror not to make a investment in one or several companies, locations, factories etc. The

36 5 Optimisation and Control Techniques
classic formulation of a BIP problem is [11]:
maximise Z = c1x1 + c2x2 + ... + cnxn
subject to
xj =
1 if decisionj is yes0 if decisionj is no
wherej = 1, 2, 3, ..., n
(5.3)
BIP optimisation is deemed far to simple to cover the complexity of this thesis, how-ever, BIP modelling introduce an interesting addition to conventional LP optimisationthat is worth investigating.
5.3 Mixed Integer Linear ProgrammingThis section is not meant to exhaust the areas governing mixed integer programmingbut rather give a fundamental understanding of the methodology behind Mixed IntegerLinear Programming (MILP). Generally, MILP is an extension of LP and BIP, where thedecision variables have multiple characteristics for example, binary variables, continuousvariables or integer values. This capability to include different types of decision variablessupersedes the capabilities of LP. The general formulation of MILP is as follows:
maximise Z = cx + hy
subject toAx + Gy ≤ b
x ∈ R+
y ∈ Z+
(5.4)
The integer variable x is a set of non-negative integers with the dimension m andcontinuous variable y is a set of n dimensional non-negative real vectors. An optimiza-tion problem is defined by specifying the following data with: c as a n-vector, A as am × n matrix, G as a m × p matrix and b as a m-vector. The problem formulation in3.1 only contains inequality constraints but can be converted to equality constraints byadding slack variables [11].
MILP optimisation is very powerful optimisation method, due to the allowed diversityof the variables the method is able to handle. The objective function is still linear andserves the same purpose as presented in the LP section. MILP optimisation is regardedas a good fit for the optimisation purpose proposed in this thesis. The variables arepresumably going to have many characteristics covering different aspects of the BESSsimulation, which a MILP algorithm is able to cover. Furthermore, the optimisation

5.3 Mixed Integer Linear Programming 37
method is not bringing unnecessary complexity to the problem. The problem functionremains linear and non-quadratic, which removes the necessity to include quadraticprogramming or heuristic programming. However, the optimisation techniques are veryrelevant to power system optimisation and will be an implementation requirement ifthe algorithm in this thesis is to be developed further. Therefore a brief overview ofquantitative approach to these optimisation techniques are presented below.

38 5 Optimisation and Control Techniques
5.4 Quadratic ProgrammingQuadratic programming is very similar to LP, it handles the same type of constraintsas regular LP optimisation and the approach is generally the same. The differencebetween quadratic programming and LP is in the formulation of the problem. Quadraticprogramming introduces a squared decision variable or the product between makingthe objective function quadratic. Quadratic programming is a very important mainlybecause many natural phenomena does not follow a strict linear function. The standardformulation of a quadratic problem is as follows:
maximise f(x) = cx − 12
xT Qx
subject toAx ≤ b
wherex ≥ 0
(5.5)
c and b are vector parameters used in constraining the problem and defining theobject function. Q is a matrix in the problem formulation, the individual elements in Q(qij) are constant meaning qij = qji which explains the 1
2 .
5.5 Heuristic Optimisation 39
5.5 Heuristic OptimisationThe advantage of heuristic algorithms is that they are able to handle non-linear functionsand non-linear constraints. However, the search methods are implementing a randominputs or a range of initial solutions, which means that a global optimum is not guar-anteed and thus the final conclusions must be subject to large degree of scepticism andsensibility analysis. An in-depth introduction to heuristic optimisation is not given inthe following section but a brief overview of the methodology is presented. The motiva-tion for doing so is to give an insight to optimisation techniques but most importantlyto support the decision of doing the analysis and simulation of the BESS using a MILPapproach. The following consist of brief introductions to some of the most prominentheuristic algorithms.
5.5.1 Evolutionary AlgorithmsA general upside to heuristic algorithms and especially evolutionary algorithms are thatsolutions to complex non-linear problems are often found quicker and more accuratelythan standard optimisations. Therefore evolutionary algorithms have been a researcharea with a growing focus, mainly due to the characteristics described above as well asa big potential within multi-modal -, combinatorial - and multi-objective optimisation.
The main inspiration behind Evolutionary optimisation is based on biological evolu-tion, where a candidate solution is gradually improving over time, in the biological worldthese improvements originate from reproduction, mutations and a constant selection ofthe strongest candidates to pass its genes on to the next e.g. ’survival of the fittest’. Inoptimisation terms this implies that the evolutionary algorithm evolves as the optimisa-tion proceeds. To initiate and run an Evolutionary algorithm three main componentsmust be provide :
• Population; A population is a set of n initial solutions, which satisfies the con-straints, however, there is no guarantee that the solutions contain the optimumsolution.
• Fitness; This is an indicator of how strong each solution from the population is.This is calculated based on how close the solution is to a given criteria of theoptimisation.
• Evaluate: Each individual solution in the population will be evaluated and adjustedto determine who has the best fitness and who has the worst.
After that process, a set of m weakest solutions will be discarded from the previouspopulation and m new solutions based on the strongest solutions in the previous solutionsare added to the population. This process continues until a stopping criteria is found i.e.sufficiently strong fitness, maximum number of iterations or computational time-limit isreached [44].
40 5 Optimisation and Control Techniques
5.5.2 Genetic Algorithms
The Genetic Algorithm is a type of Evolutionary Algorithm, which uses the same funda-mental iterative process to search for an optimum with a given problem. Its populationis created from a set of randomly generated individuals and the fitness is usually deter-mined from the objective function.
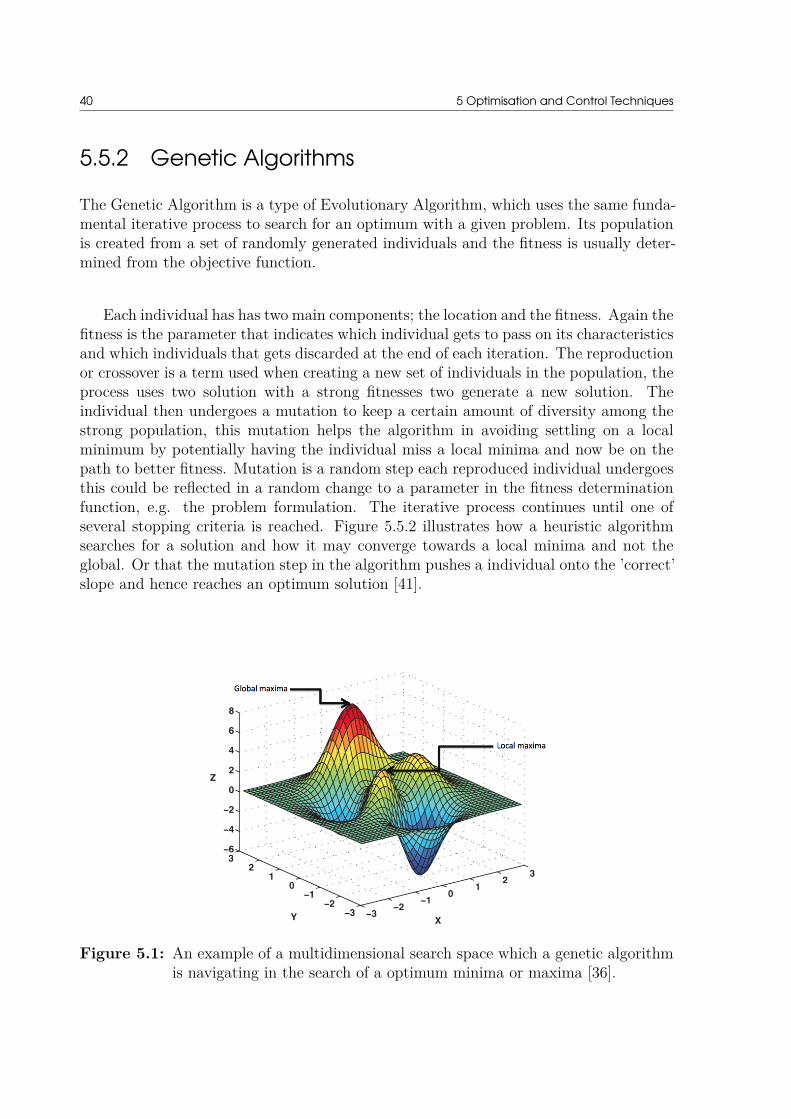
Each individual has has two main components; the location and the fitness. Again thefitness is the parameter that indicates which individual gets to pass on its characteristicsand which individuals that gets discarded at the end of each iteration. The reproductionor crossover is a term used when creating a new set of individuals in the population, theprocess uses two solution with a strong fitnesses two generate a new solution. Theindividual then undergoes a mutation to keep a certain amount of diversity among thestrong population, this mutation helps the algorithm in avoiding settling on a localminimum by potentially having the individual miss a local minima and now be on thepath to better fitness. Mutation is a random step each reproduced individual undergoesthis could be reflected in a random change to a parameter in the fitness determinationfunction, e.g. the problem formulation. The iterative process continues until one ofseveral stopping criteria is reached. Figure 5.5.2 illustrates how a heuristic algorithmsearches for a solution and how it may converge towards a local minima and not theglobal. Or that the mutation step in the algorithm pushes a individual onto the ’correct’slope and hence reaches an optimum solution [41].
Figure 5.1: An example of a multidimensional search space which a genetic algorithmis navigating in the search of a optimum minima or maxima [36].

5.5 Heuristic Optimisation 41
5.5.3 Particle SwarmThe original idea behind Particle Swarm method is to replicate a swarm of birds ability tonavigate and fly synchronously. The method has various similarities with Evolutionaryalgorithms and Genetic algorithms. The method starts with an initialisation of theprocess similar to the process described above, each candidate solution created in theinitialisation i.e. each particle, has an initial knowledge about four characteristics, theseare:
• Current location
• Historically personal best location
• The global best location of any particle in the population
• Current velocity
The particle swarm method introduces the velocity as a new parameter, which is anew addition compared to the genetic and evolutionary algorithms. The method is aiterative process, however the there is no crossover or mutation operators in the process,as seen in the two techniques described above. In stead each individual updates its posi-tion i.e. solution based on the a number of parameters. The previous solution/location,historically best location, the best global position of the entire population and a fewweighting parameters. The new velocity i.e the change in variables subject to the loca-tion is then used to calculated a new position for the particle. This process continuesuntil a stopping criterion is reached [21].

42
CHAPTER 6Algorithm and Modelling
This chapter discusses the final BESS strategy and how it is formulated as a MILPproblem. The controls implemented in this thesis are peak-shaving, virtual spinningreserve, local PV optimisation and EV charging, which are discussed in chapter 3. Theproblem formulation of the strategy is a generic cost minimisation problem, which aimsto keep the battery operating in the most feasible way. The governing idea of thecontrol strategy, is to use various forecast for the upcoming day of operation, which givesthe BESS an opportunity to prioritise the dispatch. The simulations uses real historicdata; solar radiation, load-profiles and day a-head prices. These inputs are fed to thealgorithm and the optimisation commences. In the scenario where all applications cannotbe handled, the control is formulated in a way, that the control algorithm prioritisescertain applications. Prioritisation is relevant, when the current SOC, total capacity ormaximum discharge in the period is insufficient to cover all applications with a certainperiod. All applications are pre-prioritised so that the most important applications areensured to operate, this is done by disregarding other applications. The order of priorityfor applications covered in this thesis is:
1. Peak-shaving
2. Primary Control - Virtual reserve
3. PV optimisation
4. EV charging
The chosen order of priority is set to reflect the applications most valuable to aDSO. The order is relative to the owner of the battery and the business case governingthat business. An EV operator would for instance have good reason to prioritise EVcharging, which is the application that ensures that whenever an EV is charging at theBESS, that the energy is provided to the EV’s is the cheapest and most sustainable. Byhaving the perspective of a DSO, i.e. DONG Energy peak shaving is the applicationthat originally motivated the utilisation of grid connected BESSs, as mentioned in 3 bysuccessfully shaving the energy drawn from the grid at peak hours a DSO can postponegrid extension and therefore run a more profitable business without compromising thesecurity of the system.
The control algorithm itself is created without prejudice as to the agenda of theowner. This ensures that if possible all applications are utilised whenever it is possibleonly in the case of an infeasible solution the prioritisation is activated. This prioritisation
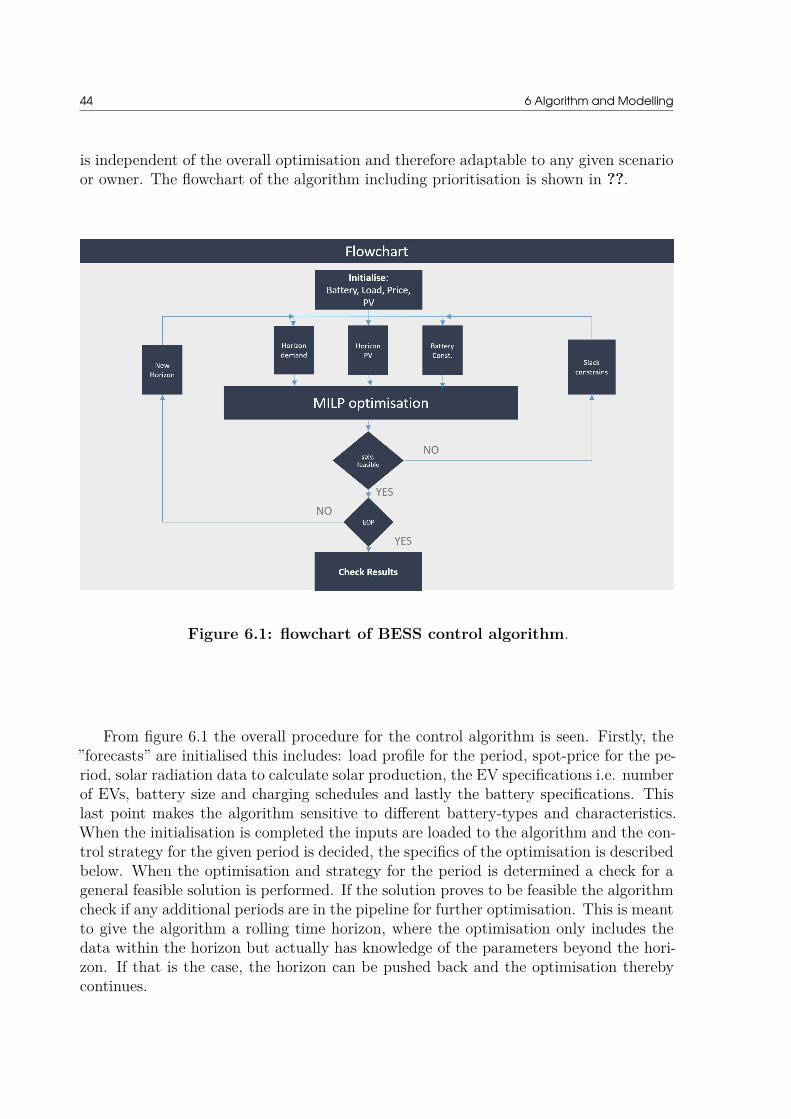
44 6 Algorithm and Modelling
is independent of the overall optimisation and therefore adaptable to any given scenarioor owner. The flowchart of the algorithm including prioritisation is shown in ??.
Figure 6.1: flowchart of BESS control algorithm.
From figure 6.1 the overall procedure for the control algorithm is seen. Firstly, the”forecasts” are initialised this includes: load profile for the period, spot-price for the pe-riod, solar radiation data to calculate solar production, the EV specifications i.e. numberof EVs, battery size and charging schedules and lastly the battery specifications. Thislast point makes the algorithm sensitive to different battery-types and characteristics.When the initialisation is completed the inputs are loaded to the algorithm and the con-trol strategy for the given period is decided, the specifics of the optimisation is describedbelow. When the optimisation and strategy for the period is determined a check for ageneral feasible solution is performed. If the solution proves to be feasible the algorithmcheck if any additional periods are in the pipeline for further optimisation. This is meantto give the algorithm a rolling time horizon, where the optimisation only includes thedata within the horizon but actually has knowledge of the parameters beyond the hori-zon. If that is the case, the horizon can be pushed back and the optimisation therebycontinues.
6.1 MATLAB MILP - Yalmip 45
6.1 MATLAB MILP - YalmipThe following section explains the main reasoning behind the implementation of theYALMIP toolbox together with the MOSEK solver. When a MILP problem is beingconstructed through MATLAB’s regular syntax, the creator must follow the syntax inequation 6.1:
maximisef tx
subject toA · x ≤ b
Aeq · x = beq
lb ≤ x ≤ ub
(6.1)
Where f is the function vector subject to the vector variable x, which defines theobjective function of the problem. A is a matrix which multiplied with the variable xdefines the value that is constrained by the vector b as an inequality constraint. Aeq isthe matrix that together defines the inequality constraints that are subject to the valuein the vector beq. Finally, lb and ub represent the upper and lower bounds to the variablex. These bounds are not a strict necessity however they can limit the computation timeof the optimisation, if the solver knows beforehand which ranges of the variable x to lookfor. The variables and parameters are defined as: f , x, b, beq, lb, and ub are vectors,and A and Aeq are matrices.
maximisez = cx + hy
subject toAx + Gy ≤ b
x ∈ R+
y ∈ Z+
(6.2)
The programming structure allowed by implementing the YALMIP toolbox enablesthe user to follow the standard MILP formulation presented in equation 5.4. This en-ables a purely mathematical approach to be taken instead of having to transfer the mathinto a programming syntax, which complicates the process. Especially the distinctionof variables and their corresponding constraints are much more intuitive when YALMIPis implemented and it gives the reader a more direct understanding of the approachestaken in the design phase of the algorithm
The variables implemented in the algorithms are shown in table 6.1. The variablescover among other things the active outputs of the BESS as well as the SOC.
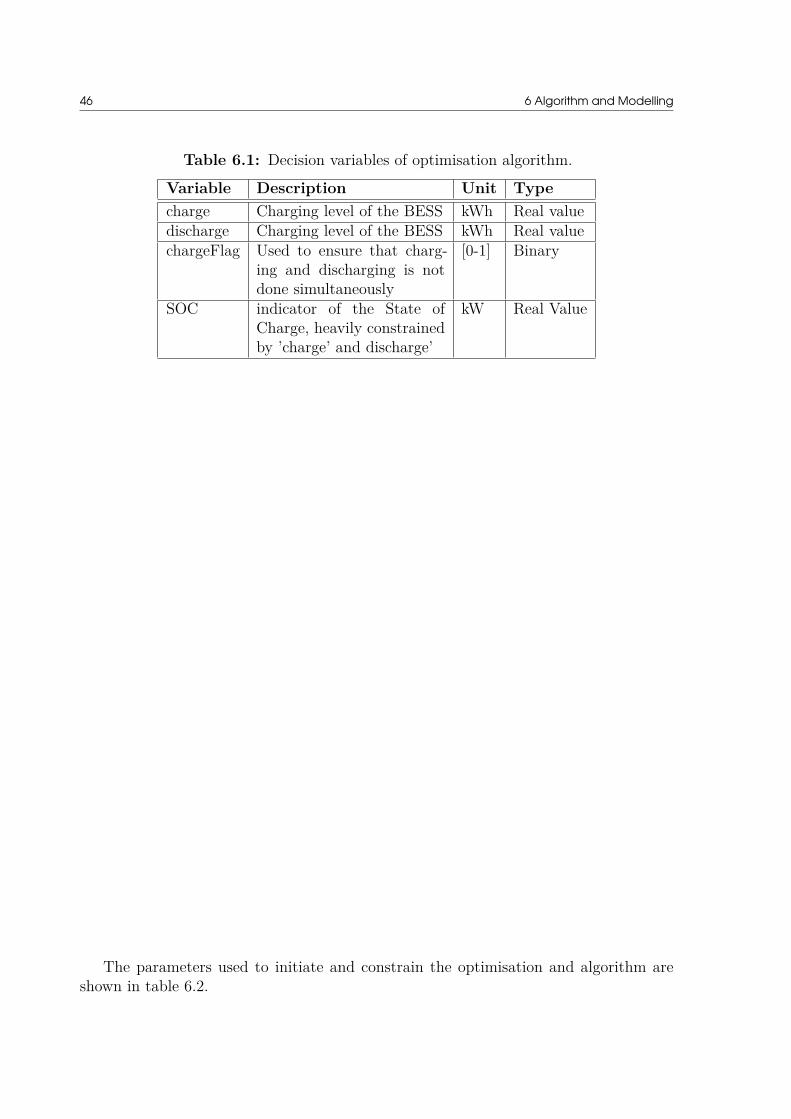
46 6 Algorithm and Modelling
Table 6.1: Decision variables of optimisation algorithm.
Variable Description Unit Typecharge Charging level of the BESS kWh Real valuedischarge Charging level of the BESS kWh Real valuechargeFlag Used to ensure that charg-
ing and discharging is notdone simultaneously
[0-1] Binary
SOC indicator of the State ofCharge, heavily constrainedby ’charge’ and discharge’
kW Real Value
The parameters used to initiate and constrain the optimisation and algorithm areshown in table 6.2.

6.2 Problem Formulation 47
Table 6.2: Optimisation parameters for algorithm.
Parameter Description Unit Valueperiod Number of days the simula-
tion runsDays
horizon Timesteps within period(15min)
Minutes 96
numCycles Charge cycles of BESS ’Integer’ 7chargeMax Maximum charge power kW 500BESSCap BESS maximum energy ca-
pacitykWh 1000
GridCapacityLimit Capacity limit of the grid,which gives rise for the peakshaving limit
kW 1450
RTE Round trip Efficiency ofBESS
% 80
schoolLoad Energy load from the school,which owns the PV system
kWh 90
InitialInv CAPEX for BESS DKK 10000price Hourly price vector with
spot price (REF to SPOTmarket)
DKK
PV Hourly PV production, ex-cess power is distributed tothe BESS
kWh
EV Charge pattern of EV’s inthe area
kWh
peak Hours where the loadexceeds the GridCapac-ityLimit withing a period
Integer
doublePeakFlag Checking parameter formultiple peak hours
NordHavnLPV total load at Nordhavn in-cluding PV production andEV consumption
kWh
6.2 Problem FormulationThe problem formulation is normally the heart of all optimisation problems, due to thewanted solution being to maximise or minimise a specific problem. The problem formu-lation in this thesis reflects the more holistic approach this thesis takes, the main goal isto minimise cost for the DSO. This perspective is driven by the fact that any failure in
48 6 Algorithm and Modelling
the algorithm at peak loads could result in the DSO being forced to upgrade the distri-bution grid, which they want to avoid. The problem formulation is shown in equation 6.3.
minz = −dischargeh · powerPriceh + Chargeh · powerPriceh (6.3)Due to the lack of an indepth economic, NPV angle to this project the problem for-
mulation is kept quite simple. All energy flowing into the battery is subject to a pricewhich is paid. All discharged energy is seen as a part of a service, which is connectedto a price that bears a profit. However, the final figure of the objective function is oflittle interest in this thesis. As previously stated the scope is to define an algorithm thatforces the BESS to behave according to a set of services available, therefore the focalpoint of the algorithm is the constraints defining the services, which the BESS provides,not the end results in terms of a monetary value.
If the prices where quantified and a real commercial setup were assumed, the prob-lem formulation would have been highly complex and include several cost - and revenueparameters. Despite the interesting results such an analysis would provide, this falls outof the scope of this work. Since since BESS associated with EnergyLab Nordhavn is aresearch project that aims to demonstrate the possibilities, limits and overall potentialof installing and running a battery storage system in the distribution grid, seen from apure electrical perspective. Therefore by keeping a very simple objective function thefinal analysis will not provide a blurred picture in terms of the most feasible solution.on the contrary, it shows a clear indication of the limits of the battery and the upsidesand potential downside of the various combinations of hybrid solutions.
6.3 ConstraintsAs YALMIP ensures the constraints subject to the problem formulation can be kept ona high-level, which makes it easier for the reader to comprehend each constraint andthereby the roots of the algorithm. Below, a complete review of all constraints is given.
0 ≤ charge(h) ≤ chargeMax · (1 − chargeF lag(h)) (6.4)
0 ≤ discharge(h) ≤ chargeMax · chargeF lag(h) (6.5)The constraints from eq. 6.4 and eq.6.5 is used to determine if the BESS is charging
or discharging within a certain timeframe. The binary variable chargeFlag is utilised toensure that the battery is unable to charge and discharge simultaneously in the sametime-step. If the battery is scheduled to charge in a given period, chargeFlag is set tozero in the optimisation, this creates the boundaries for the variable charge to be strictlybetween.
6.3 Constraints 49
0 ≤ charge(h) ≤ chargeMax · (1 − 0) ⇒ 0 ≤ charge(h) ≤ chargeMax
where chargeMax is the parameter deciding the power level the BESS can chargewith.In the case that the battery is to discharge in a given period, chargeFlag is set to one.This gives creates the boundaries for charge to:
0 ≤ charge(h) ≤ chargeMax · (1 − 1) ⇒ 0 ≤ charge(h) ≤ 0
The inverse relation between eq. 6.4 and eq. 6.5 makes it possible for dischargingconstraints similar to the ones presented above. The negative magnitude for dischargingis applied elsewhere in the constraints, the reason for the positive magnitude is to distinctbetween the revenue from services, where the BESS discharges a certain amount andwhen the SOC is updated where discharge is subtracted from the previous SOC.
discharge ≤ SOC(h) (6.6)Equation 6.6 ensures that the discharge level of the battery is limited to the SOC at
that time-frame. The overall discharge level is secure in eq. 6.5, however, in the scenariowhere SOC < chargeMax the BESS can only discharge the amount available from theBESS SOC.
nordHavnLPV(h) − (discharge(h) · RTE) + charge(h) ≤ GridCapacityLimit (6.7)
A central equation in the peak-shaving capabilities of the BESS is shown in eq.6.7.The idea behind peak-shaving is that the local load cannot exceed the power transfercapabilities of the installed capacity in the grid. Therefore by setting a constraint thatrequires the total load including EV’s and PV production in peak hours to be lower thanthe parameter GridCapacityLimit this should be avoided. When the discharge variableis included it motivates the optimisation to discharge the battery at peak hours, since itis the only variable in the equation that has a chance to ensure the requirement is met,at peak hours.
0 ≤ SOC(h) ≤ BESSCap (6.8)Equation 6.8 defines the capacity limit of the BESS, this ensures that the SOC does
not exceed the capacity specified by the physical battery.A lower bound is introducedto make sure that the discharging is only available, when energy is stored in the BESS.
SOC(h+1) == SOC(h) +(charge(h) −(discharge(h) ·RTE))+(PV(h) −schoolLoad) (6.9)
With the maximum capacity of the SOC set in equation 6.8, the actual chargingand discharging mechanism that connects the charging and discharging variables to the
50 6 Algorithm and Modelling
SOC is defined in equation 6.9. Here the SOC for the upcoming time-step is definedby; the current SOC level added the charging and discharging variables for that timeinstance. When the optimisation is done in MATLAB, it introduces the possibility ofconditional constraints. Equation 6.9 is a conditional constraint which is dependent onthe last part of the equation. If the PV production of the PV-system installed on thelocal school, exceeds the static school load the excess PV production is absorbed bythe battery. (PV(h) − schoolLoad) covers the additional PV power that is fed into thebattery.
SOC(h+1) == SOC(h) + (charge(h) − (discharge(h) · RTE)) (6.10)When introducing conditional constraints, at least one additional constraint must beintroduced. This constraint aims to cover the scenario where the first condition cannotbe met. Equation 6.10 is the else condition, in programming terms, that is the activeconstraint whenever a specific condition is unachievable. In this case, when the PVproduction is insufficient compared to the school load. SOC is updated as in equation6.9 but without the part including PV production.
∑charge(h) ≤ chargeMax · numCycles (6.11)
∑discharge(h) ≤ chargeMax · numCycles (6.12)
Battery degradation is unavoidable when operating a battery and even though the BESSmanufacturer or supplier might offer a time based guarantee it is desirable not to runa battery with too many charge cycles per day. Therefore 6.11 and 6.12 introducesconstraints that limits the total charged and discharged energy in one period i.e. oneday.
SOC(peak(1)−1) ≥∑
NordHavnLPV(peak) − GridCapacityLimit · length(peak) (6.13)
Equation 6.13 is the second part of the peak shaving application. Where eq: 6.7 isthe driver for the discharge during peak hours, eq: 6.13 is the constraint that ensuresthat the battery has enough stored energy before entering the first peak time-slot. Thealgorithm searches for the length of the peak, being continuous periods where the loadexceeds the grid capacity limit. When the peak period is determined the constraint isset so that the cumulated peak energy is smaller than or equal to the energy stored inthe battery prior one time-step before the peak period commences. The constraint fromeq: 6.13 dictates that the SOC p
discharge(h) ≥SOC(h)
length(peak)(6.14)
Equation 6.14 is a conditional constraint in the case of peak-shaving. It constraintsthe discharge power to equal to or greater than the delta from the grid capacity limit tothe load in the system.

6.3 Constraints 51
The algorithm also searches for the case where several peaks are to be shaved withinone period. This is an unlikely scenario, since the peak hours often come in continuousblocks. The case where the load oscillates around the grid capacity limit could createsuch a case. Regardless, this constraint adds robustness to the algorithm. Again aconditional constraint is added, which is dependent on the double peakFlag

52
CHAPTER 7Case Analysis
7.1 Distribution Grid Upgrade DeferralThe first case-study demonstrates the how optimal scheduling of the peak-shaving al-gorithm works in a 48 hour window, where a peak load is forecasted to occur. TheBESS, will based on the two day-ahead prices determines, when to charge the batteryso the DSO will minimise the cost of charging, prior when to the peak-shaving serviceis activated. The algorithm generates the operation schedules with 24 hourly intervals,this way the daily operation is simulated, even though the data inputs for the entireperiod is inserted initially.
For this case, the desired outcome is to see how the peak-shaving algorithm schedulesa day with a forecasted peak-load. In order to show the capabilities to the fullest a fewassumptions surrounding the market set up and the BESS’s behaviour are made. Asmentioned, the scope is to demonstrate how the BESS reacts to a forecasted peak in thegrid, the BESS must prepare for the upcoming peak and have the capacity charged tothe level required to resolve the peak. Commercial key aspects of the BESS operation isomitted, due to the nature of the Nordhavn project and the obligations a DSO obligationstowards security of supply.
7.1.1 MethodologyThe scheduling of the BESS is done based on the MILP optimisation process describedabove, the operating schedule, post optimisation will be analysed and the subsequentoperational results will give a clear indication of how the BESS’s overall availability isbeing utilised properly. Availability generally defines the ratio between actual operationtime and the theoretical maximum operational time.
A financial analysis and how the market mechanism influences the battery and itsoperational scheduling is of clear interest. However, from a project perspective thefinancials were omitted due to various uncertainties. The objective function definesa classic minimisation problem, where the services defined in the constraints of theproblem are to be upheld. Due to the lack of insight to the financial dimensions ofrunning and operating the BESS the final cost of running the services are of littleimportance, since decisive conclusions based on the problem statement simply givesand indication of a cost, which is under many and vast assumptions such as, CAPEX,
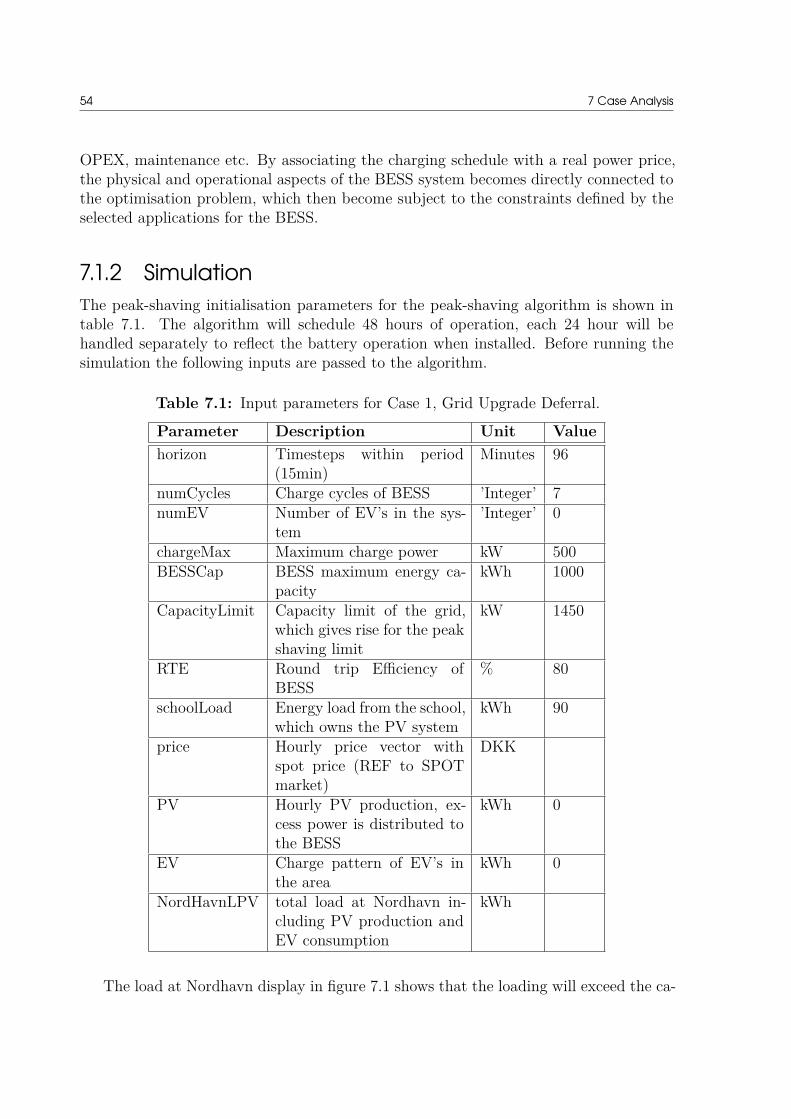
54 7 Case Analysis
OPEX, maintenance etc. By associating the charging schedule with a real power price,the physical and operational aspects of the BESS system becomes directly connected tothe optimisation problem, which then become subject to the constraints defined by theselected applications for the BESS.
7.1.2 SimulationThe peak-shaving initialisation parameters for the peak-shaving algorithm is shown intable 7.1. The algorithm will schedule 48 hours of operation, each 24 hour will behandled separately to reflect the battery operation when installed. Before running thesimulation the following inputs are passed to the algorithm.
Table 7.1: Input parameters for Case 1, Grid Upgrade Deferral.
Parameter Description Unit Valuehorizon Timesteps within period
(15min)Minutes 96
numCycles Charge cycles of BESS ’Integer’ 7numEV Number of EV’s in the sys-
tem’Integer’ 0
chargeMax Maximum charge power kW 500BESSCap BESS maximum energy ca-
pacitykWh 1000
CapacityLimit Capacity limit of the grid,which gives rise for the peakshaving limit
kW 1450
RTE Round trip Efficiency ofBESS
% 80
schoolLoad Energy load from the school,which owns the PV system
kWh 90
price Hourly price vector withspot price (REF to SPOTmarket)
DKK
PV Hourly PV production, ex-cess power is distributed tothe BESS
kWh 0
EV Charge pattern of EV’s inthe area
kWh 0
NordHavnLPV total load at Nordhavn in-cluding PV production andEV consumption
kWh
The load at Nordhavn display in figure 7.1 shows that the loading will exceed the ca-
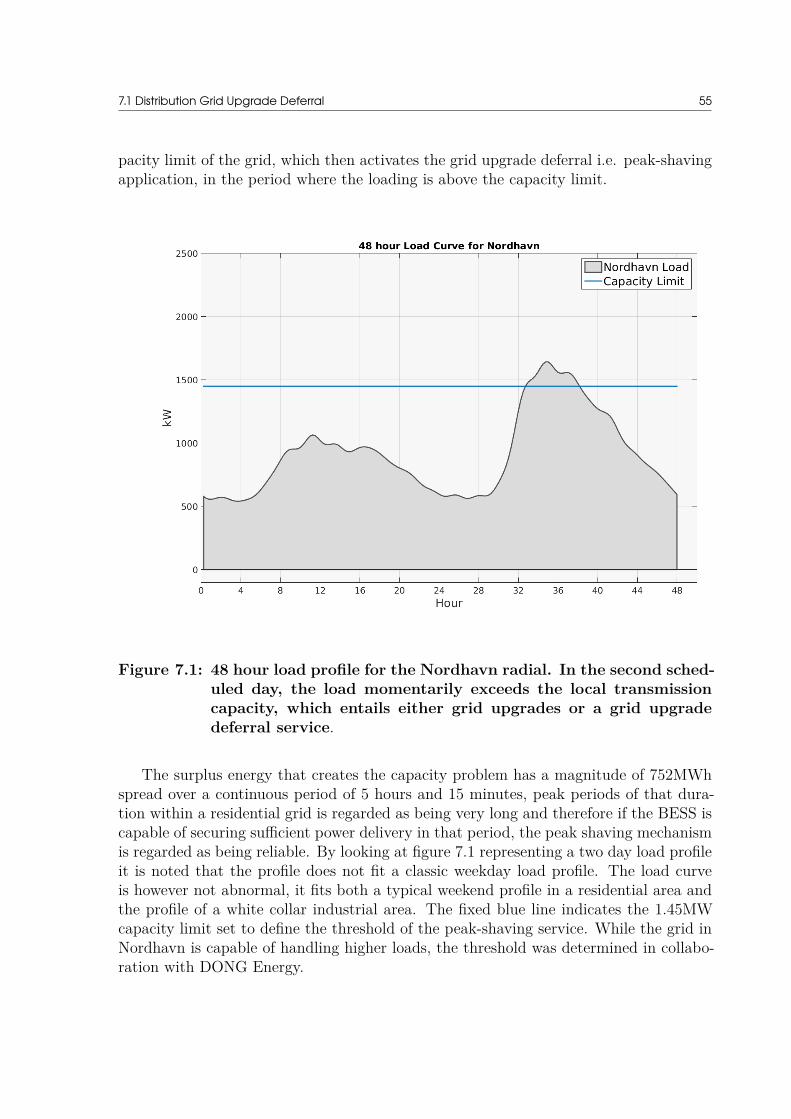
7.1 Distribution Grid Upgrade Deferral 55
pacity limit of the grid, which then activates the grid upgrade deferral i.e. peak-shavingapplication, in the period where the loading is above the capacity limit.
Figure 7.1: 48 hour load profile for the Nordhavn radial. In the second sched-uled day, the load momentarily exceeds the local transmissioncapacity, which entails either grid upgrades or a grid upgradedeferral service.
The surplus energy that creates the capacity problem has a magnitude of 752MWhspread over a continuous period of 5 hours and 15 minutes, peak periods of that dura-tion within a residential grid is regarded as being very long and therefore if the BESS iscapable of securing sufficient power delivery in that period, the peak shaving mechanismis regarded as being reliable. By looking at figure 7.1 representing a two day load profileit is noted that the profile does not fit a classic weekday load profile. The load curveis however not abnormal, it fits both a typical weekend profile in a residential area andthe profile of a white collar industrial area. The fixed blue line indicates the 1.45MWcapacity limit set to define the threshold of the peak-shaving service. While the grid inNordhavn is capable of handling higher loads, the threshold was determined in collabo-ration with DONG Energy.
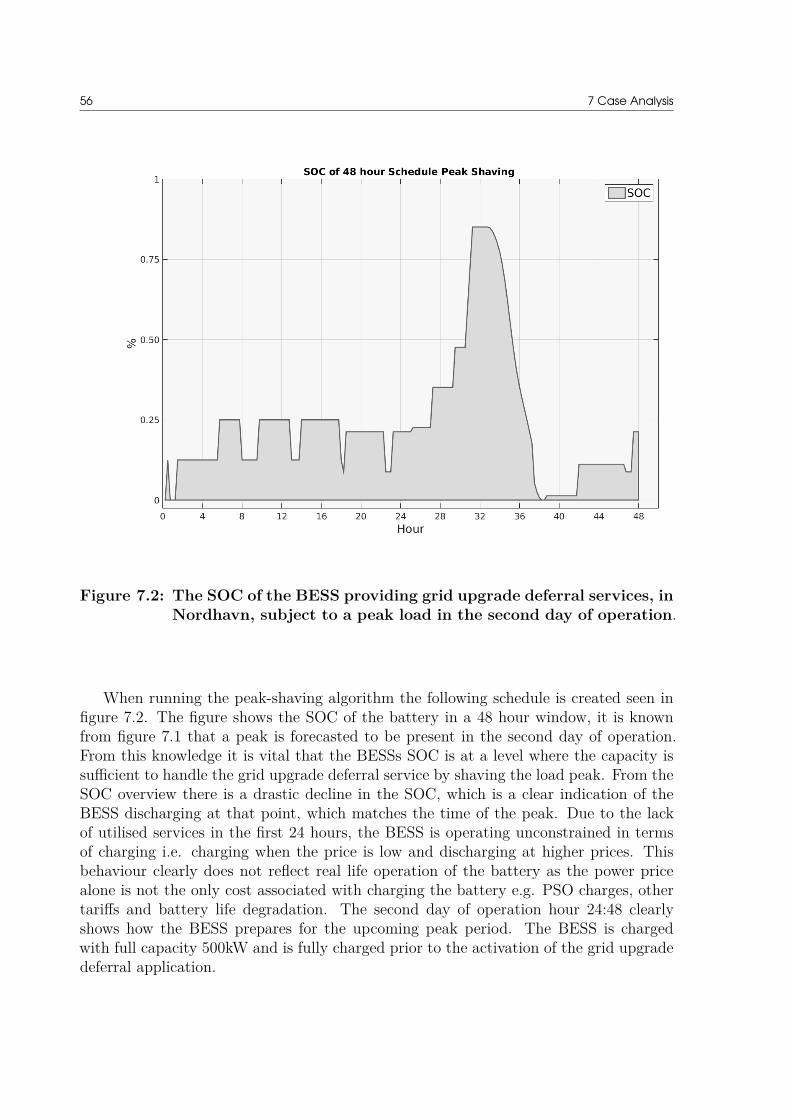
56 7 Case Analysis
Figure 7.2: The SOC of the BESS providing grid upgrade deferral services, inNordhavn, subject to a peak load in the second day of operation.
When running the peak-shaving algorithm the following schedule is created seen infigure 7.2. The figure shows the SOC of the battery in a 48 hour window, it is knownfrom figure 7.1 that a peak is forecasted to be present in the second day of operation.From this knowledge it is vital that the BESSs SOC is at a level where the capacity issufficient to handle the grid upgrade deferral service by shaving the load peak. From theSOC overview there is a drastic decline in the SOC, which is a clear indication of theBESS discharging at that point, which matches the time of the peak. Due to the lackof utilised services in the first 24 hours, the BESS is operating unconstrained in termsof charging i.e. charging when the price is low and discharging at higher prices. Thisbehaviour clearly does not reflect real life operation of the battery as the power pricealone is not the only cost associated with charging the battery e.g. PSO charges, othertariffs and battery life degradation. The second day of operation hour 24:48 clearlyshows how the BESS prepares for the upcoming peak period. The BESS is chargedwith full capacity 500kW and is fully charged prior to the activation of the grid upgradedeferral application.

7.1 Distribution Grid Upgrade Deferral 57
Figure 7.3: The forecasted load profile in Nordhavn (red) and the same theload profile subject to the grid deferral services provided by theBESS(grey).
Figure 7.3 provides an overview of the original load profile seen in figure 7.1 and thenew updated load profile subject to the peak-shaving mechanism provided by the BESSthat ultimately hindered a distribution upgrade requirement to that part of the grid.From the operational perspective the discharged power from the BESS is equal to theamount of surplus power causing the initial peak. This is due to a optimisation tech-nicality, in order to minimise the cost of running the BESS it implies that a minimumamount of power is used at times, with a high power price. However, the algorithmproves to be functional to its intend by providing the required discharge power. Froma real operations perspective, a certain degree of maneuverability would be required asany forecasted load always differs from the actual load in the system.
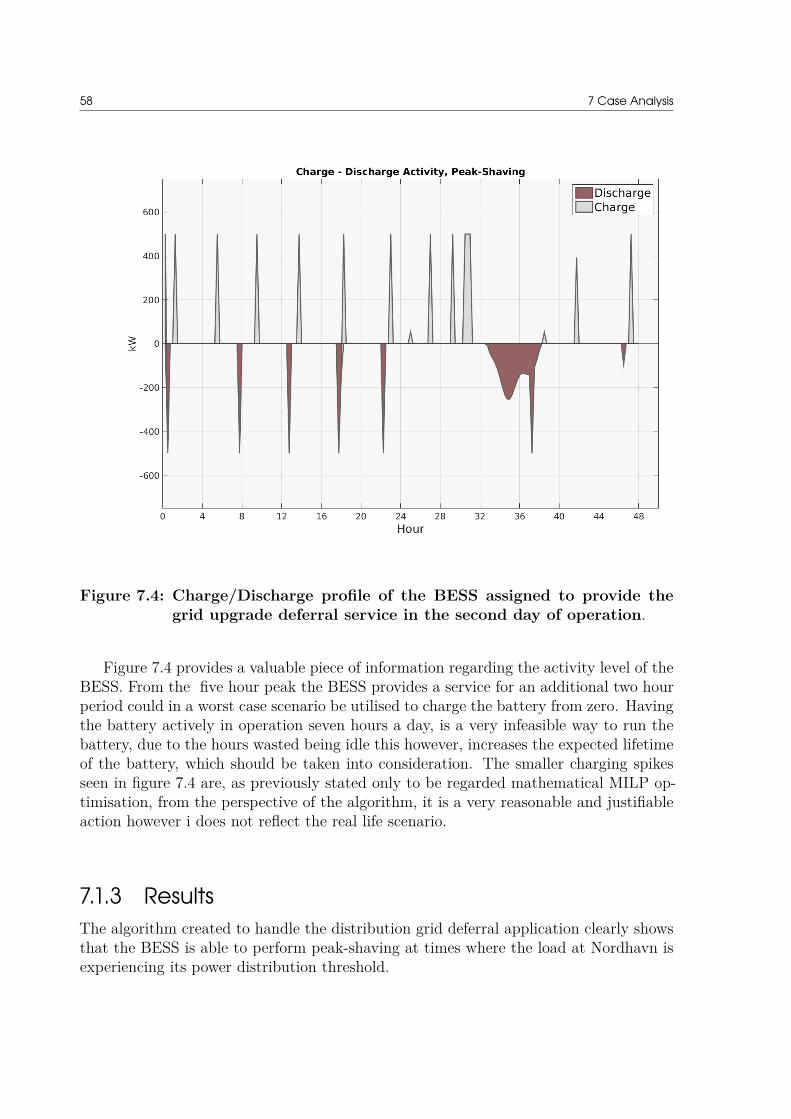
58 7 Case Analysis
Figure 7.4: Charge/Discharge profile of the BESS assigned to provide thegrid upgrade deferral service in the second day of operation.
Figure 7.4 provides a valuable piece of information regarding the activity level of theBESS. From the five hour peak the BESS provides a service for an additional two hourperiod could in a worst case scenario be utilised to charge the battery from zero. Havingthe battery actively in operation seven hours a day, is a very infeasible way to run thebattery, due to the hours wasted being idle this however, increases the expected lifetimeof the battery, which should be taken into consideration. The smaller charging spikesseen in figure 7.4 are, as previously stated only to be regarded mathematical MILP op-timisation, from the perspective of the algorithm, it is a very reasonable and justifiableaction however i does not reflect the real life scenario.
7.1.3 ResultsThe algorithm created to handle the distribution grid deferral application clearly showsthat the BESS is able to perform peak-shaving at times where the load at Nordhavn isexperiencing its power distribution threshold.

7.1 Distribution Grid Upgrade Deferral 59
However, with the grid upgrade deferral application being the prime motivation forinstalling the BESS at Nordhavn, there is obvious room for optimising the use of thebattery and its capabilities. Looking at the scheduled day of operation, containing re-quired peak-shaving, analysed in this section, the service it self only represent 30% ofthe hours available during the day of operation. Furthermore, by looking at the dailyload in Nordhavn on a yearly basis it further strengthens the point that grid upgradedeferral services are required to work in synergies with other services if a BESS is tohave a commercial future providing distribution grid services.
Figure 7.5: Annual load on the Nordhavn radial, the grid capacity is indicat-ing how many hours of peak-shaving the DSO requires.
7.1.4 SensitivityFrom figure 7.5 the hourly load during a full year at Nordhavn is shown. The grey lineindicates the capacity threshold, which schedules a peak shaving mechanism if the loadis above that threshold. From the figure is it seen that the hours requiring peak-shavingare 51 hours, or roughly 5% of the time during a full year. It must be noted that thepeaks often are in several consecutive hours, meaning that the days of grid upgrade
60 7 Case Analysis
deferral days are approximately 15-20 days per annum. Having a BESS installed tosolely provide grid upgrade deferral is never going to make a solid business case. How-ever the service remains the top priority simply due to the consequences of not beingable to defer grid upgrades. The consequences are cost of grid upgrades, reduced life-time the power equipment experiences being strained by the heavy loading of the gridand potential failures due to the overloading, which affects both DSO and end consumer.
To utilise the BESS potential the Operational Availability has to improve. Opera-tional Availability is in this context an indication of the ratio between the total time aBESS is providing services in relation to the total time available. As explained above,the annual operational availability is:
OpA = HoursScheduled
HoursAvailable= 50
8760= 0.0005 = 5 (7.1)
This is a clear indication that while prioritising grid upgrade deferral, the BESSshould be able to deliver additional services without compromising the requirements de-fined in the specifications of a Grid upgrade deferral agreement. The following sectionsprovide a different options for implementing several services at once.
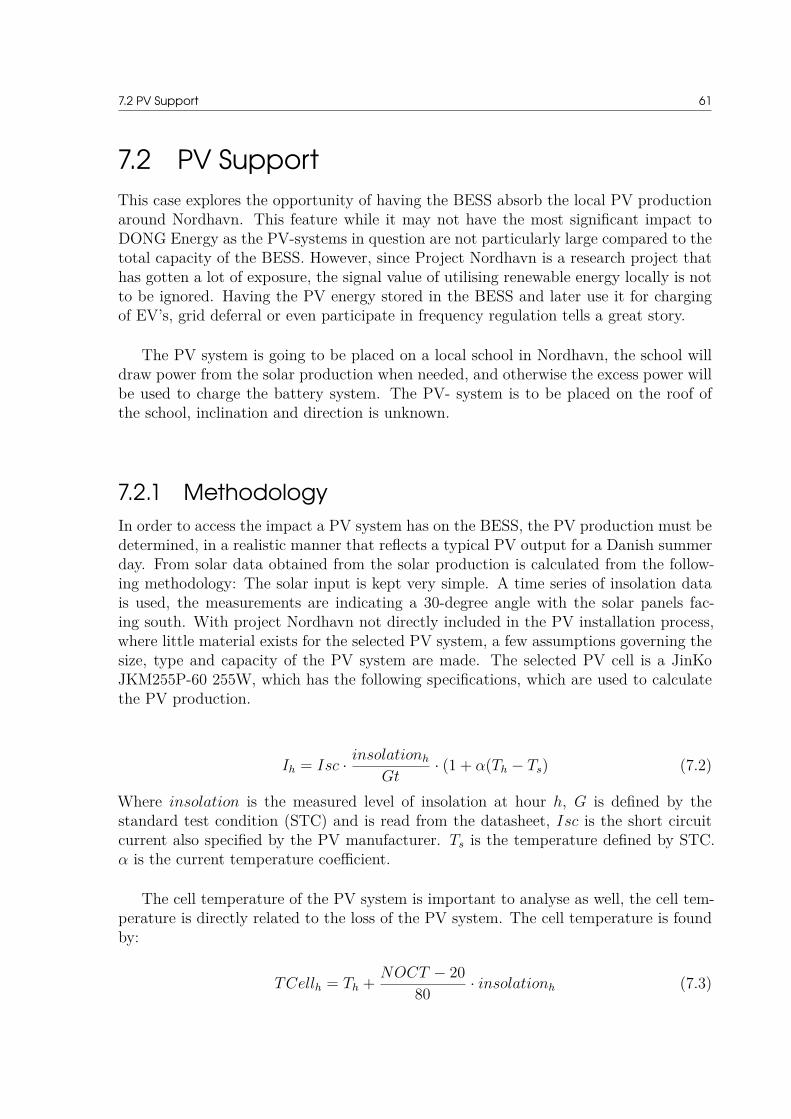
7.2 PV Support 61
7.2 PV SupportThis case explores the opportunity of having the BESS absorb the local PV productionaround Nordhavn. This feature while it may not have the most significant impact toDONG Energy as the PV-systems in question are not particularly large compared to thetotal capacity of the BESS. However, since Project Nordhavn is a research project thathas gotten a lot of exposure, the signal value of utilising renewable energy locally is notto be ignored. Having the PV energy stored in the BESS and later use it for chargingof EV’s, grid deferral or even participate in frequency regulation tells a great story.
The PV system is going to be placed on a local school in Nordhavn, the school willdraw power from the solar production when needed, and otherwise the excess power willbe used to charge the battery system. The PV- system is to be placed on the roof ofthe school, inclination and direction is unknown.
7.2.1 MethodologyIn order to access the impact a PV system has on the BESS, the PV production must bedetermined, in a realistic manner that reflects a typical PV output for a Danish summerday. From solar data obtained from the solar production is calculated from the follow-ing methodology: The solar input is kept very simple. A time series of insolation datais used, the measurements are indicating a 30-degree angle with the solar panels fac-ing south. With project Nordhavn not directly included in the PV installation process,where little material exists for the selected PV system, a few assumptions governing thesize, type and capacity of the PV system are made. The selected PV cell is a JinKoJKM255P-60 255W, which has the following specifications, which are used to calculatethe PV production.
Ih = Isc · insolationh
Gt· (1 + α(Th − Ts) (7.2)
Where insolation is the measured level of insolation at hour h, G is defined by thestandard test condition (STC) and is read from the datasheet, Isc is the short circuitcurrent also specified by the PV manufacturer. Ts is the temperature defined by STC.α is the current temperature coefficient.
The cell temperature of the PV system is important to analyse as well, the cell tem-perature is directly related to the loss of the PV system. The cell temperature is foundby:
TCellh = Th + NOCT − 2080
· insolationh (7.3)

62 7 Case Analysis
Where th is the measured ambient temperature, NOCT is the Nominal OperatingCell Temperature, found in the datasheet for the PV cell.
The voltage of the PV system can now be calculated based on the cell temperaturecalculated in equation 7.3.
Vh = V oc · (1 + β · (TCellhTs)) (7.4)
Where β is the Voltage temperature coefficient and V oc is the open circuit voltage spec-ified by the manufacturer.
The fill factor (FF ) is a parameter which is widely used in PV characteristics. FFis defined as the ratio of the actual maximum obtainable power to the product of theopen circuit voltage times the short circuit current.
FF = V mp · Imp
V oc · Isc= 29.3 · 8.71
36.5 · 9.32= 0.752 (7.5)
where V mp is the voltage at maximum power, Imp is the current under maximum power,Isc is the short circuit current of the PV panel and V oc is the open circuit voltage ofthe panel.
Finally, Ph the maximum power output per solar cell is calculated.
Ph = Vh · Ih · FF (7.6)
The school load is a fixed load of 90 kW between 08:00 to 16:00, otherwise the loadingat the school is zero. Generally, the power production from the PV system is expected tobe highest during the period where the school is ‘active’. The calculated PV productionfor 48 hours is shown in figure 7.6
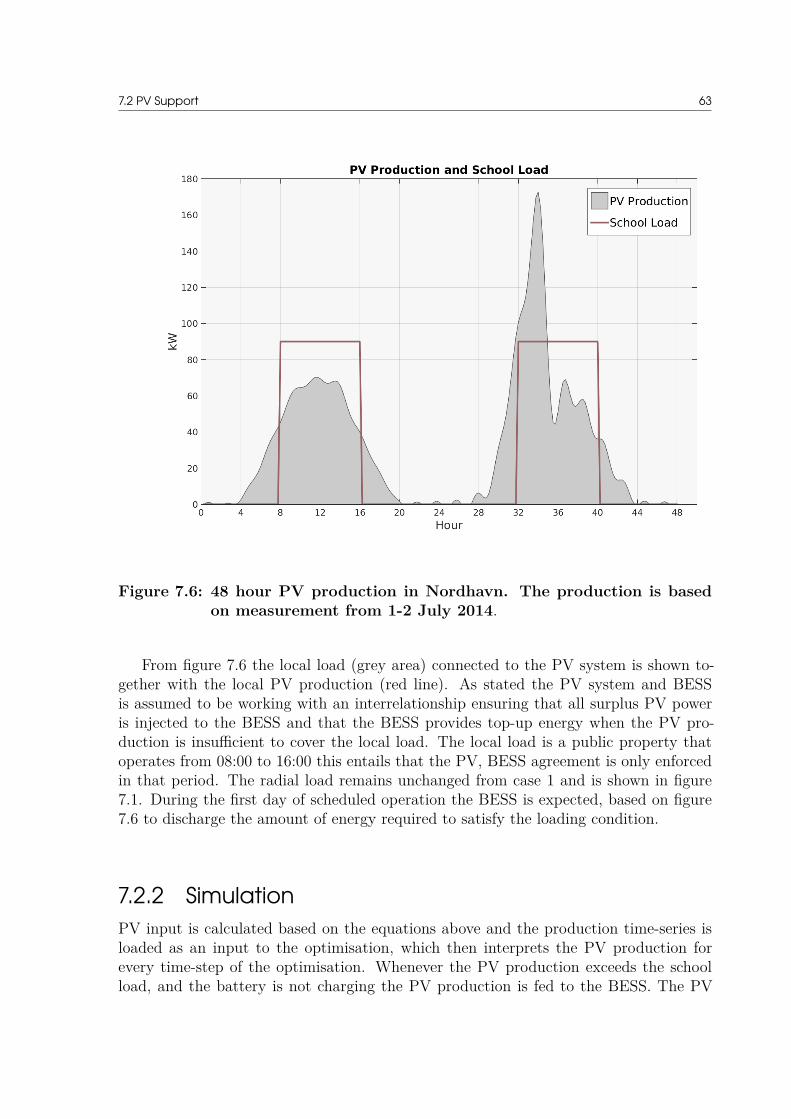
7.2 PV Support 63
Figure 7.6: 48 hour PV production in Nordhavn. The production is basedon measurement from 1-2 July 2014.
From figure 7.6 the local load (grey area) connected to the PV system is shown to-gether with the local PV production (red line). As stated the PV system and BESSis assumed to be working with an interrelationship ensuring that all surplus PV poweris injected to the BESS and that the BESS provides top-up energy when the PV pro-duction is insufficient to cover the local load. The local load is a public property thatoperates from 08:00 to 16:00 this entails that the PV, BESS agreement is only enforcedin that period. The radial load remains unchanged from case 1 and is shown in figure7.1. During the first day of scheduled operation the BESS is expected, based on figure7.6 to discharge the amount of energy required to satisfy the loading condition.
7.2.2 SimulationPV input is calculated based on the equations above and the production time-series isloaded as an input to the optimisation, which then interprets the PV production forevery time-step of the optimisation. Whenever the PV production exceeds the schoolload, and the battery is not charging the PV production is fed to the BESS. The PV
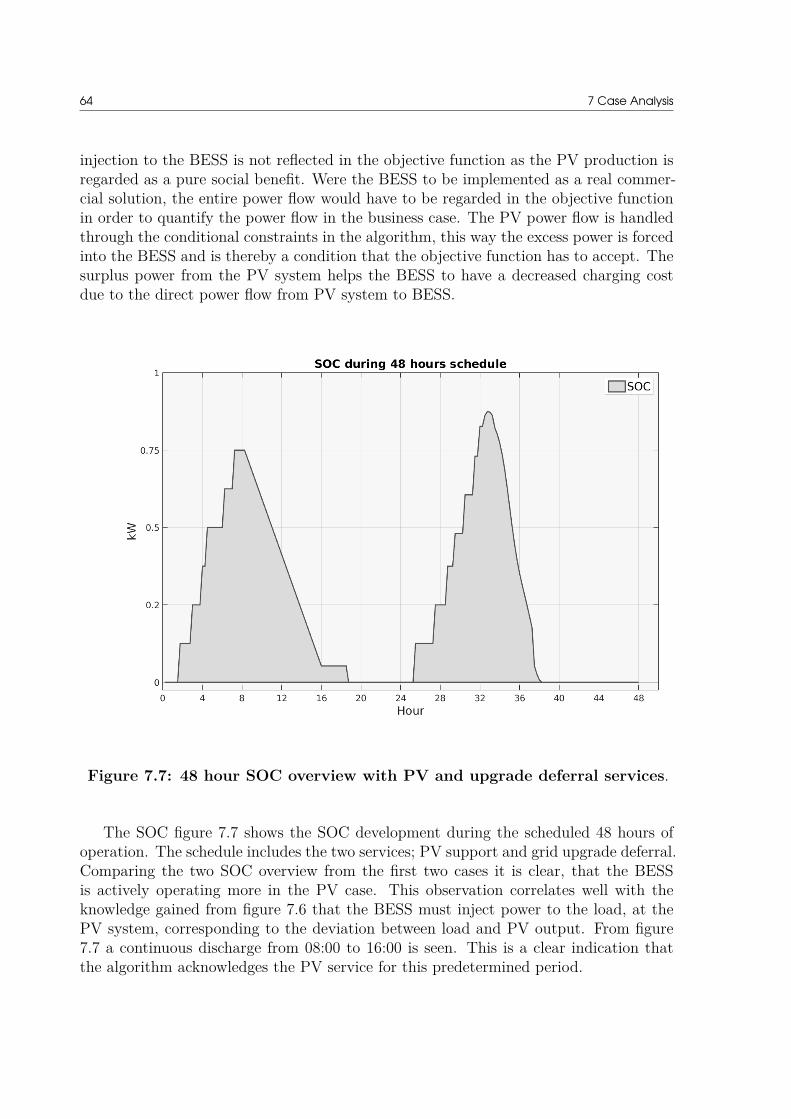
64 7 Case Analysis
injection to the BESS is not reflected in the objective function as the PV production isregarded as a pure social benefit. Were the BESS to be implemented as a real commer-cial solution, the entire power flow would have to be regarded in the objective functionin order to quantify the power flow in the business case. The PV power flow is handledthrough the conditional constraints in the algorithm, this way the excess power is forcedinto the BESS and is thereby a condition that the objective function has to accept. Thesurplus power from the PV system helps the BESS to have a decreased charging costdue to the direct power flow from PV system to BESS.
Figure 7.7: 48 hour SOC overview with PV and upgrade deferral services.
The SOC figure 7.7 shows the SOC development during the scheduled 48 hours ofoperation. The schedule includes the two services; PV support and grid upgrade deferral.Comparing the two SOC overview from the first two cases it is clear, that the BESSis actively operating more in the PV case. This observation correlates well with theknowledge gained from figure 7.6 that the BESS must inject power to the load, at thePV system, corresponding to the deviation between load and PV output. From figure7.7 a continuous discharge from 08:00 to 16:00 is seen. This is a clear indication thatthe algorithm acknowledges the PV service for this predetermined period.

7.2 PV Support 65
Figure 7.8: The local load at Nordhavn with PV support and upgrade defer-ral services. The red area is the initial load, and the grey areareflect the load after BESS services.
The load in the area is shown in figure 7.8, the main point of interest is how the loadlooks while the BESS is providing top-up power to the PV-load. When comparing figure7.3 from case 7.1 the period where this is most apparent is during the first 24 hours ofoperation. Here the radial load – subject to BESS services (grey area) is showing a loaddecrease between 08:00 and 16:00, which again correlates excellently with the figuresabove and the overarching expectations of how the PV service affects the system as awhole.

66 7 Case Analysis
Figure 7.9: Charge/Discharge activity of BESS during 48 hours offering PVand grid upgrade deferral services.
The final figure in this case analysis shows the charge and discharge activity of BESSduring the scheduled 48 hours. The peak-shaving mechanism activated by the gridupgrade deferral service is working simultaneously with the PV top-up, as the servicerequires. Despite the peak loading, the BESS still manages to handle both services andkeeps a reasonable distance form operating close to the limits of its capacity. Whichmakes a strong indication for the BESS being able to operate both services at once withthe risk of the BESS being insufficient in providing the services, being very unlikely.
7.2.3 ResultsThis case demonstrates that it is possible to have the BESS operate with two servicessimultaneously, which is regarded as a requirement if a BESS is to be deemed commer-cially feasible, seen from a DSO’s perspective. By having two active services operating,the yearly Operational Availability is:
OpA = 50 + (8 · 220)8760
= 0.206 ∼ 21% (7.7)

7.2 PV Support 67
Which is a significant increase compared to the stand-alone grid upgrade deferral service.Furthermore, when looking at the utilised power relative to the technical limits of theBESS, the robustness of the hybrid service becomes more apparent:
The potential energy injection over the period is clearly 1MWh, with a maximumdischarge of 500kW. From the simulation of the control the energy required throughoutthe peak period is 875kW, leaving sufficient capcity to provide the PV service.
However, returning to an intuitional perspective of this hybrid solution it is likely toprove to be an infeasible solution if the installation of the BESS is to be justified, seenfrom an economical perspective. This view is rooted in the reoccurring issue of who isthe rightful owner of the BESS and more importantly who is the ruling authority whendetermining the order of priority.

68 7 Case Analysis
7.3 EV Charging
The EV operator CleanCharge will install fast-chargers in Nordhavn for the locals touse. The idea behind CleanCharge is to have DC fast-chargers working as ’gas stations’for the EV fleet. This enables a 50kWh charging for the connected EV. The challenge inhaving CleanCharge present on the Nordhavn radial is that currently the fast chargersare charging ’unintelligently’ seen from an environmental perspective. Therefore thisthesis implements the EV charging as a non-intelligent charger that basically chargesthe EV without regard for grid-loading, price or amount of renewable production in thegrid. This approach gives the opportunity to test the BESS capabilities under a worstcase scenario due to the charging be handled without regard for any strategy at hours,were the grid is under the biggest pressure. Again, the case explores the maximum ca-pabilities of a BESS and how it handles multiple services at once.
7.3.1 Methodology
The EVs in the vicinity of the BESS in Nordhavn are assumed as consumer cars, whichare used for the daily commute between Nordhavn and the users respective workplace.This means that when determining the charging patterns of the EV follows a regularloading profile of a residential area. To simulate the quick charge 50kW charging capa-bilities in Nordhavn the hourly dataseries are interpolated to 15 min time steps to catchthe 15min charging spikes occurring in the grid. The interpolation of the spot price isjust increased in resolution and not directly interpolated, as the spot price is fixed forall quarters of a certain hour, whereas i.e. a load is interpolated meaning the load willvary slightly from quarter to quarter within the same hour. 30 EVs are assumed to beactive in Nordhavn and they each carry a 22kWh battery.To emulate the cars charging patterns, which are assumed to follow a regular load pat-tern in a residential area. To implement the EV charging pattern a function is writtenthat based on a regular random number generator, inserts the specified number of EV’sbetween 17:00 and 20:00, which is the timeframe where most people return from workand therefore recharges their EVs. The lack of intelligent charging causes the EVs tobegin instant charging when connected. From a 48 hour period the charging pattern isdisplayed in figure 7.10.
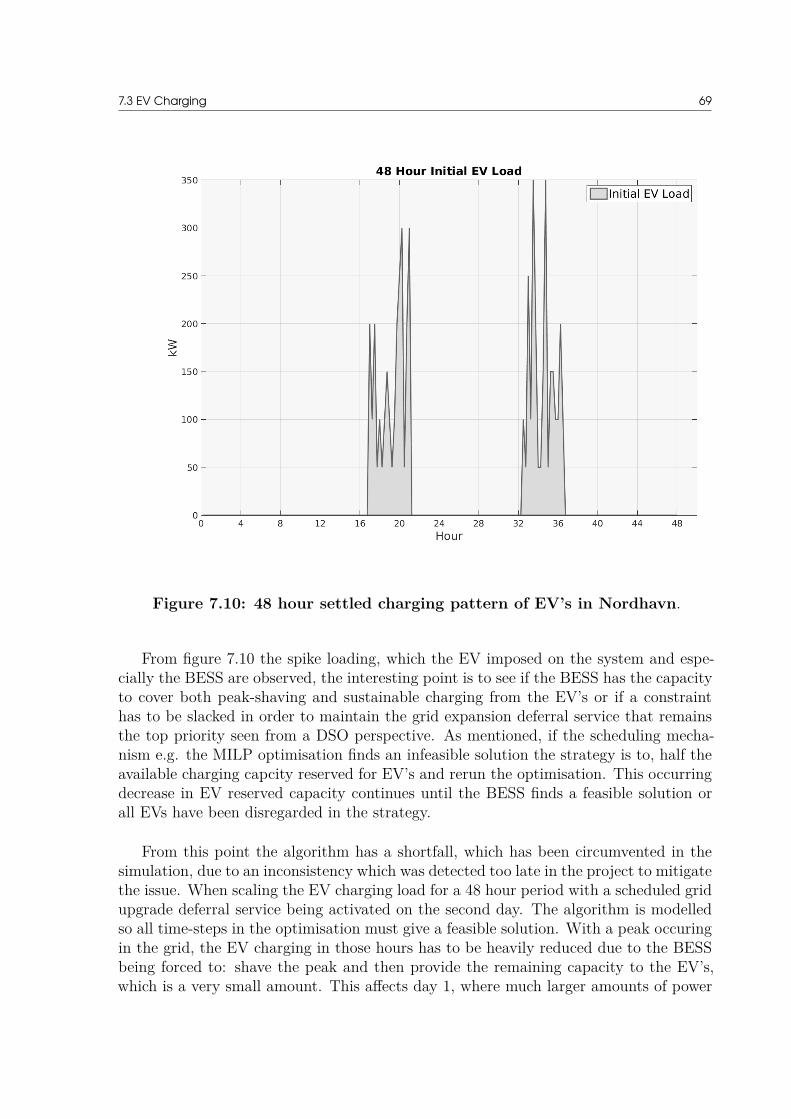
7.3 EV Charging 69
Figure 7.10: 48 hour settled charging pattern of EV’s in Nordhavn.
From figure 7.10 the spike loading, which the EV imposed on the system and espe-cially the BESS are observed, the interesting point is to see if the BESS has the capacityto cover both peak-shaving and sustainable charging from the EV’s or if a constrainthas to be slacked in order to maintain the grid expansion deferral service that remainsthe top priority seen from a DSO perspective. As mentioned, if the scheduling mecha-nism e.g. the MILP optimisation finds an infeasible solution the strategy is to, half theavailable charging capcity reserved for EV’s and rerun the optimisation. This occurringdecrease in EV reserved capacity continues until the BESS finds a feasible solution orall EVs have been disregarded in the strategy.
From this point the algorithm has a shortfall, which has been circumvented in thesimulation, due to an inconsistency which was detected too late in the project to mitigatethe issue. When scaling the EV charging load for a 48 hour period with a scheduled gridupgrade deferral service being activated on the second day. The algorithm is modelledso all time-steps in the optimisation must give a feasible solution. With a peak occuringin the grid, the EV charging in those hours has to be heavily reduced due to the BESSbeing forced to: shave the peak and then provide the remaining capacity to the EV’s,which is a very small amount. This affects day 1, where much larger amounts of power
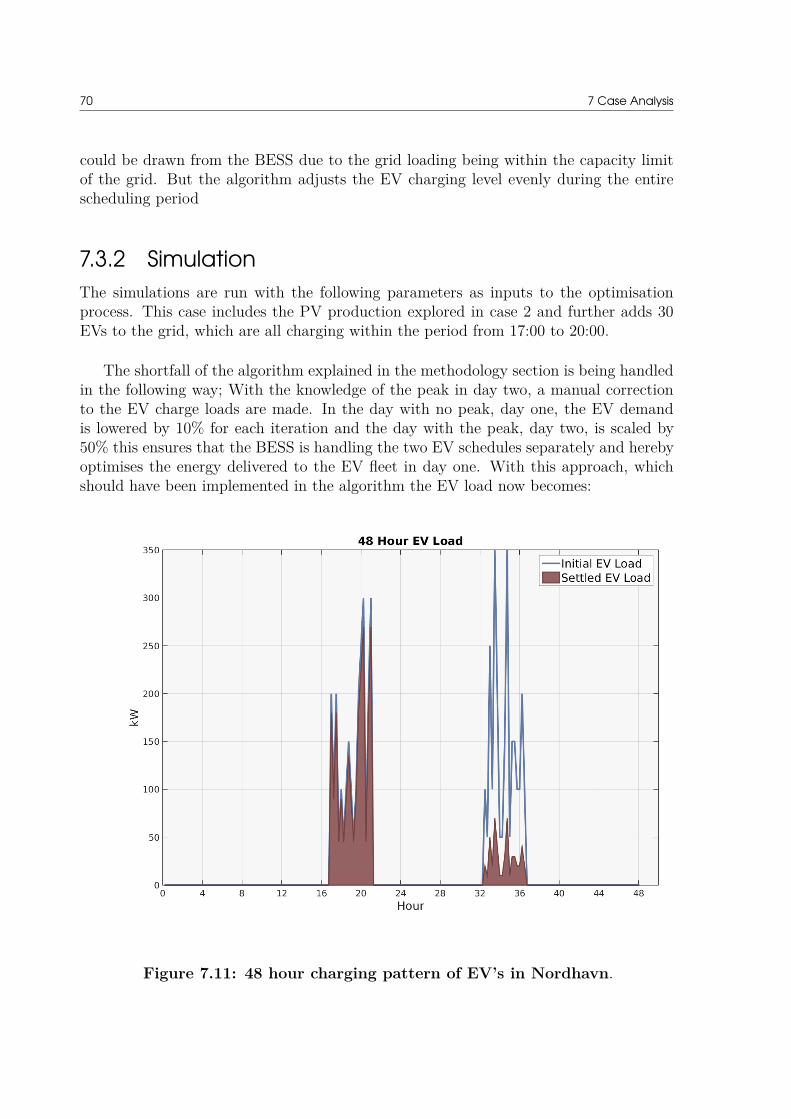
70 7 Case Analysis
could be drawn from the BESS due to the grid loading being within the capacity limitof the grid. But the algorithm adjusts the EV charging level evenly during the entirescheduling period
7.3.2 SimulationThe simulations are run with the following parameters as inputs to the optimisationprocess. This case includes the PV production explored in case 2 and further adds 30EVs to the grid, which are all charging within the period from 17:00 to 20:00.
The shortfall of the algorithm explained in the methodology section is being handledin the following way; With the knowledge of the peak in day two, a manual correctionto the EV charge loads are made. In the day with no peak, day one, the EV demandis lowered by 10% for each iteration and the day with the peak, day two, is scaled by50% this ensures that the BESS is handling the two EV schedules separately and herebyoptimises the energy delivered to the EV fleet in day one. With this approach, whichshould have been implemented in the algorithm the EV load now becomes:
Figure 7.11: 48 hour charging pattern of EV’s in Nordhavn.

7.3 EV Charging 71
Where the filled area is the energy made available for the EV’s to charge during thetwo days. When comparing figure 7.10 with figure 7.11 it is clear that the first scheduledday would have become scaled far beyond what is required for the load to be within thefeasible range of the BESS. It took 3 iterations to find a charging level, which satisfiedthe conditions set through the BESS. One clear conflict with the BESS’ capabilities isthat the maximum discharge level for the BESS is 500kW which is clearly violated withthe initial EV demand peaking at 150kW.
Figure 7.12: SOC during 48 hours of EV charging and peak-shaving.
The SOC overview for the 48 scheduled hours is seen in figure 7.12 above. From theknowledge of the settled EV load during day one in the period 17:00 to 21:00 it is clearlyseen from the SOC that the BESS implements the algorithm as intended, which is bythe rapid decrease in SOC in that period. The BESS recharges during night due to thecheap price of electricity and is ready to handle the grid upgrade deferral service in daytwo as well as the minor EV charging service.
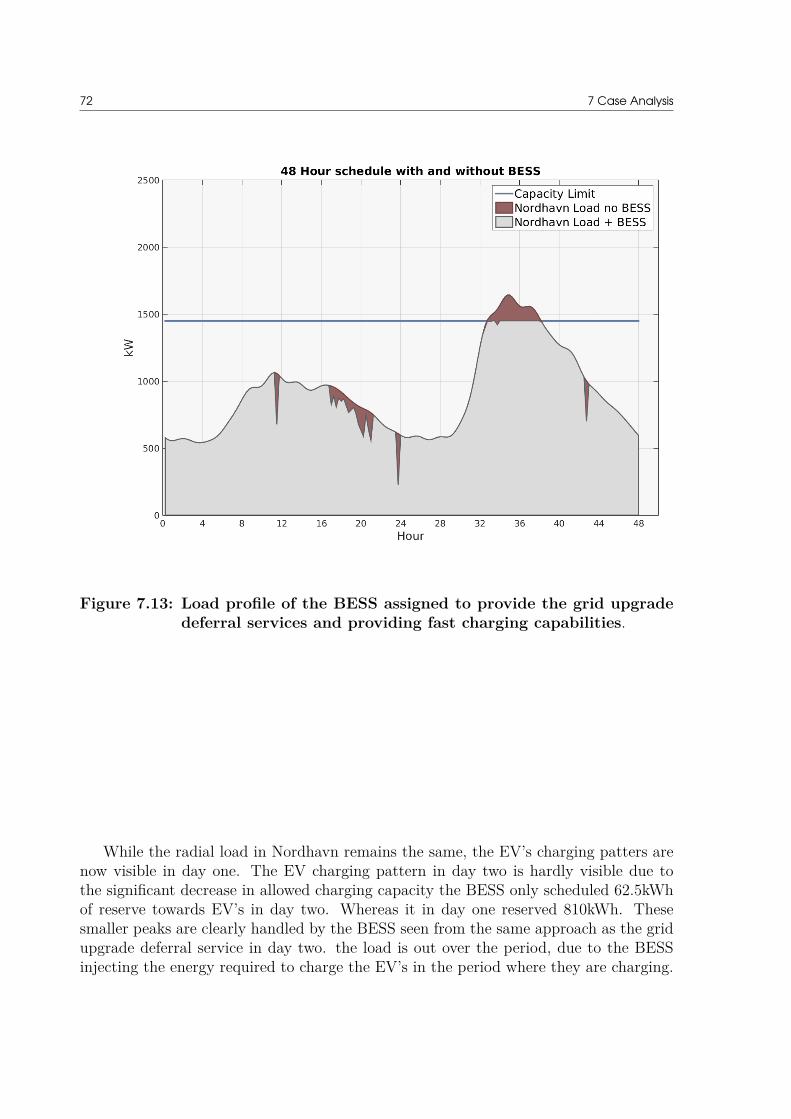
72 7 Case Analysis
Figure 7.13: Load profile of the BESS assigned to provide the grid upgradedeferral services and providing fast charging capabilities.
While the radial load in Nordhavn remains the same, the EV’s charging patters arenow visible in day one. The EV charging pattern in day two is hardly visible due tothe significant decrease in allowed charging capacity the BESS only scheduled 62.5kWhof reserve towards EV’s in day two. Whereas it in day one reserved 810kWh. Thesesmaller peaks are clearly handled by the BESS seen from the same approach as the gridupgrade deferral service in day two. the load is out over the period, due to the BESSinjecting the energy required to charge the EV’s in the period where they are charging.
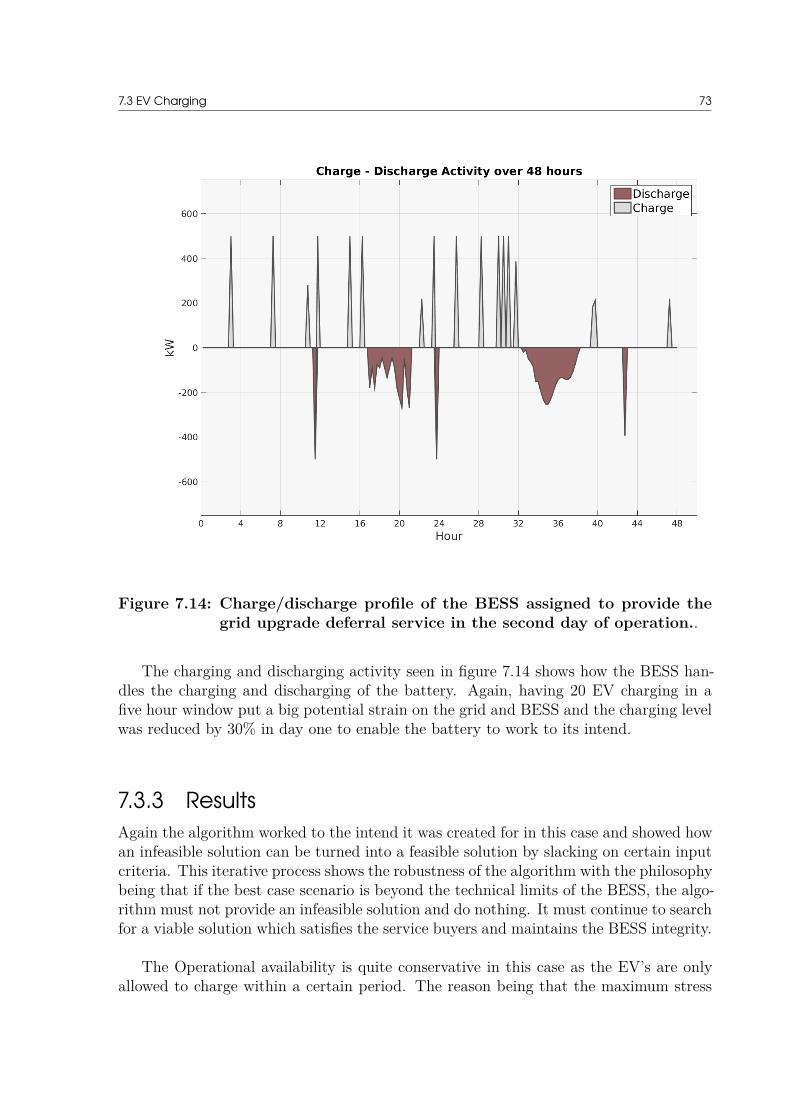
7.3 EV Charging 73
Figure 7.14: Charge/discharge profile of the BESS assigned to provide thegrid upgrade deferral service in the second day of operation..
The charging and discharging activity seen in figure 7.14 shows how the BESS han-dles the charging and discharging of the battery. Again, having 20 EV charging in afive hour window put a big potential strain on the grid and BESS and the charging levelwas reduced by 30% in day one to enable the battery to work to its intend.
7.3.3 ResultsAgain the algorithm worked to the intend it was created for in this case and showed howan infeasible solution can be turned into a feasible solution by slacking on certain inputcriteria. This iterative process shows the robustness of the algorithm with the philosophybeing that if the best case scenario is beyond the technical limits of the BESS, the algo-rithm must not provide an infeasible solution and do nothing. It must continue to searchfor a viable solution which satisfies the service buyers and maintains the BESS integrity.
The Operational availability is quite conservative in this case as the EV’s are onlyallowed to charge within a certain period. The reason being that the maximum stress

74 7 Case Analysis
is asserted to the BESS, by having additional peaks appear in the grid. A more evenlydistributed charging pattern would have an effect on the Operational Availability, how-everm in this case it is found to be:
OpA = 50 + (10 ∗ 220)8760
= 0.256 =∼ 26% (7.8)
The number one priority between the two services remains the grid upgrade deferralservice, which in some cases forces the operator of the EV charging spot to experiencelimitation to the power that the chargers are able to provide. This adds risk to theoperator as a key consumer concern about EV’s limitation to the degree of freedom anEV offers compared to a conventional car. The right to prioritise remains the right ofthe DSO in this case.
7.4 FDR - Frequency Disturbance ReserveWithin the last month of this project frequency data in a second resolution were provided,which gave the opportunity to create an assessment of the impact on the services if aBESS were to provide frequency response to the grid. As explained in the previous sec-tion the chosen reserve was the Frequency Controled Reserve, FDR - ’FrekvensstyretDriftforstyrrelsesreserve’ which is activated whenever the grid frequency falls below49.9HZ. A key aspect in FDR is that the amount of reserve capacity bid into the mar-ket is asymmetrical, which means that the FDR is only providing up-regulation. Theamount of energy that is being activated as FDR is very low, which could open up forthe opportunity to have several services running at once, or at least minimise the timea BESS has to recharge in order to cope with an up-comming grid upgrade deferralscenario.
Due to the short time-line of implementing this service into the algorithm, the anal-ysis is done by circumventing the algorithm and only check how the service would affectthe SOC, during the 48 hours of operation. The algorithm was adapted to handle theservice, however the computational time of running a 48 hour simulation in a secondresolution implying that 172.800 individual time-steps all including 951.367 constraintssimply resulted in an in-depth integration of the service being impossible.
Instead the SOC analysis were conducted based on the rules and regulations gov-erning FDR in DK2. The reserve delivered is inversely proportional to the frequencyfrequency deviation within the range 49.9Hz - 49.5 Hz. 50% of the initial response mustbe delivered within 5 seconds and the remaining capacity within 25 seconds. The 48hours impact on the SOC, when providing FDR is seen in figure 7.15

7.4 FDR - Frequency Disturbance Reserve 75
Figure 7.15: SOC of the BESS during 48 hours of providing FDR service..
Figure 7.15 given an indication of how the SOC of the BESS is developing after 48hours of continuously providing FDR. The SOC shows that the service is having a verylight effect on the battery. After 48 hours the SOC of the BESS is still above 90%, whichis adds to the potential of having a hybrid of FDR and grid upgrade deferral workingtogether. The low discharge level and the long periods of inactivity gives the BESSplenty of room to recharge to unity SOC thus enabling it to quickly respond to a gridupgrade deferral service. Thus extending the time available for providing FDR. It isnoted that a 48 hour period does not provide a sufficient foundation for a business case,however it gives a good indication of how the BESS is effected when providing FDR.Ownership and prioritisation issues are not as dominant as in case two and three dueto the battery owner only responding to system operators and not commercial entities,which is also a positive with the current regulatory landscape.

76
CHAPTER 8Discussion
The introduction of BESSs into the electrical infrastructure brings a new type of actorto the market, which raised a number of important questions that have to be answeredif electrical energy storage is to be successful in the future. Electrical energy storagecould be regarded as one of the biggest must-wins if the existing global climate goals areto be met. Adding renewable generation and interconnections are a big step of the way,however, with transmission congestion and ever increasing fluctuations in production,there is an additional incentive to search for local distribution solutions. In this place inthe electricity system, storage could play a vital role. A fundamental question regardingbattery energy storage today is whether a battery should be regarded as a Generator,Load or a third entity. Due to the characteristics of a BESS that enables it to switchfrom charge to discharge i.e. load to generation, Bess has unique opportunities for var-ious applications. However, the fact that one of the most fundamental categorisationsregarding electrical grid components that in addition are mutually exclusive, cannot beassigned to a BESS, indicates that the existing regulatory setup needs to be revised toencompass and optimise the use of electrical storage in the grid.
The test cases done in this project have been selected based on their technical poten-tial in relation to a DSO owned BESS. The potential defines the use and value addedby having a certain, or several, services operate that are controlled by the BESS’s con-trol mechanism. A secondary goal to the operational potential was to identify areas ofconcern in how these services would influence their surroundings under various real lifescenarios. These areas feed into the discussion of the fundamental view on BESSs andthe current lack of governance in the field.
The first case demonstrated the main component of the control algorithm, Distri-bution Grid Upgrade Deferral. As mentioned, the main application of the BESS is todefer grid upgrades in Nordhavn, and to demonstrate how it would work in weaker grids.The case proved that the BESS is, based on the relevant inputs which are reasonablyavailable to a DSO, able to create a proper grid upgrade deferral schedule, and the simu-lations shows that the BESS would execute the service. The BESS discharged the exactamount of power corresponding to the instantaneous surplus load required to shave thepeak. This perfect balance would in practise be impossible to obtain and one couldargue that the BESS should work within a band of uncertainty to accommodate for fore-casting errors etc. However, an interesting aspect is that BESS should in theory not berestraining its capacity unnecessarily, disregarding life-time aspects. This is though onlyrelevant when providing a hybrid of services where grid upgrade deferral is provided with
78 8 Discussion
a range of other services. The argument being that the BESS in practically indemnifyingthe grid for peak periods due to the grid having a fictional capacity limit determined,if the BESS is then imposed with a fictional limit it might too need an indemnifyingentity handling the excess energy that the BESS is unable to cover. Hence, the band isomitted in this analysis.
The second case involved a local PV-system working in synergy with the BESS. ThePV system would draw energy from the BESS at times when production was unable tomeet demand and inject surplus energy to the BESS when available. The goal in thiscase was to demonstrate how two services deeply rooted in the Nordhavn project couldwork together. The BESS would be limited and forced to discharge in longer periodswith no PV. The BESS was to provide the load with energy in the period 08:00 to 16:00.This could potentially cause trouble when the BESS is providing grid deferral servicesafter or during the PV services are complete. Non-technical yet highly relevant questionarose from this case. How is the ownership determined between a DSO and a local loadand who defines the order of priority? Since DONG Energy is the official owner of theBESS, they are to have the last say. However conflicts of interest are bound to happendue to the local loads being dependent on the BESS at certain times. And the BESSowner could be a commercial player selling grid deferral services and PV-synergies atonce. With the long frequency of peak-shaving being an active service the question maynot have a big impact for the consumer. But the connection agreements between loadand BESS or DSO are highly interesting. Which further the case of prioritised controlbeing a key component in the control strategies going forward.
Case three, similarly to case two, tries to disturb the grid-deferral mechanism andfurther to demonstrate how the BESS is able to limit certain services rather than dis-carding them completely, thereby optimising the use and value. The same issue ariseswhen reflecting on the analysis of the two services. The EV charging operator, Clean-Charge, is assumed to have the fast charging capabilities as a prime value, which theyhope would convince many consumers to buy an EV. But, if the EV consumers wantto charge 50kW DC simultaneously to a peak period, which is this case lasts for 5.5hours the selling point quickly diminishes. Through discussion with DONG a solutionwas identified that the operator could get his own grid connection, however this scenarioseverely diminishes the facilitation of renewables and the potential synergies betweenstorage, production and generation.
Despite the final case not being completely integrated in the algorithm, the upsidesto an FDR and grid deferral hybrid are quite distinctive. Seen from a DSO perspectivethere is no conflict of interest as they are utilising the BESS for services concerningsecurity of supply only. However, It remains undetermined whether a DSO is allowedto partiticate in the market for ancillary services. In this thesis it is assumed that theDSO is allowed to be active within the market. With the research project ongoing atNordhavn, it seems reasonable that the BESS could have some regulatory carve-outs inthe connection agreement in order to investigate the full potential of the BESS.
8 Discussion 79
When scheduled for FDR one gets an availability payment regardless of any reservebeing called upon. Together with the calculated low discharge energy from case fourit is seen as a very interesting hybrid. The fact that FDR is only up-regulating re-serve makes the schedule easier to make and mush more risk friendly, than if one wereto give a symmetrical bid. Furthermore, in the scenario where FDR is required andthe battery is charging could prove to be a very beneficial service for the provider andbuyer of the reserve. The provider could inject ’double’ the capacity. This is doneby stopping the charge and in addition discharging to the grid, which also provides avery effective reserve for the buyer. From a socio-environmental perspective the down-side is that the synergies are passed upon and the goal of supporting the facilitation ofrenewables also diminishes. From the EnergyLab Nordhavn perspective the case seeslike the most feasible option, despite the EV operators likelihood to argument otherwise.
The apparent lack of economical and NPV estimations are thought to have an impacton conclusions made based on the cases presented combined with the scope of this project.However, some of the services described above are in hindsight regarded as infeasibleto run commercially. There are currently many ongoing debates and issues regardingbattery storage, which blur the picture when it comes to determining how a BESS shouldbe regarded. should a BESS pay consumer tariffs when charging outside of services thatrequire it to charge? How would pricing of various for services be determined and howdoes the prioritisation reflect these prices and finally what are the consequences in thescenario where the BESS owner is unable to provide a certain service.

80
CHAPTER 9Conclusion
This thesis investigated the operational potential of having a grid connected BESS,owned by a DSO, running with different power grid related services. The main focusremained on identifying the operational potential in the context of having the BESSoperating in the Nordhavn area of Copenhagen.
The inputs used for initiating the algorithm are thought to emulate real forecasts,which are available on a daily basis. Despite the lack of a band of uncertainty the theinputs proves how the BESS is able to operate and handle, prioritise and execute severalservices at once. Depending on the service a BESS operator aims to deliver, other inputsare worth exploring such as: consumer inputs on expected periods of loading. This isrelevant for EV owners and their operators, if a BESS operator is able to approximateor obtain the driving and charging pattern of an EV, the charging could be completedwith a higher amount of renewables since the BESS would have time to adjust its SOCto the estimated demand. It is possible to have the BESS monitor the instantaneousgrid frequency and provide services related to the fluctuations in frequency. The testcase in this thesis demonstrates how the apparent potential of having a BESS provideFDR services is worth further exploration.
The algorithm developed to simulate the operation and potential of the BESS provedto work the way it was intended. Distribution Upgrade Deferral services remained thetop priority but the algorithm explored the opportunity to include other services. Thisshows the flexibility of the algorithm and facilitates the option to explore several controlstrategies to search for the most optimal control strategy. The determination of theoptimum control strategy is relative and subjective to the services provided, owner ofthe battery and the regulatory landscape. Further, the optimum control strategy couldbe viewed from a technical perspective where the flow of energy is the primary driver forquantifying the best strategy or it could be seen from an economical perspective whichis not covered in this thesis but contain interesting aspects that are worth pursuing.
Furthermore, the algorithm demonstrated how an iterative process can ensure thatthe BESS creates a feasible schedule based on the estimated net energy flow in thescheduled period. Optimisation techniques are fragile in the way, that if a solution isinfeasible the optimisation fails and the process stops. By implementing the potential ofenabling the BESS to slack on certain parameters the best feasible solution is guaranteedto be found. The analysis further shows that the capacity of the BESS and power-to-energy ratio is suitable for the conditions governing the Nordhavn area and the services

82 9 Conclusion
implemented. A smaller BESS would also be able to handle many of the services shownin this thesis, as the SOC rarely is exhausted due to a continuous discharge of the BESSfrom unity SOC.
Several issues have been identified, if BESSs are to be an integrated part of thepower system. Some of these issues are probably not solved through technical ingenuityand engineering solutions alone, but through commercial and regulatory discussions andagreements. While these issues might fall out of the classical engineering scope they areheavily rooted in a technical context, which rise from technical innovation and the con-tinued push for ensuring security of supply while facilitating renewable energy. Disputesover priorities of service, ownership and environmental agendas might be settled outsidethe field of engineering but the implementation of such solutions returns to the deskof the engineer for implementation, testing and operation. Therefore, by identifyingthese issues before they arise, the mitigation process and period could be limited, whichtheoretically benefits all the actors involved.
Of the different control strategies explored in this thesis the following two strategiesare regarded as the ones with the biggest potential. The combination of EV chargingservices and grid upgrade deferral showed good promise, and the BESS was kept inoperation to a satisfying degree. Further, the energy flow during the simulated 48 hoursis at a level where the BESS is not being over-used and not kept idle for too long. Thesecond strategy is the FDR and grid upgrade deferral option, which isolates the ownerof the BESS to only deal with operative entities such as DSOs and TSOs. Further, whenproviding FDR the BESS is receiving an availability payment regardless of the BESSbeing activated or not. The short simulation of the 48 hour frequency data, in a secondresolution, gives an indication of how the SOC would decrease if the BESS only rodethe frequency and provided FDR as required. From the study it is clear that the BESSis not being strained in a way, which could jeopardise the synergies in the two services.
Battery Energy Storage Systems are in the early steps on a path, which potentiallycould be a game-changer if the regulatory environment surrounding them acknowledgesthe huge potential of integrating large scale battery energy systems.
9.1 Future WorkThrough the analysis conducted in this thesis several interesting topics have emerged,which are worth pursuing. This thesis has approached a big research project in its earlyphase and have therefore adapted a relatively holistic approach to the analysis. Further,to maintain this approach a number of assumptions were made. These assumptionsenforce a natural limitation to the cases, if they were to be adopted in a real life sce-nario. Therefore a more narrow approach could be pursued where a single strategy wereinvestigated, this could allow the researcher to implement more complex input methodsand have the algorithm adapted to a more dynamic environment.
9.1 Future Work 83
Further, the economical feasibility of the BESS in Nordhavn would add another di-mension to the project, which carry a lot of value. Ultimately if BESSs are to haveany commercial success, an indepth NPV analysis and complete mapping of the regu-latory landscape would be required. The regulatory discussion might be more suitableto approach from a socio-economic perspective which further adds value to an NPVassessment of the BESS. To summarize the proposals for future works are:
• Integrate real-time inputs
• Explore the possibilities of Evolutionary and Genetic algorithm in a power systemcontext
• Approach the BESS strategy from an economical perspective
• Map the regulatory landscape and elevate the discussion therein

84
Bibliography[1] AECOM. Energy Storage Studye Funding and knowledge sharing priorities. Tech.
rep. SanAECOM Australia, 2015.[2] Abbas A. Akhil. DOE/EPRI Electricity Storage Handbook in Collaboration with
NRECA. Tech. rep. Sandia National Laboratories, 2015.[3] Philipp Braun. “Intelligent Energy Management System for Virtual Power Plants”.
PhD thesis. Aalborg Universitet, 2015.[4] Greisen. Christoffer. “EnergyLab Nordhavn New Urban Energy Infrastructure and
Smart Components”. In: Nordhavn (2015).[5] Strategen Consulting. White Paper Analysis of Utility-Managed, On-Site Energy
Storage in Minnesota. Tech. rep. Minnesota Department of Commerce, 2013.[6] Matthew Deal. Electric Energy Storage: An Assessment of Potential Barriers and
Opportunities. Tech. rep. California Public Utilities Commision, 2010.[7] Energinet.dk. Introduktion til systemydelser. 2015.[8] Energy Storage for the Electricity Grid: Benefits and Market Potential Assessment
Guide. Tech. rep. Sandia National Laboratories, 2010.[9] DONG Energy. DONG Energy Homepage. http://dongenergy-distribution.
dk/. [Online; accessed 20-January-2016]. 2015.[10] Eurolectric. Decentralised Storage:Impact on future distribution grids. Tech. rep.
Eurolectric, 2012.[11] G. Lieberman F. Hillier. Dynamic Modeling Simulation and Control of Energy
Generation. McGraw-Hill Inc., 2013.[12] “Field Tests Experience from ”1.6MW/400kWh” Li-ion Battery Energy Storage
System providing Primary Frequency Regulation Service”. In: 4th IEEE PES In-novative Smart Grid Technologies Europe (ISGT Europe) (2013).
[13] Anwar Salim Gillian Lacey Ghamin Putrus. “The Use of Second Life ElectricVehicle Batteries for Grid Support”. In: EuroCon 2013 (2013).
[14] Chioke Bem Harris. “A Mixed-Integer Model for Optimal Grid-Scale Energy Stor-age Allocation”. MA thesis. The University of Texas at Austin, 2010.
[15] IEA. Energy Policies of IEA Countries - Denmark. Tech. rep. International EnergyAgency, 2011.
[16] Integrating Renewables in Electricity Markets. Springer, 2014.
86 Bibliography
[17] IRENA. BATTERY STORAGE FOR RENEWABLES: MARKET STATUS ANDTECHNOLOGY OUTLOOK. Tech. rep. IRENA, 2015.
[18] IRENA. Renewables and electricity storage, A technology roadmap for Remap 2030.Tech. rep. IRENA, 2015.
[19] Daniel Sandermann Jensen. “Large-scale energy storage in the future Danish powersystem by means of Vanadium and Li-Ion batteries”. MA thesis. Technical Univer-sity of Denmark, DTU, 2015.
[20] Fehrenbacher. Katie. ”This will be a breakout year for batteries”. ttp://fortune.com / 2015 / 09 / 03 / battery - record - tesla - storage/. [Online; accessed 20-January-2016]. 2015.
[21] R Kennedy J. Eberhart. Particle Swarm Optimization. 1995.[22] Prabha Kundur. Power System Stability and Control. Springer, 1994.[23] S.-J. Lee. “Coordinated Control Algorithm for Distributed Battery Energy Storage
Systems for Mitigating Voltage and Frequency Deviations”. In: IEEE TRANSAC-TIONS ON SMART GRID (2015).
[24] K.K Leung. “Storage power flow controller using battery storage”. In: Power Elec-tronics and Drive Systems, 1999. PEDS ’99. Proceedings of the IEEE 1999 Inter-national Conference on (Volume:2 ) (1999).
[25] J. Löfberg. “YALMIP : A Toolbox for Modeling and Optimization in MATLAB”.In: Proceedings of the CACSD Conference. Taipei, Taiwan, 2004. url: http://users.isy.liu.se/johanl/yalmip.
[26] Henry L. López-Salamanca LúciaValéria R. Arruda Leandro Magatão. “Using aMILP Model for Battery Bank Operation in the “White Tariff” Brazilian Context”.In: The fifth International Renewable Energy Congress IREC (2014).
[27] P Mahat. “A Micro-Grid Battery Storage Management”. In: Power and EnergySociety General Meeting (PES), 2013 IEEE (2013).
[28] Nexeon. About Li-ion batteries. http://www.nexeon.co.uk/about- li- ion-batteries/. [Online; accessed 20-January-2016]. 2015.
[29] EnergiLab Nordhavn. Her er fremtidens energiløsninger. http://nordhavn.uptime.dk/. [Online; accessed 20-January-2016]. 2008.
[30] Ali Emadi Pawel Malysz Shahin Sirouspour. “MILP-based Rolling Horizon Controlfor Microgrids with Battery Storage”. In: Industrial Electronics Society, IECON2013 - 39th Annual Conference of the IEEE (2013).
[31] Germán C. Tarnowski Philip C. Kjaer Rasmus Lærke. “ANCILLARY SERVICESPROVIDED FROM WIND POWER PLANT AUGMENTED WITH ENERGYSTORAGE”. In: Power Electronics and Applications (EPE), 2013 15th EuropeanConference on (2013).
[32] G. Pistoia. Battery Technology Handbook: Advances and Applications. Newnes,2013.

Bibliography 87
[33] D A J. Rand R M. Dell. Understanding Batteries. RS-C, 2001.[34] Charlotte Søndergren. ELECTRIC VEHICLES IN FUTURE MARKET MOD-
ELS. Tech. rep. DEA, EA, DTU, 2011.[35] Daniel Spaizman. “GRID-SCALE ENERGY STORAGE: A PROPOSED CON-
TROL ALGORITHM FOR SODIUM SULFUR BATTERIES”. MA thesis. Cali-fornia Polytechnic State University, 2014.
[36] Reid. Stuart. Fitness Landscape Analysis for Computational Finance. http://www.turningfinance . com / fitness - landscape . analysis - for - computational -finance/. [Online; accessed 20-January-2016]. 2015.
[37] William E. Kramer Sudipta Chakraborty Marcelo G. Simões. Power electronicsfor renewables and distributed energy systems. Springer, 2013.
[38] “The Integration and Control of Multifunctional Stationary PV-Battery Systemsin Smart Distribution Grid”. In: Proceedings of the 28th European PhotovoltaicSolar Energy Conference and Exhibition (2013).
[39] Naveen Venkatesan. “Modeling and Integration of Demand Response and DemandSide Resources for Smart Grid Application in Distribution Systems”. MA thesis.West Virginia University, XXXX.
[40] Ranjan Vepa. Introduction to Operations research. McGraw-Hill Inc., 2013.[41] D Whitley. A Genetic Algorithm Tutorial. 2012.[42] Wollenber. B F Wood. A. Power Generation Operation and Control. Wiley, 2014q.[43] Seddik Bacha Yann Riffonneau. “Optimal Power Flow Management for Grid Con-
nected PV Systems With Batteries”. In: IEEE TRANSACTIONS ON SUSTAIN-ABLE ENERGY, VOL. 2, NO. 3, JULY 2011 (2011).
[44] M Yu X. Gen. Introduction to Evolutionary Algorithms. 2010.[45] TORU NAMERIKAWA YUKI MIYANO. “Optimal Pricing Algorithm in the Elec-
tricity Market with Battery and Accumulator and Demand–Supply Balancing”. In:Translated from Denki Gakkai Ronbunshi. Vol. 133-C. No. 10 (2015).

88
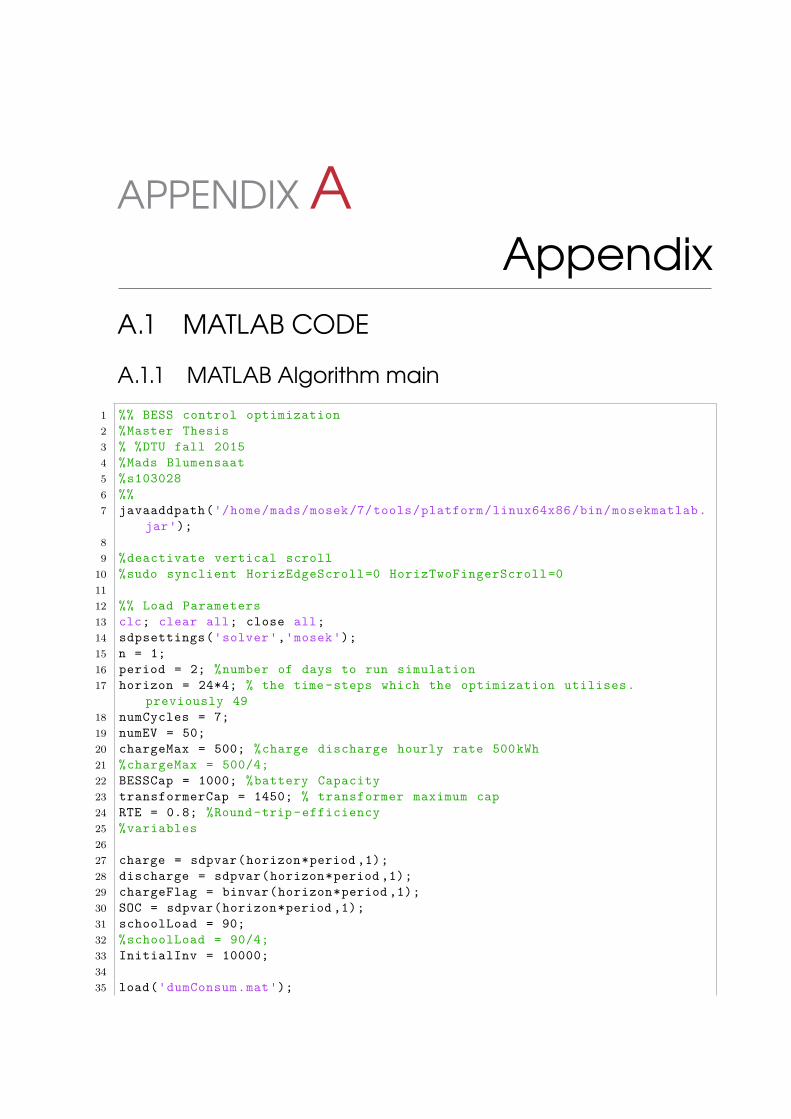
APPENDIX AAppendix
A.1 MATLAB CODE
A.1.1 MATLAB Algorithm main1 %% BESS control optimization2 %Master Thesis3 % %DTU fall 20154 %Mads Blumensaat5 %s1030286 %%7 javaaddpath('/home/mads/mosek/7/tools/platform/linux64x86/bin/mosekmatlab.
jar');89 %deactivate vertical scroll
10 %sudo synclient HorizEdgeScroll=0 HorizTwoFingerScroll=01112 %% Load Parameters13 clc; clear all; close all;14 sdpsettings('solver','mosek');15 n = 1;16 period = 2; %number of days to run simulation17 horizon = 24*4; % the time-steps which the optimization utilises.
previously 4918 numCycles = 7;19 numEV = 50;20 chargeMax = 500; %charge discharge hourly rate 500kWh21 %chargeMax = 500/4;22 BESSCap = 1000; %battery Capacity23 transformerCap = 1450; % transformer maximum cap24 RTE = 0.8; %Round-trip-efficiency25 %variables2627 charge = sdpvar(horizon*period ,1);28 discharge = sdpvar(horizon*period ,1);29 chargeFlag = binvar(horizon*period ,1);30 SOC = sdpvar(horizon*period ,1);31 schoolLoad = 90;32 %schoolLoad = 90/4;33 InitialInv = 10000;3435 load('dumConsum.mat');

90 A Appendix
36 load('dumPrice.mat');37 load('dischargePrice.mat');38 load('NordHavnLoad.mat');39 [NUMERIC, TXT, RAW] = xlsread('Insolation');40 dischargePrice = dischargePrice ';41 price = price';4243 % interpolation of inputs.44 dumConsum = interpft(dumConsum ,4*length(dumConsum));45 %dumConsum = interpft(dumConsum ,4*length(dumConsum));464748 %price = interpft(price ,4*length(price))';49 price = reshape(repmat(price ,4,1),1,[])'; %extends priceseries from hourly
to quarterly basis'50 dischargePrice = reshape(repmat(dischargePrice ,4,1),1,[])';51 NordHavnLoad = interpft(NordHavnLoad ,4*length(NordHavnLoad));5253 PV = getPV(NUMERIC)'; % insert all PV production5455 PV = PV(4345:4392); % select 48 hour PV production5657 PV = interpft(PV,4*length(PV))*0;58 for i = 1:length(PV)59 if PV(i)<060 PV(i) = 0;61 else62 Pv(i) = PV(i);63 end64 end65 doublePeakFlag = []; % used to check if there are multiple peaks in a
period.66 peak = find(NordHavnLoad >transformerCap); %The peaks to be shaved 19006768 Constraints = [];69 Objective = [];70 Objective(1) =InitialInv; % bliver overrided duer ikke71 SOC(1)=00; % Initial Value of SOC7273 EV = EVCharge(horizon,period,numEV);74 plot(EV);75 NordHavnLPV = ((NordHavnLoad));76 doublePeakFlag = [];77 flag = 0;78 storage = [EV];798081 %%82 while flag == 083 Constraints = [Constraints , sum(charge(1:horizon)) <= chargeMax*
numCycles];
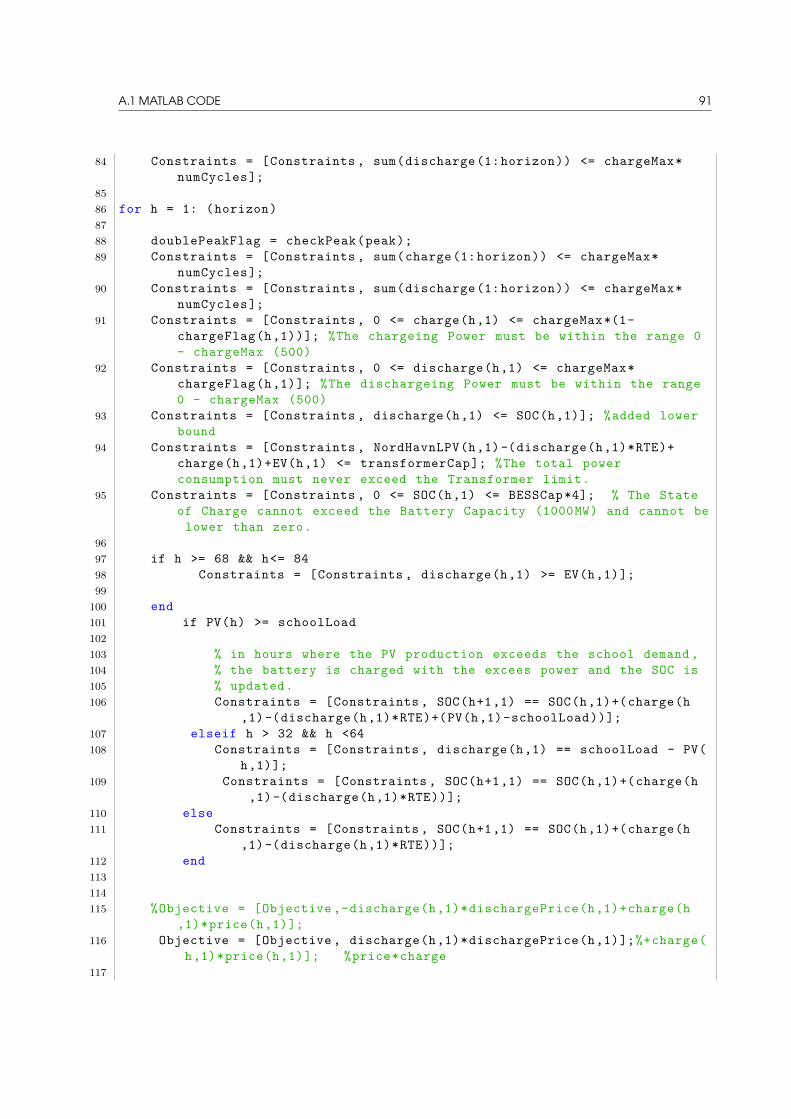
A.1 MATLAB CODE 91
84 Constraints = [Constraints , sum(discharge(1:horizon)) <= chargeMax*numCycles];
8586 for h = 1: (horizon)8788 doublePeakFlag = checkPeak(peak);89 Constraints = [Constraints , sum(charge(1:horizon)) <= chargeMax*
numCycles];90 Constraints = [Constraints , sum(discharge(1:horizon)) <= chargeMax*
numCycles];91 Constraints = [Constraints , 0 <= charge(h,1) <= chargeMax*(1-
chargeFlag(h,1))]; %The chargeing Power must be within the range 0- chargeMax (500)
92 Constraints = [Constraints , 0 <= discharge(h,1) <= chargeMax*chargeFlag(h,1)]; %The dischargeing Power must be within the range0 - chargeMax (500)
93 Constraints = [Constraints , discharge(h,1) <= SOC(h,1)]; %added lowerbound
94 Constraints = [Constraints , NordHavnLPV(h,1)-(discharge(h,1)*RTE)+charge(h,1)+EV(h,1) <= transformerCap]; %The total powerconsumption must never exceed the Transformer limit.
95 Constraints = [Constraints , 0 <= SOC(h,1) <= BESSCap*4]; % The Stateof Charge cannot exceed the Battery Capacity (1000MW) and cannot belower than zero.
9697 if h >= 68 && h<= 8498 Constraints = [Constraints , discharge(h,1) >= EV(h,1)];99
100 end101 if PV(h) >= schoolLoad102103 % in hours where the PV production exceeds the school demand,104 % the battery is charged with the excees power and the SOC is105 % updated.106 Constraints = [Constraints , SOC(h+1,1) == SOC(h,1)+(charge(h
,1)-(discharge(h,1)*RTE)+(PV(h,1)-schoolLoad))];107 elseif h > 32 && h <64108 Constraints = [Constraints , discharge(h,1) == schoolLoad - PV(
h,1)];109 Constraints = [Constraints , SOC(h+1,1) == SOC(h,1)+(charge(h
,1)-(discharge(h,1)*RTE))];110 else111 Constraints = [Constraints , SOC(h+1,1) == SOC(h,1)+(charge(h
,1)-(discharge(h,1)*RTE))];112 end113114115 %Objective = [Objective ,-discharge(h,1)*dischargePrice(h,1)+charge(h
,1)*price(h,1)];116 Objective = [Objective , discharge(h,1)*dischargePrice(h,1)];%+charge(
h,1)*price(h,1)]; %price*charge117
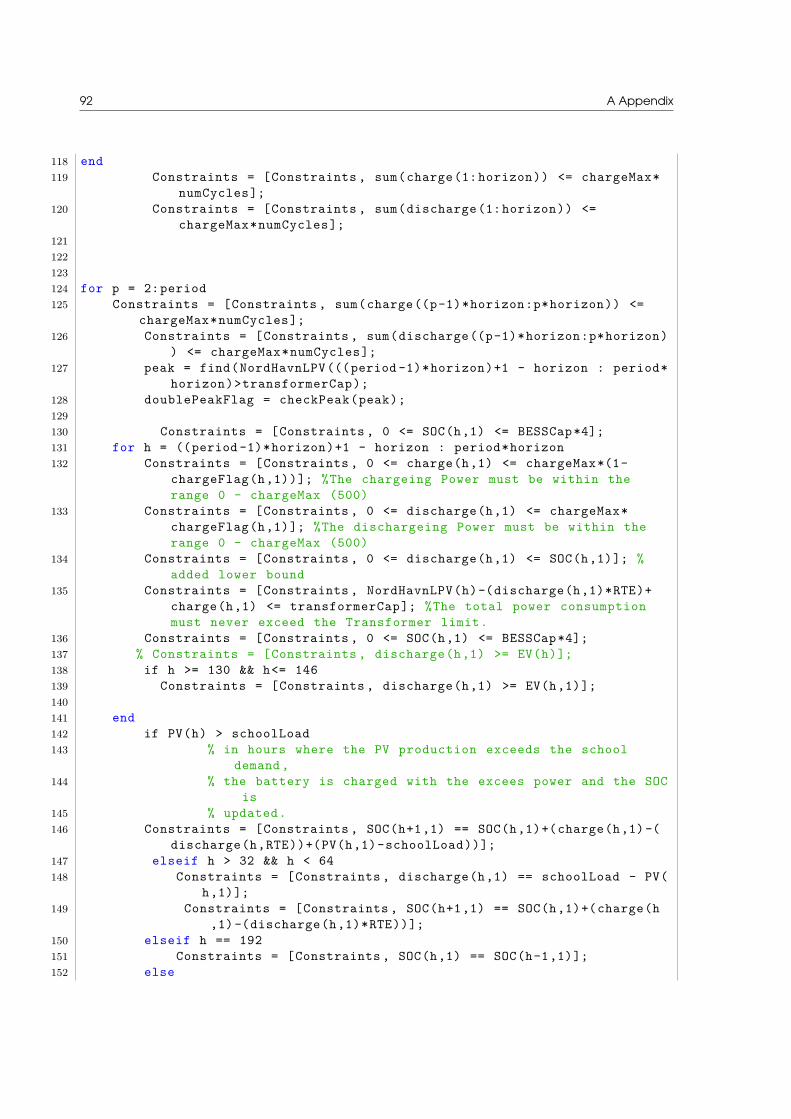
92 A Appendix
118 end119 Constraints = [Constraints , sum(charge(1:horizon)) <= chargeMax*
numCycles];120 Constraints = [Constraints , sum(discharge(1:horizon)) <=
chargeMax*numCycles];121122123124 for p = 2:period125 Constraints = [Constraints , sum(charge((p-1)*horizon:p*horizon)) <=
chargeMax*numCycles];126 Constraints = [Constraints , sum(discharge((p-1)*horizon:p*horizon)
) <= chargeMax*numCycles];127 peak = find(NordHavnLPV(((period -1)*horizon)+1 - horizon : period*
horizon)>transformerCap);128 doublePeakFlag = checkPeak(peak);129130 Constraints = [Constraints , 0 <= SOC(h,1) <= BESSCap*4];131 for h = ((period -1)*horizon)+1 - horizon : period*horizon132 Constraints = [Constraints , 0 <= charge(h,1) <= chargeMax*(1-
chargeFlag(h,1))]; %The chargeing Power must be within therange 0 - chargeMax (500)
133 Constraints = [Constraints , 0 <= discharge(h,1) <= chargeMax*chargeFlag(h,1)]; %The dischargeing Power must be within therange 0 - chargeMax (500)
134 Constraints = [Constraints , 0 <= discharge(h,1) <= SOC(h,1)]; %added lower bound
135 Constraints = [Constraints , NordHavnLPV(h)-(discharge(h,1)*RTE)+charge(h,1) <= transformerCap]; %The total power consumptionmust never exceed the Transformer limit.
136 Constraints = [Constraints , 0 <= SOC(h,1) <= BESSCap*4];137 % Constraints = [Constraints , discharge(h,1) >= EV(h)];138 if h >= 130 && h<= 146139 Constraints = [Constraints , discharge(h,1) >= EV(h,1)];140141 end142 if PV(h) > schoolLoad143 % in hours where the PV production exceeds the school
demand,144 % the battery is charged with the excees power and the SOC
is145 % updated.146 Constraints = [Constraints , SOC(h+1,1) == SOC(h,1)+(charge(h,1)-(
discharge(h,RTE))+(PV(h,1)-schoolLoad))];147 elseif h > 32 && h < 64148 Constraints = [Constraints , discharge(h,1) == schoolLoad - PV(
h,1)];149 Constraints = [Constraints , SOC(h+1,1) == SOC(h,1)+(charge(h
,1)-(discharge(h,1)*RTE))];150 elseif h == 192151 Constraints = [Constraints , SOC(h,1) == SOC(h-1,1)];152 else
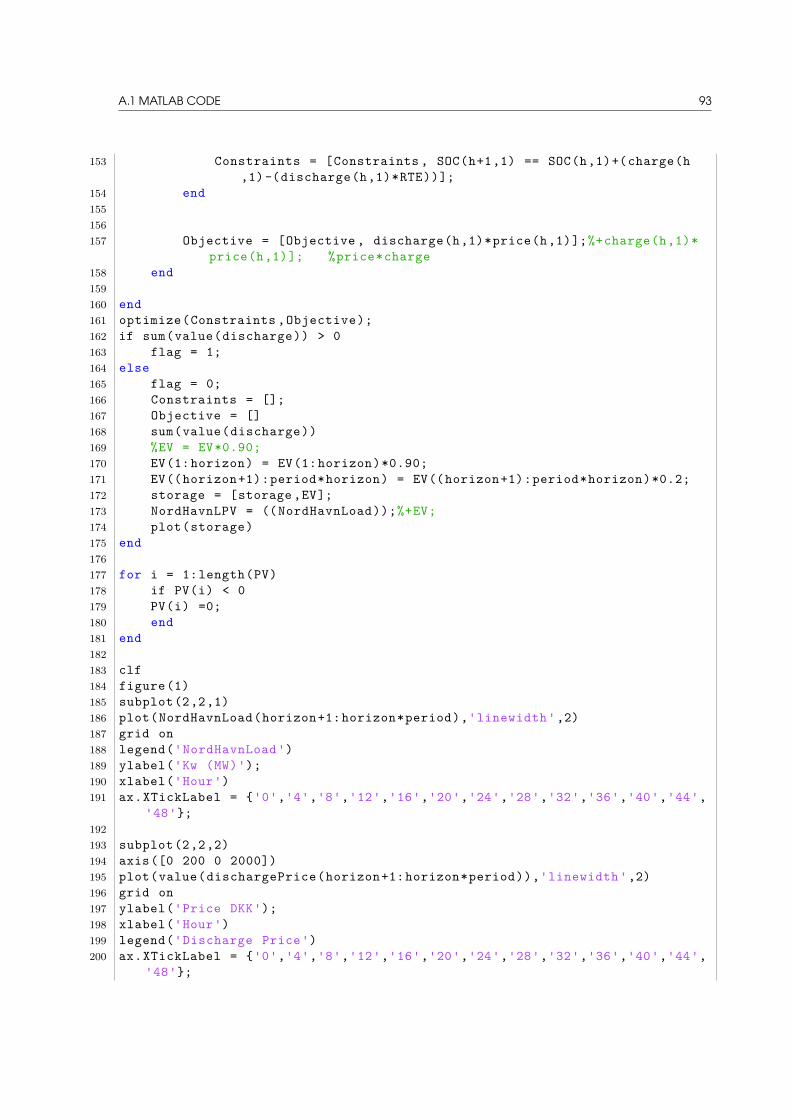
A.1 MATLAB CODE 93
153 Constraints = [Constraints , SOC(h+1,1) == SOC(h,1)+(charge(h,1)-(discharge(h,1)*RTE))];
154 end155156157 Objective = [Objective , discharge(h,1)*price(h,1)];%+charge(h,1)*
price(h,1)]; %price*charge158 end159160 end161 optimize(Constraints ,Objective);162 if sum(value(discharge)) > 0163 flag = 1;164 else165 flag = 0;166 Constraints = [];167 Objective = []168 sum(value(discharge))169 %EV = EV*0.90;170 EV(1:horizon) = EV(1:horizon)*0.90;171 EV((horizon+1):period*horizon) = EV((horizon+1):period*horizon)*0.2;172 storage = [storage,EV];173 NordHavnLPV = ((NordHavnLoad));%+EV;174 plot(storage)175 end176177 for i = 1:length(PV)178 if PV(i) < 0179 PV(i) =0;180 end181 end182183 clf184 figure(1)185 subplot(2,2,1)186 plot(NordHavnLoad(horizon+1:horizon*period),'linewidth',2)187 grid on188 legend('NordHavnLoad')189 ylabel('Kw (MW)');190 xlabel('Hour')191 ax.XTickLabel = {'0','4','8','12','16','20','24','28','32','36','40','44',
'48'};192193 subplot(2,2,2)194 axis([0 200 0 2000])195 plot(value(dischargePrice(horizon+1:horizon*period)),'linewidth',2)196 grid on197 ylabel('Price DKK');198 xlabel('Hour')199 legend('Discharge Price')200 ax.XTickLabel = {'0','4','8','12','16','20','24','28','32','36','40','44',
'48'};
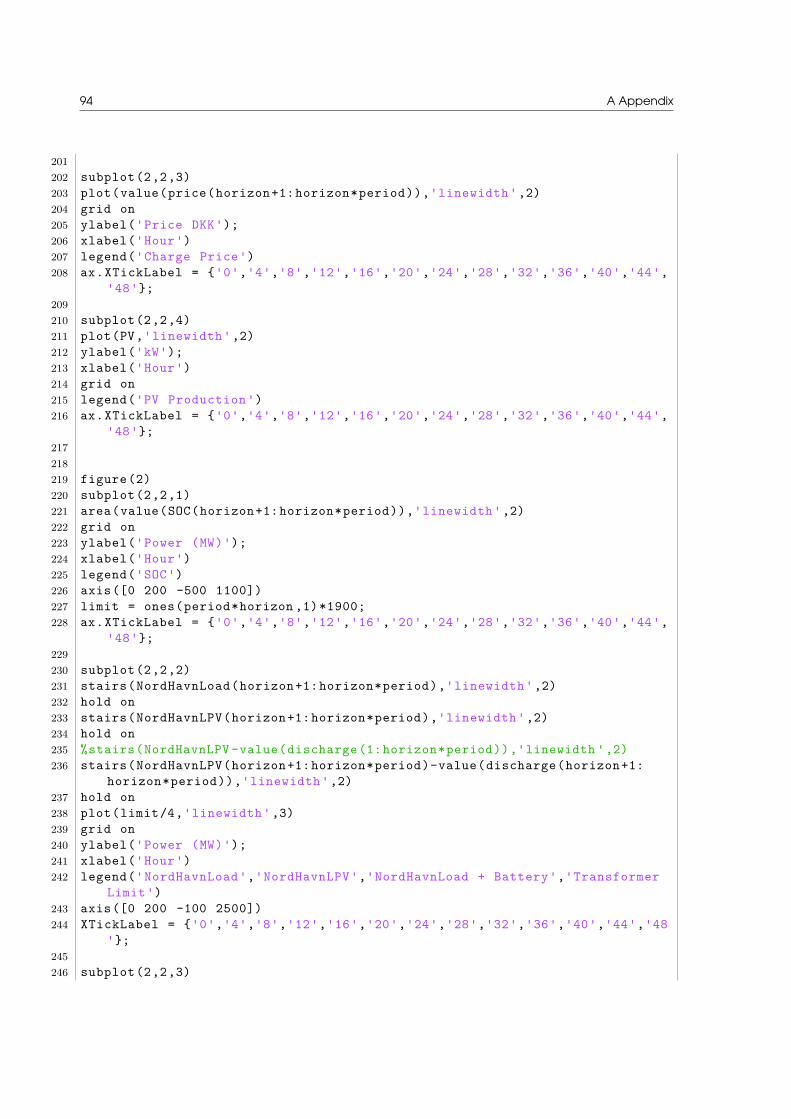
94 A Appendix
201202 subplot(2,2,3)203 plot(value(price(horizon+1:horizon*period)),'linewidth',2)204 grid on205 ylabel('Price DKK');206 xlabel('Hour')207 legend('Charge Price')208 ax.XTickLabel = {'0','4','8','12','16','20','24','28','32','36','40','44',
'48'};209210 subplot(2,2,4)211 plot(PV,'linewidth',2)212 ylabel('kW');213 xlabel('Hour')214 grid on215 legend('PV Production')216 ax.XTickLabel = {'0','4','8','12','16','20','24','28','32','36','40','44',
'48'};217218219 figure(2)220 subplot(2,2,1)221 area(value(SOC(horizon+1:horizon*period)),'linewidth',2)222 grid on223 ylabel('Power (MW)');224 xlabel('Hour')225 legend('SOC')226 axis([0 200 -500 1100])227 limit = ones(period*horizon ,1)*1900;228 ax.XTickLabel = {'0','4','8','12','16','20','24','28','32','36','40','44',
'48'};229230 subplot(2,2,2)231 stairs(NordHavnLoad(horizon+1:horizon*period),'linewidth',2)232 hold on233 stairs(NordHavnLPV(horizon+1:horizon*period),'linewidth',2)234 hold on235 %stairs(NordHavnLPV -value(discharge(1:horizon*period)),'linewidth ',2)236 stairs(NordHavnLPV(horizon+1:horizon*period)-value(discharge(horizon+1:
horizon*period)),'linewidth',2)237 hold on238 plot(limit/4,'linewidth',3)239 grid on240 ylabel('Power (MW)');241 xlabel('Hour')242 legend('NordHavnLoad','NordHavnLPV','NordHavnLoad + Battery','Transformer
Limit')243 axis([0 200 -100 2500])244 XTickLabel = {'0','4','8','12','16','20','24','28','32','36','40','44','48
'};245246 subplot(2,2,3)
A.1 MATLAB CODE 95
247 stairs(value(-discharge(horizon+1:horizon*period)),'linewidth',2,'color','r')
248 grid on249 hold on250 stairs(value(charge(horizon+1:horizon*period)),'linewidth',2)251 ylabel('Power (MW)');252 xlabel('Hour')253 legend('discharge', 'charge')254 axis([0 200 -500 500])255 ax.XTickLabel = {'0','4','8','12','16','20','24','28','32','36','40','44',
'48'};256257 %%258 figure(11)259 area(storage(:,1),'linewidth',2)260 grid on261 ylabel('Price DKK');262 xlabel('Hour')263 legend('Charge Price')
mainAppendix.m.
96 A Appendix
A.1.2 MATLAB Algorithm Input PV1 %thji23 function PV = getPV(NUMERIC)45 Ins = NUMERIC(6:8765,2:8);6 east30= Ins(:,1);7 west30= Ins(:,2);8 south30= Ins(:,3);9 % STC Test conditions -42004 PV-panels (255Wp)
10 %Ta=5;11 Gt=1000; Isc=8.92; Voc=38; TcoefVoc=-0.0031;12 T0=25;Vmp=30.8;Imp=8.28; Eff=0.1374; L=1.65; wi=0.992; % L& wi tells the
size1314 %%Fill factor15 FF=(Imp*Vmp)/(Isc*Voc);1617 %Tcell=[];18 Il=[];19 V=[];20 Ps=[];2122 TCell=(0.0325*south30);23 day=1;24 i=0;25 while day<=3652627 for Lt=1:2428 %Tcell(Lt+i) = T(Lt+1)+(0.0325*S15(Lt+i)); Wrong results29 V(Lt+i) = Voc*(1+TcoefVoc*(TCell(Lt+i)-T0));30 Il(Lt+i)=(south30(Lt+i)/Gt)*Isc;31 P(Lt+i)= FF*V (Lt+i)*Il(Lt+i);%Real power output3233 PV = P*650;34 end3536 day=day+1;37 i=Lt+i;38 end3940 end
getPV.m.

A.1 MATLAB CODE 97
A.1.3 MATLAB Algorithm Input EV1 %% EV2 % The EV load is handled in this function.3 function EVLoad = EVCharge(horizon, period, numEV)4 % The number of EV's in the fleet56 EVLoad= zeros(horizon*period ,1);7 EVChargeHour = [];8 for i = 1:period9 if i == 1
10 %EVChargeHour = [EVChargeHour , randi([130 146],1,numEV)];11 EVChargeHour = [EVChargeHour , randi([68 84],1,numEV)];12 elseif i == 213 EVChargeHour = [EVChargeHour , randi([130 146],1,numEV)];14 %EVChargeHour = [EVChargeHour , 0];1516 end17 % 1018 end19 for i = 1:numEV*period20 EVLoad(EVChargeHour(i)) = EVLoad(EVChargeHour(i))+50;21 end22 plot(EVLoad)
EVCharge.m.

98 A Appendix
A.2 Datasheets

www.jinkosolar.com
KEY FEATURES
High module conversion efficiency (up to 16.19%), through innovative manufacturing technology.
JKM265P-60
Positive power tolerance of 0/+3%
245-265 WattPOLY CRYSTALLINE MODULE
ISO9001:2008、ISO14001:2004、OHSAS18001certified factory.IEC61215、IEC61730 certified products.
High Efficiency:
4 Busbar Solar Cell:
Advanced glass and solar cell surface texturing allow for excellent performance in low-light environments.
Low-light Performance:
Certified to withstand: wind load (2400 Pascal) and snow load (5400 Pascal).
Severe Weather Resilience:
High salt mist and ammonia resistance certified by TUV NORD.
Durability against extreme environmental conditions:
4 busbar solar cell adopts new technology to improve the efficiency of modules , offers a better aesthetic appearance, making it perfect for rooftop installation.
(4BB)
MCS
LINEAR PERFORMANCE WARRANTY10 Year Product Warranty 25 Year Linear Power Warranty
80.7%
90.%
95.%97.5%100%
1 5 12 25yearsG
uara
ntee
d P
ower
Per
form
ance
linear performance warranty
Standard performance warrantyAdditional value from Jinko Solar’s linear warranty
A.2 Datasheets 99
A.2.1 PV Panel Datasheet

100 A Appendix
A.3 CleanCharge DC fastcharge datasheet
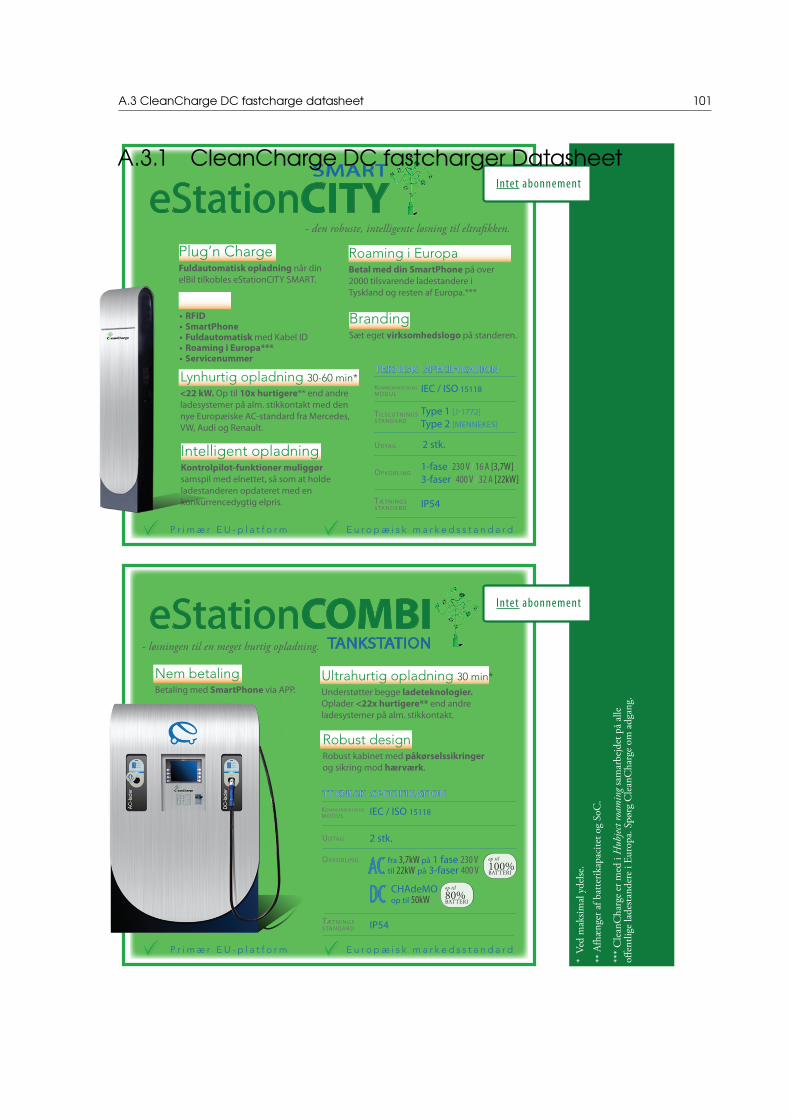
eStationCITYSMART
- den robuste, intelligente løsning til eltrafikken.
TekniskspecifikaTion
tilslUtningsstandard
kOmmUnik atiOns mOdUl
OpkObling
tæ tningsstandard
2 stk. Udtag
Type 1 [J-1772]Type 2 [MennekeS]
IeC / ISO 15118
1-fase 230v/16a[3,7W]3-faser 400v/32a[22kW]
IP54
BrandingSæt eget virksomhedslogo på standeren.
Lynhurtig opladning 30-60 min* <22 kW. Op til 10x hurtigere** end andre ladesystemer på alm. stikkontakt med den nye europæiske AC-standard fra Mercedes, VW, Audi og Renault.
Plug’n ChargeFuldautomatisk opladning når din elBil tilkobles eStationCITY SMART.
Intelligent opladningKontrolpilot-funktioner muliggør samspil med elnettet, så som at holde ladestanderen opdateret med en konkurrencedygtig elpris.
Plug’n ChargeRoaming i Europa Betal med din SmartPhone på over 2000 tilsvarende ladestandere i Tyskland og resten af europa.***
P r i m æ r E U - p l a t f o r m E u r o p æ i s k m a r k e d s s t a n d a r d
P r i m æ r E U - p l a t f o r m E u r o p æ i s k m a r k e d s s t a n d a r d
* V
ed m
aksim
al y
delse
. **
Afh
ænge
r af b
atte
rikap
acite
t og
SoC
.
***
Cle
anC
harg
e er
med
i H
ubjec
t roa
min
g sa
mar
bejd
et p
å al
le
offen
tlige
lade
stand
ere
i Eur
opa.
Spø
rg C
lean
Cha
rge
om a
dgan
g.
intet abonnementeStationCOMBItankstatiOn- løsningen til en meget hurtig opladning.
Ultrahurtig opladning 30 min*Understøtter begge ladeteknologier. Oplader <22x hurtigere** end andre ladesystemer på alm. stikkontakt.
TekniskspecifikaTion
OpkObling
tæ tningsstandard
2 stk. Udtag
fra 3,7kW på 1 fase 230vtil 22kW på 3-faser 400V
IP54
Nem betalingBetaling med SmartPhone via APP.
Robust designRobust kabinet med påkørselssikringer og sikring mod hærværk.
op til
80%bAttEri
op til
100%bAttEri
intet abonnement
Adgang•RFID•SmartPhone•Fuldautomatisk med kabel ID•Roaming i Europa***•Servicenummer
CHAdeMOop til 50kW
acDc
kOmmUnik atiOns mOdUl ieC / isO 15118
A.3 CleanCharge DC fastcharge datasheet 101
A.3.1 CleanCharge DC fastcharger Datasheet

102