DRIVES AND CONTROLS Geared and gearless drives, motors, fluid ...
������������ ���������
���������������������������������
���������������������������������������������������������� !��������"����#���������������������������$%�����&�$'�(� !)�!���������� ��� �*���������
���+����$����,--,$,.�

EUB/AGS Geo-Note 2002-21
Controls on Fluid Flow Systems in Northern Alberta as Related to MVT Mineralization: A Contribution to the Carbonate-Hosted Pb-Zn (MVT) Targeted Geoscience Initiative
J.J. Adams* and D.R. Eccles
Alberta Geological Survey
September 2003

©Her Majesty the Queen in Right of Alberta, 2003
The Alberta Geological Survey and its employees and contractors make no warranty, guarantee orrepresentation, express or implied, or assume any legal liability regarding the correctness, accuracy,completeness, or reliability of this publication. Any digital data and software supplied with thispublication are subject to the licence conditions. The data are supplied on the understanding that they arefor the sole use of the licensee, and will not be redistributed in any form, in whole or in part, to thirdparties. Any references to proprietary software in the documentation, and/or any use of proprietary dataformats in this release does not constitute endorsement by the Alberta Geological Survey of anymanufacturer's product.
When using information from this publication in other publications or presentations, due acknowledge-ment should be given to the Alberta Energy and Utilities Board/Alberta Geological Survey. Thefollowing reference format is recommended:
Adams, J.J. and Eccles, D.R. (2003): Controls on fluid flow systems in northern Alberta as related toMVT mineralization: A contribution to the carbonate-hosted Pb-Zn (MVT) targeted geoscienceinitiative; Alberta Energy and Utilities Board, EUB/AGS Geo-Note 2002-21.
Author contact information
*J.J. AdamsFormerly of Alberta Geological [email protected]
Published September 2003 by:Alberta Energy and Utilities BoardAlberta Geological Survey4th Floor, Twin Atria Building4999 – 98th AvenueEdmonton, AlbertaT6B 2X3
Tel: (780) 422-3767 (Information Sales)Fax: (780) 422-1918E-mail: [email protected]
Web site: www.ags.gov.ab.ca
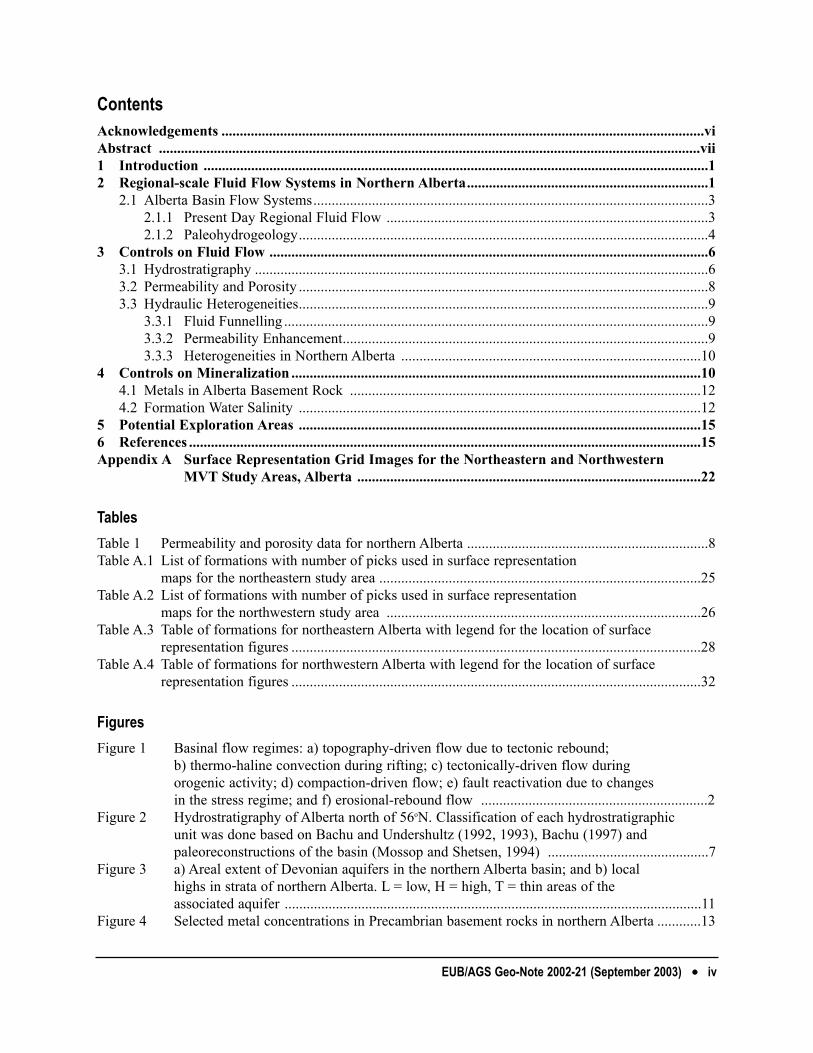
Cover Photo: Saline spring discharge on Lambert Creek, 3.2 km upstream from the confluence withHarper Creek.
EUB/AGS Geo-Note 2002-21 (September 2003) •• iii
ContentsAcknowledgements ....................................................................................................................................viAbstract ....................................................................................................................................................vii1 Introduction ..........................................................................................................................................12 Regional-scale Fluid Flow Systems in Northern Alberta..................................................................1
2.1 Alberta Basin Flow Systems............................................................................................................32.1.1 Present Day Regional Fluid Flow ........................................................................................32.1.2 Paleohydrogeology................................................................................................................4
3 Controls on Fluid Flow ........................................................................................................................63.1 Hydrostratigraphy ............................................................................................................................63.2 Permeability and Porosity ................................................................................................................83.3 Hydraulic Heterogeneities................................................................................................................9
3.3.1 Fluid Funnelling ....................................................................................................................93.3.2 Permeability Enhancement....................................................................................................93.3.3 Heterogeneities in Northern Alberta ..................................................................................10
4 Controls on Mineralization ................................................................................................................104.1 Metals in Alberta Basement Rock ................................................................................................124.2 Formation Water Salinity ..............................................................................................................12
5 Potential Exploration Areas ..............................................................................................................156 References ............................................................................................................................................15Appendix A Surface Representation Grid Images for the Northeastern and Northwestern
MVT Study Areas, Alberta ..............................................................................................22
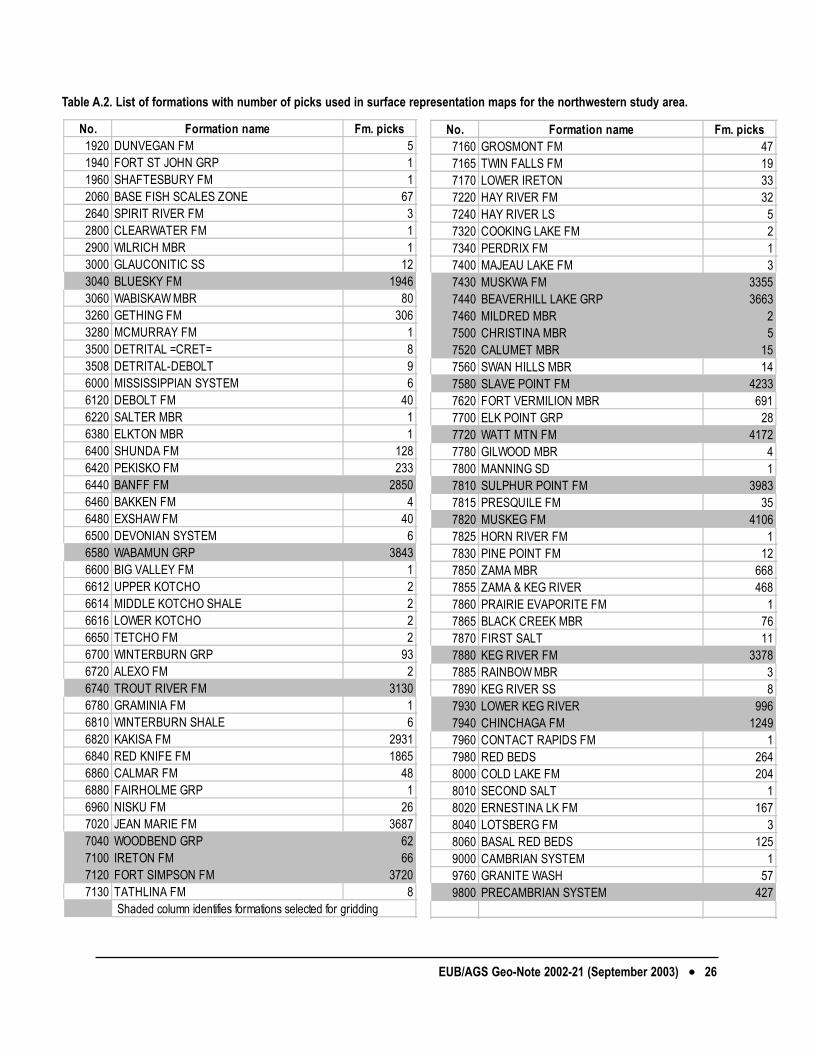
TablesTable 1 Permeability and porosity data for northern Alberta ..................................................................8Table A.1 List of formations with number of picks used in surface representation
maps for the northeastern study area ........................................................................................25Table A.2 List of formations with number of picks used in surface representation
maps for the northwestern study area ......................................................................................26Table A.3 Table of formations for northeastern Alberta with legend for the location of surface
representation figures ................................................................................................................28Table A.4 Table of formations for northwestern Alberta with legend for the location of surface
representation figures ................................................................................................................32
FiguresFigure 1 Basinal flow regimes: a) topography-driven flow due to tectonic rebound;
b) thermo-haline convection during rifting; c) tectonically-driven flow during orogenic activity; d) compaction-driven flow; e) fault reactivation due to changes in the stress regime; and f) erosional-rebound flow ..............................................................2
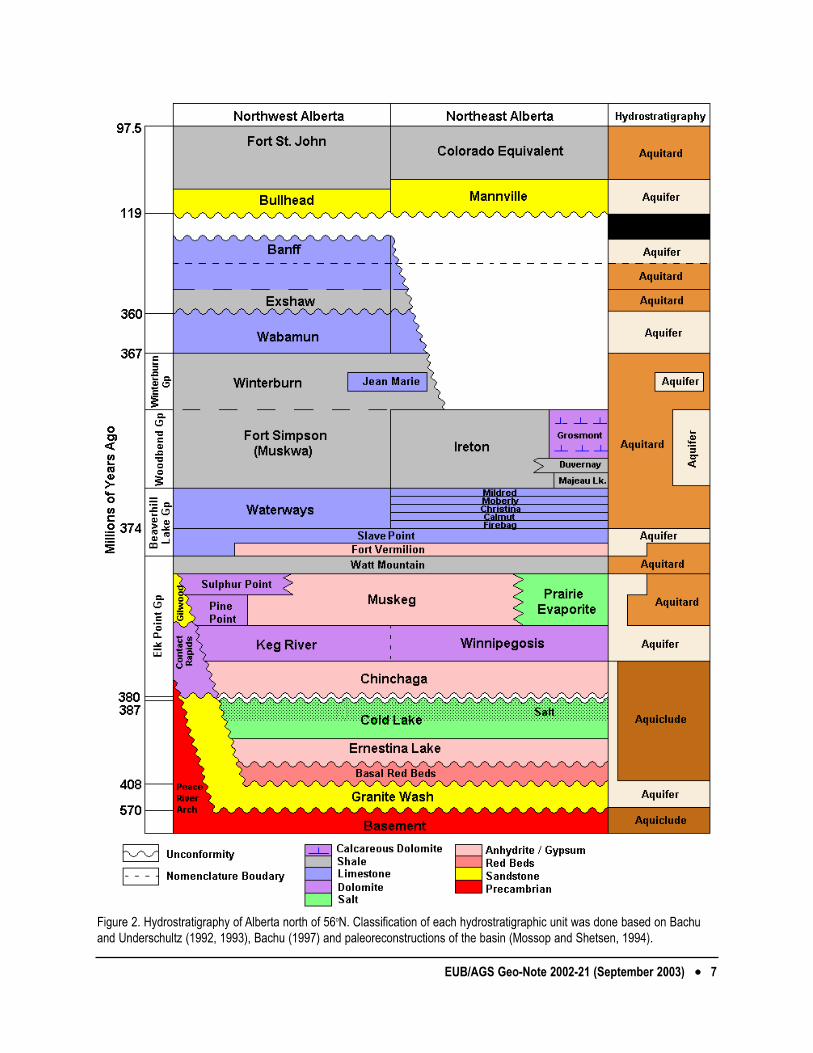
Figure 2 Hydrostratigraphy of Alberta north of 56oN. Classification of each hydrostratigraphic unit was done based on Bachu and Undershultz (1992, 1993), Bachu (1997) and paleoreconstructions of the basin (Mossop and Shetsen, 1994) ............................................7
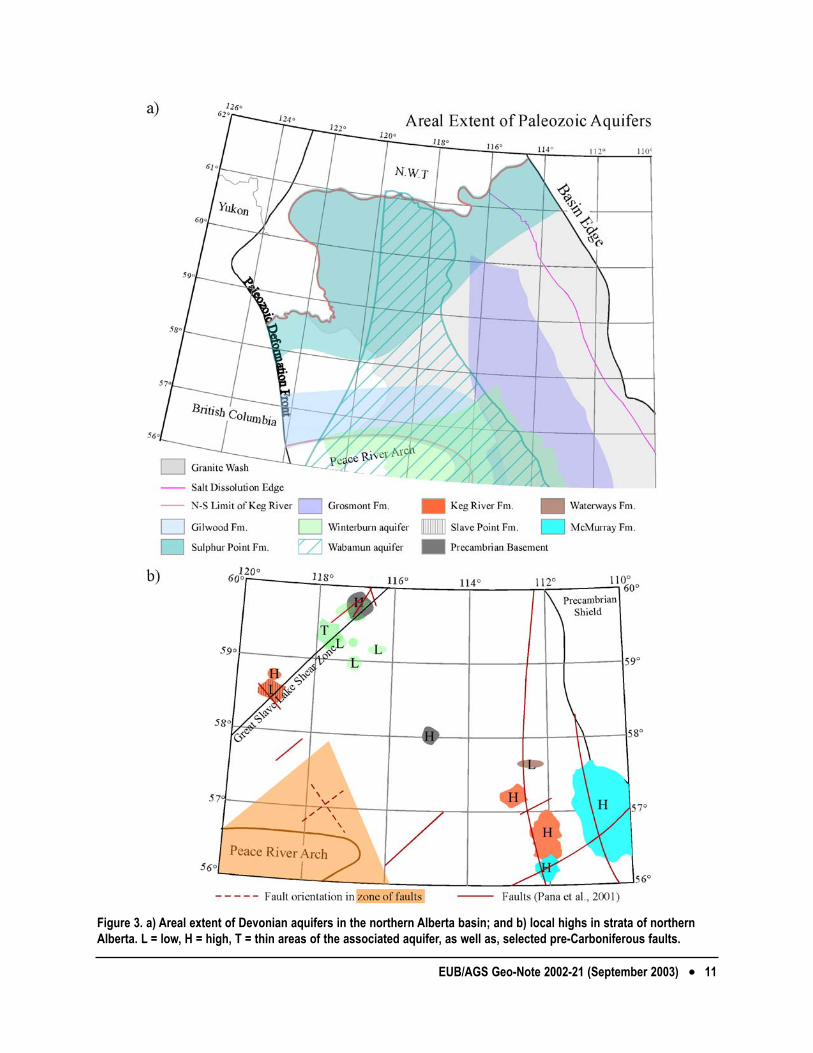
Figure 3 a) Areal extent of Devonian aquifers in the northern Alberta basin; and b) local highs in strata of northern Alberta. L = low, H = high, T = thin areas of the associated aquifer ..................................................................................................................11
Figure 4 Selected metal concentrations in Precambrian basement rocks in northern Alberta ............13
EUB/AGS Geo-Note 2002-21 (September 2003) •• iv
Figure 5 Present day formation water salinity in g/l TDS for a) Elk Point and b) Beaverhill Lake aquifer systems ......................................................................................14
Figure A.1 Isopach map showing the depth to the Devonian surface in northeastern Alberta…. ..........23Figure A.2 Isopach map showing the depth to the Devonian surface in northwestern Alberta…..........24Figure A.3 Surface representation maps for the top of the McMurray Formation ................................29Figure A.4 Surface representation maps for the top of the Waterways Group…………………. ..........30Figure A.5 Surface representation maps for the top of the Waterways Group using the AGS
database……………………………………………………………………………………..31Figure A.6 Surface representation maps for the top of the Bluesky Formation………………... ..........33Figure A.7 Surface representation maps for the top of the Banff Formation……………………..........34Figure A.8 Surface representation maps for the top of the Wabamun Group………………….. ..........35Figure A.9 Surface representation maps for the top of the Winterburn Group. ..........…………………36Figure A.10 Surface representation maps for the top of the Woodbend Group ........................................37Figure A.11 Surface representation maps for the top of the Beaverhill Lake Group or top of the
Waterways Group ..................................................................................................................38Figure A.12 Surface representation maps for the top of the Slave Point Formation ............……………39Figure A.13 Surface representation maps for the top of the Watt Mountain Formation ..........................40Figure A.14 Surface representation maps for the top of the Sulphur Point Formation ............…………41Figure A.15 Surface representation maps for the top of the Muskeg Formation ......................................42Figure A.16 Surface representation maps for the top of the Keg River Formation ..................................43Figure A.17 Surface representation maps for the top of the Lower Keg River Formation ......................44Figure A.18 Surface representation maps for the top of the Chinchaga Formation..................................45Figure A.19 Surface representation grid maps for the top of the Precambrian basement ............………46Figure A.20 Surface representation isopach maps from the top of the Wabamun Group to the
top of the Winterburn Group ................................................................................................47Figure A.21 Surface representation isopach maps from the top of the Winterburn Group
to the top of the Woodbend Group ........................................................................................48Figure A.22 Surface representation isopach maps from the top of the Woodbend Group
to the top of the Beaverhill Lake Group (Waterways Group) ..............................................49Figure A.23 Surface representation isopach maps from the top of the Beaverhill Lake
Group (or top of the Waterways Group) to the top of the Slave Point Formation ..............50Figure A.24 Surface representation isopach maps from the top of the Slave Point Formation
to the top of the Watt Mountain Formation ..........................................................................51Figure A.25 Surface representation isopach maps from the top of the Watt Mountain
Formation to the top of the Sulphur Point Formation ..........................................................52Figure A.26 Surface representation isopach maps from the top of the Sulphur Point
Formation to the top of the Chinchaga Formation ................................................................53Figure A.27 Surface representation isopach maps from the top of the Keg River
Formation to the top of the Lower Keg River Formation ....................................................54
EUB/AGS Geo-Note 2002-21 (September 2003) •• v

AcknowledgementsThis manuscript has been improved through reviews by R.J. Rice, Project Leader and R.A. Olson, Head,Minerals Section, Alberta Geological Survey.
EUB/AGS Geo-Note 2002-21 (September 2003) •• vi

AbstractLarge-scale fluid migrations control the mobilization, transportation and mineralization events that formMississippi Valley-type (MVT) lead-zinc ore districts within a basin. Therefore, an analysis of thefavourable features and components that control fluid flow related to possible MVT mineralization inthe Alberta portion of the Western Canada Sedimentary Basin allows for the delineation of highprobability areas for exploration.
For northern Alberta, the potential flow mechanisms responsible for MVT mineralization are reviewed,and the literature about past and present flow systems is summarized. Definition of the regional hydros-tratigraphic framework and associated permeability values show that, the Keg River Formation, Presqu’ilebarrier complex and Grosmont Formation represent the most favourable conduits for MVT ore-formingfluids in northern Alberta. Within these more prospective rock packages, more localized conduits offocused fluid flow, such as faults, breccias, shear zones, structural highs or stratigraphically thick to thinzones, have been identified and evaluated in the context of prospectivity for MVT mineralization. Someexamples include the Great Slave Lake Shear zone and the Peace River arch area where there are a largenumber of pre-Carboniferous faults. As well, along the south-eastern portion of the study area some largefaults are also associated with local structural highs. Lithochemical analyses of basement rock, a potentialsource of MVT metals, show an area of coincident high Pb and Zn concentrations east of the Peace RiverArch and south of the Great Slave Lake Shear zone in the Ksituan region. Finally, mapping of formationwater salinity in the Elk Point and Beaverhill Lake Groups identified high salinity water (>150 g/l Cl)needed for metal-mobilization around the Peace River Arch in the Beaverhill Lake Group and along theedge of the Prairie Evaporite in the Elk Point.
In conclusion, investigation of hydraulic heterogeneities, formation water salinity and metal sourcessuggests that around the Peace River Arch, along the Great Slave Lake Shear zone, between 118° and116°W and at the margin of the basin, between 56.5° and 57.5°N would be good target areas for MVTexploration, in northern Alberta.
EUB/AGS Geo-Note 2002-21 (September 2003) •• vii
1 Introduction
The successful development of a Mississippi Valley-type (MVT) Pb-Zn ore district relies on the co-existence of large volumes of high salinity, metal-bearing water, warm temperatures, and a source ofreduced sulphur for the duration of mineralization in a permeable, carbonate host rock. All of thesecomponents are present in abundance in sedimentary basins; however, they are rarely coexistent for longenough to accumulate an economic ore district. In addition, the high grades (5 to 10 wt%) and largetonnage in MVT deposits, combined with low solubility of Pb and Zn in basinal brines, suggest that alarge volume of water is required for the formation of observed ore deposits (Anderson and Macqueen,1982). Mass balance calculations have determined that ore-forming fluids containing a minimum of 1ppm aqueous Pb and Zn must pass through the host rock for 0.2 to 5 Ma to concentrate the observed ore(Garven, 1985). The volume of ore-forming fluids is on the order of hundreds of cubic kilometres,suggesting that the flow system is active at a regional-scale (Bethke and Marshak, 1990).
In general, the flow system controls the timing of the ore mineralization, whereas the spatial location ofan ore district can be a function of geological structure and permeability (e.g., breccias, karst or localbasement highs) and/or chemical traps (e.g., mixing zones, redox barriers or temperature and pressurechanges).
This report discusses regional-scale flow mechanisms, which become active during the evolution ofsedimentary basins, in the context of MVT mineralization. This discussion includes a review of past andpresent regional flow systems, and possible sources of metals and highly saline water, needed for metalmobilization in northern Alberta. Fluid flow pathways (e.g., aquifers, faults) and fluid focusing features(e.g., facies changes, basement highs) are also identified. All these data are integrated to delineatepotential target areas for MVT exploration in northern Alberta.
2 Regional-Scale Fluid Flow Systems in Northern Alberta
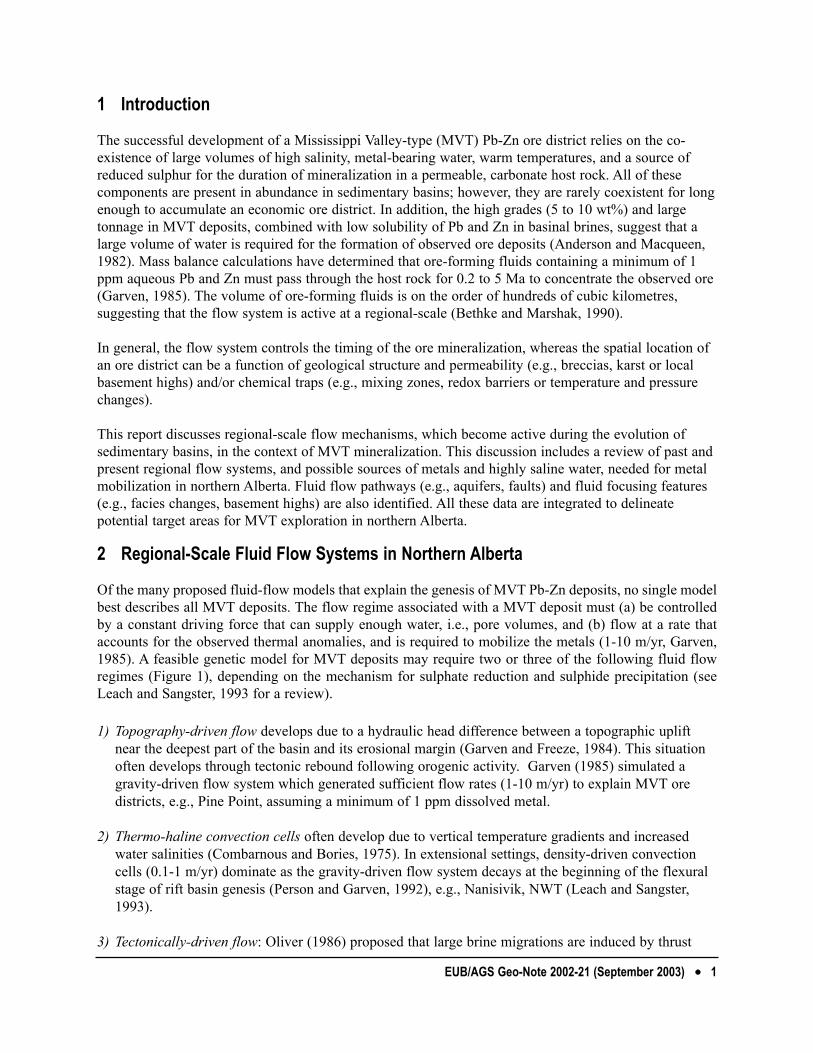
Of the many proposed fluid-flow models that explain the genesis of MVT Pb-Zn deposits, no single modelbest describes all MVT deposits. The flow regime associated with a MVT deposit must (a) be controlledby a constant driving force that can supply enough water, i.e., pore volumes, and (b) flow at a rate thataccounts for the observed thermal anomalies, and is required to mobilize the metals (1-10 m/yr, Garven,1985). A feasible genetic model for MVT deposits may require two or three of the following fluid flowregimes (Figure 1), depending on the mechanism for sulphate reduction and sulphide precipitation (seeLeach and Sangster, 1993 for a review).
1) Topography-driven flow develops due to a hydraulic head difference between a topographic uplift near the deepest part of the basin and its erosional margin (Garven and Freeze, 1984). This situation often develops through tectonic rebound following orogenic activity. Garven (1985) simulated a gravity-driven flow system which generated sufficient flow rates (1-10 m/yr) to explain MVT ore districts, e.g., Pine Point, assuming a minimum of 1 ppm dissolved metal.
2) Thermo-haline convection cells often develop due to vertical temperature gradients and increased water salinities (Combarnous and Bories, 1975). In extensional settings, density-driven convection cells (0.1-1 m/yr) dominate as the gravity-driven flow system decays at the beginning of the flexural stage of rift basin genesis (Person and Garven, 1992), e.g., Nanisivik, NWT (Leach and Sangster, 1993).
3) Tectonically-driven flow: Oliver (1986) proposed that large brine migrations are induced by thrust
EUB/AGS Geo-Note 2002-21 (September 2003) •• 1

EUB/AGS Geo-Note 2002-21 (September 2003) •• 2
Figure 1. Basinal flow regimes: a) topography-driven flow due to tectonic rebound; b) thermo-haline convection during rifting; c) tectonically-driven flow during orogenic activity;d) compaction-driven flow; e) fault reactivation due to changes in the stress regime; and f) erosional-rebound flow. Small vectors indicate direction of groundwater flow. Largearrows indicate basinal forces or stresses. Note scale changes for each case. (Modified from Garven, 1995).
sheets ‘overriding’ sedimentary packages in foreland basins. However, Ge and Garven (1992) demonstrated that an insufficient volume of fluid is expelled during a compressional tectonic event to account for MVT deposits, despite the adequately high flow rates of 0.1-1 m/yr. Sufficient flow may be attained if brines are focused into aquifers, but the driving force in this flow regime persists for only ~10 000 years (Bethke and Marshak, 1990).
4) Compaction-driven flow is caused by a reduction in porosity during burial of basinal sediments (Jackson and Beales, 1967). However, Bethke (1985) demonstrated that steady-state compaction-driven flow rates (0.1-1 cm/yr) are insufficient to account for thermal anomalies in many deposits by advection of heat, and for the mass of ore in economic ore districts. An end member of compaction-driven flow is episodic basin dewatering from overpressurized compartments in a rapidly subsiding basin (Cathles and Smith, 1983). This mechansim is dependent on sedimentation of shaly material at 1 km/Ma as can be found in the Gulf Coast basin, USA, resulting in rapid explusion of water through confined aquifers.
5) Tectonic reactivation of deep seated basement faults due to an adjustment in the tectonic regime may result in the discharge of deep brines upwards along the faults (Campbell, 1967; Hitchon, 1993).
6) Erosion-rebound flow that induces underpressures can develop in low permeability strata during dilation of the rock matrix caused by unloading or erosion (Neuzil and Pollack, 1982). These conditions cause flow in the direction of maximum unloading, usually down-dip. This type of flow system is extremely slow and cannot account for MVT mineralization.
There currently is no universally accepted genetic model for MVT Zn-Pb ore districts (Sangster, 1990).Nonetheless, recent paleomagnetic, fission track and radiometric dating have confirmed the geneticconnection between MVT deposits and orogenic activity adjacent to the parent sedimentary basin. Thiscorrelation is thought to corroborate the development of regional topography-driven flow systems inresponse to tectonic uplift along the orogenic belt (Leach et al., 2001). In support of these findings, thenumerical modelling discussed previously has predicted that only the higher flow rates of gravity-drivenflow systems (1-10 m/yr) can account for ore tonnage and formation temperatures of MVT deposits atthe margins of the basin (Garven, 1985; Bethke, 1986).
2.1 Alberta Basin Flow Systems
In general, flow regimes are dependent on i) parent basin configuration or spatial distribution ofphysical properties, e.g., aquifer connection, permeabilities and compressibilities, and ii) driving forcesactive in the basin, e.g., tectonics, fluid salinity and heat flow. The Alberta basin has assumed a suite ofconfigurations in response to various tectonic regimes (Porter et al., 1982). Initial tilting and erosion ofthe Precambrian basement was followed by a passive margin stage, characterized by carbonatesedimentation. This was followed by the onset of active compressional tectonics and significant clasticsedimentation during the Columbian and Laramide orogenies. Most recently, mechanical unloading,hydrocarbon generation, topographic rebound and glaciation have also altered the basin stratigraphy anddriven fluids across the basin. Many of these stages were associated with fluid flow through existingaquifers at local and regional scales.
2.1.1 Present Day Regional Fluid Flow
A combination of driving forces, fluid types and permeabilities has produced the complex fluid flowpatterns observed in the basin today. These fluid flow patterns across the Alberta basin are representative
EUB/AGS Geo-Note 2002-21 (September 2003) •• 3
of ‘decayed’ topography-driven flow systems controlled by the Rockies and topographic highs inMontana (Bachu and Underschultz, 1992, 1993; Bachu, 1997). These patterns show that northernAlberta is a transition zone between the central Alberta flow system and the NWT flow system. Thepresent day flow systems are inadequate for the development of an ore district, in that the flowrates aretoo slow (Bethke, 1986; Bachu, 1999); however, they do help to delineate permeable pathways, such asaquifers.
In the Peace River Arch area, the Colorado Group aquitard separates flow in the post-Colorado clasticwedge from the flow system in the underlying passive margin carbonate succession (Tóth, 1978; Tóthand Corbet, 1986; Bachu, 1995; Rostron and Tóth, 1997). Flow in the post-Colorado sequence iscontrolled by local topographic highs; that is, meteoric water recharges at topographic highs and localriver valleys act as discharge zones. The flow system has reached equilibrium with topography (Parksand Tóth, 1995). Beneath this flow zone within sand lenses of the western portion of the ColoradoGroup, measured hydraulic pressures are lower than the lowest surface elevation in the basin, movingwater southwesterly towards the disturbed belt. This underpressuring is interpreted as delayedadjustment to Cenozoic erosion due to the extremely low permeability of Colorado shales (Tóth andMillar, 1983). At the eastern margin of the basin, salinity and flow in all strata are controlled by localtopographic relief (Barson et al., 2001).
Across northern Alberta, fluid pressures in the passive margin carbonate succession are sub-hydrostaticin the deep basin; nonetheless, the hydraulic gradient drives fluids updip to discharge in the northeast atthe erosional margin. This flow system resembles gravity-driven flow (Bachu, 1995), but the pattern isdifficult to reconcile with that in the overlying stiff, low permeability, Colorado shales. These shalesrestrict recharge into the underlying carbonate aquifers (Bachu, 1995). Tóth (1978), and Tóth and Millar(1983) proposed the carbonate flow pattern is a relic from an earlier period dominated by topography-driven flow that most likely was prevalent shortly after maximum burial. Considering parallel cross-sections further north along the NWT-Alberta border, the same slow topography-driven flow systemexists. The flow system extends up through the sedimentary succession, because the Fort St. John Groupstrata, which are equivalent to the Colorado Group aquitard, are more permeable, thereby allowinghydraulic connection between the passive margin carbonate aquifers and the overlying foreland clasticaquifers. This connection is confirmed by evidence for intrusion of meteoric water into the deep basin atits western margin (Bachu, 1997).
2.1.2 Paleohydrogeology
For exploration purposes, an understanding of paleohydrogeology is more useful than present-day flowpatterns in identifying potential ore-forming zones. For these reasons, a series of cross-basin studieshave investigated stable and radiogenic isotopes, as well as solute chemistry of formation waters andfluid inclusions, to delineate the timing, direction and magnitude of paleoflow (Machel and Mountjoy,1987; Nesbitt and Muehlenbachs, 1994; Nesbitt, 1995; Mountjoy et al., 1997; Nesbitt and Prochaska,1998; Machel and Cavell, 1999; Mountjoy et al., 1999). In the Alberta basin, the Peace River Arch hasacted as a major hydraulic and thermal divide, separating northern from central and southern regions ofthe basin (Mountjoy et al., 1997). Similarly, fluid flow history can be subdivided into the passive marginstage, characterized by local shallow matrix dolomitization and subsequent burial replacementdolomitization, and the Mesozoic and Tertiary flow systems of the clastic foreland controlled bytectonics along the western margin of the basin.
Until the Middle Devonian, the northern Alberta basin consisted of a series of evaporitic subbasins,separated by basement topographic highs, e.g., Peace River Arch or Tathlina Uplift, that may have
EUB/AGS Geo-Note 2002-21 (September 2003) •• 4

controlled fluid flow at the time. By the end of the Devonian, basement highs had been buried by theextensive Devonian carbonates, which have been significantly dolomitized (Machel and Mountjoy,1987; Machel and Anderson, 1989; Kaufman et al., 1991; Amthor et al., 1993, 1994; Mountjoy andAmthor, 1994; Drivet and Mountjoy, 1997; Mountjoy et al., 1997; Mountjoy et al., 1999; Mountjoy etal., 1999; Green, 1999; Duggan et al., 2001). Multiple diagenetic and epigenetic carbonate phases in theDevonian carbonates record various fluid events across the basin, whose genesis is hotly debated(Morrow, 1998). Generally, early matrix dolomite is associated with stylotization, suggesting a geneticconnection with shallow burial (~500 m) and vertical compaction. High sedimentation rates (1 to 10mm/yr) are needed to provide regional compaction-driven flow systems (Bethke, 1985). Theseconditions would have been rare in the passive margin succession, suggesting that local flow may havedominated.
A second dolomite phase, massive replacement dolomite, has been found in the carbonates across thebasin, e.g., Grosmont Fm., Leduc reefs, Swan Hills reefs, Presqu’ile barrier reef complex and theRimbey-Meadowbrook trend. These dolomites required large volumes of water carrying Mg, with thefluids being driven by many possible forces. Mountjoy and Amthor (1994) suggested that bothtopography-driven and tectonically-driven flow during the Antler orogeny dolomitized much of thebasin. The northern limit of Antler tectonics has not been confirmed, but there is no evidence ofcompressional deformation in the disturbed belt adjacent to northern Alberta (Root, 1993; Colpron et al.,2000). Shields and Brady (1995) proposed that seepage reflux of seawater may have been responsiblefor the massive dolomitization, but this mechanism is dependent on thick packages of permeable rock.Morrow (1998) maintains thermo-haline convection of highly saline brine could also have accomplishedsuch dolomitization. These systems may have been active in the Devonian and Carboniferous, but thereis no evidence of high heat flow or localized sources of high salinity water.
Other carbonate deposition phases include fracture filling in the Peace River Arch area, which documentmultiple periods of fracturing that resulted in fluid focusing along fractures and precipitation ofdolomite. Similar fracture-fill dolomite is found in northern Alberta in the Zama region (Lonnee et al.,2000) and at Pine Point, which suggests that tectonic adjustments have initiated fluid flow in the past.There is, however, no indication of the duration and magnitude of these flow systems for comparisonwith that required for MVT systems.
During the Laramide orogeny, rapid sedimentation of shales may have resulted in compaction-drivenfluid flow as these high-water content rocks were dewatered during further burial (Bethke, 1985). Asthrusting began, tectonically-driven flow may have been active during compressional pulses or loading(Oliver, 1986; Machel and Cavell, 1999). This type of flow only affects the foreland basin adjacent tothe disturbed belt due to the limited duration of the driving force (~1000 to 10000 years; Ge and Garven,1992), and therefore, cannot explain ore districts outside the disturbed belt. The last compressional pulseof the Laramide orogeny occurred during the Late Paleocene to Early Eocene (approximately 58 Ma;Fermor and Moffat, 1992; Willett et al., 1997). In the central portion of the Alberta basin, maximumburial caused oil and gas generation, which may also have caused overpressuring, especially in the deepbasin (Allan and Creaney, 1991). Extensional faulting and erosion of the fold and thrust belt causedtectonic rebound of the foreland basin. This topographic uplift is understood to have initiated regionaltopography-driven flow through the foreland basin (Garven, 1985). Saddle dolomite and late-stagecalcite cements in permeable carbonate conduits are thought to be related to fluid flow associated withthe Laramide orogeny. Deep burial, high temperatures and highly saline parent fluids are characteristicof saddle dolomite formation, which occurred prior to late-calcite cementation. The chemical characterof late-stage calcites suggests that they formed from mixed Cretaceous meteoric waters duringtopography-driven flow in the Tertiary (Qing and Mountjoy, 1992; Mountjoy et al., 1997). As erosion
EUB/AGS Geo-Note 2002-21 (September 2003) •• 5
lessened the topographic gradient, this flow system decayed back to local-scale flow near surface asdescribed today (Bachu, 1995).
In general, the above indicates a variety of fluid driving forces were active during the Phanerozoic,whereas current fluid pressures provide clues to only the most recent flow systems. Whole paleo-fluidflow systems must be inferred from fluid inclusions in diagenetic and epigenetic minerals in the contextof MVT mineralization potential (Gregg and Shelton, 1989; Savard and Kontak, 1998). The feasibilityof any of these flow systems to form a MVT ore district has been evaluated for some cases usingnumerical models.
3 Controls on Fluid Flow
In general, Zn-Pb mineralized zones or deposits are hosted by highly permeable, regional aquifers,which often narrow laterally or vertically towards the deposits (Leach and Sangster, 1993). Morespecifically within the aquifer, the ore is precipitated in zones of enhanced permeability and/or in areasin which fluids are focussed. Thus, the strata of a basin define the hydraulic framework duringmineralization and heterogeneities within the main conduits of ore-forming fluids act to define the areasin which the ore accumulates.
3.1 Hydrostratigraphy
At a regional-scale, aquifers, which often are porous carbonates or coarse clastic units, act as conduitsfor fluids within a basin. The strata within the Alberta MVT study area can be subdivided into a series ofaquitards and aquifers, based on lithology, porosity and Drill Stem Test (DST) data collected by thepetroleum industry (Figure 2). The following discussion is a summary of material published in Bachuand Underschultz (1992, 1993) and Bachu (1997), as well as paleo-reconstructions in Mossop andShetsen (1994).
The Precambrian basement is considered an aquiclude, since the permeability of tight crystalline rock(10-17 to 10-22 m2) is orders of magnitude less permeable than sedimentary rock (Freeze and Cherry, 1979).The relatively permeable saprolite layer and the sandstones and conglomerates of Granite Wash Fm.(thickness = 0 to 182 m) fill the irregular topography of the basement rock; however, the discontinuousnature of this unit requires that it be considered only a local aquifer. The overlying sequence of redbeds,evaporites and microcrystalline carbonates act as an aquiclude across northern Alberta, except near thePeace River Arch (PRA) where eroded detritus was deposited. The intervening Ernestina Lake Fm. isrelatively permeable and would be considered an aquifer in a more detailed analysis.
The Keg River and Winnipegosis formations form the oldest regionally extensive aquifer in northernAlberta. These platformal carbonates are capped by the Prairie Fm. halite in eastern Alberta and thelaterally equivalent anhydrites and fine-crystalline dolostones of the Muskeg Fm towards the wests.These two formations form an aquitard-aquiclude pair across all but the northwestern corner of Alberta,where the Pine Point Group and the Sulphur Point Fm. of the Presqu’ile barrier act as a highlypermeable aquifer. Following a period of subaerial exposure, the regionally extensive Watt MountainFm. was deposited across Alberta and is considered a thin aquitard.
Further regression led to the deposition of anhydrite, interbedded with dolomite and limestone, (FortVermillion Fm.) across the southern and southeastern portion of the study area. These evaporites gradeto the northwest and prograde upwards into more permeable carbonates, which are included in the SlavePoint aquifer. The limy shales and argillaceous micrites of the Waterways Fm grade laterally into the
EUB/AGS Geo-Note 2002-21 (September 2003) •• 6
EUB/AGS Geo-Note 2002-21 (September 2003) •• 7
Figure 2. Hydrostratigraphy of Alberta north of 56oN. Classification of each hydrostratigraphic unit was done based on Bachuand Underschultz (1992, 1993), Bachu (1997) and paleoreconstructions of the basin (Mossop and Shetsen, 1994).
Fort Simpson shale to the north and upwards into the Ireton Fm. In combination, these units form a thick(>200 m) aquitard that stretches across the basin. These shales grade into the carbonate shelf of theGrosmont Fm. in the north central portion of the study area. North of the Peace River Arch theWinterburn Group is an aquitard. The overlying Wabamun Group is a permeable dolomitic limestone inthe southern portion of the study area. To the north, the limestone becomes argillaceous and tight,making it a good aquitard. The black Exshaw Fm. shale and the lower portion of the Banff Fm. can becombined into a thick (55 to 200 m), regionally-extensive aquitard.
The upper Carboniferous, Permian, Triassic and Jurassic strata occupy only the south westernmostcorner of the study area and therefore are ignored. In the western portion of the study area, theCretaceous strata are a mélange of foreland clastics, which in combination are considered an aquitard.For the Mannville Group sandstones in particular, they extend across the southern portion of the studyarea and are thought to be an excellent aquifer. The overlying Colorado Group shales act as a barrier tofluid flow.
3.2 Permeability and Porosity
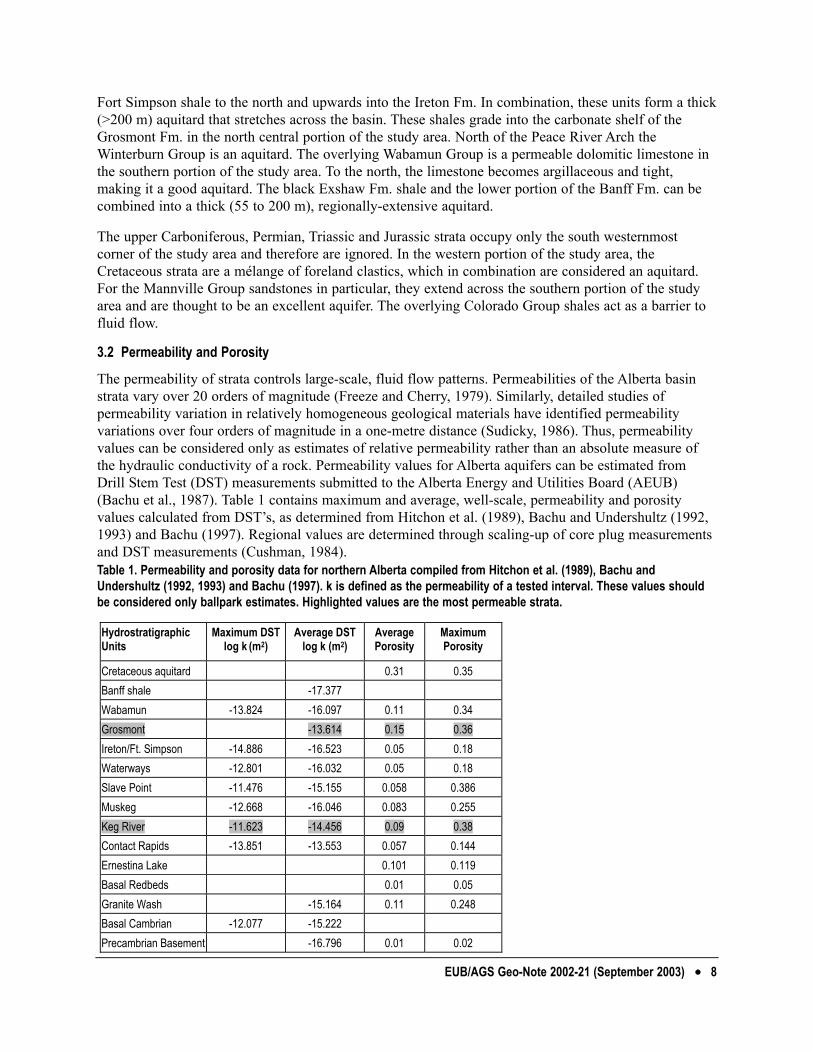
The permeability of strata controls large-scale, fluid flow patterns. Permeabilities of the Alberta basinstrata vary over 20 orders of magnitude (Freeze and Cherry, 1979). Similarly, detailed studies ofpermeability variation in relatively homogeneous geological materials have identified permeabilityvariations over four orders of magnitude in a one-metre distance (Sudicky, 1986). Thus, permeabilityvalues can be considered only as estimates of relative permeability rather than an absolute measure ofthe hydraulic conductivity of a rock. Permeability values for Alberta aquifers can be estimated fromDrill Stem Test (DST) measurements submitted to the Alberta Energy and Utilities Board (AEUB)(Bachu et al., 1987). Table 1 contains maximum and average, well-scale, permeability and porosityvalues calculated from DST’s, as determined from Hitchon et al. (1989), Bachu and Undershultz (1992,1993) and Bachu (1997). Regional values are determined through scaling-up of core plug measurementsand DST measurements (Cushman, 1984).
EUB/AGS Geo-Note 2002-21 (September 2003) •• 8
Hydrostratigraphic Units
Maximum DST log k (m2)
Average DST log k (m2)
Average Porosity
Maximum Porosity
Cretaceous aquitard 0.31 0.35 Banff shale -17.377 Wabamun -13.824 -16.097 0.11 0.34 Grosmont -13.614 0.15 0.36 Ireton/Ft. Simpson -14.886 -16.523 0.05 0.18 Waterways -12.801 -16.032 0.05 0.18 Slave Point -11.476 -15.155 0.058 0.386 Muskeg -12.668 -16.046 0.083 0.255 Keg River -11.623 -14.456 0.09 0.38 Contact Rapids -13.851 -13.553 0.057 0.144 Ernestina Lake 0.101 0.119 Basal Redbeds 0.01 0.05 Granite Wash -15.164 0.11 0.248 Basal Cambrian -12.077 -15.222 Precambrian Basement -16.796 0.01 0.02
Table 1. Permeability and porosity data for northern Alberta compiled from Hitchon et al. (1989), Bachu andUndershultz (1992, 1993) and Bachu (1997). k is defined as the permeability of a tested interval. These values shouldbe considered only ballpark estimates. Highlighted values are the most permeable strata.

Well-scale permeabilities show that the Contact Rapids, Keg River and Grosmont aquifers are the mostconductive for fluid flow. The Basal Cambrian, Keg River, Muskeg and Slave Point units reach thehighest maximum permeabilities, suggesting that local regions have much higher permeabilities than theaverage. Generally, porosity decreases with depth due to compaction by burial. Again, the Keg River,Slave Point and Grosmont aquifers have the highest maximum porosity values, which may be related tokarst zones. Similarly, the Granite Wash and Contact Rapids aquifers have relatively high porosities fortheir depth. On a regional-scale, the Keg River Formation and Grosmont Formation represent the mostpermeable and porous hydrostratigraphic units in the study (Hitchon et al., 1989; Bachu andUndershultz, 1992, 1993; Bachu, 1997). As a result, these carbonates should be considered the mostfavourable conduits for MVT ore-forming fluids in northern Alberta, at least based on recentpermeability and porosity data.
3.3 Hydraulic Heterogeneities
In general, Zn-Pb mineralization occurs in areas of increased permeability and/or zones in which fluidsare funnelled laterally or vertically. These types of hydraulic heterogeneities focus fluids within the mainaquifer, allowing local concentration and deposition of ore, if temperature, pressure, reductant or othercausative depositional conditions change favourably.
3.3.1 Fluid Funnelling
Fluids within an aquifer can be funnelled laterally by lateral facies changes or by basement highs. Forinstance, on the east and west sides of the Illinois basin, two arches are understood to have funnellednorthward flowing ore-forming fluids into the Upper Mississippi Valley ore district (Bethke, 1986).These structures generated a higher fluid flux to the ore district, thereby providing more metal-bearingfluids. In contrast, in southeast Missouri, the Lamotte sandstone pinches out at Precambrian uplifts. As aresult, northward flowing, metal-bearing fluids in this aquifer were forced vertically upwards into theBonneterre dolostone, which caused Pb-Zn ore to precipitate (Gregg and Shelton, 1989). A similar effectcan be achieved by lateral facies changes, which can funnel fluids into smaller and smaller volumes ofporous rock; e.g., the Presqu’ile barrier narrows from a width of 200 km in the northwestern corner ofAlberta to 10 km near Pine Point.
3.3.2 Permeability Enhancement
Zones of highest permeability will experience the highest fluid fluxes and thus have the greatestpotential rate of metal-precipitation from ore-forming fluids. Diagenetic permeability enhancement iscommon in the carbonate rocks that typically host MVT deposits. Mineralization is preferentially foundin breccias or karst, in faults zones and along fold hingelines. For example, the Upper Mississippi Valleyore district is found in complex networks of faults, which extend across an aquitard and into the basalaquifer, the source of the metals (Arnold et al., 1996). Also, at a regional-scale, the Pine Point oredistrict is located at the intersection point of the Presqu’ile barrier reef and the Great Slave Lake shearzone (Campbell, 1967). Finally, many MVT deposits are associated with overlying unconformities ordisconformities, which document a period of subaerial exposure that may have initiated weathering andkarstification of the host carbonate, which resulted in enhanced permeability and porosity. Later, morerobust flow systems may further enhance the permeability of these areas of dissolution, potentiallycausing brecciation and enhanced karstification.
EUB/AGS Geo-Note 2002-21 (September 2003) •• 9

3.3.3 Heterogeneities in Northern Alberta
To identify large-scale heterogeneities, structure and isopach maps were generated for all major hydros-tratigraphic units below the top of the McMurray Formation and some minor units in the the MiddleDevonian sequence (Appendix A). Most of the units show uniform sloping strata across the study areas.All heterogeneities were identified by inspection of these maps and compiled into Figure 3.
The lower Paleozoic strata in northern Alberta contain a series of lateral facies changes anddiscontinuous aquifers. Figure 3a shows the areal extent of all the aquifers in the Paleozoic succession,except for the Beaverhill Lake and Keg River aquifers, which extend across all of northern Alberta. Thisdistribution of aquifers could result in a complex flow system at a regional-scale. Fluids could befunnelled to the north along the Grosmont and Wabamun aquifers, whereas the Sulphur Point andunderlying Pine Point aquifers, as well as the Gilwood Fm. would preferentially focus water to thenortheast.
Figure 3b shows local highs (H), lows (L) and thin areas (T) within Devonian strata in northern Alberta.These zones were identified from isopach and structural contour maps (Appendix A). The major faultzones were extracted from a compilation of structural elements for northern Alberta (Pana et al., 2001).The following conclusions can be drawn from this figure:
• Highs in the Keg River in the southeast corner of the study area are at the margin of the basin, typically where MVT districts form.
• The lows in the Winterburn Fm. are in the low permeability section of this unit and therefore are of little interest (Figure A.9).
• The basement high along the Great Slave Lake Shear Zone (GSLSZ) could be a good target for exploration as it is underlying the Presqu’ile barrier; however, the barrier is at least 800 m below ground surface in this area (Figure A.27).
• The high and associated low of the Keg River Fm. in the western part of northern Alberta is close to the GSLSZ and might also have promoted mineralization (Figure A.16). In fact, Turner and McPhee (1994) have reported 3.1% Zn (with 0.05% Pb) over 21 m in the Keg River Fm. in this region, but at ca. 1300 m depth.
Faults act as major conduits for fluids. Hundreds of faults have been identified in the study area (seePana et al., 2001); however, our interest lies in pre-Carboniferous faults, which may affectmineralization in the Devonian carbonates. The basement rooted GSLSZ in northwestern Alberta is notonly a conduit for fluids, but also a potential source of metals. There are several large pre-Carboniferousfaults sub-parallel to and in the vicinity of the GSLSZ (Pana et al., 2001). In addition, many faults havebeen identified around the PRA (Pana et al., 2001) due to repeated tectonic uplift and its proximity tothe disturbed belt (Figure 3b). Other pre-Carboniferous faults can be found skirting the erosional limit ofthe basin and in the southeastern portion of the study area (Figure 3b).
4 Controls on Mineralization
Mineralization processes that lead to important MVT ore districts require a large supply of reducedsulphur and dissolved metals. Both components are abundant in sedimentary basins, but are not alwaysin a chemically available form for mineralization.
The sources of metals are most likely the underlying Precambrian basement or siltstone and argillitewithin the Phanerozoic sedimentary package, although every formation along the flowpath of an ore-
EUB/AGS Geo-Note 2002-21 (September 2003) •• 10
EUB/AGS Geo-Note 2002-21 (September 2003) •• 11
Figure 3. a) Areal extent of Devonian aquifers in the northern Alberta basin; and b) local highs in strata of northernAlberta. L = low, H = high, T = thin areas of the associated aquifer, as well as, selected pre-Carboniferous faults.

forming fluid has been proposed. A minimum of 1 ppm Pb and Zn must be mobilized out of these rocks,under an appropriate regional flow regime, to explain the high ore grades found in MVT deposits(Sverjensky, 1984). Laboratory and field measurements of formation waters reveal a direct correlationbetween water salinity and concentrations of dissolved Zn and Pb. As salinity increases, measured in-situ pH decreases and higher order metal chloride complexes (Me2+ MeCl2
0 MeCl42-) progressively
dominate (Hanor, 1996). Calculations show that more than 150 g/l Cl are required at 100oC to mobilize1 ppm of Zn or Pb from a source rock for transport to an MVT host rock (Hanor, 1996).
Sulphur is ubiquitous in the subsurface as aqueous sulphate; however, reduction of this sulphate to H2Sis necessary for formation of sulphides. Reduction occurs in sedimentary basins by bacterial sulphatereduction (BSR) at temperatures below 80oC and thermochemical sulphate reduction (TSR) attemperatures above 125oC (e.g., Machel, 2001). Reduced sulphur can be transported as a dissolvedphase, but not in the presence of Pb or Zn unless the pH is below 3 (Anderson and Macqueen, 1982). Inthe Alberta basin, significant amounts of H2S are generated in the deep basin by TSR and at shallowdepths biogenic H2S has also been recorded. Simpson (1999) showed that H2S has been transported as adissolved phase up to 200 km.
4.1 Metals in Alberta Basement Rock
Although metals can be derived from almost any local rock body, the upper several metres of thePrecambrian basement rock are highly weathered and friable. The sandstone and conglomerate of theGranite Wash may also be a good source of metals. The relatively high permeability of these units wouldallow for easy extraction of metals by highly saline water. In Figure 4, metal concentrations in thePrecambrian basement rock across northern Alberta are plotted. These plots derive from lithogeochemi-cal analyses of samples collected by R. Burwash, Department of Earth and Atmospheric Sciences,University of Alberta and the data resides in a basement sample database (Pana et al., 2002) inpreparation at the Alberta Geological Survey.
The data show a band of high metal concentrations east of the PRA. High Pb and Zn are coincident eastof the PRA and south of GSLSZ in the Ksituan (Ks) region. Generally, the amount of Zn is greater thanthat of Pb, as is the case for most MVT ore districts, worldwide. The limited data coverage make furtherconclusions difficult.
4.2 Formation Water Salinity
Approximately 150 g/l aqueous Cl is necessary to mobilize metals from rocks at 100°C; higherconcentrations are needed for lower temperatures and vice versa. Figure 5 shows the salinity (TotalDissolved Solids or TDS g/l) of formation waters in the Elk Point aquifer system (i.e., in the SulphurPoint, Pine Point, Winnipegosis, Contact Rapids and Keg River formations) and the Beaverhill Lakesystem (Slave Point and Waterways formations). The data are stored in the AGS water chemistrydatabase which is derived from data and information collected by the AEUB from the petroleumindustry. The data have been culled according to Hitchon and Brulotte (1994), and Hitchon (1996).
The water salinity varies from 20 to 220 g/l in the Beaverhill Lake aquifer, whereas the Elk Pointaquifer system reaches 320 g/l. The samples containing more than 150 g/l Cl are plotted individually inred. In the Elk Point map, the high-Cl samples almost exclusively correlate to the regions where thePrairie Fm. halite overlies the aquifer. Similarly, in the Beaverhill Lake the highest salinity waters existaround the PRA. More specifically, they are associated with the continental sabka facies of the FortVermillion Fm. There are only three instances of waters with greater than 150 g/l Cl, but there are over91 waters with greater than 100 g/l Cl.
EUB/AGS Geo-Note 2002-21 (September 2003) •• 12

EUB/AGS Geo-Note 2002-21 (September 2003) •• 13

EUB/AGS Geo-Note 2002-21 (September 2003) •• 14
Figure 5. Present day formation water salinity in g/l TDS for a) Elk Point and b) Beaverhill Lake aquifer systems. Reddiamonds represent locations of formation waters containing more than 150 g/l Cl.

The Prairie Fm. salt dissolution edge runs subparallel to the erosional edge of the basin. This suggeststhat much more saline water may have existed along the edge of the basin, but it has long since beenflushed out.
5 Potential Exploration Areas
The formation of a MVT ore district requires a highly permeable carbonate host rock, a large source ofsaline brine to mobilize Pb and Zn, a source of reduced sulphur and a robust fluid flow driving force tofocus fluids into the ore district. The location of the ore district and individual deposits is controlled bylocal-scale hydraulic heterogeneities, such as, basement highs, enhanced permeability zones, and faults.
In northern Alberta, investigation of hydraulic heterogeneities, formation water salinity and metalsources has provided several potential target areas for MVT exploration. They are reviewed belowwithout consideration as to the depth to target stratigraphic units:
1) Around the Peace River Arch:• Highly saline fluids, with Cl > 150 g/l• Collection of faults active throughout the Phanerozoic• Coincident Pb (~16-25 ppm) and Zn (>20 ppm) anomalies east of the PRA• Suite of aquifers flank the arch, i.e., Granite Wash Fm., Gilwood Fm., Keg River Fm., and
Beaverhill Lake Group
2) Along the GSLSZ, between 118° and 116°W:• Major structural fault zone, which acts as a permeable conduit for fluids• Coincident Pb (~11-15 ppm) and Zn (~21-90 ppm) anomalies• Small basement high and other local highs and lows in Paleozoic strata• Within the Presqu’ile barrier carbonates, which funnels fluids to the basin margins
3) At the margin of the basin, between 56.5° and 57.5°N:• Highs in the Keg River Fm. and McMurray Fm. • Adjacent to the Grosmont Fm., which is a highly permeable and narrow conduit for fluids• Good source of Zn (~21-90 ppm) and one concentrated source of Pb (16-25 ppm)• Adjacent to the Prairie Fm. halite dissolution edge, where highly saline water may have existed
during dissolution• Coincident sets of pre-Carboniferous faults in area of local highs (Pana et al., 2001)• Both high salinity and high chlorinity formation waters exist in the Elk Point aquifer system
Of the three target areas reviewed, the last one, which is near the margin of the basin, would provide theshallowest mining depths and is therefore the favoured target area for exploration for at or relativelynear-surface MVT Pb-Zn deposits.
6 References
Allan, J. and Creaney, S., (1991); Oil families of the Western Canada Sedimentary basin: Bulletin ofCanadian Petroleum Geology, v. 39, p. 107-122.
Amthor, J. E., Mountjoy, E. W., and Machel, H. G., (1994); Regional-scale porosity and permeabilityvariations in Upper Devonian Leduc buildups: implications for reservoir development andprediction in carbonates: AAPG Bulletin, v. 78, p. 1541-1559.
EUB/AGS Geo-Note 2002-21 (September 2003) •• 15

Amthor, J. E., Mountjoy, E. W., and Machel, H. G., (1993); Subsurface dolomites in Upper DevonianLeduc Formation buildups, central part of Rimbey-Meadowbrook reef trend, Alberta, Canada:Canadian Bulletin of Petroleum Geology, v. 41, p. 164-185.
Anderson, G. M. and Macqueen, R. W., (1982); Ore Deposit Models - 6. Mississippi Valley-Type Lead-Zinc Deposits: Geoscience Canada, v. 9, n. 2 p. 108-117.
Arnold, B. W., Bahr, J. M., and Fantucci, R., (1996); Paleohydrogeology of the Upper Mississippi Valleyzinc-lead district. in, Carbonate-Hosted Lead-Zinc Deposits, ed. D.F. Sangster, Special PublicationNumber 4, Society of Economic Geologists, p. 378-389.
Bachu, S. and Underschultz, J. R., (1992); Regional-scale porosity and permeability variations, PeaceRiver arch area, Alberta, Canada: American Association Petroleum Geologists Bulletin, v. 76, p. 547-562.
Bachu, S., (1995); Synthesis and model of formation-water flow, Alberta Basin, Canada: AAPGBulletin, v. 79, p. 1159-1178.
Bachu, S., (1997); Flow of Formation Waters, Aquifer Characteristics and their Relation to HydrocarbonAccumulations, Northern Alberta Basin: AAPG Bulletin, v. 81, p. 712-733.
Bachu, S., Sauveplane, C.M., Lytviak, A. T., Hitchon, B., (1987); Analysis of fluid and heat regimes insedimentary basins: techniques for use with large data bases: AAPG Bulletin, v. 71, p. 822-843
Bachu, S. and Underschultz, J. R., (1993); Hydrogeology of Formation Waters, Northeastern AlbertaBasin: AAPG Bulletin, v. 77, p. 1745-1768.
Barson, D., Bachu, S., and Esslinger, P., (2001); Flow systems in the Mannville Group in the SoutheastAthabasca area and implications for steam-assisted gravity drainage (SAGD) operations for in-situbitumen production: Bulletin of Canadian Petroleum Geology, v. 49, p. 376-392.
Bethke, C. M., (1985); A numerical model of compaction-driven groundwater flow and heat transfer andits application to the paleohydrology of intracratonic sedimentary basins: Journal of GeophysicalResearch, v. 90, p. 6817-6828.
Bethke, C. M., (1986); Hydrologic Constraints on Genesis of the Upper Mississippi Valley MineralDistrict from Illinois Basin Brines: Economic Geology, v. 81, p. 233-249.
Bethke, C. M. and Marshak, S., (1990); Brine migrations across North America - The plate tectonics ofgroundwater: Annual Reviews of Earth and Planetary Science, v. 18, p. 287-315.
Campbell, N., (1967); Tectonics, reefs and stratiform lead-zinc deposits of the Pine Point area, Canada:Economic Geology, Monograph 3, p. 59-70.
Cathles, L. M. and Smith, A. T., (1983); Thermal constraints on the formation of Mississippi Valley-typeLead-Zinc deposits and their implications for episodic basin dewatering and deposit genesis:Economic Geology, v. 78, p. 983-1002.
EUB/AGS Geo-Note 2002-21 (September 2003) •• 16

Colpron, M., Murphy, D.C. and Mortensen, J.K., (2000); Mid-Paleozoic tectonism in Yukon-Tananaterrane, northern Canadian Cordillera: record of intra-arc deormation. Proceedings of GeoCanada2000, Calgary, May 31 to June 4, Paper 368.
Combarnous, M. A. and Bories, S. A., (1975); Hydrothermal convection in saturated porous media:Advances in Hydrosciences, v. 10, p. 231-307.
Cushman, J. H., (1984); On unifying the concepts of scale, instrumentation, and stochastics in thedevelopment of multiphase transport theory: Water Resources Research, v. 20, p. 1668-1676.
Drivet, E. and Mountjoy, E. W., (1997); Dolomitization of the Leduc Formation (Upper Devonian),Southern Rimbey-Meadowbrook Reef Trend, Alberta: Journal of Sedimentary Research, v. 67, p. 411-423.
Duggan, J.P., Mountjoy, E.W. and Stasiuk, L., (2001); Fault-controlled dolomitization at Swan HillsSimonette oil field (Devonian), deep basin west-central Alberta, Canada. Sedimentology, v. 48, n.2,p. 301-323.
Earth Resources Mapping Pty. Ltd. (1998); ERMapper, Version 6.0. Perth, Australia.
Fermor, P.R. and I.W. Moffat, (1992); Tectonics and structure of the Western Canada foreland basin, inR.W. Macqueen, D.A Leckie, eds., Foreland Basins and Fold Belts, AAPG Memoir 55, AmericanAssociation of Petroleum Geologists, p. 81-105.
Freeze, R. A. and Cherry, J. A., (1979); Groundwater: New Jersey, Prentice-Hall Inc., 604 p.
Garven, G., (1985); The role of regional fluid flow in the genesis of the Pine Point deposit, westernCanada sedimentary basin: Economic Geology, v. 80, p. 307-324.
Garven, G. and Freeze, R. A., (1984); Theoretical analysis of the role of groundwater flow in the genesisof stratabound ore deposits. 1. Mathematical and numerical model: American Journal of Science, v.284, p. 1085-1124.
Garven, G., (1985); The Role of Regional Fluid Flow in the Genesis of the Pine Point Deposit, WesternCanada Sedimentary Basin: Economic Geology, v. 80, p. 307-324.
Garven, G., (1995); Continental-scale groundwater flow and geological processes: Annual ReviewsEarth and Planetary Science, v. 23, p. 89-117.
Ge, S. and Garven, G., (1992); Hydromechanical modeling of tectonically driven groundwater flow withapplication to the Arkoma foreland basin: Journal of Geophysical Research, v. 97, p. 9119-9144.
Green D.G., (1999); Dolomitization and deep burial of the Devonian of west-central Alberta deep basin:Kaybob South and Fox Creek (Swan Hills Formation) and Pine Creek fields (Leduc and WabamunFormations). Unpub. Ph.D. thesis, McGill University, Montreal, 267 p.
Gregg, J. M. and Shelton, K. L., (1989); Minor- and trace-element distributions in the BonneterreDolomite (Cambrian), southeast Missouri: Evidence for possible multiple-basin fluid sources andpathways during lead-zinc mineralization: Geological Society of America Bulletin, v. 101, p. 221-230.
EUB/AGS Geo-Note 2002-21 (September 2003) •• 17

Halbertsma, L.L. (1994); Devonian Wabamun Group of the Western Canada Sedimentary Basin. In:Geological Atlas of the Western Canada Sedimentary Basin, G.D. Mossop and I. Shetsen (comps.).Canadian Society of Petroleum Geologists and Alberta Research Council, Alberta GeologicalSurvey, Calgary, Alberta, p. 203-220.
Hanor, J. S., (1996); Controls on the solubilization of lead and zinc in basinal brines,In: Carbonate-Hosted Lead-Zinc Deposits, ed. D.F. Sangster, Special Publication Number 4, Society of EconomicGeologists, p. 483-500.
Hayes, B.J.R., Christopher, J.E., Rosenthal, L., Low, G., McKercher, B., Minken, D., Tremblay, Y.M.,and Fennel, J. (1994); Cretaceous Mannville Group of the Western Canada Sedimentary Basin. In:Geological Atlas of the Western Canada Sedimentary Basin, G.D. Mossop and I. Shetsen (comps.).Canadian Society of Petroleum Geologists and Alberta Research Council, Alberta GeologicalSurvey, Calgary, Alberta, p. 317-334.
Hitchon, B., (1993); Geochemisty of formation water, northern Alberta, Canada: their relation to thePine Point ore deposit. Alberta Geological Survey, Open File Report 1993-14, 93 p.
Hitchon, B., Sauveplane, C. M. Koster, E. H., and Lytviak, A. T., (1989); Hydrogeology of the SwanHills Area, Alberta: Evaluation for deep waste injection. Alberta Geological Survey, Bulletin No. 58,79 p.
Hitchon, B. and Brulotte, M., (1994); Culling criteria for standard formation water analyses: AppliedGeochemistry, v. 9, p. 637-645.
Hitchon, B., (1996);, Rapid evaluation of the hydrochemistry of a sedimentary basin using only standardformation water analyses: example from the Canadian portion of the Williston basin: AppliedGeochemistry, v. 11, p. 789-795.
Jackson, S. A. and Beales, F. W., (1967); An aspect of sedimentary basin evolution: the concentration ofMississippi Valley type ores during late stages of diagenesis: Bulletin of Canadian PetroleumGeology, v. 15, p. 383-433.
Kaufman, J., Hanson, G. N., and Meyers, W. J., (1991); Dolomitization of the Devonian Swan Hillsformation, Rosevear field, Alberta, Canada: Sedimentology, v. 38, p. 41-66.
Leach, D. L. and Sangster, D. F., (1993); Mississippi Valley-type Lead-Zinc Deposits: eds., Kirkham, R.V., Sinclair, W. D., Thorpe, R. I., Duke, J. M.; Mineral Deposit Modelling, GAC Special Paper 40,Geological Association of Canada, p. 289-314.
Leach, D.L.,Bradley, D., Lewchuk, M.T., Symons, D.T.A. and de Marsily G., (2001); Mississippi Valley-type lead-zinc deposits through geological time: implications from recent age-dating research.Mineralium Deposita, v. 36, p. 711-740.
Lonnee, J.S. and Al-Aasm, I.S., (2000); Dolomitization and fluid evolution in the Middle DevonianSulphur Point Formation, Rainbow South Field, Alberta: petrographic and geochemical evidence.Bulletin of Canadian Petroleum Geology, v. 48, p. 262-283.
EUB/AGS Geo-Note 2002-21 (September 2003) •• 18

Machel, H. G. and Mountjoy, E. W., (1987); General constraints on the extensive pervasivedolomitization and their application to the Devonian carbonates of Western Canada: Bulletin ofCanadian Petroleum Geology, v. 35, p. 143-158.
Machel, H.G. and Anderson, J.H., (1989); Pervasive subsurface dolomitization of the Nisku Formationin Central Alberta. Journal of Sedimentary Petrology, v. 59, p. 891-911.
Machel, H. G. and Cavell, P. A., (1999);, Indications for tectonically induced fluid flow into the RockyMountain foreland basin - with implications for petroleum exploration: Bulletin of CanadianPetroleum Geology, v. 47, p. 510-533.
Machel, H.G., (2001); Bacterial and thermochemical sulfate reduction in diagenetic settings – old andnew insights, Sedimentary Geology, v. 140, p. 143-175.
Meijer Drees, N.C. (1994); Devonian Elk Point Group of the Western Canada Sedimentary Basin. In:Geological Atlas of the Western Canada Sedimentary Basin, G.D. Mossop and I. Shetsen (comps.).Canadian Society of Petroleum Geologists and Alberta Research Council, Alberta GeologicalSurvey, Calgary, Alberta, p. 129-147.
Morrow, D., (1998); Regional subsurface dolomitization: models and constraints: Geoscience Canada, v.25, p. 57-70.
Mossop, G. D. and Shetsen, I., (compilers) (1994); Geological Atlas of the Western Canada SedimentaryBasin: Calgary, AB, Canadian Society of Petroleum Geologists and Alberta Research Council, 510 p.
Mountjoy E.W., Machel, H.G., Green, D., Duggan, J. and A.E. Williams-Jones, (1999); Devonian matrixdolomites and deep burial carbonate cements: A comparison between the Rimbey-Meadowbrookreef trend and the deep basin of west-central Alberta. Bulletin of Canadian Petroleum Geology, v.42, no.4, p. 487-509
Mountjoy, E. W., Machel, H. G., Green, D., Duggan, J., and William-Jones, E., (1999); Devonian matrixdolomites and deep burial carbonate cements: a comparison between the Rimbey-Meadowbrookreef trend and the deep basin of west-central Alberta: Bulletin of Canadian Petroleum Geology, v.47, p. 487-509.
Mountjoy, E., Whittaker, S., Williams-Jones, A., Qing, H., Drivet, E., and Marquez, X., (1997); Variablefluid and heat flow regimes in three Devonian dolomite conduit systems, Western CanadaSedimentary Basin: isotopic and fluid inclusion evidence/constraints, In: Basin-Wide DiageneticPatterns: Integrated Petrologic, Geochemical and Hydrologic Considerations, Society ofSedimentary Geology, SEPM No. 57, p. 119-137.
Mountjoy, E. W. and Amthor, J. E., (1994); Has burial dolomitization come of age? Some answers fromthe Western Canada Sedimentary Basin, In: Dolomites: A volume in honour of Dolomieu, ed.Purser, B., Tucker, M., Zenger, D.; Boston, Mass., Blackwell Scientific Publications, p. 203-229.
Nesbitt, B. E. and Muehlenbachs, K., (1994); Paleohydrogeology of the Canadian Rockies and origins ofbrines, Pb-Zn deposits and dolomitization in the Western Canada Sedimentary basin: Geology, v.22, p. 243-246.
EUB/AGS Geo-Note 2002-21 (September 2003) •• 19

Nesbitt, B. E., (1995); Crustal paleo-hydrogeological mapping as a tool in exploration for mineraldeposits: Journal of Geochemical Exploration, v. 54, p. 153-165.
Nesbitt, B. E. and Prochaska, W., (1998); Solute chemistry of inclusion fluids from sparry dolomites andmagnesite in Middle Cambrian carbonate rocks of the southern Canadian Rocky Mountains:Canadian Journal of Earth Sciences, v. 35, p. 546-555.
Neuzil, C. E. and Pollock, D. W., (1983); Erosional unloading and fluid pressures in hydraulically“tight” rocks: Journal of Geology, v. 91, p. 179-193.
Oldale, H.S. and Munday, R.J. (1994); Devonian Beaverhill Lake Group of the Western CanadaSedimentary Basin. In: Geological Atlas of the Western Canada Sedimentary Basin, G.D. Mossopand I. Shetsen (comps.). Canadian Society of Petroleum Geologists and Alberta Research Council,Alberta Geological Survey, Calgary, Alberta, p. 149-164.
Oliver, J., (1986); Fluids expelled tectonically from orogenic belts: their role in hydrocarbon migrationand other geologic phenomena: Geology, v. 14, p. 99-102.
Pana, D., Waters, E.J. and Grobe, M., (2001); GIS Compilation of Structural Elements in NorthernAlberta, Release 1.0; Alberta Energy and Utilities Board, Alberta Geological Survey, EarthSciences Report 2001-01.
Pana, D., Burwash, R., Zerbe, T., Adams, J. and Amer, Z., (2002); Alberta Basement Database (inpreparation).
Parks, K. P. and Tóth, J., (1995); Field evidence for erosion-induced underpressuring in UpperCretaceous and Tertiary strata, west central Alberta, Canada: Bulletin of Canadian PetroleumGeology, v. 43, p. 281-292.
Person, M. and Garven, G., (1992); Hydrologic constraints on petroleum generation within continentalrift basins: Theory and application to the Rhine graben: AAPG Bulletin, v. 76, p. 468-488.
Porter, J. W., Price, R. A., and McCrossan, R. G., (1982); The Western Canada Sedimentary basin: Phil.Trans. Roy. Soc. London, v. A305, p. 42-48.
Qing, H. and Mountjoy, E. W., (1992); Large-scale fluid flow in the Middle Devonian Presqu'ile barrier,Western Canada Sedimentary Basin: Geology, v. 20, p. 903-906.
Richards, B.C., Barclay, J.E., Bryan, D., Hartling, A., Henderson, C.M., Hinds, R.C. (1994);Carboniferous strata of the Western Canada Sedimentary Basin. In: Geological Atlas of theWestern Canada Sedimentary Basin, G.D. Mossop and I. Shetsen (comps.). Canadian Society ofPetroleum Geologists and Alberta Research Council, Alberta Geological Survey, Calgary, Alberta,p. 221-250.
Root, K., (1993); Devonian and Mississippian thrust belt and foreland basin development in westernCanada: implications for tectonics and diagenesis in the Plains: UBC, Lithoprobe secretariat, p. 92-95.
EUB/AGS Geo-Note 2002-21 (September 2003) •• 20

Rostron, B. J. and Tóth, J., (1997); Cross-formational fluid flow and the generation of a saline plume offormation waters in the Mannville Group, west-central Alberta: CSPG Memoir 18, p. 169-190.
Sangster, D. F., (1990); Mississippi Valley-type and SEDEX lead-zinc deposits: a comparativeexamination: Transactions of the Institution of Mining and Metallurgy, Section B: Applied EarthScience, v. 99, p. B21-B42.
Savard, M. M. and Kontak, D. J., (1998); δ13C-δ18O-87Sr/86Sr covariations in ore-stage calcites at andaround the Gays River Zn-Pb deposit (Nova Scotia, Canada) - Evidence for fluid mixing.Economic Geology, v. 93, p. 818-833.
Shields, M. J. and Brady, P. V., (1995); Mass balance and fluid flow constraints on regional-scaledolomitization, late Devonian, Western Canada Sedimentary Basin: Bulletin of CanadianPetroleum Geology, v. 43, p. 371-392.
Simpson, G.P., (1999); Sulfate reduction and fluid chemistry of the Devonian Leduc and Niskuformations in south-central Alberta, Ph.D. Thesis, Department of Geology and Geophysics,University of Calgary, 228 p.
Sudicky, E.A., (1986); A natural gradient experiment on solute transport in a sand aquifer: spatialvariability of hydraulic conductivity and its role in the dispersion process. Water ResourcesResearch, v. 22, n. 13, p. 2069-2082.
Sverjensky, D. A., (1984); Oil field brines as ore-forming solutions: Economic Geology, v. 79, p. 23-37.
Switzer, S.B., Holland, W.G. Christie, D.S., Graf, G.C., Hedinger, A.D., McAuley, R.J., Wierzbicki,R.A., and Packard, J.J. (1994); Devonian Woodbend-Winterburn strata of the Western CanadaSedimentary Basin. In: Geological Atlas of the Western Canada Sedimentary Basin, G.D. Mossopand I. Shetsen (comps.). Canadian Society of Petroleum Geologists and Alberta Research Council,Alberta Geological Survey, Calgary, Alberta, p. 165-202.
Tóth, J., (1978); Gravity-induced cross-formational flow of formation fluids, Red Earth region, Alberta,Canada: analysis, patterns and evolution: Water Resources Research, v. 14, p. 805-843.
Tóth, J. and Corbet, T. F., (1986); Post-Paleocene evolution of regional groundwater flow-systems andtheir relation to petroleum accumulations, Taber area, southern Alberta, Canada: Bulletin ofCanadian Petroleum Geology, v. 34 , p. 339-363.
Tóth, J. and Millar, R. F., (1983); Possible effects of erosional changes of the topographic relief on porepressures at depth: Water Resources Research, v. 19, p. 1585-1597.
Turner , A. and McPhee, D., (1994); Analysis of Paleozoic core data for the evaluation of potential Pb-Zn mineralization in northern Alberta; Canada-Alberta Partnership on Mineral Development,Project M93-04-032, 50 p.
Willett, S. D., Issler, D. R., Beaumont, C., Donelick, R. A., and Girst, A. M., (1997); Inverse modelingof annealing of fission tracks in apatite 2: Application to the thermal history of the Peace RiverArch region, Western Canada Sedimentary Basin: American Journal of Science, p. 970-1011.
EUB/AGS Geo-Note 2002-21 (September 2003) •• 21

Appendix A – Surface Representation Grid Images for the Northeastern andNorthwestern MVT Study Areas, Albertaby D. Roy Eccles
1 Introduction
Devonian rocks are only known to crop out in the northeastern part of the plains of Alberta and inthrusted and folded belts associated with the Rocky Mountains. In northeastern Alberta, Devonian rocksoccur between Cretaceous rocks, which cover much of north-central and northwestern Alberta, and thePrecambrian Shield, with its exposure contained to the most northeastern corner of the province. Thisstudy excludes the Wood Buffalo National Park, where current regulations prohibit development, andthus focuses on two areas in northern Alberta:
1) northeastern Alberta bounded by latitudes 56.5º to 58ºN and longitudes 110º to 112ºW; and
2) northwestern Alberta bounded by latitudes 58º to 60ºN and longitudes 114ºN to 120ºW.
In northeastern Alberta, fossiliferous Devonian limestone and minor dolomite rocks are exposed alongthe banks of the Clearwater and Athabasca Rivers and their associated tributaries (e.g., Christina,MacKay and Muskeg Rivers). Devonian rocks in the northwestern study area are completely overlain byCretaceous rocks and surficial deposits. Isopach maps, which portray the depth to the Devonian surface,shows that the Cretaceous and glacial cover varies between 0 m and 686 m in northeastern Alberta(Figure A.1) and between 15 m and 1,778 m in northwestern Alberta (Figure A.2). From known welllogs, 74% of the northeastern study area and only 13% of the northwestern study area contain wells thatpenetrate Devonian rocks at a depth of <250 m from the surface.
As such, modellers are forced to rely on the well log data to provide knowledge about the subsurfacephysiography of the Devonian rocks. This section presents the surface representation grid images forindividual formations, based on the available data, for northeastern and northwestern Alberta. Theimages are then used to model subsurface units in an attempt to show any trends in the data that may beattributed to structural deformation or potential pathways for the migration of metal-bearing fluids.These interpretations are presented and discussed in Section 3.3.3.
2 Surface Representation Maps
2.1 Formation Selection
Well data from International Datashare Corporation (iDc) were used to model the subsurface in thecurrent study areas. Due to time limitations, the over 85 000 formation picks used as part of this studywere not verified as being ‘true picks’. In contrast, this section recognizes that the use of raw,uncontrolled data may be useful for tectonic modeling in comparison to a ‘culled dataset’, in which allabnormalities are discarded. Where possible, controlled picks were used, such as Alberta GeologicalSurvey picks on the top of the Waterways Group in the Fort McMurray/oil sands area. In addition to theDevonian picks, surface representation maps for the Precambrian basement and Cretaceous formations(e.g., Bluesky Formation) were used to expand our model vertically through the entire basin.
Tables A.1 and A.2 show the number of picks by formation that are recorded in the iDc database fromwells in the northeastern and northwestern study areas, respectively. The surface representation mapswere somewhat limited by the abundance of formation picks, particularly in the northeastern map area.Nevertheless, surface representation images were created for formations where there were >900 picks
EUB/AGS Geo-Note 2002-21 (September 2003) •• 22

Figure A.1. Isopach map showing the depth to the Devonian surface in northeastern Alberta.
EUB/AGS Geo-Note 2002-21 (September 2003) •• 23

EUB/AGS Geo-Note 2002-21 (September 2003) •• 24
Figure A.2. Isopach map showing the depth to the Devonian surface in northwestern Alberta.
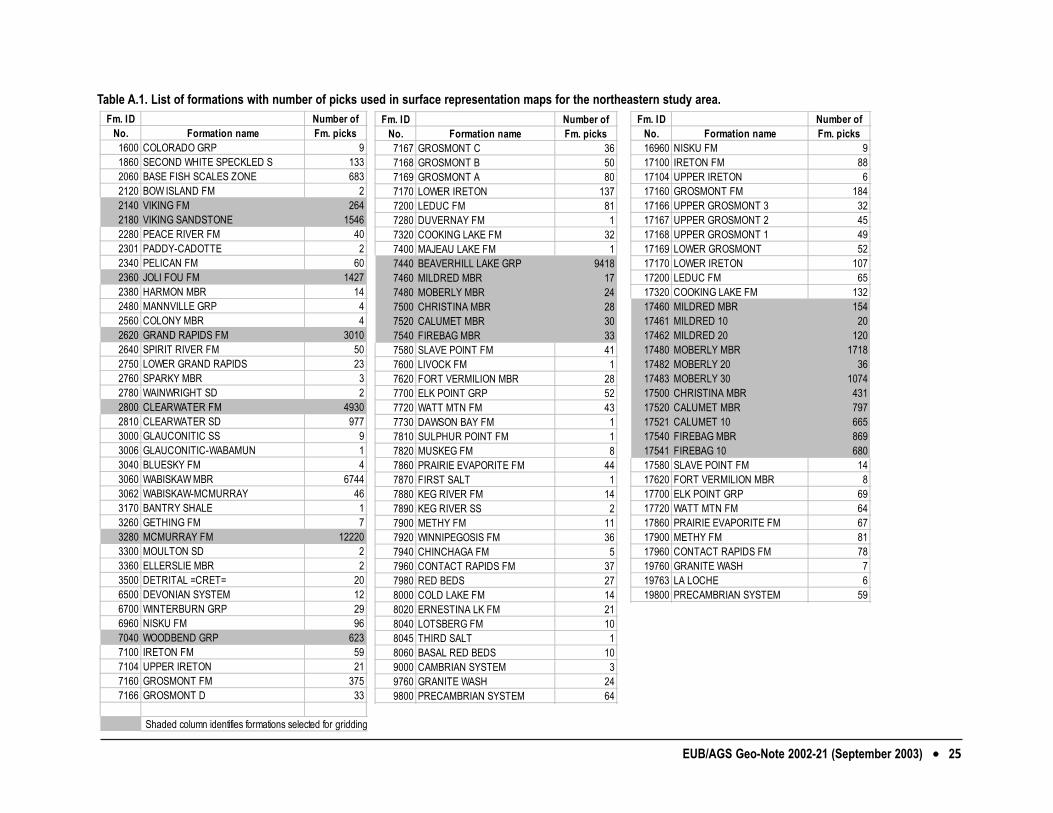
Fm. ID Number ofNo. Formation name Fm. picks
1600 COLORADO GRP 91860 SECOND WHITE SPECKLED S 1332060 BASE FISH SCALES ZONE 6832120 BOW ISLAND FM 22140 VIKING FM 2642180 VIKING SANDSTONE 15462280 PEACE RIVER FM 402301 PADDY-CADOTTE 22340 PELICAN FM 602360 JOLI FOU FM 14272380 HARMON MBR 142480 MANNVILLE GRP 42560 COLONY MBR 42620 GRAND RAPIDS FM 30102640 SPIRIT RIVER FM 502750 LOWER GRAND RAPIDS 232760 SPARKY MBR 32780 WAINWRIGHT SD 22800 CLEARWATER FM 49302810 CLEARWATER SD 9773000 GLAUCONITIC SS 93006 GLAUCONITIC-WABAMUN 13040 BLUESKY FM 43060 WABISKAW MBR 67443062 WABISKAW-MCMURRAY 463170 BANTRY SHALE 13260 GETHING FM 73280 MCMURRAY FM 122203300 MOULTON SD 23360 ELLERSLIE MBR 23500 DETRITAL =CRET= 206500 DEVONIAN SYSTEM 126700 WINTERBURN GRP 296960 NISKU FM 967040 WOODBEND GRP 6237100 IRETON FM 597104 UPPER IRETON 217160 GROSMONT FM 3757166 GROSMONT D 33
Shaded column identifies formations selected for gridding
Fm. ID Number ofNo. Formation name Fm. picks16960 NISKU FM 917100 IRETON FM 8817104 UPPER IRETON 617160 GROSMONT FM 18417166 UPPER GROSMONT 3 3217167 UPPER GROSMONT 2 4517168 UPPER GROSMONT 1 4917169 LOWER GROSMONT 5217170 LOWER IRETON 10717200 LEDUC FM 6517320 COOKING LAKE FM 13217460 MILDRED MBR 15417461 MILDRED 10 2017462 MILDRED 20 12017480 MOBERLY MBR 171817482 MOBERLY 20 3617483 MOBERLY 30 107417500 CHRISTINA MBR 43117520 CALUMET MBR 79717521 CALUMET 10 66517540 FIREBAG MBR 86917541 FIREBAG 10 68017580 SLAVE POINT FM 1417620 FORT VERMILION MBR 817700 ELK POINT GRP 6917720 WATT MTN FM 6417860 PRAIRIE EVAPORITE FM 6717900 METHY FM 8117960 CONTACT RAPIDS FM 7819760 GRANITE WASH 719763 LA LOCHE 619800 PRECAMBRIAN SYSTEM 59
Fm. ID Number ofNo. Formation name Fm. picks
7167 GROSMONT C 367168 GROSMONT B 507169 GROSMONT A 807170 LOWER IRETON 1377200 LEDUC FM 817280 DUVERNAY FM 17320 COOKING LAKE FM 327400 MAJEAU LAKE FM 17440 BEAVERHILL LAKE GRP 94187460 MILDRED MBR 177480 MOBERLY MBR 247500 CHRISTINA MBR 287520 CALUMET MBR 307540 FIREBAG MBR 337580 SLAVE POINT FM 417600 LIVOCK FM 17620 FORT VERMILION MBR 287700 ELK POINT GRP 527720 WATT MTN FM 437730 DAWSON BAY FM 17810 SULPHUR POINT FM 17820 MUSKEG FM 87860 PRAIRIE EVAPORITE FM 447870 FIRST SALT 17880 KEG RIVER FM 147890 KEG RIVER SS 27900 METHY FM 117920 WINNIPEGOSIS FM 367940 CHINCHAGA FM 57960 CONTACT RAPIDS FM 377980 RED BEDS 278000 COLD LAKE FM 148020 ERNESTINA LK FM 218040 LOTSBERG FM 108045 THIRD SALT 18060 BASAL RED BEDS 109000 CAMBRIAN SYSTEM 39760 GRANITE WASH 249800 PRECAMBRIAN SYSTEM 64
Table A.1. List of formations with number of picks used in surface representation maps for the northeastern study area.
EUB/AGS Geo-Note 2002-21 (September 2003) •• 25
EUB/AGS Geo-Note 2002-21 (September 2003) •• 26
No. Formation name Fm. picks1920 DUNVEGAN FM 51940 FORT ST JOHN GRP 11960 SHAFTESBURY FM 12060 BASE FISH SCALES ZONE 672640 SPIRIT RIVER FM 32800 CLEARWATER FM 12900 WILRICH MBR 13000 GLAUCONITIC SS 123040 BLUESKY FM 19463060 WABISKAW MBR 803260 GETHING FM 3063280 MCMURRAY FM 13500 DETRITAL =CRET= 83508 DETRITAL-DEBOLT 96000 MISSISSIPPIAN SYSTEM 66120 DEBOLT FM 406220 SALTER MBR 16380 ELKTON MBR 16400 SHUNDA FM 1286420 PEKISKO FM 2336440 BANFF FM 28506460 BAKKEN FM 46480 EXSHAW FM 406500 DEVONIAN SYSTEM 66580 WABAMUN GRP 38436600 BIG VALLEY FM 16612 UPPER KOTCHO 26614 MIDDLE KOTCHO SHALE 26616 LOWER KOTCHO 26650 TETCHO FM 26700 WINTERBURN GRP 936720 ALEXO FM 26740 TROUT RIVER FM 31306780 GRAMINIA FM 16810 WINTERBURN SHALE 66820 KAKISA FM 29316840 RED KNIFE FM 18656860 CALMAR FM 486880 FAIRHOLME GRP 16960 NISKU FM 267020 JEAN MARIE FM 36877040 WOODBEND GRP 627100 IRETON FM 667120 FORT SIMPSON FM 37207130 TATHLINA FM 8
Shaded column identifies formations selected for gridding
Table A.2. List of formations with number of picks used in surface representation maps for the northwestern study area.
No. Formation name Fm. picks7160 GROSMONT FM 477165 TWIN FALLS FM 197170 LOWER IRETON 337220 HAY RIVER FM 327240 HAY RIVER LS 57320 COOKING LAKE FM 27340 PERDRIX FM 17400 MAJEAU LAKE FM 37430 MUSKWA FM 33557440 BEAVERHILL LAKE GRP 36637460 MILDRED MBR 27500 CHRISTINA MBR 57520 CALUMET MBR 157560 SWAN HILLS MBR 147580 SLAVE POINT FM 42337620 FORT VERMILION MBR 6917700 ELK POINT GRP 287720 WATT MTN FM 41727780 GILWOOD MBR 47800 MANNING SD 17810 SULPHUR POINT FM 39837815 PRESQUILE FM 357820 MUSKEG FM 41067825 HORN RIVER FM 17830 PINE POINT FM 127850 ZAMA MBR 6687855 ZAMA & KEG RIVER 4687860 PRAIRIE EVAPORITE FM 17865 BLACK CREEK MBR 767870 FIRST SALT 117880 KEG RIVER FM 33787885 RAINBOW MBR 37890 KEG RIVER SS 87930 LOWER KEG RIVER 9967940 CHINCHAGA FM 12497960 CONTACT RAPIDS FM 17980 RED BEDS 2648000 COLD LAKE FM 2048010 SECOND SALT 18020 ERNESTINA LK FM 1678040 LOTSBERG FM 38060 BASAL RED BEDS 1259000 CAMBRIAN SYSTEM 19760 GRANITE WASH 579800 PRECAMBRIAN SYSTEM 427

and/or where formation lithologies define clear marker units within the basin. For example, the WattMountain shale defines a clear lithological break between the overlying Fort Vermillion and underlyingPrairie evaporites.
Formation surfaces used in the northeastern Alberta study area are highlighted on the table of formationslegend for the area (Table A.3), and include• Figure A.3. McMurray Formation
• Figure A.4. Waterways Group from IDC picks
• Figure A.5. Waterways Group from AGS picks
Formation surfaces used in the northwestern Alberta study area are highlighted on the table offormations legend for the area (Table A.4), and include• Figure A.6. Bluesky Formation (equivalent to bullhead Fm. Top in Figure 2)
• Figure A.7. Banff Formation
• Figure A.8. Wabamun Group
• Figure A.9. Winterburn Group
• Figure A.10. Woodbend Group
• Figure A.11. Beaverhill Lake Group (Waterways Group)
• Figure A.12. Slave Point Formation
• Figure A.13. Watt Mountain Formation
• Figure A.14. Sulphur Point Formation
• Figure A.15. Muskeg Formation
• Figure A.16. Keg River Formation
• Figure A.17. Lower Keg River Formation
• Figure A.18. Chinchaga Formation
• Figure A.19. Precambrian basement
Because there is better subsurface data in the northwestern Alberta area, a number of isopach maps wereincluded to portray the thickness between major formation horizons. These figures are also highlightedon the table of formations legend for the area (Table A.4), and include• Figure A.20. Wabamun Group top to Winterburn Group top
• Figure A.21. Winterburn Group top to Woodbend Group top
• Figure A.22. Woodbend Group top to Beaverhill Lake Group (Waterways Group) top
• Figure A.23. Waterways Group top to Slave Point Formation top
• Figure A.24. Slave Point Formation top to Watt Mountain Formation top
• Figure A.25. Watt Mountain Formation top to Sulphur Point Formation top
• Figure A.26. Sulphur Point Formation top to Chinchaga Formation top
• Figure A.27. Keg River Formation top to Lower Keg River Formation top
EUB/AGS Geo-Note 2002-21 (September 2003) •• 27
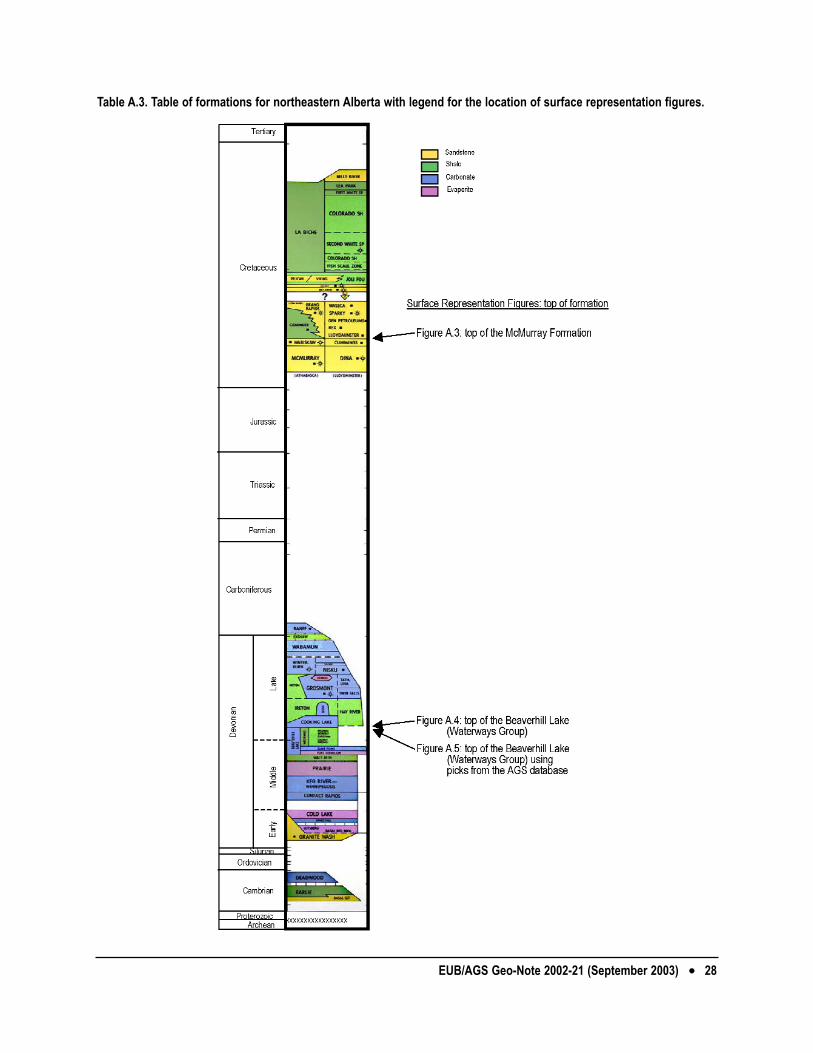
Table A.3. Table of formations for northeastern Alberta with legend for the location of surface representation figures.
EUB/AGS Geo-Note 2002-21 (September 2003) •• 28

EUB/AGS Geo-Note 2002-21 (September 2003) •• 29
Figure A.3. Surface representation maps for the tip of the McMurray Formation. A) surface grid map with the location of wells used to create the minimum curvature grid; B)shaded-relief surface grid map with sun-angle from the north; C) shaded-relief surface grid map using only the well data from the detailed area outlined in A; and D) tilted 3D-view of the image in C with view from the south; scale 1:1 000 000.

EUB/AGS Geo-Note 2002-21 (September 2003) •• 30
Figure A.4. Surface representation maps for the top of the Waterways Group using the IDC database. A) surface grid map with the location of wells used to create the minimumcurvature grid with subcrop paleogeology from Hayes et al. (1994); B) shaded-relief surface grid map with sun-angle from the north; C) shaded-relief surface grid map using onlythe well data from the detailed area outlined in A; and d) tilted 3D-view of the image in C with view from the south; scale 1:1000 000.

EUB/AGS Geo-Note 2002-21 (September 2003) •• 31
Figure A.5. Surface representation maps for the top of the Waterways Group using the AGS database. A) surface grid map with the location of wells used to create the minimumcurvature grid with subcrop paleogeology from Hayes et al. (1994); B) shaded-relief surface grid map with sun-angle from the north; C) shaded-relief surface grid map using onlythe well data from the detailed area outlined in A; and D) tilted 3D-view of the image in C with view from the south; scale 1:100 000.
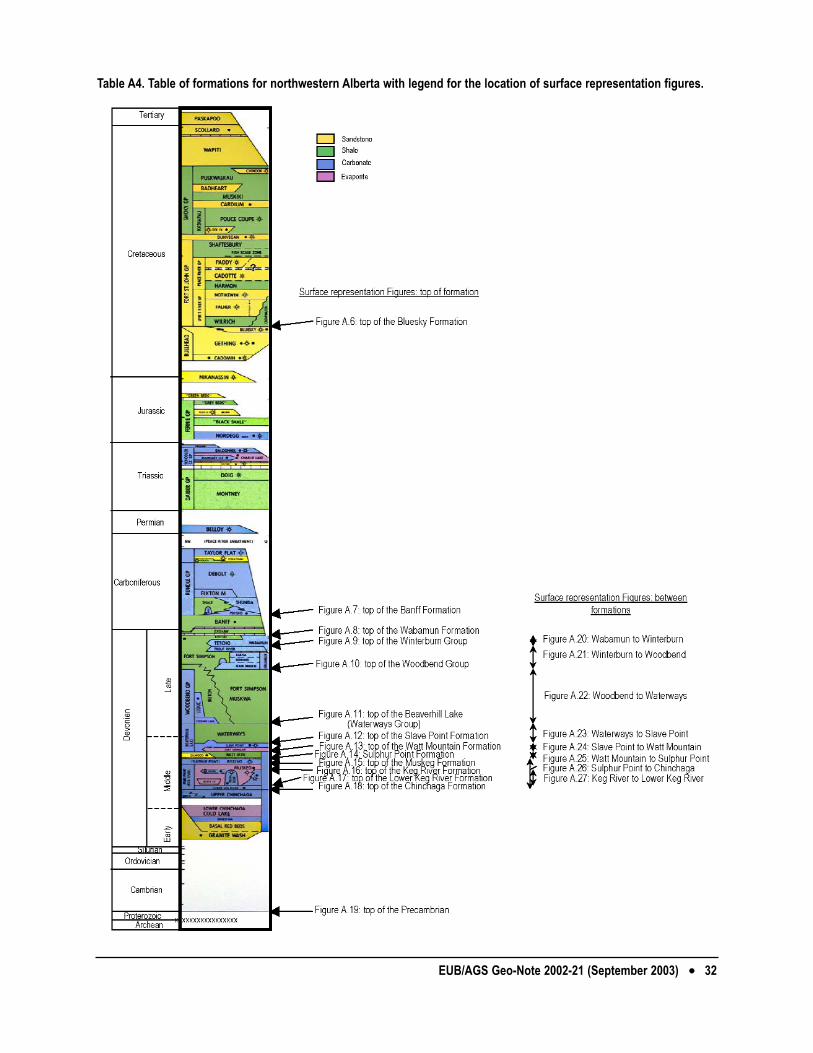
Table A4. Table of formations for northwestern Alberta with legend for the location of surface representation figures.
EUB/AGS Geo-Note 2002-21 (September 2003) •• 32
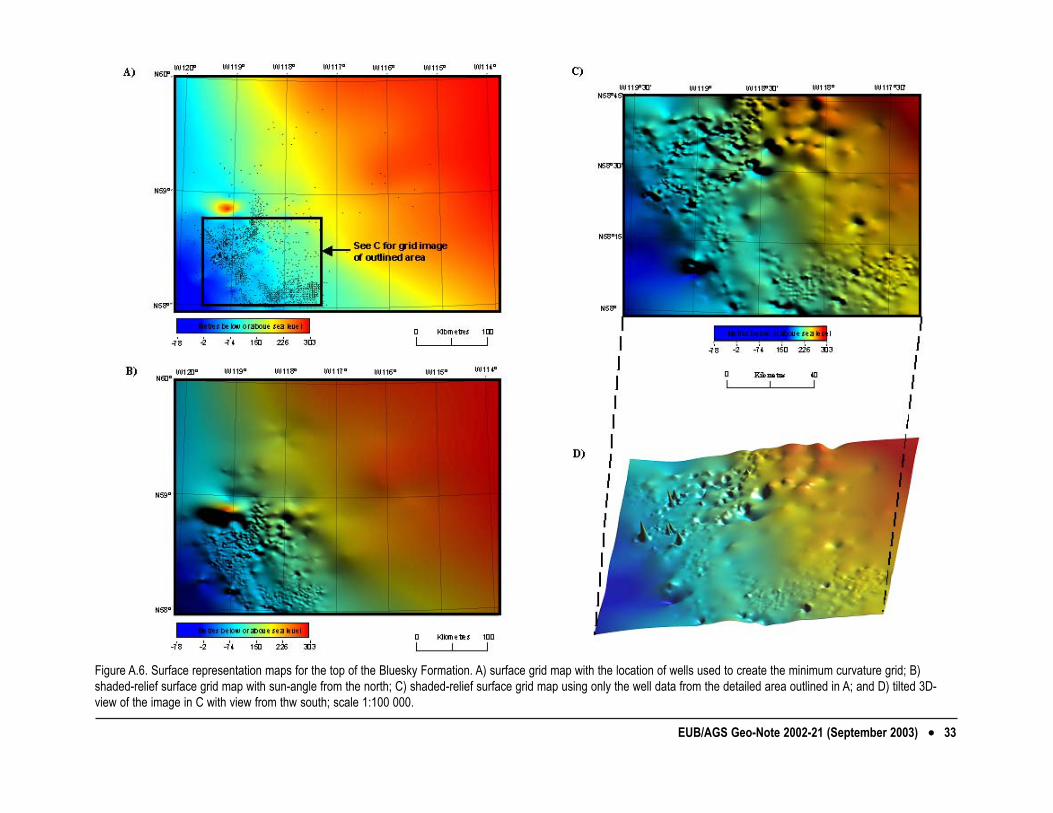
EUB/AGS Geo-Note 2002-21 (September 2003) •• 33
Figure A.6. Surface representation maps for the top of the Bluesky Formation. A) surface grid map with the location of wells used to create the minimum curvature grid; B)shaded-relief surface grid map with sun-angle from the north; C) shaded-relief surface grid map using only the well data from the detailed area outlined in A; and D) tilted 3D-view of the image in C with view from thw south; scale 1:100 000.
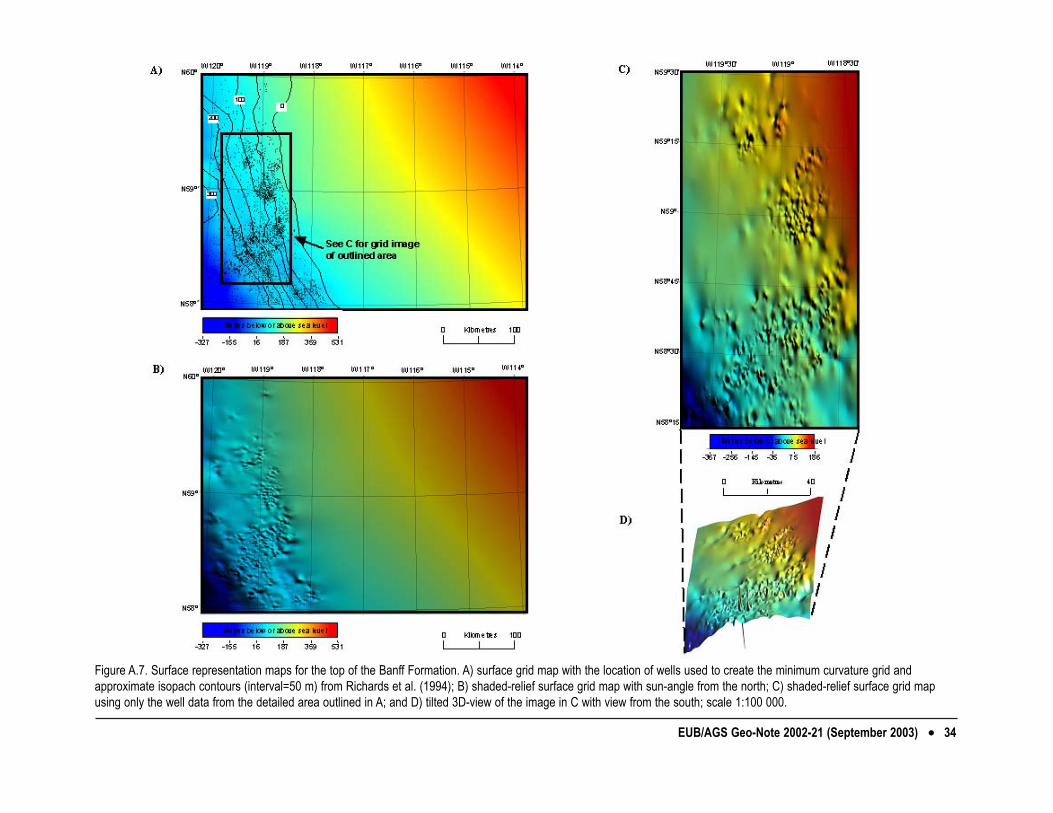
EUB/AGS Geo-Note 2002-21 (September 2003) •• 34
Figure A.7. Surface representation maps for the top of the Banff Formation. A) surface grid map with the location of wells used to create the minimum curvature grid andapproximate isopach contours (interval=50 m) from Richards et al. (1994); B) shaded-relief surface grid map with sun-angle from the north; C) shaded-relief surface grid mapusing only the well data from the detailed area outlined in A; and D) tilted 3D-view of the image in C with view from the south; scale 1:100 000.

EUB/AGS Geo-Note 2002-21 (September 2003) •• 35
Figure A.8. Surface representation maps for the top of the Wabamun Group. A) surface grid map with the location of wells used to create the minimum curvature grid andapproximate isopach contours (interval=50 m) from Halbertsma (1994); B) shaded-releif surface grid map with sun-angle from the north; C) shaded-relief surface grid map usingonly the well data from the detailed area outlined in A; and D) tilted 3D-view of the image in C with view from the south; scale 1:100 000.

EUB/AGS Geo-Note 2002-21 (September 2003) •• 36
Figure A.9. Surface representation maps for the top of the Winterburn Group. A) surface grid map with the location of wells used to create the minimum curvature grid andapproximate isopach contours (interval=50 m) for the combined Woodbend and Winterburn intervals from Switzer et al. (1994); B) shaded-relief surface grid map with sun-anglefrom the north; C) shade-relief surface grid map using only the well data from the detailed area outlined in A; and D) tilted 3D-view of the image in C with view from the south;scale 1:100 000.
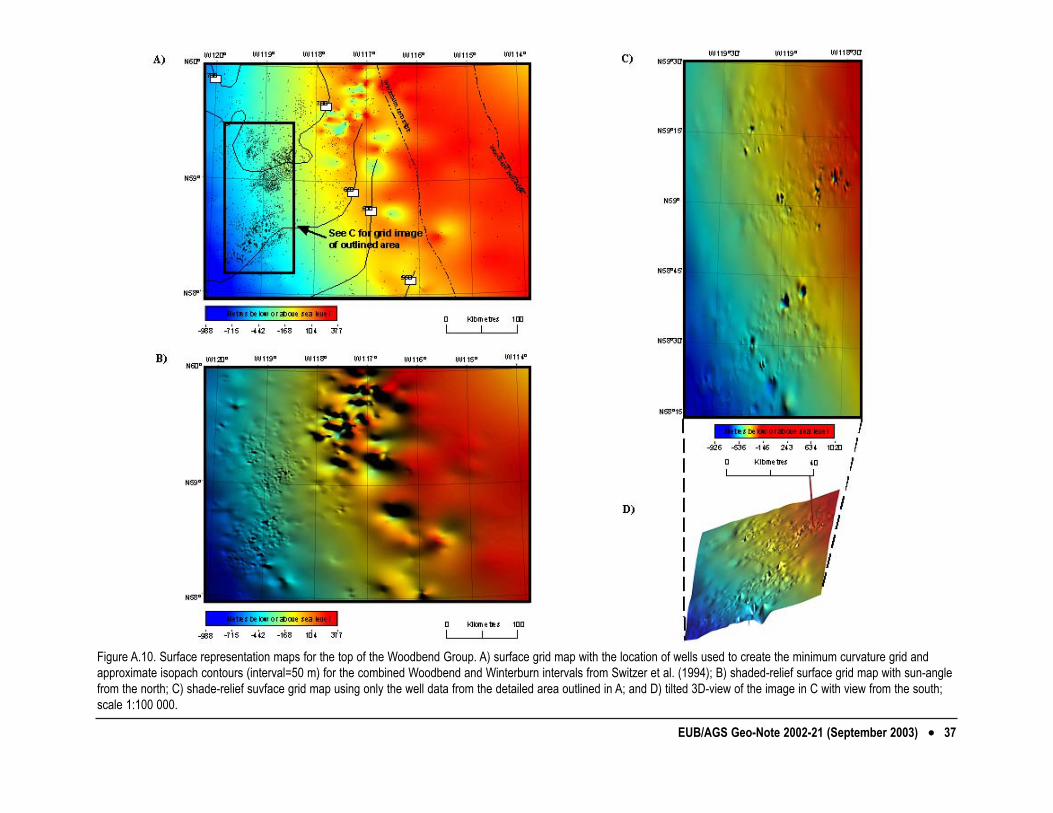
EUB/AGS Geo-Note 2002-21 (September 2003) •• 37
Figure A.10. Surface representation maps for the top of the Woodbend Group. A) surface grid map with the location of wells used to create the minimum curvature grid andapproximate isopach contours (interval=50 m) for the combined Woodbend and Winterburn intervals from Switzer et al. (1994); B) shaded-relief surface grid map with sun-anglefrom the north; C) shade-relief suvface grid map using only the well data from the detailed area outlined in A; and D) tilted 3D-view of the image in C with view from the south;scale 1:100 000.
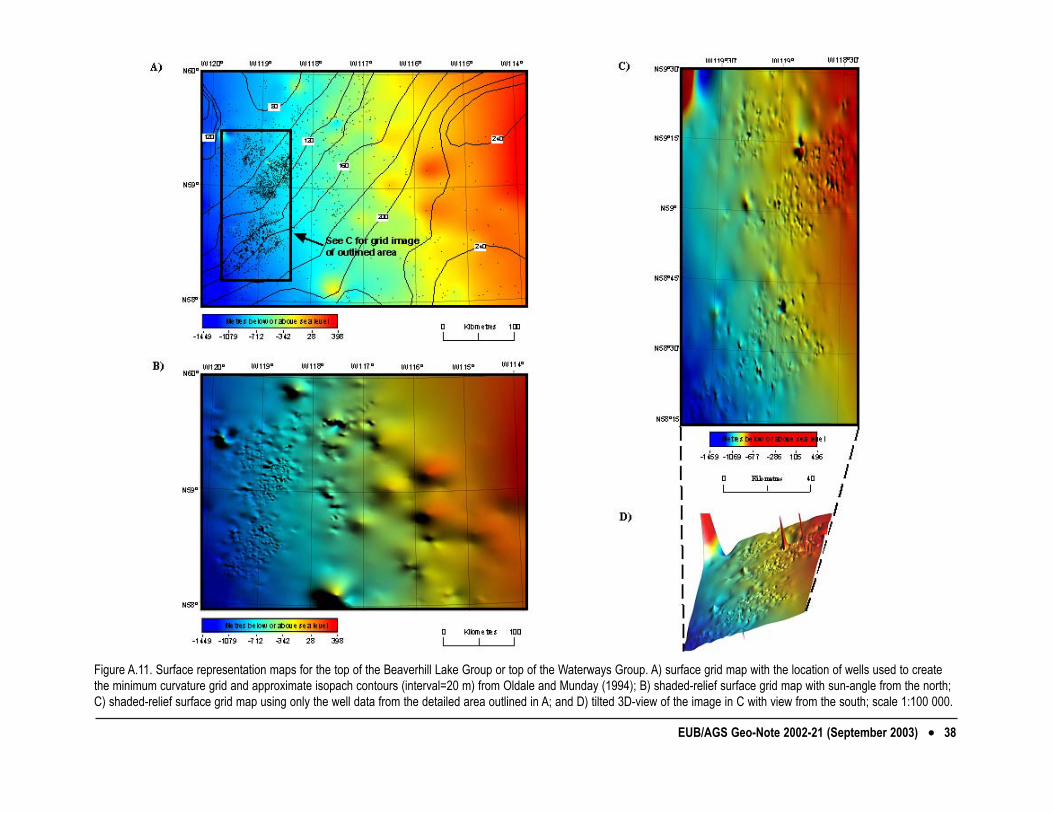
EUB/AGS Geo-Note 2002-21 (September 2003) •• 38
Figure A.11. Surface representation maps for the top of the Beaverhill Lake Group or top of the Waterways Group. A) surface grid map with the location of wells used to createthe minimum curvature grid and approximate isopach contours (interval=20 m) from Oldale and Munday (1994); B) shaded-relief surface grid map with sun-angle from the north;C) shaded-relief surface grid map using only the well data from the detailed area outlined in A; and D) tilted 3D-view of the image in C with view from the south; scale 1:100 000.
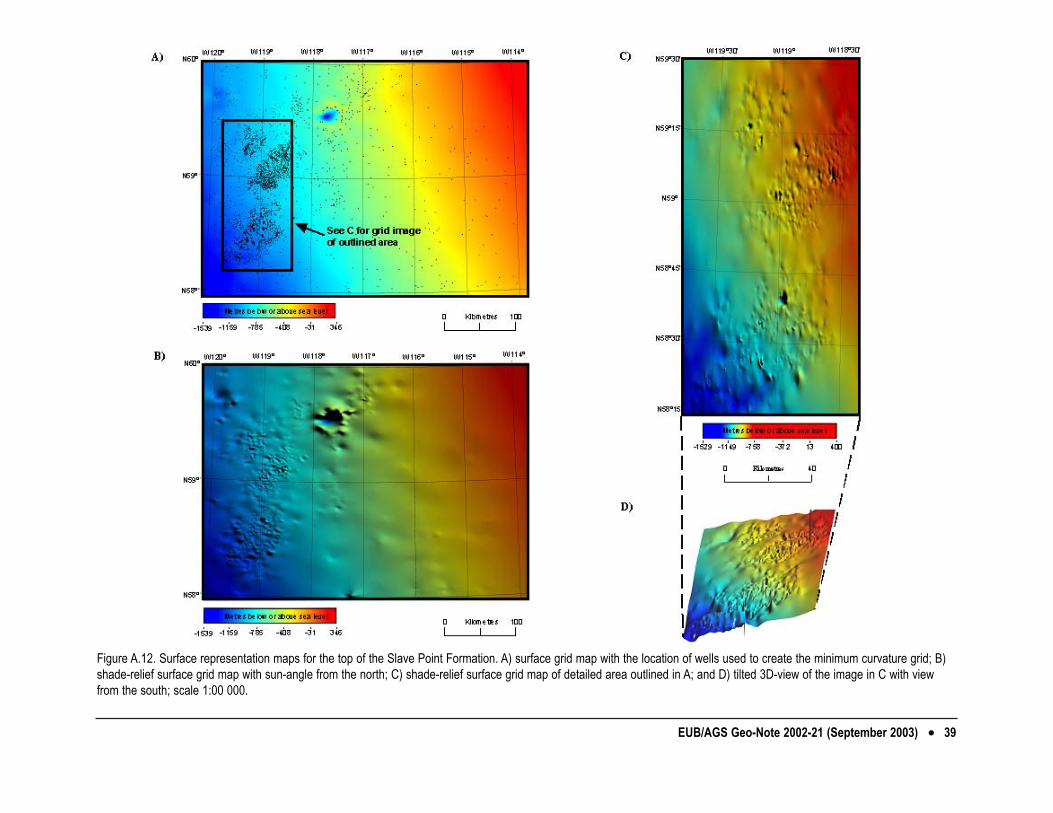
EUB/AGS Geo-Note 2002-21 (September 2003) •• 39
Figure A.12. Surface representation maps for the top of the Slave Point Formation. A) surface grid map with the location of wells used to create the minimum curvature grid; B)shade-relief surface grid map with sun-angle from the north; C) shade-relief surface grid map of detailed area outlined in A; and D) tilted 3D-view of the image in C with viewfrom the south; scale 1:00 000.
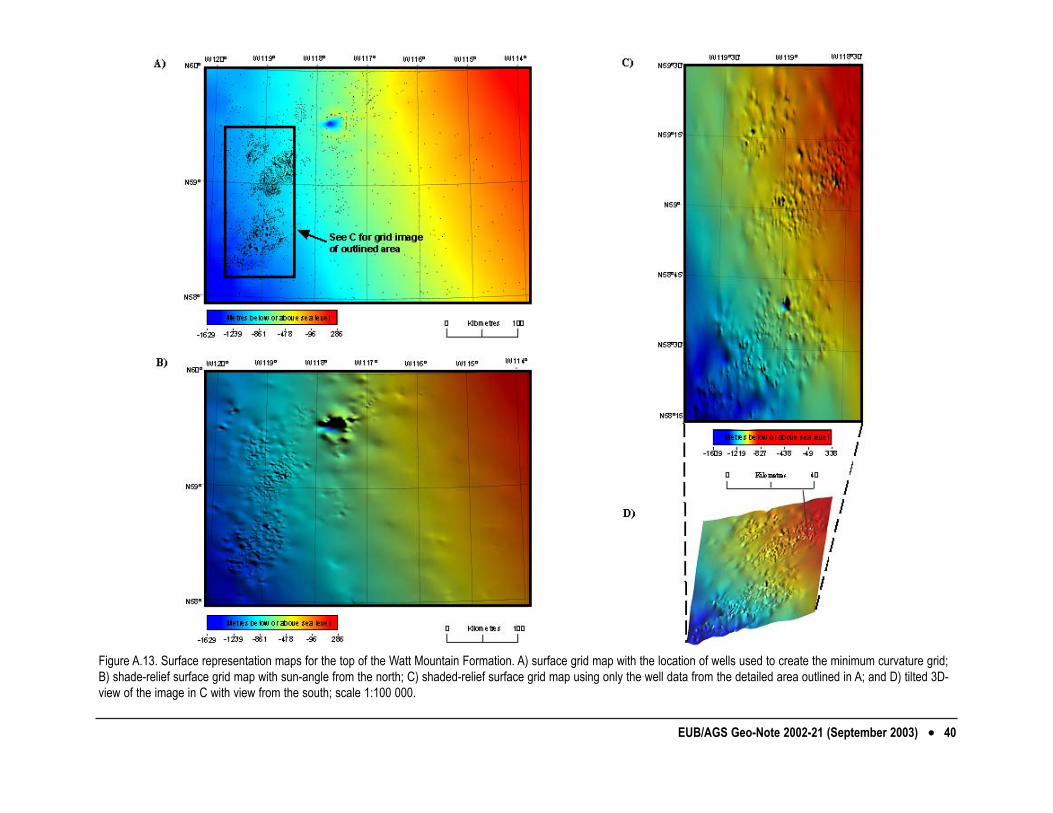
EUB/AGS Geo-Note 2002-21 (September 2003) •• 40
Figure A.13. Surface representation maps for the top of the Watt Mountain Formation. A) surface grid map with the location of wells used to create the minimum curvature grid;B) shade-relief surface grid map with sun-angle from the north; C) shaded-relief surface grid map using only the well data from the detailed area outlined in A; and D) tilted 3D-view of the image in C with view from the south; scale 1:100 000.

EUB/AGS Geo-Note 2002-21 (September 2003) •• 41
Figure A.14. Surface representation maps for the top of the Sulphur Point Formation. A) surface grid map with the location of wells used to create the minimum curvature gridand epositional edge of the Sulphur Point from Jeijer Drees (1994); B) shaded-relief surface grid map with sun-angle from the north; C) shaded-relief surface grid map usingonly the well data from the detailed area outlined in A; and D) tilted 3D-view of the image in C with view from the south; scale 1:100 000.
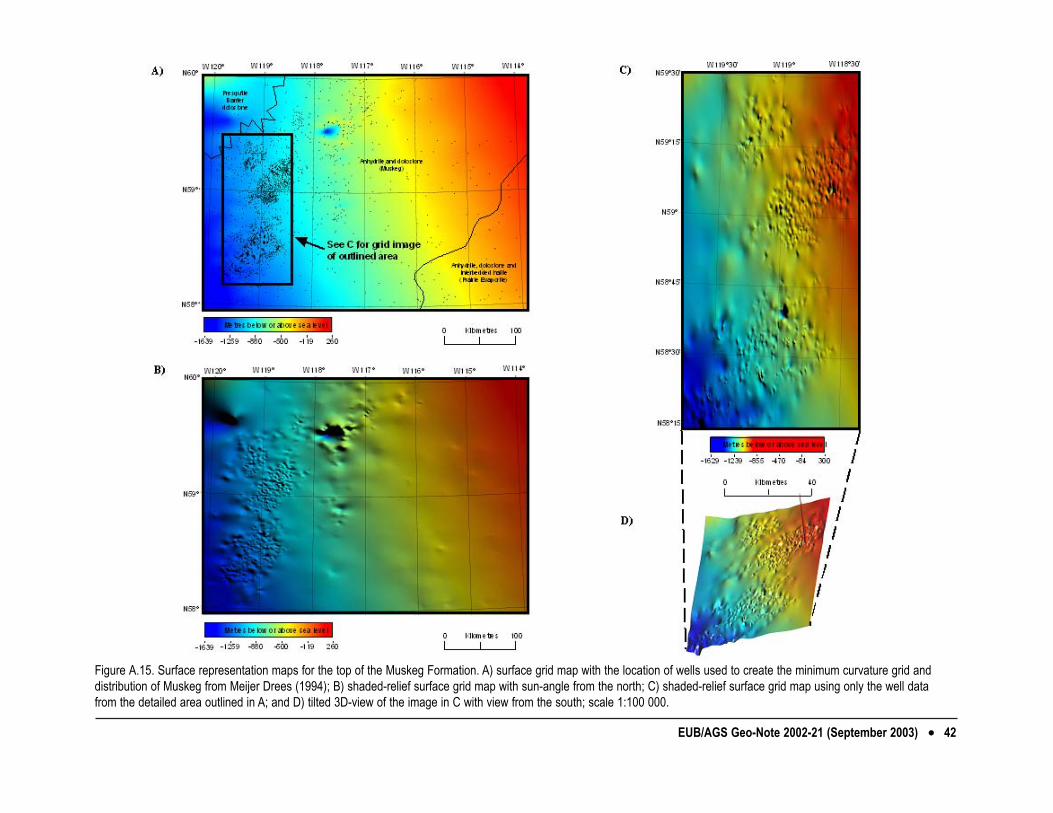
EUB/AGS Geo-Note 2002-21 (September 2003) •• 42
Figure A.15. Surface representation maps for the top of the Muskeg Formation. A) surface grid map with the location of wells used to create the minimum curvature grid anddistribution of Muskeg from Meijer Drees (1994); B) shaded-relief surface grid map with sun-angle from the north; C) shaded-relief surface grid map using only the well datafrom the detailed area outlined in A; and D) tilted 3D-view of the image in C with view from the south; scale 1:100 000.

EUB/AGS Geo-Note 2002-21 (September 2003) •• 43
Figure A.16. Surface representation maps for the top of the Keg River Formation. A) surface grid map with the location of wells used to create the minimum curvature grid; B)shaded-relief surface grid map with sun-angle from the north; C) shaded-relief surface grid map using only the well data from the detailed area outlined in A; and D) tilted 3D-view of the image in C with view from the south; scale 1:100 000.

EUB/AGS Geo-Note 2002-21 (September 2003) •• 44
Figure A.17. Surface representation maps for the top of the Lower Keg River Formation. A) surface grid map with the location of wells used to create the minimum curvaturegrid; B) shaded-relief surface grid map with sun-angle from the north; C) shaded-relief surface grid map using only the well data from the detailed area outlined in A; and D)tilted 3D-view of the image in C with view from the south; scale 1:100 000.

EUB/AGS Geo-Note 2002-21 (September 2003) •• 45
Figure A.18. Surface representation maps for the top of the Chinchaga Formation. A) surface grid map with the location of wells used to create the minimum curvature grid; B)shaded-relief surface grid map with sun-angle from the north; C) shaded-relief surface grid map using only the well data from the detailed area outlined in A; and D) tilted 3D-view of the image in C with view from the south; scale 1:100 000.

Figure A.19. Surface representation grid maps for the top of the Precambrian basement. A) surface grid with the location of thewells used to create the minimum curvature grid; and B) shaded-relief surface grid with sun-angle from the northeast.
EUB/AGS Geo-Note 2002-21 (September 2003) •• 46

Figure A.20. Surface representation isopach maps from the top of the Wabamun Group to the top of the Winterburn Group. A) surface grid with the location of the wells used to create the minimum curvature grid; and B) contour map (see A for locationof area).
EUB/AGS Geo-Note 2002-21 (September 2003) •• 47
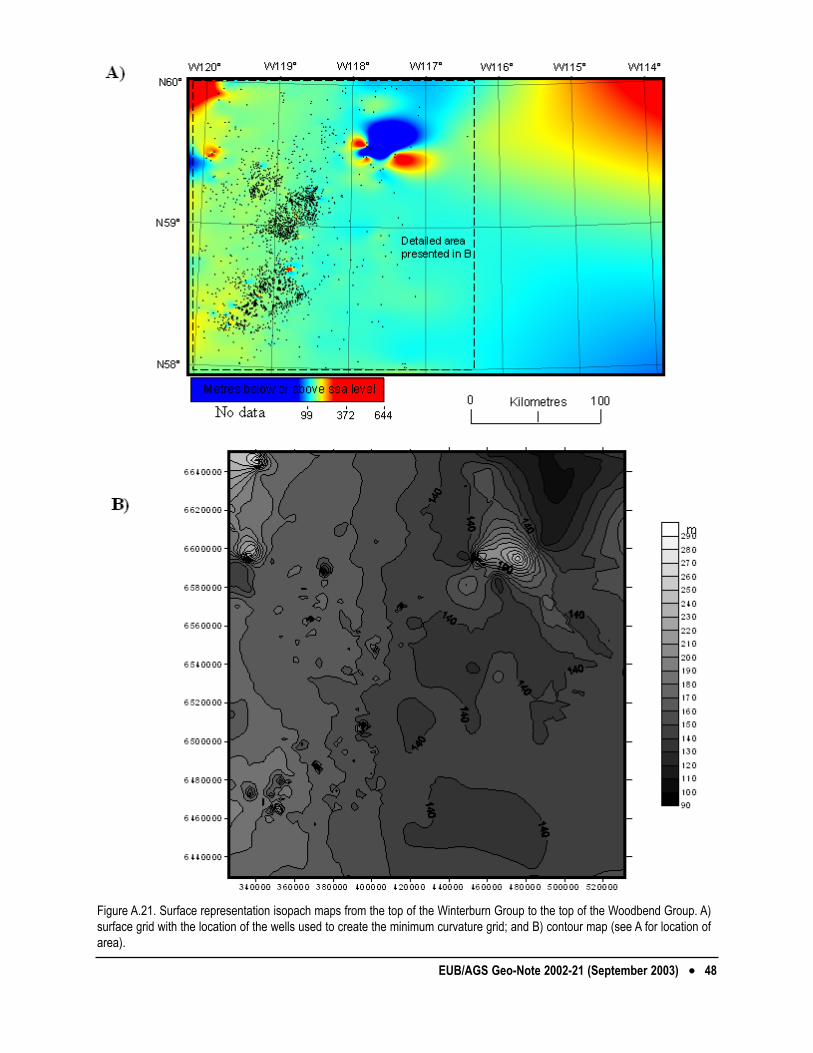
Figure A.21. Surface representation isopach maps from the top of the Winterburn Group to the top of the Woodbend Group. A)surface grid with the location of the wells used to create the minimum curvature grid; and B) contour map (see A for location ofarea).
EUB/AGS Geo-Note 2002-21 (September 2003) •• 48

Figure A.22. Surface representation isopach maps from the top of the Woodbend Group to the top of the Beaverhill Lake Group(Waterways Group). A) surface grid with the location of the wells used to create the minimum curvature grid; and B) contour map.
EUB/AGS Geo-Note 2002-21 (September 2003) •• 49

Figure A.23. Surface representation isopach maps from the top of the Beaverhill Lake Group (or top of the Waterways Group)to the top of the Slave Point Formation. A) surface grid with the location of the wells used to create the minimum curvature grid;and B) contour map.
EUB/AGS Geo-Note 2002-21 (September 2003) •• 50

Figure A. 24. Surface representation isopach maps from the top of the Slave Point Formation to the top of the Watt MountainFormation. A) surface grid with the location of the wells used to create the minimum curvature grid; and B) contour map.
EUB/AGS Geo-Note 2002-21 (September 2003) •• 51

Figure A.25. Surface representation isopach maps from the top of the Watt Mountain Formation to the top of the Sulphur PointFormation. A) surface grid with the location of the wells used to create the minimum curvature grid; and B) contour map (see Afor location of area).
EUB/AGS Geo-Note 2002-21 (September 2003) •• 52
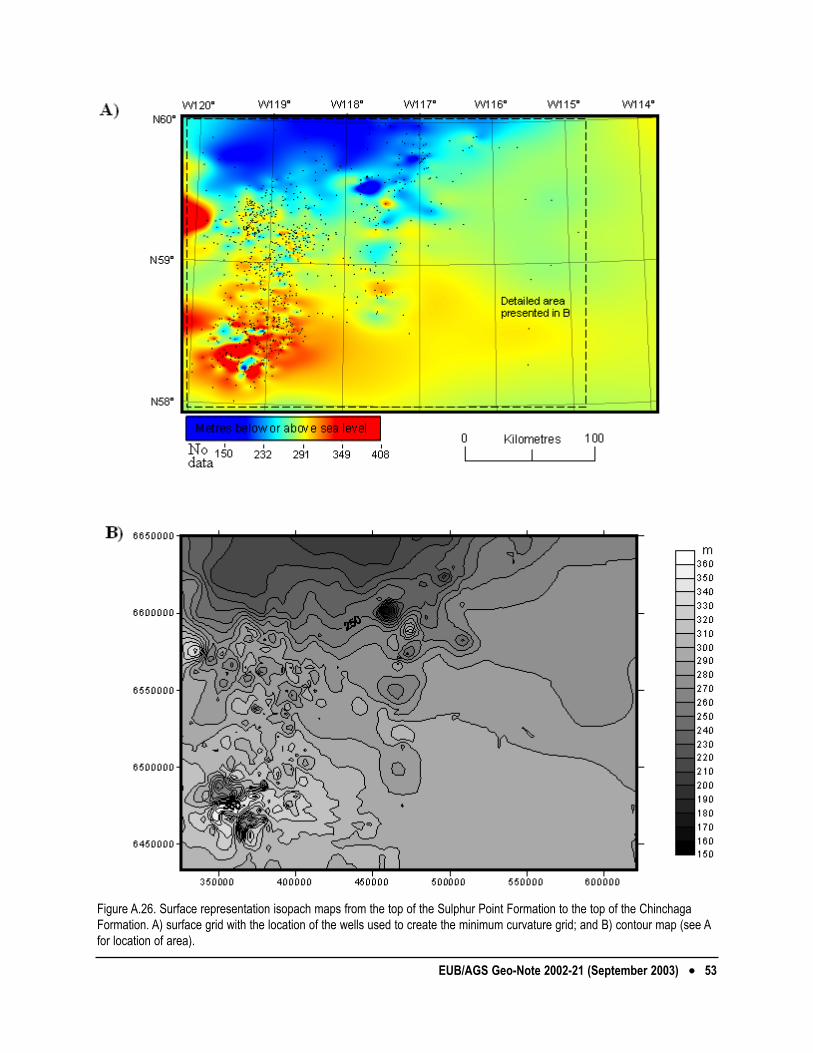
Figure A.26. Surface representation isopach maps from the top of the Sulphur Point Formation to the top of the ChinchagaFormation. A) surface grid with the location of the wells used to create the minimum curvature grid; and B) contour map (see Afor location of area).
EUB/AGS Geo-Note 2002-21 (September 2003) •• 53

Figure A.27. Surface representation isopach maps from the top of the Keg River Formation to the top of the Lower Keg RiverFormation. A) surface grid with the location of the wells used to create the minimum curvature grid; and B) contour map.
EUB/AGS Geo-Note 2002-21 (September 2003) •• 54

2.2 Methodology
The data were retrieved from iDc using GeoSoft v3.4 and the well locations were transformed toUniversal Transverse Mercator projection (UTM Zones 11 and 12; map datum NAD83). A gridded rasterimage was created using the minimum curvature interpolation method (set to standard parameters) usingERMapper image processing software (Earth Resources Mapping Pty. Ltd., 1998). The boundary extentof each ‘formation grid’ was set to identical parameters in order to allow for a visual comparison. TwoX, Y cell sizes were used to grid the data: 500 x 500 m for the larger surface representation maps thatcover the entire study area, and 200 x 200 m for detailed images.
Each surface representation figure includes1) a 1:500 000 (500 x 500 m cell size) image with the location of the wells used in the gridding process
(e.g., Figure A.3.A);2) a 1:500 000 (500 x 500 m cell size) shaded relief image with a sun-angle from the north
(e.g., Figure A.3.B);3) a 1:100 000 (200 x 200 m cell size) shaded relief image, which was regridding using only the data
from an area of detail, which focuses on the area with the densest proportion of well data (e.g., Figure A.3.C); and
4) a rotated, three-dimensional view of the area of detail (e.g., Figure A.3.D).
Additional information, where possible, was added to the grid images from the Geological Atlas of theWestern Canada Sedimentary Basin (Mossop and Shetsen, 1994).
EUB/AGS Geo-Note 2002-21 (September 2003) •• 55


![Untitled-1 [fluidcontrols.com] · Fluid Controls@ Hookup System Instrument Hookups from Fluid Controls@ are custom designed to our clients needs and are available with different end](https://static.fdocuments.us/doc/165x107/5e6f76df6fdebb6333331723/untitled-1-fluid-controls-hookup-system-instrument-hookups-from-fluid-controls.jpg)