Controlling Mechanism of Ignition Enhancing and ...
26
蒸発ガス、給油時蒸発ガスの排出実態 Evaluation of Evaporative and Refueling Emissions in Japan using PTR-MS National Traffic Safety and Environment Laboratory Hiroyuki YAMADA National Institute for Environmental Studies Satoshi INOMATA, Hiroshi TANIMOTO 1 大気環境学会シンポジウム“蒸発ガス・給油時蒸発ガスを考える” 16 th November, 2015
Transcript of Controlling Mechanism of Ignition Enhancing and ...

蒸発ガス、給油時蒸発ガスの排出実態Evaluation of Evaporative and Refueling
Emissions in Japan using PTR-MS
National Traffic Safety and Environment LaboratoryHiroyuki YAMADA
National Institute for Environmental StudiesSatoshi INOMATA, Hiroshi TANIMOTO
1
大気環境学会シンポジウム“蒸発ガス・給油時蒸発ガスを考える”16th November, 2015

Evaporative emissions
Carbon Canister
Fuel Tank
Active Carbon
Intake Manifold
Fuel Vapor
Trapped
Release
Clean Air
Emissions by expanding gasoline vaper inside the tank→ Fuel Vapor Generation (FVG)
Permeation of gasolines through a tank and tube→ Permeation
2
Gasoline car is equipped with a carbon canister to trap FVG.
Release of FVG to atmosphere when a carbon canister is fully filled with FVG is called for “Breakthrough”

Refueling emissions
Prevention Technology
Emissions that Gaseous fuel in the tank is pushed out by filled fuel during a refueling process
3
Fuel tank
Gasoline
Gasoline Vapor
Gasoline Vapor
ORVR
Dispenser
Gasoline
Gasoline
Vapor
Vapor
Underground Tank
Stage II Refueling emissions are sent to underground tank.
Refueling emissions are trapped by canister
Kanagawa Prefecture HP

Contents
• Evaluating evaporative emissions during 3 days parking events• Estimating annual total evaporative emissions in Japan
4
Evaluation of evaporative emissions
Evaluation of Refueling emissions• Evaluating refueling emissions at various temperature• Evaluating effects of preventing technologies
Evaluation of Ozone Formatting Potentials • Estimating MIR of evaporative and refueling emissions• Comparing them with MIR of tested gasoline
This presentation was based on the discussion listed below.H. Yamada, S. Inomata, H. Tanimoto, “Evaporative Emissions in Three-Day Diurnal Breathing LossTests on Passenger Cars for the Japanese Market”, Atmospheric Environment 107, 166-173(2015)H. Yamada, S. Inomata, H. Tanimoto, “Refueling Emissions from cars in Japan: Compositions,Temperature Dependence and Effect of Vapor Liquefied Collection System”, Atmospheric Environment120, 445-462(2015)H. Yamada, “Contribution of Evaporative Emissions from Gasoline Vehicles toward Total VOCEmissions in Japan”, Science of the Total Environment, 449, 143-149, (2013)

Evaluation of evaporative emissions
Evaluation of Refueling emissions
Evaluation of Ozone Formatting Potentials

15
20
25
30
35
40
0 6 12 18 24
Tem
pera
ture
(℃)
Time (h)
SHED Test (Diurnal Breathing Loss)Evaporative emissions were evaluated using Sealed Housing for. Evaporative Determination (SHED).
6
0
1
2
3
4
5
6
Day 1 Day 2 Day 3
THC
(g/d
ay)
THC in three continuous DBL test
The most of FVG was trapped by the canister in Day1.Emissions increased because of the appearance of breaktrough emissions.
Permeation only
Permeation + Breakthrough

Tested Cars for Evaporative Emissions
7
9 cars were tested.FC was produced by European manufacturerFM was produced by US manufacturer
Name MA MB MC CA CB CC CD FC FM
Maker Toyota Subaru Nissan Toyota Mitsubishi Toyota Toyota Smart Ford
Category Mid-size Mid-size Mid-size (van)
Compact Compact Conpact
(van)Conpact
(van) Compact SUV
Travel millage (km) 32,000 114,343 168,021 29,678 8,700 15,452 51,588 48,813 7,684
Car age (year) 5.5 5.8 13.6 4.5 2.7 4.6 7 3.2 0.8Tank capacity
(L) 50 50 76 40 45 55 55 33 70
Displacement (L) 1.8 2 3.5 1.5 1.5 2 2 1 2
Vehicle weight (kg) 1260 1420 2000 1050 1090 1640 1580 840 2020

0
2
4
6
8
10
12
day1 day2 day3
THC
(g/d
ay)
MA MBMC CACB CCCD FCFM
Japanese regulatry
Emissions during 3 days Parking Events
8
4 out of 6 Japanese cars exhibited breakthrough emissionsEmission of US car was the lowestBreakthrough appearance is not “On-Off” event, it appears gradually
US car
EU car

Estimation of amount of breakthrough emisssionsReddy Equation EFVG_gal = AeB(RVP)(eCT2-eCT1)
EFVG_gal: Evap. emissions per space CT2: Max. Temp. CT1:Min. Temp.
theoretical Equation𝐸𝐸𝐹𝐹𝐹𝐹𝐹𝐹 = 𝑀𝑀𝑓𝑓𝑓𝑓𝑓𝑓𝑓𝑓 × 1 − 𝑇𝑇𝑀𝑀𝑀𝑀𝑀𝑀
𝑇𝑇𝑚𝑚𝑚𝑚𝑚𝑚× 273
𝑇𝑇𝑀𝑀𝑀𝑀𝑀𝑀× 𝑃𝑃𝑓𝑓𝑓𝑓
𝑃𝑃𝑀𝑀𝑚𝑚𝑎𝑎× 𝐹𝐹𝑡𝑡𝑀𝑀𝑚𝑚𝑡𝑡
22.4
EFVG:Evap. Emissions Mfuel: molecular weight of fuelPfv: Vapor pressure of fuel Tmax: Max. temp. Tmin:Min temp.
05
10152025303540
0 20 40 60 80 100
Em
issi
on (
g)
Fuel Occupancy in the tank (%)
ExperimentalThis study with = 65 kPaThis study with = 100 kPaby Reddy Equation
P fv
P fv
9
Theoretical equation with Vapor pressure = 100kPa well reproduced experimental resultsReddy equation overestimated.

10
15
20
25
30
35
0:00 12:00 0:00 12:00 0:00 12:00 0:00 12:00 0:00
(deg
ree
C)
Tank Temp. UpperTank Temp. LowerAmbient Temp.Temp. at Fuchu observatory
(a) Temperature
0
2
4
6
8
10
0:00 12:00 0:00 12:00 0:00 12:00 0:00 12:00 0:00
Win
d ve
loci
ty (m
/s)
North windSouth wind
(b) Wind velocity and direction at Fuchu observatory
0
1
2
3
4
020406080
100120
0:00 0:00 0:00 0:00 0:00
Rai
nfal
l rat
e (m
m /
h)
Suns
hine
rat
io (%
)
Time
Sunshine ratio
Rainfall rate
23rd May 2012 24th 25th 26th
(c) Sunshine ratio and Rainfall rate at Fuchu observatory
Estimation of Fuel Temperature
Fuel tank temperature profiles are important parameters for estimating breakthrough emissions but it was similar to ambient temperature
Fuel tank temperature during parking in shinny car lots
10

Evaporative Emissions Map
Emissions per car
11
Total emissions in each prefecture
Emissions from each car was high at inland area.Total emissions were high at big cities (because of high population)

12
Various Sources of VOC with Gasoline cars
Tailpipes: 18,000 ton
Evaporative: 33,000 ton
Refueling: 110,000 ton
Total VOC emissions in Japan: 86,0,000 metric ton

Evaluation of evaporative emissions
Evaluation of Refueling emissions
Evaluation of Ozone Formatting Potentials

Test for Refueling Emissions
14
• Setting gasoline dispenser next to the SHED• Refueling emissions were evaluated using normal SHED• Effect of On-board Refueling Vapor Recovery (ORVR) and Vapor
Liquefied Collection System (VLCS) were also evaluated
SHED VLCS ORVR
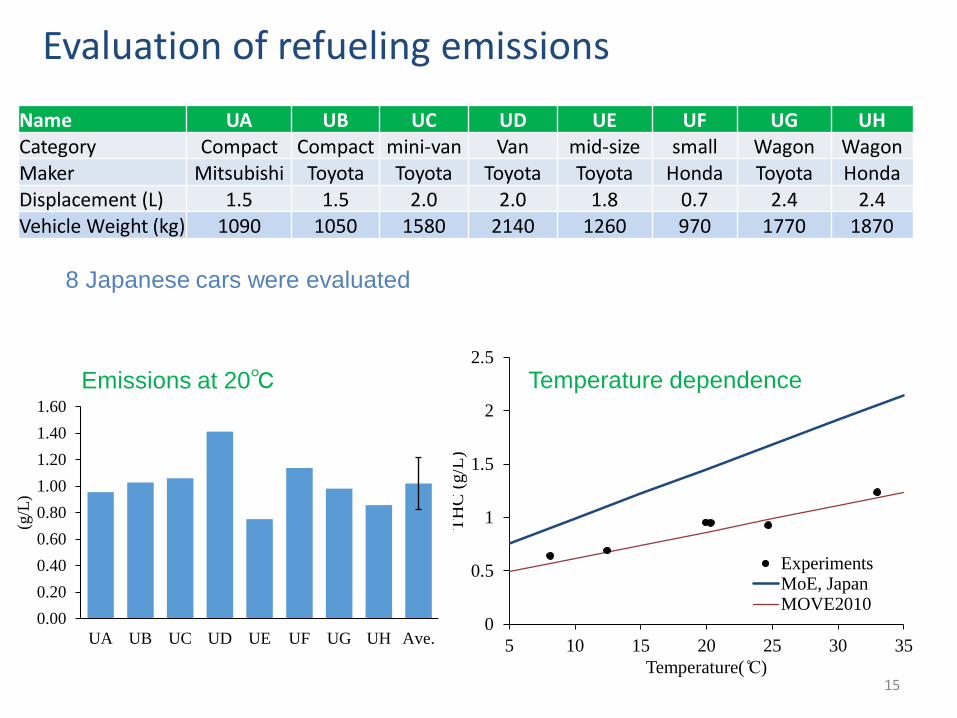
Evaluation of refueling emissions
15
0
0.5
1
1.5
2
2.5
5 10 15 20 25 30 35
THC
(g/L
)
Temperature( ̊C)
ExperimentsMoE, JapanMOVE2010
0.000.200.400.600.801.001.201.401.60
UA UB UC UD UE UF UG UH Ave.
(g/L
)
Emissions at 20℃ Temperature dependence
Name UA UB UC UD UE UF UG UHCategory Compact Compact mini-van Van mid-size small Wagon WagonMaker Mitsubishi Toyota Toyota Toyota Toyota Honda Toyota HondaDisplacement (L) 1.5 1.5 2.0 2.0 1.8 0.7 2.4 2.4Vehicle Weight (kg) 1090 1050 1580 2140 1260 970 1770 1870
8 Japanese cars were evaluated

Refueling Emissions Preventing Technologies
16
Dispenser
Underground Tank
Gasoline
Gasoline
VaporVapor
Condenser
Liquefied Vapor
Gasoline Trap
Exhaust
Pump
VLCS
Release Valve
ORVR
0
0.01
0.02
0.03
0.04
0.05
0.06
0.07
5 10 15 20 25 30 35
Emis
sion
s rel
ativ
e to
unc
ontro
lled
Temperature ( ̊C)
VLCSORVR
VLCS
Results (Emission relative to uncontrolled )
Emissions with ORVR and VLCS was almost similar (5% to uncontrolled)
Vapor liquefied Collection System (VLCS) was similar to Stage II, developed by Tatsuno. Trapped gasoline vapor was liquefied and send to dispenser.

Evaluation of evaporative emissions
Evaluation of Refueling emissions
Evaluation of Ozone Formatting Potentials

00.20.40.60.8
11.21.41.6
16 30 44 58 72 86 100
114
128
142
156
170
184
MIR
Alkane
normal
branched
Why Composition analysis of VOC is needed?
18
0
2
4
6
8
10
12
14
78 92 106 120 134 148 162
MIR
Aromatics
0
2
4
6
8
10
12
14
28 42 56 70 84 98 112126140
MIR
AlkeneAromatics Alkanes Alkenes
MIR =Increased amount of Oxidant (g)
Increased amount of VOC (g)
NO2
NO
OH
HO2
RO2
RO
O3
NO
NO2
O3
H2O2
ROOH
VOC
CO
O2
hν
hν
NO2
NO
OH
HO2
RO2
RO
O3
NO
NO2
O3
H2O2
ROOH
VOC
CO
O2
hν
hν
VOCs from cars have been regulated as non-methane hydrocarbon (NMHC) or total hydrocarbons (THC)
VOCs increases grand level ozone and its effects depend on their structures
Selection of Methodology
19
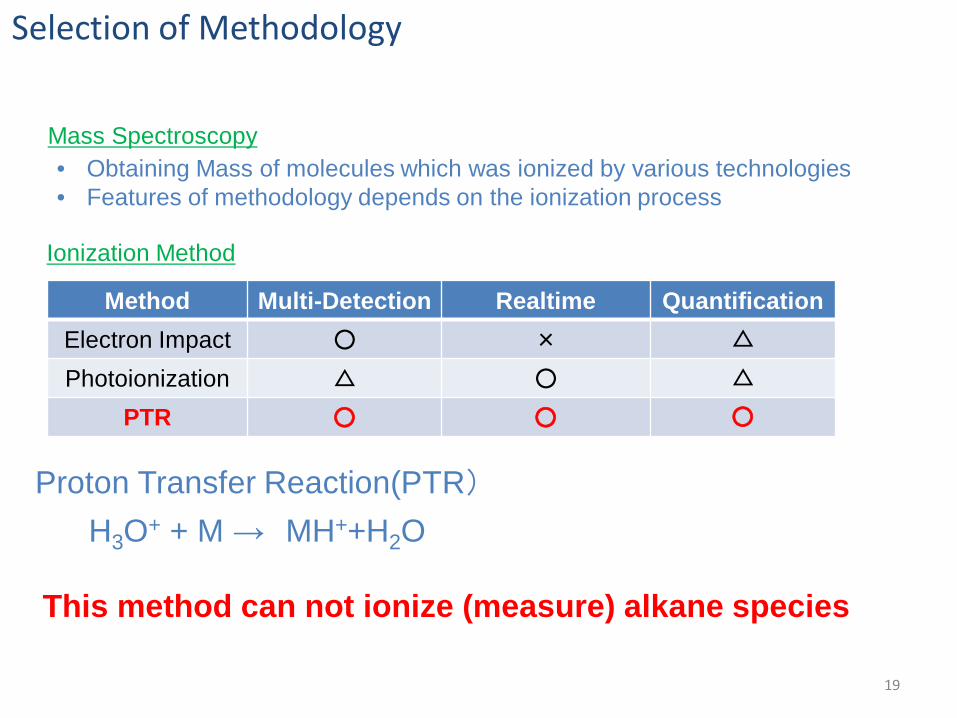
• Obtaining Mass of molecules which was ionized by various technologies• Features of methodology depends on the ionization process
Ionization Method
Mass Spectroscopy
Method Multi-Detection Realtime QuantificationElectron Impact ○ × △
Photoionization △ ○ △
PTR ○ ○ ○
Proton Transfer Reaction(PTR)
H3O+ + M → MH++H2O
This method can not ionize (measure) alkane species

Pure AirSample
pump
pump
Drift tube Quadrupole MSIon source
pump
NO+ Chemical Ionization Mass Spectrometry
NO+ + VOC VOC+, [VOC‒H]+
NO+VOC+
[VOC‒H]+
VOC
NO+ + VOC → [VOC‒H]+ + HNO
NO+ chemical ionization:
IONICON PTR+SRI-MSProton Transfer Reaction plusSelective Reagent Ion-Mass Spectrometer
http://www.ionicon.com/
discharge
VOC = Alkane
VOC = Alkene, Aromatics
NO+ + VOC → VOC+ + NO

0
0.1
0.2
0.3
M56(C4)
M70(C5)
M84(C6)
M98(C7)
M112(C8)
Mas
s R
atio
PermeationBreakthroughFuel
0
0.1
0.2
0.3
0.4
0.5
M58(C4)
M72(C5)
M86(C6)
M100(C7)
M114(C8)
Mas
s R
atio
PermeationBreakthroughFuel
Compositions of Evaporative Emissions
21
Composition of Breakthrough differed from that of permeation.Almost no aromatics in breakthrough.Permeation and Breakthrough consists of smaller species than fuel.High C4 and C5 alkane and alkene in case of breakthrough.
Alkanes
Alkenes
0
0.05
0.1
0.15
0.2
M78(Benz.)
M92(Tol.)
M106(C8)
M120(C9)
M128(Nap.)
Mas
s R
atio
PermeationBreakthroughFuel
Aromatics

00.5
11.5
22.5
33.5
44.5
Fuel Permeation Breakthrough
MIR
×R
atio
Aromatics Alkane Alkene
Compositions and MIR of Evaporative Emissions
22
0
0.2
0.4
0.6
0.8
1
Fuel Permeation Breakthrough
Rat
io
Aromatics Alkane Alkene
Compositions MIRs
Main components was alkaneEffect of aromatics alkenes were high because of their higher MIRsBreakthrough had the highest MIR because of C4 and C5 alkenes→ MIRBreakthrough = MIRFuel + 0.5 MIRPermeation = MIRFuel

Composition of Refueling Emissions
23
0.0
0.2
0.4
0.6
0.8
1.0
Tested Fuel RefuelingEmissions
Alkanes
Alkenes
Aromatics
Di-enes
0
1
2
3
4
5
Tested Fuel RefuelingEmissions
Alkanes
Alkenes
Aromatics
Di-enesCompositions MIR
No aromatics and higher effect of C4 and C5 alkenes
Almost similar to breakthrough of evaporative emissions
0.0
0.1
0.2
0.3
0.4
0.5
C4 C5 C6 C7 C8 C9M
ass
ratio
RefuelingEmissions(UB)
Alkanes
0
0.05
0.1
0.15
0.2
C4 C5 C6 C7 C8 C9
Mas
s ra
tio
RefuelingEmissions(UB)
Alkenes
0
0.02
0.04
0.06
0.08
0.1
0.12
M78 M92 M106M120M134M128M148
Mas
s ra
tio
RefuelingEmissions (UB)Fuel
AromaticsDetailed Compositions

Species Profiles during DBL Tests
PTR + SRI – MS can obtain profiles of various species
24
15
20
25
30
35
40
0 5 10 15 20
Tem
pera
ture
( ̊C
)
Time (hour)
(a) Temperature
0
10
20
30
40
0 5 10 15 20
Con
cent
ratio
n (p
pb)
Time (hour)
m78m106m120
(b) Aromatics
0
50
100
150
200
0 5 10 15 20
Con
cent
ratio
n (p
pb)
Time (hour)
m72m86m100
(c) Alkanes
0
1000
2000
3000
4000
5000
0 5 10 15 20
Con
cent
ratio
n (p
pb)
Time (hour)
(d) Pentane (breakthrough)
Decrease of low volatility species and high concentration species were observed.
Traditional analysis (before /after test measurement) possibly underestimates these emissions
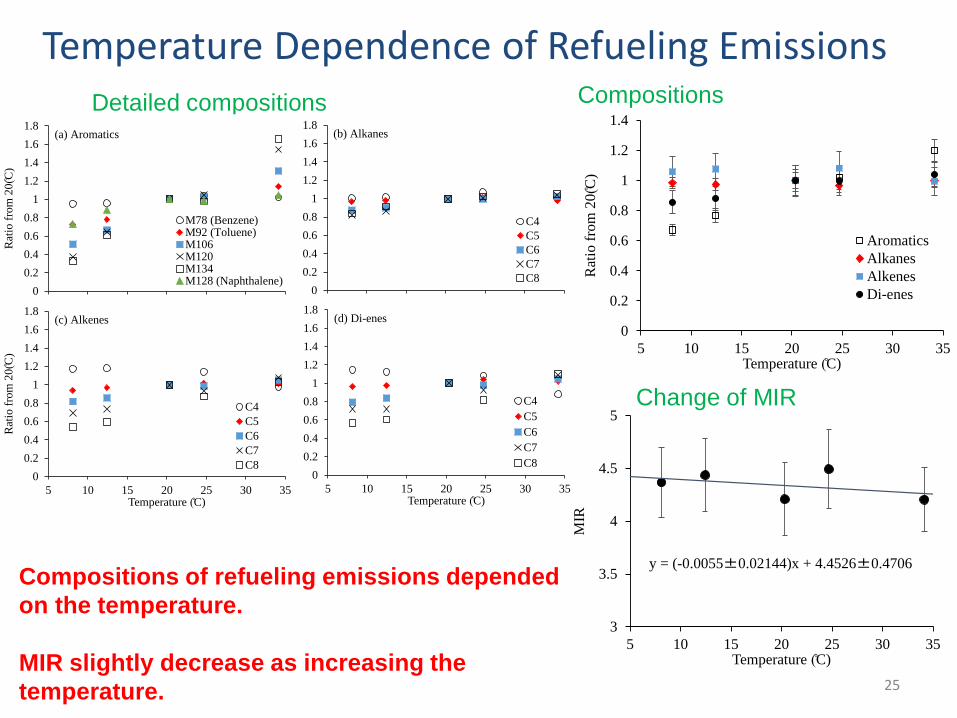
y = (-0.0055±0.02144)x + 4.4526±0.4706
3
3.5
4
4.5
5
5 10 15 20 25 30 35
MIR
Temperature (̊C)
0
0.2
0.4
0.6
0.8
1
1.2
1.4
5 10 15 20 25 30 35
Rat
io fr
om 2
0(̊C
)
Temperature (̊C)
AromaticsAlkanesAlkenesDi-enes
Temperature Dependence of Refueling EmissionsDetailed compositions
25
Compositions
Compositions of refueling emissions depended on the temperature.
MIR slightly decrease as increasing the temperature.
00.20.40.60.8
11.21.41.61.8
5 10 15 20 25 30 35R
atio
from
20(̊
C)
Temperature (̊C)
C4C5C6C7C8
(b) Alkanes
00.20.40.60.8
11.21.41.61.8
5 10 15 20 25 30 35
Rat
io fr
om 2
0(̊C
)
Temperature (̊C)
M78 (Benzene)M92 (Toluene)M106M120M134M128 (Naphthalene)
(a) Aromatics
00.20.40.60.8
11.21.41.61.8
5 10 15 20 25 30 35
Rat
io fr
om 2
0(̊C
)
Temperature (̊C)
C4C5C6C7C8
(d) Di-enes
00.20.40.60.8
11.21.41.61.8
5 10 15 20 25 30 35
Rat
io fr
om 2
0(̊C
)
Temperature (̊C)
C4C5C6C7C8
(c) Alkenes
Change of MIR

Conclusion
26
MIRRefueling =MIRBreakthrough = MIRFuel + 0.5MIRPermeation = MIRFuel
• 4 of 6 Japanese cars exhibited breakthrough emissions in 3 DBL tests• Breakthrough emissions appeared as gradual increased emissions• Total evaporative emissions in Japan was estimated to 33,000 ton.
Evaluation of evaporative emissions
Evaluation of Refueling emissions• Refueling emissions at 20 ℃ was 1.02 ± 0.20 g /L.• MoE estimation overestimated the emissions (because of no term of RVP)• Emissions with ORVR and VLCS were 5% of uncontrolled emissions.
Evaluation of Ozone Formatting Potentials • Impact of C4 and C5 alkene was high on MIR of each emission