Controlled Sintering of Ceramics - nanoparticles.org
16
Application of Master Sintering Curve Theory To Predict And Control Nano-Crystalline Ceramic Sintering Kevin G. Ewsuk, Christopher B. DiAntonio, Donald T. Ellerby, and Denise N. Bencoe Sandia National Laboratories Albuquerque, NM 87185-1340 Sintering 2003 3rd Intl Conf on the Science, Technology, & Applications of Sintering September 14-17, 2003 University Park, PA Sandia National Laboratories is a multi-program laboratory operated by Sandia Corporation, a Lockheed Martin Company for the US Department of Energy under contract No. DE-AC04-94AL8500
Transcript of Controlled Sintering of Ceramics - nanoparticles.org
Application of Master Sintering Curve Theory To Predict And Control Nano-Crystalline Ceramic Sintering
Kevin G. Ewsuk, Christopher B. DiAntonio,Donald T. Ellerby, and Denise N. Bencoe
Sandia National LaboratoriesAlbuquerque, NM 87185-1340
Sintering 2003 3rd Intl Conf on the Science, Technology, & Applications of Sintering
September 14-17, 2003University Park, PA
Sandia National Laboratories is a multi-program laboratory operated by Sandia Corporation, a Lockheed Martin Company for the US Department of Energy under contract No. DE-AC04-94AL8500
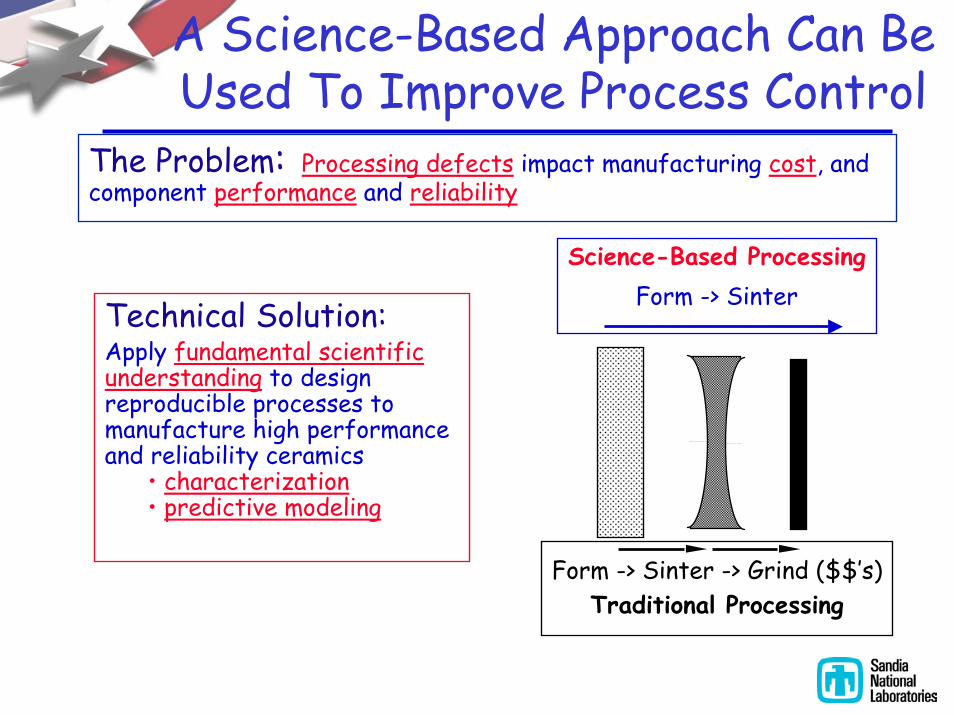
A Science-Based Approach Can Be Used To Improve Process Control
The Problem: Processing defects impact manufacturing cost, and component performance and reliability
Science-Based ProcessingForm -> SinterTechnical Solution:
Apply fundamental scientific understanding to design reproducible processes to manufacture high performance and reliability ceramics
• characterization• predictive modeling
Form -> Sinter -> Grind ($$’s)Traditional Processing
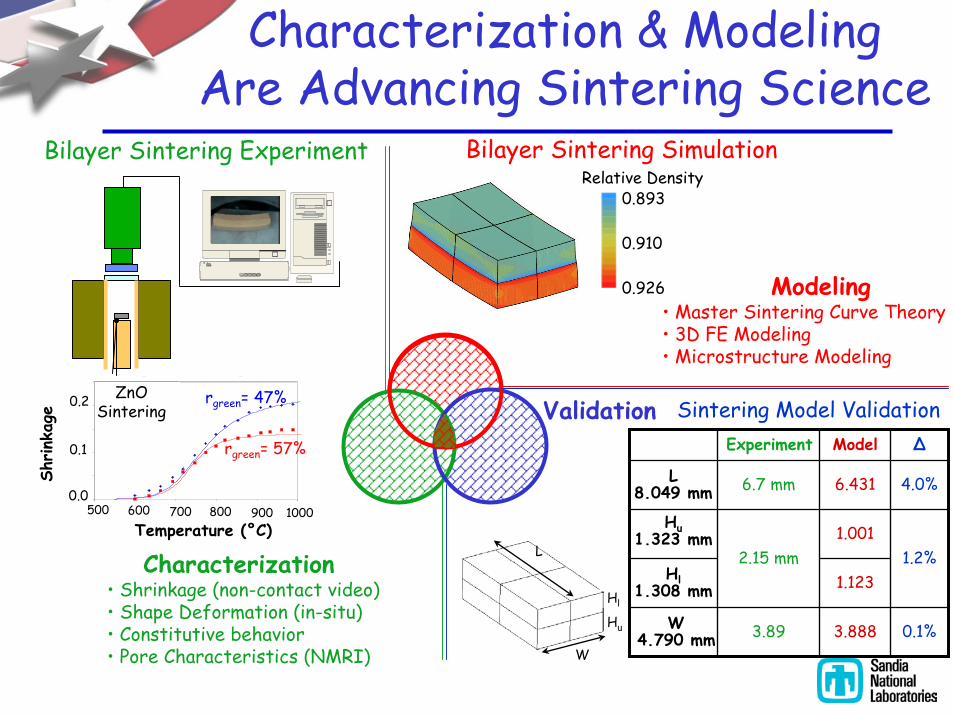
Characterization & ModelingAre Advancing Sintering Science
Free sintering of zinc oxide with different green densities.
-0.05
0
0.05
0.1
0.15
0.2
0.25
500 600 700 800 900 1000
Temperature (C)
47% Green Density57% Green Density
500 600 700 800 900 1000
rgreen= 57%
rgreen= 47%
Temperature (°C)
0.0
0.1
0.2 ZnOSintering
Shrink
age
0.893
0.910
0.926
Relative DensityBilayer Sintering Simulation
0.1%3.8883.89W4.790 mm
1.123Hl1.308 mm
1.2%1.001
2.15 mm
Hu1.323 mm
4.0%6.4316.7 mmL8.049 mm
∆ModelExperiment
Modeling• Master Sintering Curve Theory• 3D FE Modeling• Microstructure Modeling
Validation
L
W
Hl
Hu
Bilayer Sintering Experiment
Sintering Model Validation
Characterization• Shrinkage (non-contact video)• Shape Deformation (in-situ)• Constitutive behavior• Pore Characteristics (NMRI)
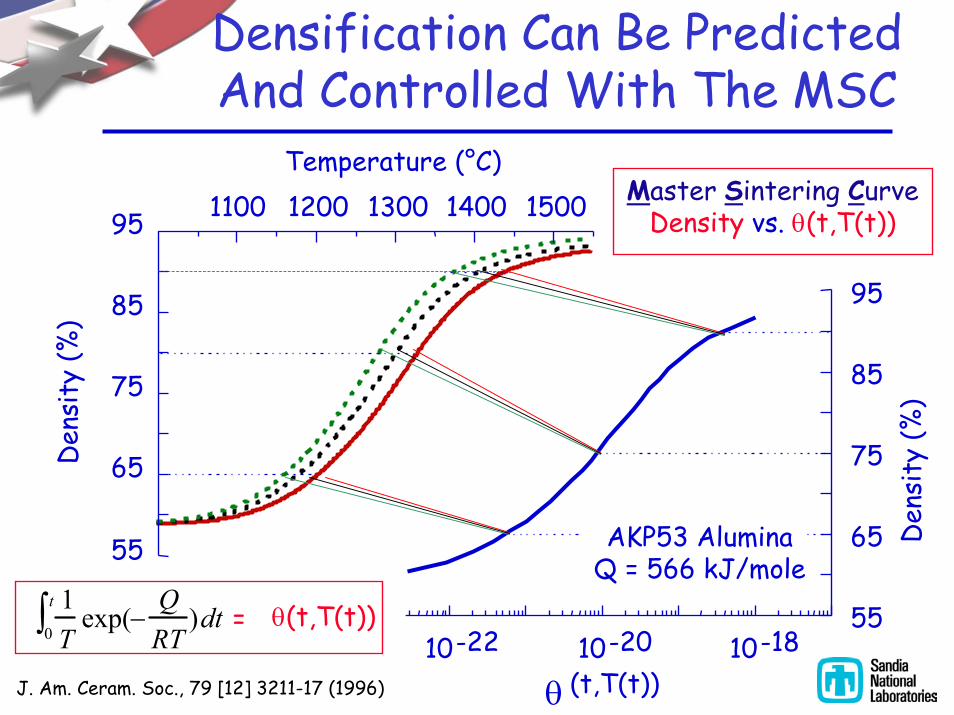
Densification Can Be PredictedAnd Controlled With The MSC
55
65
85
95
10 10-22 10-20 10-18
θ
AKP53 AluminaQ = 566 kJ/mole55
65
75
85
95 1100 1200 1300 1400 1500
Den
sity
(%)
Master Sintering CurveDensity vs. θ(t,T(t))
1T0t∫ exp(−
QRT)dt θ(t,T(t))=
J. Am. Ceram. Soc., 79 [12] 3211-17 (1996) (t,T(t))
Temperature (°C)
75
Den
sity
(%)
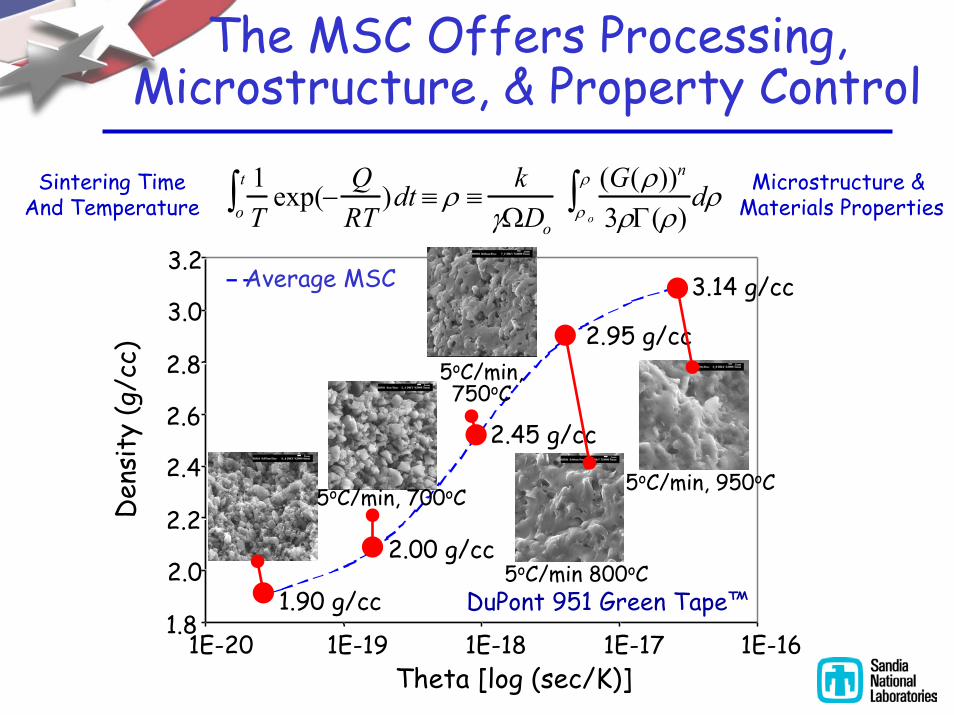
The MSC Offers Processing,Microstructure, & Property Control
1Tot∫ exp(−
QRT)dt ≡ ρ ≡
kγΩDo
(G(ρ))n
3ρΓ(ρ)ρ o
ρ∫ dρSintering TimeAnd Temperature
Microstructure & Materials Properties
1.8
2.0
2.2
2.4
2.6
2.8
3.0
3.2
1E-20 1E-19 1E-18 1E-17 1E-16Theta [log (sec/K)]
Den
sity
(g/c
c)
Average MSC
5oC/min, 750oC
DuPont 951 Green Tape™
2.45 g/cc
5oC/min, 950oC
3.14 g/cc
5oC/min 800oC
2.95 g/cc
2.00 g/cc
5oC/min, 700oC
1.90 g/cc
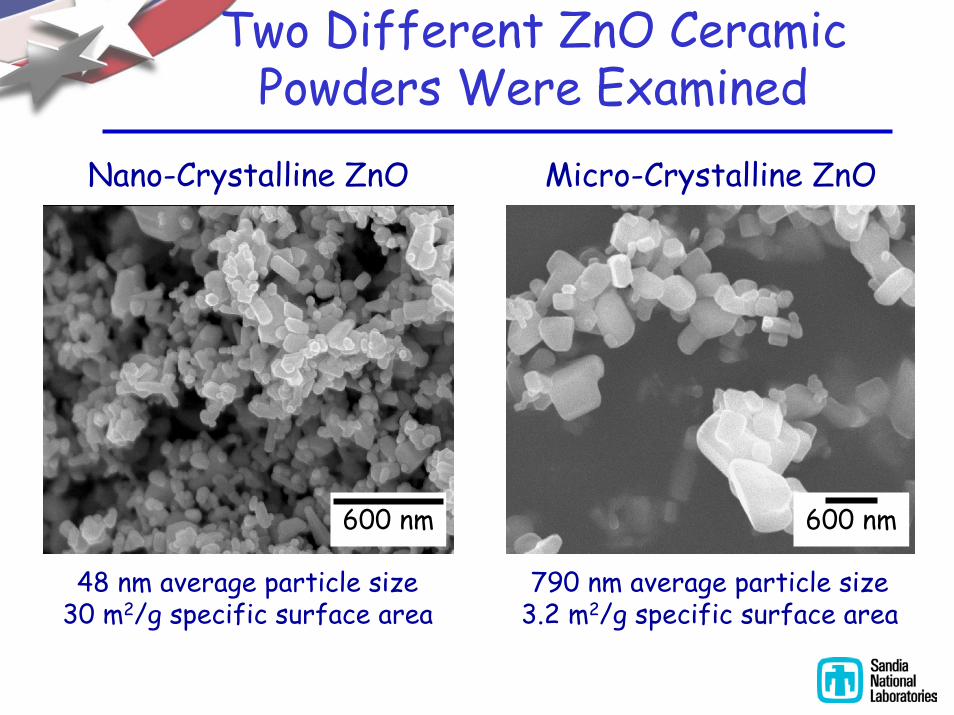
Two Different ZnO CeramicPowders Were Examined
Nano-Crystalline ZnO Micro-Crystalline ZnO
600 nm 600 nm
790 nm average particle size3.2 m2/g specific surface area
48 nm average particle size30 m2/g specific surface area
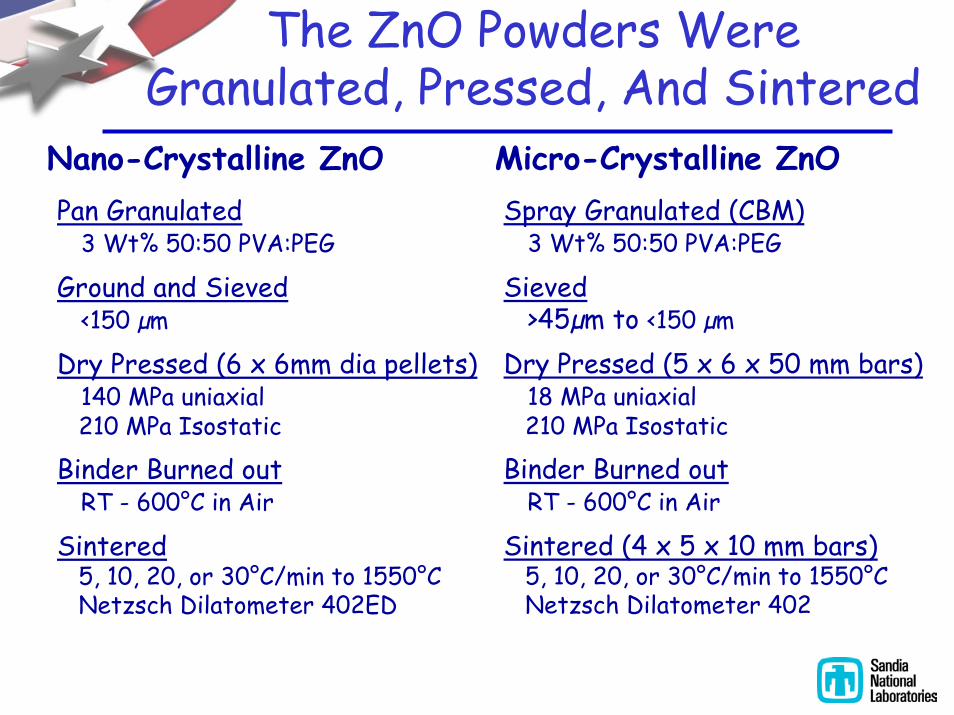
The ZnO Powders WereGranulated, Pressed, And Sintered
Micro-Crystalline ZnONano-Crystalline ZnOSpray Granulated (CBM)
3 Wt% 50:50 PVA:PEG
Sieved>45µm to <150 µm
Dry Pressed (5 x 6 x 50 mm bars)18 MPa uniaxial210 MPa Isostatic
Binder Burned outRT - 600°C in Air
Sintered (4 x 5 x 10 mm bars)5, 10, 20, or 30°C/min to 1550°CNetzsch Dilatometer 402
Pan Granulated3 Wt% 50:50 PVA:PEG
Ground and Sieved<150 µm
Dry Pressed (6 x 6mm dia pellets)140 MPa uniaxial210 MPa Isostatic
Binder Burned outRT - 600°C in Air
Sintered5, 10, 20, or 30°C/min to 1550°CNetzsch Dilatometer 402ED
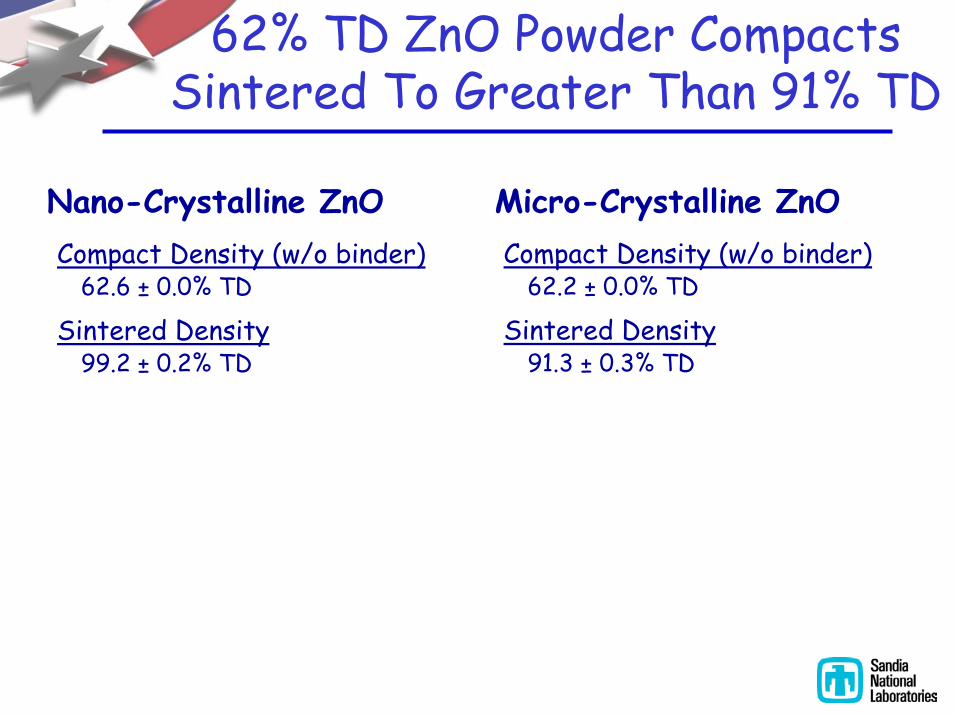
62% TD ZnO Powder CompactsSintered To Greater Than 91% TD
Micro-Crystalline ZnONano-Crystalline ZnOCompact Density (w/o binder)
62.2 ± 0.0% TD
Sintered Density91.3 ± 0.3% TD
Compact Density (w/o binder)62.6 ± 0.0% TD
Sintered Density99.2 ± 0.2% TD
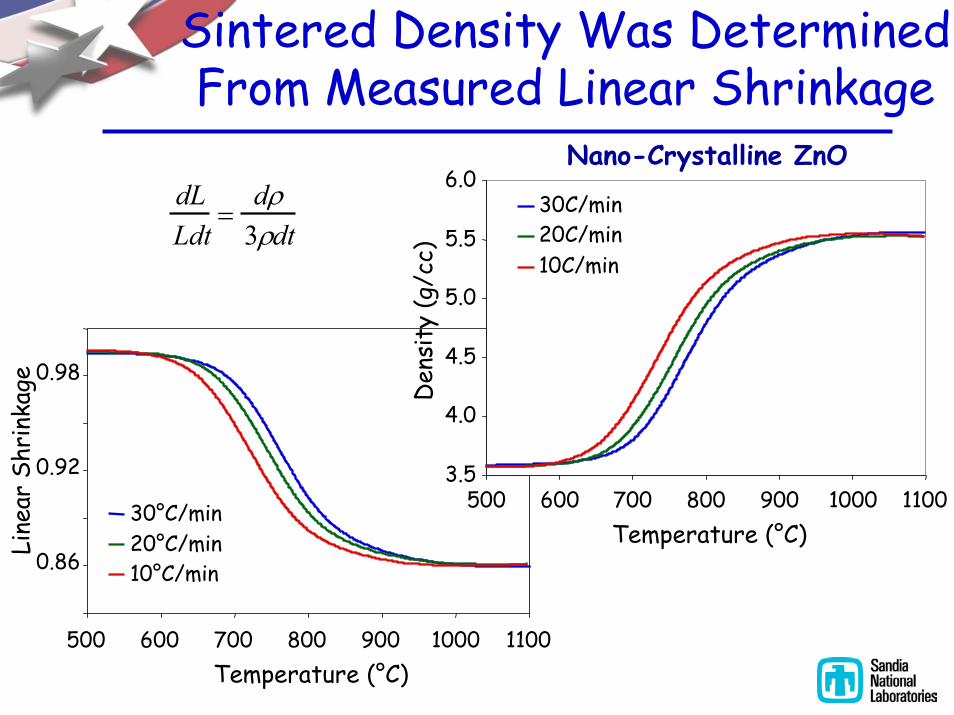
Sintered Density Was Determined From Measured Linear Shrinkage
Nano-Crystalline ZnO
0.86
0.92
0.98
500 600 700 800 900 1000 1100Temperature (°C)
Line
ar S
hrin
kage
30°C/min20°C/min10°C/min
3.5
4.0
4.5
5.0
5.5
6.0
500 600 700 800 900 1000 1100Temperature (°C)
Den
sity
(g/c
c)
30C/min20C/min10C/min
dLLdt
=dρ3ρdt
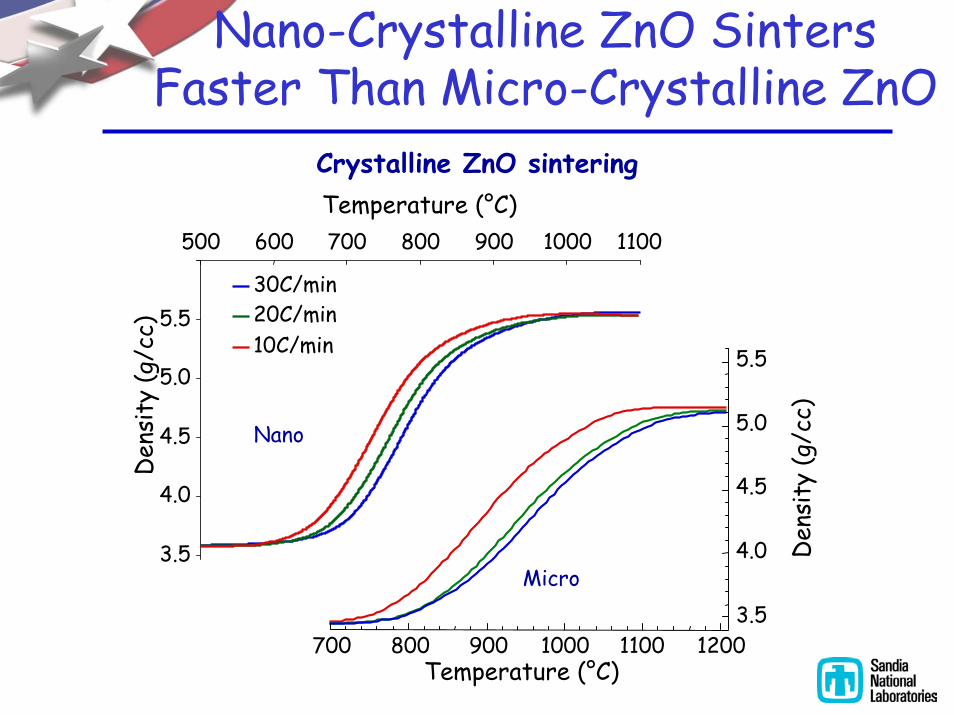
Nano-Crystalline ZnO SintersFaster Than Micro-Crystalline ZnO
Crystalline ZnO sintering
3.5
4.0
4.5
5.0
5.5
500 600 700 800 900 1000 1100Temperature (°C)
Den
sity
(g/c
c)
30C/min20C/min10C/min
3.5
4.0
4.5
5.0
5.5
700 800 900 1000 1100 1200
Den
sity
(g/c
c)
Temperature (°C)
Nano
Micro
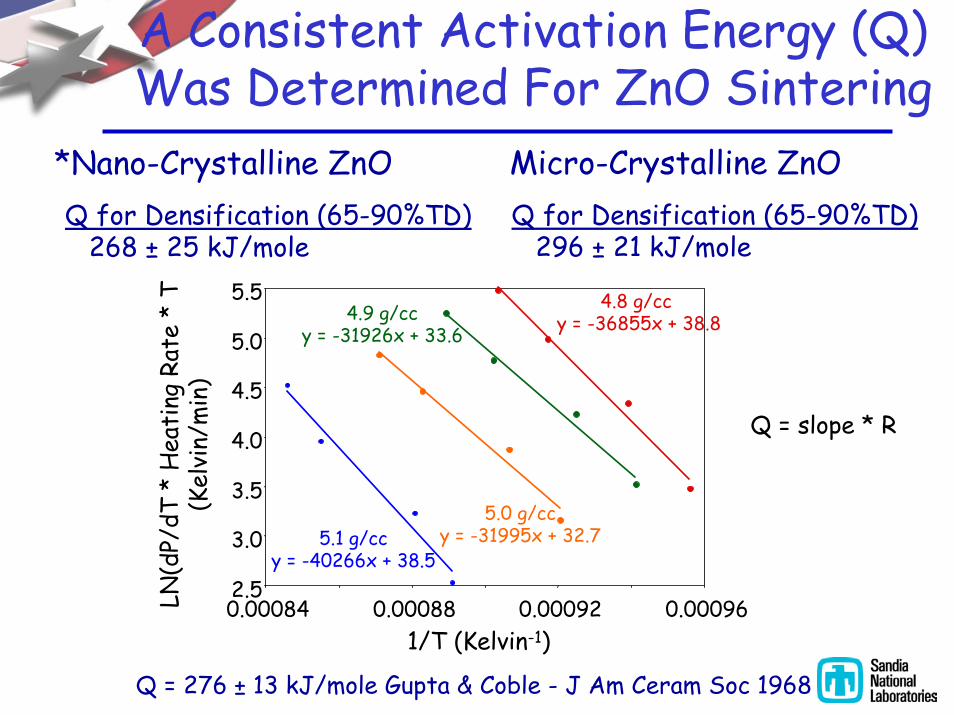
A Consistent Activation Energy (Q) Was Determined For ZnO Sintering
Micro-Crystalline ZnO*Nano-Crystalline ZnOQ for Densification (65-90%TD)
296 ± 21 kJ/moleQ for Densification (65-90%TD)
268 ± 25 kJ/mole
4.9 g/ccy = -31926x + 33.6
5.0 g/ccy = -31995x + 32.7
4.8 g/cc y = -36855x + 38.8
5.1 g/ccy = -40266x + 38.5
2.5
3.0
3.5
4.0
4.5
5.0
5.5
0.00084 0.00088 0.00092 0.00096LN(d
P/dT
* H
eati
ng R
ate
* T
(Kel
vin/
min
)
1/T (Kelvin-1)
Q = slope * R
Q = 276 ± 13 kJ/mole Gupta & Coble - J Am Ceram Soc 1968
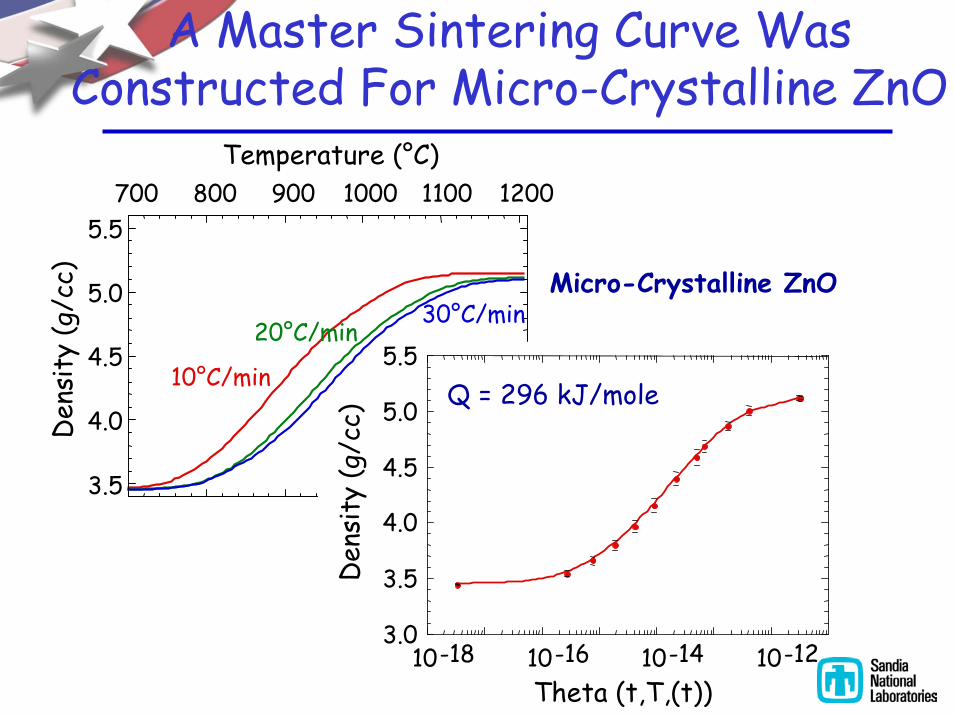
A Master Sintering Curve Was Constructed For Micro-Crystalline ZnO
3.5
4.0
4.5
5.0
5.5700 800 900 1000 1100 1200
Den
sity
(g/c
c)
Temperature (°C)
10°C/min
20°C/min30°C/min
3.0
3.5
4.0
4.5
5.0
5.5
10-18 10-16 10-14 10-12
Den
sity
(g/c
c)
Theta (t,T,(t))
Micro-Crystalline ZnO
Q = 296 kJ/mole
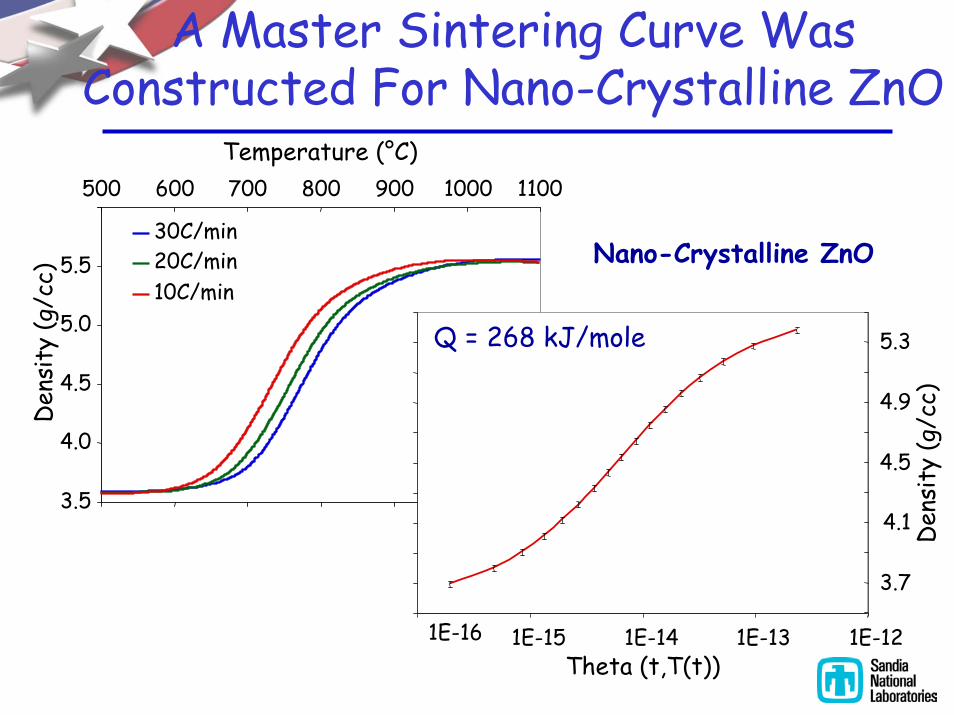
A Master Sintering Curve Was Constructed For Nano-Crystalline ZnO
1E-16
3.5
4.0
4.5
5.0
5.5
500 600 700 800 900 1000 1100Temperature (°C)
Den
sity
(g/c
c)
30C/min20C/min10C/min
3.7
4.1
4.5
4.9
5.3
1E-15 1E-14 1E-13 1E-12Theta (t,T(t))
Den
sity
(g/c
c)
Q = 268 kJ/mole
Nano-Crystalline ZnO
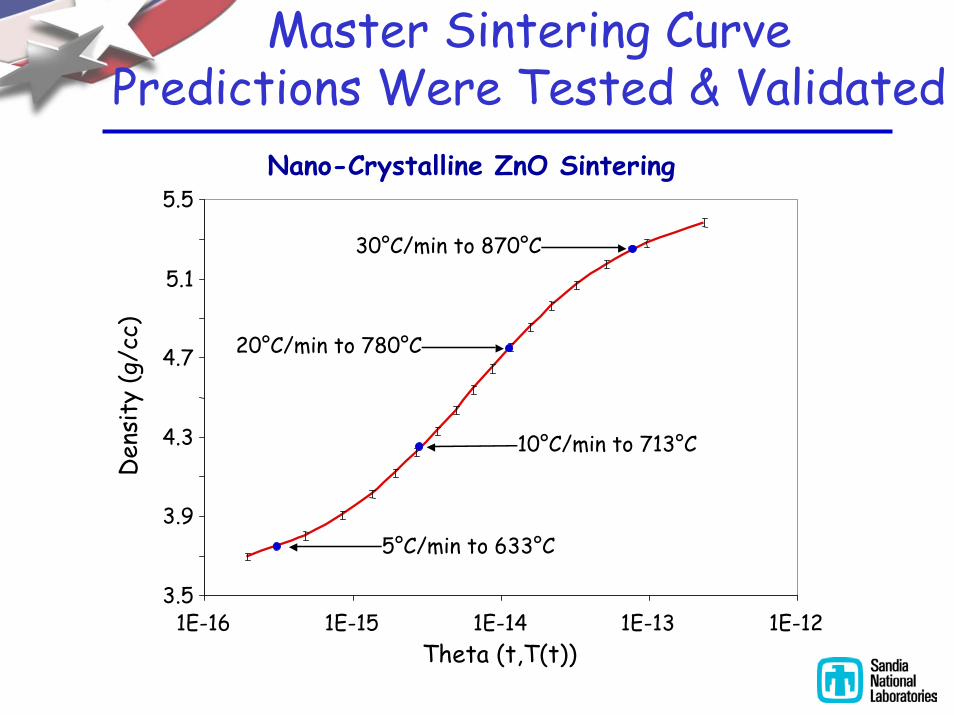
Master Sintering CurvePredictions Were Tested & Validated
Nano-Crystalline ZnO Sintering
3.5
3.9
4.3
4.7
5.1
5.5
1E-16 1E-15 1E-14 1E-13 1E-12Theta (t,T(t))
Den
sity
(g/c
c)
30°C/min to 870°C
20°C/min to 780°C
10°C/min to 713°C
5°C/min to 633°C
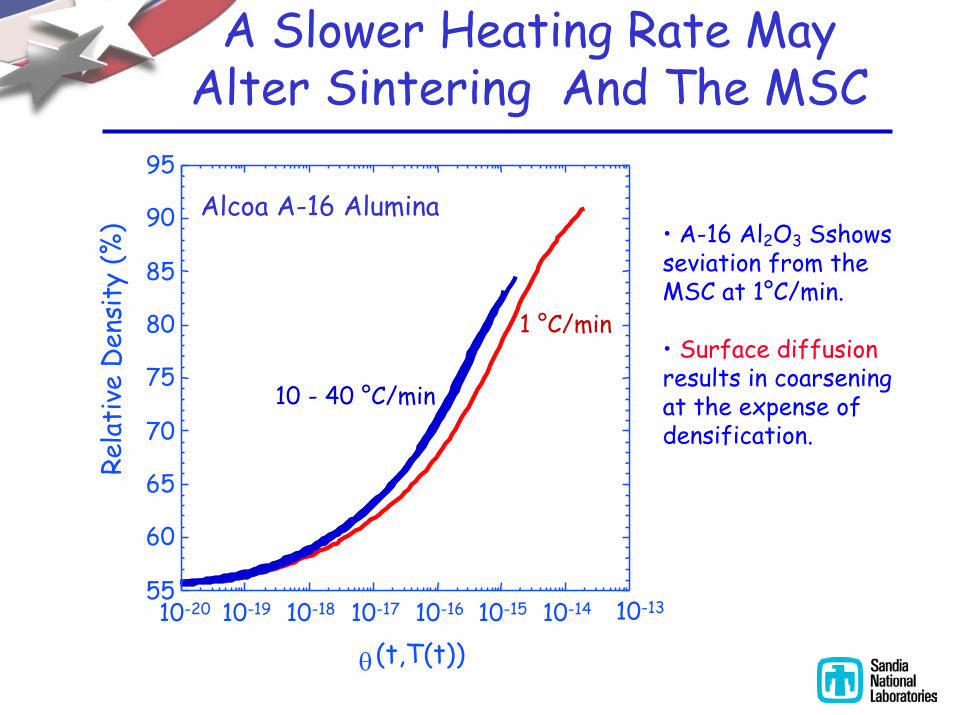
A Slower Heating Rate MayAlter Sintering And The MSC
• A-16 Al2O3 Sshowsseviation from the MSC at 1°C/min.
• Surface diffusionresults in coarsening at the expense of densification.
55
60
65
70
75
80
85
90
95
10-20 10-19 10-18 10-17 10-16 10-15 10-14
Rela
tive
Den
sity
(%)
(t,T(t))10-13
Alcoa A-16 Alumina
10 - 40 °C/min
θ
1 °C/min
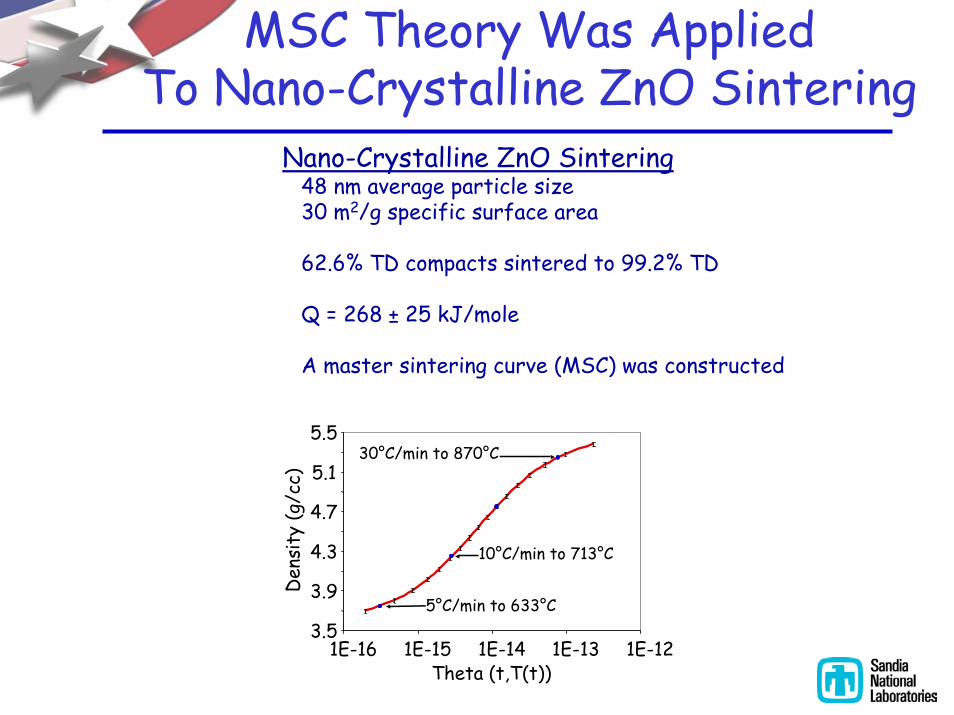
MSC Theory Was AppliedTo Nano-Crystalline ZnO Sintering
Nano-Crystalline ZnO Sintering48 nm average particle size30 m2/g specific surface area
62.6% TD compacts sintered to 99.2% TD
Q = 268 ± 25 kJ/mole
A master sintering curve (MSC) was constructed
3.5
3.9
4.3
4.7
5.1
5.5
1E-16 1E-15 1E-14 1E-13 1E-12Theta (t,T(t))
Den
sity
(g/c
c)
30°C/min to 870°C
10°C/min to 713°C
5°C/min to 633°C


![Effect of calcium fluoride on sintering behaviour of SiO ...159 Processing and Application of Ceramics 6 [3] (2012) 159–164 Effect of calcium fluoride on sintering behaviour of SiO](https://static.fdocuments.us/doc/165x107/5e6a083ea3ca29489b34d3da/effect-of-calcium-fluoride-on-sintering-behaviour-of-sio-159-processing-and.jpg)
![09: ' # '7& *#0 & 8 · Microwave Sintering of Thermistor Ceramics 87 3.1.2 Microwave sintering of NTC thermistor ceramics Jin et al.[12, 13] successfully calcined and sintered Mn](https://static.fdocuments.us/doc/165x107/5ea839ed78e3b04910080f23/09-7-0-8-microwave-sintering-of-thermistor-ceramics-87-312.jpg)

![Microwave Sintering of Thermistor Ceramics · 2018. 9. 25. · Microwave Sintering of Thermistor Ceramics 87 3.1.2 Microwave sintering of NTC thermistor ceramics Jin et al.[12, 13]](https://static.fdocuments.us/doc/165x107/5fc1c5bde14383042a0edfab/microwave-sintering-of-thermistor-ceramics-2018-9-25-microwave-sintering-of.jpg)