Controlled processing of (Gd,Ln) O :Eu (Ln=Y, Lu) red...
6
1 Supporting Information Controlled processing of (Gd,Ln) 2 O 3 :Eu (Ln=Y, Lu) red phosphor particles and compositional effects on photoluminescence Bin Lu 1,2 , Ji-Guang Li 1,* and Yoshio Sakka 1,2 (1) Materials Processing Unit, National Institute for Materials Science, Tsukuba, Ibaraki, 305-0047 Japan (2) Department of Materials Science and Engineering, Graduate School of Pure and Applied Sciences, University of Tsukuba, Tsukuba, Ibaraki 305-8571, Japan * Corresponding author National Institute for Materials Science Materials Processing Unit Tel: +81-29-860-4394 E-mail: [email protected]
Transcript of Controlled processing of (Gd,Ln) O :Eu (Ln=Y, Lu) red...

1
Supporting Information
Controlled processing of (Gd,Ln)2O3:Eu (Ln=Y, Lu) red phosphor
particles and compositional effects on photoluminescence
Bin Lu 1,2, Ji-Guang Li 1,* and Yoshio Sakka 1,2
(1) Materials Processing Unit, National Institute for Materials Science, Tsukuba, Ibaraki, 305-0047
Japan
(2) Department of Materials Science and Engineering, Graduate School of Pure and Applied Sciences,
University of Tsukuba, Tsukuba, Ibaraki 305-8571, Japan
*Corresponding author
National Institute for Materials Science
Materials Processing Unit
Tel: +81-29-860-4394
E-mail: [email protected]
2
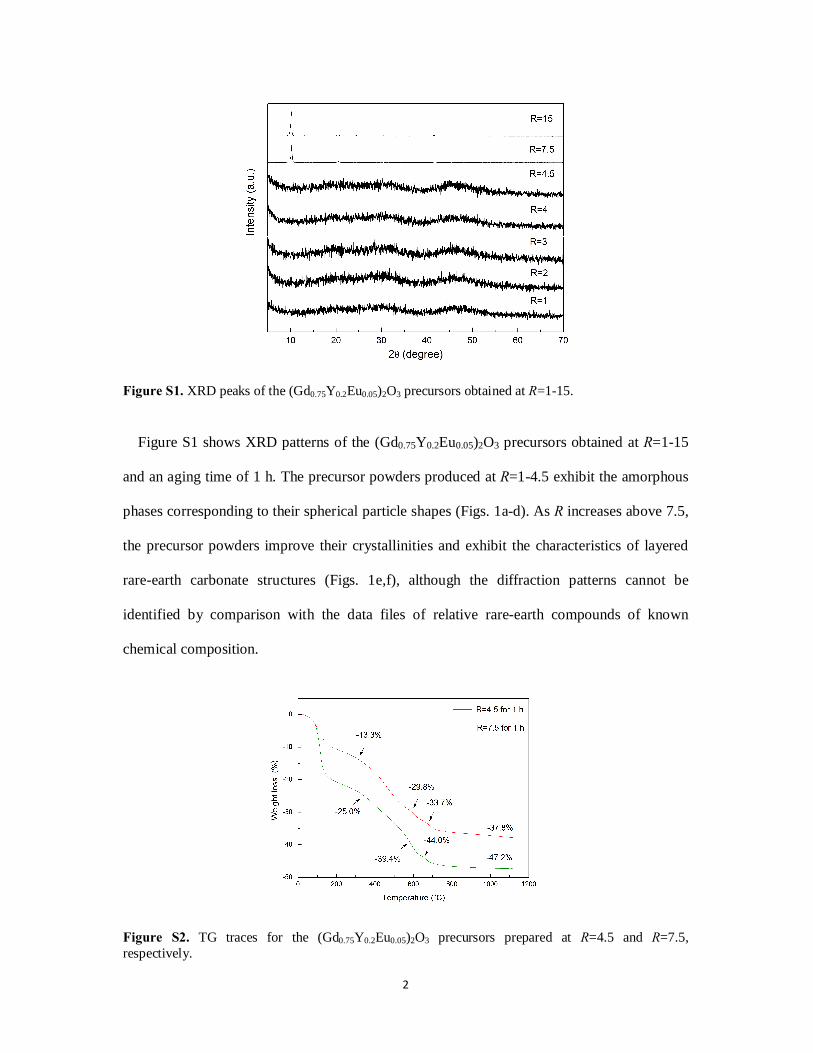
Figure S1. XRD peaks of the (Gd0.75Y0.2Eu0.05)2O3 precursors obtained at R=1-15.
Figure S1 shows XRD patterns of the (Gd0.75Y0.2Eu0.05)2O3 precursors obtained at R=1-15
and an aging time of 1 h. The precursor powders produced at R=1-4.5 exhibit the amorphous
phases corresponding to their spherical particle shapes (Figs. 1a-d). As R increases above 7.5,
the precursor powders improve their crystallinities and exhibit the characteristics of layered
rare-earth carbonate structures (Figs. 1e,f), although the diffraction patterns cannot be
identified by comparison with the data files of relative rare-earth compounds of known
chemical composition.
Figure S2. TG traces for the (Gd0.75Y0.2Eu0.05)2O3 precursors prepared at R=4.5 and R=7.5, respectively.
3
Figure S2 shows the TG curves of two kinds of typical (Gd0.75Y0.2Eu0.05)2O3 precursors,
which have been detected to possess a chemical composition of
(Gd0.75Y0.2Eu0.05)2(CO3)3‧4H2O and (NH4)1.4(Gd0.75Y0.2Eu0.05)2(CO3)3.7‧5.6H2O, respectively
(Table 1).
The (Gd0.75Y0.2Eu0.05)2(CO3)3‧4H2O precursor decomposes to oxide via four major steps.
The first step (below 300°C) is mainly owing to dehydration and causes a weight loss (-
13.3%), which is consistent with theoretical value (-13.4%). And the weight losses of -29.8%,
-33.7% and -37.8% for the other three steps are also in accordance with the calculated weight
loss of -29.7%, -33.8% and -37.9%, respectively, which are largely due to the removal of
carbon dioxide. The decomposition processes of this precursor may be depicted as follows.
2 3 3 2 2 3 3300 300-600
2 3 2 2 2 3 2 3 600-680 680
2 3 2 3600
( ) 4 ( )
( ) ( )
dehydration decarbonation
decarbonation decarbonation
crystallite growth
Ln CO H O Ln CO
Ln O CO Ln O CO Ln O
Ln O Ln O
<
>
>
⋅ → →
→ → →
℃ ℃
℃ ℃
℃
Similarly, the decomposition processes of the (NH4)1.4(Gd0.75Y0.2Eu0.05)2(CO3)3.7‧5.6H2O
precursor were deduced as below.
dehydration and min4 1.4 2 3 3.7 2 2 3 3350 350-600
2 3 2 2 2 3 2 3 600-680 680
2 3
( ) ( ) 5.6 ( )
( ) ( )
dea ation decarbonation
decarbonation decarbonation
crystalli
NH Ln CO H O Ln CO
Ln O CO Ln O CO Ln O
Ln O
<
>
⋅ → →
→ →
℃ ℃
℃ ℃
2 3600
te growth Ln O>
→ ℃
4
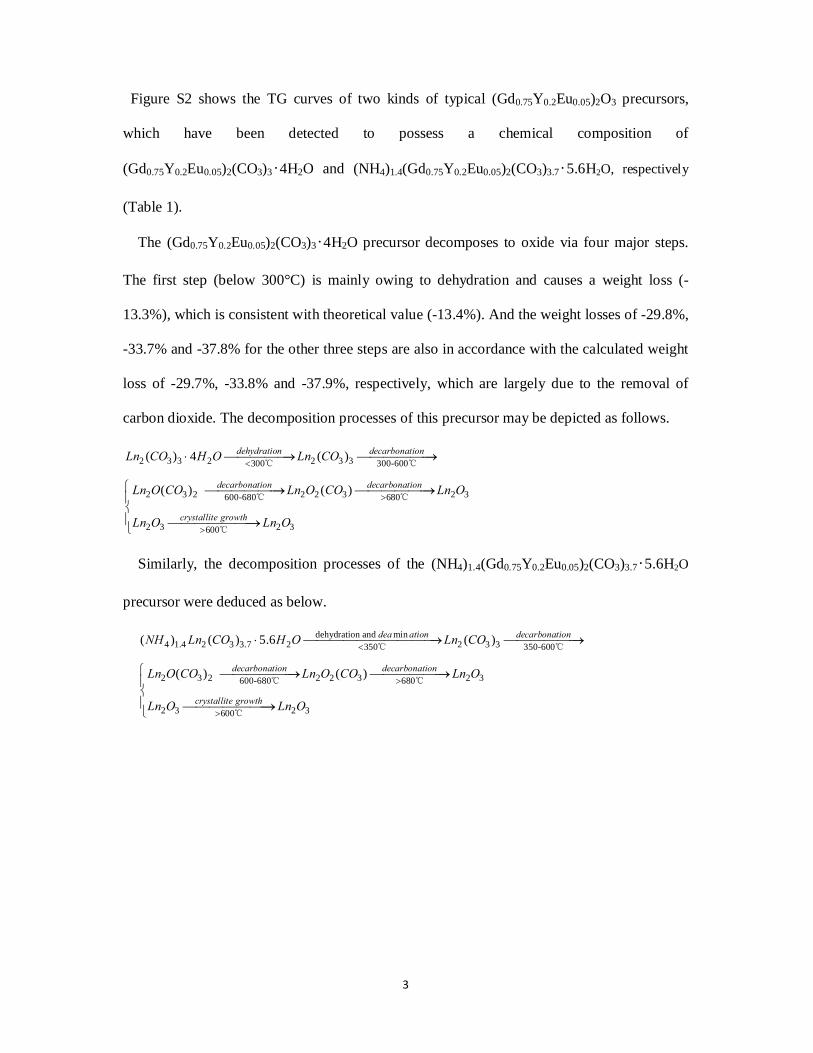
Figure S3. XRD patterns of the (Gd0.75Y0.2Eu0.05)2O3 precursors obtained at R=4.5 and an aging time of 3-10 h.
Figure S4. XRD patterns of (Gd,Ln)2O3:Eu precursors with the composition (Gd0.95-xYxEu0.05)2O3 (a), and (Gd0.95-xLuxEu0.05)2O3 (b).
Figure S5. Particle size distribution for the (Gd0.95Eu0.05)2O3 oxide powder.
5
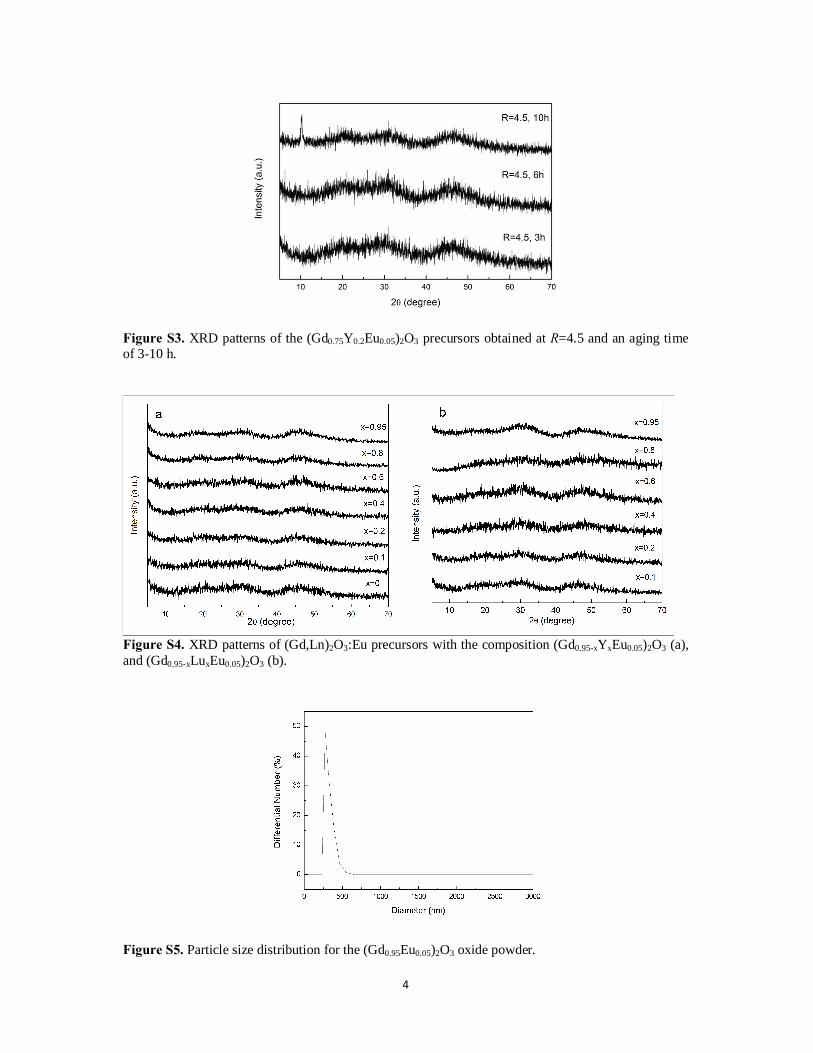
Figure S6. XRD patterns of the calcination products of the (Gd0.75Y0.2Eu0.05)2O3 sample.
Figure S7. Fluorescence decay behaviors of the (Gd,Ln)2O3:Eu phosphors for the 613 nm emission with the composition (Gd0.95-xYxEu0.05)2O3 (a), and (Gd0.95-xLuxEu0.05)2O3 (b).
Figure S8. Calcination temperature effect on fluorescence lifetime by taking the (Gd0.75Y0.2Eu0.05)2O3 sample as an example.
6
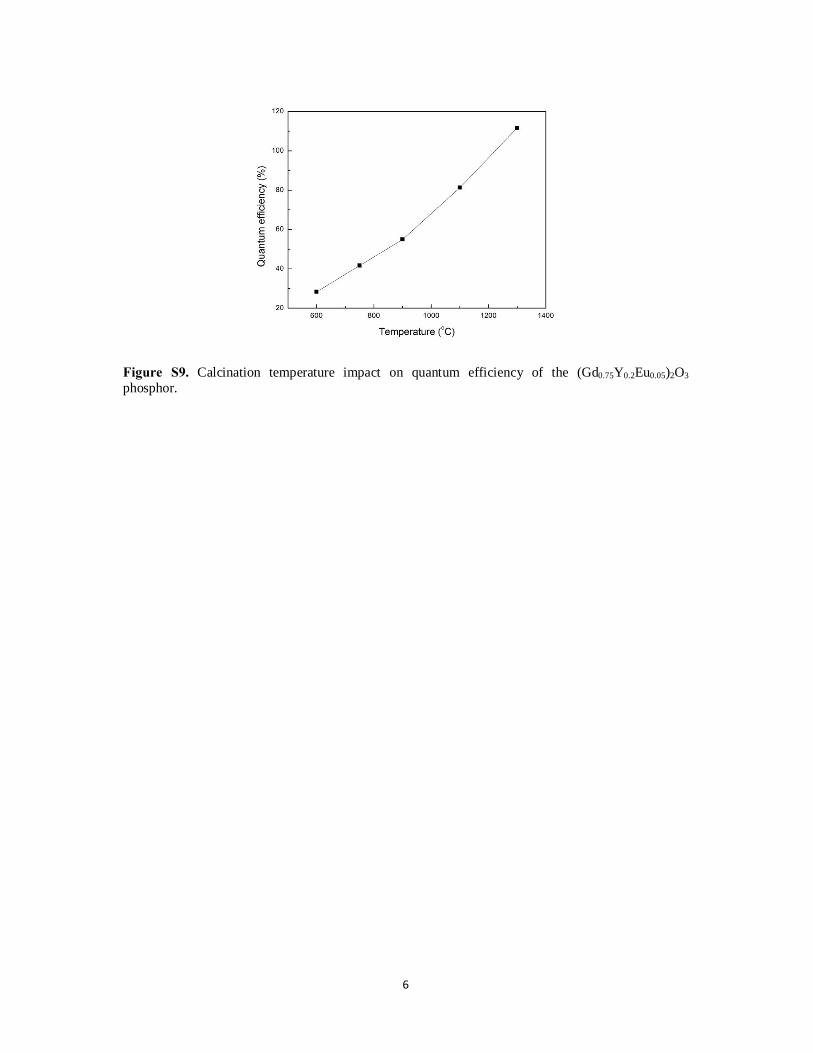
Figure S9. Calcination temperature impact on quantum efficiency of the (Gd0.75Y0.2Eu0.05)2O3 phosphor.


![Synthesis, structure and magnetic properties of [FeIII4LnIII2] (Ln… · 2018-10-27 · Synthesis, structure and magnetic properties of [FeIII 4Ln III 2] (Ln = Gd, Tb, Dy, Ho) and](https://static.fdocuments.us/doc/165x107/5f381a4c30d0b2437878b0f9/synthesis-structure-and-magnetic-properties-of-feiii4lniii2-ln-2018-10-27.jpg)