Control Architecture for Intentional Island Operation in...
167
General rights Copyright and moral rights for the publications made accessible in the public portal are retained by the authors and/or other copyright owners and it is a condition of accessing publications that users recognise and abide by the legal requirements associated with these rights. • Users may download and print one copy of any publication from the public portal for the purpose of private study or research. • You may not further distribute the material or use it for any profit-making activity or commercial gain • You may freely distribute the URL identifying the publication in the public portal If you believe that this document breaches copyright please contact us providing details, and we will remove access to the work immediately and investigate your claim. Downloaded from orbit.dtu.dk on: Jun 18, 2018 Control Architecture for Intentional Island Operation in Distribution Network with High Penetration of Distributed Generation Chen, Yu; Østergaard, Jacob; Xu, Zhao Publication date: 2010 Document Version Publisher's PDF, also known as Version of record Link back to DTU Orbit Citation (APA): Chen, Y., Østergaard, J., & Xu, Z. (2010). Control Architecture for Intentional Island Operation in Distribution Network with High Penetration of Distributed Generation. Technical University of Denmark, Department of Electrical Engineering.
Transcript of Control Architecture for Intentional Island Operation in...

General rights Copyright and moral rights for the publications made accessible in the public portal are retained by the authors and/or other copyright owners and it is a condition of accessing publications that users recognise and abide by the legal requirements associated with these rights.
• Users may download and print one copy of any publication from the public portal for the purpose of private study or research. • You may not further distribute the material or use it for any profit-making activity or commercial gain • You may freely distribute the URL identifying the publication in the public portal
If you believe that this document breaches copyright please contact us providing details, and we will remove access to the work immediately and investigate your claim.
Downloaded from orbit.dtu.dk on: Jun 18, 2018
Control Architecture for Intentional Island Operation in Distribution Network with HighPenetration of Distributed Generation
Chen, Yu; Østergaard, Jacob; Xu, Zhao
Publication date:2010
Document VersionPublisher's PDF, also known as Version of record
Link back to DTU Orbit
Citation (APA):Chen, Y., Østergaard, J., & Xu, Z. (2010). Control Architecture for Intentional Island Operation in DistributionNetwork with High Penetration of Distributed Generation. Technical University of Denmark, Department ofElectrical Engineering.
Yu Chen
Control Architecture for Inten-tional Island Operation in Dis-tribution Network with High Penetration of Distributed Generation
PhD Thesis, September 2010

Yu Chen
Control Architecture for Inten-tional Island Operation in Dis-tribution Network with High Penetration of Distributed Generation
PhD Thesis, September 2010

Yu Chen
Kontrolarkitektur for planlagt ø-drift i fremtidige distributi-onsnet med stor andel af de-central elproduktion
PhD Afhandling, september 2010


陈煜
针对在具有分布式电源高接入水
平的配电网中进行有意识孤岛运
行的控制架构的研究
博士论文 2010年9月
丹麦技术大学
电气工程系
电力技术中心
2
Control Architecture for Intentional Island Operation in Distribution Network with High Penetration of Distributed Generation,
Author(s): Yu Chen Supervisor(s): Professor, Jacob Østergaard, Technical University of Denmark Doctor of Philosophy, Zhao Xu, Technical University of Denmark, The Hong Kong Poly-technic University
Department of Electrical Engineering Centre for Electric Technology (CET) Technical University of Denmark Elektrovej 325 DK-2800 Kgs. Lyngby Denmark www.elektro.dtu.dk/cet Tel: (+45) 45 25 35 00 Fax: (+45) 45 88 61 11 E-mail: [email protected]
Release date:
September 2010
Class:
1 (public)
Edition:
Official edition
Comments:
This report is a part of the requirements to achieve PhD in Elec-trical Engineering at Technical University of Denmark.
Rights:
© Yu Chen, 2010

3
To learn without thinking is labour in vain; To think without learning is desolation.
-- Confucius, < LUN YU•WEI ZHENG>
学而不思则罔;
思而不学则殆.
-- 孔子, <论语•为政>

5
ABSTRACT
Currently, a high penetration level of Distributed Generations (DGs), such as Wind Turbines (WTs) and Combined Heat and Power plants (CHPs), has been observed in the Danish distribution systems, and even more DGs are foreseen to be present in the com-ing years. With adequate DGs available, how to utilize them for maintaining the secu-rity of the power supply under the emergency situations, has been of great interest for study. One proposal is the intentional island operation. This PhD project is intended to develop a control architecture for the island operation in distribution system with high amount of DGs. As part of the NextGen project, this project focuses on the system modeling and simula-tion regarding the control architecture and recommends the development of a communi-cation and information exchange system based on IEC 61850. This thesis starts with the background of this PhD project, followed by an overview of three existing activities that are related to island operation. Afterwards, the experience of the planned island operation both in Bornholm, Denmark and Canada is discussed. Thereafter, an Islanding Security Region (ISR) concept is established based on which the Islanding Control Architecture with its associated coordination scheme (ICA) is designed. Moreover, an investigation of different factors that affect the ISR concept is performed, and different case studies about the ICA demonstration are conducted in DIgSI-LENT/PowerFactory. Both the 2-Dimension ISR (with one lumped generator and one lumped load) and the 3-Dimension ISR (with one generator, one WT, and one lumped load) are plotted. The influence of the Demand as Frequency controlled Reserve (DFR) on the ISR is investigated. A specific coordination scheme between WT and load is de-signed and implemented. Furthermore, the feasibility of the application of Artificial Neural Network (ANN) to ICA is studied, in order to improve the computation efficiency for ISR calculation. Finally, the integration of ICA into Dynamic Security Assessment (DSA), the ICA im-plementation, and the development of ICA are discussed.


7
RESUMÉ
Antallet af vindmøller og kraftvarmeværker, der er tilsluttet det danske elsystem, vok-ser, og størrelsen af denne decentrale elproduktion kan forventes at stige yderligere i de kommende år. Derfor er det relevant at analysere, hvorledes den decentral elproduktion kan kontrolleres med henblik på at opnå en høj grad af forsyningssikkerhed, herunder bidrage i kritiske driftssituationer. Indførelsen af ø-drift i elnettet forventes at udgøre en mulighed for at skabe øget forsyningssikkerhed. Formålet med dette ph.d. projekt er at designe en kontrolarkitektur for ø-drift af distributionssystemer med mange decentrale produktionsenheder. Fokus i afhandlingen er systemmodellering og simulation af el-systemets kontrolarkitektur. Projektet anbefaler udviklingen af et kommunikations- og informationsystem baseret på IEC 61850. Indledningsvist sættes de problemstillinger, som behandles i ph.d.-afhandlingen ind i en større sammenhæng og der gives en kort beskrivelse af tre eksisterende aktiviteter, som er beslægtet med ø-drift. Dernæst diskuteres eksisterende erfarninger med planlagt ø-drift på Bornholm, i Danmark og i Canada. Ph.d.-afhandlingen udvikler et nyt koncept med driftsregioner for sikker ø-drift (Islanding Security Region (ISR)). Udviklingen af dette begreb baserer sig på den i afhandlingen designede kontrolarkitektur for ø-drift i elsystemet og en tilhørende koordinationsplan (Islanding Control Architecture (ICA)). Videre analyserer afhandlingen en række forskellige faktorers indflydelse på regional ø-driftssikkerhed. For at vise den positive indvirkning på forsyningssikkerheden, som den i afhandlingen udviklede kontrolarkitektur har i et givent elsystem, udføres forskellige casestudier i simuleringssprogrammerne DIgSILENT/PowerFactory. Der foretages si-muleringer, hvor både to-dimentionel ISR (hvor henholdsvis generatorer og elforbruger er aggregeret) og tre-dimensionel ISR (hvor henholdsvis generatorer, vindmøller og alt elforbrug er aggregeret) genereres og plottes. Ligeledes simuleres virkningerne af at anvende elforbrug som frekvensstyret reserve (Demand as Frequency controlled Reser-ve (DFR)). Med udgangspunkt i disse simuleringer udvikles der i afhandlingen en koor-dinationsplan med vindmøller og elforbrug, som afprøves i nye simuleringer. Endeligt vurderer afhandlingen, hvorvidt det er muligt at anvende neurale netværk i opbygning af en kontrolarkitektur. Formålet er at afdække, hvorvidt anvendelsen af neu-rale netværk vil lette computerberegningerne i forbindelse med udarbejdelsen af en gi-ven kontrolarkitektur for ø-drift. Til sidst diskuterer afhandlingen, hvorledes en kontrol-arkitektur for ø-drift integreres i en overordnet dynamisk sikkerhedstruktur (Dynamic Security Assessment (DSA)) samt hvorledes en given kontrolarkitektur udvikles og im-plementeres. Projektet indgår som en del af NextGen projektet.


9
摘要
目前,在丹麦的电力配电网中,涌现出大量诸如风机和热电联产电厂的可再生和高能源利用率的分布式电源。据预测,未来几年内,将出现更多的分布式电源。如此高的分布式电源并网接入水平使得对如何控制他们以保证供电安全性,特别是在紧急情况下的供电安全性的研究成为热点。在这样的背景之下,一种较可行的方案是进行有意识的孤岛运行。本论文项目旨在发展专为电力配电网在运行扰动或是故障的情况下进行有意识孤岛运行的控制架构。
作为“下一代电源”项目的一部分,本项目关注于对控制架构的系统建模和仿真以及针对基于IEC 61850国际标准的通信交换系统提出相关建议。
本论文以对此博士论文项目的背景介绍开篇,紧接着介绍三个现存的有关孤岛运行的项目。然后讨论在丹麦博恩霍姆岛(Bornholm)以及在加拿大有关孤岛运行的经验。之后,本论文创新性地提出孤岛安全域(Islanding Security Region (ISR))的概念并在此基础上设计了包括协调方案在内的孤岛控制架构(Islanding Control Architecture with its associated coordination scheme (ICA))。
在本论文中,作者对影响孤岛安全域的不同因素进行了研究。这些不同因素可以是以运行约束形式来表达的孤岛评估标准,可以是负载特性,可以是发电机的调速器率,可以是发电机电压调节器增益,抑或是在发电机组中不同的调度功率比。在这之后,作者针对所提出的孤岛控制架构,利用商用系统仿真工具DIgSILENT/PowerFactory,进行了不同的实例研究,绘制了二维孤岛安全域和三维孤岛安全域,分析了可作为频率可控备用源的需求侧对孤岛安全域的影响。同时,本文具体设计并实施了一个在风机和负载之间进行的协调方案。
此外,本论文还对人工神经网络在孤岛控制架构中的应用的可行性进行了研究。目的是为了探析利用神经网络来解决繁重计算负担的可能性。
最后,作者对孤岛控制架构集成于动态安全评估,孤岛控制架构的落实及其发展进行了探讨。


11
ACKNOWLEDGEMENT
As one task of the three-year PhD program at Technical University of Denmark (DTU), this thesis study is the third part of NextGen project, funded by Danish Transmission System Operator (TSO) Energinet.dk. The whole program started on April 1st, 2007, and it was mainly carried out at the Centre for Electric Technology (CET), Department of Electrical Engineering, DTU, except a period of external stay study at Natural Re-sources Canada's CanmetENERGY, Varennes, Québec, Canada, from May 4th to July 24th, 2009. I must above all present thanks to my supervisors: Professor Jacob Østergaard and Dr. Zhao Xu (Associate Professor at CET DTU, previously; Assistant Professor at the Hong Kong Polytechnic University, presently). I appreciate Jacob’s sparkling ideas and guide for this research topic, and his support and trust for independent study. I benefited a lot from Zhao’s experience in programming (Matlab, SAS, and DPL/PowerFactory) and simulation (PowerFactory). I also learned pretty much from his way of thinking and research. Equally, I would like to thank Associate Professor John Eli Nielsen for the time work-ing together on the PMU data for Bornholm island operation in September 2007, and for his very good contact with CanmetENERGY, which realized my study visit there. I must thank Professor Morten Lind for his leadership in Ecogrid.dk project Phase One Work Package 2, where we had comprehensive discussions about future power system architecture. His systematic thinking of automation provided me another angle to under-stand the power system. My sincere thanks go to Associate Professor Arne Hejde Nielsen and Associate Profes-sor Knud Ole Helgesen Pedersen (from Siemens Wind Power). Their solid knowledge about CET PMU dragged me out of the suffering from the PMU study. I must thank Director Lisa Dignard-Bailey from CanmetENERGY. Her appropriate arrangement made my work done efficiently and my life comfortable in Canada. I also appreciate Dr. Chad Abbey (now in Hydro Québec) for his professional knowledge on island operation, as well as Dave Turcotte for his help about PSCAD, Reinaldo Ton-koski for his arrangement of my visit to Concordia University, and many other col-leagues at CanmetENERGY. Merci. I had excellent colleagues at CET. Germán Claudio Tarnowski taught me a lot about wind turbine modeling and simulation. I would also like to thank Hjörtur Jóhannsson for his expertise on Matlab and power system stability, Friđrik Rafn Ísleifsson for his knowledge about the PMU data extraction, Preben Nyeng for discussion about NextGen project. I must thank Shi You, Arshad Saleem, Kai Heußen, Nenad Mijatovic, and many

Acknowledgement
12
other PhD students for sharing study experience and social activities together like broth-ers. I appreciate the consistent care and help from Louise Busch-Jensen during the last three years. Equally, I must thank other colleagues from CET who ever helped me dur-ing my study period. Last but absolutely not least, I must present my thanks and love to my parents. No words can exactly describe their infinite care, love and support. It was, it is, and it will be.
13
TABLE OF CONTENTS
Abstract ........................................................................................................................... 5
Resumé............................................................................................................................. 7
摘要 .................................................................................................................................. 9
Acknowledgement......................................................................................................... 11
Acronyms and Abbreviations ...................................................................................... 17
1 Background ........................................................................................................... 19 1.1 Opportunities and challenges for Danish power system................................. 19 1.2 Overview of NextGen project......................................................................... 20 1.3 Overview of NextGen project Part 3 .............................................................. 22 1.4 Chapters in thesis ............................................................................................ 23 1.5 Publications..................................................................................................... 24
2 Introduction........................................................................................................... 25 2.1 Overview of island operation.......................................................................... 25 2.2 Islanding related activities .............................................................................. 26
2.2.1 Island operation in European project - MicroGrids ................................ 26 2.2.2 Island operation in Danish Cell Controller Pilot Project ........................ 28 2.2.3 Islanding guide - IEEE P1547.4 Standard draft...................................... 29
2.3 Definitions of island operation ....................................................................... 30
3 Planned Island operation in Practice .................................................................. 35 3.1 Danish experience – Bornholm island operation............................................ 35 3.2 Canadian experience ....................................................................................... 36
3.2.1 BC Hydro Boston Bar............................................................................. 38 3.2.2 Hydro Québec Senterre........................................................................... 39
4 Islanding Security Region based Control Architecture .................................... 41 4.1 Architecture components ................................................................................ 41
4.1.1 Synchronous generator ........................................................................... 42 4.1.2 Wind turbine ........................................................................................... 44 4.1.3 Demand................................................................................................... 45
4.1.3.1 Demand as Frequency controlled Reserve.......................................... 45
Table of Contents
14
4.1.3.2 Load shedding .....................................................................................46 4.2 Requirements for control architecture.............................................................46 4.3 Islanding Security Region based control architecture.....................................46
4.3.1 Islanding Security Region .......................................................................47 4.3.2 Coordination scheme in architecture.......................................................53
5 Investigation of Factors Affecting Islanding Security Region...........................55 5.1 Criteria influence.............................................................................................55 5.2 Other factors affecting the Islanding Security Region ....................................58
5.2.1 Load characteristics.................................................................................59 5.2.2 Droop of governor ...................................................................................60 5.2.3 Gain of voltage regulator.........................................................................61 5.2.4 Power dispatches among generators........................................................61
6 Case Study for Islanding Control Architecture..................................................65 6.1 System modeling and simulation ....................................................................66
6.1.1 System introduction.................................................................................66 6.1.2 System preparation ..................................................................................67 6.1.3 Validation of hydro-power generator model ...........................................68 6.1.4 DFR introduction.....................................................................................75 6.1.5 Wind turbine introduction .......................................................................75 6.1.6 Load shedding introduction.....................................................................82
6.2 Coordination scheme.......................................................................................83 6.3 Case study........................................................................................................84
6.3.1 Case study 1: ISR with synchronous generator.......................................85 6.3.2 Case study 2: ISR with synchronous generator and Demand as Frequency controlled Reserve .................................................................................86 6.3.3 Case study 3: ISR with synchronous generator and wind turbine...........87 6.3.4 Case study 4: the coordination scheme ...................................................89
7 Artificial Neural Network Application to Islanding Control Architecture .....93 7.1 Artificial Neural Network introduction...........................................................93 7.2 Application for Islanding Security Region......................................................95 7.3 Application for Islanding Control Architecture ..............................................97
8 Implementation and Development of the Architecture ...................................103 8.1 Architecture implementation.........................................................................103
8.1.1 Integration into Dynamic Security Assessment ....................................103 8.1.2 Components description........................................................................104 8.1.3 Structure for integration ........................................................................105 8.1.4 Implementation description...................................................................106 8.1.5 Monitoring, Information exchange and Control....................................107
8.2 Architecture development .............................................................................108
Table of Contents
15
8.2.1 Architecture extension .......................................................................... 108 8.2.2 Extra consideration for coordination scheme design............................ 110
9 Conclusion and Future Work ............................................................................ 113 9.1 Conclusion .................................................................................................... 113
9.1.1 Concept design and application ............................................................ 113 9.1.2 Application of Artificial Neural Network............................................. 114 9.1.3 Architecture implementation ................................................................ 114
9.2 Future work................................................................................................... 114 9.2.1 Concept development ........................................................................... 115 9.2.2 Modeling and simulation ...................................................................... 115 9.2.3 Test ....................................................................................................... 115
References.................................................................................................................... 117
A Paper for Bornholm Island operation................................................................... 127
B Paper for Islanding Data Analysis......................................................................... 129
C Paper for Architecture Design ............................................................................... 131
D Data Examples For Artificial Neural Network .................................................... 133


17
ACRONYMS AND ABBREVIATIONS
AGC Automatic Generation Control GHG GreenHouse Gas
ANN Artificial Neural Network HV High Voltage
AVR Automatic Voltage Regulator ICA Islanding Control Architecture
CB Circuit Breaker ICT Information and Communication Technology
CCPP Cell Controller Pilot Project IEC International Electrotechnical Commission
CET Centre for Electric Technology IEEE Institute of Electrical and Elec-tronics Engineers
CHP Combined Heat and Power plant IPP Independent Power Producer
COP15 UN Climate Change Conference, Copenhagen
ISR Islanding Security Region
DER Distributed Energy Resource LV Low Voltage
DFR Demand as Frequency controlled Reserve
MC Microsource Controller
DG Distributed Generation MGCC MicroGrid Central Controller
DPL DIgSILENT Programming Lan-guage
MIC Monitoring, Information exchange and Control
DR Distributed Resouce MLP Multi-Layer Perceptron
DSA Dynamic Security Assessment MMO Multi-Master Operation
DSO Distribution System Operator MSE Mean Squared Error
DTU Technical University of Denmark NWPC Nordic Wind Power Conference
EMS Energy Management System P Active power
ENTSO-E European Network of Transmis-sion System Operators for Elec-tricity
PCC Point of Common Coupling
EPS Electric Power System PCU Primary Controller Unit
EU European Union PEP Power Export Pattern
FP5 (7) The European 5th (7th ) Frame-work Programme
PF DIgSILENT/PowerFactory
FSIG Fixed Speed Induction Generator PIP Power Import Pattern

Acronyms and Abbreviations
18
PMU Phasor Measurement Unit
PSCAD Electromagnetic time domain transient simulation tool
Q Reactive power
RES Renewable Energy Source
RLC resistance, inductance, capaci-tance
RMS Root Mean Square
ROCOF Rate Of Change Of Frequency
RPSI Real Power Space for Islanding
SA Security Assessment
SAIDI System Average Interruption Duration Index
SAIFI System Average Interruption Frequency Index
SAS Statistical Analysis System tool
SCADA Supervisory Control And Data Acquisition
SCC21 IEEE Standards Coordinating Committee 21 on Fuel Cell, Photovoltaics, Dispersed Gen-eration, and Energy Storage
SMO Single Master Operation
SS State Space
TSO Transmission System Operator
UCTE Union for the Coordination of the Transmission of Electricity
UFLS Under Frequency Load Shedding
UN United Union
UPEC University Power Engineering Conference
VSI Voltage Source Inverter
WAMS Wide Area Monitoring System
WT Wind Turbine
19
1 BACKGROUND
This chapter starts with a brief introduction to the opportunities and the associated chal-lenges that the Danish power system is facing, followed by a general introduction to the NextGen project. Finally, the summary of each chapter is presented.
1.1 Opportunities and challenges for Danish power system Climate change and energy security has stimulated the global awareness of both utiliza-tion of renewable energy and energy efficiency. On the one hand, the United Nations (UN) Climate Change Conference (COP15) in Copenhagen, Denmark, concluded with the Copenhagen Accord on December 18, 2009, stating a strong worldwide political will to urgently combat climate change [1-1]. On the other hand, both European Union (EU) and Danish government have already taken actions. In Europe, two key targets have been set by European Council regarding the EU’s cli-mate and energy policy [1-2]:
• A reduction of at least 20% in greenhouse gases (GHG) by 2020; • A 20% share of renewable energies in EU energy consumption by 2020.
This brings in opportunities for the development of both renewable energy and energy efficiency technology, which are two of main tools to deliver the targets. A great num-ber of related research projects have been set up across Europe, financed by the EU funding - under the Seventh framework programme for research and technological de-velopment (FP7) [1-3] [1-4]. In Denmark, “A visionary Danish energy policy 2025”, published by the Danish gov-ernment in early 2007 [1-5], underlines efficient energy generation and consumption, renewable energy (the share of renewable energy must be increased to at least 30% of energy consumption by 2025), and more efficient energy technologies as crucial areas to achieve the following targets by 2025:
• Reduce the use of fossil fuels by at least 15% compared with today; • Effectively counteract rises in overall energy consumption, which must remain
static. This indicates that 50% of total electricity demand in Denmark by 2025 will be supplied by Wind Turbines (WTs) [1-6], and the status of Combined Heat and Power plants (CHPs) (especially CHPs fueled by renewable energy) will be strengthened, which has been extremely important for improving energy efficiency in Denmark [1-7, p. 5].
Background
20
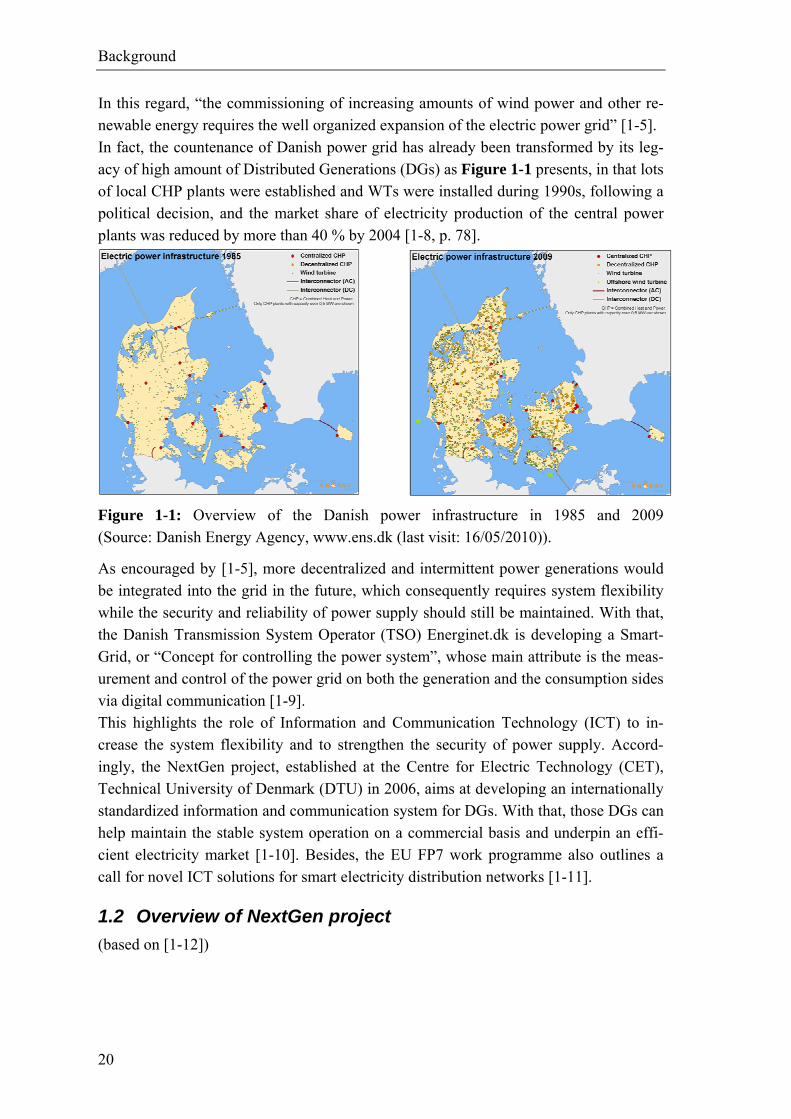
In this regard, “the commissioning of increasing amounts of wind power and other re-newable energy requires the well organized expansion of the electric power grid” [1-5]. In fact, the countenance of Danish power grid has already been transformed by its leg-acy of high amount of Distributed Generations (DGs) as Figure 1-1 presents, in that lots of local CHP plants were established and WTs were installed during 1990s, following a political decision, and the market share of electricity production of the central power plants was reduced by more than 40 % by 2004 [1-8, p. 78].
Figure 1-1: Overview of the Danish power infrastructure in 1985 and 2009 (Source: Danish Energy Agency, www.ens.dk (last visit: 16/05/2010)).
As encouraged by [1-5], more decentralized and intermittent power generations would be integrated into the grid in the future, which consequently requires system flexibility while the security and reliability of power supply should still be maintained. With that, the Danish Transmission System Operator (TSO) Energinet.dk is developing a Smart-Grid, or “Concept for controlling the power system”, whose main attribute is the meas-urement and control of the power grid on both the generation and the consumption sides via digital communication [1-9]. This highlights the role of Information and Communication Technology (ICT) to in-crease the system flexibility and to strengthen the security of power supply. Accord-ingly, the NextGen project, established at the Centre for Electric Technology (CET), Technical University of Denmark (DTU) in 2006, aims at developing an internationally standardized information and communication system for DGs. With that, those DGs can help maintain the stable system operation on a commercial basis and underpin an effi-cient electricity market [1-10]. Besides, the EU FP7 work programme also outlines a call for novel ICT solutions for smart electricity distribution networks [1-11].
1.2 Overview of NextGen project (based on [1-12])
Background
21
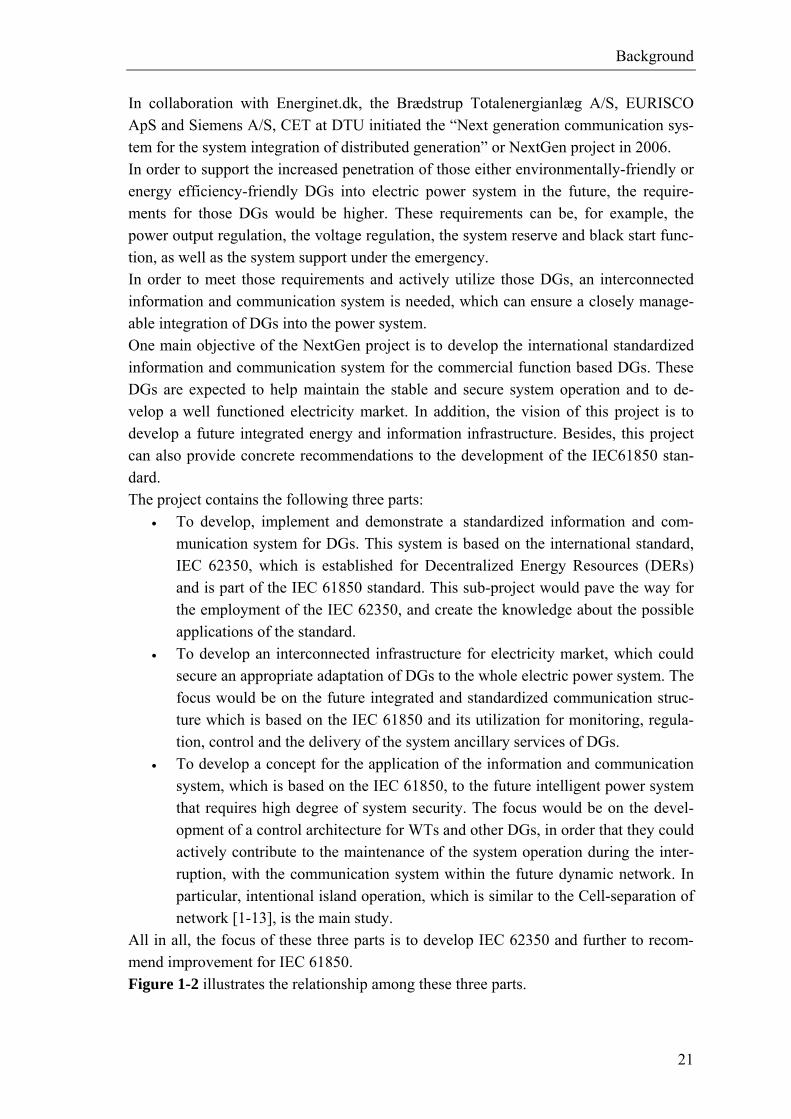
In collaboration with Energinet.dk, the Brædstrup Totalenergianlæg A/S, EURISCO ApS and Siemens A/S, CET at DTU initiated the “Next generation communication sys-tem for the system integration of distributed generation” or NextGen project in 2006. In order to support the increased penetration of those either environmentally-friendly or energy efficiency-friendly DGs into electric power system in the future, the require-ments for those DGs would be higher. These requirements can be, for example, the power output regulation, the voltage regulation, the system reserve and black start func-tion, as well as the system support under the emergency. In order to meet those requirements and actively utilize those DGs, an interconnected information and communication system is needed, which can ensure a closely manage-able integration of DGs into the power system. One main objective of the NextGen project is to develop the international standardized information and communication system for the commercial function based DGs. These DGs are expected to help maintain the stable and secure system operation and to de-velop a well functioned electricity market. In addition, the vision of this project is to develop a future integrated energy and information infrastructure. Besides, this project can also provide concrete recommendations to the development of the IEC61850 stan-dard. The project contains the following three parts:
• To develop, implement and demonstrate a standardized information and com-munication system for DGs. This system is based on the international standard, IEC 62350, which is established for Decentralized Energy Resources (DERs) and is part of the IEC 61850 standard. This sub-project would pave the way for the employment of the IEC 62350, and create the knowledge about the possible applications of the standard.
• To develop an interconnected infrastructure for electricity market, which could secure an appropriate adaptation of DGs to the whole electric power system. The focus would be on the future integrated and standardized communication struc-ture which is based on the IEC 61850 and its utilization for monitoring, regula-tion, control and the delivery of the system ancillary services of DGs.
• To develop a concept for the application of the information and communication system, which is based on the IEC 61850, to the future intelligent power system that requires high degree of system security. The focus would be on the devel-opment of a control architecture for WTs and other DGs, in order that they could actively contribute to the maintenance of the system operation during the inter-ruption, with the communication system within the future dynamic network. In particular, intentional island operation, which is similar to the Cell-separation of network [1-13], is the main study.
All in all, the focus of these three parts is to develop IEC 62350 and further to recom-mend improvement for IEC 61850. Figure 1-2 illustrates the relationship among these three parts.
Background
22
Figure 1-2: Relationship between three parts in NextGen project.
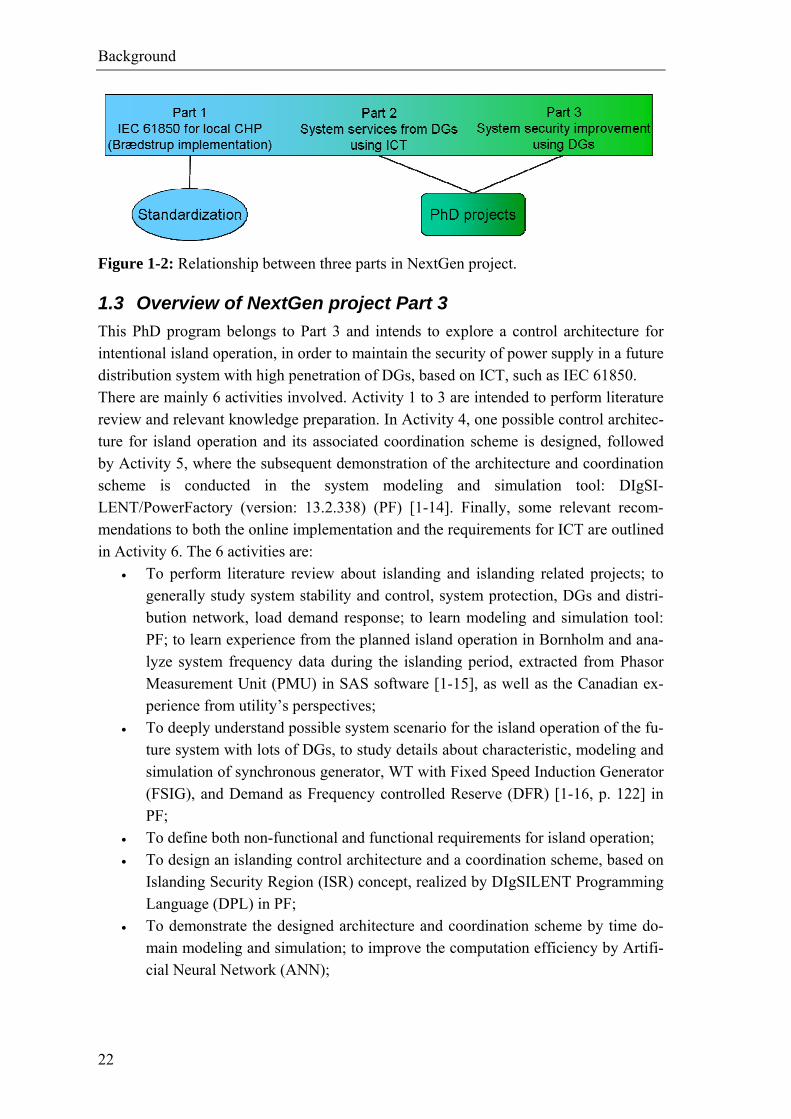
1.3 Overview of NextGen project Part 3 This PhD program belongs to Part 3 and intends to explore a control architecture for intentional island operation, in order to maintain the security of power supply in a future distribution system with high penetration of DGs, based on ICT, such as IEC 61850. There are mainly 6 activities involved. Activity 1 to 3 are intended to perform literature review and relevant knowledge preparation. In Activity 4, one possible control architec-ture for island operation and its associated coordination scheme is designed, followed by Activity 5, where the subsequent demonstration of the architecture and coordination scheme is conducted in the system modeling and simulation tool: DIgSI-LENT/PowerFactory (version: 13.2.338) (PF) [1-14]. Finally, some relevant recom-mendations to both the online implementation and the requirements for ICT are outlined in Activity 6. The 6 activities are:
• To perform literature review about islanding and islanding related projects; to generally study system stability and control, system protection, DGs and distri-bution network, load demand response; to learn modeling and simulation tool: PF; to learn experience from the planned island operation in Bornholm and ana-lyze system frequency data during the islanding period, extracted from Phasor Measurement Unit (PMU) in SAS software [1-15], as well as the Canadian ex-perience from utility’s perspectives;
• To deeply understand possible system scenario for the island operation of the fu-ture system with lots of DGs, to study details about characteristic, modeling and simulation of synchronous generator, WT with Fixed Speed Induction Generator (FSIG), and Demand as Frequency controlled Reserve (DFR) [1-16, p. 122] in PF;
• To define both non-functional and functional requirements for island operation; • To design an islanding control architecture and a coordination scheme, based on
Islanding Security Region (ISR) concept, realized by DIgSILENT Programming Language (DPL) in PF;
• To demonstrate the designed architecture and coordination scheme by time do-main modeling and simulation; to improve the computation efficiency by Artifi-cial Neural Network (ANN);
Background
23
• To recommend the possible implementation of the islanding architecture and the requirements for ICT; to explore the potential integration into the Dynamic Se-curity Assessment (DSA) in Supervisory, Control And Data Acquisition (SCADA)/Energy Management System (EMS).
1.4 Chapters in thesis This PhD thesis includes nine chapters. Chapter 1 (this chapter) in general presents opportunities and challenges for the Danish electric power system, followed by an overview of NextGen project, to which this PhD project belongs. This chapter finalizes with the summary of every chapter. Chapter 2 starts with an overview about island operation. Afterwards, several island operation related activities such as EU MicroGrids project [1-17], Danish Cell Control-ler Pilot Project (CCPP) [1-9, 1-13], and IEEE 1547.4 standard draft for Distributed Resource island systems [1-18] are introduced. The definitions of island operation from different entities are presented in the end. Chapter 3 discusses the island operation experience from both Denmark and Canada. In Denmark, the experience learned from the one-week long island operation test in Born-holm is of great importance to understand the operation difficulty with large amount of wind energy; while in Canada, the focus is on the application of small/medium size DGs to the planned island operation for the purpose of system reliability improvement. In Chapter 4, different components considered in the architecture design are introduced, and requirements for islanding architecture are defined. Besides, this chapter presents the ISR concept, which is the base for the proposed Islanding Control Architecture and its associated coordination scheme (ICA). Subsequently, a 2-Dimension ISR is plotted for a study system that is based on a 9-bus demo model in PF [1-19] [1-20, pp. 37-39]. Chapter 5 analyzes the influence of different factors on ISR, such as the criteria for ISR, the load characteristics, the droop of governor, the gain of voltage regulator, and differ-ent power dispatches for generators. Chapter 6 starts with the description of a Canadian rural feeder benchmark, based on which a WT with FSIG and a DFR function is modeled. Afterwards, a specific coordi-nation scheme of ICA among load and WT is designed and presented. In the end, this chapter conducts four study cases to demonstrate the ICA. In order to tackle the multi-dimension issue for the ISR and also the heavy computation burden, the Artificial Neural Network (ANN) technique is suggested and applied in Chapter 7. The feasibility of ANN is proved by comparing the ANN results with the analytically obtained ISR, which is explained in this chapter. Chapter 8 further explores the potential online application of ICA to DSA, including the implementation structure and the requirements for Monitoring, Information exchange and Control (MIC). This chapter also discusses the possible extension of ICA to trans-mission level, from which both Transmission System Operator (TSO) and Distribution
Background
24
System Operator (DSO) may benefit. Finally, the influence of generator response speed on the coordination scheme design is discussed. Chapter 9 concludes the PhD thesis with several highlights.
1.5 Publications Published: [A] Yu Chen, Zhao Xu, and Jacob Østergaard, “Frequency Analysis for Planned
Island operation in the Danish Distribution System – Bornholm,” 43rd interna-tional Universities Power Engineering Conference, Padova, Italy, September 1-4, 2008.
[B] Yu Chen, Zhao Xu, Jacob Østergaard, “Control Mechanism and Security Region for Intentional Islanding Transition,” IEEE PES General Meeting, Calgary, Can-ada, July 26-30 July, 2009.
[C] Yu Chen, Zhao Xu, and Jacob Østergaard, “PMU Frequency Data Processing for A Planned Island operation in Bornholm,” Nordic Wind Power Conference, Bornholm, Denmark, September 10-11, 2009.
Submitted: [D] Yu Chen, Zhao Xu, and Jacob Østergaard, “Security Assessment for Intentional
Island operation in Distribution Network with Distributed Generations,” Electric Power Systems Research, journal ELSEVIER, submitted, May 2010.
[E] Yu Chen, Zhao Xu, and Jacob Østergaard, “Islanding Control Architecture and Its Application to A Distribution System with Both Demand and Wind Turbine Control,” IEEE Transactions on Power Systems, submitted, May 2010.
25
2 INTRODUCTION
This chapter provides an overview of the island operation and its related research and development activities, including the European MicroGrids, the Danish Cell Controller Pilot Project (CCPP), and the IEEE P1547.4 standard draft. Afterwards, islanding defi-nitions by different entities are introduced, together with the definitions used in this PhD study.
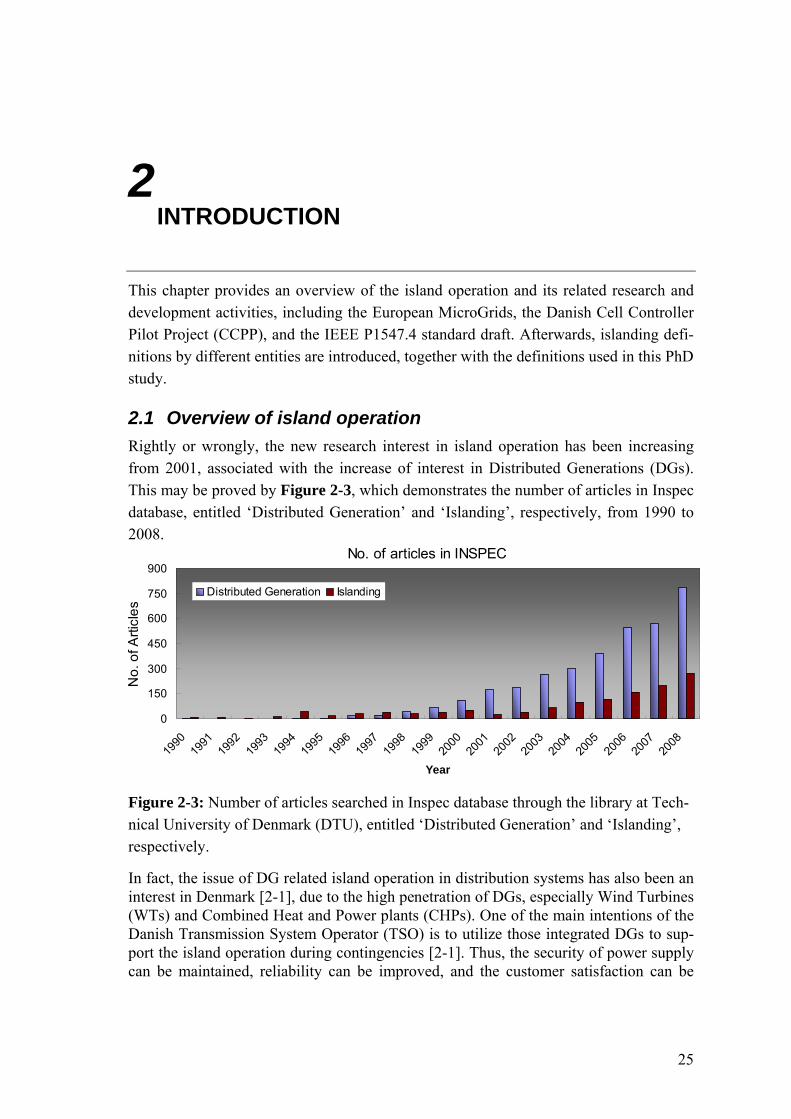
2.1 Overview of island operation Rightly or wrongly, the new research interest in island operation has been increasing from 2001, associated with the increase of interest in Distributed Generations (DGs). This may be proved by Figure 2-3, which demonstrates the number of articles in Inspec database, entitled ‘Distributed Generation’ and ‘Islanding’, respectively, from 1990 to 2008.
No. of articles in INSPEC
0
150
300
450
600
750
900
1990
1991
1992
1993
1994
1995
1996
1997
1998
1999
2000
2001
2002
2003
2004
2005
2006
2007
2008
Year
No.
of A
rticl
es
Distributed Generation Islanding
Figure 2-3: Number of articles searched in Inspec database through the library at Tech-nical University of Denmark (DTU), entitled ‘Distributed Generation’ and ‘Islanding’, respectively.
In fact, the issue of DG related island operation in distribution systems has also been an interest in Denmark [2-1], due to the high penetration of DGs, especially Wind Turbines (WTs) and Combined Heat and Power plants (CHPs). One of the main intentions of the Danish Transmission System Operator (TSO) is to utilize those integrated DGs to sup-port the island operation during contingencies [2-1]. Thus, the security of power supply can be maintained, reliability can be improved, and the customer satisfaction can be
Introduction
26
met. These contingencies could be the congestion pressure in nearby line, natural dis-turbances or others. However, there are many technical challenges related to the island operation with DGs, which we should tackle before marching towards the objective:
• The lack of architecture for system control with higher and higher penetration of DGs;
• Different generation mix, especially with intermittent DGs and power electron-ics interface;
• Flexible protection settings for island operation, related to criteria for successful island operation;
• The demand participation for power balance during islanding is expected; • The controllability of DGs and demand is required; • The coordination among DGs and demand is required; • Fast response speed of DGs and demand is anticipated; • Monitoring, measuring, Information and Communication Technology (ICT) is
needed. There are already several attempts, aiming at removing some of those hurdles, such as the EU CLUSTER RES+DG [2-2]. Among others, European MicroGrids project [2-3], Danish CCPP [2-1], and IEEE P1547.4 standard draft [2-4] will be mainly discussed as follows.
2.2 Islanding related activities
2.2.1 Island operation in European project - MicroGrids Under the European fifth framework programme (FP5), the MicroGrids project, entitled “Large Scale Integration of Micro-Generation to Low Voltage Grids”, focuses on the operation of one single Microgrid with the following objectives [2-3]:
• To increase the penetration of Renewable Energy Source (RES) and other micro-sources in order to contribute to the reduction of Green House Gas (GHG) emissions;
• To study the main issues regarding the operation of Microgrids in paral-lel with the upstream grid and in islanding conditions that may follow faults;
• To define, develop and demonstrate control strategies that will ensure the most efficient, reliable and economic operation and management of Mi-crogrids;
• To define appropriate protection and grounding policies that will assure safety of operation and capability of fault detection, isolation and islanded operation;
• To identify the needs and develop the telecommunication infrastructures and communication protocols required;
Introduction
27
• To determine the economic benefits of the Microgrid operation and to propose systematic methods and tools to quantify these benefits and to propose appropriate regulatory measures.
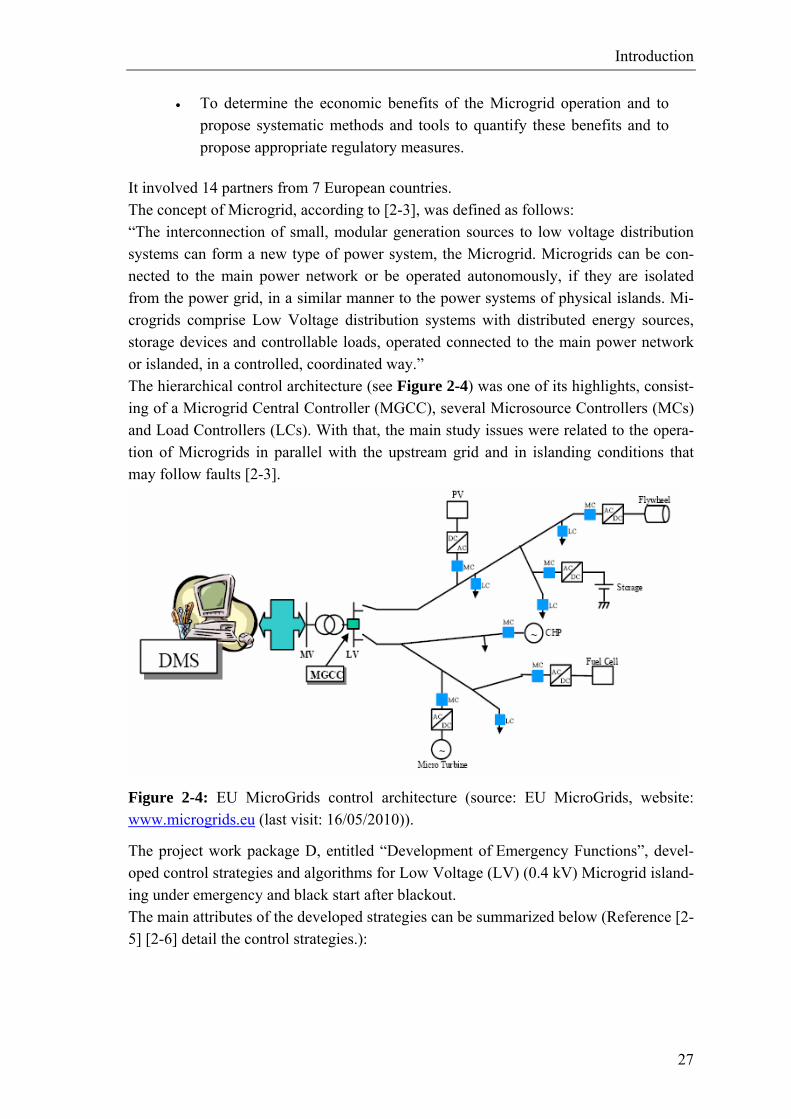
It involved 14 partners from 7 European countries. The concept of Microgrid, according to [2-3], was defined as follows: “The interconnection of small, modular generation sources to low voltage distribution systems can form a new type of power system, the Microgrid. Microgrids can be con-nected to the main power network or be operated autonomously, if they are isolated from the power grid, in a similar manner to the power systems of physical islands. Mi-crogrids comprise Low Voltage distribution systems with distributed energy sources, storage devices and controllable loads, operated connected to the main power network or islanded, in a controlled, coordinated way.” The hierarchical control architecture (see Figure 2-4) was one of its highlights, consist-ing of a Microgrid Central Controller (MGCC), several Microsource Controllers (MCs) and Load Controllers (LCs). With that, the main study issues were related to the opera-tion of Microgrids in parallel with the upstream grid and in islanding conditions that may follow faults [2-3].
Figure 2-4: EU MicroGrids control architecture (source: EU MicroGrids, website: www.microgrids.eu (last visit: 16/05/2010)).
The project work package D, entitled “Development of Emergency Functions”, devel-oped control strategies and algorithms for Low Voltage (LV) (0.4 kV) Microgrid island-ing under emergency and black start after blackout. The main attributes of the developed strategies can be summarized below (Reference [2-5] [2-6] detail the control strategies.):

Introduction
28
• Voltage Source Inverter (VSI) or/and conventional synchronous generator for frequency and voltage control (either under Single Master Operation (SMO) or Multi Master Operation (MMO)) after the island operation;
• Storage devices, such as flywheels, battery with power electronics interface, for primary frequency and voltage control;
• Load shedding participation in primary frequency control, when large frequency excursion or storage overload occurs.
Meanwhile, there are also some limits and uncertainties: several pre-specified condi-tions assumed, which causes the lack of overall understanding for all possible operating states, no participation of Wind Turbines (WTs) in frequency control; the lack of coor-dination either between generators or between generators and loads. Besides, this strat-egy is designed for LV Microgrids. Nevertheless, plenty of the strengths, exposed in MicroGrids project, are of great use and value to guide the further development and application of MicroGrids concept.
2.2.2 Island operation in Danish Cell Controller Pilot Project CCPP was initiated by Danish TSO Energinet.dk in 2004. For the purpose of pursuing the intelligent mobilization of local power generation, CCPP aims to ensure that the Danish power system is adapted to the future requirements by increasing the extent of system control and monitoring, to maintain the high degree of security of power supply, and to support the liberalized power market, as a great amount of DGs are expected to be integrated into the system [2-7]. More details about CCPP can be found in [2-1] [2-7]-[2-9]. CCPP defines a distribution cell as each sectionized, radially operated 60 kV network below each 150/60 kV transformer [2-1]. An entire pilot cell implementation is sched-uled for 2011. As the high ambition of CCPP, controlled island operation is expected to avoid blackout and eventually maintain the security of power supply in case a regional emergency situation occurs, reaching the point of no return. As [2-1] points out, “it is important to understand that each cell will be required to oper-ate in parallel with the High Voltage (HV) power system in any normal and stressed contingency situation….The only exception is that during a regional severely stressed situation as in an impending voltage collapse, where the point of no return has been reached, the Cell Controller can be allowed to transfer the cell into islanded operation.” In this regard, the immediate question would be how to define “stressed contingency situation” and “severely stressed situation” (or the point of no return), and how long the lead time prior to the island operation moment can be obtained. In [2-1], an early warn-ing system has been envisioned, which may provide the lead time for reactions. For the system operator, it would be beneficial to know beforehand whether or not the system can survive an island operation. The Islanding Security Region (ISR), proposed in this thesis, is specifically designed for this prupose. By comparing the system operat-
Introduction
29
ing state with its corresponding ISR in real time, the system operator can tell if a suc-cessful island operation can be performed. Further, once the lead time prior to the island operation moment is available, the operator can instantly initiate certain ISR based co-ordination scheme among generation and load to prepare for the coming island opera-tion if needed. Thus, a successful island operation can be more quickly and easily en-sured, thanks to the ISR and the lead time.
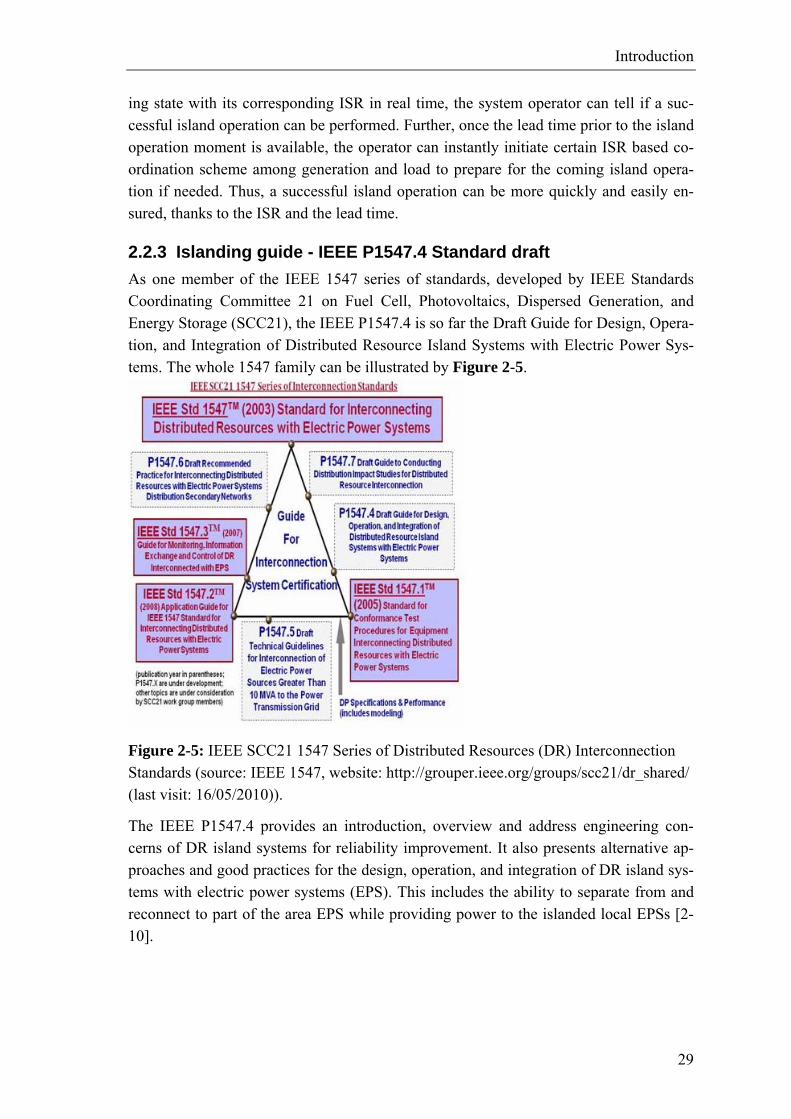
2.2.3 Islanding guide - IEEE P1547.4 Standard draft As one member of the IEEE 1547 series of standards, developed by IEEE Standards Coordinating Committee 21 on Fuel Cell, Photovoltaics, Dispersed Generation, and Energy Storage (SCC21), the IEEE P1547.4 is so far the Draft Guide for Design, Opera-tion, and Integration of Distributed Resource Island Systems with Electric Power Sys-tems. The whole 1547 family can be illustrated by Figure 2-5.
Figure 2-5: IEEE SCC21 1547 Series of Distributed Resources (DR) Interconnection Standards (source: IEEE 1547, website: http://grouper.ieee.org/groups/scc21/dr_shared/ (last visit: 16/05/2010)).
The IEEE P1547.4 provides an introduction, overview and address engineering con-cerns of DR island systems for reliability improvement. It also presents alternative ap-proaches and good practices for the design, operation, and integration of DR island sys-tems with electric power systems (EPS). This includes the ability to separate from and reconnect to part of the area EPS while providing power to the islanded local EPSs [2-10].

Introduction
30
Reference [2-4] defines six planned DR island systems: a local EPS island (facility is-land), a lateral island, a circuit island, a substation bus island, a substation island, and an adjacent circuit island, as shown in Figure 2-6.
Figure 2-6: Six DR island system configuration (source: [2-4]).
With the DR island system, there are several benefits as [2-4] points out, such as to im-prove reliability, to allow for maintenance, to resolve overload problems and power quality issues. By referring to the standard, we could better understand the concepts, definitions and engineering concerns in terms of island operation, which may help prepare for the re-search work and make it promising and executive.
2.3 Definitions of island operation There are several islanding related definitions by different entities. This PhD study has referred to some of them that are listed in Table 2-1.
Introduction
31
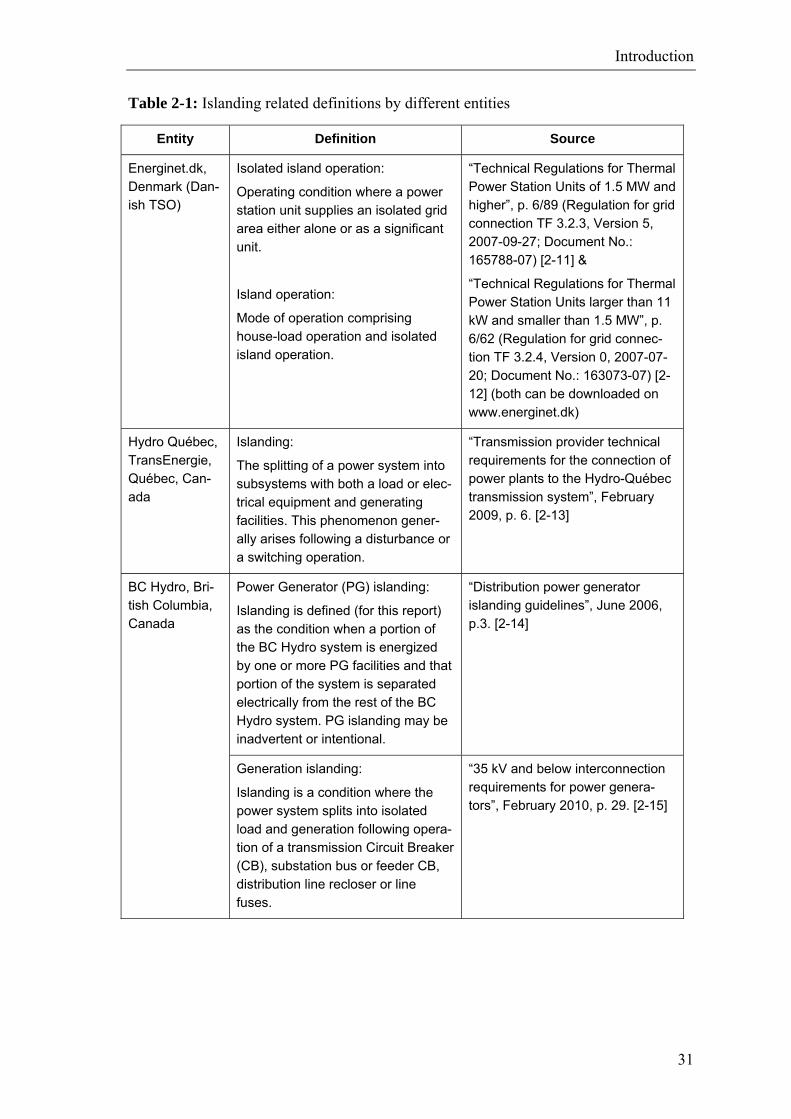
Table 2-1: Islanding related definitions by different entities
Entity Definition Source
Energinet.dk, Denmark (Dan-ish TSO)
Isolated island operation:
Operating condition where a power station unit supplies an isolated grid area either alone or as a significant unit.
Island operation:
Mode of operation comprising house-load operation and isolated island operation.
“Technical Regulations for Thermal Power Station Units of 1.5 MW and higher”, p. 6/89 (Regulation for grid connection TF 3.2.3, Version 5, 2007-09-27; Document No.: 165788-07) [2-11] &
“Technical Regulations for Thermal Power Station Units larger than 11 kW and smaller than 1.5 MW”, p. 6/62 (Regulation for grid connec-tion TF 3.2.4, Version 0, 2007-07-20; Document No.: 163073-07) [2-12] (both can be downloaded on www.energinet.dk)
Hydro Québec, TransEnergie, Québec, Can-ada
Islanding:
The splitting of a power system into subsystems with both a load or elec-trical equipment and generating facilities. This phenomenon gener-ally arises following a disturbance or a switching operation.
“Transmission provider technical requirements for the connection of power plants to the Hydro-Québec transmission system”, February 2009, p. 6. [2-13]
Power Generator (PG) islanding:
Islanding is defined (for this report) as the condition when a portion of the BC Hydro system is energized by one or more PG facilities and that portion of the system is separated electrically from the rest of the BC Hydro system. PG islanding may be inadvertent or intentional.
“Distribution power generator islanding guidelines”, June 2006, p.3. [2-14]
BC Hydro, Bri-tish Columbia, Canada
Generation islanding:
Islanding is a condition where the power system splits into isolated load and generation following opera-tion of a transmission Circuit Breaker (CB), substation bus or feeder CB, distribution line recloser or line fuses.
“35 kV and below interconnection requirements for power genera-tors”, February 2010, p. 29. [2-15]
Introduction
32
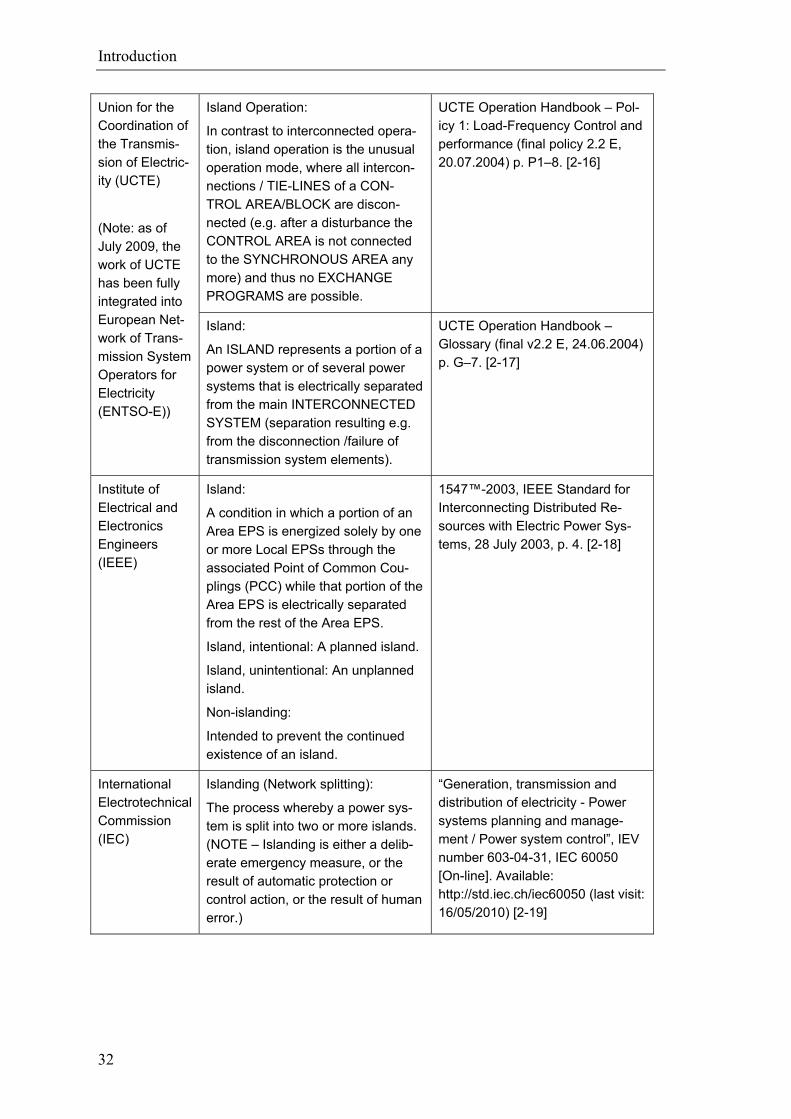
Island Operation:
In contrast to interconnected opera-tion, island operation is the unusual operation mode, where all intercon-nections / TIE-LINES of a CON-TROL AREA/BLOCK are discon-nected (e.g. after a disturbance the CONTROL AREA is not connected to the SYNCHRONOUS AREA any more) and thus no EXCHANGE PROGRAMS are possible.
UCTE Operation Handbook – Pol-icy 1: Load-Frequency Control and performance (final policy 2.2 E, 20.07.2004) p. P1–8. [2-16]
Union for the Coordination of the Transmis-sion of Electric-ity (UCTE)
(Note: as of July 2009, the work of UCTE has been fully integrated into European Net-work of Trans-mission System Operators for Electricity (ENTSO-E))
Island:
An ISLAND represents a portion of a power system or of several power systems that is electrically separated from the main INTERCONNECTED SYSTEM (separation resulting e.g. from the disconnection /failure of transmission system elements).
UCTE Operation Handbook – Glossary (final v2.2 E, 24.06.2004) p. G–7. [2-17]
Institute of Electrical and Electronics Engineers (IEEE)
Island:
A condition in which a portion of an Area EPS is energized solely by one or more Local EPSs through the associated Point of Common Cou-plings (PCC) while that portion of the Area EPS is electrically separated from the rest of the Area EPS.
Island, intentional: A planned island.
Island, unintentional: An unplanned island.
Non-islanding:
Intended to prevent the continued existence of an island.
1547™-2003, IEEE Standard for Interconnecting Distributed Re-sources with Electric Power Sys-tems, 28 July 2003, p. 4. [2-18]
International Electrotechnical Commission (IEC)
Islanding (Network splitting):
The process whereby a power sys-tem is split into two or more islands. (NOTE – Islanding is either a delib-erate emergency measure, or the result of automatic protection or control action, or the result of human error.)
“Generation, transmission and distribution of electricity - Power systems planning and manage-ment / Power system control”, IEV number 603-04-31, IEC 60050 [On-line]. Available: http://std.iec.ch/iec60050 (last visit: 16/05/2010) [2-19]
Introduction
33
For clarity and the relevance to this PhD study, three kinds of islanding have been de-fined as follows:
• Planned islanding: an operation condition where the distribution system is islanded when the power at the Point of Common Coupling (PCC) is adjusted to be zero or near zero during the maintenance, or under other non-emergent situa-tions;
• Forced islanding: an operation condition where the distribution system is im-mediately islanded by formidable fault without any warning;
• Intentional islanding: an operation condition where the distribution system is islanded with considerable lead time for the system to initiate coordination scheme and take preventive actions for islanding preparation, under a gradually aggravated stressed situation. This lead time (seconds or minutes) can be given by an early warning system or TSO.
The intentional islanding is the focus of this study and will be mainly discussed in this thesis.

35
3 PLANNED ISLAND OPERATION IN PRACTICE
This chapter starts with the introduction to one planned operation in Bornholm, Den-mark. The analysis of this island operation has been summarized in two conference pa-pers (see Appendix A, [3-1] and Appendix B, [3-2]). Furthermore, the chapter presents the Canadian experience about planned island operation from the utility’s perspective by discussing two cases: the BC Hydro Boston Bar and the Hydro Québec Senneterre substation. The main objective and intention of planned islanding in Canada is to im-prove the system reliability.
3.1 Danish experience – Bornholm island operation During the period from September 11 to 14, 2007, the local Distribution System Opera-tor (DSO) Østkraft conducted a planned island operation in a Danish island, Bornholm, which is located in Baltic Sea. The electric power system in Bornholm is a 60 kV distribution network. There is one 60 kV sea cable with 60 MW capacity, connecting the Bornholm system to the Swedish system. This cable makes Bornholm a part of the Nordic power system. The Bornholm system is normally inter-connected with the Nordic system. The peak load in Bornholm is around 60 MW while the minimum load is 13 MW in 2007. The generators include 14 Diesel (Oil) units with a total capacity of 35 MW, 1 steam plant (BLOK 5) with 25 MW capacity, 1 Combined Heat and Power plant (CHP) (BLOK 6) with 37 MW capac-ity, 35 Wind Turbines (WTs) with a total capacity of 30 MW and one 2 MW Biogas plant. The interest in island operation for Bornholm was initiated by several unexpected break-down of the sea cable by ship anchor. This causes the trouble in terms of system opera-tion for power balance and the system stability. Besides, the high penetration of Wind Turbines (WTs) in Bornholm makes the islanding more difficult. Its wind energy in 2007 accounted for 32.4% of the total electricity supply. In fact, such a high penetration level of WTs makes Bornholm a representative to the Danish 60 kV distribution systems, where more distributed WTs and CHPs are foresee-able to be installed, as driven by [3-3]. With that, the island operation is considered as a potential measure to maintain the power supply under emergency by utilizing those DGs. In this regard, to learn from the Bornholm experience will benefit the future island operations for Danish power systems or alike. Details about the description of island
Planned Island operation in Practice
36
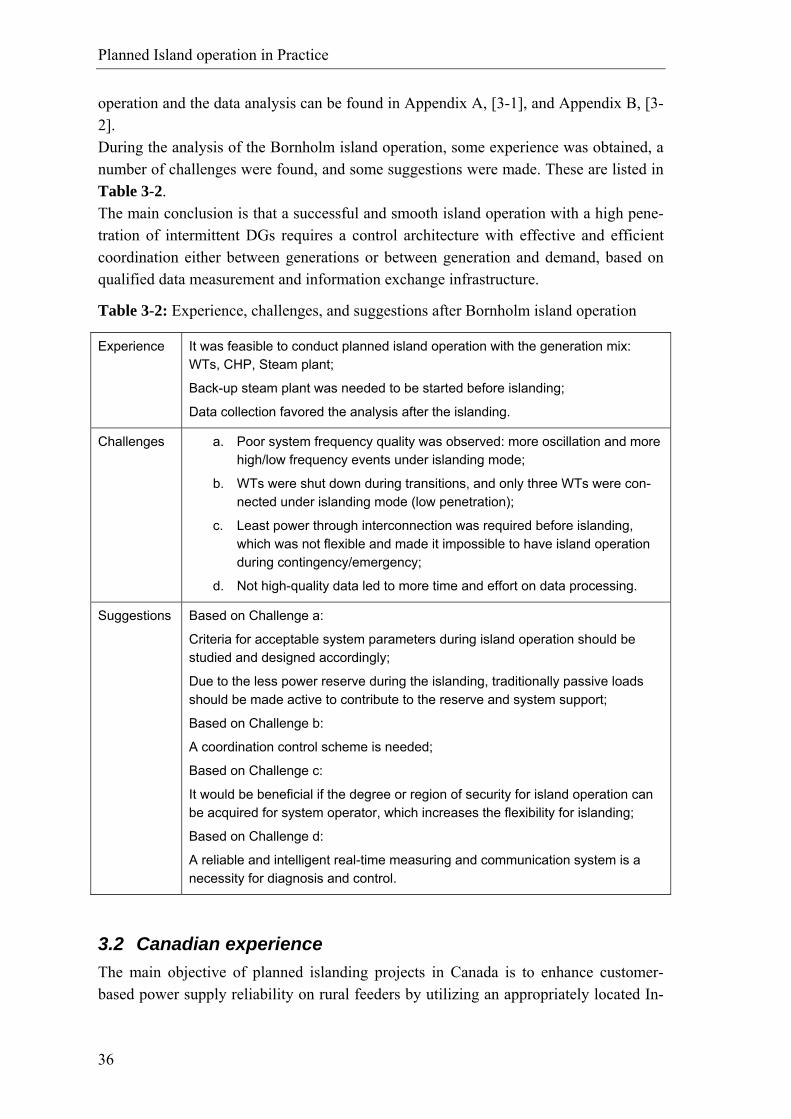
operation and the data analysis can be found in Appendix A, [3-1], and Appendix B, [3-2]. During the analysis of the Bornholm island operation, some experience was obtained, a number of challenges were found, and some suggestions were made. These are listed in Table 3-2. The main conclusion is that a successful and smooth island operation with a high pene-tration of intermittent DGs requires a control architecture with effective and efficient coordination either between generations or between generation and demand, based on qualified data measurement and information exchange infrastructure.
Table 3-2: Experience, challenges, and suggestions after Bornholm island operation
Experience It was feasible to conduct planned island operation with the generation mix: WTs, CHP, Steam plant;
Back-up steam plant was needed to be started before islanding;
Data collection favored the analysis after the islanding.
Challenges a. Poor system frequency quality was observed: more oscillation and more high/low frequency events under islanding mode;
b. WTs were shut down during transitions, and only three WTs were con-nected under islanding mode (low penetration);
c. Least power through interconnection was required before islanding, which was not flexible and made it impossible to have island operation during contingency/emergency;
d. Not high-quality data led to more time and effort on data processing.
Suggestions Based on Challenge a:
Criteria for acceptable system parameters during island operation should be studied and designed accordingly;
Due to the less power reserve during the islanding, traditionally passive loads should be made active to contribute to the reserve and system support;
Based on Challenge b:
A coordination control scheme is needed;
Based on Challenge c:
It would be beneficial if the degree or region of security for island operation can be acquired for system operator, which increases the flexibility for islanding;
Based on Challenge d:
A reliable and intelligent real-time measuring and communication system is a necessity for diagnosis and control.
3.2 Canadian experience The main objective of planned islanding projects in Canada is to enhance customer-based power supply reliability on rural feeders by utilizing an appropriately located In-
Planned Island operation in Practice
37
dependent Power Producer (IPP) [3-4], either during contingency or maintenance. This is quantified by two indexes: System Average Interruption Frequency Index (SAIFI) and System Average Interruption Duration Index (SAIDI) [3-5]. In addition, utility BC Hydro published a report about islanding guidelines in June 2006, which outlines how BC Hydro will consider the technical attributes of power gen-erator planned islanding in the integrated distribution system at 35 kV and below. Within the report, a so-called “Two-to-One” rule-of-thumb has been developed to esti-mate the islanding capability of a power generator. The “Two-to-One” rule is based on the assumption that an island is not sustainable where the annual minimum load in the island is at least twice the island’s generation [3-5] [3-6]. As a matter of fact, there would be some loads in system which may change their power consumption as the sys-tem frequency changes, such as fans or pumps with induction motors. This introduces a damping factor D to the swing equation, as shown in the following:
fDPdt
fdH2 ΔΔΔ⋅−= ( 3.1)
where, ∆f is per unit frequency change from starting frequency, ∆P is generation difi-ciency (generation minus load divided by generation), and H is system intertia constant. The solution of this swing equation can be calculated as shown below:
⎟⎟⎟
⎠
⎞
⎜⎜⎜
⎝
⎛ ⋅−
−= H2tD
e1DPf ΔΔ ( 3.2)
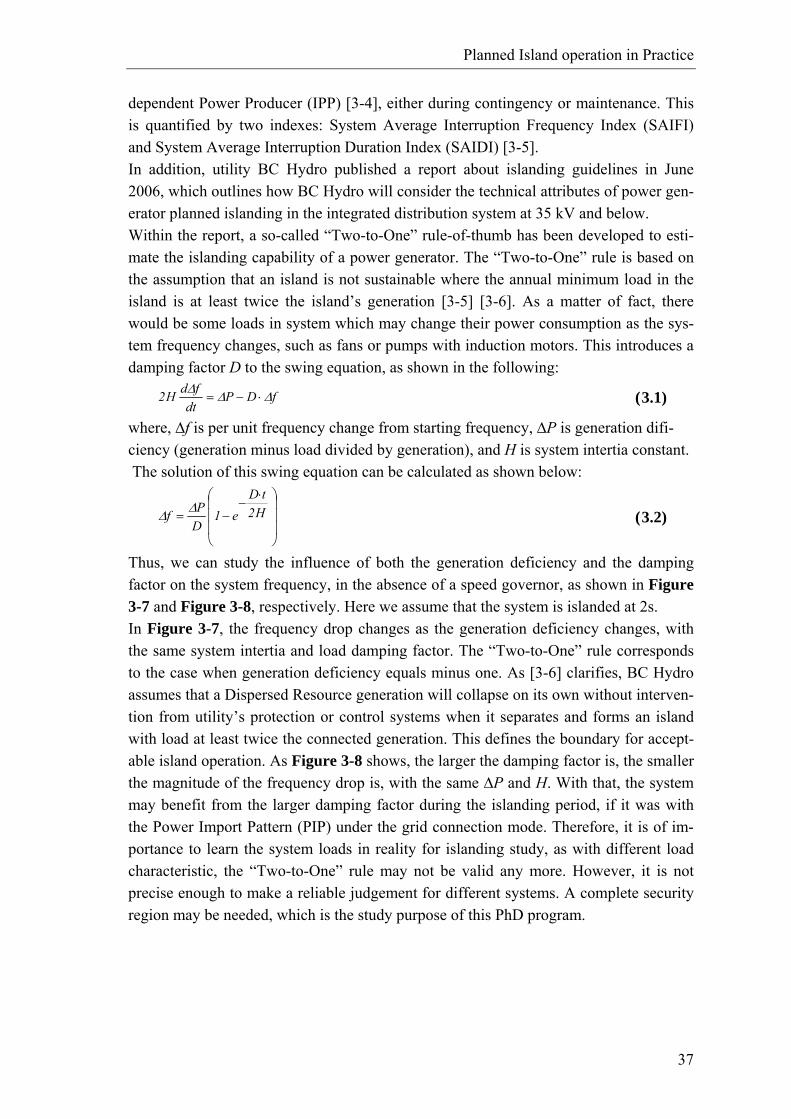
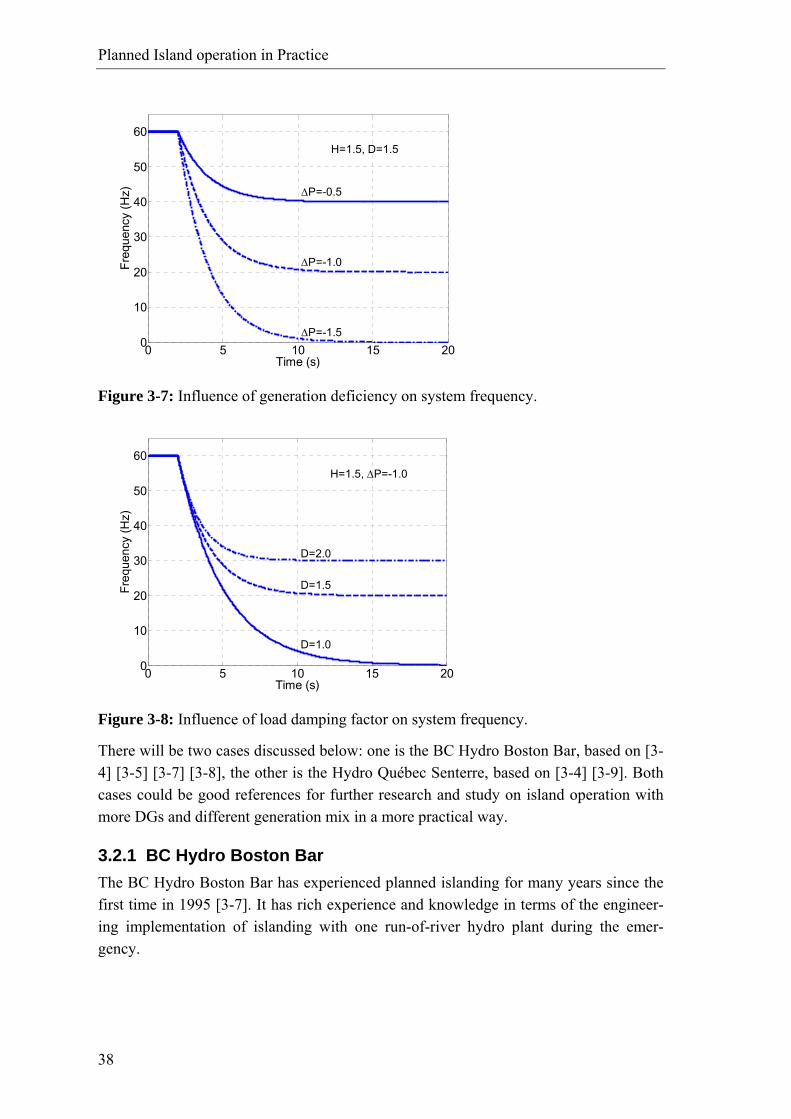
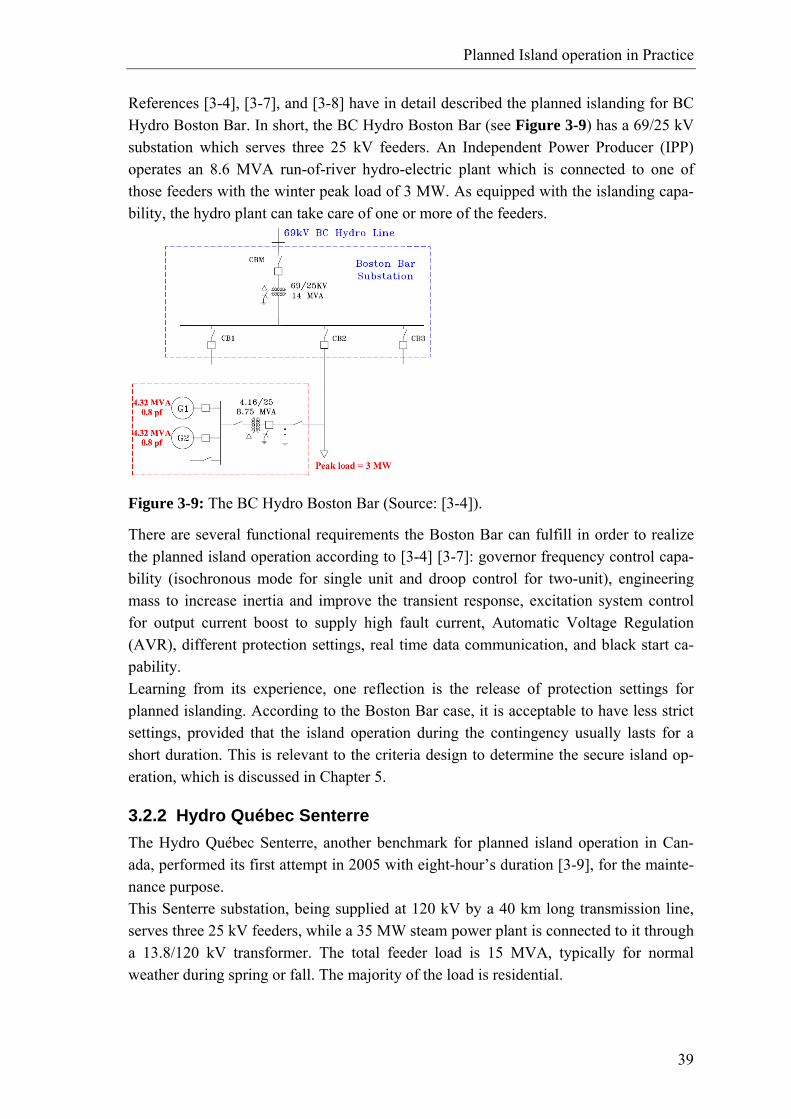
Thus, we can study the influence of both the generation deficiency and the damping factor on the system frequency, in the absence of a speed governor, as shown in Figure 3-7 and Figure 3-8, respectively. Here we assume that the system is islanded at 2s. In Figure 3-7, the frequency drop changes as the generation deficiency changes, with the same system intertia and load damping factor. The “Two-to-One” rule corresponds to the case when generation deficiency equals minus one. As [3-6] clarifies, BC Hydro assumes that a Dispersed Resource generation will collapse on its own without interven-tion from utility’s protection or control systems when it separates and forms an island with load at least twice the connected generation. This defines the boundary for accept-able island operation. As Figure 3-8 shows, the larger the damping factor is, the smaller the magnitude of the frequency drop is, with the same ∆P and H. With that, the system may benefit from the larger damping factor during the islanding period, if it was with the Power Import Pattern (PIP) under the grid connection mode. Therefore, it is of im-portance to learn the system loads in reality for islanding study, as with different load characteristic, the “Two-to-One” rule may not be valid any more. However, it is not precise enough to make a reliable judgement for different systems. A complete security region may be needed, which is the study purpose of this PhD program.
Planned Island operation in Practice
38
0 5 10 15 200
10
20
30
40
50
60 H=1.5, D=1.5
ΔP=-0.5
ΔP=-1.0
ΔP=-1.5
Time (s)
Freq
uenc
y (H
z)
Figure 3-7: Influence of generation deficiency on system frequency.
0 5 10 15 200
10
20
30
40
50
60 H=1.5, ΔP=-1.0
D=1.0
D=1.5
D=2.0
Time (s)
Freq
uenc
y (H
z)
Figure 3-8: Influence of load damping factor on system frequency.
There will be two cases discussed below: one is the BC Hydro Boston Bar, based on [3-4] [3-5] [3-7] [3-8], the other is the Hydro Québec Senterre, based on [3-4] [3-9]. Both cases could be good references for further research and study on island operation with more DGs and different generation mix in a more practical way.
3.2.1 BC Hydro Boston Bar The BC Hydro Boston Bar has experienced planned islanding for many years since the first time in 1995 [3-7]. It has rich experience and knowledge in terms of the engineer-ing implementation of islanding with one run-of-river hydro plant during the emer-gency.
Planned Island operation in Practice
39
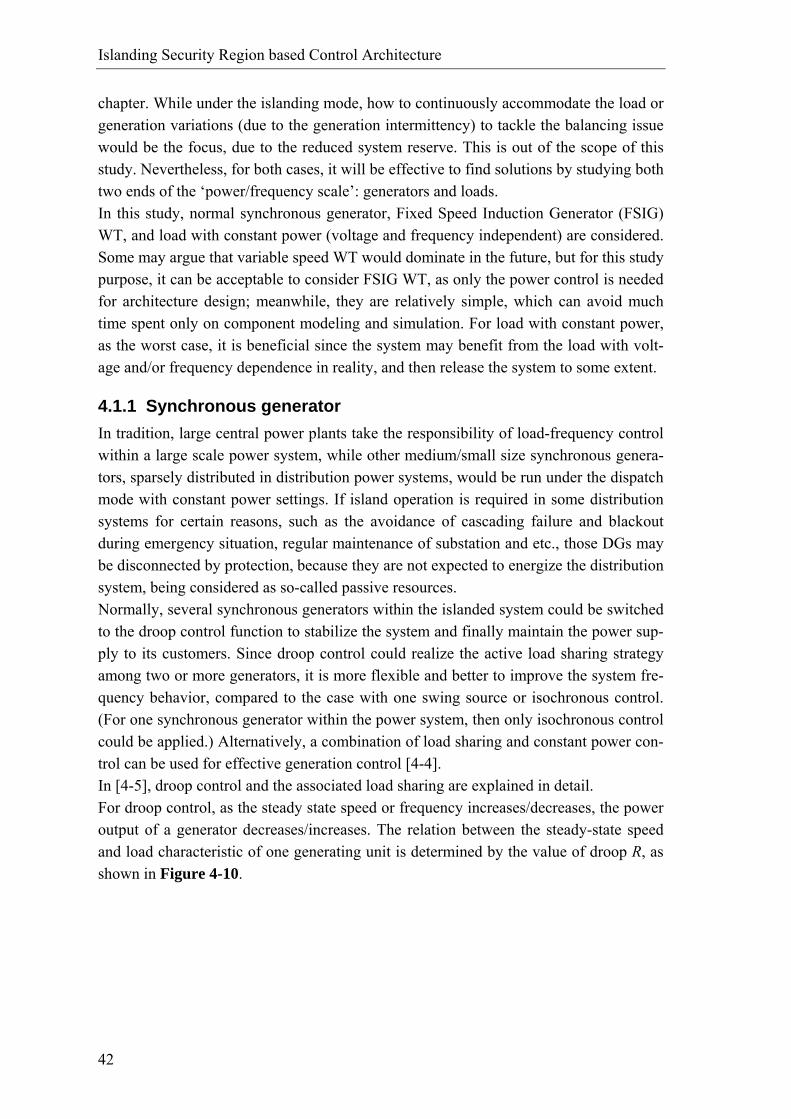
References [3-4], [3-7], and [3-8] have in detail described the planned islanding for BC Hydro Boston Bar. In short, the BC Hydro Boston Bar (see Figure 3-9) has a 69/25 kV substation which serves three 25 kV feeders. An Independent Power Producer (IPP) operates an 8.6 MVA run-of-river hydro-electric plant which is connected to one of those feeders with the winter peak load of 3 MW. As equipped with the islanding capa-bility, the hydro plant can take care of one or more of the feeders.
Figure 3-9: The BC Hydro Boston Bar (Source: [3-4]).
There are several functional requirements the Boston Bar can fulfill in order to realize the planned island operation according to [3-4] [3-7]: governor frequency control capa-bility (isochronous mode for single unit and droop control for two-unit), engineering mass to increase inertia and improve the transient response, excitation system control for output current boost to supply high fault current, Automatic Voltage Regulation (AVR), different protection settings, real time data communication, and black start ca-pability. Learning from its experience, one reflection is the release of protection settings for planned islanding. According to the Boston Bar case, it is acceptable to have less strict settings, provided that the island operation during the contingency usually lasts for a short duration. This is relevant to the criteria design to determine the secure island op-eration, which is discussed in Chapter 5.
3.2.2 Hydro Québec Senterre The Hydro Québec Senterre, another benchmark for planned island operation in Can-ada, performed its first attempt in 2005 with eight-hour’s duration [3-9], for the mainte-nance purpose. This Senterre substation, being supplied at 120 kV by a 40 km long transmission line, serves three 25 kV feeders, while a 35 MW steam power plant is connected to it through a 13.8/120 kV transformer. The total feeder load is 15 MVA, typically for normal weather during spring or fall. The majority of the load is residential.

Planned Island operation in Practice
40
To meet the requirements for island operation, such as the load following, voltage and frequency control and the power plant stability, the steam plant had to modify its instal-lation. Similar to the case in Bornholm, the active and reactive power from the power station were adjusted to meet a near zero power flow at the Point of Common Coupling (PCC). After the islanding, the plant regulator was transferred from the power factor regulation mode to the voltage regulation mode. There are two technical constraints to be emphasized. Firstly, it is the limited synchro-nous reserve under the islanding mode, which affects the load pick-up capability, and consequently, automatic reclosure is not acceptable. In this regard, the demand may contribute to the system reserve. At the Centre for Electric Technology (CET), Techni-cal University of Denmark (DTU), a completed Demand as Frequency controlled Re-serve (DFR) project [3-10] concludes that DFR is a promising technology, which util-izes the existing resources to supplement the system reserve and support the system operation. The DFR technology and its application in this PhD study are discussed in Chapter 4 and Chapter 6, respectively. The second constraint is the lack of black start capability, which reduces the flexibility of the system. Once the generator is shut down after islanding, the restarting requires the return of the external grid power. Thus, the rigid requirements for weather and limited islanding duration are expected. Based on [3-11], an outlook about the challenges for the island operation in Canada could be firstly the increasing number of integrated DGs and secondly the different gen-eration mix: such as wind-diesel, wind-hydro, wind-CHP-hydro, etc. Further, the de-mand response is another foreseeable participation. Therefore, an effective coordination among generators and loads is needed. From the Canadian planned islanding experience, the following reflections are worth being emphasized:
• An overall control architecture and the coordination scheme among generators and loads are in need for systems with multi-DGs;
• Criteria for security assessment of island operation should be designed, either by releasing the protection settings or by considering the power quality;
• Demand response including DFR and load shedding are good candidate to par-ticipate in island operation;
• Intermittent DGs, like WTs, should be taken into account for future islanding study;
• An effective and efficient monitoring, measuring, and information exchange sys-tem is necessary for reliable real-time system analysis, diagnosis, and control.
All in all, both Danish experience and Canadian experience pave the way for the future intentional island operation that is expected to be stable, all-around, active, controllable, visible and smart, for the purpose of system reliability and security of power supply.
41
4 ISLANDING SECURITY REGION BASED CON-TROL ARCHITECTURE
The term “Architecture” is defined as the organizational structure of a system or com-ponent according to [4-1]. It is further developed in [4-2] to be the structure of compo-nents, their relationships, and the principles and guidelines governing their design and evolution over time. Particularly for power systems, [4-3] defines the architecture as a specification of operating objectives, functions and components and their mutual rela-tions in the electrical power generation, transmission, distribution and consumption sub-systems. The specification also includes associated subsystems for data acquisition, co-ordination, control and protection and the linkage of these systems through communica-tion networks. Especially for island operation of the future distribution system with high penetration of Distributed Generations (DGs), it is necessary to design a corresponding control archi-tecture. Due to the foreseeable complexity, this architecture should define the functions of different components and clarify their relationships, including a tangible coordination scheme among them, in order to assist the system operation and maintain the security of power supply under emergency situation. In this regard, this Chapter 4 develops the Islanding Security Region (ISR) based con-trol architecture and its associated coordination scheme, or the Islanding Control Archi-tecture (ICA) for short. This chapter starts with the introduction to main components involved in the ICA, such as synchronous generator with droop control, Wind Turbine (WT), Demand as Fre-quency controlled Reserve (DFR) and load shedding. Afterwards, requirements for ICA are defined and a generic ICA introduced. The details about ICA are described and ex-plained in Appendix C.
4.1 Architecture components During the whole island operation, including the transition period and the islanding mode, one of the crucial issues is the frequency stability due to the real power imbal-ance. For the transition period, due to the sudden loss of the power interchange, the main concern is whether or not the islanded system can survive the islanding moment and smoothly transfer to the islanding mode, without the system crash or any severe damages to the system equipments. In this regard, the ISR concept is proposed in this
Islanding Security Region based Control Architecture
42
chapter. While under the islanding mode, how to continuously accommodate the load or generation variations (due to the generation intermittency) to tackle the balancing issue would be the focus, due to the reduced system reserve. This is out of the scope of this study. Nevertheless, for both cases, it will be effective to find solutions by studying both two ends of the ‘power/frequency scale’: generators and loads. In this study, normal synchronous generator, Fixed Speed Induction Generator (FSIG) WT, and load with constant power (voltage and frequency independent) are considered. Some may argue that variable speed WT would dominate in the future, but for this study purpose, it can be acceptable to consider FSIG WT, as only the power control is needed for architecture design; meanwhile, they are relatively simple, which can avoid much time spent only on component modeling and simulation. For load with constant power, as the worst case, it is beneficial since the system may benefit from the load with volt-age and/or frequency dependence in reality, and then release the system to some extent.
4.1.1 Synchronous generator In tradition, large central power plants take the responsibility of load-frequency control within a large scale power system, while other medium/small size synchronous genera-tors, sparsely distributed in distribution power systems, would be run under the dispatch mode with constant power settings. If island operation is required in some distribution systems for certain reasons, such as the avoidance of cascading failure and blackout during emergency situation, regular maintenance of substation and etc., those DGs may be disconnected by protection, because they are not expected to energize the distribution system, being considered as so-called passive resources. Normally, several synchronous generators within the islanded system could be switched to the droop control function to stabilize the system and finally maintain the power sup-ply to its customers. Since droop control could realize the active load sharing strategy among two or more generators, it is more flexible and better to improve the system fre-quency behavior, compared to the case with one swing source or isochronous control. (For one synchronous generator within the power system, then only isochronous control could be applied.) Alternatively, a combination of load sharing and constant power con-trol can be used for effective generation control [4-4]. In [4-5], droop control and the associated load sharing are explained in detail. For droop control, as the steady state speed or frequency increases/decreases, the power output of a generator decreases/increases. The relation between the steady-state speed and load characteristic of one generating unit is determined by the value of droop R, as shown in Figure 4-10.
Islanding Security Region based Control Architecture
43
.).( upP
.).( upf
0P1P 2P
0f1f
2f2PΔ
1PΔ 2fΔ
1fΔ
0.10
2
2
20
20
1
1
01
01
Pf
PPffR
orPf
PPffR
ΔΔ
=−−
=
ΔΔ
=−−
=
.).( upP
.).( upf
0P1P 2P
0f1f
2f2PΔ
1PΔ 2fΔ
1fΔ
0.10
2
2
20
20
1
1
01
01
Pf
PPffR
orPf
PPffR
ΔΔ
=−−
=
ΔΔ
=−−
=
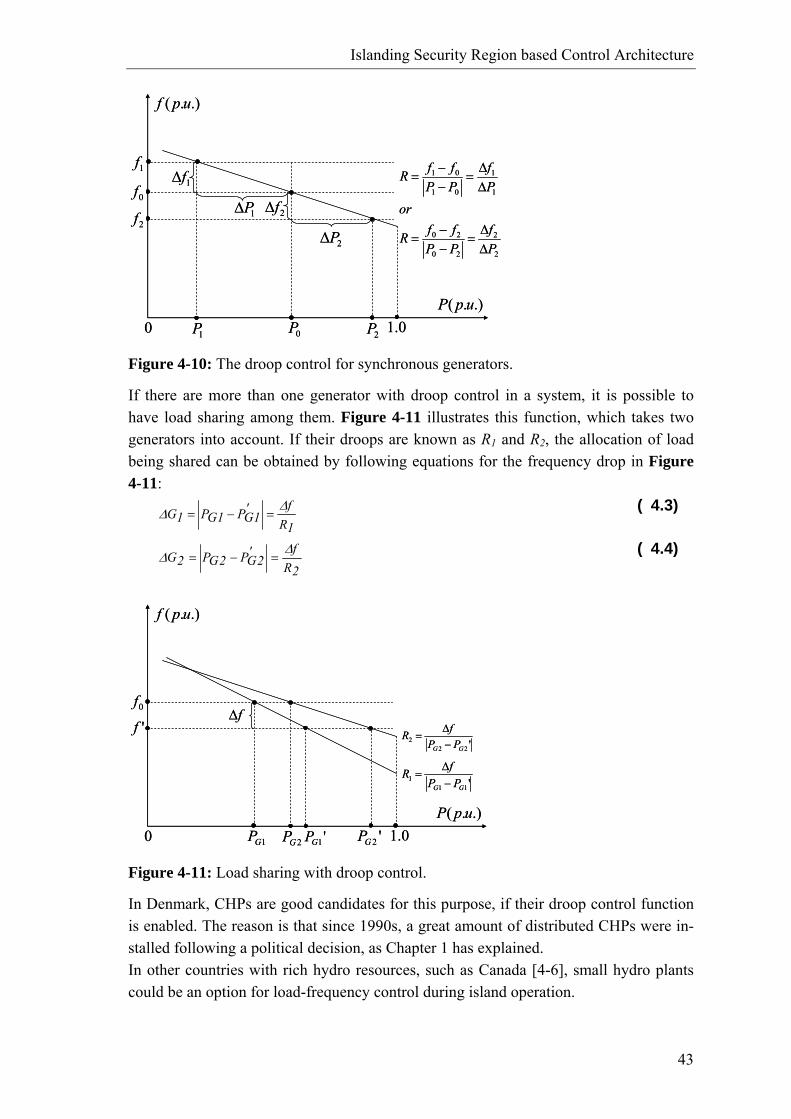
Figure 4-10: The droop control for synchronous generators.
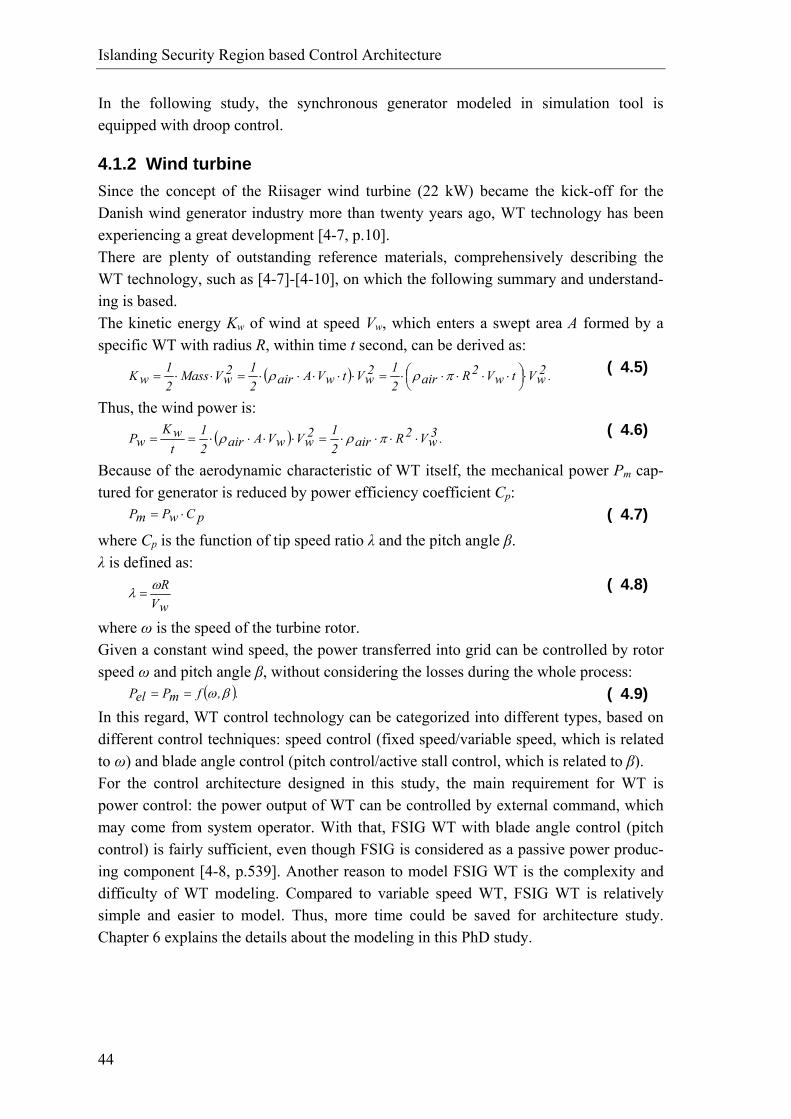
If there are more than one generator with droop control in a system, it is possible to have load sharing among them. Figure 4-11 illustrates this function, which takes two generators into account. If their droops are known as R1 and R2, the allocation of load being shared can be obtained by following equations for the frequency drop in Figure 4-11:
1Rf'
1GP1GP1G ΔΔ =−= ( 4.3)
2Rf'
2GP2GP2G ΔΔ =−= ( 4.4)
.).( upP
.).( upf
1GP 2GP
0f
'f
0.10 '1GP
'222
GG PPfR−Δ
=
'111
GG PPfR−Δ
=
'2GP
fΔ
.).( upP
.).( upf
1GP 2GP
0f
'f
0.10 '1GP
'222
GG PPfR−Δ
=
'111
GG PPfR−Δ
=
'2GP
fΔ
Figure 4-11: Load sharing with droop control.
In Denmark, CHPs are good candidates for this purpose, if their droop control function is enabled. The reason is that since 1990s, a great amount of distributed CHPs were in-stalled following a political decision, as Chapter 1 has explained. In other countries with rich hydro resources, such as Canada [4-6], small hydro plants could be an option for load-frequency control during island operation.
Islanding Security Region based Control Architecture
44
In the following study, the synchronous generator modeled in simulation tool is equipped with droop control.
4.1.2 Wind turbine Since the concept of the Riisager wind turbine (22 kW) became the kick-off for the Danish wind generator industry more than twenty years ago, WT technology has been experiencing a great development [4-7, p.10]. There are plenty of outstanding reference materials, comprehensively describing the WT technology, such as [4-7]-[4-10], on which the following summary and understand-ing is based. The kinetic energy Kw of wind at speed Vw, which enters a swept area A formed by a specific WT with radius R, within time t second, can be derived as: ( ) .2
wVtwV2Rair212
wVtwVAair212
wVMass21
wK ⋅⎟⎠⎞⎜
⎝⎛ ⋅⋅⋅⋅⋅=⋅⋅⋅⋅⋅=⋅⋅= πρρ ( 4.5)
Thus, the wind power is: ( ) .3
wV2Rair212
wVwVAair21
twK
wP ⋅⋅⋅⋅=⋅⋅⋅⋅== πρρ ( 4.6)
Because of the aerodynamic characteristic of WT itself, the mechanical power Pm cap-tured for generator is reduced by power efficiency coefficient Cp: pCwPmP ⋅= ( 4.7) where Cp is the function of tip speed ratio λ and the pitch angle β. λ is defined as:
wVRωλ = ( 4.8)
where ω is the speed of the turbine rotor. Given a constant wind speed, the power transferred into grid can be controlled by rotor speed ω and pitch angle β, without considering the losses during the whole process: ( ).,fmPelP βω== ( 4.9) In this regard, WT control technology can be categorized into different types, based on different control techniques: speed control (fixed speed/variable speed, which is related to ω) and blade angle control (pitch control/active stall control, which is related to β). For the control architecture designed in this study, the main requirement for WT is power control: the power output of WT can be controlled by external command, which may come from system operator. With that, FSIG WT with blade angle control (pitch control) is fairly sufficient, even though FSIG is considered as a passive power produc-ing component [4-8, p.539]. Another reason to model FSIG WT is the complexity and difficulty of WT modeling. Compared to variable speed WT, FSIG WT is relatively simple and easier to model. Thus, more time could be saved for architecture study. Chapter 6 explains the details about the modeling in this PhD study.
Islanding Security Region based Control Architecture
45
4.1.3 Demand
4.1.3.1 Demand as Frequency controlled Reserve Some loads may have frequency dependence feature, which cause load demand to re-spond to system frequency change. Similarly, by installing a small electronic device, we could intentionally make the loads responsive to the system frequency. Thus, they could support the system operation. Those loads, either from the households or industry, could be electric heating, refrigerator, waste water treatment plant, cooling and ventilation units, etc., to whose temporary interruptions of several minutes or even one hour, hu-man beings will not become sensitive [4-11]. Although these interruptions are short, the system may be released from being heavily loaded and even crashed. A research project about the investigation of the potential technology to utilize the elec-tricity Demand as Frequency controlled Reserve (DFR) in power system finalizes with a conclusion: using DFR is an emerging technology which allows demand to actively participate in maintaining the system operation without reducing the energy service de-livered to the customer and without the need of user interaction [4-12]. The demonstra-tion of DFR in reality is under development at CET, with close cooperation with Danish industry. There are two kinds of control logics for DFR. The first one is the external control type, denoted as type I; the other is named integrated control, differentiated as type II. The main difference in between is whether or not the load is turn on or off directly according to the system frequency. Type I turns on and off the loads according to system fre-quency directly, while type II turns on or off the thermostatically controlled loads (space heaters) by adjusting their temperature set points according to system frequency [4-12]. Regarding the island operation with possibility of bi-directional power flow through interconnection, type II would be favourable in this study, thanks to its capability of continuous regulation for both low and high frequency cases. With type II DFR control, the temperature settings vary in accordance with system fre-quency for thermostats activation: )0ff(fKnormal_highThighT −+= ( 4.10) )0ff(fKnormal_lowTlowT −+= ( 4.11) where Thigh_normal and Tlow_normal are nominal high and low temperature settings; f0 is sys-tem nominal frequency (for example, 50 Hz for Nordic system and 60 Hz for North America system); f is actual system frequency; Kf is the coefficient of frequency change, which is defined in the following as the ratio of the temperature difference ∆T to the frequency deviation ∆f:
fT
fKΔΔ
= ( 4.12)
Thus, actual temperature settings Thigh and Tlow are coupled with system frequency change through different design of Kf. If actual temperature T is reaches Thigh, the heater
Islanding Security Region based Control Architecture
46
turns off, while if T reaches Tlow, the heater turns on. The design of Kf determines the share of loads which are activated for a given frequency deviation. Take the Nordic system for example, if the system frequency is required to be within 50±0.1 Hz [4-13], and assume the temperature difference is 2 0C, Kf can be set to the following value if all demand is activated when ∆f equals ±0.1 Hz:
)Hz
reedeg(20
Hz1.0reedeg2
fK == ( 4.13)
More details can be found in [4-12] [4-14], and it has been recognized with great poten-tial for implementation in Denmark. DFR is further studied in Chapter 6 and the simulation results show that it is an effec-tive measure to assist a smooth islanding transition.
4.1.3.2 Load shedding In addition to the DFR technology, load shedding is also considered in the islanding coordination scheme of the designed ICA. Some loads could be coordinated with WT once there is a need for more generation while WT reaches its maximum available power. According to ISR, the amount of loads needed to be shed can be calculated, and then the loads close to the required amount would be selected for load shedding. This will be studied in Chapter 6.
4.2 Requirements for control architecture In power system, the security of power supply is one of main objectives for operation and control. Practically, the distribution system may be islanded under certain emergency when there is an unavoidable disturbance or contingency occurring in the upstream grid. The nor-mal procedure is to detect the island operation and then de-energize those DGs, causing the system blackout, since unintentional islanding is considered as a hazard. As more DGs are emerging in distribution system, it is of concern to utilize them to maintain the security of power supply, instead of the blackout under emergency. In this regard, intentional island operation is suggested to reach the objective. Those DGs are expected to continue supply electricity to their customers. However, this leads to a pre-requisite for ICA design: DGs should become controllable, active and visible to system operator. Based on this, the requirements for ICA can be defined as: The control architecture should conduct the proactive diagnosis, search preventive measures accordingly, and finally execute coordination scheme before island operation, in order to ensure a smooth islanding transition which may ease the control and opera-tion under islanding mode, even for later reconnection operation.
4.3 Islanding Security Region based control architecture As early as in 1978, [4-15] defined the states of operation, and described the controlled
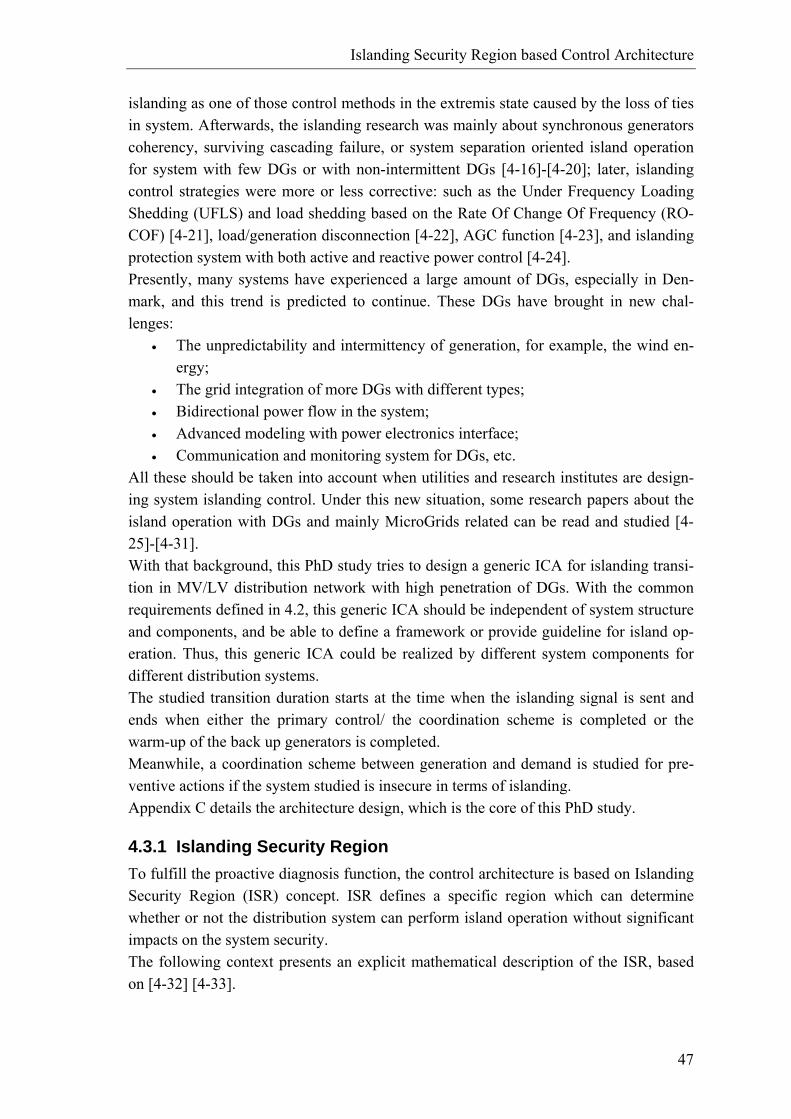
Islanding Security Region based Control Architecture
47
islanding as one of those control methods in the extremis state caused by the loss of ties in system. Afterwards, the islanding research was mainly about synchronous generators coherency, surviving cascading failure, or system separation oriented island operation for system with few DGs or with non-intermittent DGs [4-16]-[4-20]; later, islanding control strategies were more or less corrective: such as the Under Frequency Loading Shedding (UFLS) and load shedding based on the Rate Of Change Of Frequency (RO-COF) [4-21], load/generation disconnection [4-22], AGC function [4-23], and islanding protection system with both active and reactive power control [4-24]. Presently, many systems have experienced a large amount of DGs, especially in Den-mark, and this trend is predicted to continue. These DGs have brought in new chal-lenges:
• The unpredictability and intermittency of generation, for example, the wind en-ergy;
• The grid integration of more DGs with different types; • Bidirectional power flow in the system; • Advanced modeling with power electronics interface; • Communication and monitoring system for DGs, etc.
All these should be taken into account when utilities and research institutes are design-ing system islanding control. Under this new situation, some research papers about the island operation with DGs and mainly MicroGrids related can be read and studied [4-25]-[4-31]. With that background, this PhD study tries to design a generic ICA for islanding transi-tion in MV/LV distribution network with high penetration of DGs. With the common requirements defined in 4.2, this generic ICA should be independent of system structure and components, and be able to define a framework or provide guideline for island op-eration. Thus, this generic ICA could be realized by different system components for different distribution systems. The studied transition duration starts at the time when the islanding signal is sent and ends when either the primary control/ the coordination scheme is completed or the warm-up of the back up generators is completed. Meanwhile, a coordination scheme between generation and demand is studied for pre-ventive actions if the system studied is insecure in terms of islanding. Appendix C details the architecture design, which is the core of this PhD study.
4.3.1 Islanding Security Region To fulfill the proactive diagnosis function, the control architecture is based on Islanding Security Region (ISR) concept. ISR defines a specific region which can determine whether or not the distribution system can perform island operation without significant impacts on the system security. The following context presents an explicit mathematical description of the ISR, based on [4-32] [4-33].
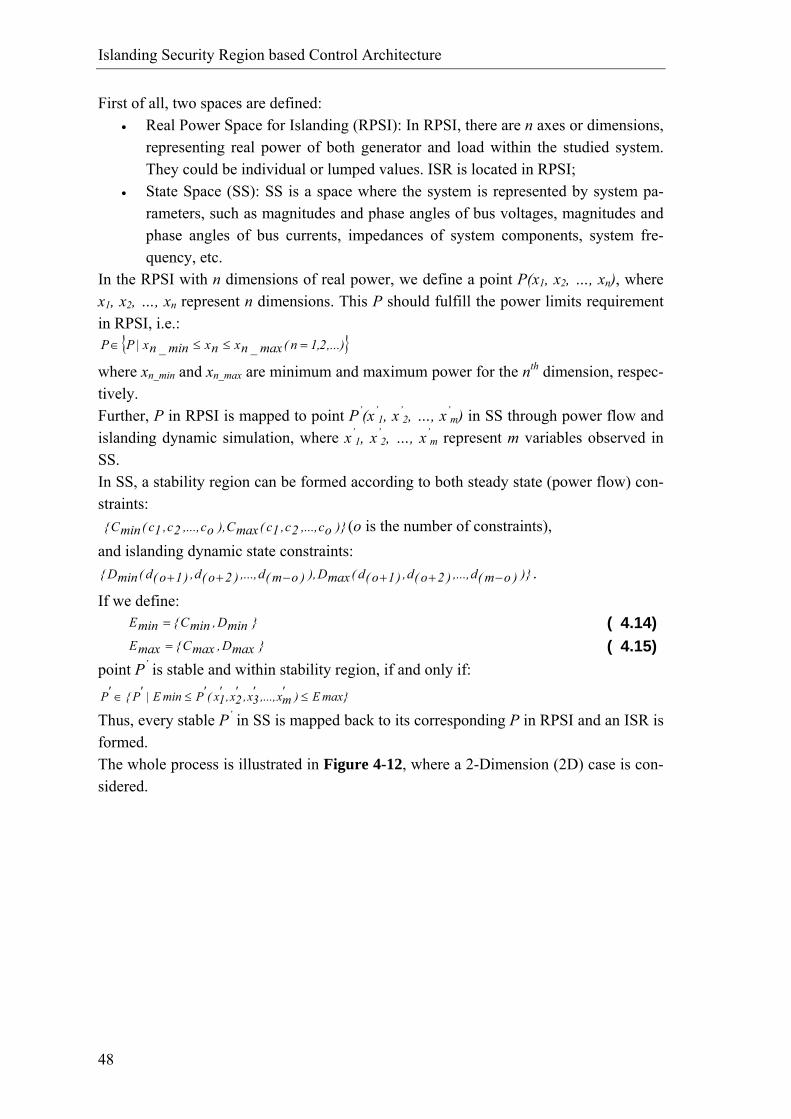
Islanding Security Region based Control Architecture
48
First of all, two spaces are defined: • Real Power Space for Islanding (RPSI): In RPSI, there are n axes or dimensions,
representing real power of both generator and load within the studied system. They could be individual or lumped values. ISR is located in RPSI;
• State Space (SS): SS is a space where the system is represented by system pa-rameters, such as magnitudes and phase angles of bus voltages, magnitudes and phase angles of bus currents, impedances of system components, system fre-quency, etc.
In the RPSI with n dimensions of real power, we define a point P(x1, x2, …, xn), where x1, x2, …, xn represent n dimensions. This P should fulfill the power limits requirement in RPSI, i.e.:
{ },...)2,1n(max_nxnxmin_nx|PP =≤≤∈
where xn_min and xn_max are minimum and maximum power for the nth dimension, respec-tively. Further, P in RPSI is mapped to point P’(x’
1, x’2, …, x’
m) in SS through power flow and islanding dynamic simulation, where x’
1, x’2, …, x’
m represent m variables observed in SS. In SS, a stability region can be formed according to both steady state (power flow) con-straints: )}oc,...,2c,1c(maxC),oc,...,2c,1c(minC{ (o is the number of constraints), and islanding dynamic state constraints:
)})om(d,...,)2o(d,)1o(d(maxD),)om(d,...,)2o(d,)1o(d(minD{ −++−++ .
If we define: }minD,minC{minE = ( 4.14) }maxD,maxC{maxE = ( 4.15) point P’ is stable and within stability region, if and only if:
max}E)'mx,...,'
3x,'2x,'
1x('PminE|'P{'P ≤≤∈ Thus, every stable P’ in SS is mapped back to its corresponding P in RPSI and an ISR is formed. The whole process is illustrated in Figure 4-12, where a 2-Dimension (2D) case is con-sidered.
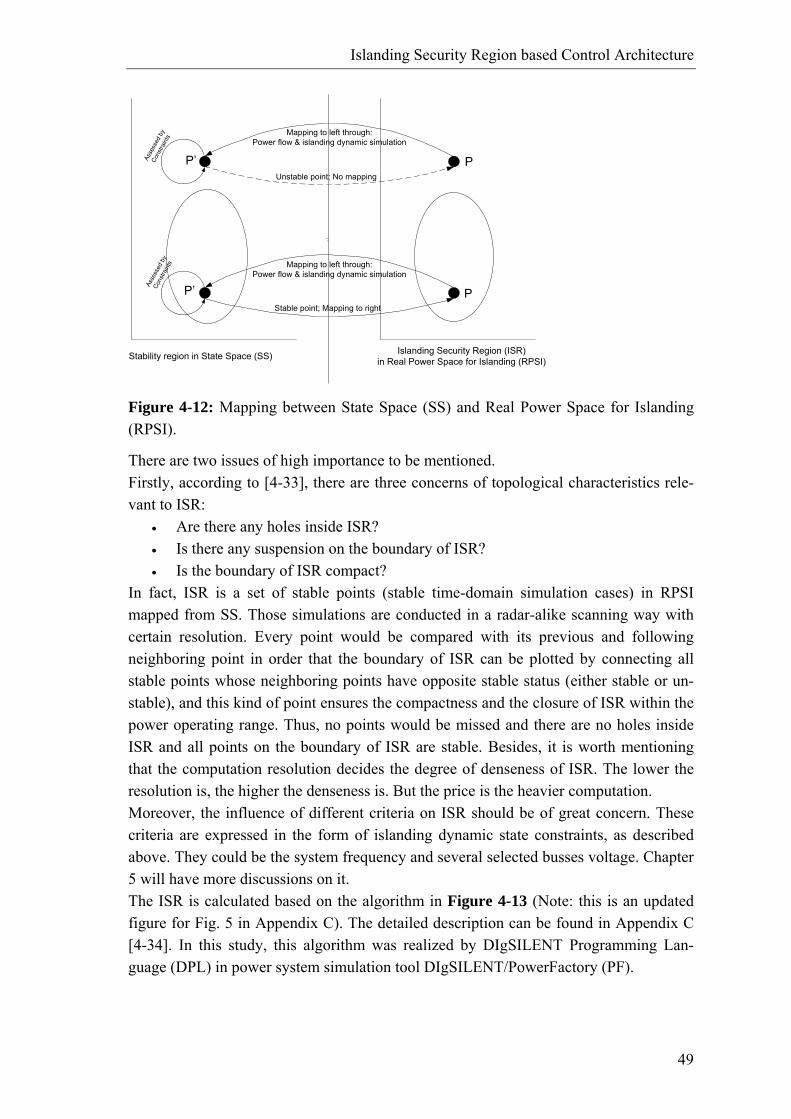
Islanding Security Region based Control Architecture
49
Stability region in State Space (SS) Islanding Security Region (ISR) in Real Power Space for Islanding (RPSI)
Mapping to left through:Power flow & islanding dynamic simulation
Unstable point; No mapping
Mapping to left through:Power flow & islanding dynamic simulation
Stable point; Mapping to right
PP’Asse
ssed
by
Cons
traint
s
Asse
ssed
by
Cons
train
ts
PP’
Figure 4-12: Mapping between State Space (SS) and Real Power Space for Islanding (RPSI).
There are two issues of high importance to be mentioned. Firstly, according to [4-33], there are three concerns of topological characteristics rele-vant to ISR:
• Are there any holes inside ISR? • Is there any suspension on the boundary of ISR? • Is the boundary of ISR compact?
In fact, ISR is a set of stable points (stable time-domain simulation cases) in RPSI mapped from SS. Those simulations are conducted in a radar-alike scanning way with certain resolution. Every point would be compared with its previous and following neighboring point in order that the boundary of ISR can be plotted by connecting all stable points whose neighboring points have opposite stable status (either stable or un-stable), and this kind of point ensures the compactness and the closure of ISR within the power operating range. Thus, no points would be missed and there are no holes inside ISR and all points on the boundary of ISR are stable. Besides, it is worth mentioning that the computation resolution decides the degree of denseness of ISR. The lower the resolution is, the higher the denseness is. But the price is the heavier computation. Moreover, the influence of different criteria on ISR should be of great concern. These criteria are expressed in the form of islanding dynamic state constraints, as described above. They could be the system frequency and several selected busses voltage. Chapter 5 will have more discussions on it. The ISR is calculated based on the algorithm in Figure 4-13 (Note: this is an updated figure for Fig. 5 in Appendix C). The detailed description can be found in Appendix C [4-34]. In this study, this algorithm was realized by DIgSILENT Programming Lan-guage (DPL) in power system simulation tool DIgSILENT/PowerFactory (PF).
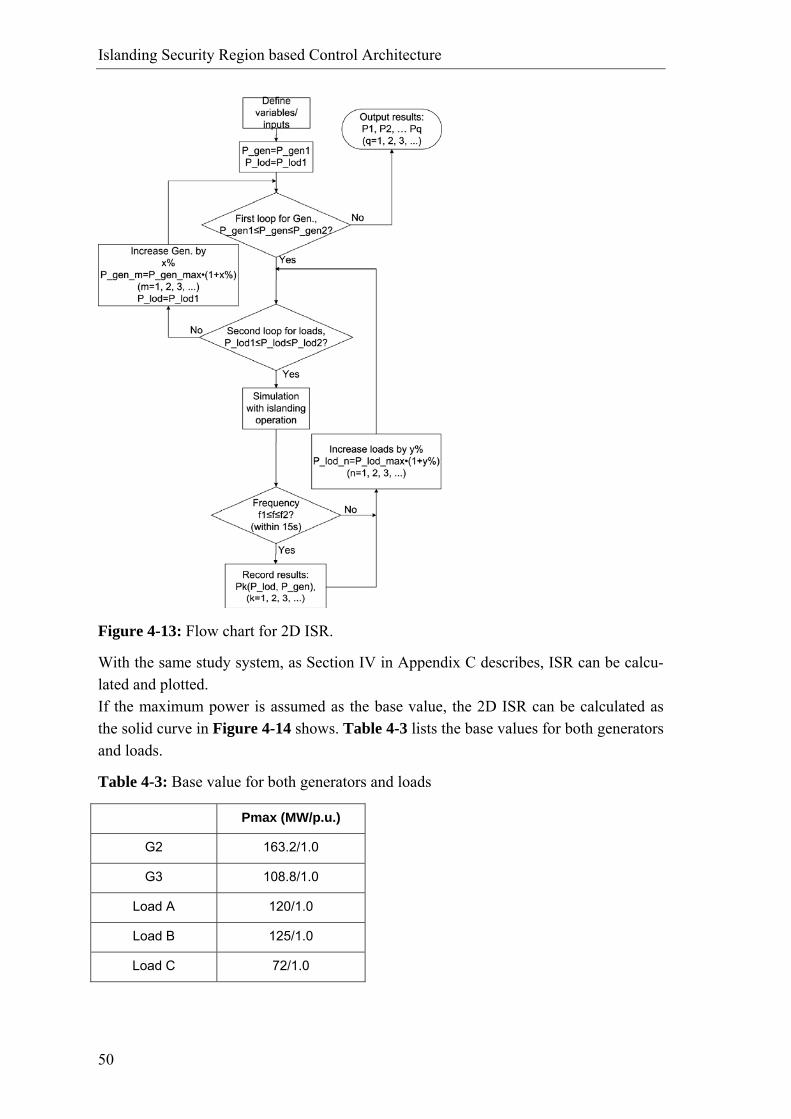
Islanding Security Region based Control Architecture
50
Figure 4-13: Flow chart for 2D ISR.
With the same study system, as Section IV in Appendix C describes, ISR can be calcu-lated and plotted. If the maximum power is assumed as the base value, the 2D ISR can be calculated as the solid curve in Figure 4-14 shows. Table 4-3 lists the base values for both generators and loads.
Table 4-3: Base value for both generators and loads
Pmax (MW/p.u.)
G2 163.2/1.0
G3 108.8/1.0
Load A 120/1.0
Load B 125/1.0
Load C 72/1.0
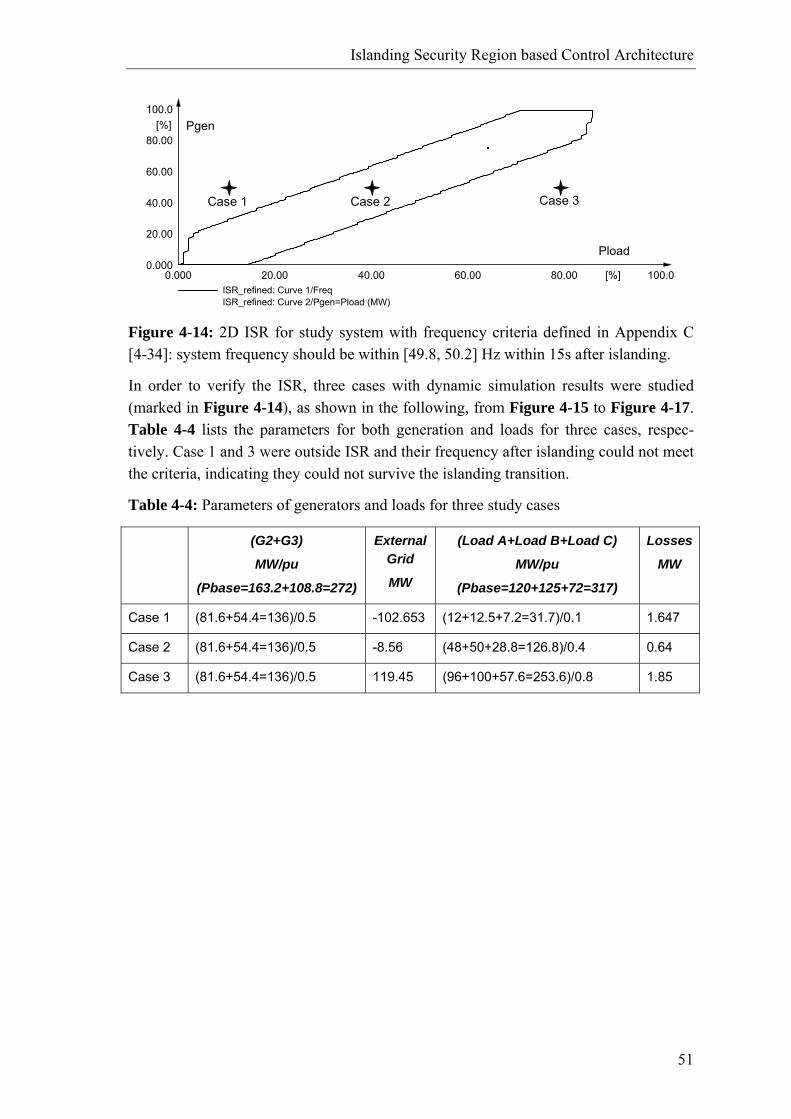
Islanding Security Region based Control Architecture
51
100.080.0060.0040.0020.000.000 [%]
100.0
80.00
60.00
40.00
20.00
0.000
[%]
ISR_refined: Curve 1/FreqISR_refined: Curve 2/Pgen=Pload (MW)
Pgen
Pload
Case 1 Case 2 Case 3
100.080.0060.0040.0020.000.000 [%]
100.0
80.00
60.00
40.00
20.00
0.000
[%]
ISR_refined: Curve 1/FreqISR_refined: Curve 2/Pgen=Pload (MW)
Pgen
Pload
Case 1 Case 2 Case 3
Figure 4-14: 2D ISR for study system with frequency criteria defined in Appendix C [4-34]: system frequency should be within [49.8, 50.2] Hz within 15s after islanding.
In order to verify the ISR, three cases with dynamic simulation results were studied (marked in Figure 4-14), as shown in the following, from Figure 4-15 to Figure 4-17. Table 4-4 lists the parameters for both generation and loads for three cases, respec-tively. Case 1 and 3 were outside ISR and their frequency after islanding could not meet the criteria, indicating they could not survive the islanding transition.
Table 4-4: Parameters of generators and loads for three study cases
(G2+G3)
MW/pu
(Pbase=163.2+108.8=272)
External Grid
MW
(Load A+Load B+Load C)
MW/pu
(Pbase=120+125+72=317)
Losses
MW
Case 1 (81.6+54.4=136)/0.5 -102.653 (12+12.5+7.2=31.7)/0.1 1.647
Case 2 (81.6+54.4=136)/0.5 -8.56 (48+50+28.8=126.8)/0.4 0.64
Case 3 (81.6+54.4=136)/0.5 119.45 (96+100+57.6=253.6)/0.8 1.85
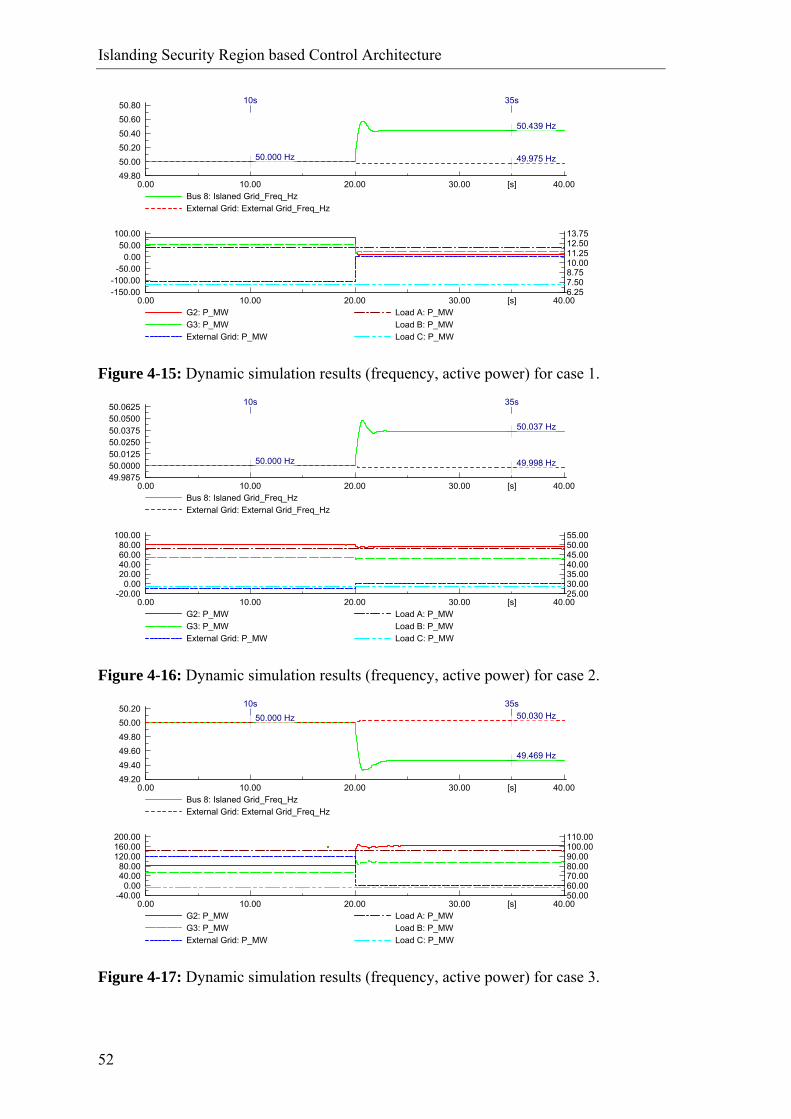
Islanding Security Region based Control Architecture
52
40.0030.0020.0010.000.00 [s]
100.0050.00
0.00-50.00
-100.00-150.00
13.7512.5011.2510.008.757.506.25
G2: P_MW Load A: P_MWG3: P_MWExternal Grid: P_MW
Load B: P_MWLoad C: P_MW
40.0030.0020.0010.000.00 [s]
50.8050.6050.4050.2050.0049.80
Bus 8: Islaned Grid_Freq_HzExternal Grid: External Grid_Freq_Hz
10s
50.000 Hz
35s
49.975 Hz
50.439 Hz
Figure 4-15: Dynamic simulation results (frequency, active power) for case 1.
40.0030.0020.0010.000.00 [s]
100.0080.0060.0040.0020.00
0.00-20.00
55.0050.0045.0040.0035.0030.0025.00
G2: P_MW Load A: P_MWG3: P_MWExternal Grid: P_MW
Load B: P_MWLoad C: P_MW
40.0030.0020.0010.000.00 [s]
50.062550.050050.037550.025050.012550.000049.9875
Bus 8: Islaned Grid_Freq_HzExternal Grid: External Grid_Freq_Hz
10s
50.000 Hz
35s
49.998 Hz
50.037 Hz
Figure 4-16: Dynamic simulation results (frequency, active power) for case 2.
40.0030.0020.0010.000.00 [s]
200.00160.00120.00
80.0040.00
0.00-40.00
110.00100.0090.0080.0070.0060.0050.00
G2: P_MW Load A: P_MWG3: P_MWExternal Grid: P_MW
Load B: P_MWLoad C: P_MW
40.0030.0020.0010.000.00 [s]
50.2050.0049.8049.6049.4049.20
Bus 8: Islaned Grid_Freq_HzExternal Grid: External Grid_Freq_Hz
10s50.000 Hz
35s
49.469 Hz
50.030 Hz
Figure 4-17: Dynamic simulation results (frequency, active power) for case 3.
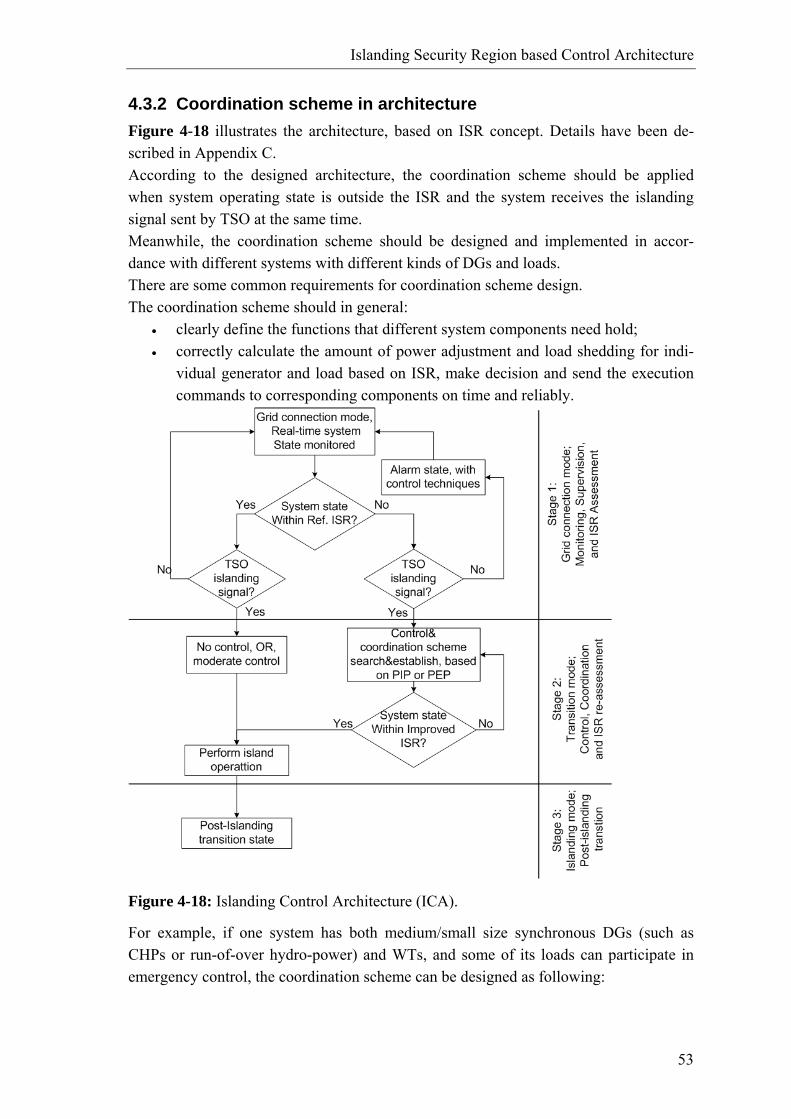
Islanding Security Region based Control Architecture
53
4.3.2 Coordination scheme in architecture Figure 4-18 illustrates the architecture, based on ISR concept. Details have been de-scribed in Appendix C. According to the designed architecture, the coordination scheme should be applied when system operating state is outside the ISR and the system receives the islanding signal sent by TSO at the same time. Meanwhile, the coordination scheme should be designed and implemented in accor-dance with different systems with different kinds of DGs and loads. There are some common requirements for coordination scheme design. The coordination scheme should in general:
• clearly define the functions that different system components need hold; • correctly calculate the amount of power adjustment and load shedding for indi-
vidual generator and load based on ISR, make decision and send the execution commands to corresponding components on time and reliably.
Figure 4-18: Islanding Control Architecture (ICA).
For example, if one system has both medium/small size synchronous DGs (such as CHPs or run-of-over hydro-power) and WTs, and some of its loads can participate in emergency control, the coordination scheme can be designed as following:

Islanding Security Region based Control Architecture
54
• Step 1: define functions of different components: One CHP switches to isochronous mode and others still in dispatch mode
(Master-slave mode [4-4]); or some/all CHPs switch to droop control to realize a load sharing function;
WTs are standby for possible power downward or upward (if WT is not under power optimization or limitation mode) adjustment;
Loads that can be shed are placed on the list for selection. • Step 2: calculate power needed for adjustment and make a decision to allocate
the task: Calculate the amount of power needed for adjustment, based on ISR; Compare the calculated power with the WT’s ability, and make decision
if WT is capable; Send command to WT, otherwise calculate the power amount for load
shedding, based on power exchange through interconnection: Select loads which have the closest amount of power needed for
load shedding on the list; Send load shedding command.
In chapter 6, a specific coordination scheme for a Canadian rural feeder benchmark is designed and demonstrated in PF.
55
5 INVESTIGATION OF FACTORS AFFECTING ISLANDING SECURITY REGION
5.1 Criteria influence In the flow chart for calculating Islanding Security Region (ISR) in Figure 4-13 of Chapter 4, whether or not the system could be successfully islanded depends on the fre-quency requirement: within 15 seconds after the system has been islanded, system fre-quency should return to the range [f1, f2] Hz. In fact, this assessment reference for islanding transition can include other requirements, for example, the voltage requrie-ment, except for the frequency requirement if necessary. The selection of different re-quirements is refered to the criteria design in this subchapter. To understand how differ-ent criteria affect the ISR would be of use for criteria design. Thus, it is the purpose for this subchapter to study the influence of the criteria design on the ISR. Before designing appropriate criteria, we need answer two questions: what system pa-rameters should be considered and where are those requirements? Those criteria for islanding transition assessment should include the requirements for equipments and overall system performance. These can be based on the protection re-quirements, which define the minimum acceptable conditions for equipments operation and their endurance to disturbances. Among other things, we mainly consider the gen-erator protection to avoid the interruption and the damage to generators, because they are crucial for power balance and frequency stability during the islanding transition. Equally, other requirements are acknowledged as important and they can be included if needed, but not considered in this study. However, there is still a wide range of abnormal conditions for generator [5-1, p.165]:
a. Winding Faults: • Stator • Phase and Ground • Rotor
b. Overload c. Overspeed d. Abnormal Voltages and Frequencies e. Underexcitation f. Motoring and Start-up.
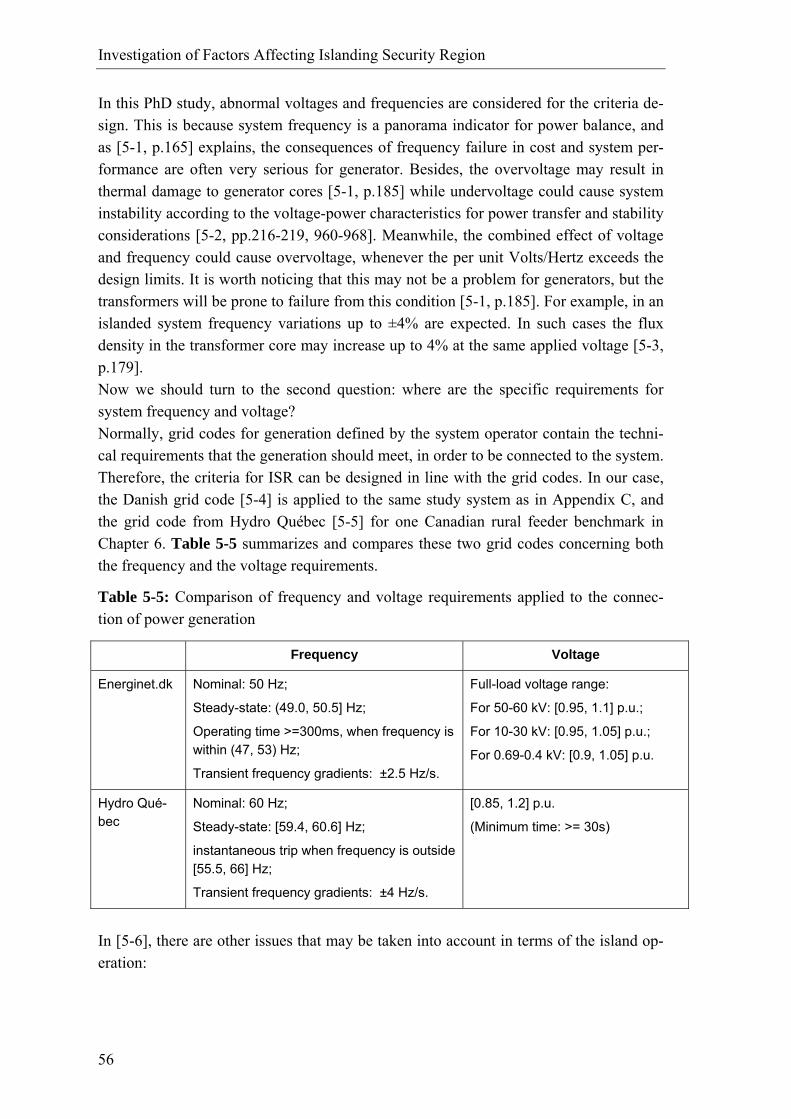
Investigation of Factors Affecting Islanding Security Region
56
In this PhD study, abnormal voltages and frequencies are considered for the criteria de-sign. This is because system frequency is a panorama indicator for power balance, and as [5-1, p.165] explains, the consequences of frequency failure in cost and system per-formance are often very serious for generator. Besides, the overvoltage may result in thermal damage to generator cores [5-1, p.185] while undervoltage could cause system instability according to the voltage-power characteristics for power transfer and stability considerations [5-2, pp.216-219, 960-968]. Meanwhile, the combined effect of voltage and frequency could cause overvoltage, whenever the per unit Volts/Hertz exceeds the design limits. It is worth noticing that this may not be a problem for generators, but the transformers will be prone to failure from this condition [5-1, p.185]. For example, in an islanded system frequency variations up to ±4% are expected. In such cases the flux density in the transformer core may increase up to 4% at the same applied voltage [5-3, p.179]. Now we should turn to the second question: where are the specific requirements for system frequency and voltage? Normally, grid codes for generation defined by the system operator contain the techni-cal requirements that the generation should meet, in order to be connected to the system. Therefore, the criteria for ISR can be designed in line with the grid codes. In our case, the Danish grid code [5-4] is applied to the same study system as in Appendix C, and the grid code from Hydro Québec [5-5] for one Canadian rural feeder benchmark in Chapter 6. Table 5-5 summarizes and compares these two grid codes concerning both the frequency and the voltage requirements.
Table 5-5: Comparison of frequency and voltage requirements applied to the connec-tion of power generation
Frequency Voltage
Energinet.dk Nominal: 50 Hz;
Steady-state: (49.0, 50.5] Hz;
Operating time >=300ms, when frequency is within (47, 53) Hz;
Transient frequency gradients: ±2.5 Hz/s.
Full-load voltage range:
For 50-60 kV: [0.95, 1.1] p.u.;
For 10-30 kV: [0.95, 1.05] p.u.;
For 0.69-0.4 kV: [0.9, 1.05] p.u.
Hydro Qué-bec
Nominal: 60 Hz;
Steady-state: [59.4, 60.6] Hz;
instantaneous trip when frequency is outside [55.5, 66] Hz;
Transient frequency gradients: ±4 Hz/s.
[0.85, 1.2] p.u.
(Minimum time: >= 30s)
In [5-6], there are other issues that may be taken into account in terms of the island op-eration:
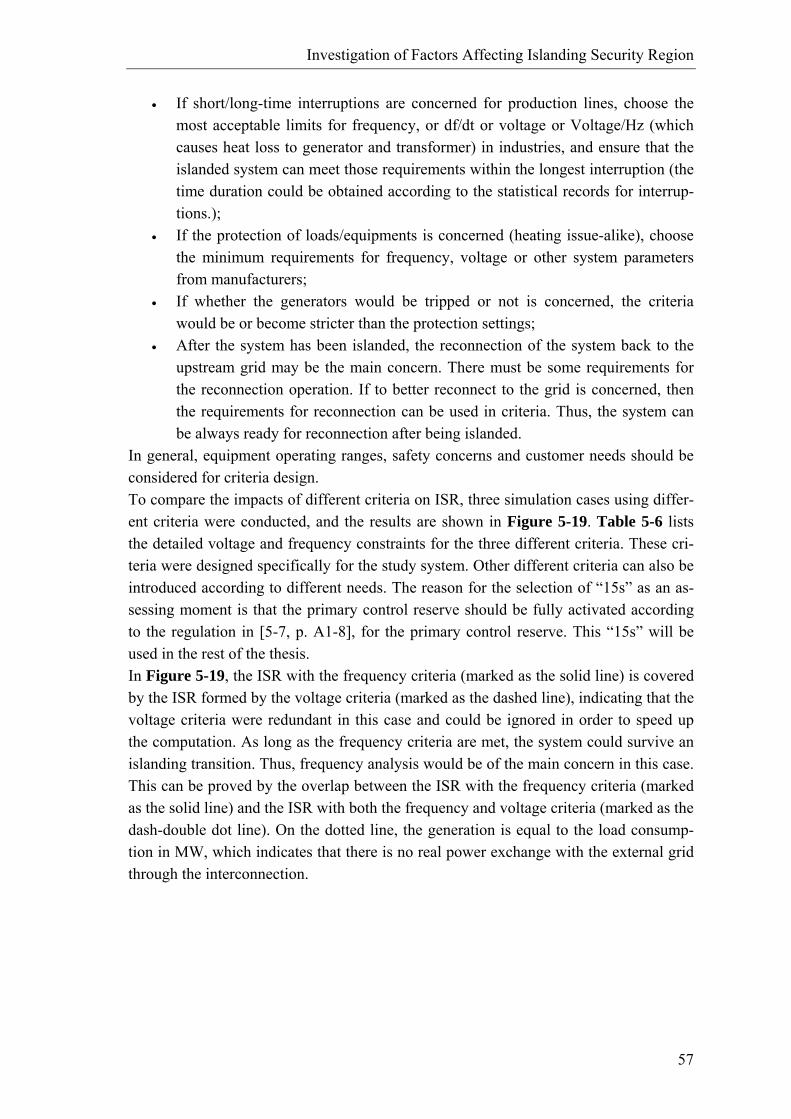
Investigation of Factors Affecting Islanding Security Region
57
• If short/long-time interruptions are concerned for production lines, choose the most acceptable limits for frequency, or df/dt or voltage or Voltage/Hz (which causes heat loss to generator and transformer) in industries, and ensure that the islanded system can meet those requirements within the longest interruption (the time duration could be obtained according to the statistical records for interrup-tions.);
• If the protection of loads/equipments is concerned (heating issue-alike), choose the minimum requirements for frequency, voltage or other system parameters from manufacturers;
• If whether the generators would be tripped or not is concerned, the criteria would be or become stricter than the protection settings;
• After the system has been islanded, the reconnection of the system back to the upstream grid may be the main concern. There must be some requirements for the reconnection operation. If to better reconnect to the grid is concerned, then the requirements for reconnection can be used in criteria. Thus, the system can be always ready for reconnection after being islanded.
In general, equipment operating ranges, safety concerns and customer needs should be considered for criteria design. To compare the impacts of different criteria on ISR, three simulation cases using differ-ent criteria were conducted, and the results are shown in Figure 5-19. Table 5-6 lists the detailed voltage and frequency constraints for the three different criteria. These cri-teria were designed specifically for the study system. Other different criteria can also be introduced according to different needs. The reason for the selection of “15s” as an as-sessing moment is that the primary control reserve should be fully activated according to the regulation in [5-7, p. A1-8], for the primary control reserve. This “15s” will be used in the rest of the thesis. In Figure 5-19, the ISR with the frequency criteria (marked as the solid line) is covered by the ISR formed by the voltage criteria (marked as the dashed line), indicating that the voltage criteria were redundant in this case and could be ignored in order to speed up the computation. As long as the frequency criteria are met, the system could survive an islanding transition. Thus, frequency analysis would be of the main concern in this case. This can be proved by the overlap between the ISR with the frequency criteria (marked as the solid line) and the ISR with both the frequency and voltage criteria (marked as the dash-double dot line). On the dotted line, the generation is equal to the load consump-tion in MW, which indicates that there is no real power exchange with the external grid through the interconnection.
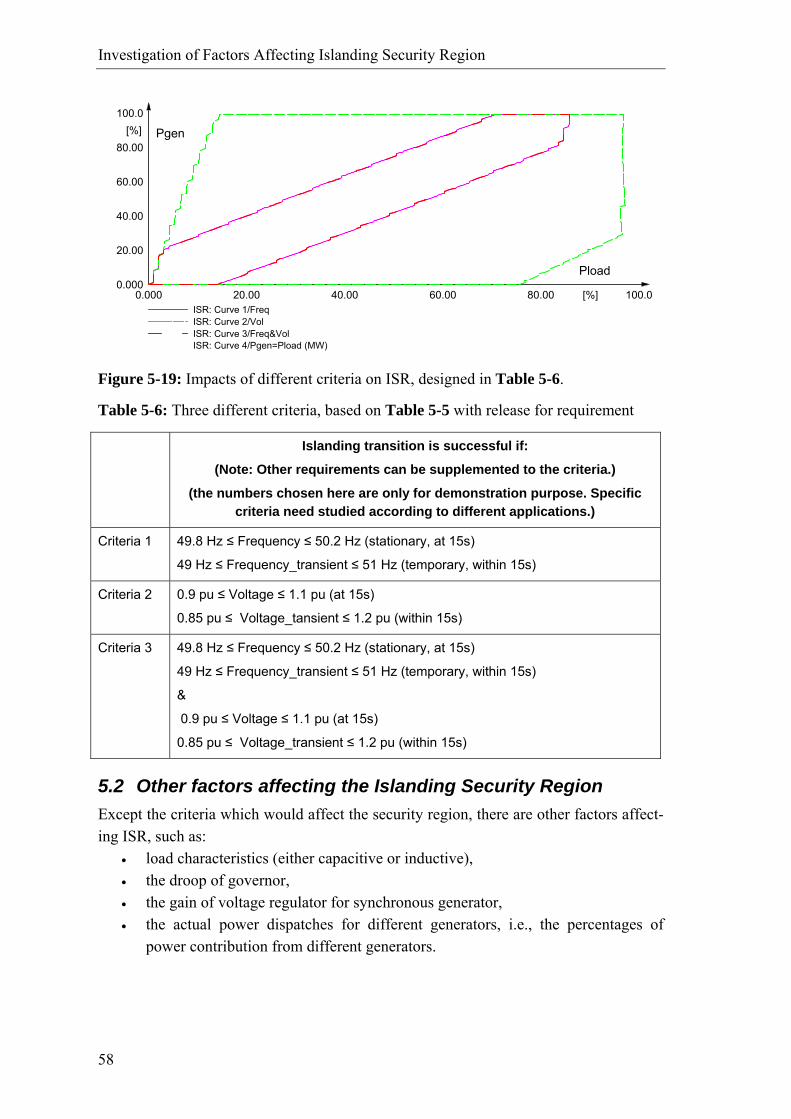
Investigation of Factors Affecting Islanding Security Region
58
100.080.0060.0040.0020.000.000 [%]
100.0
80.00
60.00
40.00
20.00
0.000
[%]
ISR: Curve 1/FreqISR: Curve 2/VolISR: Curve 3/Freq&VolISR: Curve 4/Pgen=Pload (MW)
Pgen
Pload
Figure 5-19: Impacts of different criteria on ISR, designed in Table 5-6.
Table 5-6: Three different criteria, based on Table 5-5 with release for requirement
Islanding transition is successful if:
(Note: Other requirements can be supplemented to the criteria.)
(the numbers chosen here are only for demonstration purpose. Specific criteria need studied according to different applications.)
Criteria 1 49.8 Hz ≤ Frequency ≤ 50.2 Hz (stationary, at 15s)
49 Hz ≤ Frequency_transient ≤ 51 Hz (temporary, within 15s)
Criteria 2 0.9 pu ≤ Voltage ≤ 1.1 pu (at 15s)
0.85 pu ≤ Voltage_tansient ≤ 1.2 pu (within 15s)
Criteria 3 49.8 Hz ≤ Frequency ≤ 50.2 Hz (stationary, at 15s)
49 Hz ≤ Frequency_transient ≤ 51 Hz (temporary, within 15s)
&
0.9 pu ≤ Voltage ≤ 1.1 pu (at 15s)
0.85 pu ≤ Voltage_transient ≤ 1.2 pu (within 15s)
5.2 Other factors affecting the Islanding Security Region Except the criteria which would affect the security region, there are other factors affect-ing ISR, such as:
• load characteristics (either capacitive or inductive), • the droop of governor, • the gain of voltage regulator for synchronous generator, • the actual power dispatches for different generators, i.e., the percentages of
power contribution from different generators.
Investigation of Factors Affecting Islanding Security Region
59
In what follows, those factors will be analyzed and discussed by different dynamic simulation cases. All simulations are based on the modified 9-bus system which has been introduced in Appendix C. The criteria are the same as in Table 5-6.
5.2.1 Load characteristics In order to demonstrate the influence of the load characteristic on the ISR, loads were modeled to consume more reactive power in DIgSILENT/PowerFactory (PF). It was expected that the voltage of the buses, to which those loads were connected, would be-come deteriorated, which may affect the ISR. The criteria 3 as listed in Table 5-6 were applied. The simulation results in Figure 5-20 verify the expectation. The ISR shrinks due to the more reactive power consumption. If we apply criteria 1 and 2 in Table Table 5-6, their respective ISRs can be plotted, as shown in Figure 5-21. It is clear that the voltage cri-teria affected the ISR, and the final ISR was the intersection of the separate ISRs formed by both frequency criteria and voltage criteria. Neither was redundant. Thus, it is important to study the load characteristics. The degree of the load inductive characteristic may affect the weight of voltage criteria on the formation of ISR. As de-scribed above, the voltage criteria was redundant when the loads were less inductive, while the voltage criteria would affect the shape of ISR when the loads became more inductive. Therefore, the criteria for islanding assessment may be simplified with the knowledge about the load characteristics. In the following, those inductive loads were retained.
100.080.0060.0040.0020.000.000 [%]
100.0
80.00
60.00
40.00
20.00
0.000
[%]
ISR: Curve 1/Freq&VolISR: Curve 2/Freq&Vol_MoreQISR: Curve 3/Pgen=Pload (MW)
Pgen
Pload
Figure 5-20: Impacts of load characteristics on ISR.
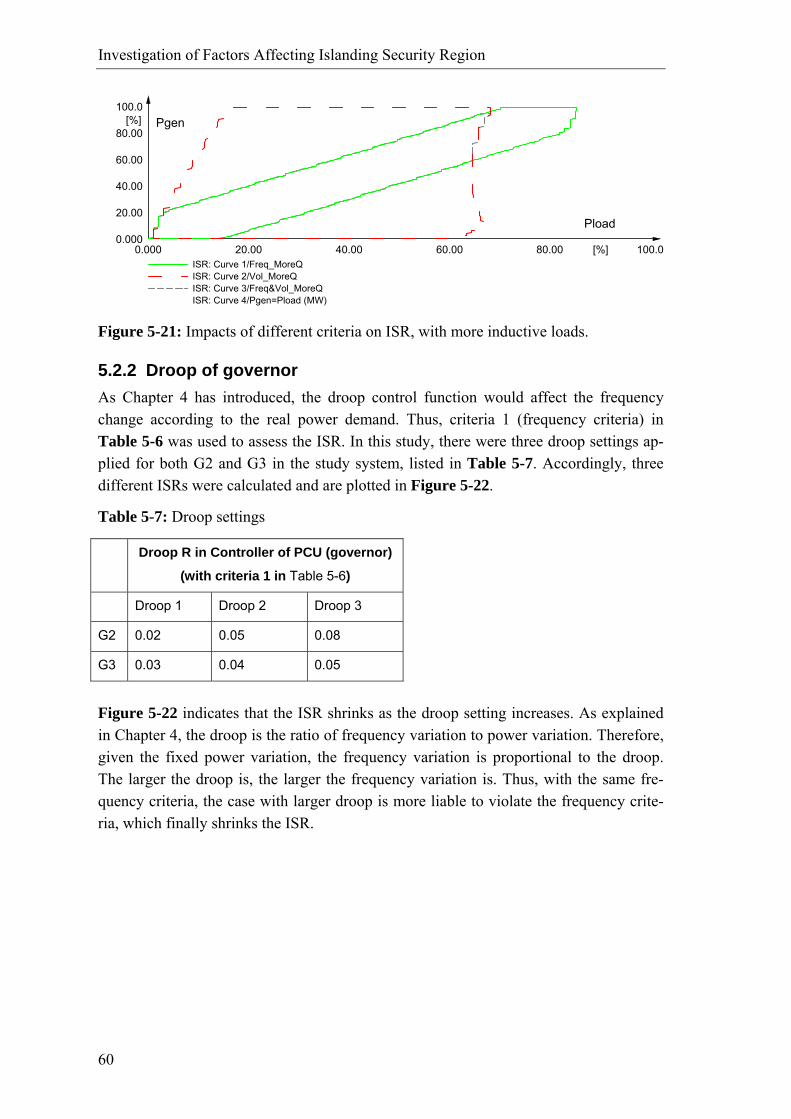
Investigation of Factors Affecting Islanding Security Region
60
100.080.0060.0040.0020.000.000 [%]
100.0
80.00
60.00
40.00
20.00
0.000
[%]
ISR: Curve 1/Freq_MoreQISR: Curve 2/Vol_MoreQISR: Curve 3/Freq&Vol_MoreQISR: Curve 4/Pgen=Pload (MW)
Pgen
Pload
Figure 5-21: Impacts of different criteria on ISR, with more inductive loads.
5.2.2 Droop of governor As Chapter 4 has introduced, the droop control function would affect the frequency change according to the real power demand. Thus, criteria 1 (frequency criteria) in Table 5-6 was used to assess the ISR. In this study, there were three droop settings ap-plied for both G2 and G3 in the study system, listed in Table 5-7. Accordingly, three different ISRs were calculated and are plotted in Figure 5-22.
Table 5-7: Droop settings
Droop R in Controller of PCU (governor)
(with criteria 1 in Table 5-6)
Droop 1 Droop 2 Droop 3
G2 0.02 0.05 0.08
G3 0.03 0.04 0.05
Figure 5-22 indicates that the ISR shrinks as the droop setting increases. As explained in Chapter 4, the droop is the ratio of frequency variation to power variation. Therefore, given the fixed power variation, the frequency variation is proportional to the droop. The larger the droop is, the larger the frequency variation is. Thus, with the same fre-quency criteria, the case with larger droop is more liable to violate the frequency crite-ria, which finally shrinks the ISR.
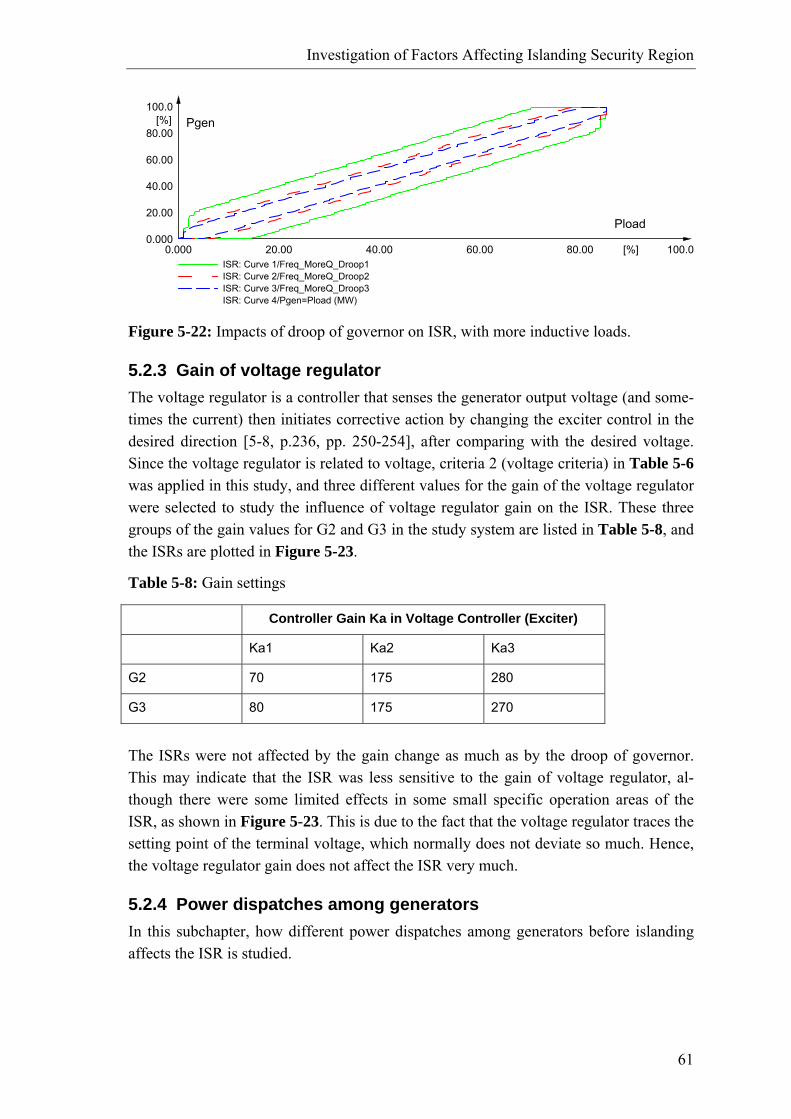
Investigation of Factors Affecting Islanding Security Region
61
100.080.0060.0040.0020.000.000 [%]
100.0
80.00
60.00
40.00
20.00
0.000
[%]
ISR: Curve 1/Freq_MoreQ_Droop1ISR: Curve 2/Freq_MoreQ_Droop2ISR: Curve 3/Freq_MoreQ_Droop3ISR: Curve 4/Pgen=Pload (MW)
Pgen
Pload
Figure 5-22: Impacts of droop of governor on ISR, with more inductive loads.
5.2.3 Gain of voltage regulator The voltage regulator is a controller that senses the generator output voltage (and some-times the current) then initiates corrective action by changing the exciter control in the desired direction [5-8, p.236, pp. 250-254], after comparing with the desired voltage. Since the voltage regulator is related to voltage, criteria 2 (voltage criteria) in Table 5-6 was applied in this study, and three different values for the gain of the voltage regulator were selected to study the influence of voltage regulator gain on the ISR. These three groups of the gain values for G2 and G3 in the study system are listed in Table 5-8, and the ISRs are plotted in Figure 5-23.
Table 5-8: Gain settings
Controller Gain Ka in Voltage Controller (Exciter)
Ka1 Ka2 Ka3
G2 70 175 280
G3 80 175 270
The ISRs were not affected by the gain change as much as by the droop of governor. This may indicate that the ISR was less sensitive to the gain of voltage regulator, al-though there were some limited effects in some small specific operation areas of the ISR, as shown in Figure 5-23. This is due to the fact that the voltage regulator traces the setting point of the terminal voltage, which normally does not deviate so much. Hence, the voltage regulator gain does not affect the ISR very much.
5.2.4 Power dispatches among generators In this subchapter, how different power dispatches among generators before islanding affects the ISR is studied.
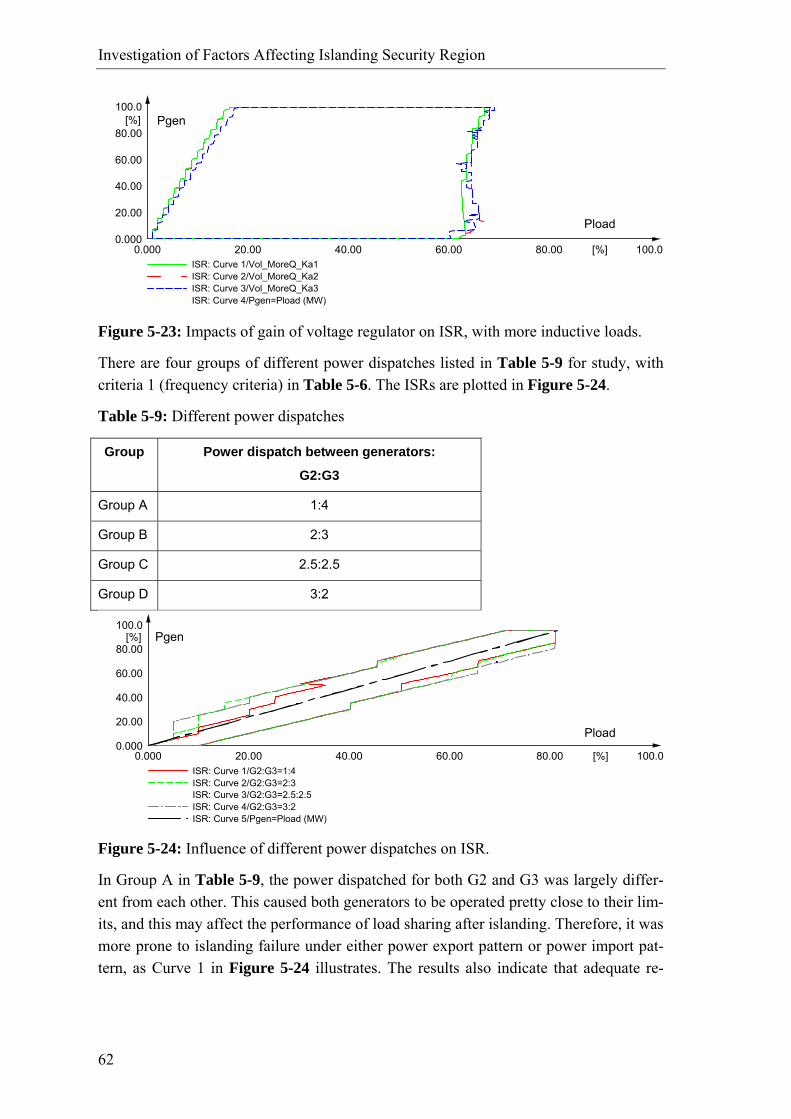
Investigation of Factors Affecting Islanding Security Region
62
100.080.0060.0040.0020.000.000 [%]
100.0
80.00
60.00
40.00
20.00
0.000
[%]
ISR: Curve 1/Vol_MoreQ_Ka1ISR: Curve 2/Vol_MoreQ_Ka2ISR: Curve 3/Vol_MoreQ_Ka3ISR: Curve 4/Pgen=Pload (MW)
Pgen
Pload
Figure 5-23: Impacts of gain of voltage regulator on ISR, with more inductive loads.
There are four groups of different power dispatches listed in Table 5-9 for study, with criteria 1 (frequency criteria) in Table 5-6. The ISRs are plotted in Figure 5-24.
Table 5-9: Different power dispatches
Group Power dispatch between generators:
G2:G3
Group A 1:4
Group B 2:3
Group C 2.5:2.5
Group D 3:2
100.080.0060.0040.0020.000.000 [%]
100.0
80.00
60.00
40.00
20.00
0.000
[%]
ISR: Curve 1/G2:G3=1:4ISR: Curve 2/G2:G3=2:3ISR: Curve 3/G2:G3=2.5:2.5ISR: Curve 4/G2:G3=3:2ISR: Curve 5/Pgen=Pload (MW)
Pgen
Pload
Figure 5-24: Influence of different power dispatches on ISR.
In Group A in Table 5-9, the power dispatched for both G2 and G3 was largely differ-ent from each other. This caused both generators to be operated pretty close to their lim-its, and this may affect the performance of load sharing after islanding. Therefore, it was more prone to islanding failure under either power export pattern or power import pat-tern, as Curve 1 in Figure 5-24 illustrates. The results also indicate that adequate re-
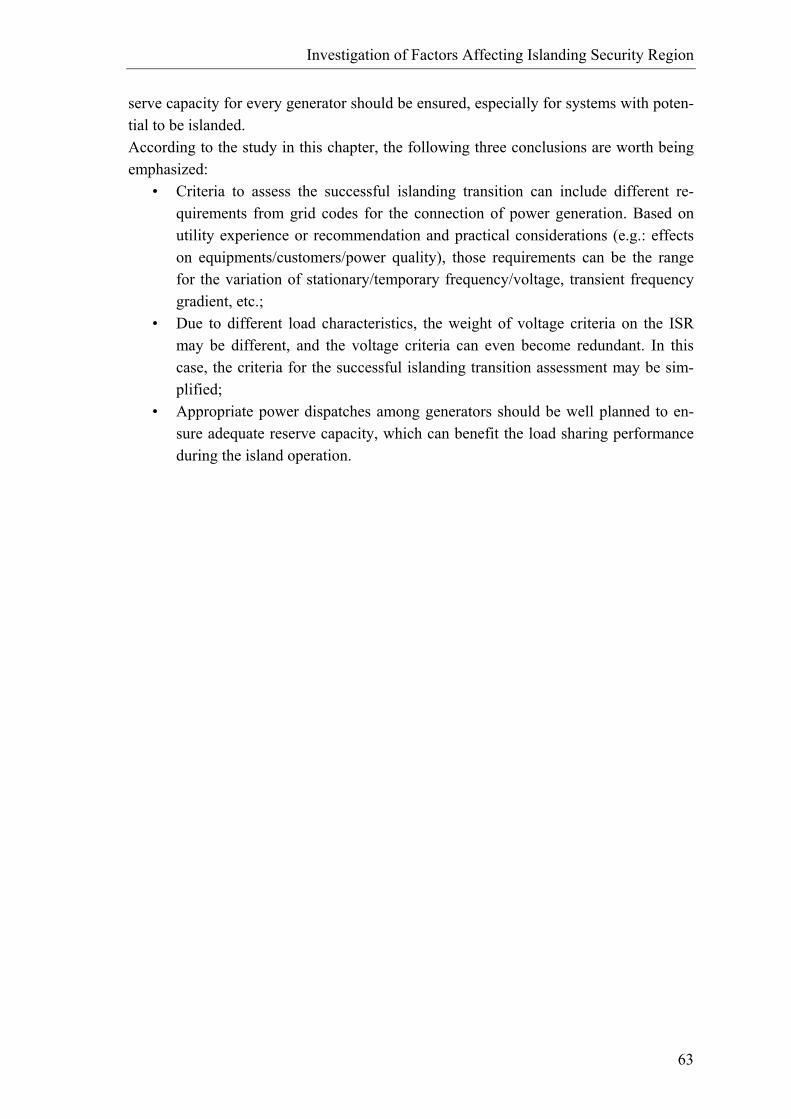
Investigation of Factors Affecting Islanding Security Region
63
serve capacity for every generator should be ensured, especially for systems with poten-tial to be islanded. According to the study in this chapter, the following three conclusions are worth being emphasized:
• Criteria to assess the successful islanding transition can include different re-quirements from grid codes for the connection of power generation. Based on utility experience or recommendation and practical considerations (e.g.: effects on equipments/customers/power quality), those requirements can be the range for the variation of stationary/temporary frequency/voltage, transient frequency gradient, etc.;
• Due to different load characteristics, the weight of voltage criteria on the ISR may be different, and the voltage criteria can even become redundant. In this case, the criteria for the successful islanding transition assessment may be sim-plified;
• Appropriate power dispatches among generators should be well planned to en-sure adequate reserve capacity, which can benefit the load sharing performance during the island operation.

65
6 CASE STUDY FOR ISLANDING CONTROL AR-CHITECTURE
As many DGs have been integrated into the distribution system and even more would be integrated in the future, there is a great potential to utilize them to maintain the security of power supply and consequently to avoid blackout. This is particularly important once the distribution system has to be islanded due to a disturbance occurring in the upstream grid or system maintenance, etc. Meanwhile, the electricity demand can also play an active role to assist power balance. This brings a measure to tackle the power balance issue, which is the most crucial prob-lem during island operation period [6-1]. However, the difficulty is how to coordinate DGs with demand in a smart way, consid-ering the possible availability of standardized Information and Communication Tech-nology (ICT), for example, IEC 61850. To answer this question, a tangible coordination scheme, as one organic element of the control architecture introduced in Chapter 4, is needed. This chapter tries to design and apply a detailed scheme to one Canadian rural feeder benchmark system to demonstrate effective coordination of its Wind Turbine (WT) and demand. It is necessary to point out that a different coordination scheme for a different specific system should be designed accordingly. But the architecture and the philosophy underneath the operational coordination scheme are generic and could be a reference for scheme design. In the following, the Canadian rural feeder benchmark system is introduced firstly, in-cluding the system model in both PSCAD/EMTDC and DIgSILENT/PowerFactory (PF). Based on that, a Demand as Frequency controlled Reserve (DFR) model devel-oped by CET, a WT with Fixed Speed Induction Generator (FSIG) and blade angle con-trol and their modeling in PF are described. Afterwards, a detailed coordination scheme is designed. Finally, Islanding Security Regions (ISRs) for different cases and the appli-cation of the scheme are introduced.
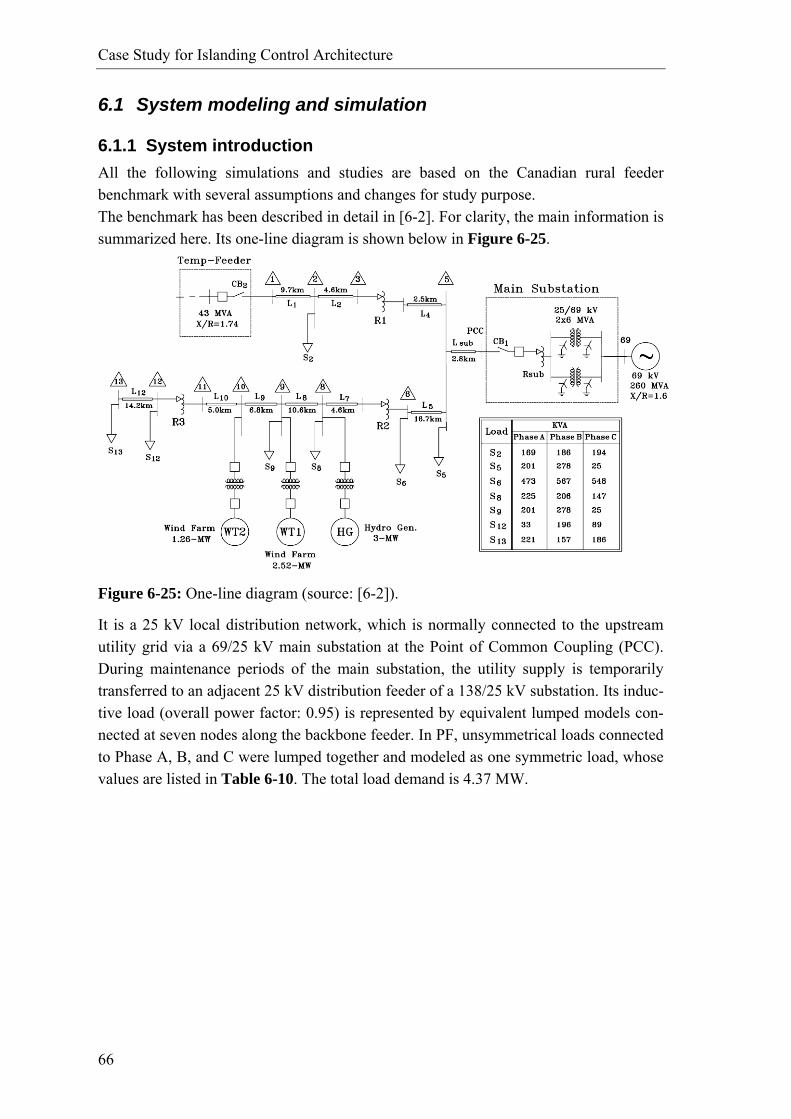
Case Study for Islanding Control Architecture
66
6.1 System modeling and simulation
6.1.1 System introduction All the following simulations and studies are based on the Canadian rural feeder benchmark with several assumptions and changes for study purpose. The benchmark has been described in detail in [6-2]. For clarity, the main information is summarized here. Its one-line diagram is shown below in Figure 6-25.
Figure 6-25: One-line diagram (source: [6-2]).
It is a 25 kV local distribution network, which is normally connected to the upstream utility grid via a 69/25 kV main substation at the Point of Common Coupling (PCC). During maintenance periods of the main substation, the utility supply is temporarily transferred to an adjacent 25 kV distribution feeder of a 138/25 kV substation. Its induc-tive load (overall power factor: 0.95) is represented by equivalent lumped models con-nected at seven nodes along the backbone feeder. In PF, unsymmetrical loads connected to Phase A, B, and C were lumped together and modeled as one symmetric load, whose values are listed in Table 6-10. The total load demand is 4.37 MW.
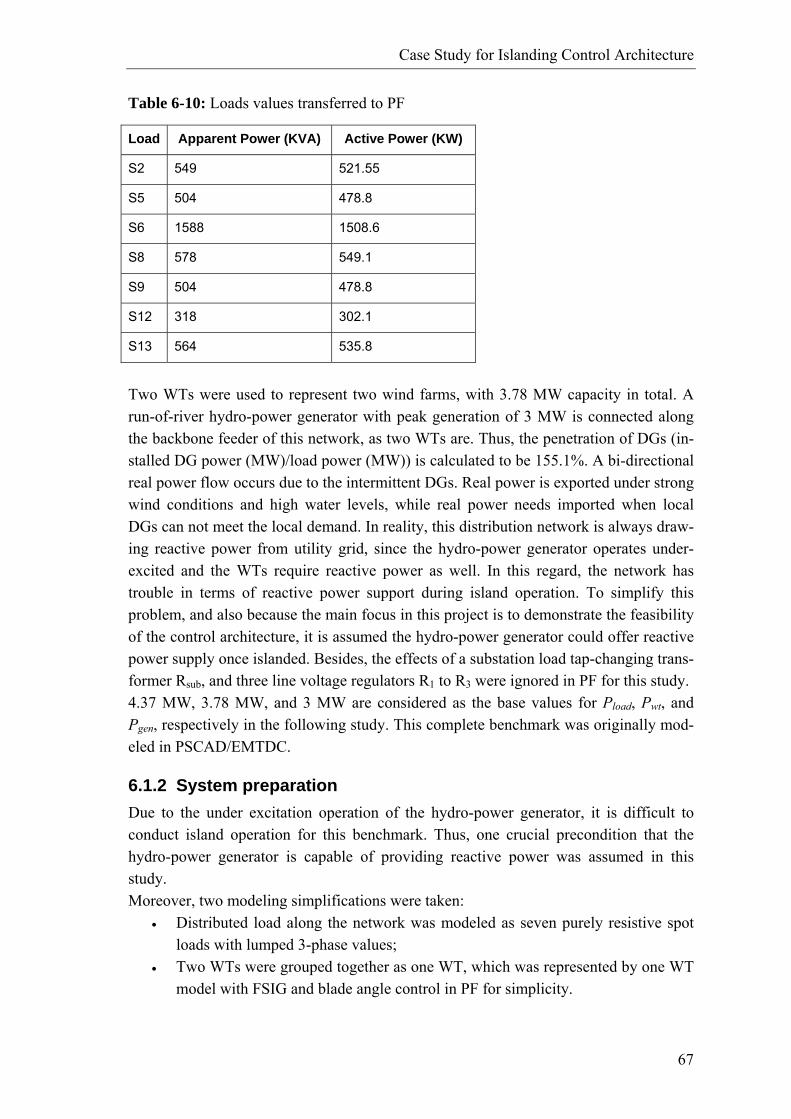
Case Study for Islanding Control Architecture
67
Table 6-10: Loads values transferred to PF
Load Apparent Power (KVA) Active Power (KW)
S2 549 521.55
S5 504 478.8
S6 1588 1508.6
S8 578 549.1
S9 504 478.8
S12 318 302.1
S13 564 535.8
Two WTs were used to represent two wind farms, with 3.78 MW capacity in total. A run-of-river hydro-power generator with peak generation of 3 MW is connected along the backbone feeder of this network, as two WTs are. Thus, the penetration of DGs (in-stalled DG power (MW)/load power (MW)) is calculated to be 155.1%. A bi-directional real power flow occurs due to the intermittent DGs. Real power is exported under strong wind conditions and high water levels, while real power needs imported when local DGs can not meet the local demand. In reality, this distribution network is always draw-ing reactive power from utility grid, since the hydro-power generator operates under-excited and the WTs require reactive power as well. In this regard, the network has trouble in terms of reactive power support during island operation. To simplify this problem, and also because the main focus in this project is to demonstrate the feasibility of the control architecture, it is assumed the hydro-power generator could offer reactive power supply once islanded. Besides, the effects of a substation load tap-changing trans-former Rsub, and three line voltage regulators R1 to R3 were ignored in PF for this study. 4.37 MW, 3.78 MW, and 3 MW are considered as the base values for Pload, Pwt, and Pgen, respectively in the following study. This complete benchmark was originally mod-eled in PSCAD/EMTDC.
6.1.2 System preparation Due to the under excitation operation of the hydro-power generator, it is difficult to conduct island operation for this benchmark. Thus, one crucial precondition that the hydro-power generator is capable of providing reactive power was assumed in this study. Moreover, two modeling simplifications were taken:
• Distributed load along the network was modeled as seven purely resistive spot loads with lumped 3-phase values;
• Two WTs were grouped together as one WT, which was represented by one WT model with FSIG and blade angle control in PF for simplicity.
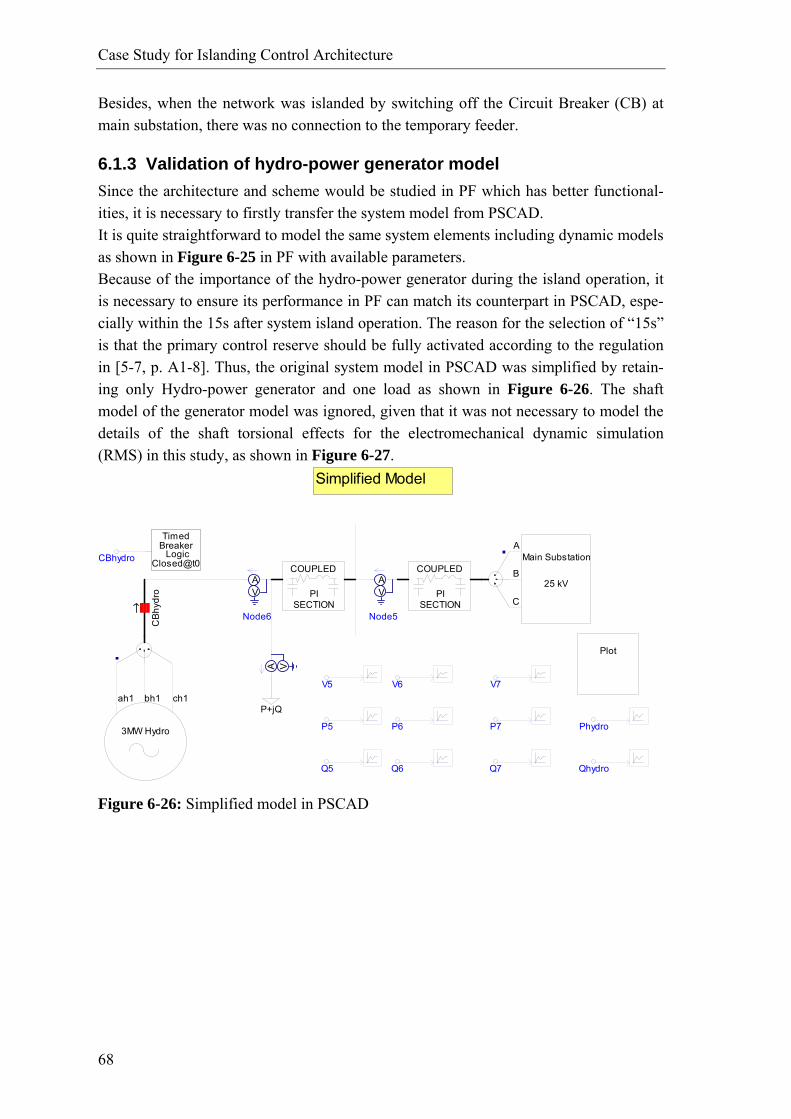
Case Study for Islanding Control Architecture
68
Besides, when the network was islanded by switching off the Circuit Breaker (CB) at main substation, there was no connection to the temporary feeder.
6.1.3 Validation of hydro-power generator model Since the architecture and scheme would be studied in PF which has better functional-ities, it is necessary to firstly transfer the system model from PSCAD. It is quite straightforward to model the same system elements including dynamic models as shown in Figure 6-25 in PF with available parameters. Because of the importance of the hydro-power generator during the island operation, it is necessary to ensure its performance in PF can match its counterpart in PSCAD, espe-cially within the 15s after system island operation. The reason for the selection of “15s” is that the primary control reserve should be fully activated according to the regulation in [5-7, p. A1-8]. Thus, the original system model in PSCAD was simplified by retain-ing only Hydro-power generator and one load as shown in Figure 6-26. The shaft model of the generator model was ignored, given that it was not necessary to model the details of the shaft torsional effects for the electromechanical dynamic simulation (RMS) in this study, as shown in Figure 6-27.
PI
COUPLED
SECTION
Plot
PI
COUPLED
SECTION
3MW Hydro
ah1 bh1 ch1
Main SubstationA
B
C
25 kV
CBh
ydro
TimedBreaker
LogicClosed@t0CBhydro
VA
Node5
VA
Node6
V6
P6
Q6
V5
P5
Q5
Phydro
Qhydro
P+jQ
VA
V7
P7
Q7
Simplified Model
Figure 6-26: Simplified model in PSCAD
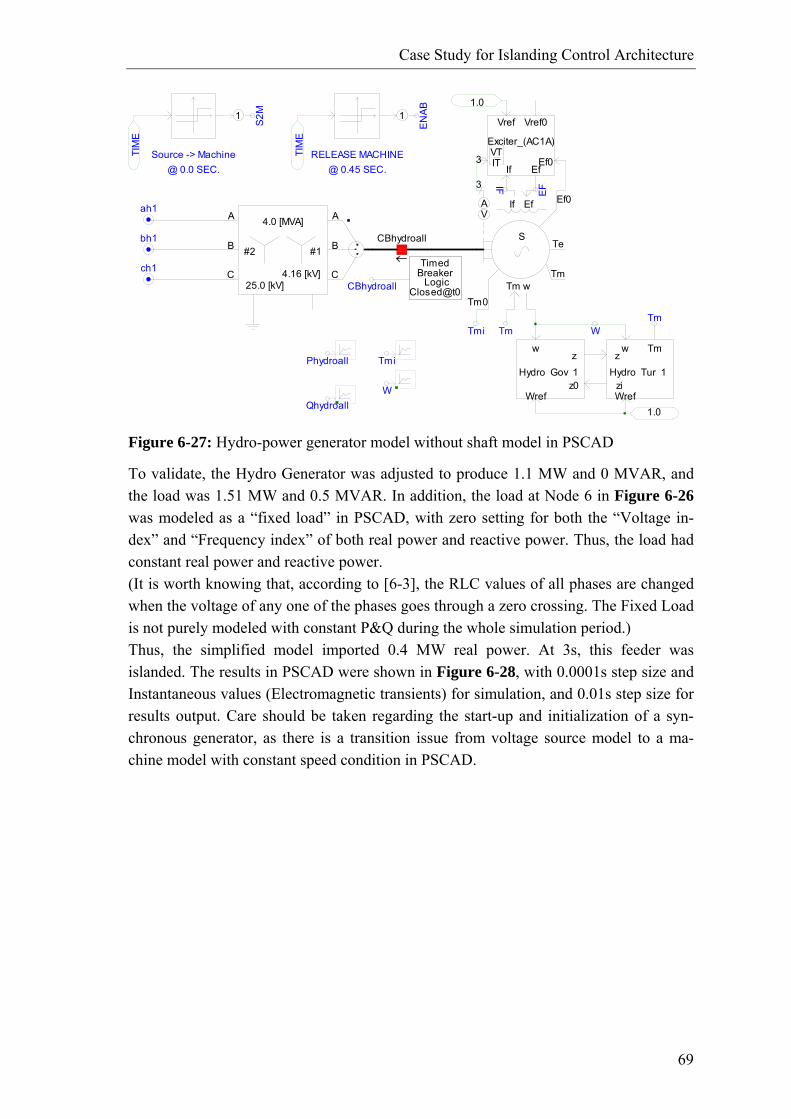
Case Study for Islanding Control Architecture
69
ah1
bh1
ch1
EFIF
VTIT3
If EfEf0
Vref
Exciter_(AC1A)
Vref0
STe
3
AV
Tm
Tm0
Ef0
Tm w
EfIf
w
Wrefz0
z Hydro Gov 1
1.0
w Tm
Wref
z
zi Hydro Tur 1
TmW
A
B
C
A
B
C25.0 [kV]
#2 #1
4.16 [kV]
4.0 [MVA]
EN
AB
TIM
E
1
S2M
TIM
E
1
RELEASE MACHINE@ 0.45 SEC.
Source -> Machine@ 0.0 SEC.
W
CBhydroall
Phydroall
Qhydroall
TimedBreaker
LogicClosed@t0CBhydroall
Tm
1.0
Tmi
Tmi
Figure 6-27: Hydro-power generator model without shaft model in PSCAD
To validate, the Hydro Generator was adjusted to produce 1.1 MW and 0 MVAR, and the load was 1.51 MW and 0.5 MVAR. In addition, the load at Node 6 in Figure 6-26 was modeled as a “fixed load” in PSCAD, with zero setting for both the “Voltage in-dex” and “Frequency index” of both real power and reactive power. Thus, the load had constant real power and reactive power. (It is worth knowing that, according to [6-3], the RLC values of all phases are changed when the voltage of any one of the phases goes through a zero crossing. The Fixed Load is not purely modeled with constant P&Q during the whole simulation period.) Thus, the simplified model imported 0.4 MW real power. At 3s, this feeder was islanded. The results in PSCAD were shown in Figure 6-28, with 0.0001s step size and Instantaneous values (Electromagnetic transients) for simulation, and 0.01s step size for results output. Care should be taken regarding the start-up and initialization of a syn-chronous generator, as there is a transition issue from voltage source model to a ma-chine model with constant speed condition in PSCAD.
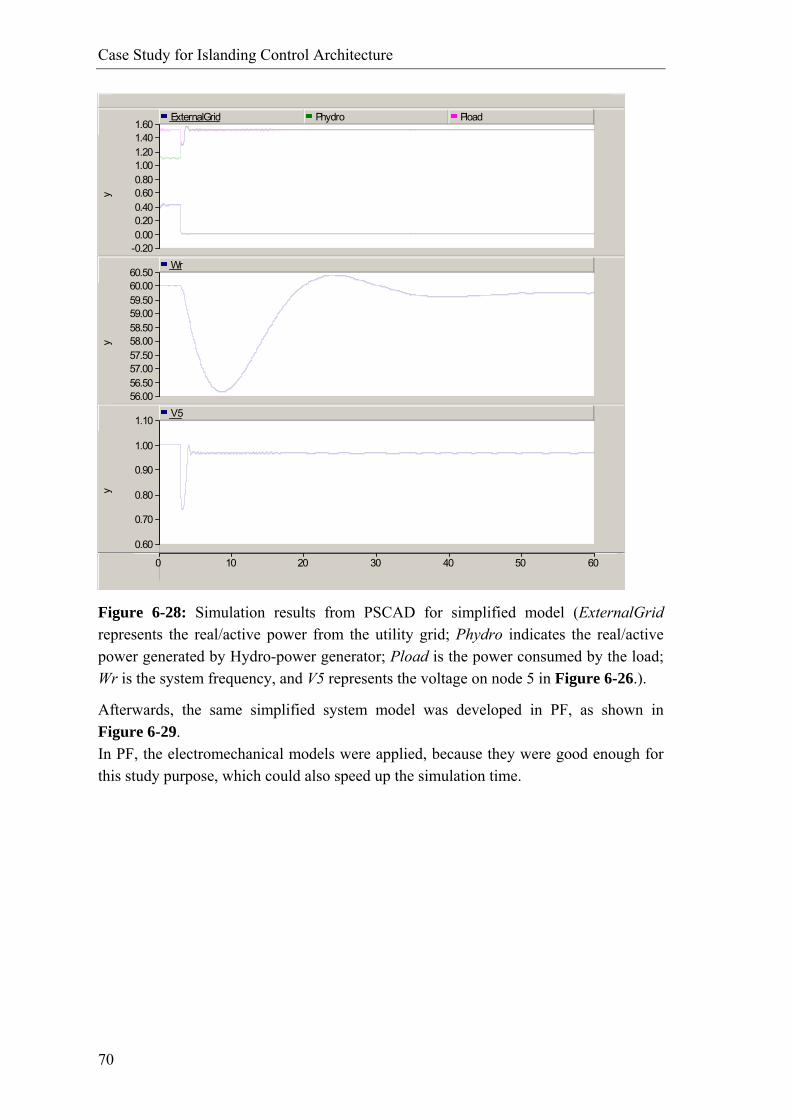
Case Study for Islanding Control Architecture
70
0 10 20 30 40 50 60
-0.20 0.00 0.20 0.40 0.60 0.80 1.00 1.20 1.40 1.60
yExternalGrid Phydro Pload
56.00 56.50 57.00 57.50 58.00 58.50 59.00 59.50 60.00 60.50
y
Wr
0.60
0.70
0.80
0.90
1.00
1.10
y
V5
Figure 6-28: Simulation results from PSCAD for simplified model (ExternalGrid represents the real/active power from the utility grid; Phydro indicates the real/active power generated by Hydro-power generator; Pload is the power consumed by the load; Wr is the system frequency, and V5 represents the voltage on node 5 in Figure 6-26.).
Afterwards, the same simplified system model was developed in PF, as shown in Figure 6-29. In PF, the electromechanical models were applied, because they were good enough for this study purpose, which could also speed up the simulation time.
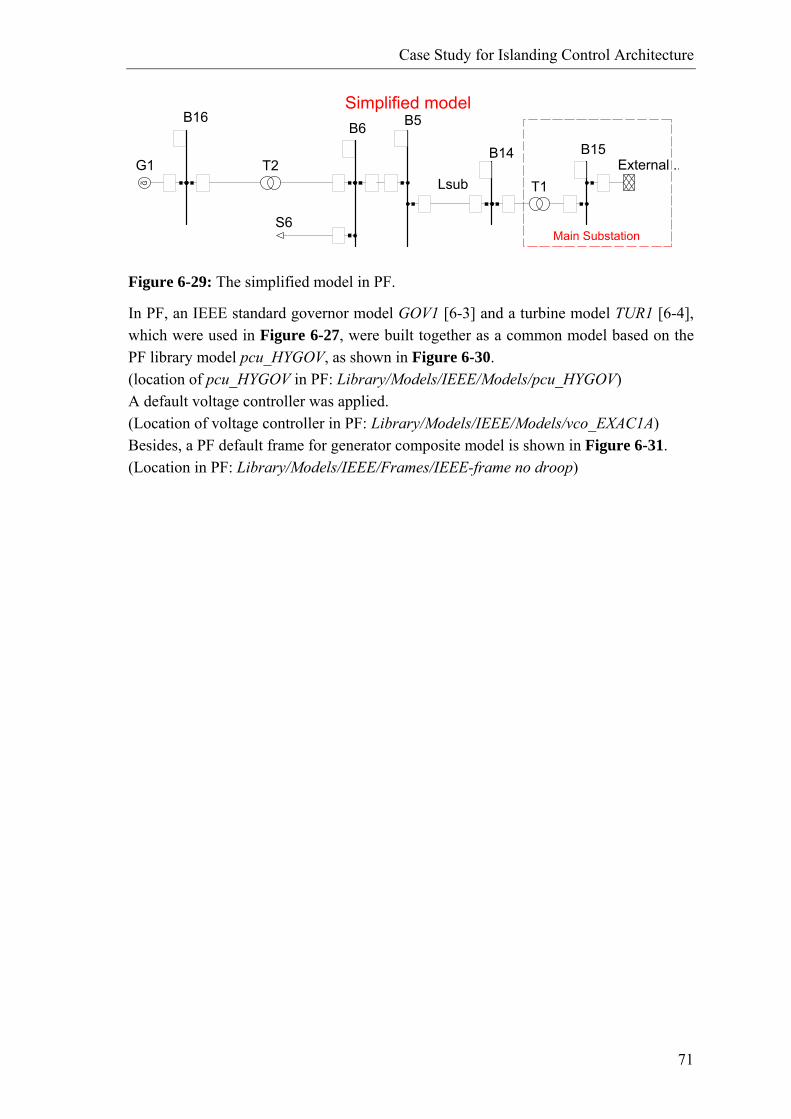
Case Study for Islanding Control Architecture
71
T2
Main Substation
Simplified model
External ..
G~
G1
S6
L5 Lsub T1
B16B6
B15B14
B5
Figure 6-29: The simplified model in PF.
In PF, an IEEE standard governor model GOV1 [6-3] and a turbine model TUR1 [6-4], which were used in Figure 6-27, were built together as a common model based on the PF library model pcu_HYGOV, as shown in Figure 6-30. (location of pcu_HYGOV in PF: Library/Models/IEEE/Models/pcu_HYGOV) A default voltage controller was applied. (Location of voltage controller in PF: Library/Models/IEEE/Models/vco_EXAC1A) Besides, a PF default frame for generator composite model is shown in Figure 6-31. (Location in PF: Library/Models/IEEE/Frames/IEEE-frame no droop)
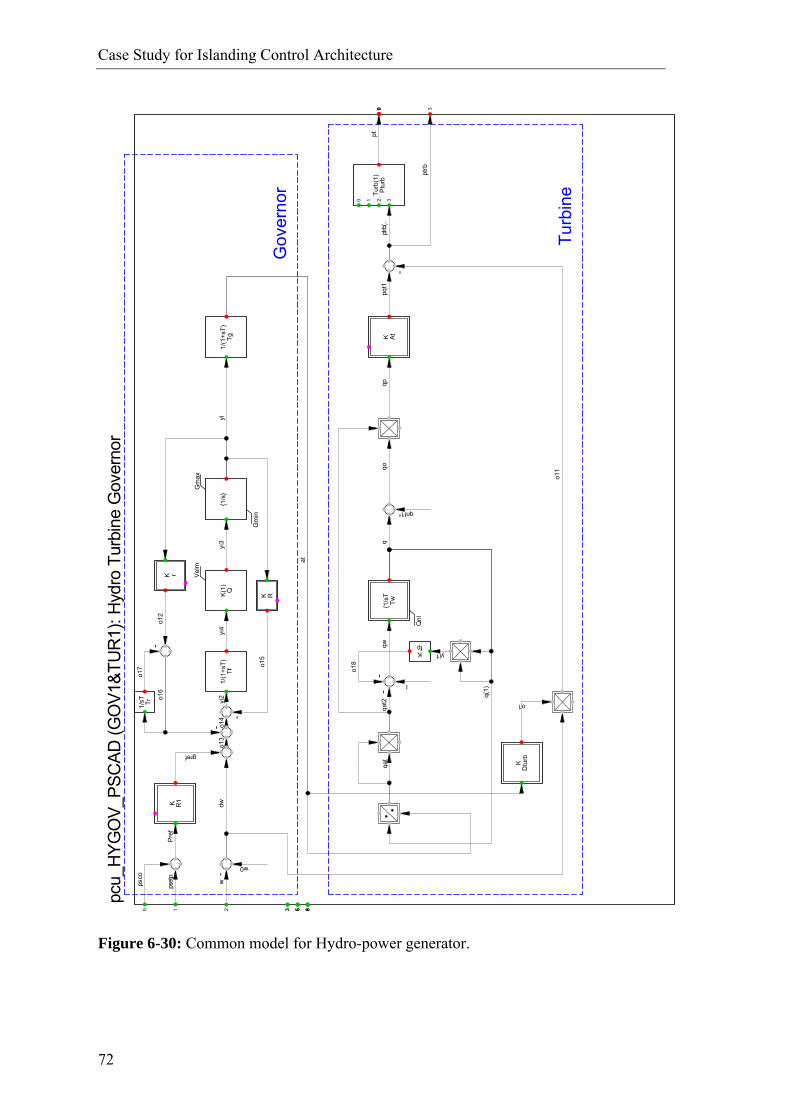
Case Study for Islanding Control Architecture
72
Turb
ine
Gov
erno
r
yi4
o18
yi3
yi1
o17
o1
o16
o12
o15
yi2
o14
o13
yi
q(1)
w
o11
at
dw
gref
Pref
w0
pset
p
psco
ptpq
t1ptr
b(..
ptrb
qnl1
I
qpqo
qqw
qat2
qat
K(1) Q
Velm
Kfp-
-
-
K r
1/sT Tr
-
-
--
-
Turb
(1)
Ptur
b
0 1 2 3K At
1/(1
+sT)
Tg
K R
{1/s
}
Gm
ax
Gm
in
1/(1
+sT)
Tf
K R1
KD
turb
{1/s
TTw
Qnl
pcu_
HYG
OV_
PSC
AD (G
OV1
&TU
R1)
: Hyd
ro T
urbi
ne G
over
nor
85
30
853
0
853
0
0 1 2
Figure 6-30: Common model for Hydro-power generator.
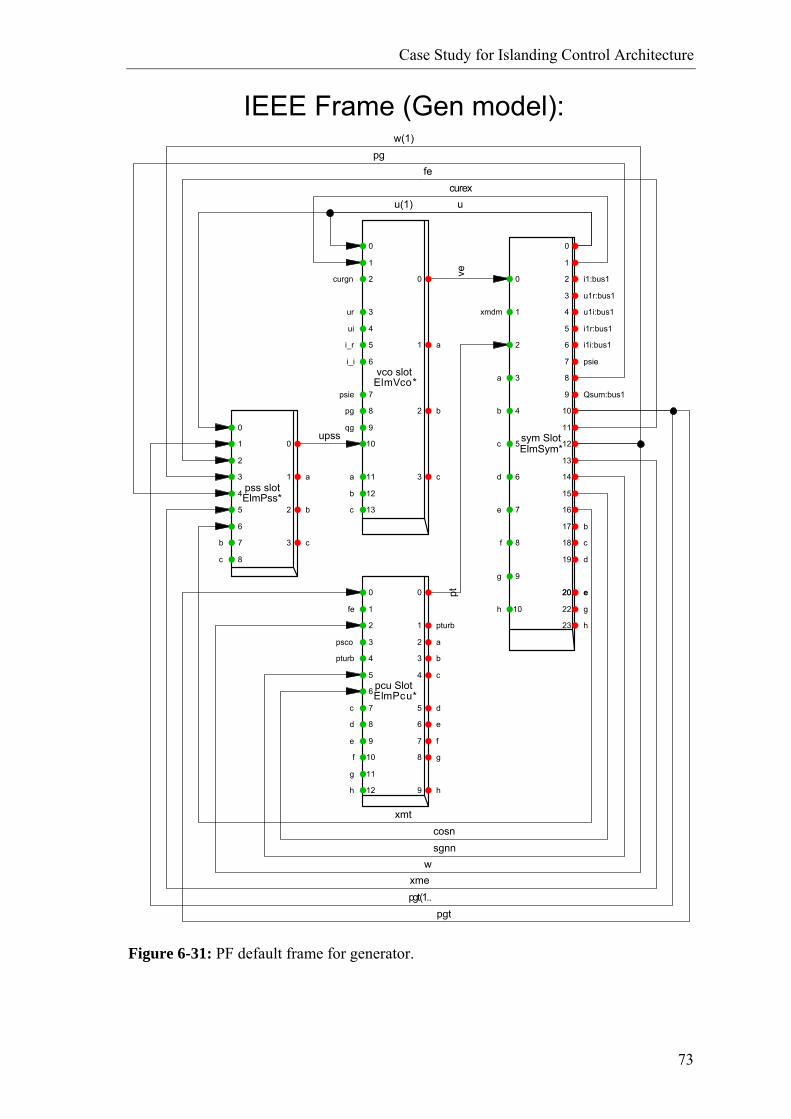
Case Study for Islanding Control Architecture
73
cosnsgnn
w
pgt
pt
xmt
xme
fe
pgt(1..
u(1)curex
w(1)
upss
pg
u
ve
vco slotElmVco*
curgn
ur
ui
i_r
i_i
psie
pg
qg
a
b
c
a
b
c
0
1
2
3
4
5
6
7
8
9
10
11
12
13
0
1
2
3
pcu SlotElmPcu*
fe
psco
pturb
c
d
e
f
g
h
pturb
a
b
c
d
e
f
g
h
0
1
2
3
4
5
6
7
8
9
10
11
12
0
1
2
3
4
5
6
7
8
9
sym SlotElmSym*
xmdm
a
b
c
d
e
f
g
h
i1:bus1
u1r:bus1
u1i:bus1
i1r:bus1
i1i:bus1
psie
Qsum:bus1
b
c
d
ee
g
h
0
1
2
3
4
5
6
7
8
9
10
0
1
2
3
4
5
6
7
8
9
10
11
12
13
14
15
16
17
18
19
2020
22
23
pss slotElmPss*
b
c
a
b
c
0
1
2
3
4
5
6
7
8
0
1
2
3
IEEE Frame (Gen model):
Figure 6-31: PF default frame for generator.
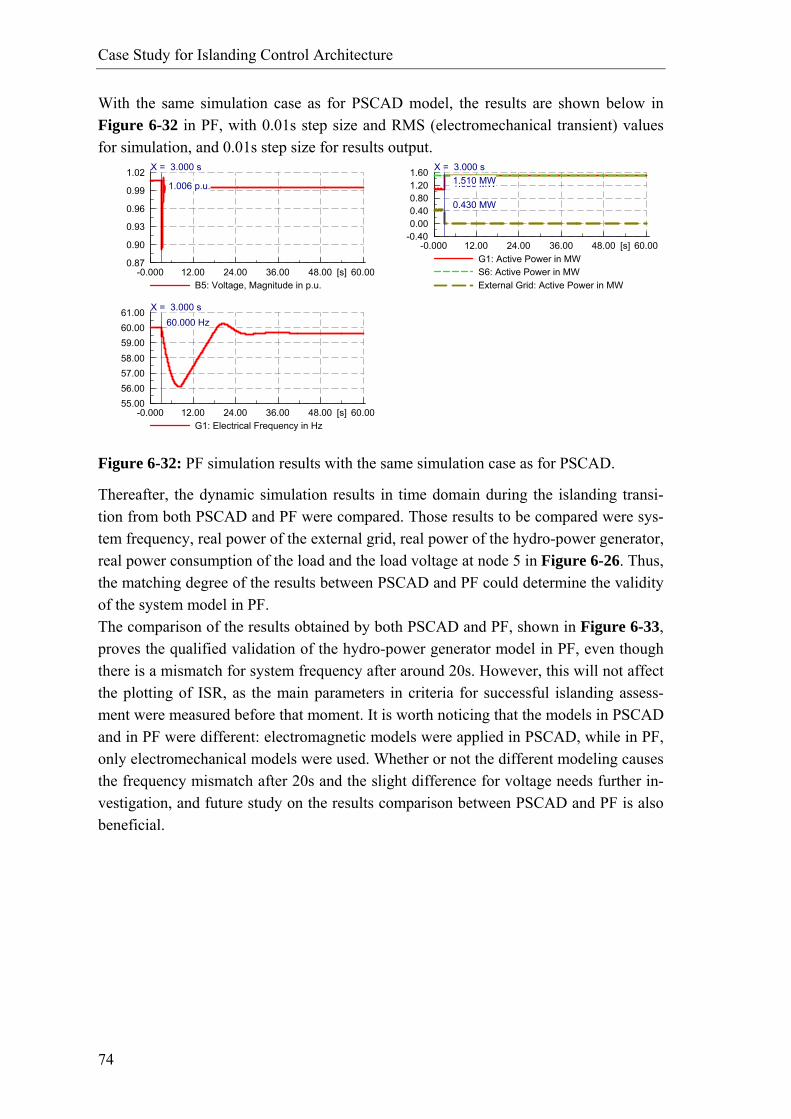
Case Study for Islanding Control Architecture
74
With the same simulation case as for PSCAD model, the results are shown below in Figure 6-32 in PF, with 0.01s step size and RMS (electromechanical transient) values for simulation, and 0.01s step size for results output.
60.0048.0036.0024.0012.00-0.000 [s]
1.02
0.99
0.96
0.93
0.90
0.87
B5: Voltage, Magnitude in p.u.
X = 3.000 s
1.006 p.u.
60.0048.0036.0024.0012.00-0.000 [s]
61.0060.0059.0058.0057.0056.0055.00
G1: Electrical Frequency in Hz
X = 3.000 s60.000 Hz
60.0048.0036.0024.0012.00-0.000 [s]
1.601.200.800.400.00
-0.40
G1: Active Power in MWS6: Active Power in MWExternal Grid: Active Power in MW
X = 3.000 s
0.430 MW
1.083 MW 1.510 MW
Figure 6-32: PF simulation results with the same simulation case as for PSCAD.
Thereafter, the dynamic simulation results in time domain during the islanding transi-tion from both PSCAD and PF were compared. Those results to be compared were sys-tem frequency, real power of the external grid, real power of the hydro-power generator, real power consumption of the load and the load voltage at node 5 in Figure 6-26. Thus, the matching degree of the results between PSCAD and PF could determine the validity of the system model in PF. The comparison of the results obtained by both PSCAD and PF, shown in Figure 6-33, proves the qualified validation of the hydro-power generator model in PF, even though there is a mismatch for system frequency after around 20s. However, this will not affect the plotting of ISR, as the main parameters in criteria for successful islanding assess-ment were measured before that moment. It is worth noticing that the models in PSCAD and in PF were different: electromagnetic models were applied in PSCAD, while in PF, only electromechanical models were used. Whether or not the different modeling causes the frequency mismatch after 20s and the slight difference for voltage needs further in-vestigation, and future study on the results comparison between PSCAD and PF is also beneficial.
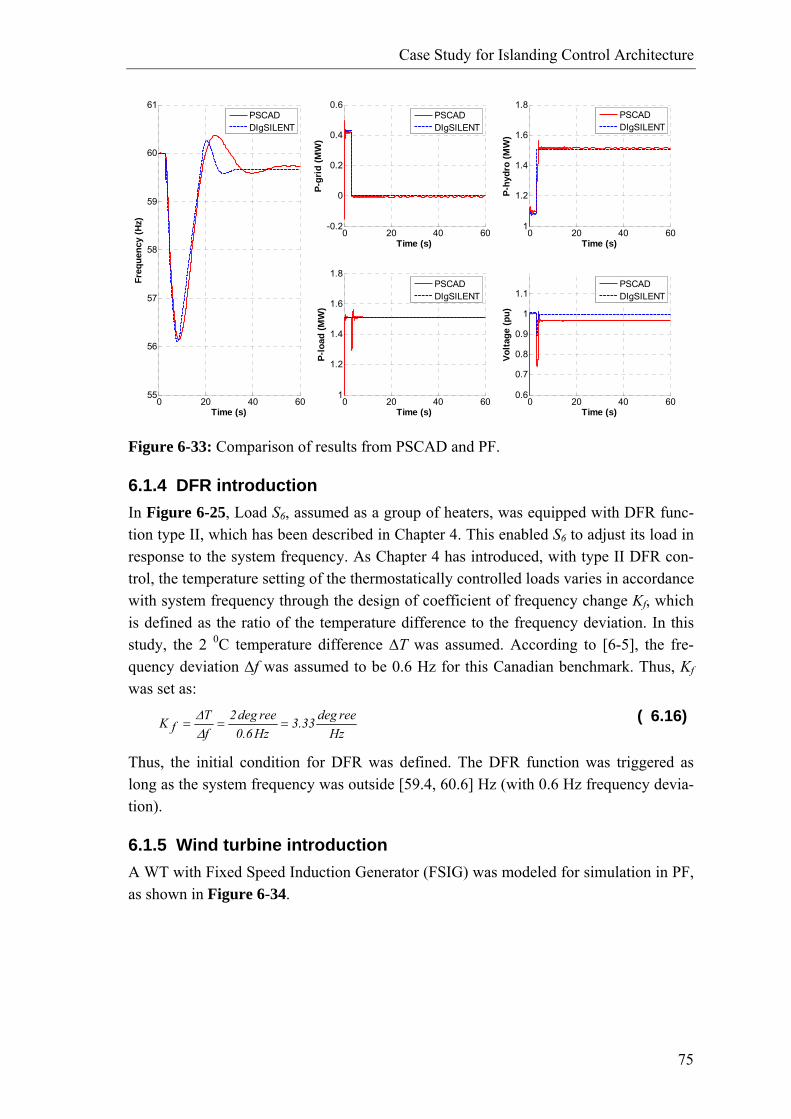
Case Study for Islanding Control Architecture
75
0 20 40 600.6
0.7
0.8
0.9
1
1.1
Time (s)
Volta
ge (p
u)
PSCADDIgSILENT
0 20 40 6055
56
57
58
59
60
61
Time (s)
Freq
uenc
y (H
z)
PSCADDIgSILENT
0 20 40 60-0.2
0
0.2
0.4
0.6
Time (s)
P-gr
id (M
W)
PSCADDIgSILENT
0 20 40 601
1.2
1.4
1.6
1.8
Time (s)
P-hy
dro
(MW
)
PSCADDIgSILENT
0 20 40 601
1.2
1.4
1.6
1.8
Time (s)
P-lo
ad (M
W)
PSCADDIgSILENT
Figure 6-33: Comparison of results from PSCAD and PF.
6.1.4 DFR introduction In Figure 6-25, Load S6, assumed as a group of heaters, was equipped with DFR func-tion type II, which has been described in Chapter 4. This enabled S6 to adjust its load in response to the system frequency. As Chapter 4 has introduced, with type II DFR con-trol, the temperature setting of the thermostatically controlled loads varies in accordance with system frequency through the design of coefficient of frequency change Kf, which is defined as the ratio of the temperature difference to the frequency deviation. In this study, the 2 0C temperature difference ∆T was assumed. According to [6-5], the fre-quency deviation ∆f was assumed to be 0.6 Hz for this Canadian benchmark. Thus, Kf was set as:
Hz
reedeg33.3Hz6.0reedeg2
fT
fK ===ΔΔ ( 6.16)
Thus, the initial condition for DFR was defined. The DFR function was triggered as long as the system frequency was outside [59.4, 60.6] Hz (with 0.6 Hz frequency devia-tion).
6.1.5 Wind turbine introduction A WT with Fixed Speed Induction Generator (FSIG) was modeled for simulation in PF, as shown in Figure 6-34.
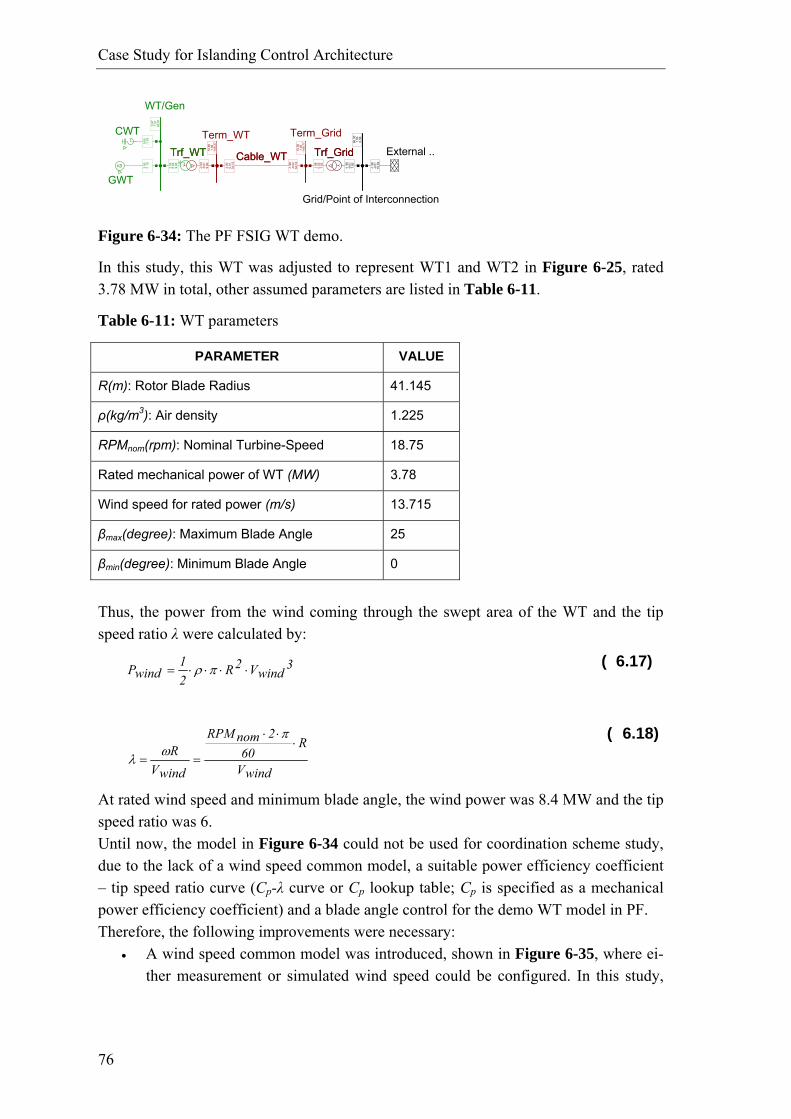
Case Study for Islanding Control Architecture
76
Trf_WT
-2.0
0-0
.01
9.90
Trf_WT2.
000.
029.
90
Trf_Grid
-1.9
8-0
.01
7.92
Trf_Grid
1.98
0.02
7.92
External ..
-1.9
8-0
.01
10.8
3
GWT
2.00
-1.1
6 G~
CWT0.
00-1
.18
Cable_WT
-1.9
8-0
.02
34.1
2
Cable_WT
2.00
0.01
34.1
2
Term_WT
10.6
01.
06-1
49.3
7
Term_Grid
10.5
01.
05-1
49.7
7
WT/Gen
0.97
1.01
60.9
1
Grid/Point of Interconnection
66.0
01.
000.
00
Figure 6-34: The PF FSIG WT demo.
In this study, this WT was adjusted to represent WT1 and WT2 in Figure 6-25, rated 3.78 MW in total, other assumed parameters are listed in Table 6-11.
Table 6-11: WT parameters
PARAMETER VALUE
R(m): Rotor Blade Radius 41.145
ρ(kg/m3): Air density 1.225
RPMnom(rpm): Nominal Turbine-Speed 18.75
Rated mechanical power of WT (MW) 3.78
Wind speed for rated power (m/s) 13.715
βmax(degree): Maximum Blade Angle 25
βmin(degree): Minimum Blade Angle 0
Thus, the power from the wind coming through the swept area of the WT and the tip speed ratio λ were calculated by:
3windV2R
21
windP ⋅⋅⋅⋅= πρ ( 6.17)
windV
R60
2nomRPM
windVR ⋅
⋅⋅
==
πωλ
( 6.18)
At rated wind speed and minimum blade angle, the wind power was 8.4 MW and the tip speed ratio was 6. Until now, the model in Figure 6-34 could not be used for coordination scheme study, due to the lack of a wind speed common model, a suitable power efficiency coefficient – tip speed ratio curve (Cp-λ curve or Cp lookup table; Cp is specified as a mechanical power efficiency coefficient) and a blade angle control for the demo WT model in PF. Therefore, the following improvements were necessary:
• A wind speed common model was introduced, shown in Figure 6-35, where ei-ther measurement or simulated wind speed could be configured. In this study,
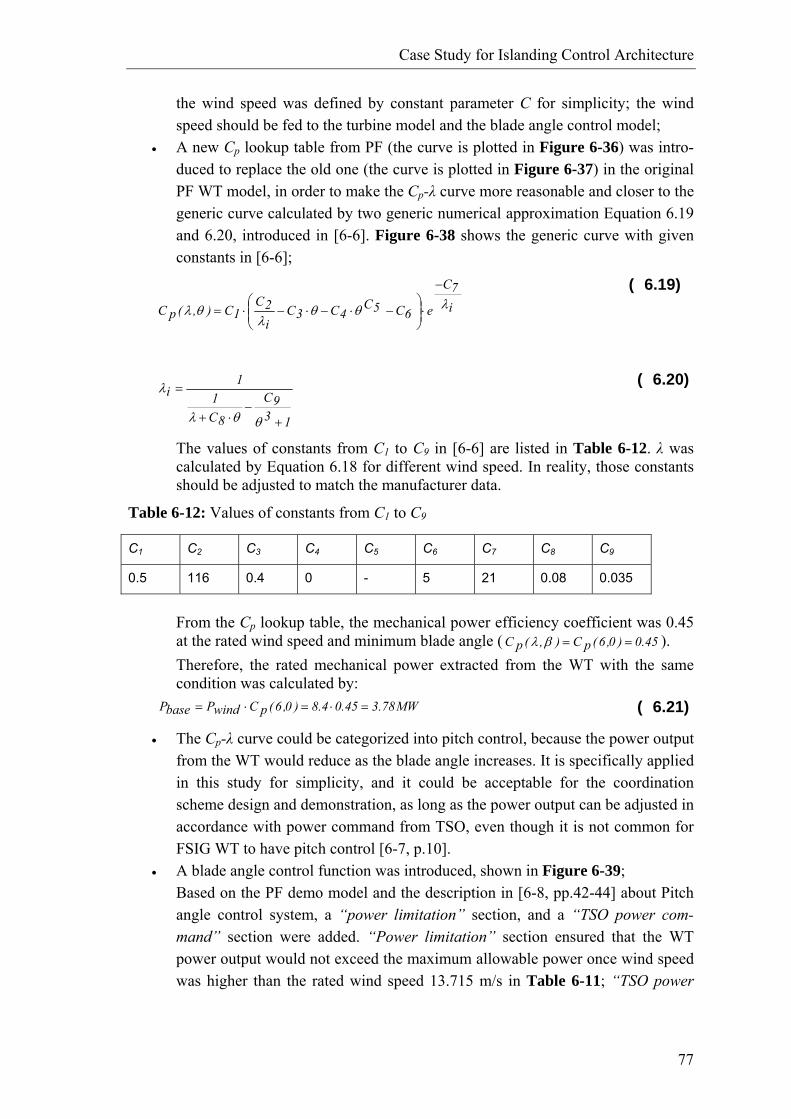
Case Study for Islanding Control Architecture
77
the wind speed was defined by constant parameter C for simplicity; the wind speed should be fed to the turbine model and the blade angle control model;
• A new Cp lookup table from PF (the curve is plotted in Figure 6-36) was intro-duced to replace the old one (the curve is plotted in Figure 6-37) in the original PF WT model, in order to make the Cp-λ curve more reasonable and closer to the generic curve calculated by two generic numerical approximation Equation 6.19 and 6.20, introduced in [6-6]. Figure 6-38 shows the generic curve with given constants in [6-6];
i7C
e6C5C4C3C
i2C
1C),(pC λθθλ
θλ
−
⋅⎟⎟⎠
⎞⎜⎜⎝
⎛−⋅−⋅−⋅=
( 6.19)
139C
8C1
1i
+−
⋅+
=
θθλ
λ ( 6.20)
The values of constants from C1 to C9 in [6-6] are listed in Table 6-12. λ was calculated by Equation 6.18 for different wind speed. In reality, those constants should be adjusted to match the manufacturer data.
Table 6-12: Values of constants from C1 to C9
C1 C2 C3 C4 C5 C6 C7 C8 C9
0.5 116 0.4 0 - 5 21 0.08 0.035
From the Cp lookup table, the mechanical power efficiency coefficient was 0.45 at the rated wind speed and minimum blade angle ( 45.0)0,6(pC),(pC ==βλ ). Therefore, the rated mechanical power extracted from the WT with the same condition was calculated by:
MW78.345.04.8)0,6(pCwindPbaseP =⋅=⋅= ( 6.21)
• The Cp-λ curve could be categorized into pitch control, because the power output from the WT would reduce as the blade angle increases. It is specifically applied in this study for simplicity, and it could be acceptable for the coordination scheme design and demonstration, as long as the power output can be adjusted in accordance with power command from TSO, even though it is not common for FSIG WT to have pitch control [6-7, p.10].
• A blade angle control function was introduced, shown in Figure 6-39; Based on the PF demo model and the description in [6-8, pp.42-44] about Pitch angle control system, a “power limitation” section, and a “TSO power com-mand” section were added. “Power limitation” section ensured that the WT power output would not exceed the maximum allowable power once wind speed was higher than the rated wind speed 13.715 m/s in Table 6-11; “TSO power
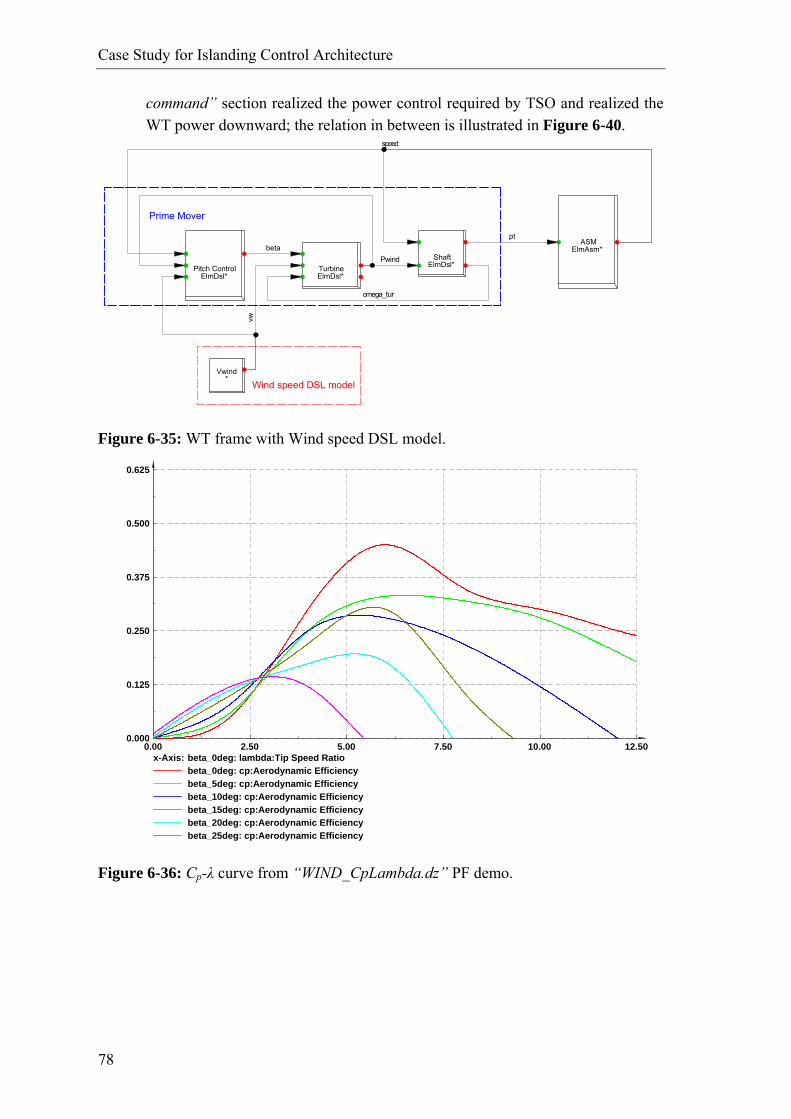
Case Study for Islanding Control Architecture
78
command” section realized the power control required by TSO and realized the WT power downward; the relation in between is illustrated in Figure 6-40.
Wind speed DSL model
Prime Mover
vw
omega_tur
Pwindbeta
speed
pt
Vwind*
ShaftElmDsl*Pitch Control
ElmDsl*TurbineElmDsl*
ASMElmAsm*
Figure 6-35: WT frame with Wind speed DSL model.
12.5010.007.505.002.500.00
0.625
0.500
0.375
0.250
0.125
0.000
x-Axis: beta_0deg: lambda:Tip Speed Ratiobeta_0deg: cp:Aerodynamic Efficiencybeta_5deg: cp:Aerodynamic Efficiencybeta_10deg: cp:Aerodynamic Efficiencybeta_15deg: cp:Aerodynamic Efficiencybeta_20deg: cp:Aerodynamic Efficiencybeta_25deg: cp:Aerodynamic Efficiency
Figure 6-36: Cp-λ curve from “WIND_CpLambda.dz” PF demo.
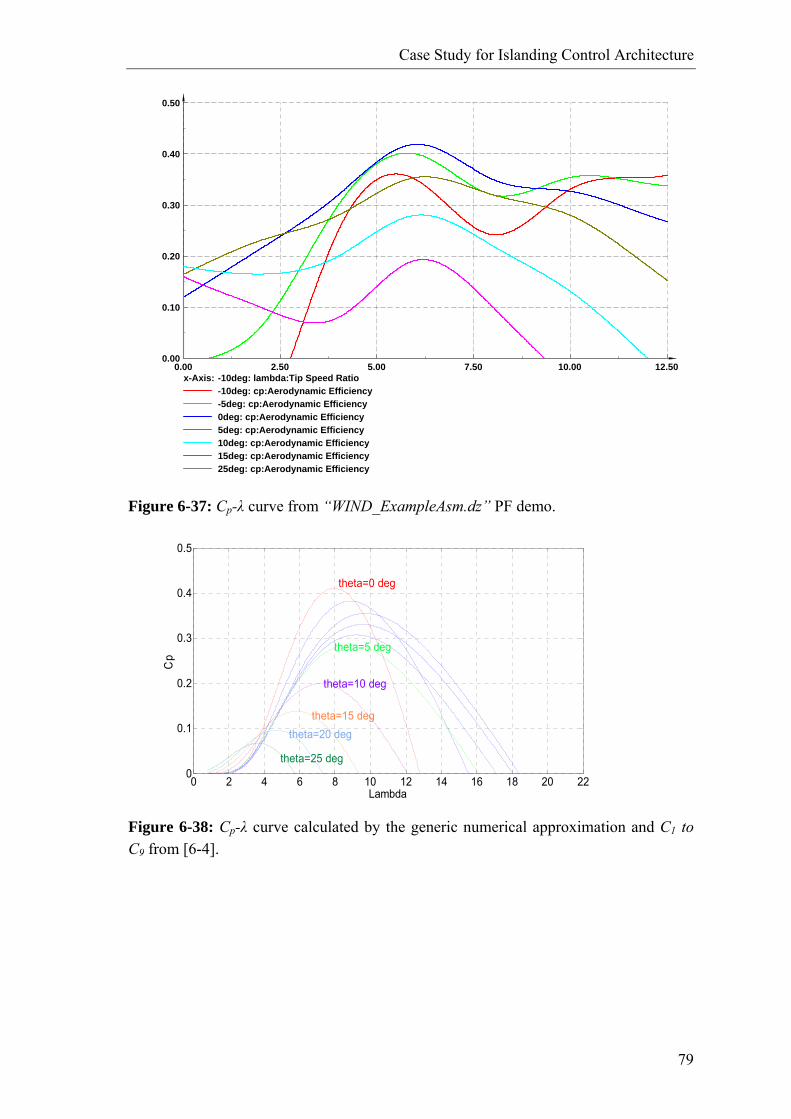
Case Study for Islanding Control Architecture
79
12.5010.007.505.002.500.00
0.50
0.40
0.30
0.20
0.10
0.00
x-Axis: -10deg: lambda:Tip Speed Ratio-10deg: cp:Aerodynamic Efficiency-5deg: cp:Aerodynamic Efficiency0deg: cp:Aerodynamic Efficiency5deg: cp:Aerodynamic Efficiency10deg: cp:Aerodynamic Efficiency15deg: cp:Aerodynamic Efficiency25deg: cp:Aerodynamic Efficiency
Figure 6-37: Cp-λ curve from “WIND_ExampleAsm.dz” PF demo.
0 2 4 6 8 10 12 14 16 18 20 220
0.1
0.2
0.3
0.4
0.5
Lambda
Cp
theta=0 deg
theta=10 deg
theta=5 deg
theta=15 degtheta=20 deg
theta=25 deg
Figure 6-38: Cp-λ curve calculated by the generic numerical approximation and C1 to C9 from [6-4].
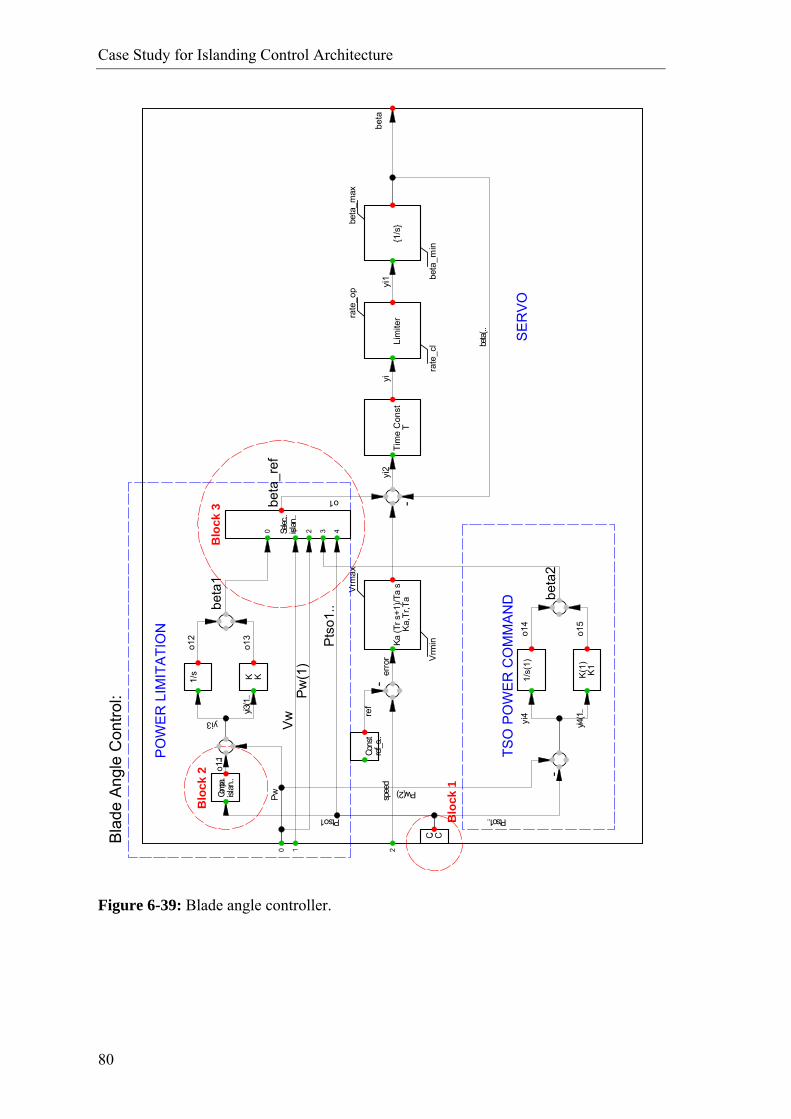
Case Study for Islanding Control Architecture
80
Blo
ck 1
Blo
ck 2
Blo
ck 3
PO
WE
R L
IMIT
ATI
ON
TSO
PO
WE
R C
OM
MA
ND
S
ER
VO
yi3(1
..
o1
o13 o1
5
Pts
o1..
beta
2
o14
yi4(1
..
yi4
Pw(2)
Ptso1..Ptso1P
w(1
)
beta
1
Pw
o12
yi3
o11
Vw
erro
rsp
eed
beta
_ref
yi2
beta(
..
beta
yi1
yi
ref
C.. C
-
K(1
)K
1
1/s(
1)
Comp
a..isl
an..
-
K K1/s
Selec
..isl
an..
0 1 2 3 4
Tim
e C
onst
T-
-Co
nst
ref_s
..
Ka (T
r s+1
)/Ta
sK
a,Tr
,Ta
Vrm
ax
Vrm
in
{1/s
}beta
_max
beta
_min
Lim
iterra
te_o
p
rate
_cl
Bla
de A
ngle
Con
trol:
210
Figure 6-39: Blade angle controller.
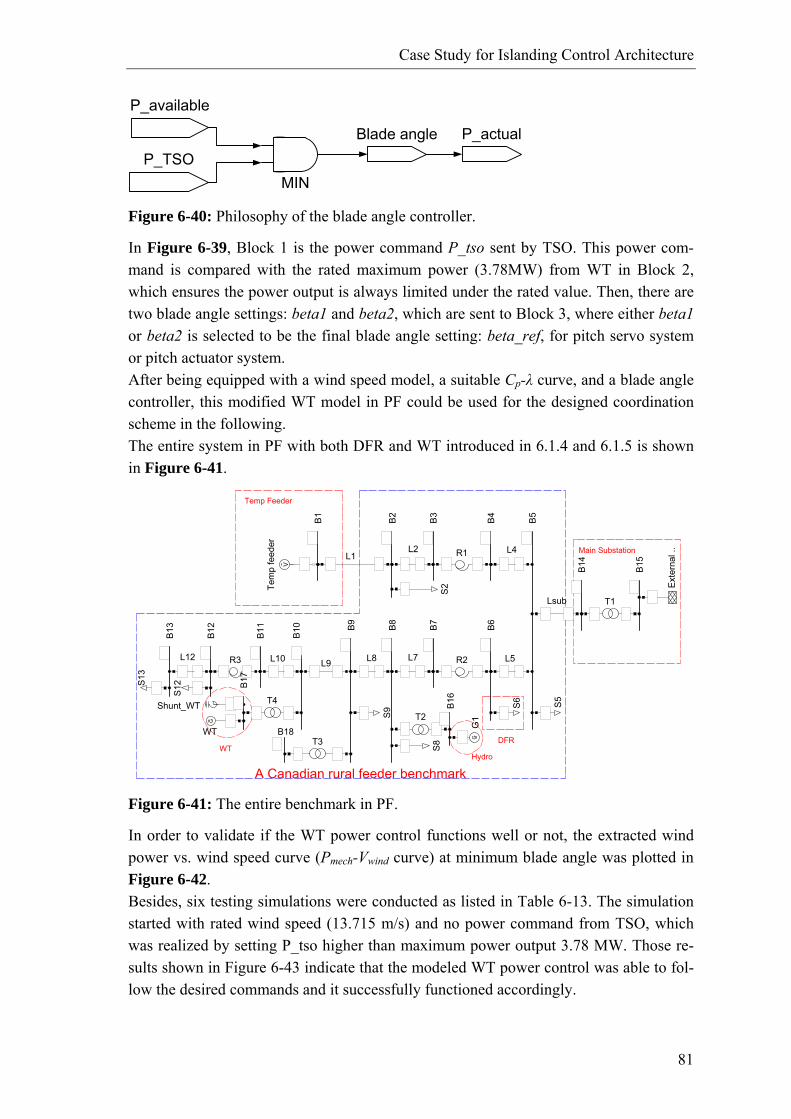
Case Study for Islanding Control Architecture
81
MIN
P_available
P_TSOBlade angle P_actual
Figure 6-40: Philosophy of the blade angle controller.
In Figure 6-39, Block 1 is the power command P_tso sent by TSO. This power com-mand is compared with the rated maximum power (3.78MW) from WT in Block 2, which ensures the power output is always limited under the rated value. Then, there are two blade angle settings: beta1 and beta2, which are sent to Block 3, where either beta1 or beta2 is selected to be the final blade angle setting: beta_ref, for pitch servo system or pitch actuator system. After being equipped with a wind speed model, a suitable Cp-λ curve, and a blade angle controller, this modified WT model in PF could be used for the designed coordination scheme in the following. The entire system in PF with both DFR and WT introduced in 6.1.4 and 6.1.5 is shown in Figure 6-41.
HydroWT
DFR
Main Substation
A Canadian rural feeder benchmark
Temp Feeder
Shunt_WT
G~
WT
Ext
erna
l ..
S13
T4
T3 G ~G
1T2
L12
S12
R3 L10 L9
S9
L8
S8
L7 R2
S6 S5
L5
S2
V~
Tem
p fe
eder
R1L1L2 L4
Lsub T1
B17
B18
B16
B13
B12
B11 B10 B
9
B8
B7
B6
B15
B14
B5
B4
B3
B2
B1
Figure 6-41: The entire benchmark in PF.
In order to validate if the WT power control functions well or not, the extracted wind power vs. wind speed curve (Pmech-Vwind curve) at minimum blade angle was plotted in Figure 6-42. Besides, six testing simulations were conducted as listed in Table 6-13. The simulation started with rated wind speed (13.715 m/s) and no power command from TSO, which was realized by setting P_tso higher than maximum power output 3.78 MW. Those re-sults shown in Figure 6-43 indicate that the modeled WT power control was able to fol-low the desired commands and it successfully functioned accordingly.
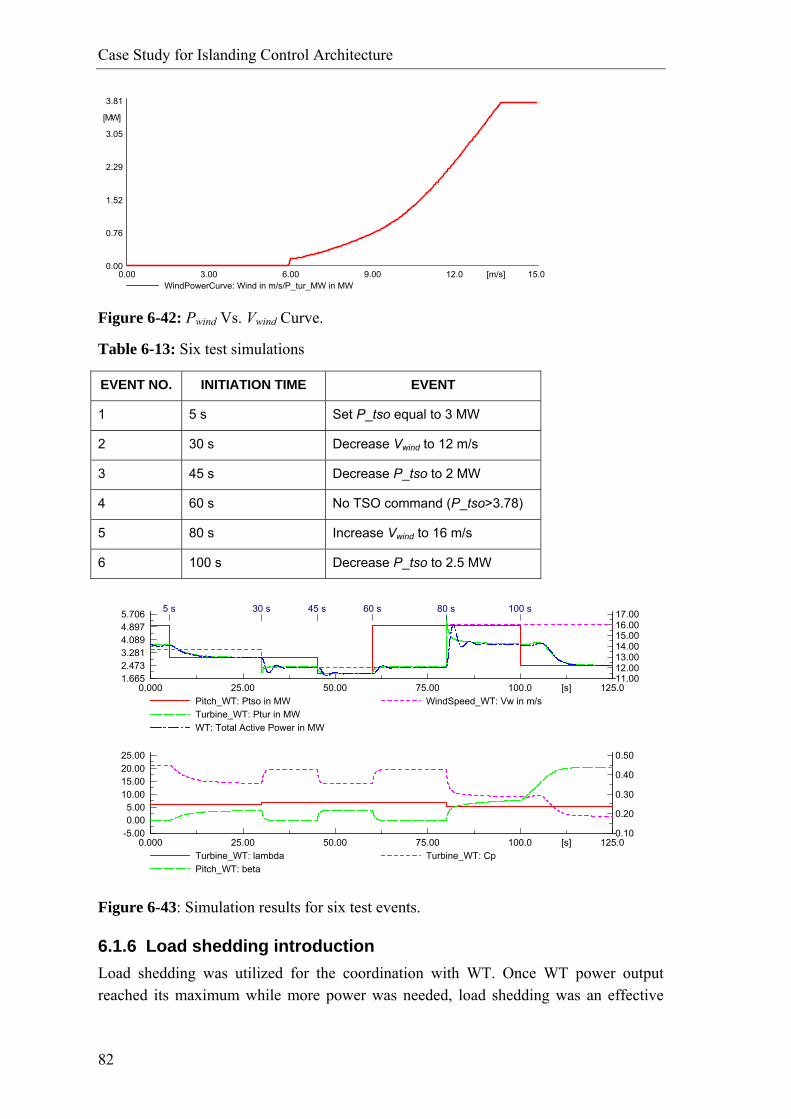
Case Study for Islanding Control Architecture
82
15.012.09.006.003.000.00 [m/s]
3.81
3.05
2.29
1.52
0.76
0.00
[MW]
WindPowerCurve: Wind in m/s/P_tur_MW in MW
Figure 6-42: Pwind Vs. Vwind Curve.
Table 6-13: Six test simulations
EVENT NO. INITIATION TIME EVENT
1 5 s Set P_tso equal to 3 MW
2 30 s Decrease Vwind to 12 m/s
3 45 s Decrease P_tso to 2 MW
4 60 s No TSO command (P_tso>3.78)
5 80 s Increase Vwind to 16 m/s
6 100 s Decrease P_tso to 2.5 MW
125.0100.075.0050.0025.000.000 [s]
25.0020.0015.0010.00
5.000.00
-5.00
0.50
0.40
0.30
0.20
0.10
Turbine_WT: lambda Turbine_WT: CpPitch_WT: beta
125.0100.075.0050.0025.000.000 [s]
5.7064.8974.0893.2812.4731.665
17.0016.0015.0014.0013.0012.0011.00
Pitch_WT: Ptso in MW WindSpeed_WT: Vw in m/sTurbine_WT: Ptur in MWWT: Total Active Power in MW
5 s 30 s 45 s 60 s 80 s 100 s
Figure 6-43: Simulation results for six test events.
6.1.6 Load shedding introduction Load shedding was utilized for the coordination with WT. Once WT power output reached its maximum while more power was needed, load shedding was an effective
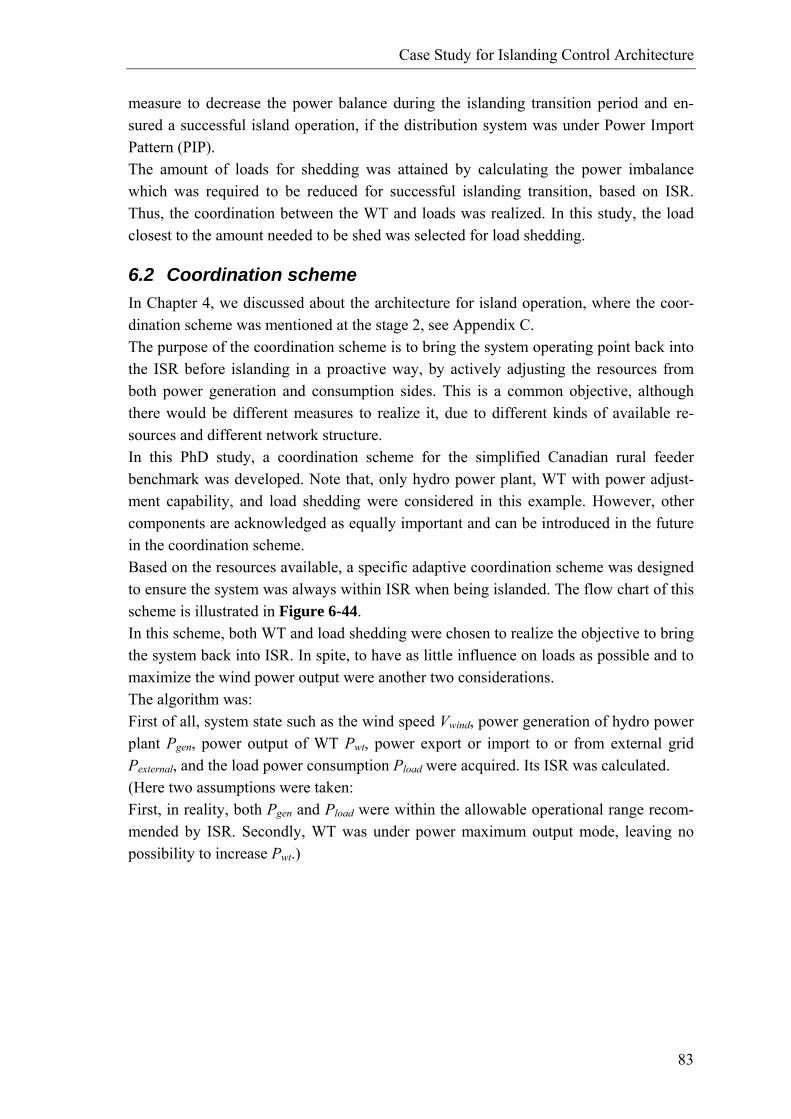
Case Study for Islanding Control Architecture
83
measure to decrease the power balance during the islanding transition period and en-sured a successful island operation, if the distribution system was under Power Import Pattern (PIP). The amount of loads for shedding was attained by calculating the power imbalance which was required to be reduced for successful islanding transition, based on ISR. Thus, the coordination between the WT and loads was realized. In this study, the load closest to the amount needed to be shed was selected for load shedding.
6.2 Coordination scheme In Chapter 4, we discussed about the architecture for island operation, where the coor-dination scheme was mentioned at the stage 2, see Appendix C. The purpose of the coordination scheme is to bring the system operating point back into the ISR before islanding in a proactive way, by actively adjusting the resources from both power generation and consumption sides. This is a common objective, although there would be different measures to realize it, due to different kinds of available re-sources and different network structure. In this PhD study, a coordination scheme for the simplified Canadian rural feeder benchmark was developed. Note that, only hydro power plant, WT with power adjust-ment capability, and load shedding were considered in this example. However, other components are acknowledged as equally important and can be introduced in the future in the coordination scheme. Based on the resources available, a specific adaptive coordination scheme was designed to ensure the system was always within ISR when being islanded. The flow chart of this scheme is illustrated in Figure 6-44. In this scheme, both WT and load shedding were chosen to realize the objective to bring the system back into ISR. In spite, to have as little influence on loads as possible and to maximize the wind power output were another two considerations. The algorithm was: First of all, system state such as the wind speed Vwind, power generation of hydro power plant Pgen, power output of WT Pwt, power export or import to or from external grid Pexternal, and the load power consumption Pload were acquired. Its ISR was calculated. (Here two assumptions were taken: First, in reality, both Pgen and Pload were within the allowable operational range recom-mended by ISR. Secondly, WT was under power maximum output mode, leaving no possibility to increase Pwt.)
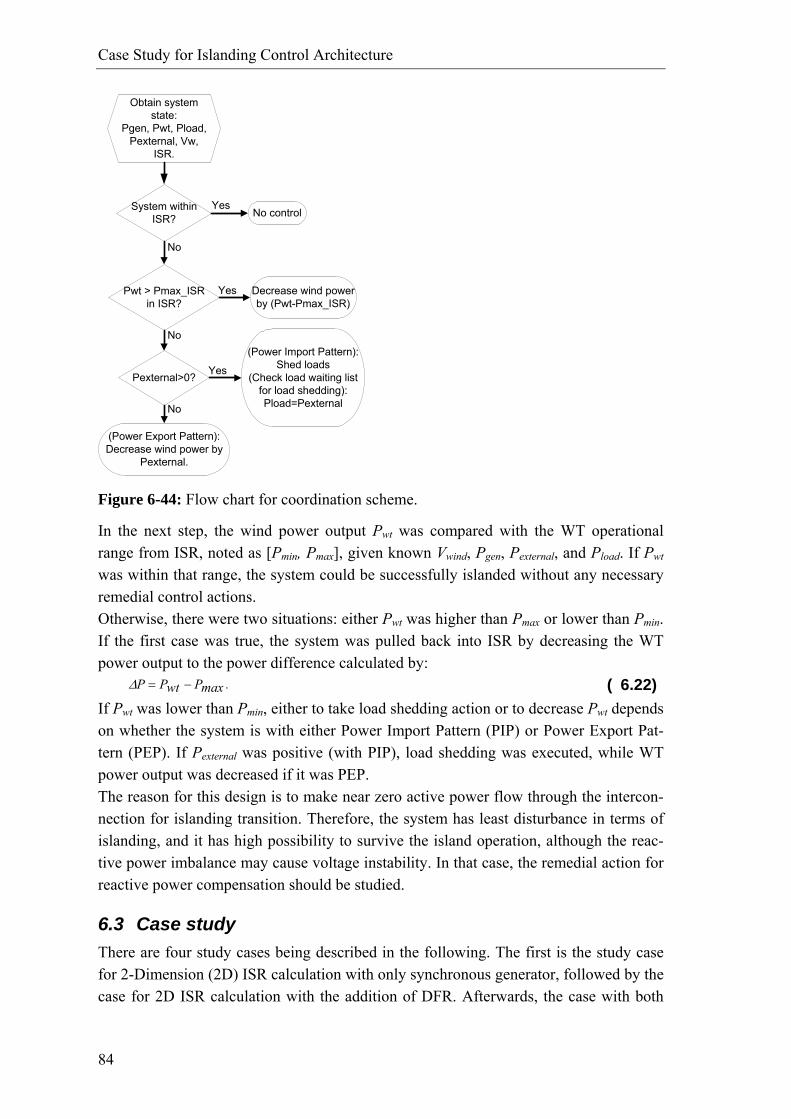
Case Study for Islanding Control Architecture
84
Obtain system state:
Pgen, Pwt, Pload, Pexternal, Vw,
ISR.
System within ISR? No control
Pwt > Pmax_ISR in ISR?
Decrease wind power by (Pwt-Pmax_ISR)
Pexternal>0?
(Power Import Pattern): Shed loads
(Check load waiting list for load shedding): Pload=Pexternal
(Power Export Pattern): Decrease wind power by
Pexternal.
Yes
No
Yes
Yes
No
No
Figure 6-44: Flow chart for coordination scheme.
In the next step, the wind power output Pwt was compared with the WT operational range from ISR, noted as [Pmin, Pmax], given known Vwind, Pgen, Pexternal, and Pload. If Pwt was within that range, the system could be successfully islanded without any necessary remedial control actions. Otherwise, there were two situations: either Pwt was higher than Pmax or lower than Pmin. If the first case was true, the system was pulled back into ISR by decreasing the WT power output to the power difference calculated by: .maxPwtPP −=Δ ( 6.22) If Pwt was lower than Pmin, either to take load shedding action or to decrease Pwt depends on whether the system is with either Power Import Pattern (PIP) or Power Export Pat-tern (PEP). If Pexternal was positive (with PIP), load shedding was executed, while WT power output was decreased if it was PEP. The reason for this design is to make near zero active power flow through the intercon-nection for islanding transition. Therefore, the system has least disturbance in terms of islanding, and it has high possibility to survive the island operation, although the reac-tive power imbalance may cause voltage instability. In that case, the remedial action for reactive power compensation should be studied.
6.3 Case study There are four study cases being described in the following. The first is the study case for 2-Dimension (2D) ISR calculation with only synchronous generator, followed by the case for 2D ISR calculation with the addition of DFR. Afterwards, the case with both
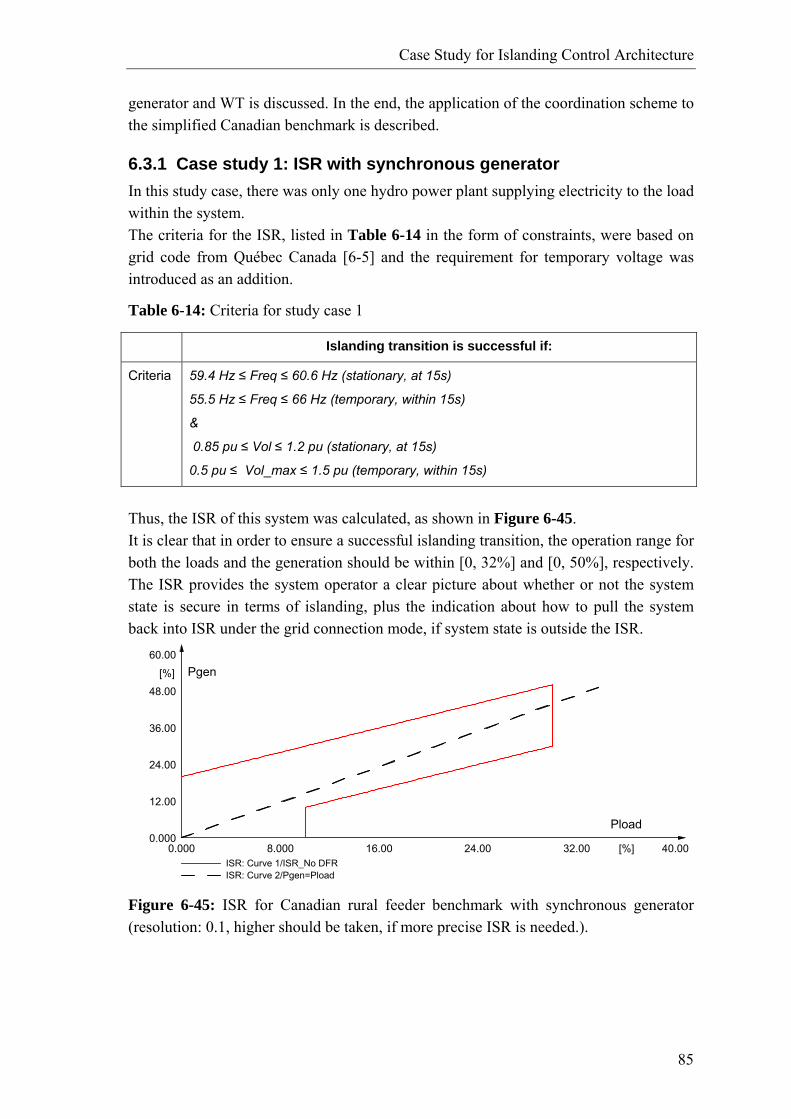
Case Study for Islanding Control Architecture
85
generator and WT is discussed. In the end, the application of the coordination scheme to the simplified Canadian benchmark is described.
6.3.1 Case study 1: ISR with synchronous generator In this study case, there was only one hydro power plant supplying electricity to the load within the system. The criteria for the ISR, listed in Table 6-14 in the form of constraints, were based on grid code from Québec Canada [6-5] and the requirement for temporary voltage was introduced as an addition.
Table 6-14: Criteria for study case 1
Islanding transition is successful if:
Criteria 59.4 Hz ≤ Freq ≤ 60.6 Hz (stationary, at 15s)
55.5 Hz ≤ Freq ≤ 66 Hz (temporary, within 15s)
&
0.85 pu ≤ Vol ≤ 1.2 pu (stationary, at 15s)
0.5 pu ≤ Vol_max ≤ 1.5 pu (temporary, within 15s)
Thus, the ISR of this system was calculated, as shown in Figure 6-45. It is clear that in order to ensure a successful islanding transition, the operation range for both the loads and the generation should be within [0, 32%] and [0, 50%], respectively. The ISR provides the system operator a clear picture about whether or not the system state is secure in terms of islanding, plus the indication about how to pull the system back into ISR under the grid connection mode, if system state is outside the ISR.
40.0032.0024.0016.008.0000.000 [%]
60.00
48.00
36.00
24.00
12.00
0.000
[%]
ISR: Curve 1/ISR_No DFRISR: Curve 2/Pgen=Pload
Pload
Pgen
Figure 6-45: ISR for Canadian rural feeder benchmark with synchronous generator (resolution: 0.1, higher should be taken, if more precise ISR is needed.).
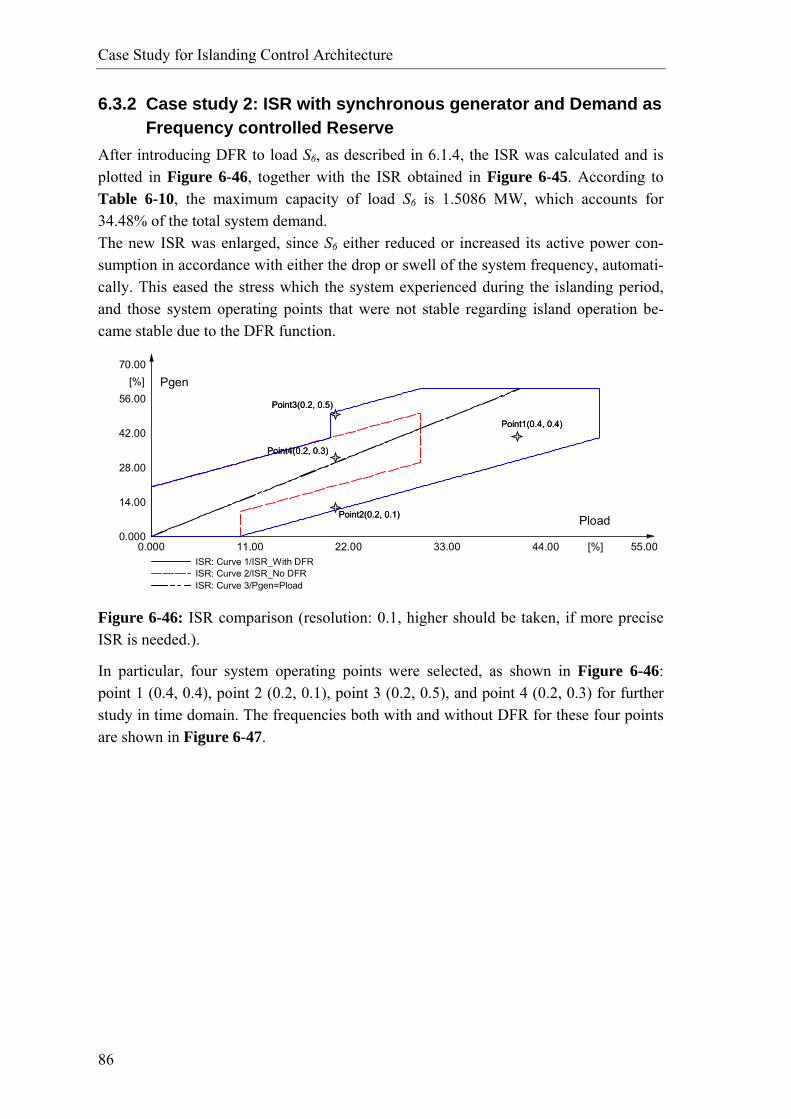
Case Study for Islanding Control Architecture
86
6.3.2 Case study 2: ISR with synchronous generator and Demand as Frequency controlled Reserve
After introducing DFR to load S6, as described in 6.1.4, the ISR was calculated and is plotted in Figure 6-46, together with the ISR obtained in Figure 6-45. According to Table 6-10, the maximum capacity of load S6 is 1.5086 MW, which accounts for 34.48% of the total system demand. The new ISR was enlarged, since S6 either reduced or increased its active power con-sumption in accordance with either the drop or swell of the system frequency, automati-cally. This eased the stress which the system experienced during the islanding period, and those system operating points that were not stable regarding island operation be-came stable due to the DFR function.
55.0044.0033.0022.0011.000.000 [%]
70.00
56.00
42.00
28.00
14.00
0.000
[%]
ISR: Curve 1/ISR_With DFRISR: Curve 2/ISR_No DFRISR: Curve 3/Pgen=Pload
Pload
Pgen
Point1(0.4, 0.4)
Point2(0.2, 0.1)
Point3(0.2, 0.5)
Point4(0.2, 0.3)
55.0044.0033.0022.0011.000.000 [%]
70.00
56.00
42.00
28.00
14.00
0.000
[%]
ISR: Curve 1/ISR_With DFRISR: Curve 2/ISR_No DFRISR: Curve 3/Pgen=Pload
Pload
Pgen
Point1(0.4, 0.4)Point1(0.4, 0.4)
Point2(0.2, 0.1)Point2(0.2, 0.1)
Point3(0.2, 0.5)Point3(0.2, 0.5)
Point4(0.2, 0.3)Point4(0.2, 0.3)
Figure 6-46: ISR comparison (resolution: 0.1, higher should be taken, if more precise ISR is needed.).
In particular, four system operating points were selected, as shown in Figure 6-46: point 1 (0.4, 0.4), point 2 (0.2, 0.1), point 3 (0.2, 0.5), and point 4 (0.2, 0.3) for further study in time domain. The frequencies both with and without DFR for these four points are shown in Figure 6-47.
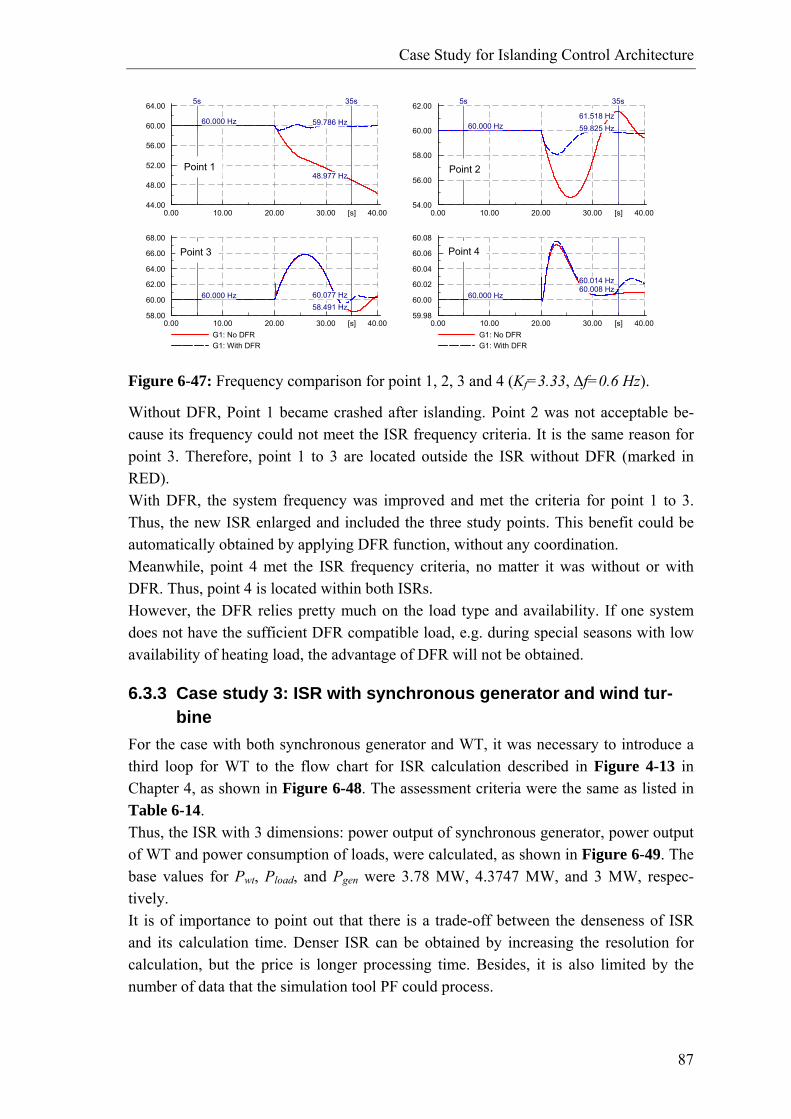
Case Study for Islanding Control Architecture
87
40.0030.0020.0010.000.00 [s]
64.00
60.00
56.00
52.00
48.00
44.00
35s
48.977 Hz
59.786 Hz
5s
60.000 Hz
40.0030.0020.0010.000.00 [s]
62.00
60.00
58.00
56.00
54.00
35s
59.825 Hz61.518 Hz
5s
60.000 Hz
40.0030.0020.0010.000.00 [s]
68.00
66.00
64.00
62.00
60.00
58.00
G1: No DFRG1: With DFR
58.491 Hz60.077 Hz60.000 Hz
40.0030.0020.0010.000.00 [s]
60.08
60.06
60.04
60.02
60.00
59.98
G1: No DFRG1: With DFR
60.008 Hz60.014 Hz
60.000 Hz
Point 1 Point 2
Point 3 Point 4
Figure 6-47: Frequency comparison for point 1, 2, 3 and 4 (Kf=3.33, ∆f=0.6 Hz).
Without DFR, Point 1 became crashed after islanding. Point 2 was not acceptable be-cause its frequency could not meet the ISR frequency criteria. It is the same reason for point 3. Therefore, point 1 to 3 are located outside the ISR without DFR (marked in RED). With DFR, the system frequency was improved and met the criteria for point 1 to 3. Thus, the new ISR enlarged and included the three study points. This benefit could be automatically obtained by applying DFR function, without any coordination. Meanwhile, point 4 met the ISR frequency criteria, no matter it was without or with DFR. Thus, point 4 is located within both ISRs. However, the DFR relies pretty much on the load type and availability. If one system does not have the sufficient DFR compatible load, e.g. during special seasons with low availability of heating load, the advantage of DFR will not be obtained.
6.3.3 Case study 3: ISR with synchronous generator and wind tur-bine
For the case with both synchronous generator and WT, it was necessary to introduce a third loop for WT to the flow chart for ISR calculation described in Figure 4-13 in Chapter 4, as shown in Figure 6-48. The assessment criteria were the same as listed in Table 6-14. Thus, the ISR with 3 dimensions: power output of synchronous generator, power output of WT and power consumption of loads, were calculated, as shown in Figure 6-49. The base values for Pwt, Pload, and Pgen were 3.78 MW, 4.3747 MW, and 3 MW, respec-tively. It is of importance to point out that there is a trade-off between the denseness of ISR and its calculation time. Denser ISR can be obtained by increasing the resolution for calculation, but the price is longer processing time. Besides, it is also limited by the number of data that the simulation tool PF could process.
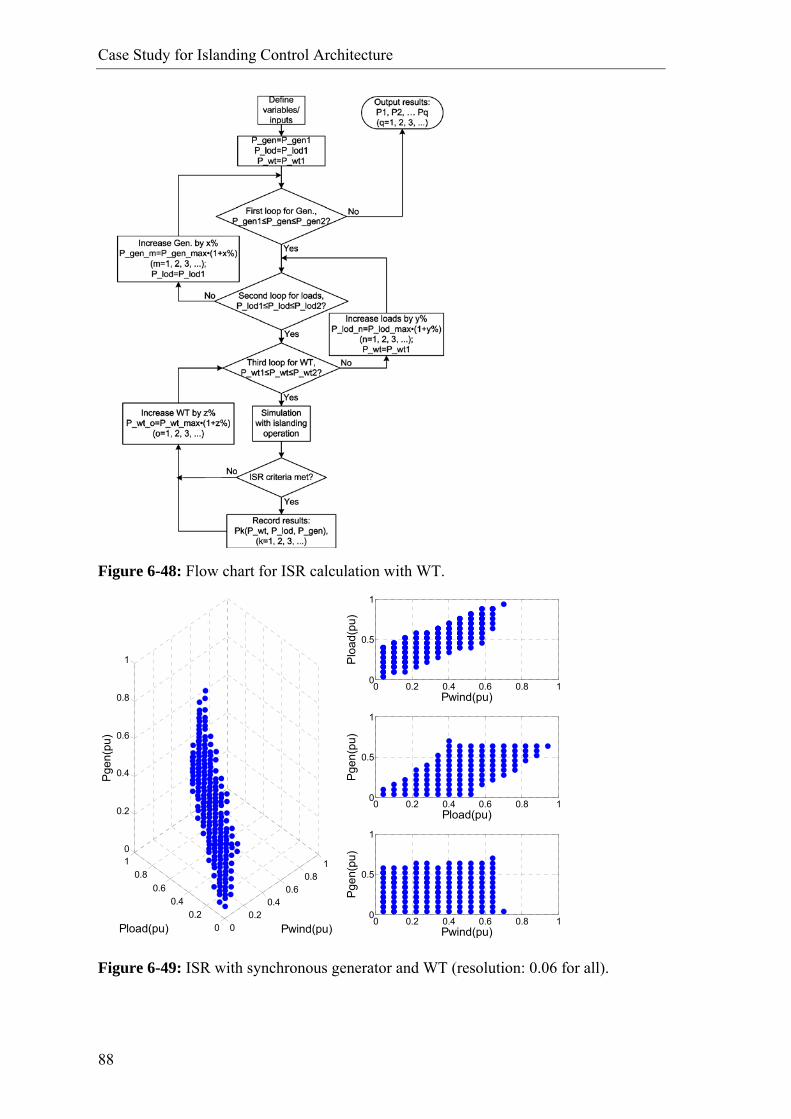
Case Study for Islanding Control Architecture
88
Figure 6-48: Flow chart for ISR calculation with WT.
00.2
0.40.6
0.81
00.2
0.40.6
0.810
0.2
0.4
0.6
0.8
1
Pwind(pu)Pload(pu)
Pge
n(pu
)
0 0.2 0.4 0.6 0.8 10
0.5
1
Pwind(pu)
Plo
ad(p
u)
0 0.2 0.4 0.6 0.8 10
0.5
1
Pload(pu)
Pge
n(pu
)
0 0.2 0.4 0.6 0.8 10
0.5
1
Pwind(pu)
Pge
n(pu
)
Figure 6-49: ISR with synchronous generator and WT (resolution: 0.06 for all).
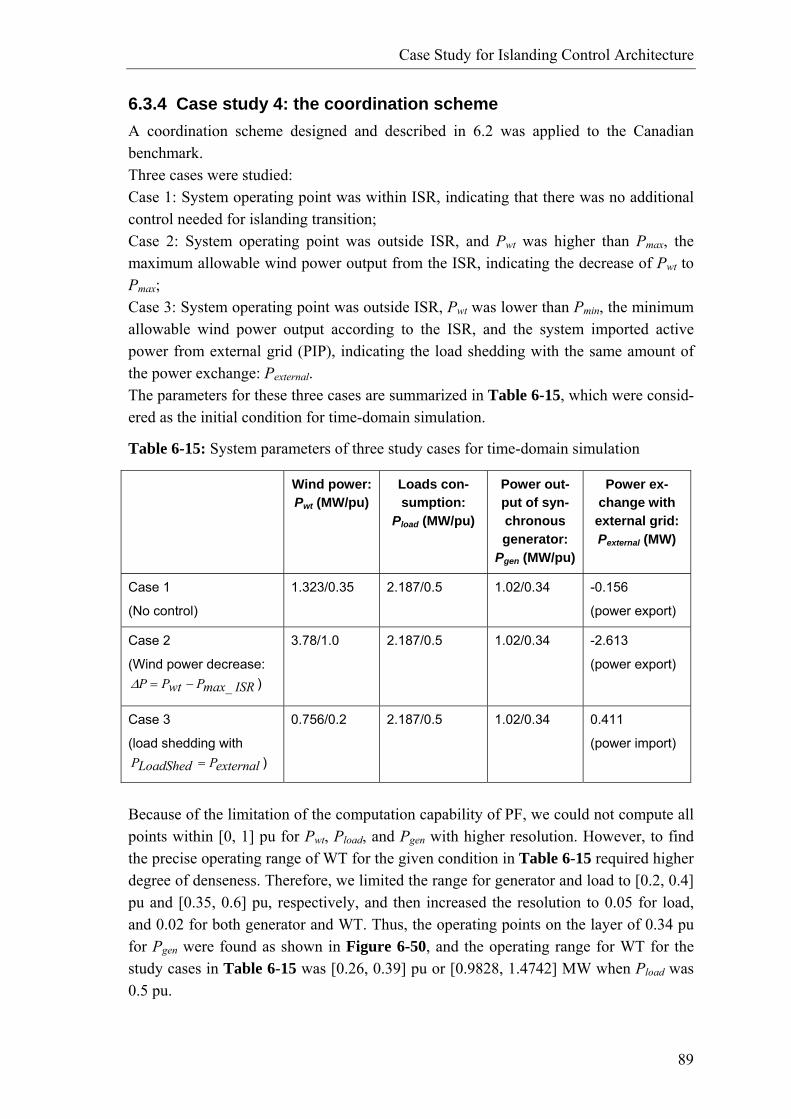
Case Study for Islanding Control Architecture
89
6.3.4 Case study 4: the coordination scheme A coordination scheme designed and described in 6.2 was applied to the Canadian benchmark. Three cases were studied: Case 1: System operating point was within ISR, indicating that there was no additional control needed for islanding transition; Case 2: System operating point was outside ISR, and Pwt was higher than Pmax, the maximum allowable wind power output from the ISR, indicating the decrease of Pwt to Pmax; Case 3: System operating point was outside ISR, Pwt was lower than Pmin, the minimum allowable wind power output according to the ISR, and the system imported active power from external grid (PIP), indicating the load shedding with the same amount of the power exchange: Pexternal. The parameters for these three cases are summarized in Table 6-15, which were consid-ered as the initial condition for time-domain simulation.
Table 6-15: System parameters of three study cases for time-domain simulation
Wind power: Pwt (MW/pu)
Loads con-sumption:
Pload (MW/pu)
Power out-put of syn-chronous generator:
Pgen (MW/pu)
Power ex-change with external grid: Pexternal (MW)
Case 1
(No control)
1.323/0.35 2.187/0.5 1.02/0.34 -0.156
(power export)
Case 2
(Wind power decrease:
ISRmax_PwtPP −=Δ )
3.78/1.0 2.187/0.5 1.02/0.34 -2.613
(power export)
Case 3
(load shedding with
externalPLoadShedP = )
0.756/0.2 2.187/0.5 1.02/0.34 0.411
(power import)
Because of the limitation of the computation capability of PF, we could not compute all points within [0, 1] pu for Pwt, Pload, and Pgen with higher resolution. However, to find the precise operating range of WT for the given condition in Table 6-15 required higher degree of denseness. Therefore, we limited the range for generator and load to [0.2, 0.4] pu and [0.35, 0.6] pu, respectively, and then increased the resolution to 0.05 for load, and 0.02 for both generator and WT. Thus, the operating points on the layer of 0.34 pu for Pgen were found as shown in Figure 6-50, and the operating range for WT for the study cases in Table 6-15 was [0.26, 0.39] pu or [0.9828, 1.4742] MW when Pload was 0.5 pu.
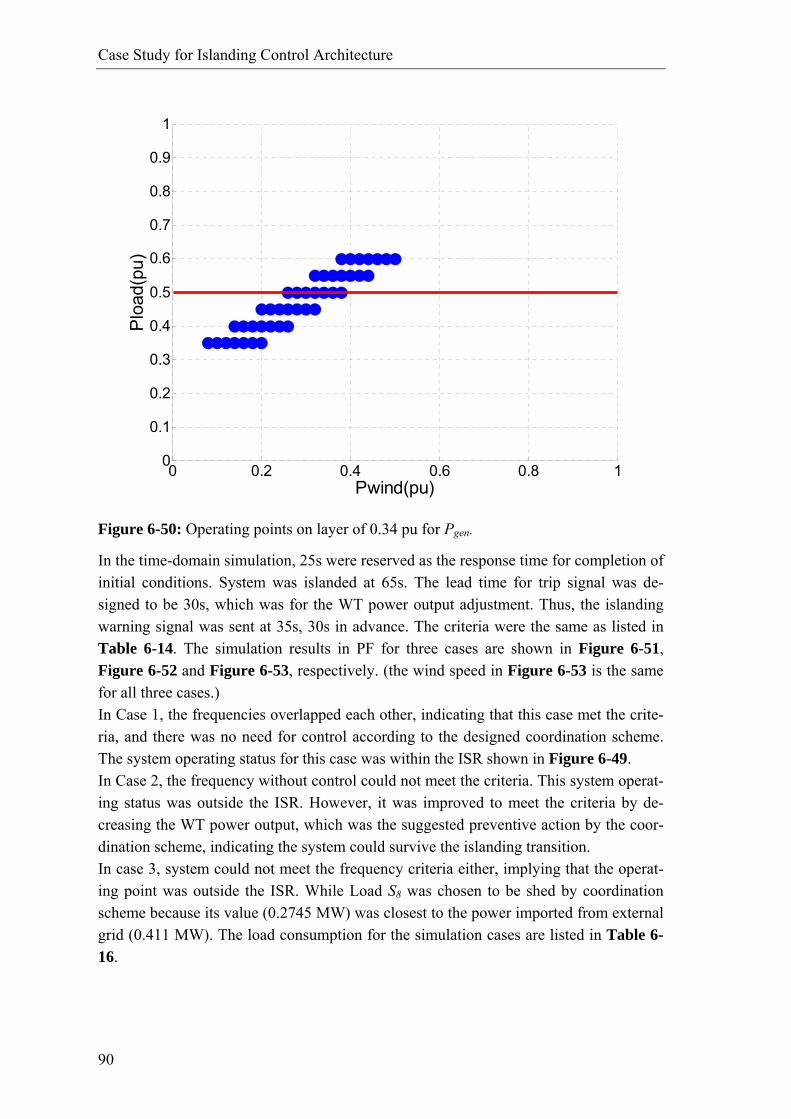
Case Study for Islanding Control Architecture
90
0 0.2 0.4 0.6 0.8 10
0.1
0.2
0.3
0.4
0.5
0.6
0.7
0.8
0.9
1
Pwind(pu)
Plo
ad(p
u)
Figure 6-50: Operating points on layer of 0.34 pu for Pgen.
In the time-domain simulation, 25s were reserved as the response time for completion of initial conditions. System was islanded at 65s. The lead time for trip signal was de-signed to be 30s, which was for the WT power output adjustment. Thus, the islanding warning signal was sent at 35s, 30s in advance. The criteria were the same as listed in Table 6-14. The simulation results in PF for three cases are shown in Figure 6-51, Figure 6-52 and Figure 6-53, respectively. (the wind speed in Figure 6-53 is the same for all three cases.) In Case 1, the frequencies overlapped each other, indicating that this case met the crite-ria, and there was no need for control according to the designed coordination scheme. The system operating status for this case was within the ISR shown in Figure 6-49. In Case 2, the frequency without control could not meet the criteria. This system operat-ing status was outside the ISR. However, it was improved to meet the criteria by de-creasing the WT power output, which was the suggested preventive action by the coor-dination scheme, indicating the system could survive the islanding transition. In case 3, system could not meet the frequency criteria either, implying that the operat-ing point was outside the ISR. While Load S8 was chosen to be shed by coordination scheme because its value (0.2745 MW) was closest to the power imported from external grid (0.411 MW). The load consumption for the simulation cases are listed in Table 6-16.
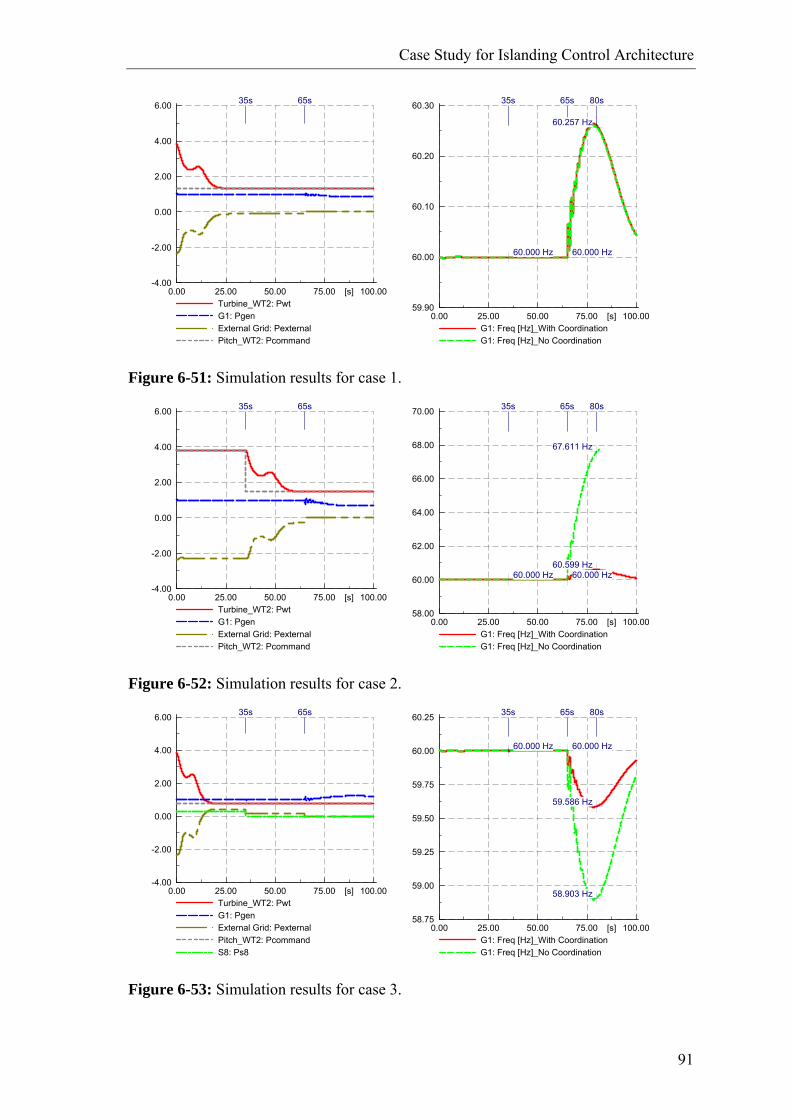
Case Study for Islanding Control Architecture
91
100.0075.0050.0025.000.00 [s]
6.00
4.00
2.00
0.00
-2.00
-4.00
Turbine_WT2: PwtG1: PgenExternal Grid: PexternalPitch_WT2: Pcommand
35s 65s
100.0075.0050.0025.000.00 [s]
60.30
60.20
60.10
60.00
59.90
G1: Freq [Hz]_With CoordinationG1: Freq [Hz]_No Coordination
65s
60.000 Hz
80s
60.257 Hz
35s
60.000 Hz
Figure 6-51: Simulation results for case 1.
100.0075.0050.0025.000.00 [s]
6.00
4.00
2.00
0.00
-2.00
-4.00
Turbine_WT2: PwtG1: PgenExternal Grid: PexternalPitch_WT2: Pcommand
35s 65s
100.0075.0050.0025.000.00 [s]
70.00
68.00
66.00
64.00
62.00
60.00
58.00
G1: Freq [Hz]_With CoordinationG1: Freq [Hz]_No Coordination
65s
60.000 Hz
80s
60.599 Hz
67.611 Hz
35s
60.000 Hz
Figure 6-52: Simulation results for case 2.
100.0075.0050.0025.000.00 [s]
60.25
60.00
59.75
59.50
59.25
59.00
58.75
G1: Freq [Hz]_With CoordinationG1: Freq [Hz]_No Coordination
65s
60.000 Hz
80s
58.903 Hz
59.586 Hz
35s
60.000 Hz
100.0075.0050.0025.000.00 [s]
6.00
4.00
2.00
0.00
-2.00
-4.00
Turbine_WT2: PwtG1: PgenExternal Grid: PexternalPitch_WT2: PcommandS8: Ps8
35s 65s
Figure 6-53: Simulation results for case 3.

Case Study for Islanding Control Architecture
92
Table 6-16: Load consumption
S2 S5 S6 S8 S9 S12 S13 Total
loadP (MW) 0.2605 0.2394 0.753 0.2745 0.2394 0.15105 0.2679 2.19
Therefore, a well designed coordination scheme with its adaptive preventive remedial actions assisted the system to survive the island operation, even though the system oper-ating status before the islanding was outside the ISR. After these four case studies in this chapter, the following conclusions need empha-sized:
• DFR can effectively enlarge the ISR, and eventually increase the probability for successful system island operation;
• ISR based coordination scheme can support island operation, by activating pre-ventive remedial actions (such as WT power adjustment and load shedding in this study), in a self-adapting style, as long as an islanding warning signal is sent with considerable lead time and corresponding system components can respond fast.
93
7 ARTIFICIAL NEURAL NETWORK APPLICA-TION TO ISLANDING CONTROL ARCHITEC-TURE
This chapter starts with the brief introduction of Artificial Neural Network (ANN) and its application in power systems. Thereafter, its application to the designed Islanding Control Architecture (ICA) is explored. The previous study has demonstrated that it is beneficial for system operator to obtain an ISR based architecture, with which operator can easily obtain a clear picture about whether or not one system could be successfully islanded if needed. It is expected to be straightforward and concise: if the system operating state is outside the ISR, preventive actions are suggested by the coordination scheme to pull the system back into the ISR in a self-adapting style. Thus, the system operator will have sufficient confidence with maintaining system security of power supply, once the system is on the back of risk to island operation. However, through the development process, the disadvantages of the suggested ICA are equally noticed. It is time consuming and cumbersome to calculate ISR due to its in-stinct of time domain simulation. It is acceptable to obtain the ISR offline for a few di-mensions, and afterwards, system operator can study the islanding feasibility by com-paring the real time system operating point with ISR online. But it becomes bulky and weighty to calculate higher-dimension ISR. Moreover, the ISR relies on the system to-pology. Thus, it is not suitable for online operation, due to its slow calculation speed of ISR, if the system topology is changed. In this regard, how to reduce the calculation time and make it integrated into online service while without significant compromise of accuracy requires research wisdom. Therefore, this chapter tries to explore the potential application of ANN for online application of the ICA, because of its self-learning and fast calculation capability. The preliminary results show that the ANN application is possible and promising. However, further study is still needed for its real application in practice.
7.1 Artificial Neural Network introduction Based on [7-1], some basic concepts of ANN are extracted here. Artificial Neural Network (ANN) is a “bottom up” approach to artificial intelligence, in that a network of processing elements is designed, these elements being based on the
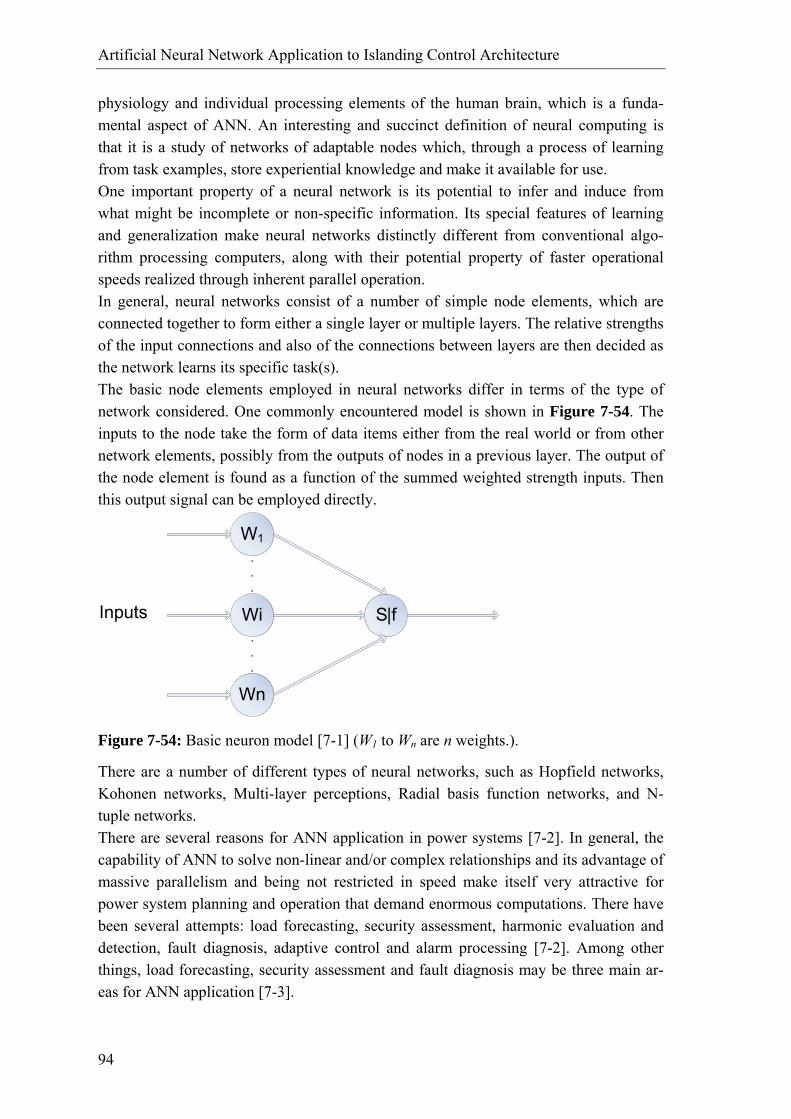
Artificial Neural Network Application to Islanding Control Architecture
94
physiology and individual processing elements of the human brain, which is a funda-mental aspect of ANN. An interesting and succinct definition of neural computing is that it is a study of networks of adaptable nodes which, through a process of learning from task examples, store experiential knowledge and make it available for use. One important property of a neural network is its potential to infer and induce from what might be incomplete or non-specific information. Its special features of learning and generalization make neural networks distinctly different from conventional algo-rithm processing computers, along with their potential property of faster operational speeds realized through inherent parallel operation. In general, neural networks consist of a number of simple node elements, which are connected together to form either a single layer or multiple layers. The relative strengths of the input connections and also of the connections between layers are then decided as the network learns its specific task(s). The basic node elements employed in neural networks differ in terms of the type of network considered. One commonly encountered model is shown in Figure 7-54. The inputs to the node take the form of data items either from the real world or from other network elements, possibly from the outputs of nodes in a previous layer. The output of the node element is found as a function of the summed weighted strength inputs. Then this output signal can be employed directly.
S|f
W1
Wi
Wn
Inputs
.
.
.
.
.
.
Figure 7-54: Basic neuron model [7-1] (W1 to Wn are n weights.).
There are a number of different types of neural networks, such as Hopfield networks, Kohonen networks, Multi-layer perceptions, Radial basis function networks, and N-tuple networks. There are several reasons for ANN application in power systems [7-2]. In general, the capability of ANN to solve non-linear and/or complex relationships and its advantage of massive parallelism and being not restricted in speed make itself very attractive for power system planning and operation that demand enormous computations. There have been several attempts: load forecasting, security assessment, harmonic evaluation and detection, fault diagnosis, adaptive control and alarm processing [7-2]. Among other things, load forecasting, security assessment and fault diagnosis may be three main ar-eas for ANN application [7-3].
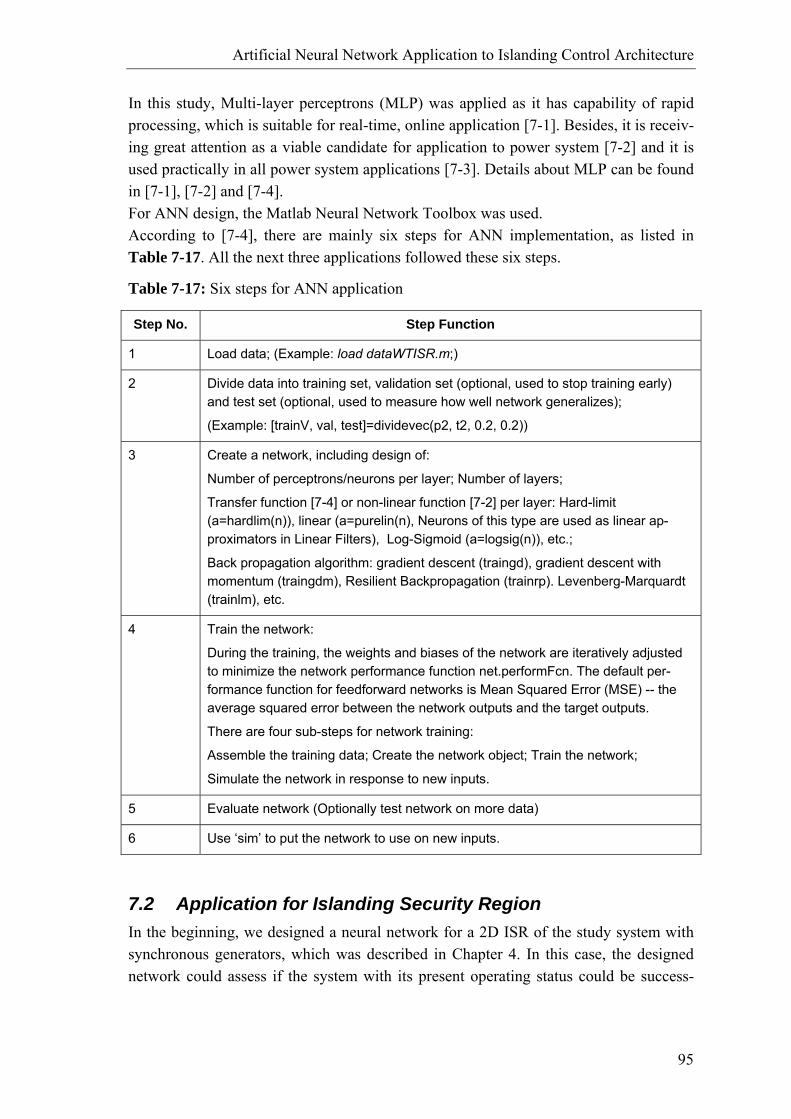
Artificial Neural Network Application to Islanding Control Architecture
95
In this study, Multi-layer perceptrons (MLP) was applied as it has capability of rapid processing, which is suitable for real-time, online application [7-1]. Besides, it is receiv-ing great attention as a viable candidate for application to power system [7-2] and it is used practically in all power system applications [7-3]. Details about MLP can be found in [7-1], [7-2] and [7-4]. For ANN design, the Matlab Neural Network Toolbox was used. According to [7-4], there are mainly six steps for ANN implementation, as listed in Table 7-17. All the next three applications followed these six steps.
Table 7-17: Six steps for ANN application
Step No. Step Function
1 Load data; (Example: load dataWTISR.m;)
2 Divide data into training set, validation set (optional, used to stop training early) and test set (optional, used to measure how well network generalizes);
(Example: [trainV, val, test]=dividevec(p2, t2, 0.2, 0.2))
3 Create a network, including design of:
Number of perceptrons/neurons per layer; Number of layers;
Transfer function [7-4] or non-linear function [7-2] per layer: Hard-limit (a=hardlim(n)), linear (a=purelin(n), Neurons of this type are used as linear ap-proximators in Linear Filters), Log-Sigmoid (a=logsig(n)), etc.;
Back propagation algorithm: gradient descent (traingd), gradient descent with momentum (traingdm), Resilient Backpropagation (trainrp). Levenberg-Marquardt (trainlm), etc.
4 Train the network:
During the training, the weights and biases of the network are iteratively adjusted to minimize the network performance function net.performFcn. The default per-formance function for feedforward networks is Mean Squared Error (MSE) -- the average squared error between the network outputs and the target outputs.
There are four sub-steps for network training:
Assemble the training data; Create the network object; Train the network;
Simulate the network in response to new inputs.
5 Evaluate network (Optionally test network on more data)
6 Use ‘sim’ to put the network to use on new inputs.
7.2 Application for Islanding Security Region In the beginning, we designed a neural network for a 2D ISR of the study system with synchronous generators, which was described in Chapter 4. In this case, the designed network could assess if the system with its present operating status could be success-
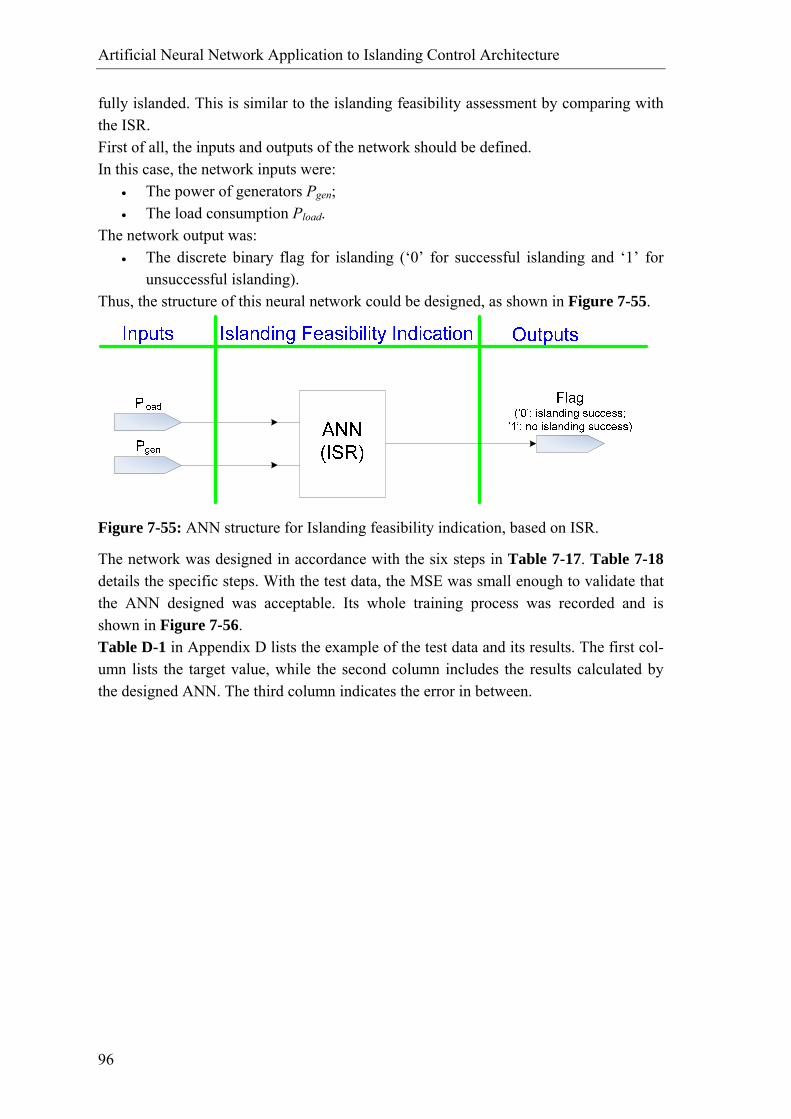
Artificial Neural Network Application to Islanding Control Architecture
96
fully islanded. This is similar to the islanding feasibility assessment by comparing with the ISR. First of all, the inputs and outputs of the network should be defined. In this case, the network inputs were:
• The power of generators Pgen; • The load consumption Pload.
The network output was: • The discrete binary flag for islanding (‘0’ for successful islanding and ‘1’ for
unsuccessful islanding). Thus, the structure of this neural network could be designed, as shown in Figure 7-55.
Figure 7-55: ANN structure for Islanding feasibility indication, based on ISR.
The network was designed in accordance with the six steps in Table 7-17. Table 7-18 details the specific steps. With the test data, the MSE was small enough to validate that the ANN designed was acceptable. Its whole training process was recorded and is shown in Figure 7-56. Table D-1 in Appendix D lists the example of the test data and its results. The first col-umn lists the target value, while the second column includes the results calculated by the designed ANN. The third column indicates the error in between.
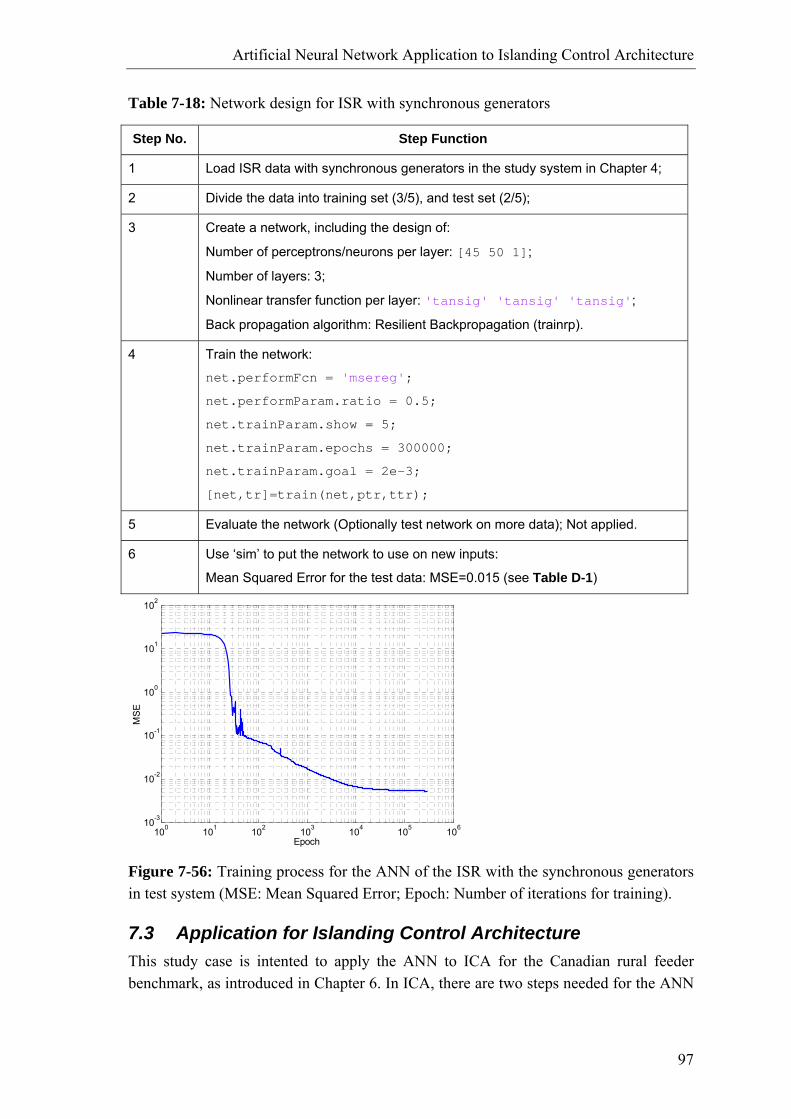
Artificial Neural Network Application to Islanding Control Architecture
97
Table 7-18: Network design for ISR with synchronous generators
Step No. Step Function
1 Load ISR data with synchronous generators in the study system in Chapter 4;
2 Divide the data into training set (3/5), and test set (2/5);
3 Create a network, including the design of:
Number of perceptrons/neurons per layer: [45 50 1];
Number of layers: 3;
Nonlinear transfer function per layer: 'tansig' 'tansig' 'tansig';
Back propagation algorithm: Resilient Backpropagation (trainrp).
4 Train the network:
net.performFcn = 'msereg';
net.performParam.ratio = 0.5;
net.trainParam.show = 5;
net.trainParam.epochs = 300000;
net.trainParam.goal = 2e-3;
[net,tr]=train(net,ptr,ttr);
5 Evaluate the network (Optionally test network on more data); Not applied.
6 Use ‘sim’ to put the network to use on new inputs:
Mean Squared Error for the test data: MSE=0.015 (see Table D-1)
100 101 102 103 104 105 10610-3
10-2
10-1
100
101
102
MSE
Epoch
Figure 7-56: Training process for the ANN of the ISR with the synchronous generators in test system (MSE: Mean Squared Error; Epoch: Number of iterations for training).
7.3 Application for Islanding Control Architecture This study case is intented to apply the ANN to ICA for the Canadian rural feeder benchmark, as introduced in Chapter 6. In ICA, there are two steps needed for the ANN
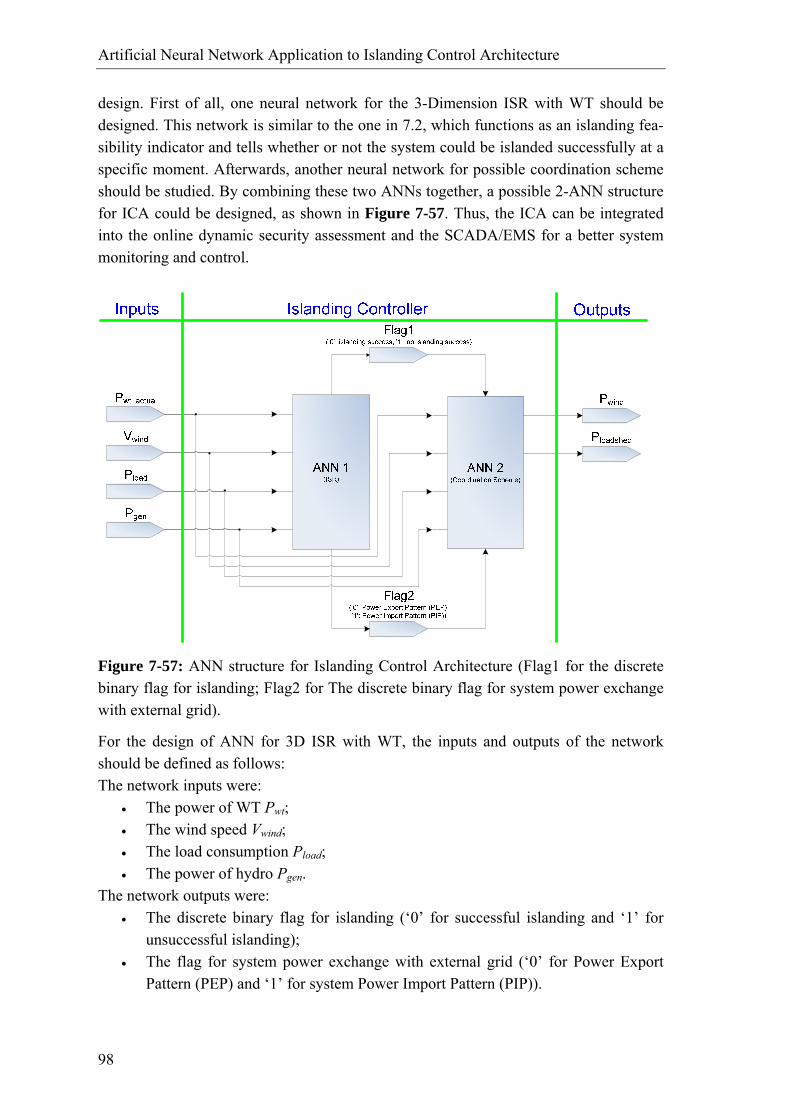
Artificial Neural Network Application to Islanding Control Architecture
98
design. First of all, one neural network for the 3-Dimension ISR with WT should be designed. This network is similar to the one in 7.2, which functions as an islanding fea-sibility indicator and tells whether or not the system could be islanded successfully at a specific moment. Afterwards, another neural network for possible coordination scheme should be studied. By combining these two ANNs together, a possible 2-ANN structure for ICA could be designed, as shown in Figure 7-57. Thus, the ICA can be integrated into the online dynamic security assessment and the SCADA/EMS for a better system monitoring and control.
Figure 7-57: ANN structure for Islanding Control Architecture (Flag1 for the discrete binary flag for islanding; Flag2 for The discrete binary flag for system power exchange with external grid).
For the design of ANN for 3D ISR with WT, the inputs and outputs of the network should be defined as follows: The network inputs were:
• The power of WT Pwt; • The wind speed Vwind; • The load consumption Pload; • The power of hydro Pgen.
The network outputs were: • The discrete binary flag for islanding (‘0’ for successful islanding and ‘1’ for
unsuccessful islanding); • The flag for system power exchange with external grid (‘0’ for Power Export
Pattern (PEP) and ‘1’ for system Power Import Pattern (PIP)).
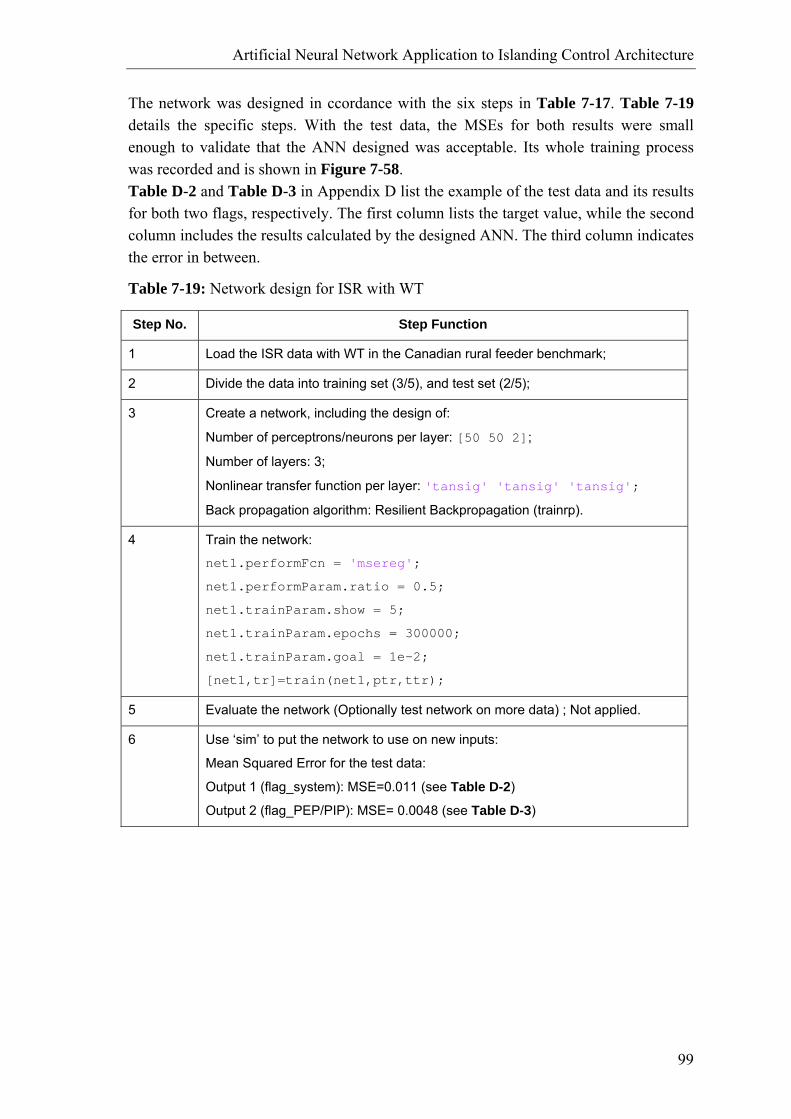
Artificial Neural Network Application to Islanding Control Architecture
99
The network was designed in ccordance with the six steps in Table 7-17. Table 7-19 details the specific steps. With the test data, the MSEs for both results were small enough to validate that the ANN designed was acceptable. Its whole training process was recorded and is shown in Figure 7-58. Table D-2 and Table D-3 in Appendix D list the example of the test data and its results for both two flags, respectively. The first column lists the target value, while the second column includes the results calculated by the designed ANN. The third column indicates the error in between.
Table 7-19: Network design for ISR with WT
Step No. Step Function
1 Load the ISR data with WT in the Canadian rural feeder benchmark;
2 Divide the data into training set (3/5), and test set (2/5);
3 Create a network, including the design of:
Number of perceptrons/neurons per layer: [50 50 2];
Number of layers: 3;
Nonlinear transfer function per layer: 'tansig' 'tansig' 'tansig';
Back propagation algorithm: Resilient Backpropagation (trainrp).
4 Train the network:
net1.performFcn = 'msereg';
net1.performParam.ratio = 0.5;
net1.trainParam.show = 5;
net1.trainParam.epochs = 300000;
net1.trainParam.goal = 1e-2;
[net1,tr]=train(net1,ptr,ttr);
5 Evaluate the network (Optionally test network on more data) ; Not applied.
6 Use ‘sim’ to put the network to use on new inputs:
Mean Squared Error for the test data:
Output 1 (flag_system): MSE=0.011 (see Table D-2)
Output 2 (flag_PEP/PIP): MSE= 0.0048 (see Table D-3)
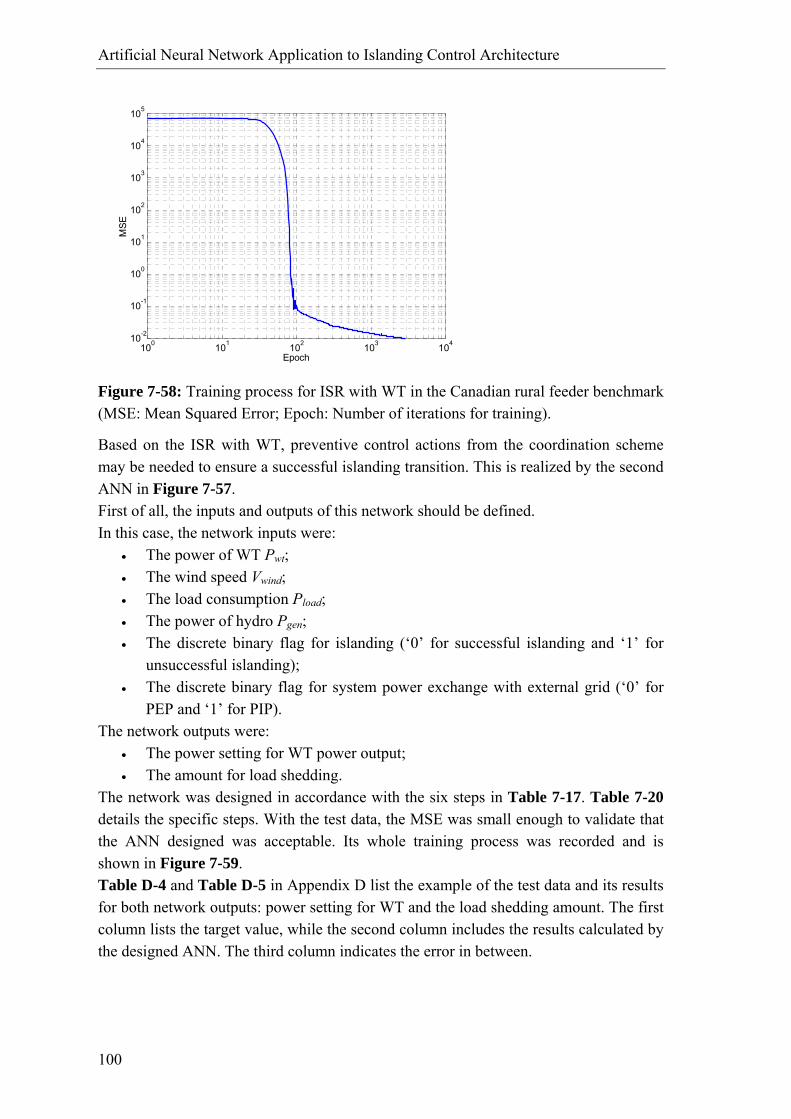
Artificial Neural Network Application to Islanding Control Architecture
100
100 101 102 103 10410-2
10-1
100
101
102
103
104
105
MSE
Epoch
Figure 7-58: Training process for ISR with WT in the Canadian rural feeder benchmark (MSE: Mean Squared Error; Epoch: Number of iterations for training).
Based on the ISR with WT, preventive control actions from the coordination scheme may be needed to ensure a successful islanding transition. This is realized by the second ANN in Figure 7-57. First of all, the inputs and outputs of this network should be defined. In this case, the network inputs were:
• The power of WT Pwt; • The wind speed Vwind; • The load consumption Pload; • The power of hydro Pgen; • The discrete binary flag for islanding (‘0’ for successful islanding and ‘1’ for
unsuccessful islanding); • The discrete binary flag for system power exchange with external grid (‘0’ for
PEP and ‘1’ for PIP). The network outputs were:
• The power setting for WT power output; • The amount for load shedding.
The network was designed in accordance with the six steps in Table 7-17. Table 7-20 details the specific steps. With the test data, the MSE was small enough to validate that the ANN designed was acceptable. Its whole training process was recorded and is shown in Figure 7-59. Table D-4 and Table D-5 in Appendix D list the example of the test data and its results for both network outputs: power setting for WT and the load shedding amount. The first column lists the target value, while the second column includes the results calculated by the designed ANN. The third column indicates the error in between.
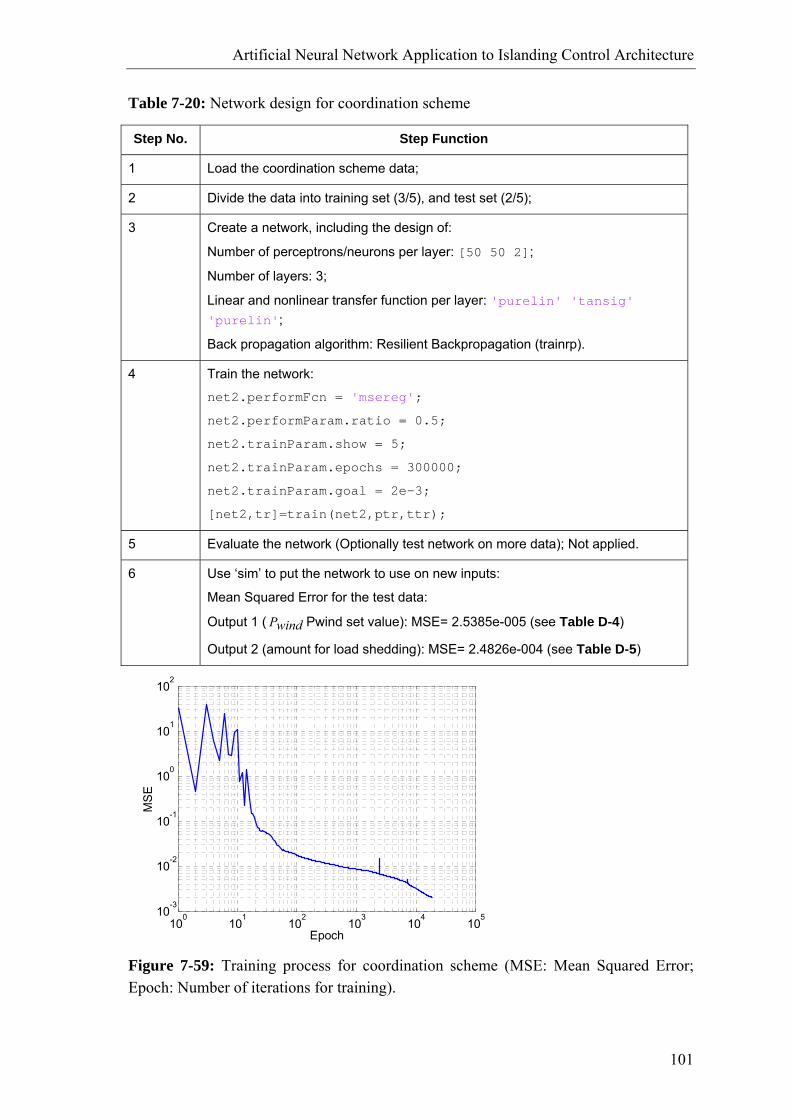
Artificial Neural Network Application to Islanding Control Architecture
101
Table 7-20: Network design for coordination scheme
Step No. Step Function
1 Load the coordination scheme data;
2 Divide the data into training set (3/5), and test set (2/5);
3 Create a network, including the design of:
Number of perceptrons/neurons per layer: [50 50 2];
Number of layers: 3;
Linear and nonlinear transfer function per layer: 'purelin' 'tansig' 'purelin';
Back propagation algorithm: Resilient Backpropagation (trainrp).
4 Train the network:
net2.performFcn = 'msereg';
net2.performParam.ratio = 0.5;
net2.trainParam.show = 5;
net2.trainParam.epochs = 300000;
net2.trainParam.goal = 2e-3;
[net2,tr]=train(net2,ptr,ttr);
5 Evaluate the network (Optionally test network on more data); Not applied.
6 Use ‘sim’ to put the network to use on new inputs:
Mean Squared Error for the test data:
Output 1 ( windP Pwind set value): MSE= 2.5385e-005 (see Table D-4)
Output 2 (amount for load shedding): MSE= 2.4826e-004 (see Table D-5)
100
101
102
103
104
10510
-3
10-2
10-1
100
101
102
MS
E
Epoch
Figure 7-59: Training process for coordination scheme (MSE: Mean Squared Error; Epoch: Number of iterations for training).

Artificial Neural Network Application to Islanding Control Architecture
102
Based on the preliminary study above, it is feasible to apply the ANN to the designed ICA in order to realize the reduction of computation burden and an online application. If more accurate results from ANN are required, there are several options that could be of use:
• Reset the initial network weights and biases to new values with ‘init’ and train again;
• Select the optimal number for hidden layers; • Increase the number of training vectors; • Increase the number of inputs; • Design and implement an online adaptive neural network for ICA (data for train-
ing and test can be regularly updated as the system envolves); • Try a different training algorithm.
It is worth pointing out that for ANN application in this case, it is of great importance to generate reliable training data, which is related to the system network. The effect of the designed ICA depends on how those data can be improved and updated online in accor-dance with the change of system topology. In this chapter, the feasibility for ANN application to ICA has been proved. With ANN application, the computation efficiency in terms of the ISR calculation could be effec-tively improved, without the expense of precision. This advantage presents its potential to be applied for online islanding security assessment.
103
8 IMPLEMENTATION AND DEVELOPMENT OF THE ARCHITECTURE
8.1 Architecture implementation
8.1.1 Integration into Dynamic Security Assessment The Islanding Security Region (ISR) based islanding architecture and its associated co-ordination scheme (ICA) can be integrated into the online Dynamic Security Assess-ment (DSA), which is intended to predict the system security issue in terms of different selected severe disturbances/contingencies. In fact, island operation can be considered as a disturbance to the islanded distribution system. It is related to the electromechanical transient stability or dynamic problem study. The degree of its severity depends on both the amount of power through the in-terconnection and how strong the system itself is. Thus, this study focuses on only one disturbance (namely, islanding) from all those disturbances that should be studied by DSA. This is because intentional island operation may become a useful measure to tackle the cascading issue, and consequently, to save the system from the blackout once the upstream grid is heavily stressed. However, it is still unknown how to utilize those Distributed Generations (DGs) occurring in the distribution system and what control architecture is needed. This has been stimulating utility’s attention recently, due to the high penetration of DGs in the distribution system [8-1]. Dynamic Secuirty Assessment (DSA) has been studied in many papers. As one fold of Security Assessment (SA), it corresponds to the investigation of disturbances which may lead to transient instabilities, while Static Security Assessment, as another fold, corresponds to those situations where the transients following the disturbance have died out, but the limit violations in the new steady-state operating point could not be toler-ated for long [8-2]. As [8-3] points out, DSA is a general term which assesses rotor angle stability (transient stability and small signal stability), voltage stability, and frequency stability. It is a complex problem, as well as a challenge to provide comprehensive analysis with the required accuracy, speed and robustness. Nevertheless, there has been a higher require-ment for a more rigorous online security assessment, caused by in particular the deregu-latied electricity market. Both [8-4] and [8-5] lists the highlighted factors leading to the great need for an online DSA.
Implementation and Development of the Architecture
104
8.1.2 Components description In [8-4], the components of an online DSA system are described. For the ICA designed in this PhD study, its main components for future online application can be described in a similar way. In Figure 8-60, there are six function components: Measurement, Modeling, Computa-tion, Reporting and Visualization, Control and Other functions.
• The Measurement component monitors and measures the main system data by either Supervisory Control And Data Acquisition system (SCADA)/Energy Management System (EMS) or Phasor Measurement Units (PMUs). Those data is sent to Modeling component, Computation component and Reporting and Visualization component;
• The Modeling component estimates the system states with the measured real-time system data to improve the system model;
• In Computation component, there are two scenarios, the one is without intelli-gent system, and the other is with intelligent system. (To tackle the heavy com-putation burden issue, machine learning techniques or intelligent systems are under study for DSA [8-6] [8-7]; Artificial Neural Network (ANN) is one of them, as Chapte 7 investigated.) For the scenario without intelligent system, noted as ‘Scenario One’ below the dashed line in Figure 8-60, the Computation component first calculates and plots the ISR offline, based on the improved sys-tem model, then SA and the corresponding coordination scheme would be proc-essed for preventive actions, with the measured system data from Measurement component; for the scenario with intelligent system, noted as ‘Scenario Two’ above the dashed line, two sets of training data for the intelligent systems, ANN1 and ANN2, should be obtained, by conducting time domain simulation; ANN1 and ANN2 have been designed in Chpater 7; then SA and the corre-sponding coordination scheme would be processed. The benefit of ANN is the fast computation and their self-learning capability. At this stage, the results would be sent to Reporting and Visualization component, Control component and Other functions component;
• The Reporting and Visualization component can enable the system operator to understand and monitor the whole system with an overview picture in real time. Thus, system operator can control the system correctly, precisely and quickly with sufficient confidence; the results can be displayed both locally and on internet;
• In the Control component, once there is an islanding signal with adequate lead time for intentional island operation, the preventive actions suggested in Compu-tation component would initiate the corresponding performances, such as the Wind Turbine (WT) power downward adjustment, load shedding, etc. Once preparation has been done, the trip signal would be sent and islanding is trig-gered;
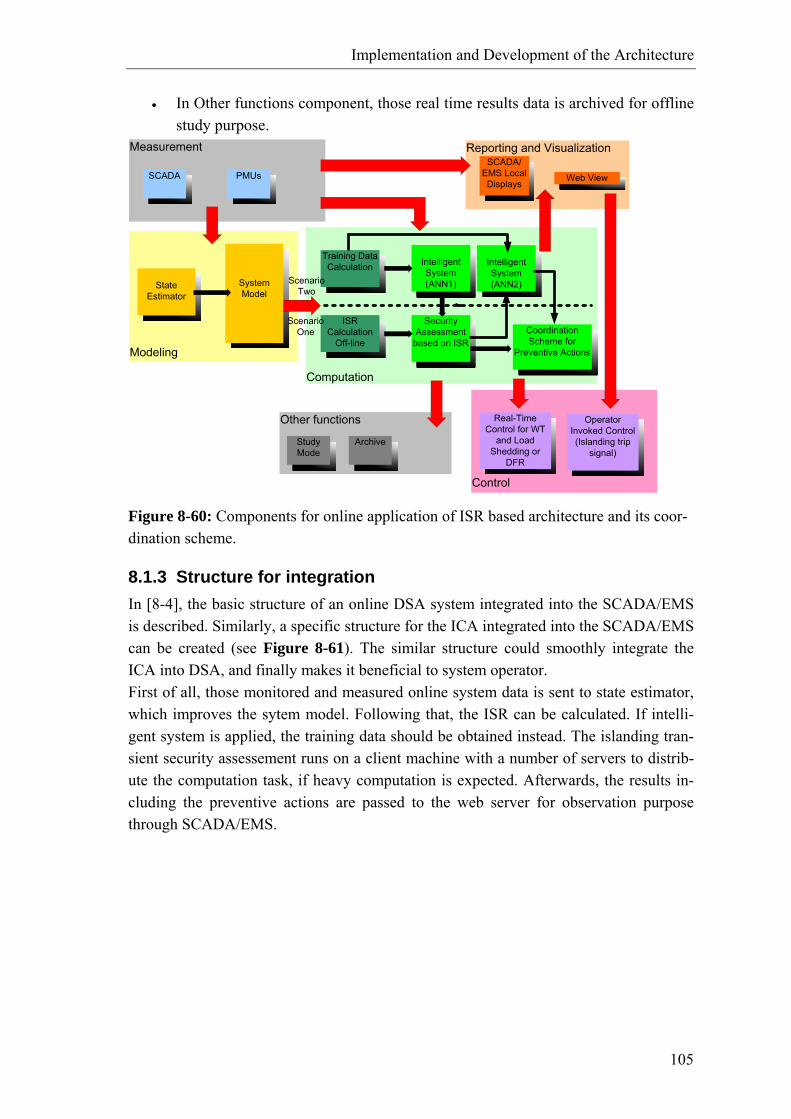
Implementation and Development of the Architecture
105
• In Other functions component, those real time results data is archived for offline study purpose.
Measurement Reporting and Visualization
Modeling
Computation
Other functions
Control
SCADA PMUs
System Model
State Estimator
Intelligent System (ANN1)
Security Assessment
based on ISRCoordination Scheme for
Preventive Actions
Intelligent System (ANN2)
ISR Calculation
Off-line
SCADA/EMS Local Displays
Web View
Real-Time Control for WT
and Load Shedding or
DFR
Operator Invoked Control(Islanding trip
signal)Study Mode
Archive
Training Data Calculation
Scenario Two
Scenario One
Figure 8-60: Components for online application of ISR based architecture and its coor-dination scheme.
8.1.3 Structure for integration In [8-4], the basic structure of an online DSA system integrated into the SCADA/EMS is described. Similarly, a specific structure for the ICA integrated into the SCADA/EMS can be created (see Figure 8-61). The similar structure could smoothly integrate the ICA into DSA, and finally makes it beneficial to system operator. First of all, those monitored and measured online system data is sent to state estimator, which improves the sytem model. Following that, the ISR can be calculated. If intelli-gent system is applied, the training data should be obtained instead. The islanding tran-sient security assessement runs on a client machine with a number of servers to distrib-ute the computation task, if heavy computation is expected. Afterwards, the results in-cluding the preventive actions are passed to the web server for observation purpose through SCADA/EMS.
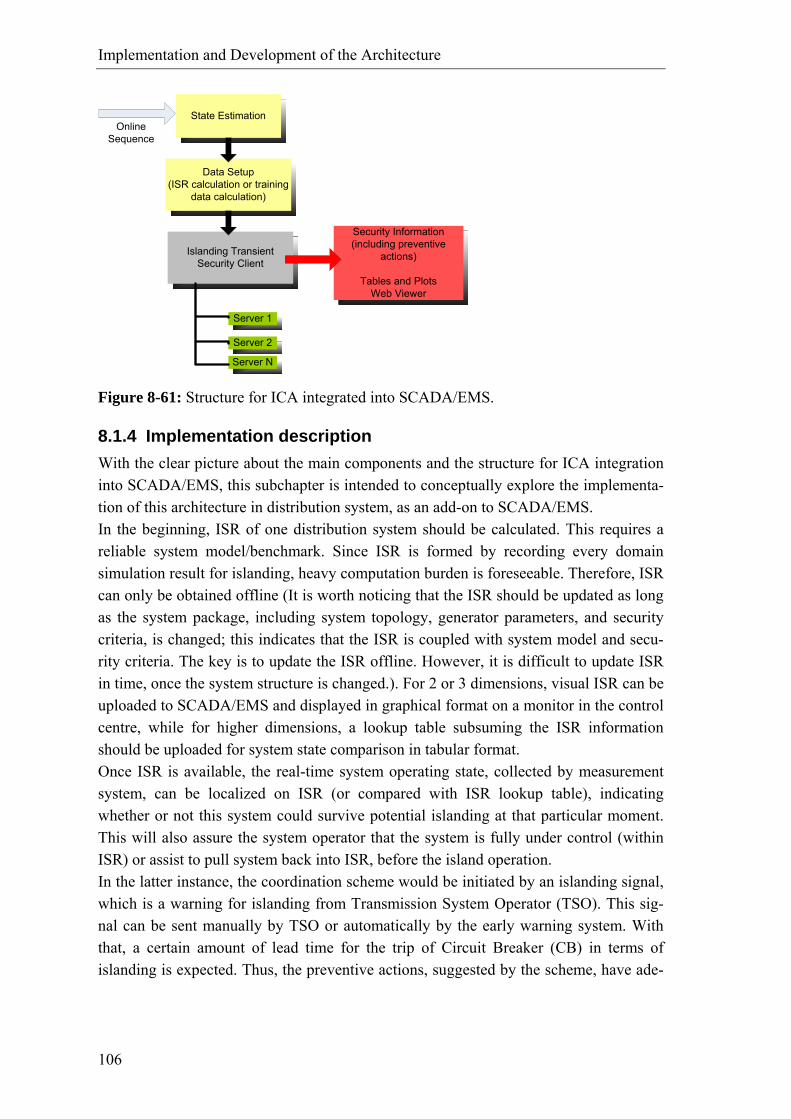
Implementation and Development of the Architecture
106
State Estimation
Data Setup(ISR calculation or training
data calculation)
Islanding Transient Security Client
Security Information(including preventive
actions)
Tables and PlotsWeb Viewer
Server 1
Server 2
Server N
Online Sequence
Figure 8-61: Structure for ICA integrated into SCADA/EMS.
8.1.4 Implementation description With the clear picture about the main components and the structure for ICA integration into SCADA/EMS, this subchapter is intended to conceptually explore the implementa-tion of this architecture in distribution system, as an add-on to SCADA/EMS. In the beginning, ISR of one distribution system should be calculated. This requires a reliable system model/benchmark. Since ISR is formed by recording every domain simulation result for islanding, heavy computation burden is foreseeable. Therefore, ISR can only be obtained offline (It is worth noticing that the ISR should be updated as long as the system package, including system topology, generator parameters, and security criteria, is changed; this indicates that the ISR is coupled with system model and secu-rity criteria. The key is to update the ISR offline. However, it is difficult to update ISR in time, once the system structure is changed.). For 2 or 3 dimensions, visual ISR can be uploaded to SCADA/EMS and displayed in graphical format on a monitor in the control centre, while for higher dimensions, a lookup table subsuming the ISR information should be uploaded for system state comparison in tabular format. Once ISR is available, the real-time system operating state, collected by measurement system, can be localized on ISR (or compared with ISR lookup table), indicating whether or not this system could survive potential islanding at that particular moment. This will also assure the system operator that the system is fully under control (within ISR) or assist to pull system back into ISR, before the island operation. In the latter instance, the coordination scheme would be initiated by an islanding signal, which is a warning for islanding from Transmission System Operator (TSO). This sig-nal can be sent manually by TSO or automatically by the early warning system. With that, a certain amount of lead time for the trip of Circuit Breaker (CB) in terms of islanding is expected. Thus, the preventive actions, suggested by the scheme, have ade-
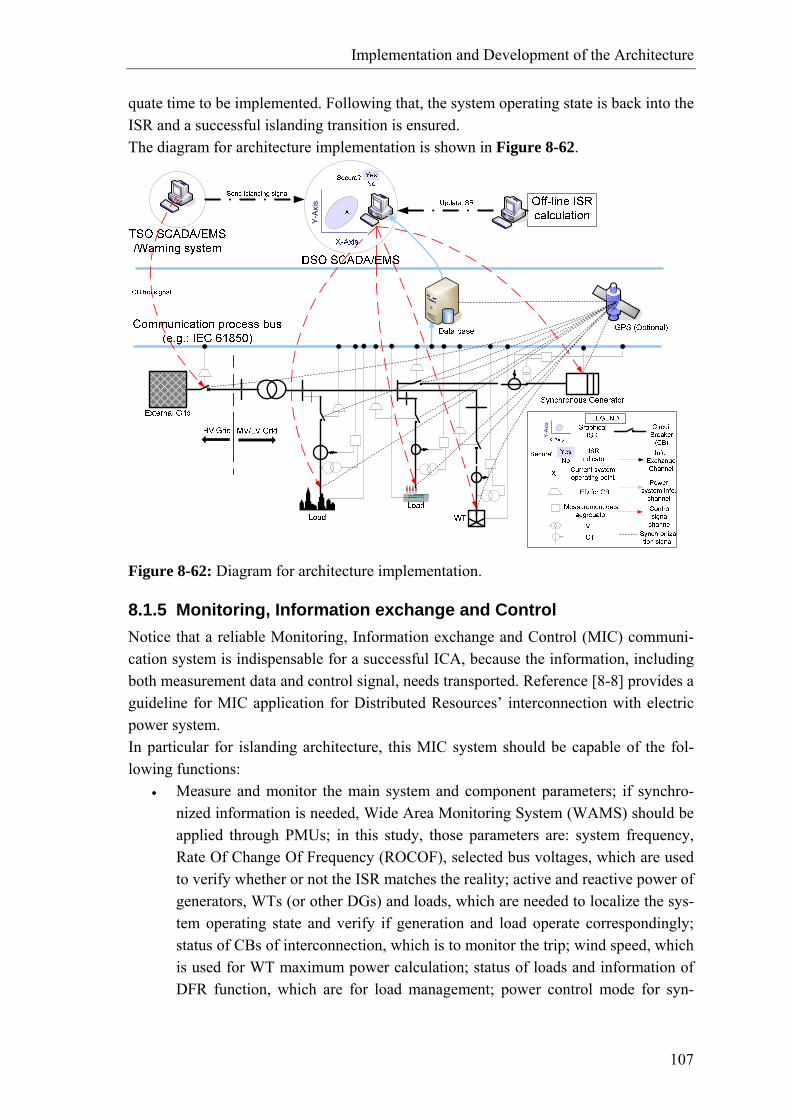
Implementation and Development of the Architecture
107
quate time to be implemented. Following that, the system operating state is back into the ISR and a successful islanding transition is ensured. The diagram for architecture implementation is shown in Figure 8-62.
Y-A
xis
Y-A
xis
Figure 8-62: Diagram for architecture implementation.
8.1.5 Monitoring, Information exchange and Control Notice that a reliable Monitoring, Information exchange and Control (MIC) communi-cation system is indispensable for a successful ICA, because the information, including both measurement data and control signal, needs transported. Reference [8-8] provides a guideline for MIC application for Distributed Resources’ interconnection with electric power system. In particular for islanding architecture, this MIC system should be capable of the fol-lowing functions:
• Measure and monitor the main system and component parameters; if synchro-nized information is needed, Wide Area Monitoring System (WAMS) should be applied through PMUs; in this study, those parameters are: system frequency, Rate Of Change Of Frequency (ROCOF), selected bus voltages, which are used to verify whether or not the ISR matches the reality; active and reactive power of generators, WTs (or other DGs) and loads, which are needed to localize the sys-tem operating state and verify if generation and load operate correspondingly; status of CBs of interconnection, which is to monitor the trip; wind speed, which is used for WT maximum power calculation; status of loads and information of DFR function, which are for load management; power control mode for syn-
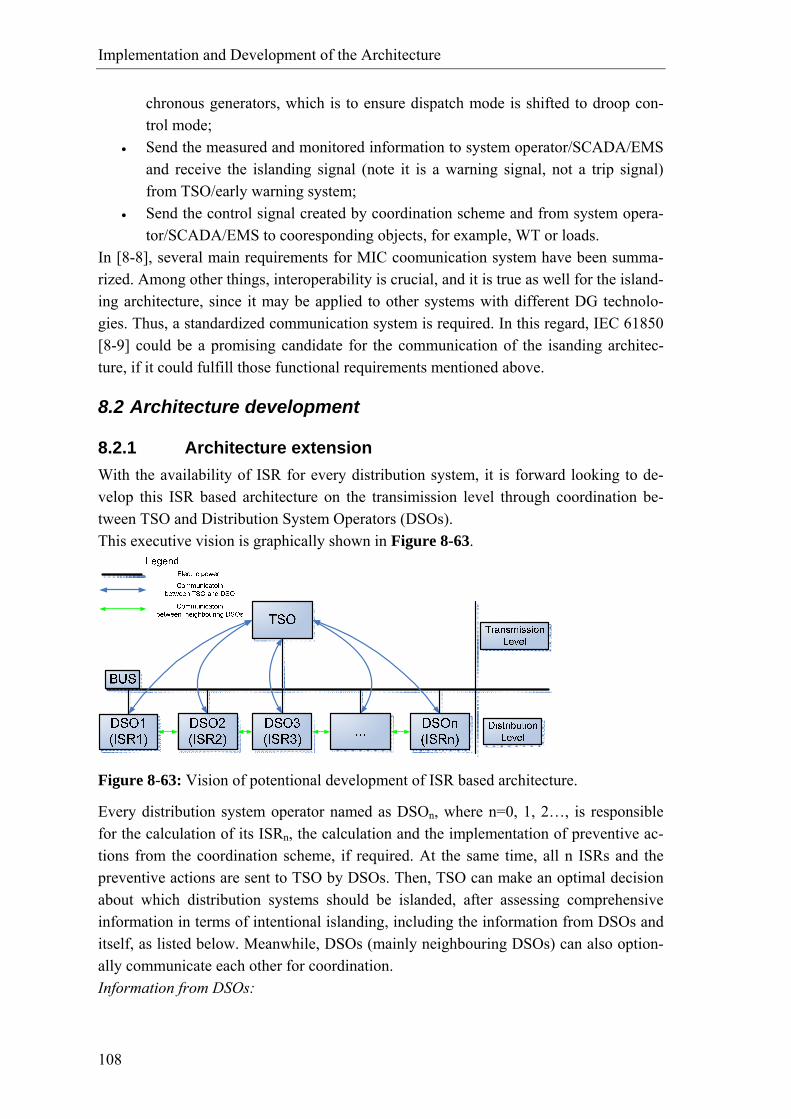
Implementation and Development of the Architecture
108
chronous generators, which is to ensure dispatch mode is shifted to droop con-trol mode;
• Send the measured and monitored information to system operator/SCADA/EMS and receive the islanding signal (note it is a warning signal, not a trip signal) from TSO/early warning system;
• Send the control signal created by coordination scheme and from system opera-tor/SCADA/EMS to cooresponding objects, for example, WT or loads.
In [8-8], several main requirements for MIC coomunication system have been summa-rized. Among other things, interoperability is crucial, and it is true as well for the island-ing architecture, since it may be applied to other systems with different DG technolo-gies. Thus, a standardized communication system is required. In this regard, IEC 61850 [8-9] could be a promising candidate for the communication of the isanding architec-ture, if it could fulfill those functional requirements mentioned above.
8.2 Architecture development
8.2.1 Architecture extension With the availability of ISR for every distribution system, it is forward looking to de-velop this ISR based architecture on the transimission level through coordination be-tween TSO and Distribution System Operators (DSOs). This executive vision is graphically shown in Figure 8-63.
Figure 8-63: Vision of potentional development of ISR based architecture.
Every distribution system operator named as DSOn, where n=0, 1, 2…, is responsible for the calculation of its ISRn, the calculation and the implementation of preventive ac-tions from the coordination scheme, if required. At the same time, all n ISRs and the preventive actions are sent to TSO by DSOs. Then, TSO can make an optimal decision about which distribution systems should be islanded, after assessing comprehensive information in terms of intentional islanding, including the information from DSOs and itself, as listed below. Meanwhile, DSOs (mainly neighbouring DSOs) can also option-ally communicate each other for coordination. Information from DSOs:
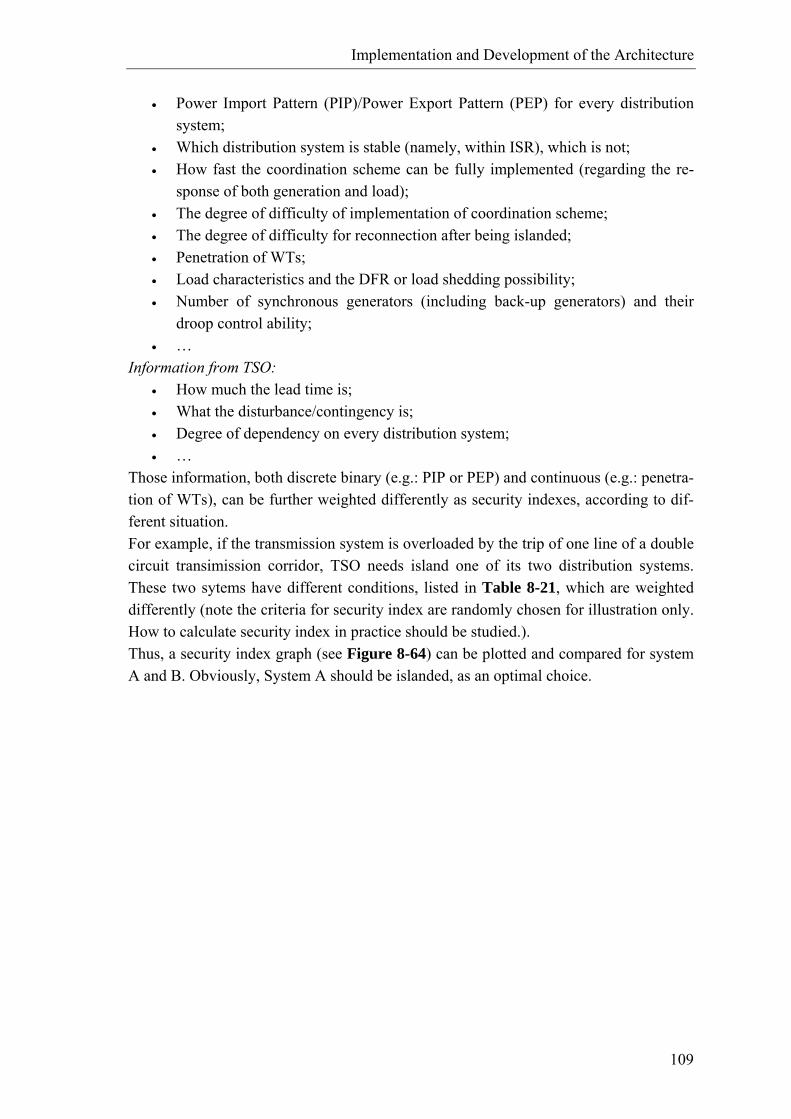
Implementation and Development of the Architecture
109
• Power Import Pattern (PIP)/Power Export Pattern (PEP) for every distribution system;
• Which distribution system is stable (namely, within ISR), which is not; • How fast the coordination scheme can be fully implemented (regarding the re-
sponse of both generation and load); • The degree of difficulty of implementation of coordination scheme; • The degree of difficulty for reconnection after being islanded; • Penetration of WTs; • Load characteristics and the DFR or load shedding possibility; • Number of synchronous generators (including back-up generators) and their
droop control ability; • …
Information from TSO: • How much the lead time is; • What the disturbance/contingency is; • Degree of dependency on every distribution system; • …
Those information, both discrete binary (e.g.: PIP or PEP) and continuous (e.g.: penetra-tion of WTs), can be further weighted differently as security indexes, according to dif-ferent situation. For example, if the transmission system is overloaded by the trip of one line of a double circuit transimission corridor, TSO needs island one of its two distribution systems. These two sytems have different conditions, listed in Table 8-21, which are weighted differently (note the criteria for security index are randomly chosen for illustration only. How to calculate security index in practice should be studied.). Thus, a security index graph (see Figure 8-64) can be plotted and compared for system A and B. Obviously, System A should be islanded, as an optimal choice.
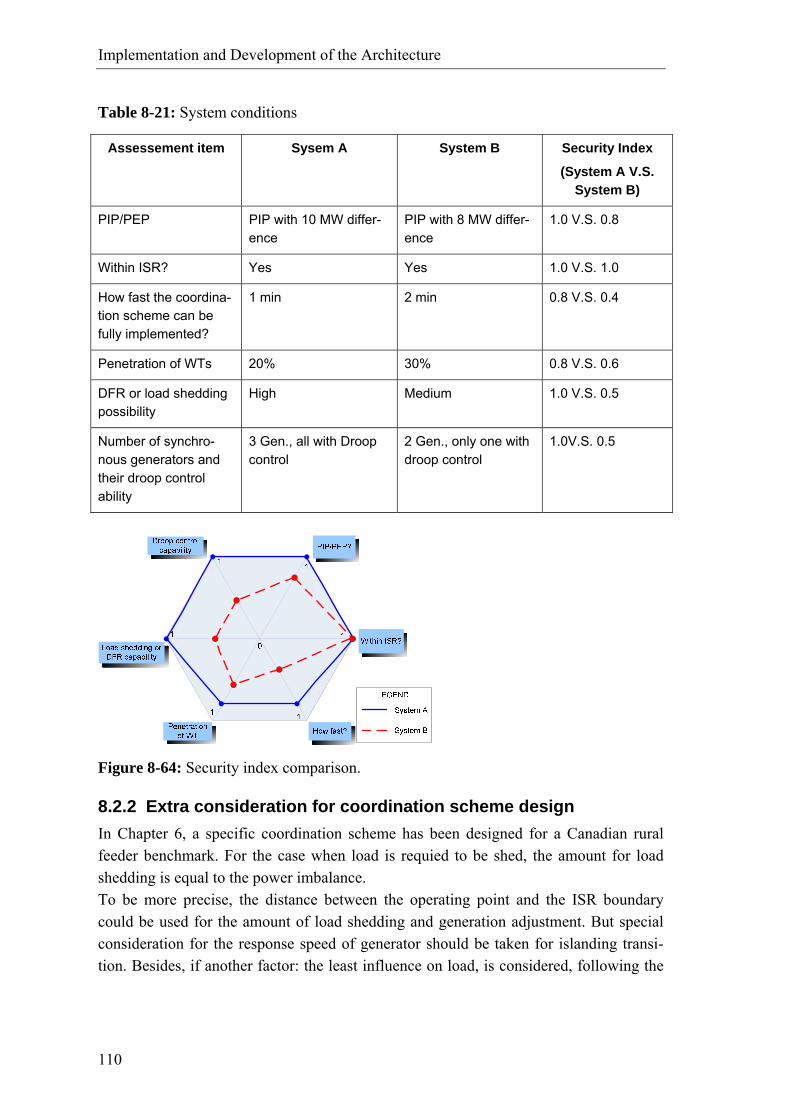
Implementation and Development of the Architecture
110
Table 8-21: System conditions
Assessement item Sysem A System B Security Index
(System A V.S. System B)
PIP/PEP PIP with 10 MW differ-ence
PIP with 8 MW differ-ence
1.0 V.S. 0.8
Within ISR? Yes Yes 1.0 V.S. 1.0
How fast the coordina-tion scheme can be fully implemented?
1 min 2 min 0.8 V.S. 0.4
Penetration of WTs 20% 30% 0.8 V.S. 0.6
DFR or load shedding possibility
High Medium 1.0 V.S. 0.5
Number of synchro-nous generators and their droop control ability
3 Gen., all with Droop control
2 Gen., only one with droop control
1.0V.S. 0.5
Figure 8-64: Security index comparison.
8.2.2 Extra consideration for coordination scheme design In Chapter 6, a specific coordination scheme has been designed for a Canadian rural feeder benchmark. For the case when load is requied to be shed, the amount for load shedding is equal to the power imbalance. To be more precise, the distance between the operating point and the ISR boundary could be used for the amount of load shedding and generation adjustment. But special consideration for the response speed of generator should be taken for islanding transi-tion. Besides, if another factor: the least influence on load, is considered, following the
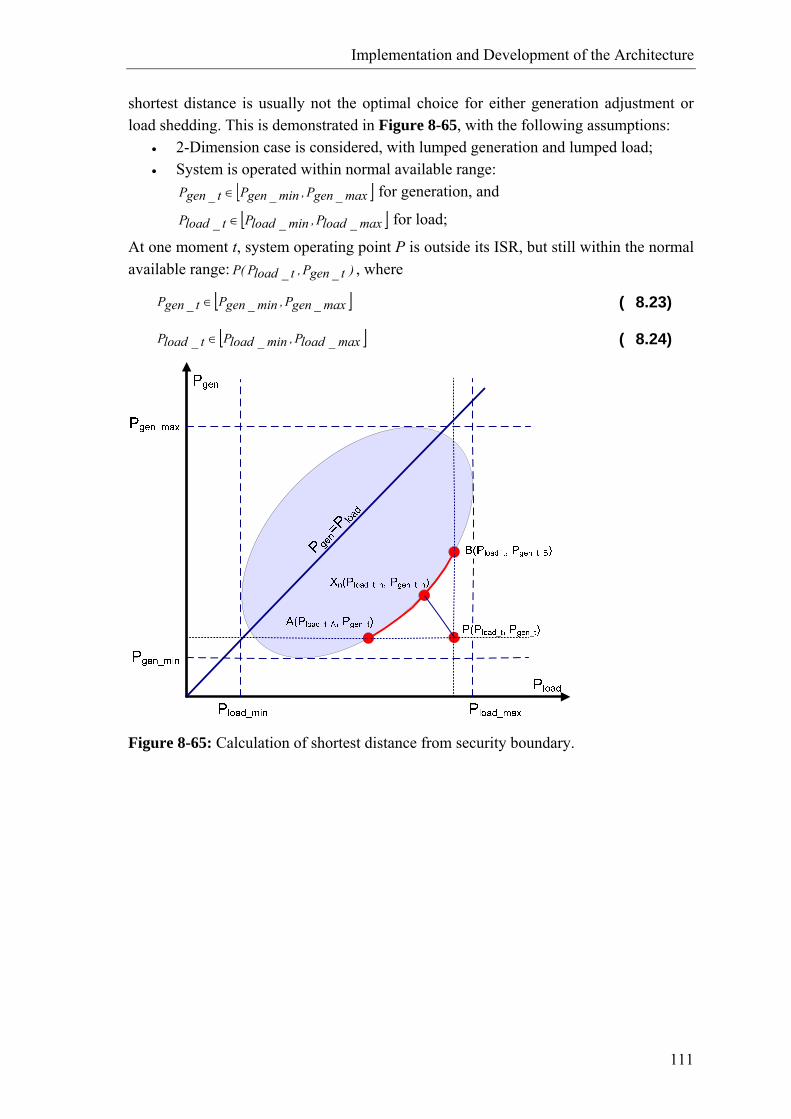
Implementation and Development of the Architecture
111
shortest distance is usually not the optimal choice for either generation adjustment or load shedding. This is demonstrated in Figure 8-65, with the following assumptions:
• 2-Dimension case is considered, with lumped generation and lumped load; • System is operated within normal available range:
[ ]max_genP,min_genPt_genP ∈ for generation, and
[ ]max_loadP,min_loadPt_loadP ∈ for load;
At one moment t, system operating point P is outside its ISR, but still within the normal available range: )t_genP,t_loadP(P , where
[ ]max_genP,min_genPt_genP ∈ ( 8.23)
[ ]max_loadP,min_loadPt_loadP ∈ ( 8.24)
Figure 8-65: Calculation of shortest distance from security boundary.
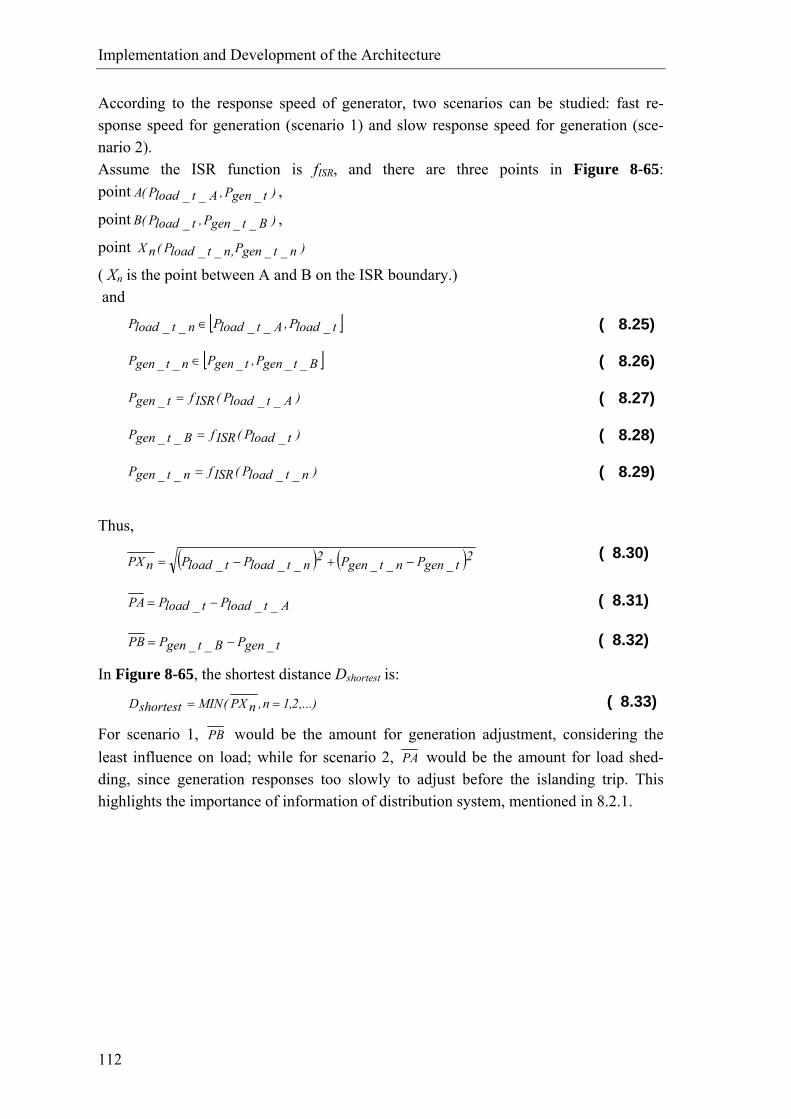
Implementation and Development of the Architecture
112
According to the response speed of generator, two scenarios can be studied: fast re-sponse speed for generation (scenario 1) and slow response speed for generation (sce-nario 2). Assume the ISR function is fISR, and there are three points in Figure 8-65: point )t_genP,A_t_loadP(A ,
point )B_t_genP,t_loadP(B ,
point )n_t_genP,n_t_loadP(nX
( Xn is the point between A and B on the ISR boundary.) and
[ ]t_loadP,A_t_loadPn_t_loadP ∈ ( 8.25)
[ ]B_t_genP,t_genPn_t_genP ∈ ( 8.26)
)A_t_loadP(ISRft_genP = ( 8.27)
)t_loadP(ISRfB_t_genP = ( 8.28)
)n_t_loadP(ISRfn_t_genP = ( 8.29)
Thus,
( ) ( )2t_genPn_t_genP2n_t_loadPt_loadPnPX −+−= ( 8.30)
A_t_loadPt_loadPPA −= ( 8.31)
t_genPB_t_genPPB −= ( 8.32)
In Figure 8-65, the shortest distance Dshortest is:
,...)2,1n,nPX(MINshortestD == ( 8.33)
For scenario 1, PB would be the amount for generation adjustment, considering the least influence on load; while for scenario 2, PA would be the amount for load shed-ding, since generation responses too slowly to adjust before the islanding trip. This highlights the importance of information of distribution system, mentioned in 8.2.1.
113
9 CONCLUSION AND FUTURE WORK
9.1 Conclusion The main outcome of this PhD study is ISR based ICA. The ISR concept, proposed, designed, and applied in this study, has exposed its capability to quantify and visualize the degree of security for island operation. Besides, its associated coordination scheme could perform a proactive diagnosis and correspondingly initiate preventive actions to pull the system back into ISR. Regarding its concept design, application, improvement, and implementation, a number of conclusions are worth being highlighted as follows.
9.1.1 Concept design and application With the ISR, the system operator can be well informed whether or not a specific distri-bution system, at any instant, can successfully handle a possible islanding transition, due to either maintenance or a disturbance from the upstream grid. There are several factors that would affect the ISR. Five main factors are different crite-ria for islanding assessment, the droop of governor, the load characteristics, the gain of voltage regulator, and different power dispatches among generators. In addition, the following factors may also affect ISR:
• Availability/variation range of generators and loads; • Voltage/frequency dependence of loads; (in this study, loads were modeled with
constant power: the most pessimistic situation.) • Resolution of every step for both generation and load increase (the amount by
which generators and loads are created every time), and it is related to the denseness of the ISR as subchapter 4.3.1 described; the smaller the step (more continuous), the better; but more computation time is required;
• Control schemes that are applied: o whether or not load management is applied: load shedding, DFR, etc.; o whether or not Wind Turbines are controlled.
Based on the previous study, both frequency and voltage criteria may affect the ISR. However, the assessment criteria can be reduced to frequency, if the study of the load characteristics proves that frequency and voltage can be decoupled. ISR is less sensitive to the gain of voltage regulator, compared to other factors.

Conclusion and Future Work
114
Appropriate power dispatches among generators should be well planned to ensure a good load sharing performance during the island operation. DFR can effectively enlarge the ISR, and eventually increase the probability for suc-cessful system island operation. ISR based coordination scheme can support island operation, by activating preventive remedial actions (such as WT power adjustment and load shedding in this study), in a self-adapting style, as long as an islanding warning signal is sent with considerable lead time and corresponding system components can respond fast. For the coordination scheme design, the response speed of different system components needs taken into account.
9.1.2 Application of Artificial Neural Network It is feasible to apply ANN to the designed ICA in order to improve computation effi-ciency for future online application. If more accurate results from ANN are required, there are several options that could be of use:
• Reset the initial network weights and biases to new values with ‘init’ and train again;
• Select the optimal number of hidden layers; • Increase the number of training vectors; • Increase the number of inputs; • Design and implement an online adaptive neural network for ICA (data for train-
ing and test can be regularly updated as the system envolves); • Try a different training algorithm.
It is worth pointing out that for ANN application in this case, it is of great importance to generate reliable training data, which is related to the system network. The effect of the designed ICA depends on how those data can be improved and updated online in accor-dance with the change of system topology.
9.1.3 Architecture implementation ICA has great potential to be integrated into DSA. A warning signal with considerable lead time for islanding is required if coordination scheme is expected to perform effectively. A reliable MIC communication system is indispensable for a successful ICA, because the information, including both measurement data and control signal, needs transported.
9.2 Future work The future work can be divided into three aspects: the concept development part, the modeling and simulation part, and the test part.
Conclusion and Future Work
115
9.2.1 Concept development The ICA designed in this study focuses on the islanding transition period. In the future, ICA should also cover islanding mode and the transition from islanding mode to grid connection mode. In case of blackout, black start strategy should be included in ICA as well. Criteria for island operation are critical, and they need further investigated, based on utility experience or recommendation and practical considerations (e.g.: effects on equipments/customers/power quality); they could be the range for the variation of sta-tionary/temporary frequency, transient frequency gradient, the time for stationary fre-quency assessment, and the same for voltage, also the ratio of voltage to frequency. If voltage issue in system is of great concern, the ICA should consider the voltage con-trol scheme. In Chapter 8, the structure for ICA extension to transmission level was designed. With this structure, the demonstration work with more than one distribution systems in simu-lation tool could be performed in the future. How to define the algorithm for different security indexes, mentioned in Chapter 8, is another interesting work. This can assist the system operator to optimize the selection of distribution system candidates for island operation.
9.2.2 Modeling and simulation In this study, the loads were modeled as constant power loads. In order to be more real-istic, the diversity of load models, such as constant impedance load, constant current load, load with voltage/freq. dependence, should be presented, based on the study on the system loads in reality. It is valuable to apply the ICA to different network scenarios with different structures, generation mix, and load mix. ICA for DGs or loads with power electronics interface can be investigated. Storage devices, such as battery and flywheels can be included to strengthen the system ability for island operation.
9.2.3 Test With the implementation structure introduced in Chapter 8, it would be beneficial to realize the application of ICA in the lab for test. If the feedback is promising, the on-site test could be the next step.

117
REFERENCES
[1-1] “Copenhagen Accord – Decision-/CP.15,” United Nations Climate Change Con-ference COP15, Copenhagen, Denmark, December 18, 2009.
[1-2] “20 20 by 2020 Europe’s climate change opportunity,” Commission of the European communities, Brussels, 23.1.2008. COM(2008) 30 final, 2008.
[1-3] “EU Funding – CIP, FP7, LIFE+, LLP understanding is the first step,” Europa Media PSC.
[1-4] EU Seventh Framework Programme (FP7) 2007 – 2013. Website: http://cordis.europa.eu/fp7/home_en.html (last vist: 16/05/2010).
[1-5] “A visionary Danish energy policy 2025,” Danish Transport and Energy Minis-try, Denmark, January 2007.
[1-6] “50% Wind Power in Denmark in 2025 – English Summary,” Ea Energy Analy-ses, Copenhagen, Denmark, July 2007.
[1-7] “Danish example – the way to an energy efficient and energy friendly econ-omy,” the Danish Energy Agency, Denmark, February, 2009. [Online] Avail-able: http://www.kemin.dk/en-US/facts/danishexample/Documents/The%20Danish%20Example%20Engelsk%20FINAL%20200209%20vs2%20_2_.pdf (last visit: 16/05/2010).
[1-8] Morten Lind, et al, “Ecogrid.dk Phase 1: WP2 System Architecture,” Ec-oGrid.dk project funded by Energinet.dk via the PSO ForskEL program, no. 2007-1-7816, Teknologisk Institut, Århus C, Denmark, May 2009.
[1-9] “System Plan 2009 summary”, Energinet.dk, Denmark, December 2009. [1-10] “Energy 2008 – Research, Development, Demonstration,” annual report on Dan-
ish energy research programmes, published in cooperation between Energi-net.dk, the Danish Energy Agency/the EUDP Secretariat, the Danish Energy As-sociation, the Programme Commission on Sustainable Energy and Environment under the Danish Council for Strategic Research and the Danish National Ad-vanced Technology Foundation, November 2008.
[1-11] “Updated Work Programme 2009 and Work Programme 2010: Cooperation – Theme 3 – ICT – Information and Communication Technologies,” European Commission C(2009) 5893 of 29, July 2009.
[1-12] (Danish) Projektbeskrivelse: NextGen, Center for Elteknologi, Danmarks Tekni-ske Universitet, 30 maj 2006.
References
118
[1-13] Per Lund, Sunil Cherian, Thomas Ackermann, “A cell controller for autonomous operation of a 60 kV distribution area,” International journal of distributed en-ergy resources, Volume 2 Number 2 (2006) Pages 83-100.
[1-14] DIgSILENT PowerFactory website: www.digsilent.de (last visit: 16/05/2010). [1-15] SAS website: www.sas.com (last visit: 16/05/2010). [1-16] “Energy 2009 – Research, Development, Demonstration,” annual report on Dan-
ish energy research programmes, published in cooperation between Energi-net.dk, the Danish Energy Agency/the EUDP Secretariat, the Danish Energy As-sociation, the Programme Commission on Sustainable Energy and Environment under the Danish Council for Strategic Research and the Danish National Ad-vanced Technology Foundation, July 2009.
[1-17] EU MicroGrids website: www.microgrids.eu (last visit: 16/05/2010). [1-18] Draft Guide for Design, Operation, and Integration of Distributed Resource Is-
land Systems with Electric Power Systems, IEEE Standards Coordinating Committee 21 Sponsored by the IEEE Standards Coordinating Committee 21 on Fuel Cells, Photovoltaics, Dispersed Generation, and Energy Storage IEEE P1547.4 Draft 6.0, January 2009, Las Vegas. (subject to change).
[1-19] Demo model: Nine Bus System. Library in DIgSILENT/PowerFactory. [1-20] P.M.Anderson, A.A. Fouad, “Power System Control and Stability,” second edi-
tion, Wiley, 2003, pp. 37-39. [2-1] Per Lund, Sunil Cherian, Thomas Ackermann, “A cell controller for autonomous
operation of a 60 kV distribution area,” International journal of distributed en-ergy resources, Volume 2 Number 2 (2006) Pages 83-100.
[2-2] “New ERA for electricity in Europe – distributed generation: key issues, chal-lenges and proposed solutions,” European Commission, Directorate-General for Research, Directorate J – Energy, Unit J-2 – Energy Production and Distribution Systems, 2003.
[2-3] EU MicroGrids, website: www.microgrids.eu (last visit: 16/05/2010). [2-4] Draft Guide for Design, Operation, and Integration of Distributed Resource Is-
land Systems with Electric Power Systems, IEEE Standards Coordinating Committee 21 Sponsored by the IEEE Standards Coordinating Committee 21 on Fuel Cells, Photovoltaics, Dispersed Generation, and Energy Storage, IEEE P1547.4 Draft 6.0, January 2009, Las Vegas. (subject to change).
[2-5] Lopes, J.A.P.; Moreira, C.L.; Madureira, A.G.; Resende, F.O.; Wu, X.; Jay-awarna, N.; Zhang, Y.; Jenkins, N.; Kanellos, F.; Hatziargyriou, N., “Control strategies for microgrids emergency operation,” Future Power Systems interna-tional conference, November 2005.
[2-6] J. A. Peças Lopes, C. L. Moreira, and A. G. Madureira “Defining Control Strategies for MicroGrids Islanded Operation,” IEEE Transactions on Power Systems, Vol. 21, No. 2, May 2006.
References
119
[2-7] Information about the cell project, Energinet.dk, May 2008 [On-line]. Available: http://www.energinet.dk/en/menu/R+and+D/The+Cell+Project/The+Cell+Project.htm. (last visit: 16/05/2010)
[2-8] Lund, P., “The Danish Cell Project - Part 1: Background and General Ap-proach,” IEEE Power Engineering Society General Meeting, 2007.
[2-9] Cherian, S.; Knazkins, V.; “The Danish Cell Project - Part 2: Verification of Control Approach via Modeling and Laboratory Tests,” IEEE Power Engineer-ing Society General Meeting, 2007.
[2-10] IEEE 1547 - Standard for Interconnecting Distributed Resources with Electric Power Systems. Website: http://grouper.ieee.org/groups/scc21/dr_shared/ (last visit: 16/05/2010).
[2-11] “Technical Regulations for Thermal Power Station Units of 1.5 MW and higher,” Regulation for grid connection TF 3.2.3, Version 5, Document No.: 165788-07, Energinet.dk, 2007-09-27, p. 6/89.
[2-12] “Technical Regulations for Thermal Power Station Units larger than 11 kW and smaller than 1.5 MW,” Regulation for grid connection TF 3.2.4, Version 0, Document No.: 163073-07, 2007-07-20, p. 6/62.
[2-13] “Transmission provider technical requirements for the connection of power plants to the Hydro-Québec transmission system,” Hydro Québec, Québec, Can-ada, February 2009, p. 6.
[2-14] “Distribution power generator islanding guidelines,” BC Hydro, Canada, June 2006, p.3.
[2-15] “35 kV and below interconnection requirements for power generators”, BC Hy-dro, Canada, February 2010, p. 29.
[2-16] “UCTE Operation Handbook – Policy 1: Load-Frequency Control and perform-ance,” final policy 2.2 E, 20.07.2004. pp.1–8.
[2-17] “UCTE Operation Handbook – Glossary,” final v2.2 E, 24.06.2004. p. G–7. [2-18] 1547™-2003, IEEE Standard for Interconnecting Distributed Resources with
Electric Power Systems, 28 July 2003, p. 4. [2-19] “Generation, transmission and distribution of electricity - Power systems plan-
ning and management / Power system control”, IEV number 603-04-31, IEC 60050. [On-line]. Available: http://std.iec.ch/iec60050 (last visit: 16/05/2010).
[3-1] Yu Chen, Zhao Xu, and Jacob Østergaard, “Frequency Analysis for Planned Island operation in the Danish Distribution System – Bornholm,” 43rd interna-tional Universities Power Engineering Conference, Padova, Italy, September 1-4, 2008.
[3-2] Yu Chen, Zhao Xu, and Jacob Østergaard, “PMU Frequency Data Processing for A Planned Island operation in Bornholm,” Nordic Wind Power Conference, Bornholm, Denmark, September 10-11, 2009.
[3-3] “A visionary Danish energy policy 2025,” Danish Transport and Energy Minis-try, Denmark, January 2007.
References
120
[3-4] Farid Katiraei, Chad Abbey, Susan Tang, and Maude Gauthier, “Planned Island-ing on Rural Feeders – Utility Perspective,” IEEE PES General Meeting (Panel on MicroGrids), Pittsburgh, Pennsylvania, USA, July 20-24, 2008.
[3-5] “Distribution Power Generator Islanding Guideline,” BC Hydro, Canada, June 2006.
[3-6] Mukesh Nagpal, , Frank Plumptre, , Richard Fulton, and Terrence G. Martinich, “Dispersed Generation Interconnection—Utility Perspective,” IEEE Transac-tions on Industry Applications, Vol. 42, No. 3, May/June 2006.
[3-7] Richard Fulton, and Chad Abbey, “Planned Islanding of 8.6 MVA IPP for BC Hydro System Reliability,” First International Conference on the Integration of RE and DER, Brussels, Belgium, December 1-3, 2004.
[3-8] J. Peralta, H. Iosfin, and X. Tang, “BC Hydro Perspective on Distribution Is-landing for Customer Reliability,” CIGRE Symposium-Integration of Wide-Scale Renewable Resources into the Delivery System, Calgary, Canada, July 29-31, 2009.
[3-9] Maude Gauthier, Chad Abbey, Farid Katiraei, Jean-Luc Pepin, Marc Plamon-don, and Georges Simard, “Planned Islanding as A Distribution System Opera-tion Tool for Reliability Enhancement,” 19th International Conference on Electrcity Distribution, Vienna, Austria, May 21-24, 2007.
[3-10] Zhao Xu, Mikael Togeby, Jacob Østergaard, “Demand as Frequency controlled Reserve,” Research Project, CET DTU, Denmark, September 2008.
[3-11] Abbey, C.; Katiraei, F.; Brothers, C.; Dignard-Bailey, L.; Joos, G. “Integration of distributed generation and wind energy in Canada,” IEEE Power Engineering Society General Meeting, 2006.
[4-1] IEEE Standard Glossary of Software Engineering Terminology, IEEE Std. 610.12-1990, Sept. 1990.
[4-2] DoD Integrated Architecture Panel, 1995, based on IEEE STD 610.12. [4-3] Morten Lind, et al, “Ecogrid.dk Phase 1: WP2 System Architecture,” Ec-
oGrid.dk project funded by Energinet.dk via the PSO ForskEL program, no. 2007-1-7816, Teknologisk Institut, Århus C, Denmark, May 2009.
[4-4] Katiraei, F.; Abbey, C.; Tang, S.; Gauthier, M., “Planned islanding on rural feeders - utility perspective,” Power and Energy Society General Meeting - Con-version and Delivery of Electrical Energy in the 21st Century, 2008 IEEE, 20-24 July 2008 Page(s):1 - 6.
[4-5] Prabha Kundur, “Power System stability and control,” New York: McGraw-Hill, 1994.
[4-6] C. Abbey, F. Katiraei, C. Brothers, L. Dignard-Bailey, and G. Joos, “Integration of Distributed Generation and Wind Energy in Canada,” IEEE PES General Meeting, 2006.
[4-7] L. H. Hansen, L. Helle, F. Blaabjerg, E. Ritchie, S. Munk-Nielsen, H. Bindner, P. Sørensen and B. Bak-Jensen, ”Conceptual survey of Generators and Power
References
121
Electronics for Wind Turbines,” Risø National Laboratory, Roskilde, Denmark December 2001.
[4-8] Thomas Akoman, “Wind Power in Power System,” John Wiley & Sons, Ltd., 2005.
[4-9] Vladislav Akhmatov, “Analysis of Dynamic Behoaviour of Electric Power Sys-tems with large amount of wind power,” Ph.D. dissertation, Dept. Electrical Eng., Technical Univ. of Denmark, April 2003.
[4-10] Anca D. Hansen, Clemens Jauch, Poul Sørensen, Florin Iov, Frede Blaabjerg, “Dynamic wind turbine models in power, system simulation tool DIgSILENT,” Risø-R-1400(EN)Risø National Laboratory, Roskilde, Denmark, December 2003.
[4-11] Catarina Marcus-Møller, “Demand as frequency controlled reserve-analysis of technology and potentials,” student special course report, Dept. Electrical Eng., Technical Univ. of Denmark, Denmark, October 2006.
[4-12] Zhao Xu, Mikael Togeby, Jacob Østergaard, “Demand as Frequency controlled Reserve,” PSO project report, Centre for Electric Technology, Technical Univ. of Denmark, Denmark, September, 2008.
[4-13] Nordic grid code, Jan. 2007. [4-14] Zhao Xu, Jacob Østergaard, Mikael Togeby, Catarina Maarcus-Møller, “Design
and Modeling of Thermostatically Controlled Loads as Frequency Controlled Reserve,” IEEE PES General Meeting, 2007.
[4-15] L. H. Fink, and Kjell Carlsen, “Operating Under Stress and Strain,” IEEE Spec-trum, March. 1978.
[4-16] H. You et al., “Self-healing in power systems: an approach using islanding and rate of frequency decline-based load shedding,” IEEE Trans. Power Syst., vol. 18, no. 1, pp. 174-181, Feb. 2002.
[4-17] Qianchuan Zhao, Kai Sun, Da-Zhong Zheng, Jin Ma, and Qiang Lu, “A Study of System Splitting Strategies for Island Operation of Power System: A Two-Phase Method Based on OBDDs,” IEEE Trnas. Power Syst., vol. 18, no. 4, Nov. 2003.
[4-18] V. Vittal, W. Kliemann, Y-X Ni, D.G. Chapman, A.D. Silk, and D.J. Sobajic, “Determination of Generator Groupings For an Islanding Scheme in the Mani-toba Hydro System Using the Method of Normal Forms,” IEEE Trans. Power Syst., Vol. 13, No. 4, Nov. 1998.
[4-19] Ming Jin, Tarlochan S. Sidhu, Fellow, IEEE, and Kai Sun, “A New System Splitting Scheme Based on the Unified Stability Control Framework,” IEEE Transactions on Power Systems, Vol. 22, No. 1, Feb. 2007.
[4-20] Kai Sun, Da-Zhong Zheng, and Qiang Lu, “Splitting Strategies for Island opera-tion of Large-Scale Power Systems Using OBDD-Based Methods,” IEEE Trans-actions on Power Systems, Vol. 18, No. 2, May 2003.
References
122
[4-21] Imai, S., and Yasuda, T, “UFLS Program to Ensure Stable Island Operation,” IEEE PES, Power Systems Conference and Exposition, 2004, Page 283-288, Vol. 1, Oct. 2004.
[4-22] Marconato, R.; Menditto, V.; Natale, A.; Salvati, R.; Scarpellini, P., “Emergency automatic control of critical sections in the ENEL power system,” Electrotech-nical Conference, 1991. Proceedings., 6th Mediterranean, 22-24 May 1991 Page(s):1363 - 1366 vol.2
[4-23] Herman B. Ross, Ning Zhu, Jay Giri, and Barbara Kindel, “An AGC Implemen-tation for System Islanding and Restoration Conditions,” IEEE Trans. Power Syst., Vol. 9, no. 3, Aug. 1994.
[4-24] Agematsu, S, Imai, S, Tsukui, R, Watandabe, H, Nakamura, T, and Matsushima, T., “Islanding protection system with active and reactive power balancing con-trol for Tokyo Metropolitan power system and actual operational experiences,” Developments in Power System Protection, 2001, Seventh International Confer-ence on (IEE), Pages: 351-354, Amsterdam, April 9-12, 2001.
[4-25] Caldon, R.; Rossetto, F.; Turri, R., “Temporary islanded operation of dispersed generation on distribution networks,” UPEC 2004. 39th International, Volume 3, 6-8 Sept. 2004.
[4-26] Bertani, A.; Bossi, C.; Fornari, F.; Massucco, S.; Spelta, S.; Tivegna, F., “A mi-croturbine generation system for grid connected and island operation,” Power Systems Conference and Exposition, 2004. IEEE PES 10-13 Oct. 2004 Page(s):360 - 365 vol.1.
[4-27] Vovos, P.N.; Kiprakis, A.E.; Wallace, A.R.; Harrison, G.P., “Centralized and Distributed Voltage Control: Impact on Distributed Generation Penetration,” IEEE Transactions on Power Systems, Volume 22, Issue 1, Feb. 2007 Page(s):476 – 483
[4-28] B. Enacheanu, M. Fontela, Ch. Andrieu, Ha Pham, A. Martin, Y. Besanger, “New Control Strategies to Prevent Blackouts: Intentional Island operation in Distribution Networks,” 18th International Conference on Electricity Distribu-tion, Turin, June 6-9, 2005.
[4-29] Lopes, J.A.P.; Moreira, C.L.; Madureira, A.G., “Defining control strategies for MicroGrids islanded operation,” IEEE Transactions on Power Systems, Volume 21, Issue 2, May 2006 Page(s):916 – 924
[4-30] Chandana Bommareddy, Elham Makram, “Island operation in A Distribution Power System,” 16th IASTED International Conference, Cancun, Mexico, May 18-20, 2005.
[4-31] Cheng-Ting Hsu; Chao-Shun Chen, “Island operations for the distribution sys-tems with dispersed generation systems,” IEEE Power Engineering Society General Meeting, 2005. 12-16 June 2005 Page(s):2962 - 2968 Vol. 3
[4-32] E. Hnyilicza, S. T. Lee, and F. C. Schweppe, “Steady-state security regions: set-theoretic approach,” proceddings of 1975 PICA conference. Pp. 347-355
References
123
[4-33] Direct Methods for Voltage and Transient Stability Regions. EPRI, Palo Alto, CA: 2005. Product ID 1010553.
[4-34] Yu Chen, Zhao Xu, Jacob Østergaard, “Control Mechanism and Security Region for Intentional Islanding Transition,” IEEE PES General Meeting, Calgary, Can-ada, July 26-30 July, 2009.
[5-1] Stanley H. Horowitz and Arun G. Phadke, “Power System Relaying,” Wiley, 1995.
[5-2] Prabha Kundur, “Power System Stability and Control,” New York: McGraw-Hill, 1994.
[5-3] “Transformer Handbook”, ABB Power Technologies Management Ltd. Trans-formers, Switzerland, 2004, pp. 179.
[5-4] “Technical Regulations for Thermal Power Station Units of 1.5 MW and high-er,” Regulation for grid connection TF 3.2.3, version 5, 2007-09-27, Energi-net.dk, Denmark.
[5-5] “Transmission Provider Technical Requirements for the Connection of Power Plants to the Hydro-Québec Transmission System,” Hydro Québec, Canada, Feb. 2009
[5-6] Draft Guide for Design, Operation, and Integration of Distributed Resource Is-land Systems with Electric Power Systems, IEEE P1547.4/Draft 6.0, Las Vegas, Jan. 2009. (subject to change).
[5-7] “A1-Appendix 1: Load-Frequency Control and Performance [E] to Policy 1 – Load-Frequency Control and Performance,” UCTE Operation Handbook, ver-sion 1.9, June 2004, pp. A1-8.
[5-8] P.M.Anderson, A.A. Fouad, “Power System Control and Stability,” second edi-tion, Wiley, 2003, pp. 37-39.
[6-1] Zhao Xu, Mikael Togeby, Jacob Østergaard, “Demand as Frequency controlled Reserve,” Research Project, CET DTU, Denmark, Sept. 2008.
[6-2] Farid Katiraei, Chad Abbey, and Richard Bahry, “Analysis of Voltage Regula-tion Problem for a 25-kV Distribution Network with Distributed Generation,” IEEE PES General Meeting, Montreal, 2006.
[6-3] PSCAD On-Line Help System. [6-4] Working Group on Prime Mover and Energy Supply Models for System Dy-
namic Performance Studies, “Hydraulic Turbine and Turbine Control Models for System Dynamic Studies,” Transactions on Power Systems, Vol. 7, NO. 1, Feb-ruary 1992, Page 167-179.
[6-5] “Transmission Provider Technical Requirements for the Connection of Power Plants to the Hydro-Québec Transmission System,” Hydro Québec, Canada, Feb. 2009.
[6-6] J. G. Slootweg, Member, IEEE, H. Polinder, Member, IEEE, and W. L. Kling, Member, IEEE “Representing Wind Turbine Electrical Generating Systems in
References
124
Fundamental Frequency Simulations,” IEEE Transactions on Energy Conver-sion, , Vol. 18, No. 4, December 2003.
[6-7] Vladislav Akhmatov, “Analysis of Dynamic Behaviour of Electric Power Sys-tems with Large Amount of Wind Power,” PhD Thesis, DTU, Denmark, 2003.
[6-8] Anca D. Hansen, Clemens Jauch, Poul Sørensen, Florin Ivo, Frede Blaabjerg, “Dynamic wind turbine models in power system simulation tool DIgSILENT,” Risø National Laboratory, Roskilde, Denmark, December, 2003.
[7-1] K. Warwick, “Neural network applications in control,” edited by George Wil-liam Irwin, K Warwick, Kenneth J. Hunt, Institution of Electrical Engineers, 1995.
[7-2] Neural networks' power, El-Sharkawi, M.A.; Potentials, IEEE Volume 15, Issue 5, Dec 1996-Jan 1997, pp.12 - 15.
[7-3] Kothari, D.P., “Application of neural networks to power systems,” Centre for Energy Studies, IIT, New Delhi, India, 19-22 Jan. 2000,Volume: 1, page(s): 621 – 626 vol.2
[7-4] Matlab Neural Network Toolbox Help. [8-1] Per Lund, Sunil Cherian, Thomas Ackermann, “A cell controller for autonomous
operation of a 60 kV distribution area,” International journal of distributed en-ergy resources, Volume 2 Number 2 (2006), pp. 83-100.
[8-2] Neural networks' power, El-Sharkawi, M.A.; Potentials, IEEE Volume 15, Issue 5, Dec 1996-Jan 1997, pp.12 – 15.
[8-3] Dynamic security assessment tools, Morison, K.; Hamadanizadeh, H.; Lei Wang; Power Engineering Society Summer Meeting, 1999. IEEE Volume 1, 18-22 July 1999, pp. 282 – 286, vol.1.
[8-4] Kip Morison, Lei Wang, and Prabha Kundur, “Power System Security Assesse-ment,” IEEE Power & Energy Magazine, September/October 2004.
[8-5] Morison, K.; Wang, L.; Kundur, P.; Xi Lin; Wenjian Gao; Chaoyang He; Feng Xue; Jianbing Xu; Taishan Xu; Yusheng Xue, “Critical Requirements for Suc-cessful On-line Security Assessment,” Power Systems Conference and Exposi-tion, 2004. IEEE PES 10-13 Oct. 2004, pp. 1676 – 1680, vol.3.
[8-6] Morison, K., “On-line Dynamic Security Assessment Using Intelligent Sys-tems,” IEEE Power Engineering Society General Meeting, 2006.
[8-7] Huang, J.A.; Valette, A.; Beaudoin, M.; Morison, K.; Moshref, A.; Provencher, M.; Sun, J., “An Intelligent System for Advanced Dynamic Security Assess-ment,” Power System Technology, 2002. Proceedings. PowerCon 2002. Interna-tional Confe ence on Volume 1, 13-17 Oct. 2002, pp. 220 – 224, vol.1.
[8-8] IEEE Guide for Monitoring, Information Exchange, and Control of Distributed Resources Interconnected with Electric Power Systems, IEEE Standards Coor-dinating Committee 21 Sponsored by the IEEE Standards Coordinating Commit-tee 21 on Fuel Cells, Photovoltaics, Dispersed Generation, and Energy Storage IEEE Std 1547.3™-2007.

References
125
[8-9] IEC 61850 for power system communication Brunner, C.; Transmission and Distribution Conference and Exposition, 2008. T&D. IEEE/PES 21-24 April 2008, pp. 1 - 6.

127
A PAPER FOR BORNHOLM ISLAND OPERATION
Frequency Analysis for Planned Island op-eration in the Danish Distribution System –
Bornholm
Abstract - The power system in Danish island Bornholm is a distribution system with a high penetration of wind generation, which is representative for future power systems. During the period from 11th to 14th September 2007, Distribution System Operator (DSO) Østkraft in Bornholm conducted a planned island operation test. To evaluate the test and achieve useful experience for future similar operations in Bornholm or even in other systems, the frequency data before, during and after this period, were recorded by Phasor Measurement Units (PMUs), supplied by Centre for Electric Technology (CET), Technical University of Denmark (DTU). Statistical analysis of frequency data has been performed and the results reveal that the frequency quality during the islanding period was significantly decreased, indicating the need for enhancing frequency control of such systems in the future.

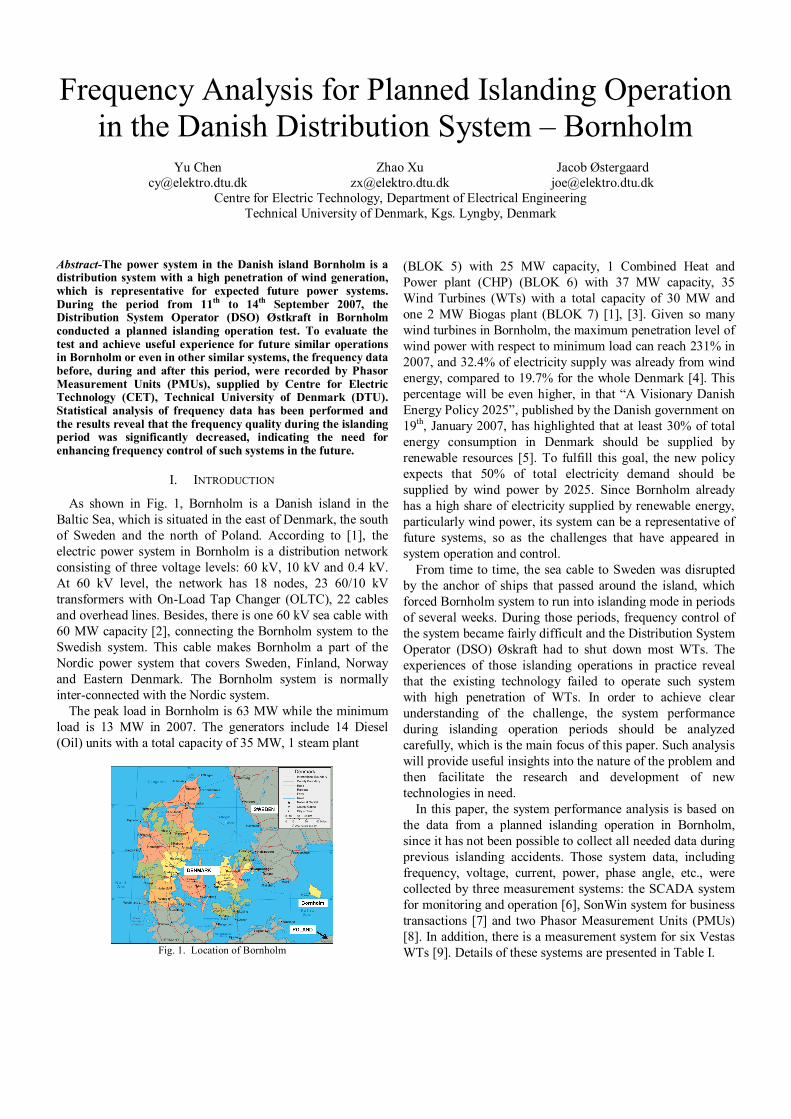
Frequency Analysis for Planned Islanding Operation in the Danish Distribution System – Bornholm
Yu Chen
[email protected] Zhao Xu
[email protected] Jacob Østergaard
[email protected] Centre for Electric Technology, Department of Electrical Engineering
Technical University of Denmark, Kgs. Lyngby, Denmark
Abstract-The power system in the Danish island Bornholm is a distribution system with a high penetration of wind generation, which is representative for expected future power systems. During the period from 11th to 14th September 2007, the Distribution System Operator (DSO) Østkraft in Bornholm conducted a planned islanding operation test. To evaluate the test and achieve useful experience for future similar operations in Bornholm or even in other similar systems, the frequency data before, during and after this period, were recorded by Phasor Measurement Units (PMUs), supplied by Centre for Electric Technology (CET), Technical University of Denmark (DTU). Statistical analysis of frequency data has been performed and the results reveal that the frequency quality during the islanding period was significantly decreased, indicating the need for enhancing frequency control of such systems in the future.
I. INTRODUCTION
As shown in Fig. 1, Bornholm is a Danish island in the Baltic Sea, which is situated in the east of Denmark, the south of Sweden and the north of Poland. According to [1], the electric power system in Bornholm is a distribution network consisting of three voltage levels: 60 kV, 10 kV and 0.4 kV. At 60 kV level, the network has 18 nodes, 23 60/10 kV transformers with On-Load Tap Changer (OLTC), 22 cables and overhead lines. Besides, there is one 60 kV sea cable with 60 MW capacity [2], connecting the Bornholm system to the Swedish system. This cable makes Bornholm a part of the Nordic power system that covers Sweden, Finland, Norway and Eastern Denmark. The Bornholm system is normally inter-connected with the Nordic system.
The peak load in Bornholm is 63 MW while the minimum load is 13 MW in 2007. The generators include 14 Diesel (Oil) units with a total capacity of 35 MW, 1 steam plant
Fig. 1. Location of Bornholm
(BLOK 5) with 25 MW capacity, 1 Combined Heat and Power plant (CHP) (BLOK 6) with 37 MW capacity, 35 Wind Turbines (WTs) with a total capacity of 30 MW and one 2 MW Biogas plant (BLOK 7) [1], [3]. Given so many wind turbines in Bornholm, the maximum penetration level of wind power with respect to minimum load can reach 231% in 2007, and 32.4% of electricity supply was already from wind energy, compared to 19.7% for the whole Denmark [4]. This percentage will be even higher, in that “A Visionary Danish Energy Policy 2025”, published by the Danish government on 19th, January 2007, has highlighted that at least 30% of total energy consumption in Denmark should be supplied by renewable resources [5]. To fulfill this goal, the new policy expects that 50% of total electricity demand should be supplied by wind power by 2025. Since Bornholm already has a high share of electricity supplied by renewable energy, particularly wind power, its system can be a representative of future systems, so as the challenges that have appeared in system operation and control.
From time to time, the sea cable to Sweden was disrupted by the anchor of ships that passed around the island, which forced Bornholm system to run into islanding mode in periods of several weeks. During those periods, frequency control of the system became fairly difficult and the Distribution System Operator (DSO) Øskraft had to shut down most WTs. The experiences of those islanding operations in practice reveal that the existing technology failed to operate such system with high penetration of WTs. In order to achieve clear understanding of the challenge, the system performance during islanding operation periods should be analyzed carefully, which is the main focus of this paper. Such analysis will provide useful insights into the nature of the problem and then facilitate the research and development of new technologies in need.
In this paper, the system performance analysis is based on the data from a planned islanding operation in Bornholm, since it has not been possible to collect all needed data during previous islanding accidents. Those system data, including frequency, voltage, current, power, phase angle, etc., were collected by three measurement systems: the SCADA system for monitoring and operation [6], SonWin system for business transactions [7] and two Phasor Measurement Units (PMUs) [8]. In addition, there is a measurement system for six Vestas WTs [9]. Details of these systems are presented in Table I.
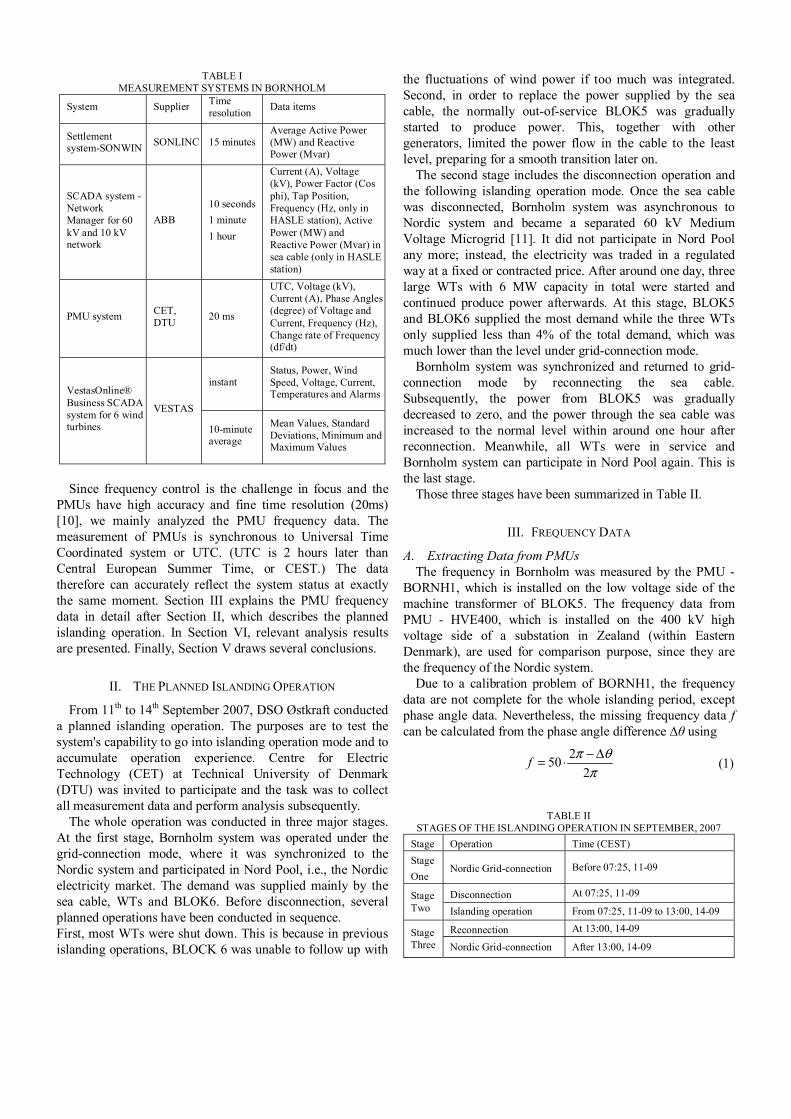
TABLE I MEASUREMENT SYSTEMS IN BORNHOLM
System Supplier Time resolution Data items
Settlement system-SONWIN SONLINC 15 minutes
Average Active Power (MW) and Reactive Power (Mvar)
SCADA system - Network Manager for 60 kV and 10 kV network
ABB 10 seconds 1 minute 1 hour
Current (A), Voltage (kV), Power Factor (Cos phi), Tap Position, Frequency (Hz, only in HASLE station), Active Power (MW) and Reactive Power (Mvar) in sea cable (only in HASLE station)
PMU system CET, DTU 20 ms
UTC, Voltage (kV), Current (A), Phase Angles (degree) of Voltage and Current, Frequency (Hz), Change rate of Frequency (df/dt)
VestasOnline® Business SCADA system for 6 wind turbines
VESTAS
instant Status, Power, Wind Speed, Voltage, Current, Temperatures and Alarms
10-minute average
Mean Values, Standard Deviations, Minimum and Maximum Values
Since frequency control is the challenge in focus and the
PMUs have high accuracy and fine time resolution (20ms) [10], we mainly analyzed the PMU frequency data. The measurement of PMUs is synchronous to Universal Time Coordinated system or UTC. (UTC is 2 hours later than Central European Summer Time, or CEST.) The data therefore can accurately reflect the system status at exactly the same moment. Section III explains the PMU frequency data in detail after Section II, which describes the planned islanding operation. In Section VI, relevant analysis results are presented. Finally, Section V draws several conclusions.
II. THE PLANNED ISLANDING OPERATION
From 11th to 14th September 2007, DSO Østkraft conducted a planned islanding operation. The purposes are to test the system's capability to go into islanding operation mode and to accumulate operation experience. Centre for Electric Technology (CET) at Technical University of Denmark (DTU) was invited to participate and the task was to collect all measurement data and perform analysis subsequently.
The whole operation was conducted in three major stages. At the first stage, Bornholm system was operated under the grid-connection mode, where it was synchronized to the Nordic system and participated in Nord Pool, i.e., the Nordic electricity market. The demand was supplied mainly by the sea cable, WTs and BLOK6. Before disconnection, several planned operations have been conducted in sequence. First, most WTs were shut down. This is because in previous islanding operations, BLOCK 6 was unable to follow up with
the fluctuations of wind power if too much was integrated. Second, in order to replace the power supplied by the sea cable, the normally out-of-service BLOK5 was gradually started to produce power. This, together with other generators, limited the power flow in the cable to the least level, preparing for a smooth transition later on.
The second stage includes the disconnection operation and the following islanding operation mode. Once the sea cable was disconnected, Bornholm system was asynchronous to Nordic system and became a separated 60 kV Medium Voltage Microgrid [11]. It did not participate in Nord Pool any more; instead, the electricity was traded in a regulated way at a fixed or contracted price. After around one day, three large WTs with 6 MW capacity in total were started and continued produce power afterwards. At this stage, BLOK5 and BLOK6 supplied the most demand while the three WTs only supplied less than 4% of the total demand, which was much lower than the level under grid-connection mode.
Bornholm system was synchronized and returned to grid-connection mode by reconnecting the sea cable. Subsequently, the power from BLOK5 was gradually decreased to zero, and the power through the sea cable was increased to the normal level within around one hour after reconnection. Meanwhile, all WTs were in service and Bornholm system can participate in Nord Pool again. This is the last stage.
Those three stages have been summarized in Table II.
III. FREQUENCY DATA
A. Extracting Data from PMUs The frequency in Bornholm was measured by the PMU -
BORNH1, which is installed on the low voltage side of the machine transformer of BLOK5. The frequency data from PMU - HVE400, which is installed on the 400 kV high voltage side of a substation in Zealand (within Eastern Denmark), are used for comparison purpose, since they are the frequency of the Nordic system.
Due to a calibration problem of BORNH1, the frequency data are not complete for the whole islanding period, except phase angle data. Nevertheless, the missing frequency data f can be calculated from the phase angle difference ∆θ using
(1)
TABLE II STAGES OF THE ISLANDING OPERATION IN SEPTEMBER, 2007
Stage Operation Time (CEST) Stage One
Nordic Grid-connection Before 07:25, 11-09
Stage Two
Disconnection At 07:25, 11-09
Islanding operation From 07:25, 11-09 to 13:00, 14-09
Stage Three
Reconnection At 13:00, 14-09
Nordic Grid-connection After 13:00, 14-09
πθπ
2250 Δ−⋅=f
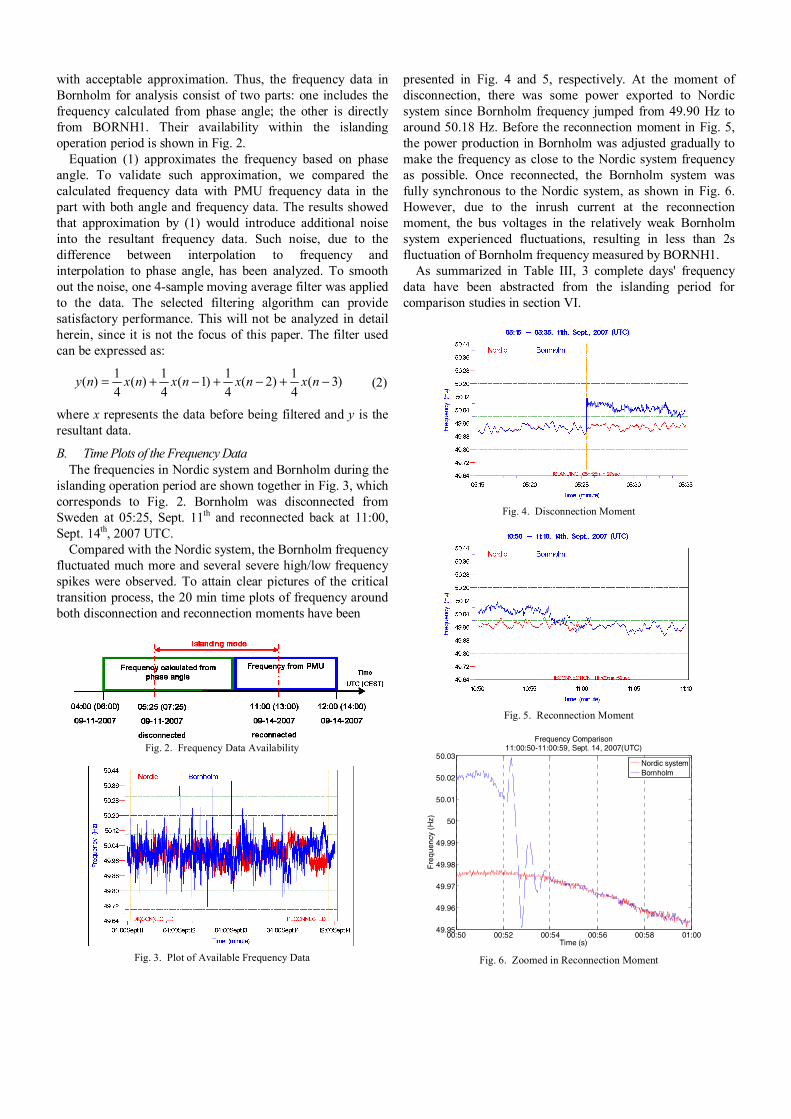
with acceptable approximation. Thus, the frequency data in Bornholm for analysis consist of two parts: one includes the frequency calculated from phase angle; the other is directly from BORNH1. Their availability within the islanding operation period is shown in Fig. 2.
Equation (1) approximates the frequency based on phase angle. To validate such approximation, we compared the calculated frequency data with PMU frequency data in the part with both angle and frequency data. The results showed that approximation by (1) would introduce additional noise into the resultant frequency data. Such noise, due to the difference between interpolation to frequency and interpolation to phase angle, has been analyzed. To smooth out the noise, one 4-sample moving average filter was applied to the data. The selected filtering algorithm can provide satisfactory performance. This will not be analyzed in detail herein, since it is not the focus of this paper. The filter used can be expressed as:
(2)
where x represents the data before being filtered and y is the resultant data.
B. Time Plots of the Frequency Data The frequencies in Nordic system and Bornholm during the
islanding operation period are shown together in Fig. 3, which corresponds to Fig. 2. Bornholm was disconnected from Sweden at 05:25, Sept. 11th and reconnected back at 11:00, Sept. 14th, 2007 UTC.
Compared with the Nordic system, the Bornholm frequency fluctuated much more and several severe high/low frequency spikes were observed. To attain clear pictures of the critical transition process, the 20 min time plots of frequency around both disconnection and reconnection moments have been
Fig. 2. Frequency Data Availability
Fig. 3. Plot of Available Frequency Data
presented in Fig. 4 and 5, respectively. At the moment of disconnection, there was some power exported to Nordic system since Bornholm frequency jumped from 49.90 Hz to around 50.18 Hz. Before the reconnection moment in Fig. 5, the power production in Bornholm was adjusted gradually to make the frequency as close to the Nordic system frequency as possible. Once reconnected, the Bornholm system was fully synchronous to the Nordic system, as shown in Fig. 6. However, due to the inrush current at the reconnection moment, the bus voltages in the relatively weak Bornholm system experienced fluctuations, resulting in less than 2s fluctuation of Bornholm frequency measured by BORNH1.
As summarized in Table III, 3 complete days' frequency data have been abstracted from the islanding period for comparison studies in section VI.
Fig. 4. Disconnection Moment
Fig. 5. Reconnection Moment
00:50 00:52 00:54 00:56 00:58 01:0049.95
49.96
49.97
49.98
49.99
50
50.01
50.02
50.03
Time (s)
Fre
quen
cy (
Hz)
Frequency Comparison11:00:50-11:00:59, Sept. 14, 2007(UTC)
Nordic systemBornholm
Fig. 6. Zoomed in Reconnection Moment
)3(41)2(
41)1(
41)(
41)( −+−+−+= nxnxnxnxny
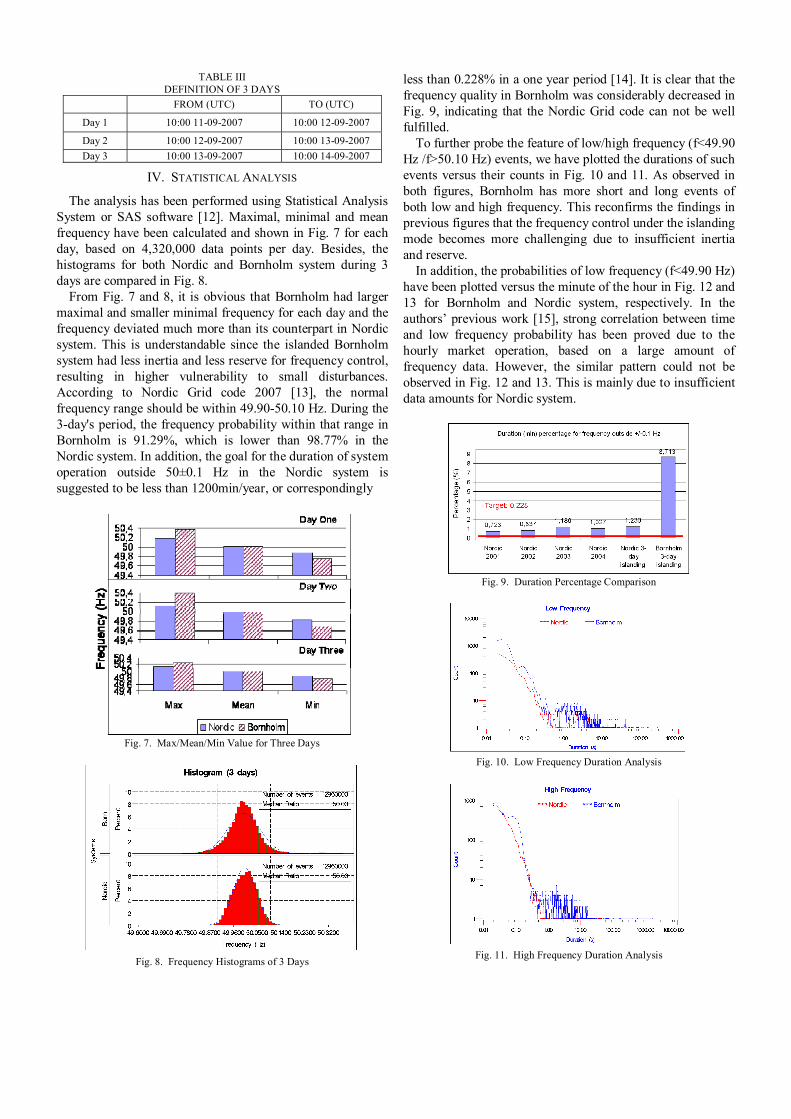
TABLE III DEFINITION OF 3 DAYS
FROM (UTC) TO (UTC)
Day 1 10:00 11-09-2007 10:00 12-09-2007
Day 2 10:00 12-09-2007 10:00 13-09-2007 Day 3 10:00 13-09-2007 10:00 14-09-2007
IV. STATISTICAL ANALYSIS
The analysis has been performed using Statistical Analysis System or SAS software [12]. Maximal, minimal and mean frequency have been calculated and shown in Fig. 7 for each day, based on 4,320,000 data points per day. Besides, the histograms for both Nordic and Bornholm system during 3 days are compared in Fig. 8.
From Fig. 7 and 8, it is obvious that Bornholm had larger maximal and smaller minimal frequency for each day and the frequency deviated much more than its counterpart in Nordic system. This is understandable since the islanded Bornholm system had less inertia and less reserve for frequency control, resulting in higher vulnerability to small disturbances. According to Nordic Grid code 2007 [13], the normal frequency range should be within 49.90-50.10 Hz. During the 3-day's period, the frequency probability within that range in Bornholm is 91.29%, which is lower than 98.77% in the Nordic system. In addition, the goal for the duration of system operation outside 50±0.1 Hz in the Nordic system is suggested to be less than 1200min/year, or correspondingly
Fig. 7. Max/Mean/Min Value for Three Days
Fig. 8. Frequency Histograms of 3 Days
less than 0.228% in a one year period [14]. It is clear that the frequency quality in Bornholm was considerably decreased in Fig. 9, indicating that the Nordic Grid code can not be well fulfilled.
To further probe the feature of low/high frequency (f<49.90 Hz /f>50.10 Hz) events, we have plotted the durations of such events versus their counts in Fig. 10 and 11. As observed in both figures, Bornholm has more short and long events of both low and high frequency. This reconfirms the findings in previous figures that the frequency control under the islanding mode becomes more challenging due to insufficient inertia and reserve.
In addition, the probabilities of low frequency (f<49.90 Hz) have been plotted versus the minute of the hour in Fig. 12 and 13 for Bornholm and Nordic system, respectively. In the authors’ previous work [15], strong correlation between time and low frequency probability has been proved due to the hourly market operation, based on a large amount of frequency data. However, the similar pattern could not be observed in Fig. 12 and 13. This is mainly due to insufficient data amounts for Nordic system.
Fig. 9. Duration Percentage Comparison
Fig. 10. Low Frequency Duration Analysis
Fig. 11. High Frequency Duration Analysis
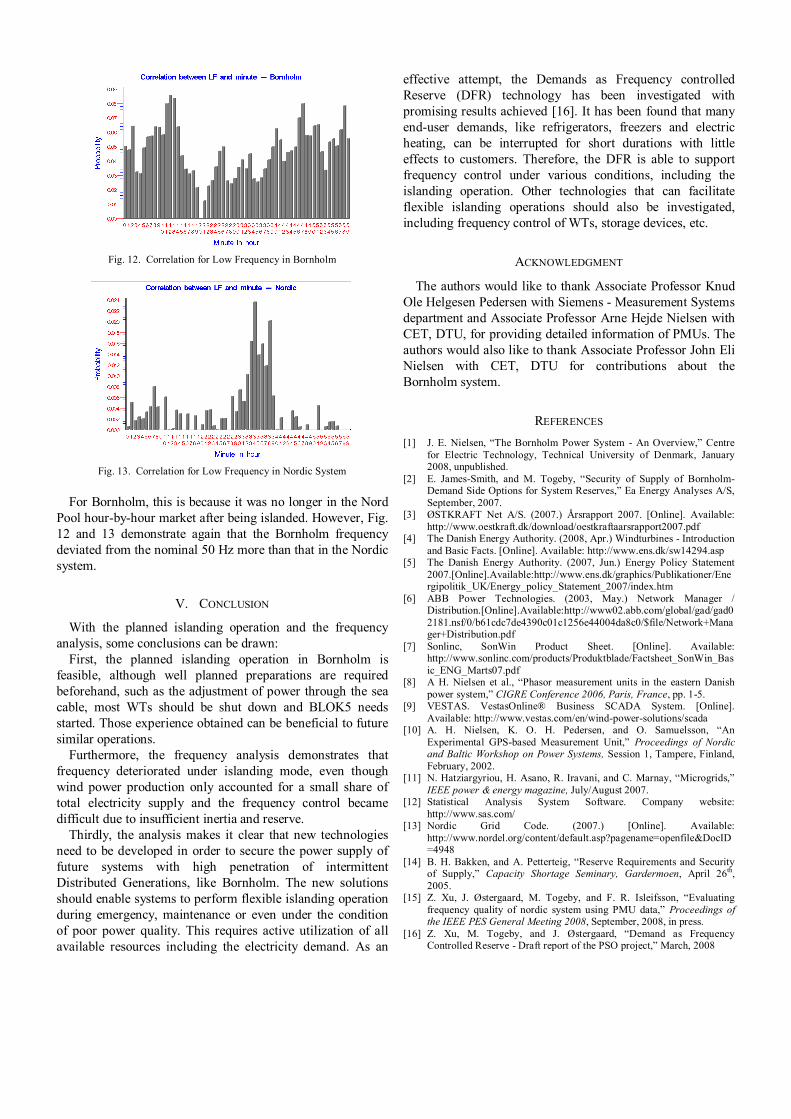
Fig. 12. Correlation for Low Frequency in Bornholm
Fig. 13. Correlation for Low Frequency in Nordic System
For Bornholm, this is because it was no longer in the Nord
Pool hour-by-hour market after being islanded. However, Fig. 12 and 13 demonstrate again that the Bornholm frequency deviated from the nominal 50 Hz more than that in the Nordic system.
V. CONCLUSION
With the planned islanding operation and the frequency analysis, some conclusions can be drawn:
First, the planned islanding operation in Bornholm is feasible, although well planned preparations are required beforehand, such as the adjustment of power through the sea cable, most WTs should be shut down and BLOK5 needs started. Those experience obtained can be beneficial to future similar operations.
Furthermore, the frequency analysis demonstrates that frequency deteriorated under islanding mode, even though wind power production only accounted for a small share of total electricity supply and the frequency control became difficult due to insufficient inertia and reserve.
Thirdly, the analysis makes it clear that new technologies need to be developed in order to secure the power supply of future systems with high penetration of intermittent Distributed Generations, like Bornholm. The new solutions should enable systems to perform flexible islanding operation during emergency, maintenance or even under the condition of poor power quality. This requires active utilization of all available resources including the electricity demand. As an
effective attempt, the Demands as Frequency controlled Reserve (DFR) technology has been investigated with promising results achieved [16]. It has been found that many end-user demands, like refrigerators, freezers and electric heating, can be interrupted for short durations with little effects to customers. Therefore, the DFR is able to support frequency control under various conditions, including the islanding operation. Other technologies that can facilitate flexible islanding operations should also be investigated, including frequency control of WTs, storage devices, etc.
ACKNOWLEDGMENT
The authors would like to thank Associate Professor Knud Ole Helgesen Pedersen with Siemens - Measurement Systems department and Associate Professor Arne Hejde Nielsen with CET, DTU, for providing detailed information of PMUs. The authors would also like to thank Associate Professor John Eli Nielsen with CET, DTU for contributions about the Bornholm system.
REFERENCES [1] J. E. Nielsen, “The Bornholm Power System - An Overview,” Centre
for Electric Technology, Technical University of Denmark, January 2008, unpublished.
[2] E. James-Smith, and M. Togeby, “Security of Supply of Bornholm-Demand Side Options for System Reserves,” Ea Energy Analyses A/S, September, 2007.
[3] ØSTKRAFT Net A/S. (2007.) Årsrapport 2007. [Online]. Available: http://www.oestkraft.dk/download/oestkraftaarsrapport2007.pdf
[4] The Danish Energy Authority. (2008, Apr.) Windturbines - Introduction and Basic Facts. [Online]. Available: http://www.ens.dk/sw14294.asp
[5] The Danish Energy Authority. (2007, Jun.) Energy Policy Statement 2007.[Online].Available:http://www.ens.dk/graphics/Publikationer/Energipolitik_UK/Energy_policy_Statement_2007/index.htm
[6] ABB Power Technologies. (2003, May.) Network Manager / Distribution.[Online].Available:http://www02.abb.com/global/gad/gad02181.nsf/0/b61cdc7de4390c01c1256e44004da8c0/$file/Network+Manager+Distribution.pdf
[7] Sonlinc, SonWin Product Sheet. [Online]. Available: http://www.sonlinc.com/products/Produktblade/Factsheet_SonWin_Basic_ENG_Marts07.pdf
[8] A H. Nielsen et al., “Phasor measurement units in the eastern Danish power system,” CIGRE Conference 2006, Paris, France, pp. 1-5.
[9] VESTAS. VestasOnline® Business SCADA System. [Online]. Available: http://www.vestas.com/en/wind-power-solutions/scada
[10] A. H. Nielsen, K. O. H. Pedersen, and O. Samuelsson, “An Experimental GPS-based Measurement Unit,” Proceedings of Nordic and Baltic Workshop on Power Systems, Session 1, Tampere, Finland, February, 2002.
[11] N. Hatziargyriou, H. Asano, R. Iravani, and C. Marnay, “Microgrids,” IEEE power & energy magazine, July/August 2007.
[12] Statistical Analysis System Software. Company website: http://www.sas.com/
[13] Nordic Grid Code. (2007.) [Online]. Available: http://www.nordel.org/content/default.asp?pagename=openfile&DocID=4948
[14] B. H. Bakken, and A. Petterteig, “Reserve Requirements and Security of Supply,” Capacity Shortage Seminary, Gardermoen, April 26th, 2005.
[15] Z. Xu, J. Østergaard, M. Togeby, and F. R. Isleifsson, “Evaluating frequency quality of nordic system using PMU data,” Proceedings of the IEEE PES General Meeting 2008, September, 2008, in press.
[16] Z. Xu, M. Togeby, and J. Østergaard, “Demand as Frequency Controlled Reserve - Draft report of the PSO project,” March, 2008

129
B PAPER FOR ISLANDING DATA ANALYSIS
PMU Frequency Data Processing for A Planned Island operation in Bornholm
Abstract-Because of the predictable higher penetration of distributed wind power and Combined Heat and Power (CHP) plants in Denmark, it is considered feasible to utilize those Distributed Generations (DGs) for planned island operation of distribution net-works due to either a disturbance or fault in the upstream grid or an interconnection maintenance. However, at present, island operation of a system with many Wind Tur-bines (WTs) like the Danish island Bornholm has been found difficult in reality. In or-der to obtain adequate operation experience for island operation, and perform detailed analysis afterwards, the local Distribution System Operator (DSO) Østkraft conducted a planned island operation from September 11th. 2007 to 14th. 2007 in Bornholm. During the island operation, the important system data were measured and collected using PMU and other measurement equipments. Since PMU offers well synchronized measurement data, such as system frequency and bus voltages, with high time resolution, their meas-urement data were utilized mainly to analyze the island operation. This paper describes the problems and provides proposals for PMU data processing procedure to ensure that the improved frequency data are acceptable for statistical analysis. The proposed data processing procedure is described and evaluated. This paper also provides a reference for future PMU data acquisition and processing.

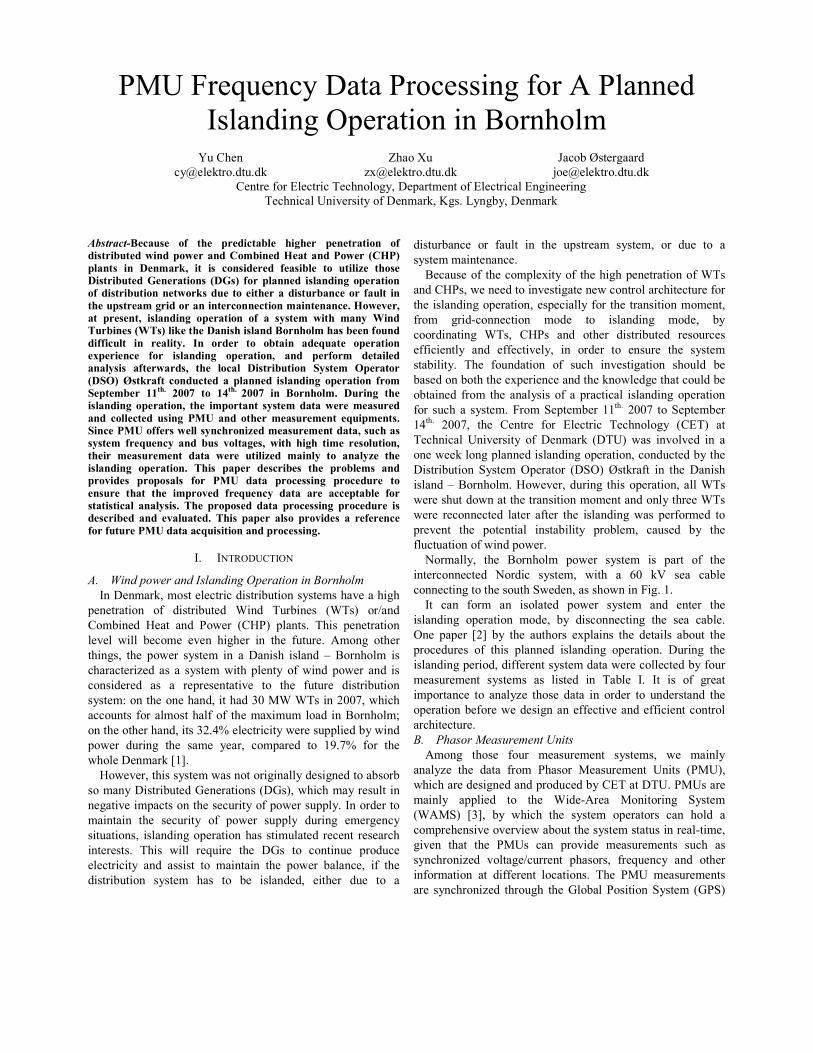
������������ ��������������������������
���������������������������������
������
�� ���!���"��"�!�
#����$�
%& ���!���"��"�!�
'���(�)����������
*�� ���!���"��"�!�
����������+��������,��������-� ������������+����������+��������
,����������.���������� ����!-�/��"�0��(�-� ����!��
������������������ �� ��� � ��������� ����� � ���� ����� ����� ����������� ���� �������������������������� ������������� ��� ����� ��� �� ��� ������� ��� �������� �� ������� �������� ������ ���� ������ ������ � � �������� ���������� ��� ���������� ����������� ������������� ��� ���� ������� ����� ��������� ����� ���� ������� �������������������� �����!� ���� � ������ ���������� ��� ����� �� �� �"���� ���� ���"� # ����$� �������# $��������������������������� ��������������������������� ��� ����" � %�� � �� � �� ������ ���&���� ��� ������'�� ������ � � ���������� ��� ������ ���� �� � �� ������������"���� �� �� ���� ��� ������ ��� ������� ("���� )�� �� ���()�� *�� �� ��������� �� �������� ���������� ��� ����� ���(������ � ++� � ,--.� �� +/� � ,--.� ��� �� ����� � �� ���� ������������� ��� ������ ��� ���� ��� �"���� ���� �� �� ����� ������� ��������� ������ �0 1� ���� ��� � ����� ����� �&������� �(������0 1��� ��������"��� ������������ �������������������"���� �&����"� ���� ���� !�������� ���� ����� ���� ������������� � ����� ����� ���� �� �� �������� �����"� �� ����"��� ������������� ��� ���� � $���� ���� � ���� ����� ��� � ������� ����� �!����� � �������� � � �0 1� ���� � ��������� � ����� �� ������ �� ��� ��� ��� �!��� �&����"� ���� � �� ���������� � ���������� ����"��� � $��� � ������� ���� � ��������� � ����� �� ������� ����� ���� �!������ � $���� ���� � ����� � �!����� �� �� ������ ��� ���0 1�������&������������� �������� ��
�"� �1,2� ��,��1�
��� ��������� ������ ���������� ��������������
�� ����!-���������������������(��������������.���������
���������� ��� ������(���� 3 ��� ,�(���� 43,�5� ��6���
���(���� 7���� ��� ��8��� 4�7�5� �����"� ,���� ����������
��.��� 8���� (������ �.�� ������� �� ���� ����"� ����� ������
�����-� ���� ��8��� ������� �� �� ����� ������ 9� �������� ���
����������%��� ��� �� �������8���� ������ ���8��� ��8��� ��� ���
���������� ��� �� �����������.�� ��� ���� ����� ������(����
������:�������������-��������;<��3 �3,����=<<>-�8�����
������� ������������������� ������&������������������?�
���������������-�����;="@A�������������8������������(��8���
��8��� ����� ���� ����� ����-� ��������� ��� BC">A� ���� ����
8����� ����!�DBE"��
7�8�.��-�������������8����������������������������(���(�
������� �����(����F���������4 F�5-�8�����������������
�����.�����������������������������8��������"������������
������� ���� �������� ��� ��8��� ������ ����� ���������
��������-� ��������������������� ���������� ������ ���������
��������"� ,���� 8���� ������� ���� F�� ��� ������ �������
������������ ��� ������� ��� ������� ���� ��8��� (�����-� ��� ����
������(���� ������� ���� ��� (�� �������-� ������� ��� ��� ��
�����(���� ��� ����� �� ���� �������� ������-� ��� ��� ��� ��
���������������"��
���������� ����������&�����������������������������3,��
����7��-�8����������.����������8������������������������
���� ����������������-����������������������������������-�
����� ����G�������� ����� ��� �������� ����-� (��
����������� 3,�-� �7��� ��� ������ ������(���� ���������
����������� ��� �������.���-� �� ������ ��� ����� ���� �������
���(�����"� ,��� �������� ��� ���� �.���������� ������ (��
(�������(���������&���������������!�8����������������(��
�(������ ����� ���� �������� ��� �� ���������� �������� ���������
���� ���� �� ������"� �����H�����(���BB��"� =<<>� ���H�����(���
B@��"� =<<>-� ���� ������ ���� +�������� ,��������� 4�+,5� ���
,����������.������� ��� ����!� 4 ,�5�8��� �.��.��� �� ��
���8��!���������������������������-���������(������
�����(���� H��������������� 4 H�5�)��!����� �� ���� �����
������9��������"�7�8�.��-������ �������������-�����3,��
8����������8������������������������������������3,��
8���� ���������������� ������ ���� ��������8��� ���������� ���
���.��� ���� ��������� ����(������ ���(���-� ������ (�� ����
������������8�����8��"�
1�������-� ���� �������� ��8��� ������� ��� ����� ��� ����
������������ 1������ ������-� 8���� �� I<� !J� ���� ��(���
��������������������H8���-�������8������"�B"��
��� ��� ����� �� ��������� ��8��� ������� ��� ����� ����
�������� ��������� ����-� (�� ����������� ���� ���� ��(��"�
��� ������ D=E�(�� ���� ������� �&������ ���� �������� �(��� ����
���������� ��� ����� ������ �������� ��������"� ���� ����
��������������-����������������������8��������������(������
���������� �������� ��� ������� �� ,�(��� �"� ��� ��� ��� ������
���������� ��� ����%�� ������ ����� �� ������ ��� �������� ����
���������(������8�����������������.���������������������
�����������"��
��� �� ����� ���������������
����� ������ ���� ���������� �������-� 8�� ������
����%�� ���� ����� ����� ������� ���������� ����� 4���5-�
8����������������������������(���+,���� ,�"����������
������ �������� ��� ���� 3 ���G����� ��������� H������
43��H5� D;E-� (�� 8����� ���� ������� ���������� ��� ����� ��
����������.���.��.��8��(��������������������������G����-�
��.�� ����� ���� ����� ��� ���.���� ����������� ���� ���
�������%��� .������6������ �������-� �������� ��� ������
���������� ��� ��������� ��������"� ,��� ���� �����������
���� �������%��� ������� ����F��(�����������H������ 4F�H5�
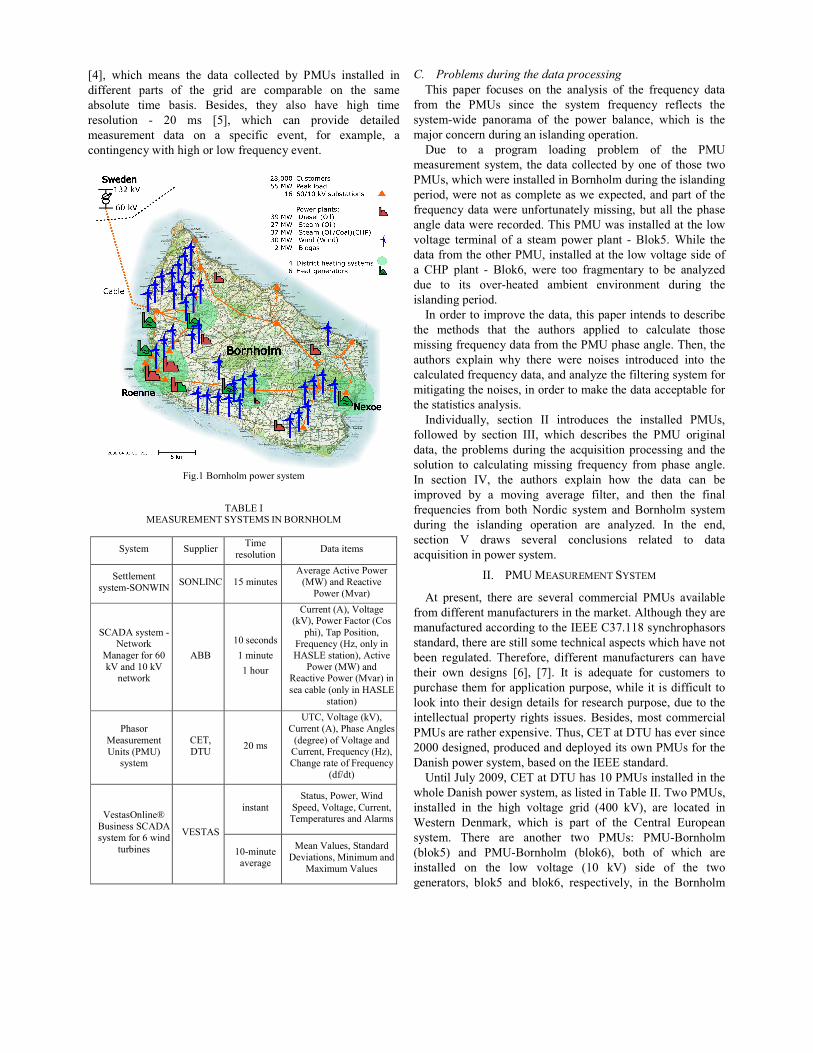
D@E-� 8����� ����� ���� ����� ���������� (�� ����� ��������� ��
��������� ������ ��� ���� ����� ���� �������(��� �� ���� �����
�(������ ����� (����"� �������-� ����� ����� ��.�� ����� �����
��������� G� =<� ��� DKE-� 8����� ��� ���.���� ���������
���������� ����� �� �� ��������� �.��-� ���� �&�����-� ��
���������8��������������8����������.��"�
�
����"B�����������8����������
�
,��0+����+�H�2+�+1,�H�H,+�H��1���217�0��
�
H������ H�������,����
��������� ����������
H���������
������GH�13 �1�H�10�1�� BK�������
�.����������.����8���
4�3 5����2�����.��
��8���4�.��5�
H�� ���������G�1��8��!�
�����������I<�
!J����B<�!J���8��!�
����
B<��������
B������
B�����
������4�5-�J�������4!J5-���8����������4����
���5-�,����������-�
��������47%-�������
7�H0+�������5-�����.��
��8���4�3 5����2�����.����8���4�.��5���
������(���4������7�H0+�
������5�
�������
����������
�����4���5��������
�+,-�
,��=<����
�,�-�J�������4!J5-�
������4�5-�������������
4������5����J���������������-���������47%5-�
����������������������
4��6��5�
������
H����-���8��-�3 ���
H����-�J������-������-�,���������������������J���������L�
�������H�� ��
�����������I�8���
��(����
J+H,�H�
B<G������.������
����J����-�H�������
�.������-����������
��&����J�����
��� �������������������� � �����������
,���� ������ ������� �� ���� �������� ��� ���� �������� �����
����� ���� ����� ����� ���� ������� �������� ��������� ����
������G8���� �������� ��� ���� ��8��� (�����-� 8����� ��� ����
��*��������������������������������"�
�� ��� �� �������� ������� ���(���� ��� ���� ����
���������� ������-� �������������������(�� ��� ��� ������ �8��
����-�8�����8����������������������������������������
������-�8����������������������8���&������-����������������
�������������8��������������������-�(����������������
����������8������������"�,��������8���������������������8�
.������� �������� ��� �� ������ ��8��� ����� G� ���!K"�3 ����� ����
�����������������������-�������������������8�.���������������
�� �7�� ����� G� ���!I-� 8���� ���� ����������� ��� (�� ����%���
��� ��� ���� �.��G������� ��(���� �.������� ����� ����
��������������"��
����������������.����������-���������������������������(��
���� �������� ����� ���� ������� �������� ��� ��������� ������
�������������������������������������������"�,��-�����
������� �&����� 8��� ������ 8���� ������ ��������� ���� ����
����������������������-��������%��������������������������
�������������������-��������������!������������������(�������
����������������������"�
���.������-� ������� ��� ��������� ���� ��������� ����-�
�����8��� (�� ������� ���-� 8����� ������(��� ���� ���� ��������
����-� �������(���������� ���� �������������������� ��� ����
������� ��� ���������� ������� �������� ����� ������ ����"�
�� ������� �J-� ���� ������� �&����� ��8� ���� ����� ��� (��
�����.��� (�� �� ��.��� �.������ ������-� ��� ���� ���� �����
���������� �����(����1������ ������� ��� �������� �������
����� ���� �������� ��������� ���� ����%��"� �� ���� ��-�
������� J� ���8�� ��.����� ��������� �������� ��� �����
��������������8���������"�
��"� �����+�H�2+�+1,�H�H,+��
��� ������-� ������ ���� ��.����� ����������� ����� �.����(���
����������������������������������!��"������������������
���������������������������+++��;>"BBM���������������
�������-���������������������������������������8�������.�����
(��� ��������"� ,��������-� �������������������� ��� ��.��
������ �8� ������� DIE-� D>E"� ��� ��� �������� ���� ��������� ���
����������������������������������-�8�������������������� ���
���!��������������������������������������������-�����������
�������������������� ������� �����"��������-�����������������
�����������������&����.�"�,��-��+,���� ,�������.��������
=<<<��������-��������������������������8��������������
�������8���������-�(������������+++��������"��
�����'���=<<C-��+,���� ,������B<���������������������
8����� �������8���������-�������������,�(�����"�,8������-�
��������� �� ���� ����� .������� ����� 4@<<� !J5-� ���� �������� ��
3 ������ ����!-� 8����� ��� ����� ��� ���� ������� +������
������"� ,����� ���� ������� �8�� ����:� ���G��������
4(��!K5� ��� ���G�������� 4(��!I5-� (���� ��� 8����� ����
��������� �� ���� ��8� .������� 4B<� !J5� ����� ��� ���� �8��
���������-� (��!K� ��� (��!I-� ��������.���-� �� ���� ��������
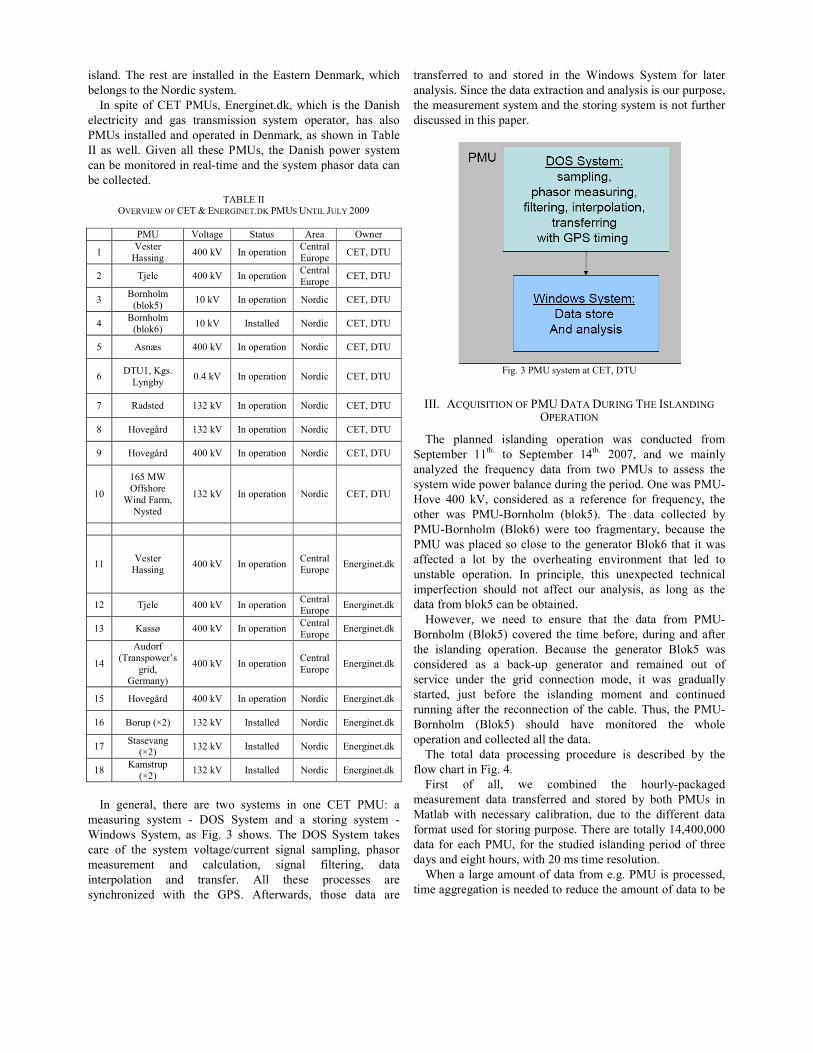
�����"�,��� ����� ���� ��������� �� ����+������ ����!-�8�����
(�������������1������������"�
�� ������ ����+,�����-�+������"�!-�8����� ��� ���� �����
������������ ��� ���� ����������� ������� ��������-� ���� �����
���������������������������� ����!-�������8���,�(���
��� ���8���"�F�.�� ���� ������ ����-� ���� ����� ��8��� �������
���(�����������������G����������������������������������
(�����������"�
,��0+�����J+2J�+3 �����+,�N�+1+2F�1+," /����H��1,�0�'�0��=<<C�
�
� ���� J������� H����� ����� �8���
B�J������
7������@<<�!J� �����������
�������
+������+,-� ,��
=� ,*���� @<<�!J� ������������������
+������+,-� ,��
;���������
4(��!K5�B<�!J� ����������� 1������ �+,-� ,��
@���������4(��!I5�
B<�!J� ��������� 1������ �+,-� ,��
K� ��O�� @<<�!J� ����������� 1������ �+,-� ,��
I� ,�B-�/��"�
0��(��<"@�!J� ����������� 1������ �+,-� ,��
>� 2������� B;=�!J� ����������� 1������ �+,-� ,��
M� 7�.��P��� B;=�!J� ����������� 1������ �+,-� ,��
C� 7�.��P��� @<<�!J� ����������� 1������ �+,-� ,��
B<�
BIK��3 �
���������
3 �������-�
1������
B;=�!J� ����������� 1������ �+,-� ,��
� � � � � �
BB�J������
7������@<<�!J� �����������
�������
+�����+������"�!�
B=� ,*���� @<<�!J� ������������������+�����
+������"�!�
B;� /���Q� @<<�!J� ������������������
+�����+������"�!�
B@�
������
4,�����8��R��
����-�F�����5�
@<<�!J� ������������������
+�����+������"�!�
BK� 7�.��P��� @<<�!J� ����������� 1������ +������"�!�
BI� �����4S=5� B;=�!J� ��������� 1������ +������"�!�
B>�H����.���
4S=5�B;=�!J� ��������� 1������ +������"�!�
BM�/�������
4S=5�B;=�!J� ��������� 1������ +������"�!�
�
�� ������-� ������ ���� �8�� �������� �� ��� �+,� ���:� ��
�������� ������� G� �H� H������ ��� �� ������� ������� G�
3 ���8�� H�����-� ��� ���"� ;� ���8�"� ,��� �H� H������ ��!���
����� ��� ���� ������� .������6������ ������ �������-� �������
���������� ��� ���������-� ������ ��������-� �����
������������ ��� �������"� ���� ������ ���������� ����
�������%��� 8���� ���� F�H"� �����8����-� ������ ����� ����
����������� ��� ��� ������� �� ���� 3 ���8�� H������ ���� ������
�������"�H��������������&�������������������������������-�
�������������������������������������������������������
���������������������"��
�
����"�;����������������+,-� ,��
�
���"� ��T��H�,��1�������� �,�� �2�1F�,7+��H0�1 �1F���+2�,��1�
,��� ������ �������� ��������� 8��� �������� �����
H�����(��� BB��"� ��� H�����(��� B@
��"� =<<>-� ��� 8�� ������
����%��� ���� �������� ����� ����� �8�� ����� ��� ������� ����
�������8������8���(���������������������"����8������G
7�.�� @<<� !J-� ���������� ��� �� ��������� ���� �������-� ����
������ 8��� ���G�������� 4(��!K5"� ,��� ����� ���������� (��
���G�������� 4���!I5� 8���� ���� ����������-� (������ ����
����8������������������� ��� ����������������!I� ����� ���8���
��������� �� ���� (�� ���� �.��������� �.������� ����� ���� ���
���(��� ��������"� �� ��������-� ����� �&������� ���������
������������ ������ ��� ������� ��� �������-� ��� ���� ��� ����
����������(��!K����(���(�����"�
7�8�.��-� 8�� ���� ��� ����� ����� ���� ����� ����� ���G
�������� 4���!K5� ��.����� ���� �����(�����-� ����� ��� ������
���� �������� ��������"� ������� ���� ��������� ���!K� 8���
���������� ��� �� (��!G�� ��������� ��� �������� ��� ���
���.���� ���� ���� ����� �������� ����-� ��� 8��� ���������
�������-� *��� (������ ���� �������� ������ ��� �������
���������� ���� ������������� ������(��"�,��-� �������G
�������� 4���!K5� ������ ��.�� ��������� ���� 8�����
����������������������������������"��
,��� ������ ����� ���������� ��������� ��� ������(��� (�� ����
���8������������"�@"�
������ ��� ���-� 8�� ���(���� ���� �����G���!�����
���������� ����� ����������� ��� ������� (�� (���� ����� ��
�����(�8���� ��������� ����(�����-� ��� ��� ���� ��������� �����
����������������������������"�,�����������������B@-@<<-<<<�
����� ������������-� ���� ���� ������� ������������������ ������
������������������-�8����=<�����������������"��
3 ������������������������������"�"�����������������-�
������������������������������������������������������(��
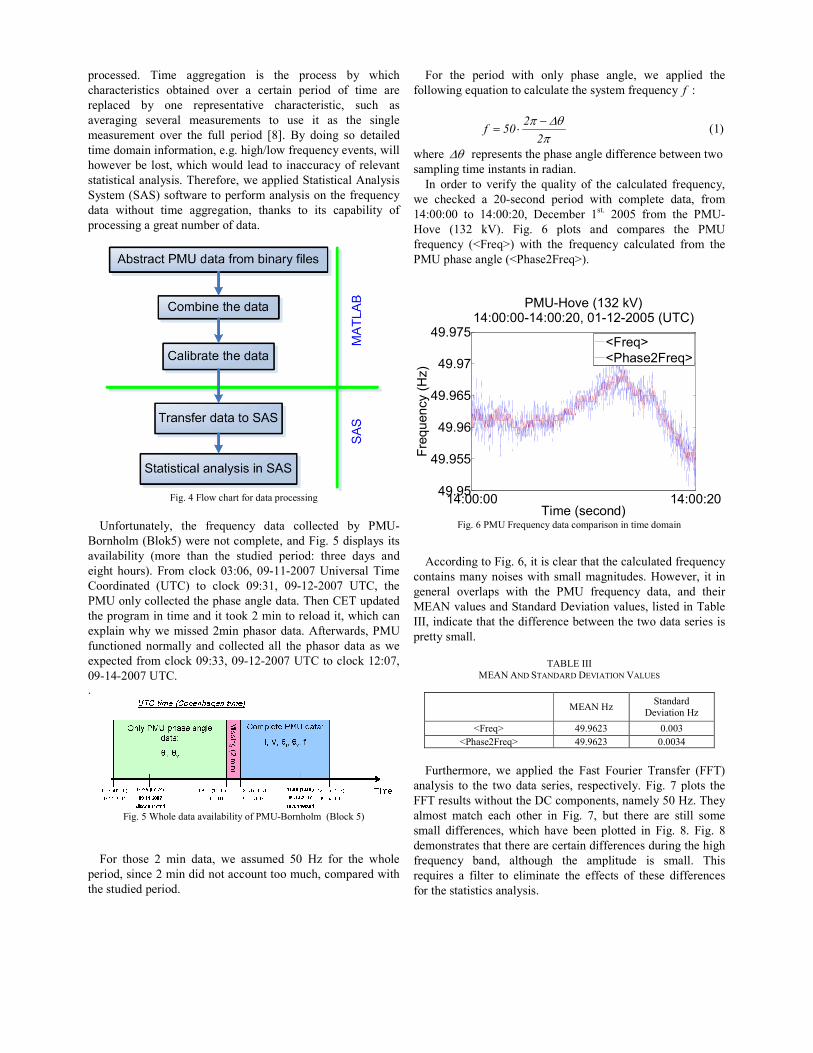
���������"� ,���� ����������� ��� ���� �������� (�� 8�����
���������������� �(������ �.��� �� ������� ������� ��� ����� ����
��������� (�� ��� �����������.�� ��������������-� ���� ���
�.������� ��.����� ����������� ��� ��� ��� ��� ���� ������
���������� �.��� ���� ���� ������� DME"� ��� ����� ��� ���������
��������������������-��"�"�����6��8����������.���-�8����
��8�.���(������-�8�����8������������ ����������������.���
�������������������"�,��������-�8����������H�������������������
H������4H�H5�����8������������������������� ������������
����� 8������ ����� ����������-� ���!�� ��� ���� ����(������ ���
�������������������(����������"�
�
����"�@����8��������������������������
�
����������-� ���� �������� ����� ���������� (�� ���G
��������4���!K5�8���������������-�������"�K��������������
�.����(������ 4����� ���� ���� ������� ������:� ������ ����� ���
������ ����5"� ���������!�<;:<I-� <CGBBG=<<>���.������,����
����������� 4�,�5� ��� ����!� <C:;B-� <CGB=G=<<>� �,�-� ����
�������������������������������������"�,����+,��������
����������������������������!�=����������������-�8��������
�&�����8���8���������=��������������"������8����-�����
�������� �������� ��� ���������� ���� ���� ������� ����� ���8��
�&����������������!�<C:;;-�<CGB=G=<<>��,���������!�B=:<>-�
<CGB@G=<<>��,�"�"�
����"�K�3 �����������.����(������������G���������4����!�K5�
�
�
���� ������ =� ��� ����-� 8�� ������� K<� 7%� ���� ���� 8�����
������-������=������������������������-����������8����
�����������������"�
���� ���� ������� 8���� ���� ������ ����-� 8�� �������� ����
�����8���������������������������������������� � :�
�
����������������������
���
�
� !�
��� � �������������������������������������4B5�
8����� �� ������������������������������������(��8����8��
���������������������������"�
�� ������ ��� .������ ���� ������� ��� ���� ���������� �������-�
8�� ����!��� �� =<G������ ������� 8���� ��������� ����-� �����
B@:<<:<<� ��� B@:<<:=<-� ����(��� B��"� =<<K� ����� ���� ���G
7�.�� 4B;=� !J5"� ���"� I� ������ ��� ��������� ���� ����
�������� 4U����V5� 8���� ���� �������� ���������� ����� ����
���������������4U�����=����V5"�
��
�������� ������������
����
����
����
�����
�����
� �������������������������������������������������
���������� !�
"#�$%� �&���'�
�
�
("#�$)
(�*+���"#�$)
����"�I�����������������������������������������
�
�
���������������"�I-����������������������������������������
�����������������8���� ��������������"�7�8�.��-� ��� ��
������� �.������� 8���� ���� ���� �������� ����-� ��� ������
�+�1�.��������H������� �.������.����-����������,�(���
���-����������������������������(��8��������8�����������������
������������"��
,��0+�����
�+�1��1 �H,�1 �2 � +J��,��1�J�0�+H�
�
� �+�1�7%�H�������
�.������7%�
U����V� @C"CI=;� <"<<;�
U�����=����V� @C"CI=;� <"<<;@�
�
����������-� 8�� �������� ���� ����� ������� ,������� 4��,5�
�������� ��� ���� �8�� ����� ������-� ��������.���"� ���"� >� ������ ����
��,��������8���������� ����������-�������K<�7%"�,����
������� ������ ����� ������ �� ���"� >-� (�� ������ ���� ������ �����
������ ����������-�8����� ��.��(��� �������� �� ���"� M"� ���"� M�
�����������������������������������������������������������
�������� (��-� �������� ���� ��������� ��� �����"� ,����
�������� �� ������� ��� ��������� ���� �������� ��� ������ �����������
��������������������������"�
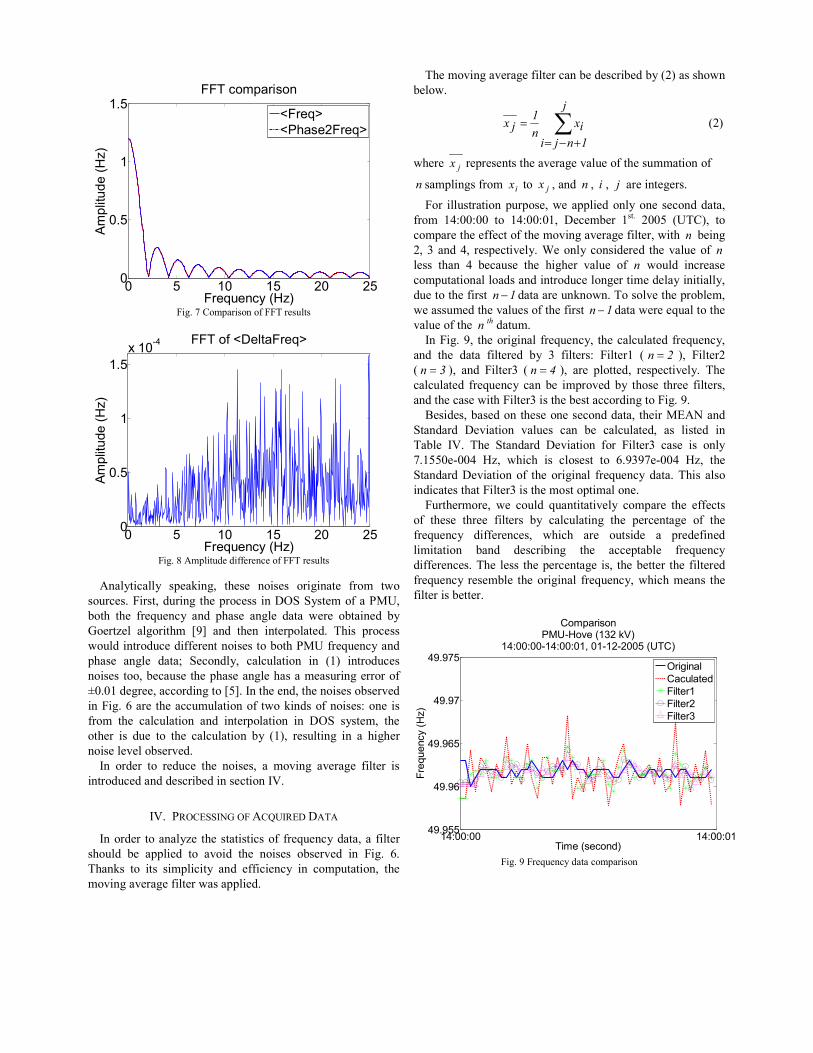
�
� �� � �� ��
��
�
��""�����,+#���
"#�$%� �&���'�
-�,.�/%!����'�
�
�
("#�$)
(�*+���"#�$)
����"�>����������������,��������
�
� �� � �� ��
��
�
��
0����� ""���1�(2�./+"#�$)
"#�$%� �&���'�
-�,.�/%!����'�
����"�M�������������������������,��������
�
������������ ����!��-� ������ ������ ��������� ����� �8��
������"������-������������������ �� �H�H��������������-�
(���� ���� �������� ��� ������ ����� ����� 8���� �(������ (��
F����%��� ���������� DCE� ��� ���� �����������"� ,���� ��������
8������������������������������(�������������������
������ ����� ����?� H������-� ���������� �� 4B5� ���������
������ ���-�(������ ��������������������������������������
W<"<B�������-�������������DKE"���������-������������(���.���
�����"�I����� ������������������8��!������������:�������
����� ���� ���������� ��� ������������ �� �H� ������-� ����
������ ��� ��� ��� ���� ���������� (�� 4B5-� �������� �� �� �������
�������.����(���.��"�
�� ������ ��� ������ ���� �����-� �� ��.��� �.������ ������� ���
������������������(�������������J"�
�
�J"� �2��+HH�1F������T��2+ � �,��
�������� �������%�������������������� ������������-��� �������
������ (�� �������� ��� �.���� ���� ������ �(���.��� �� ���"� I"�
,��!�� ��� ���� ����������� ��� ���������� �� ���������-� ����
��.����.�������������8����������"�
,�����.����.����������������(��������(���(��4=5�������8�
(���8"�
���������������������������� ����
�
"
#�"�
�$�
#"$ ��������������������������������������4=5�
8����� "$ ���������������.������.����������������������
� �������������� �$ ���� "$ -���� � -� � -� " ������������"�
���� �����������������-�8���������������������������-�
����� B@:<<:<<� ��� B@:<<:<B-� ����(��� B��"� =<<K� 4�,�5-� ���
����������������������������.����.������������-�8���� � �(����
=-�;����@-� ��������.���"�3 ���������������� ����.������� � �
����� ���� @� (������ ���� ������� .���� ��� � �8���� ��������
������������������������������������������������������-�
���������������� #� � ���������!�8"�,�����.���������(���-�
8�������������.������������������ #� � �����8����������������
.����������� ��������"��
�����"�C-� �������������������-� ���������������������-�
��� ���� ����� ��������� (�� ;� �������:� ������B� 4 �� � 5-� ������=�
4 %� � 5-� ��� ������;� 4 &� � 5-� ���� �������-� ��������.���"� ,���
���������� �������� ���(�� �����.���(�� ������ ������ �������-�
������������8����������;��������(�������������������"�C"�
�������-�(������� �������������������-��������+�1����
H������� �.������ .����� ��� (�� ���������-� ��� ������� ��
,�(��� �J"� ,��� H������� �.������ ���� ������;� ����� ��� ����
>"BKK<�G<<@� 7%-� 8����� ��� �������� ��� I"C;C>�G<<@� 7%-� ����
H������� �.������ ��� ���� �������� �������� ����"�,���� �����
��������������������;�����������������������"�
����������-� 8�� ����� ��������.���� �������� ���� ��������
��� ������ ������ �������� (�� ���������� ���� ���������� ��� ����
�������� ����������-� 8����� ���� ������� �� ����������
���������� (��� ������(��� ���� �������(��� ��������
����������"�,�������� �������������� ��-� ����(������ �������������
�������� �����(��� ������������ �������-�8���������� ����
����������(�����"��
�
�������� ������������
����
����
�����
�����
���,+#��� � ���������������
����������������������������������
���������� !�
"#�$%� �&���'�
�
�
3#�4� +.
�+�%.+/�!
"�./�#�
"�./�#�
"�./�#�
����"�C������������������������
�
��
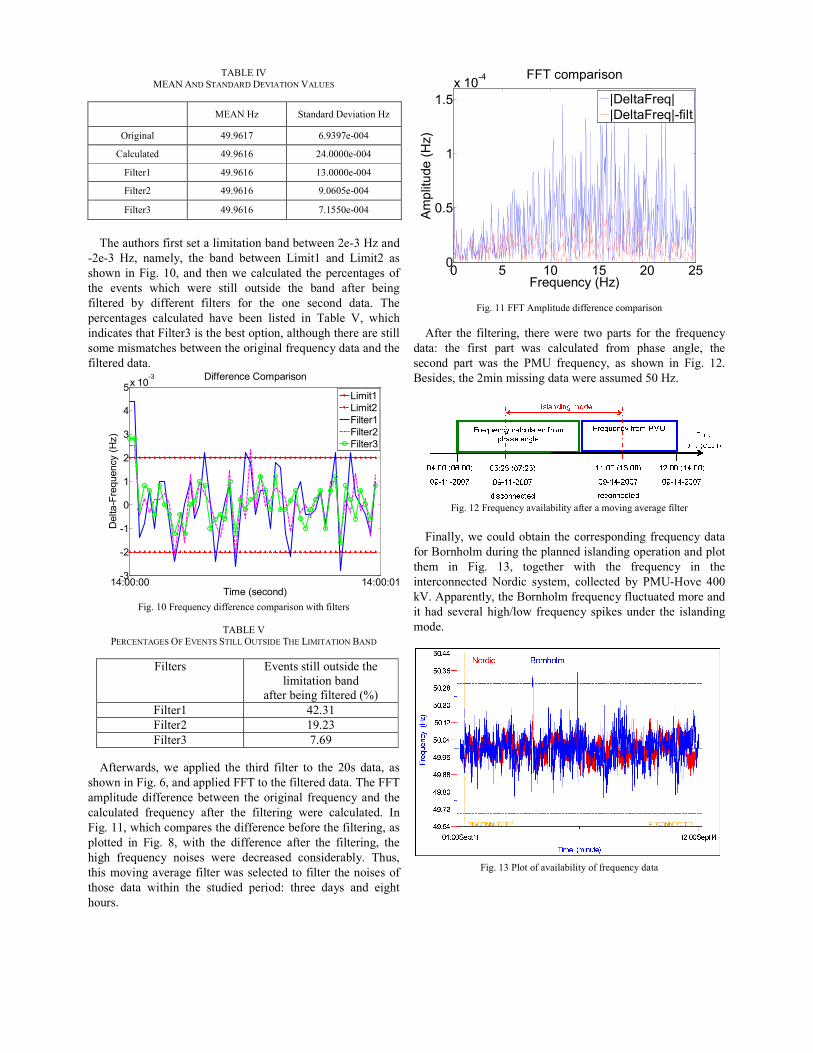
,��0+��J�
�+�1��1 �H,�1 �2 � +J��,��1�J�0�+H�
�
� �+�1�7%� H������� �.������7%�
�������� @C"CIB>� I"C;C>�G<<@�
���������� @C"CIBI� =@"<<<<�G<<@�
������B� @C"CIBI� B;"<<<<�G<<@�
������=� @C"CIBI� C"<I<K�G<<@�
������;� @C"CIBI� >"BKK<�G<<@�
�
,��������������������������������(���(��8���=�G;�7%����
G=�G;� 7%-� �����-� ���� (��� (��8��� 0����B� ��� 0����=� ���
���8� �����"� B<-���� ����8������������ ������������������
���� �.���� 8����� 8���� ������ ������� ���� (��� ������ (����
��������� (�� ��������� �������� ���� ���� ��� ������ ����"� ,���
����������� ���������� ��.�� (��� ������� �� ,�(��� J-� 8�����
��������������������;��������(���������-�������������������������
����������������(��8�����������������������������������
�������������"�
�������� ����������
��
��
�
�
�
�
�
0���
�� 2�11�#� ������,+#���
���������� !�
2�./+�"#�$%� �&���'�
�
�
5���/�
5���/�
"�./�#�
"�./�#�
"�./�#�
����"�B<�����������������������������8������������
�
,��0+�J��+2�+1,�F+H����+J+1,H�H,�00���,H� +�,7+�0���,�,��1���1 �
�
�������� +.���������������������
����������(���
������(�������������4A5�
������B� @=";B�
������=� BC"=;�
������;� >"IC��
�����8����-�8�� �������� ���� ������ ������� ��� ���� =<�� ����-� ���
���8������"�I-��������������,���������������������"�,�����,�
�������������������(��8��� ������������ �������� ��� ����
���������� �������� ������ ���� ��������� 8���� ���������"� ��
���"�BB-�8����������������������������(������������������-����
�������� �� ���"� M-� 8���� ���� ���������� ������ ���� ��������-� ����
����� �������� ������ 8���� ���������� ��������(��"� ,��-�
�������.����.�������������8�����������������������������������
������ ����� 8����� ���� ������� ������:� ������ ����� ��� ������
����"�
� �� � �� ��
��
�
��
0����� ""�����,+#���
"#�$%� �&���'�
-�,.�/%!����'�
�
�
62�./+"#�$6
62�./+"#�$6�1�./
��
���"�BB���,�������������������������������
������ ���� ��������-� ������8���� �8�� ������ ���� ���� ��������
����:� ���� ������ ����� 8��� ���������� ����� ������ ����-� ����
������ ����� 8��� ���� ���� �������-� ��� ���8� �� ���"� B="�
�������-�����=���������������8�����������K<�7%"�
�
����"�B=����������.����(����������������.����.�������������
�
������-�8��������(���� �����������������������������
����������������������������������������������������
����� �� ���"� B;-� ��������� 8���� ���� �������� �� ����
������������ 1������ ������-� ���������� (�� ���G7�.�� @<<�
!J"����������-��������������������������������������
���������.���������6��8��������� ���!������� ���� ��������
����"�
�
����"�B;����������.����(����������������������
�
�
J"� ��1�0�H��1�
������ �� ���� �������� ������(��� �� ����� �����-� ��.�����
��������� �������� ���� ���� ����� ���������� ��� (��
���8"��
,�����������������������������������������������������
.����-� ��.�� ���� ���.���� ���������� �� �������� ��� �����
�������������"�,����8�������.����������������������������
�������� ����� ���������� �� ���� �����8��� ��������������
���������������&���"�,��-�8�����������������������������
��� ������� �������� ��� ����%�� ���� ������� ������� ��8���
(�����-� ����� ���� ���������� �������� ������ ��������� ����
������R�� ����������-� �.�� ������ ������ ���� ������
��������"��
����������-�����.����.������ ������� ������(���������� ���
����������������������������������������������������������
����"�7�8�.��-�8������� ��� ��� �������(������ ��-� ������� ��
8����� ������� ��� �������� ��� �������"� ��� �� ����� ��������� ���
���������-� ������� �� �������� ������� ������ (�� �������� ��� ����
�����(������ ��� ���� ���� ���������� ������� ������ (��
�����"�
������-��������������������������������������8���������
�������������8�����8��-�������8������������������������
.�������� ����� ���� �������� ��������� ���� ���� ��������
8����� ������ 8��� �� ��� ������� 8��� ��8��"� ,��� �.������
���������������������(�����������������������������
���� �������� ��������� ���� ���� �������� 8���� �� �����
������������.������8�����8��"�
2+�+2+1�+H�
DBE� ,��� �����+�������������"�4=<<M-����"5�3 ����(����G�������������������������"�D����E"��.����(��:�����:66888"��"�!6�8B@=C@"����
D=E� �"����-�#"�$-� ��� '"�)���������-�X�������� �������� ���� ����������������������������� ����� �����(����H������9��������-Y�������"� @;��� ����������� ��.��������� ��8��� +�������� ��������-�����.�-������-�BG@�H�����(���=<<M"�
D;E� ��(���� 0���(!�-� +���� H�����%-� ��� H����� ������-� X,����� ����+��������F���-Y�����2�.��8�@6=<<M"�
D@E� ���� 7�*��� 1�����-� /�� ���� 7������� ������-� ��� �����H�������-� X�� +&���������� F�HG(����� ���������� ���-Y������������ ��� 1������ ��� ������� 3 ��!����� �� ��8��� H������-�,������-������-���(�����@GK�=<<="�
DKE� ���� 7"� 1�����-� /"�"7"�������-� '"2������-� '"7�.�����-�H-/"����-�����"'Q�����-�X����������������������������+������ �������8���H�����-Y���F2+�=<<I"�
DIE� �+++���8���+��������H������-�X�+++�H�����������H�������������������8���H������-Y��+++�H����;>"BBM,�G=<<K"�
D>E� '������� ���(���-� J�������� �����-� ���F"� ����!�-� ����������������-� X���������.�� ,������ ��� H������%��� ������� ��������������-Y��+++6�+H�F������������-� �.��-���-�'��=<<@"�
DME� ����� 7"'"� �����-� ��� ����� �"7"� F-� H����� ���������� ��� ��8���T������ ����(����-������:� '���3 �����N� H��-� ��"-� =<<I-� �;BCG;=="�
DCE� ���� J"� ��������-� ��� 2����� 3 "� H������-� �������G����� H��������������-��H�:��������G7���-���"-�BCMC-��KMKGKM>"�
�

131
C PAPER FOR ARCHITECTURE DESIGN
Control Mechanism and Security Region for Intentional Islanding Transition
Abstract--This paper investigates the control mechanism for intentional islanding transi-tion, when a Low Voltage (LV) or Medium Voltage (MV) distribution system, which is usually under grid connection mode, is supposed to be separated from the upstream grid, due to either maintenance or a disturbance in the grid. The concept of Islanding Security Region (ISR) has been proposed as an organic composition of the developed control mechanism. The purpose of this control mechanism is to maintain the frequency stability and eventually the security of power supply to the customers, by utilizing re-sources from generation and demand sides. The control mechanism can be extended to consider the distributed generations like wind power and other innovative technologies such as the Demand as Frequency controlled Reserve (DFR) technique in the future.

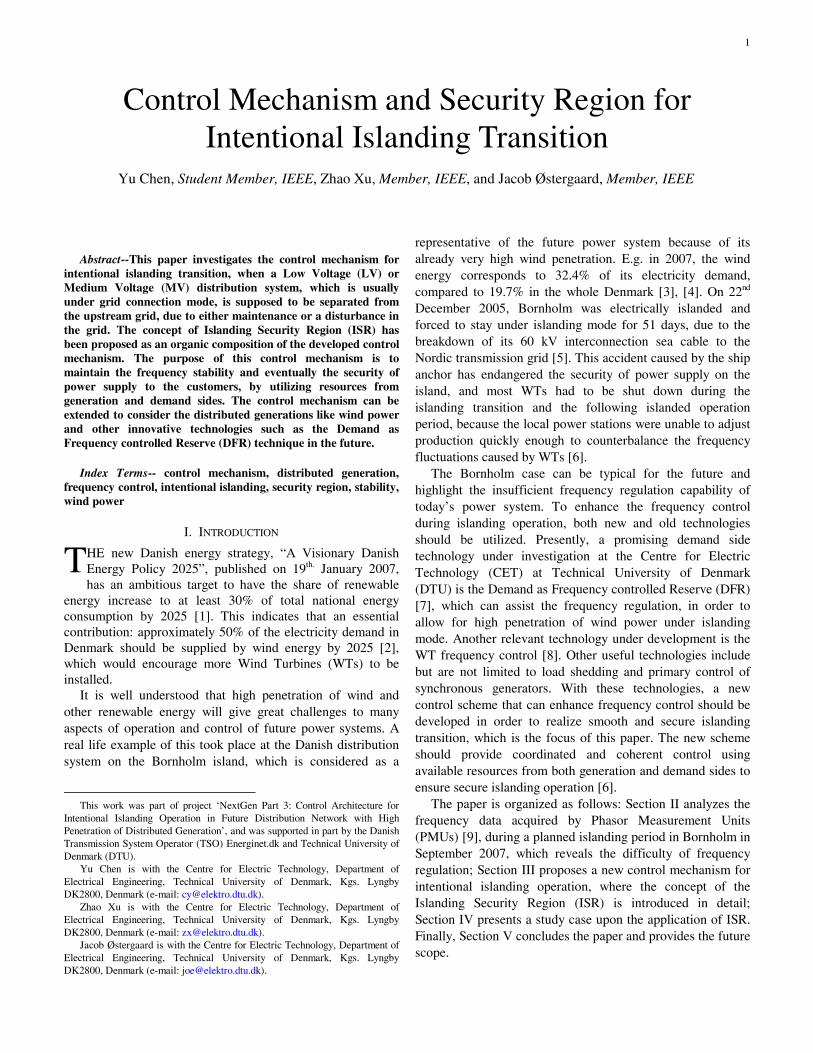
1
Abstract--This paper investigates the control mechanism for
intentional islanding transition, when a Low Voltage (LV) or Medium Voltage (MV) distribution system, which is usually under grid connection mode, is supposed to be separated from the upstream grid, due to either maintenance or a disturbance in the grid. The concept of Islanding Security Region (ISR) has been proposed as an organic composition of the developed control mechanism. The purpose of this control mechanism is to maintain the frequency stability and eventually the security of power supply to the customers, by utilizing resources from generation and demand sides. The control mechanism can be extended to consider the distributed generations like wind power and other innovative technologies such as the Demand as Frequency controlled Reserve (DFR) technique in the future.
Index Terms-- control mechanism, distributed generation, frequency control, intentional islanding, security region, stability, wind power
I. INTRODUCTION
HE new Danish energy strategy, “A Visionary Danish Energy Policy 2025”, published on 19th. January 2007, has an ambitious target to have the share of renewable
energy increase to at least 30% of total national energy consumption by 2025 [1]. This indicates that an essential contribution: approximately 50% of the electricity demand in Denmark should be supplied by wind energy by 2025 [2], which would encourage more Wind Turbines (WTs) to be installed.
It is well understood that high penetration of wind and other renewable energy will give great challenges to many aspects of operation and control of future power systems. A real life example of this took place at the Danish distribution system on the Bornholm island, which is considered as a
This work was part of project ‘NextGen Part 3: Control Architecture for
Intentional Islanding Operation in Future Distribution Network with High Penetration of Distributed Generation’, and was supported in part by the Danish Transmission System Operator (TSO) Energinet.dk and Technical University of Denmark (DTU).
Yu Chen is with the Centre for Electric Technology, Department of Electrical Engineering, Technical University of Denmark, Kgs. Lyngby DK2800, Denmark (e-mail: [email protected]).
Zhao Xu is with the Centre for Electric Technology, Department of Electrical Engineering, Technical University of Denmark, Kgs. Lyngby DK2800, Denmark (e-mail: [email protected]).
Jacob Østergaard is with the Centre for Electric Technology, Department of Electrical Engineering, Technical University of Denmark, Kgs. Lyngby DK2800, Denmark (e-mail: [email protected]).
representative of the future power system because of its already very high wind penetration. E.g. in 2007, the wind energy corresponds to 32.4% of its electricity demand, compared to 19.7% in the whole Denmark [3], [4]. On 22nd December 2005, Bornholm was electrically islanded and forced to stay under islanding mode for 51 days, due to the breakdown of its 60 kV interconnection sea cable to the Nordic transmission grid [5]. This accident caused by the ship anchor has endangered the security of power supply on the island, and most WTs had to be shut down during the islanding transition and the following islanded operation period, because the local power stations were unable to adjust production quickly enough to counterbalance the frequency fluctuations caused by WTs [6].
The Bornholm case can be typical for the future and highlight the insufficient frequency regulation capability of today’s power system. To enhance the frequency control during islanding operation, both new and old technologies should be utilized. Presently, a promising demand side technology under investigation at the Centre for Electric Technology (CET) at Technical University of Denmark (DTU) is the Demand as Frequency controlled Reserve (DFR) [7], which can assist the frequency regulation, in order to allow for high penetration of wind power under islanding mode. Another relevant technology under development is the WT frequency control [8]. Other useful technologies include but are not limited to load shedding and primary control of synchronous generators. With these technologies, a new control scheme that can enhance frequency control should be developed in order to realize smooth and secure islanding transition, which is the focus of this paper. The new scheme should provide coordinated and coherent control using available resources from both generation and demand sides to ensure secure islanding operation [6].
The paper is organized as follows: Section II analyzes the frequency data acquired by Phasor Measurement Units (PMUs) [9], during a planned islanding period in Bornholm in September 2007, which reveals the difficulty of frequency regulation; Section III proposes a new control mechanism for intentional islanding operation, where the concept of the Islanding Security Region (ISR) is introduced in detail; Section IV presents a study case upon the application of ISR. Finally, Section V concludes the paper and provides the future scope.
Control Mechanism and Security Region for Intentional Islanding Transition
Yu Chen, Student Member, IEEE, Zhao Xu, Member, IEEE, and Jacob Østergaard, Member, IEEE
T
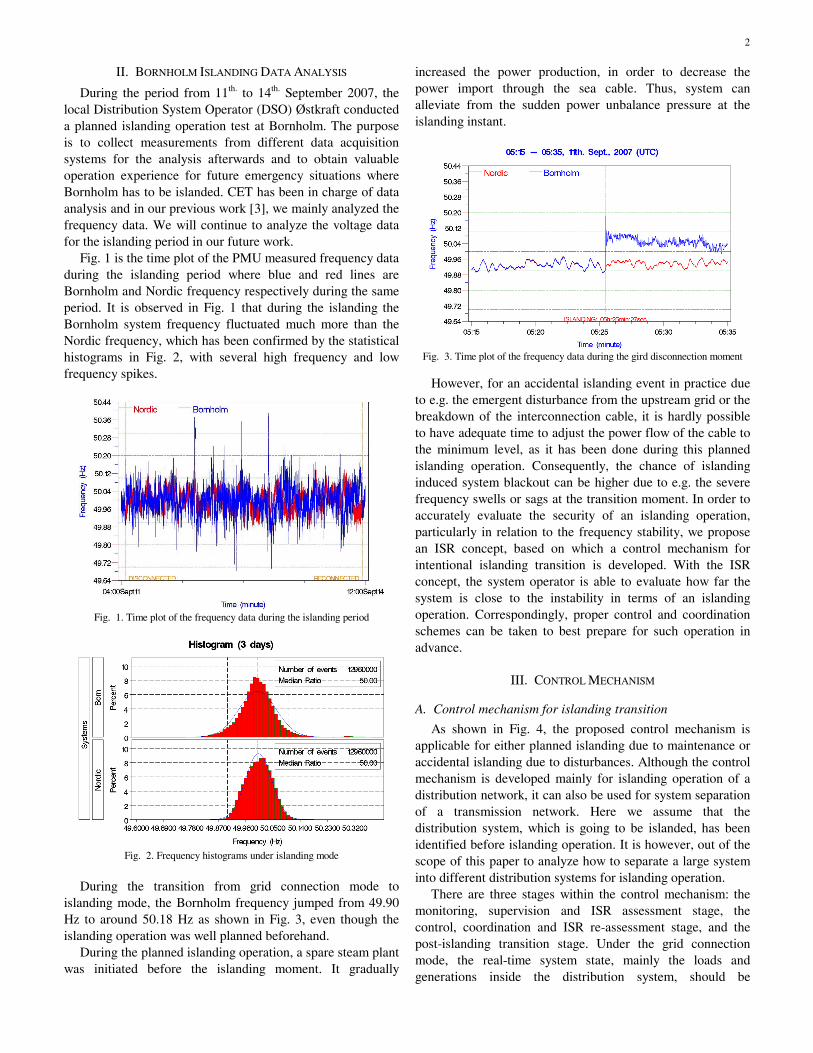
2
II. BORNHOLM ISLANDING DATA ANALYSIS
During the period from 11th. to 14th. September 2007, the local Distribution System Operator (DSO) Østkraft conducted a planned islanding operation test at Bornholm. The purpose is to collect measurements from different data acquisition systems for the analysis afterwards and to obtain valuable operation experience for future emergency situations where Bornholm has to be islanded. CET has been in charge of data analysis and in our previous work [3], we mainly analyzed the frequency data. We will continue to analyze the voltage data for the islanding period in our future work.
Fig. 1 is the time plot of the PMU measured frequency data during the islanding period where blue and red lines are Bornholm and Nordic frequency respectively during the same period. It is observed in Fig. 1 that during the islanding the Bornholm system frequency fluctuated much more than the Nordic frequency, which has been confirmed by the statistical histograms in Fig. 2, with several high frequency and low frequency spikes.
Fig. 1. Time plot of the frequency data during the islanding period
Fig. 2. Frequency histograms under islanding mode
During the transition from grid connection mode to
islanding mode, the Bornholm frequency jumped from 49.90 Hz to around 50.18 Hz as shown in Fig. 3, even though the islanding operation was well planned beforehand.
During the planned islanding operation, a spare steam plant was initiated before the islanding moment. It gradually
increased the power production, in order to decrease the power import through the sea cable. Thus, system can alleviate from the sudden power unbalance pressure at the islanding instant.
Fig. 3. Time plot of the frequency data during the gird disconnection moment
However, for an accidental islanding event in practice due to e.g. the emergent disturbance from the upstream grid or the breakdown of the interconnection cable, it is hardly possible to have adequate time to adjust the power flow of the cable to the minimum level, as it has been done during this planned islanding operation. Consequently, the chance of islanding induced system blackout can be higher due to e.g. the severe frequency swells or sags at the transition moment. In order to accurately evaluate the security of an islanding operation, particularly in relation to the frequency stability, we propose an ISR concept, based on which a control mechanism for intentional islanding transition is developed. With the ISR concept, the system operator is able to evaluate how far the system is close to the instability in terms of an islanding operation. Correspondingly, proper control and coordination schemes can be taken to best prepare for such operation in advance.
III. CONTROL MECHANISM
A. Control mechanism for islanding transition
As shown in Fig. 4, the proposed control mechanism is applicable for either planned islanding due to maintenance or accidental islanding due to disturbances. Although the control mechanism is developed mainly for islanding operation of a distribution network, it can also be used for system separation of a transmission network. Here we assume that the distribution system, which is going to be islanded, has been identified before islanding operation. It is however, out of the scope of this paper to analyze how to separate a large system into different distribution systems for islanding operation.
There are three stages within the control mechanism: the monitoring, supervision and ISR assessment stage, the control, coordination and ISR re-assessment stage, and the post-islanding transition stage. Under the grid connection mode, the real-time system state, mainly the loads and generations inside the distribution system, should be
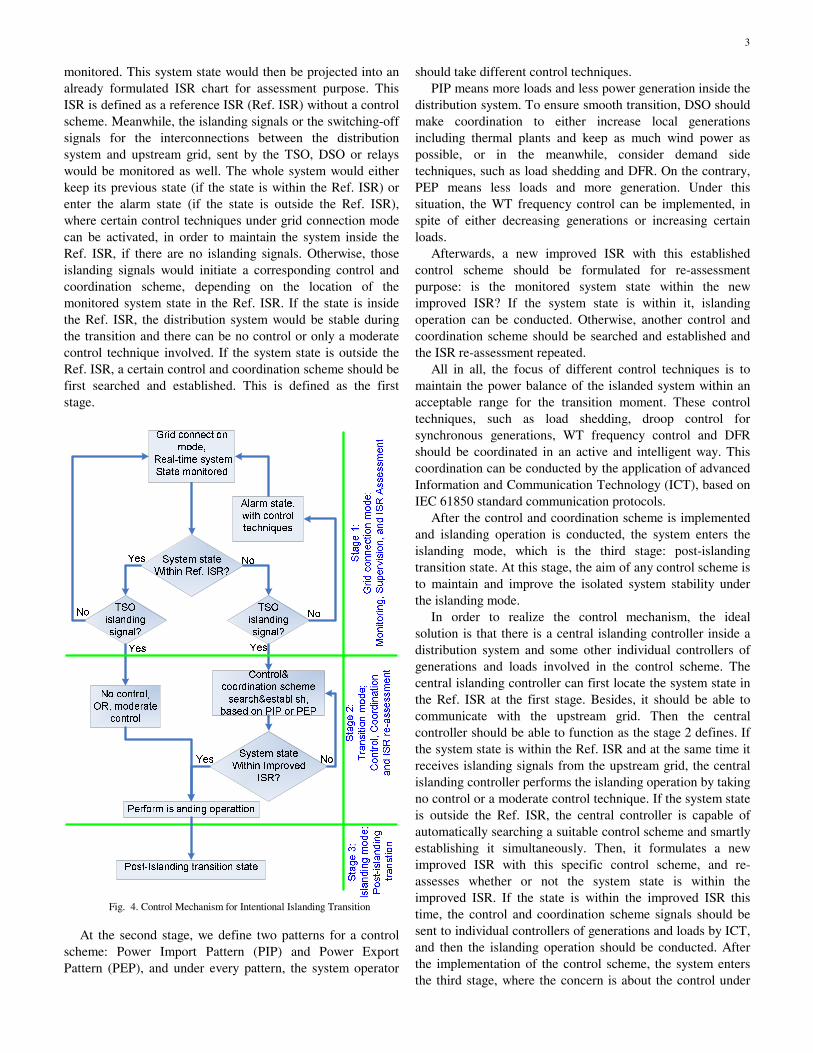
3
monitored. This system state would then be projected into an already formulated ISR chart for assessment purpose. This ISR is defined as a reference ISR (Ref. ISR) without a control scheme. Meanwhile, the islanding signals or the switching-off signals for the interconnections between the distribution system and upstream grid, sent by the TSO, DSO or relays would be monitored as well. The whole system would either keep its previous state (if the state is within the Ref. ISR) or enter the alarm state (if the state is outside the Ref. ISR), where certain control techniques under grid connection mode can be activated, in order to maintain the system inside the Ref. ISR, if there are no islanding signals. Otherwise, those islanding signals would initiate a corresponding control and coordination scheme, depending on the location of the monitored system state in the Ref. ISR. If the state is inside the Ref. ISR, the distribution system would be stable during the transition and there can be no control or only a moderate control technique involved. If the system state is outside the Ref. ISR, a certain control and coordination scheme should be first searched and established. This is defined as the first stage.
System state
Within Ref. ISR?
TSO
islanding
signal?
TSO
islanding
signal?
No control,
OR, moderate
control
Control&
coordination scheme
search&establish,
based on PIP or PEP
Yes
Yes
No
No No
Yes
Grid connection
mode,
Real-time system
State monitored
Alarm state,
with control
techniques
Post-Islanding transition state
Perform islanding operattion
System state
Within Improved
ISR?
NoYes
Fig. 4. Control Mechanism for Intentional Islanding Transition
At the second stage, we define two patterns for a control scheme: Power Import Pattern (PIP) and Power Export Pattern (PEP), and under every pattern, the system operator
should take different control techniques. PIP means more loads and less power generation inside the
distribution system. To ensure smooth transition, DSO should make coordination to either increase local generations including thermal plants and keep as much wind power as possible, or in the meanwhile, consider demand side techniques, such as load shedding and DFR. On the contrary, PEP means less loads and more generation. Under this situation, the WT frequency control can be implemented, in spite of either decreasing generations or increasing certain loads.
Afterwards, a new improved ISR with this established control scheme should be formulated for re-assessment purpose: is the monitored system state within the new improved ISR? If the system state is within it, islanding operation can be conducted. Otherwise, another control and coordination scheme should be searched and established and the ISR re-assessment repeated.
All in all, the focus of different control techniques is to maintain the power balance of the islanded system within an acceptable range for the transition moment. These control techniques, such as load shedding, droop control for synchronous generations, WT frequency control and DFR should be coordinated in an active and intelligent way. This coordination can be conducted by the application of advanced Information and Communication Technology (ICT), based on IEC 61850 standard communication protocols.
After the control and coordination scheme is implemented and islanding operation is conducted, the system enters the islanding mode, which is the third stage: post-islanding transition state. At this stage, the aim of any control scheme is to maintain and improve the isolated system stability under the islanding mode.
In order to realize the control mechanism, the ideal solution is that there is a central islanding controller inside a distribution system and some other individual controllers of generations and loads involved in the control scheme. The central islanding controller can first locate the system state in the Ref. ISR at the first stage. Besides, it should be able to communicate with the upstream grid. Then the central controller should be able to function as the stage 2 defines. If the system state is within the Ref. ISR and at the same time it receives islanding signals from the upstream grid, the central islanding controller performs the islanding operation by taking no control or a moderate control technique. If the system state is outside the Ref. ISR, the central controller is capable of automatically searching a suitable control scheme and smartly establishing it simultaneously. Then, it formulates a new improved ISR with this specific control scheme, and re-assesses whether or not the system state is within the improved ISR. If the state is within the improved ISR this time, the control and coordination scheme signals should be sent to individual controllers of generations and loads by ICT, and then the islanding operation should be conducted. After the implementation of the control scheme, the system enters the third stage, where the concern is about the control under
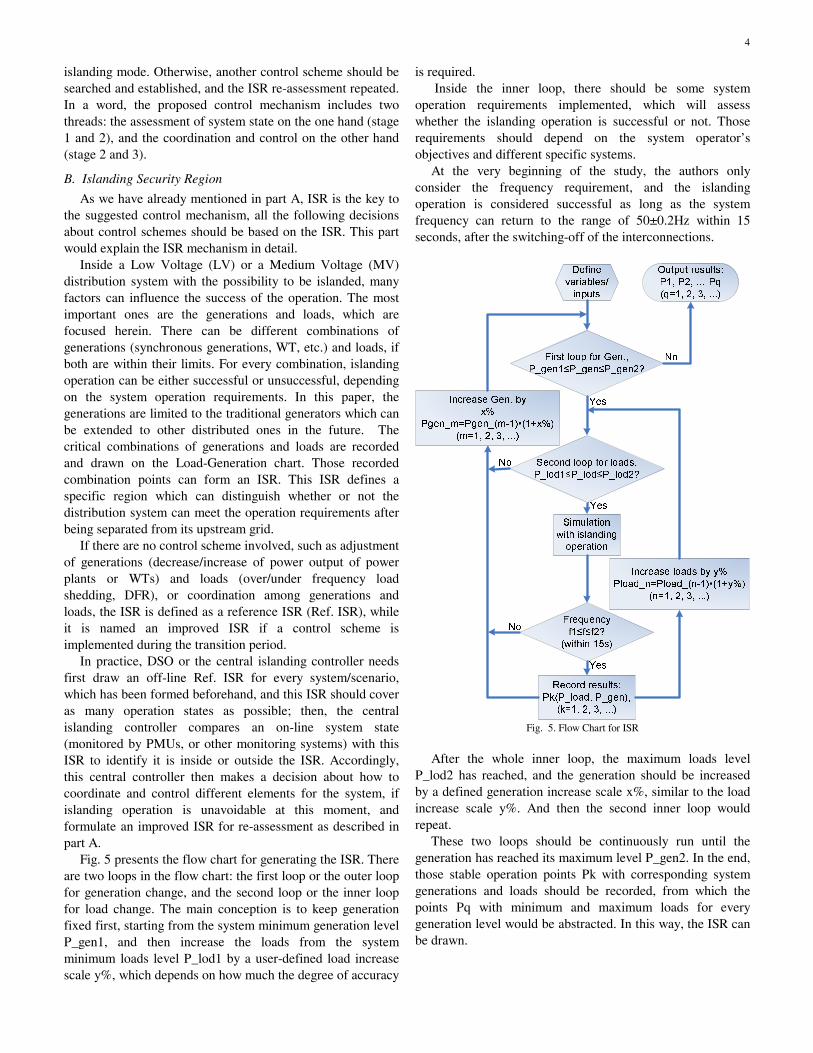
4
islanding mode. Otherwise, another control scheme should be searched and established, and the ISR re-assessment repeated. In a word, the proposed control mechanism includes two threads: the assessment of system state on the one hand (stage 1 and 2), and the coordination and control on the other hand (stage 2 and 3).
B. Islanding Security Region
As we have already mentioned in part A, ISR is the key to the suggested control mechanism, all the following decisions about control schemes should be based on the ISR. This part would explain the ISR mechanism in detail.
Inside a Low Voltage (LV) or a Medium Voltage (MV) distribution system with the possibility to be islanded, many factors can influence the success of the operation. The most important ones are the generations and loads, which are focused herein. There can be different combinations of generations (synchronous generations, WT, etc.) and loads, if both are within their limits. For every combination, islanding operation can be either successful or unsuccessful, depending on the system operation requirements. In this paper, the generations are limited to the traditional generators which can be extended to other distributed ones in the future. The critical combinations of generations and loads are recorded and drawn on the Load-Generation chart. Those recorded combination points can form an ISR. This ISR defines a specific region which can distinguish whether or not the distribution system can meet the operation requirements after being separated from its upstream grid.
If there are no control scheme involved, such as adjustment of generations (decrease/increase of power output of power plants or WTs) and loads (over/under frequency load shedding, DFR), or coordination among generations and loads, the ISR is defined as a reference ISR (Ref. ISR), while it is named an improved ISR if a control scheme is implemented during the transition period.
In practice, DSO or the central islanding controller needs first draw an off-line Ref. ISR for every system/scenario, which has been formed beforehand, and this ISR should cover as many operation states as possible; then, the central islanding controller compares an on-line system state (monitored by PMUs, or other monitoring systems) with this ISR to identify it is inside or outside the ISR. Accordingly, this central controller then makes a decision about how to coordinate and control different elements for the system, if islanding operation is unavoidable at this moment, and formulate an improved ISR for re-assessment as described in part A.
Fig. 5 presents the flow chart for generating the ISR. There are two loops in the flow chart: the first loop or the outer loop for generation change, and the second loop or the inner loop for load change. The main conception is to keep generation fixed first, starting from the system minimum generation level P_gen1, and then increase the loads from the system minimum loads level P_lod1 by a user-defined load increase scale y%, which depends on how much the degree of accuracy
is required. Inside the inner loop, there should be some system
operation requirements implemented, which will assess whether the islanding operation is successful or not. Those requirements should depend on the system operator’s objectives and different specific systems.
At the very beginning of the study, the authors only consider the frequency requirement, and the islanding operation is considered successful as long as the system frequency can return to the range of 50±0.2Hz within 15 seconds, after the switching-off of the interconnections.
Define
variables/
inputs
First loop for Gen.,
P_gen1≤P_gen≤P_gen2?
Simulation
with islanding
operation
Increase Gen. by
x%
Pgen_m=Pgen_(m-1)•(1+x%)
(m=1, 2, 3, ...)
Output results:
P1, P2, … Pq
(q=1, 2, 3, ...)
Increase loads by y%
Pload_n=Pload_(n-1)•(1+y%)
(n=1, 2, 3, ...)
Record results:
Pk(P_load, P_gen),
(k=1, 2, 3, ...)
Second loop for loads,
P_lod1≤P_lod≤P_lod2?
Frequency
f1≤f≤f2?
(within 15s)
Yes
Yes
Yes
No
No
No
Fig. 5. Flow Chart for ISR
After the whole inner loop, the maximum loads level
P_lod2 has reached, and the generation should be increased by a defined generation increase scale x%, similar to the load increase scale y%. And then the second inner loop would repeat.
These two loops should be continuously run until the generation has reached its maximum level P_gen2. In the end, those stable operation points Pk with corresponding system generations and loads should be recorded, from which the points Pq with minimum and maximum loads for every generation level would be abstracted. In this way, the ISR can be drawn.
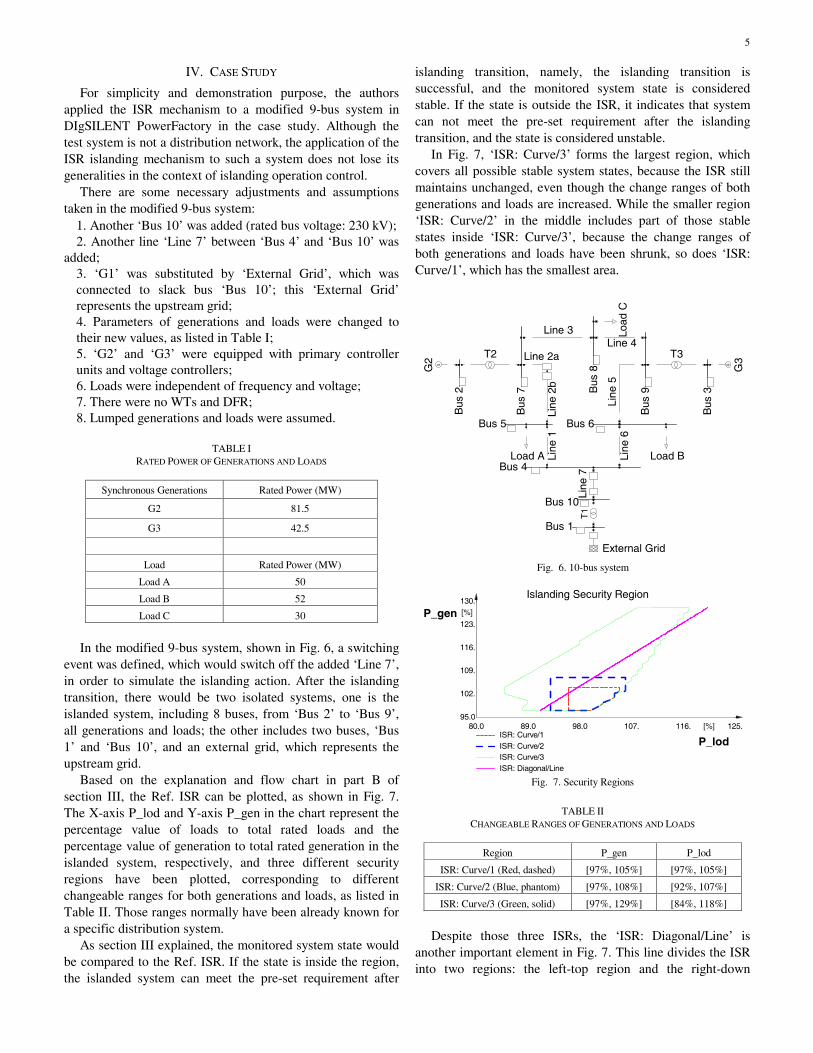
5
IV. CASE STUDY
For simplicity and demonstration purpose, the authors applied the ISR mechanism to a modified 9-bus system in DIgSILENT PowerFactory in the case study. Although the test system is not a distribution network, the application of the ISR islanding mechanism to such a system does not lose its generalities in the context of islanding operation control.
There are some necessary adjustments and assumptions taken in the modified 9-bus system:
1. Another ‘Bus 10’ was added (rated bus voltage: 230 kV); 2. Another line ‘Line 7’ between ‘Bus 4’ and ‘Bus 10’ was
added; 3. ‘G1’ was substituted by ‘External Grid’, which was connected to slack bus ‘Bus 10’; this ‘External Grid’ represents the upstream grid; 4. Parameters of generations and loads were changed to their new values, as listed in Table I; 5. ‘G2’ and ‘G3’ were equipped with primary controller units and voltage controllers; 6. Loads were independent of frequency and voltage; 7. There were no WTs and DFR; 8. Lumped generations and loads were assumed.
TABLE I RATED POWER OF GENERATIONS AND LOADS
Synchronous Generations Rated Power (MW)
G2 81.5
G3 42.5
Load Rated Power (MW)
Load A 50
Load B 52
Load C 30
In the modified 9-bus system, shown in Fig. 6, a switching
event was defined, which would switch off the added ‘Line 7’, in order to simulate the islanding action. After the islanding transition, there would be two isolated systems, one is the islanded system, including 8 buses, from ‘Bus 2’ to ‘Bus 9’, all generations and loads; the other includes two buses, ‘Bus 1’ and ‘Bus 10’, and an external grid, which represents the upstream grid.
Based on the explanation and flow chart in part B of section III, the Ref. ISR can be plotted, as shown in Fig. 7. The X-axis P_lod and Y-axis P_gen in the chart represent the percentage value of loads to total rated loads and the percentage value of generation to total rated generation in the islanded system, respectively, and three different security regions have been plotted, corresponding to different changeable ranges for both generations and loads, as listed in Table II. Those ranges normally have been already known for a specific distribution system.
As section III explained, the monitored system state would be compared to the Ref. ISR. If the state is inside the region, the islanded system can meet the pre-set requirement after
islanding transition, namely, the islanding transition is successful, and the monitored system state is considered stable. If the state is outside the ISR, it indicates that system can not meet the pre-set requirement after the islanding transition, and the state is considered unstable.
In Fig. 7, ‘ISR: Curve/3’ forms the largest region, which covers all possible stable system states, because the ISR still maintains unchanged, even though the change ranges of both generations and loads are increased. While the smaller region ‘ISR: Curve/2’ in the middle includes part of those stable states inside ‘ISR: Curve/3’, because the change ranges of both generations and loads have been shrunk, so does ‘ISR: Curve/1’, which has the smallest area.
Line
7
Load A Line
1
T1
Line
6Li
ne 5
Load B
T3
G ~ G3
Line 4
Load
C
Line 3
T2
G~G2
External GridLi
ne 2
b
Line 2a
Bus
7
Bus 5
Bus 4
Bus 10
Bus 6
Bus
3
Bus
9Bus
8
Bus
2
Bus 1
Fig. 6. 10-bus system
125.116.107.98.089.080.0 [%]
130.
123.
116.
109.
102.
95.0
[%]
ISR: Curve/1ISR: Curve/2ISR: Curve/3ISR: Diagonal/Line
P_lod
P_gen
Islanding Security Region
Fig. 7. Security Regions
TABLE II
CHANGEABLE RANGES OF GENERATIONS AND LOADS
Region P_gen P_lod
ISR: Curve/1 (Red, dashed) [97%, 105%] [97%, 105%]
ISR: Curve/2 (Blue, phantom) [97%, 108%] [92%, 107%]
ISR: Curve/3 (Green, solid) [97%, 129%] [84%, 118%]
Despite those three ISRs, the ‘ISR: Diagonal/Line’ is
another important element in Fig. 7. This line divides the ISR into two regions: the left-top region and the right-down
6
region. These two regions correspond to PEP and PIP, respectively, which would lead to different control and coordination scheme, as defined in section III.
V. CONCLUSIONS
With the ISR based islanding control mechanism, the system operator can be well informed whether or not a specific distribution system, at any instant, can successfully handle a possible islanding transition, due to either maintenance or a disturbance from the upstream grid. Since wind distributed generations have different characteristics, it is necessary to differentiate them from the traditional generation technology in the islanding control. The ISR mechanism should be extended to include these considerations in the future.
The ISR concept can also provide the operator with a functional tool to effectively assess different control schemes to ensure successful islanding operation. The ultimate goal of the islanding mechanism is to utilize and coordinate those available resources from traditional and innovative techniques, such as load shedding, droop control among power plants, WT frequency control and DFR, in order to maintain real time balance of generation and demand inside the system during the short transition period. Further development of the islanding mechanism is underway to investigate the proper control scheme for coordinated control of different resources to ensure the success of an intentional islanding.
Furthermore, we mainly consider the application of the control mechanism to the frequency stability at present, however, there is a potential to investigate its application to the voltage stability as well, even though the voltage stability is considered fairly localized.
VI. REFERENCES [1] The Danish Energy Authority. (2007, Jun.) Energy Policy Statement
2007.[Online].Available: http://www.ens.dk/graphics/Publikationer/Energipolitik_UK/Energy_policy_Statement_2007/index.htm
[2] Ea Energy Analyses, “50% Wind Power in Denmark in 2025 – English Summary,” Ea Energy Analyses A/S, July, 2007. [Online]. Available: http://www.ea-energianalyse.dk/reports/642_50_per_cent_wind_power_in_Danmark_in_2025_July_2007.pdf
[3] Y. Chen, Z. Xu, and J. Østergaard, “Frequency Analysis for Planned Islanding Operation in the Danish Distribution System – Bornholm,” in Proc. 43rd International Universities Power Engineering Conference, Padova, Italy, 1-4 September 2008.
[4] The Danish Energy Authority. (2008, Apr.) Windturbines – Introduction and Basic Facts. [Online]. Available: http://www.ens.dk/sw14294.asp
[5] ØSTKRAFT Net A/S. (2006.) Årsrapport 2006. [Online]. Available: http://www.oestkraft.dk/download/oestkraftaarsrapport2006.pdf
[6] Edward James-Smith, and Mikael Togeby, “Security of supply for Bornholm-Integration of fluctuating generation using coordinated control of demand and wind turbines-Demand side options for system reserves,” September, 2007. [Online]. Available: http://www.ea-energianalyse.dk/reports/640_Security_of_supply_for_Bornholm.pdf
[7] Z. Xu, M. Togeby, and J. Østergaard, “Demand as Frequency Controlled Reserve - Final report of the PSO project,” September, 2008. [Online]. Available:http://www.ea-
energianalyse.dk/reports/513_demand_as_frequency_controlled_reserve_final_report.pdf
[8] O. Anaya-Lara, F.M. Hughes, N. Jenkins, and G. Strbac, “Contribution of DFIG-based wind farms to power system short-term frequency regulation,” in IEE Proc. –Gener. Transm. Distrib., Vol. 153, No. 2, March 2006.
[9] A H. Nielsen, K.O.H. Pedersen, J. Rasmussen, J. Havsager, S. K. Olsen, and P. Jørgensen, “Phasor measurement units in the eastern Danish power system,” in CIGRE Conference 2006, Paris, France, pp. 1-5.
VII. BIOGRAPHIES
Yu Chen (S’08) received the B.Eng. degree in electrical engineering and automation from Nanjing University of Science and Technology (Nanjing, China) in 2004, and the M.Sc. degree in electric power engineering from Chalmers University of Technology (Gothenburg, Sweden) in 2006, respectively. He is currently pursuing his Ph.D. at the Centre for Electric Technology (CET), Technical University of Denmark (Kgs. Lyngby, Denmark). From September 2005 to May 2006, he conducted his
Master thesis at TST, HVDC Power System department, ABB, Ludvika, Sweden.
His employment experience included the Technology Centre (Beijing, China) in Medium Voltage Products Unit, ABB Asea Brown Boveri Ltd., where he was a R&D engineer working on electric field simulation.
His current and potential research interests include intentional islanding control and operation and microgrids with high penetration of distributed generations.
Zhao Xu ((S’00, M’06) received PhD. in electrical engineering from University of Queensland in 2006. He is now an Assistant Professor at Centre for Electric Technology, Technical University of Denmark. His research interests include demand side, grid integration of wind power, electricity market planning and management, AI applications.
Jacob Østergaard (M’95) is Professor and Head of the Centre for Electric Technology, in the Department of Electrical Engineering, Technical University of Denmark. His research interests include integration of renewable energy, control architecture for future power system, and demand side. Professor Østergaard is serving in several professional organizations including the EU SmartGrids advisory council.
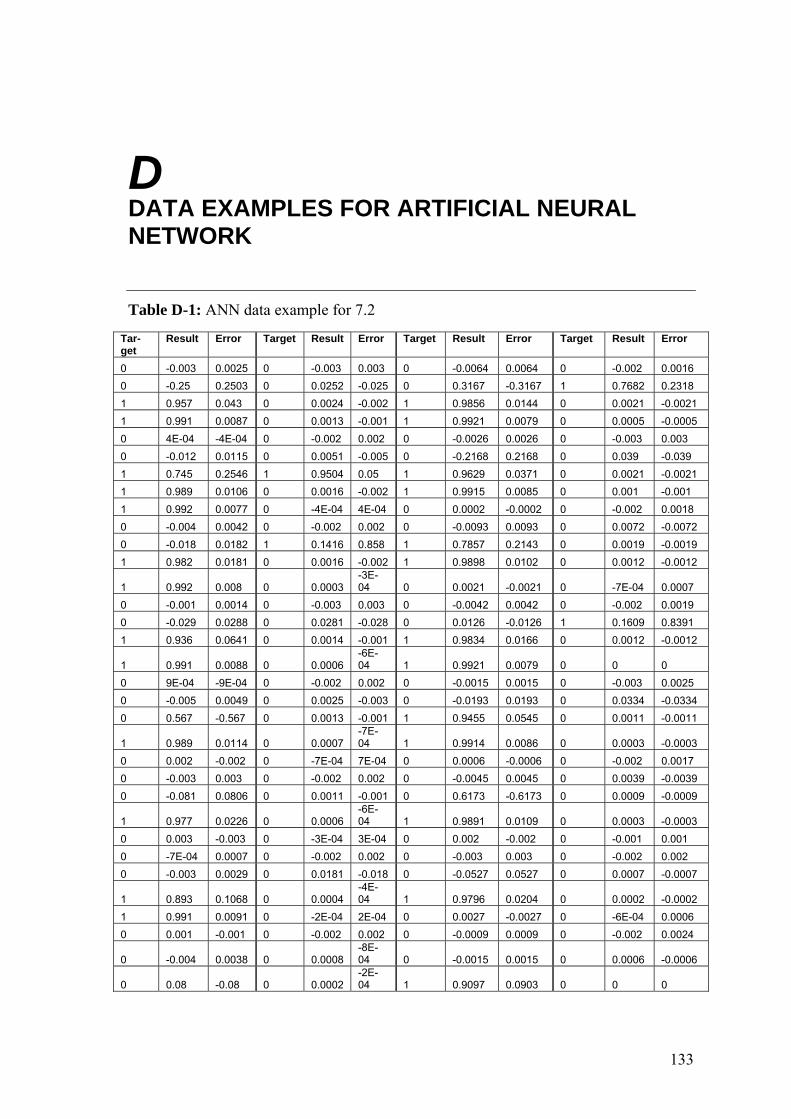
133
D DATA EXAMPLES FOR ARTIFICIAL NEURAL NETWORK
Table D-1: ANN data example for 7.2
Tar-get
Result Error Target Result Error Target Result Error Target Result Error
0 -0.003 0.0025 0 -0.003 0.003 0 -0.0064 0.0064 0 -0.002 0.0016 0 -0.25 0.2503 0 0.0252 -0.025 0 0.3167 -0.3167 1 0.7682 0.2318 1 0.957 0.043 0 0.0024 -0.002 1 0.9856 0.0144 0 0.0021 -0.0021 1 0.991 0.0087 0 0.0013 -0.001 1 0.9921 0.0079 0 0.0005 -0.0005 0 4E-04 -4E-04 0 -0.002 0.002 0 -0.0026 0.0026 0 -0.003 0.003 0 -0.012 0.0115 0 0.0051 -0.005 0 -0.2168 0.2168 0 0.039 -0.039 1 0.745 0.2546 1 0.9504 0.05 1 0.9629 0.0371 0 0.0021 -0.0021 1 0.989 0.0106 0 0.0016 -0.002 1 0.9915 0.0085 0 0.001 -0.001 1 0.992 0.0077 0 -4E-04 4E-04 0 0.0002 -0.0002 0 -0.002 0.0018 0 -0.004 0.0042 0 -0.002 0.002 0 -0.0093 0.0093 0 0.0072 -0.0072 0 -0.018 0.0182 1 0.1416 0.858 1 0.7857 0.2143 0 0.0019 -0.0019 1 0.982 0.0181 0 0.0016 -0.002 1 0.9898 0.0102 0 0.0012 -0.0012
1 0.992 0.008 0 0.0003 -3E-04 0 0.0021 -0.0021 0 -7E-04 0.0007
0 -0.001 0.0014 0 -0.003 0.003 0 -0.0042 0.0042 0 -0.002 0.0019 0 -0.029 0.0288 0 0.0281 -0.028 0 0.0126 -0.0126 1 0.1609 0.8391 1 0.936 0.0641 0 0.0014 -0.001 1 0.9834 0.0166 0 0.0012 -0.0012
1 0.991 0.0088 0 0.0006 -6E-04 1 0.9921 0.0079 0 0 0
0 9E-04 -9E-04 0 -0.002 0.002 0 -0.0015 0.0015 0 -0.003 0.0025 0 -0.005 0.0049 0 0.0025 -0.003 0 -0.0193 0.0193 0 0.0334 -0.0334 0 0.567 -0.567 0 0.0013 -0.001 1 0.9455 0.0545 0 0.0011 -0.0011
1 0.989 0.0114 0 0.0007 -7E-04 1 0.9914 0.0086 0 0.0003 -0.0003
0 0.002 -0.002 0 -7E-04 7E-04 0 0.0006 -0.0006 0 -0.002 0.0017 0 -0.003 0.003 0 -0.002 0.002 0 -0.0045 0.0045 0 0.0039 -0.0039 0 -0.081 0.0806 0 0.0011 -0.001 0 0.6173 -0.6173 0 0.0009 -0.0009
1 0.977 0.0226 0 0.0006 -6E-04 1 0.9891 0.0109 0 0.0003 -0.0003
0 0.003 -0.003 0 -3E-04 3E-04 0 0.002 -0.002 0 -0.001 0.001 0 -7E-04 0.0007 0 -0.002 0.002 0 -0.003 0.003 0 -0.002 0.002 0 -0.003 0.0029 0 0.0181 -0.018 0 -0.0527 0.0527 0 0.0007 -0.0007
1 0.893 0.1068 0 0.0004 -4E-04 1 0.9796 0.0204 0 0.0002 -0.0002
1 0.991 0.0091 0 -2E-04 2E-04 0 0.0027 -0.0027 0 -6E-04 0.0006 0 0.001 -0.001 0 -0.002 0.002 0 -0.0009 0.0009 0 -0.002 0.0024
0 -0.004 0.0038 0 0.0008 -8E-04 0 -0.0015 0.0015 0 0.0006 -0.0006
0 0.08 -0.08 0 0.0002 -2E-04 1 0.9097 0.0903 0 0 0

Data Examples For Artificial Neural Network
134
1 0.987 0.0126 0 -3E-04 3E-04 0 0.003 -0.003 0 -5E-04 0.0005 0 0.002 -0.002 0 -0.001 0.001 0 0.0007 -0.0007 0 -0.002 0.0019 0 -0.002 0.0021 0 -0.002 0.002 0 -0.0036 0.0036 0 0.0018 -0.0018 0 0.005 -0.005 0 0 0 0 0.0886 -0.0886 0 -2E-04 0.0002 1 0.969 0.0309 0 -4E-04 4E-04 1 0.9881 0.0119 0 -6E-04 0.0006 0 0.002 -0.002 0 -0.001 0.001 0 0.0016 -0.0016 0 -0.002 0.0015 0 -4E-04 0.0004 0 -0.002 0.002 0 -0.0022 0.0022 0 -0.002 0.0021 0 -0.002 0.0024 0 -1E-04 1E-04 0 0.0095 -0.0095 0 -3E-04 0.0003 1 0.752 0.248 0 -6E-04 6E-04 1 0.9726 0.0274 0 -8E-04 0.0008 0 0.003 -0.003 0 -0.001 0.001 0 0.002 -0.002 0 -0.001 0.0013 0 8E-04 -8E-04 0 -0.002 0.002 0 -0.0006 0.0006 0 -0.003 0.0025
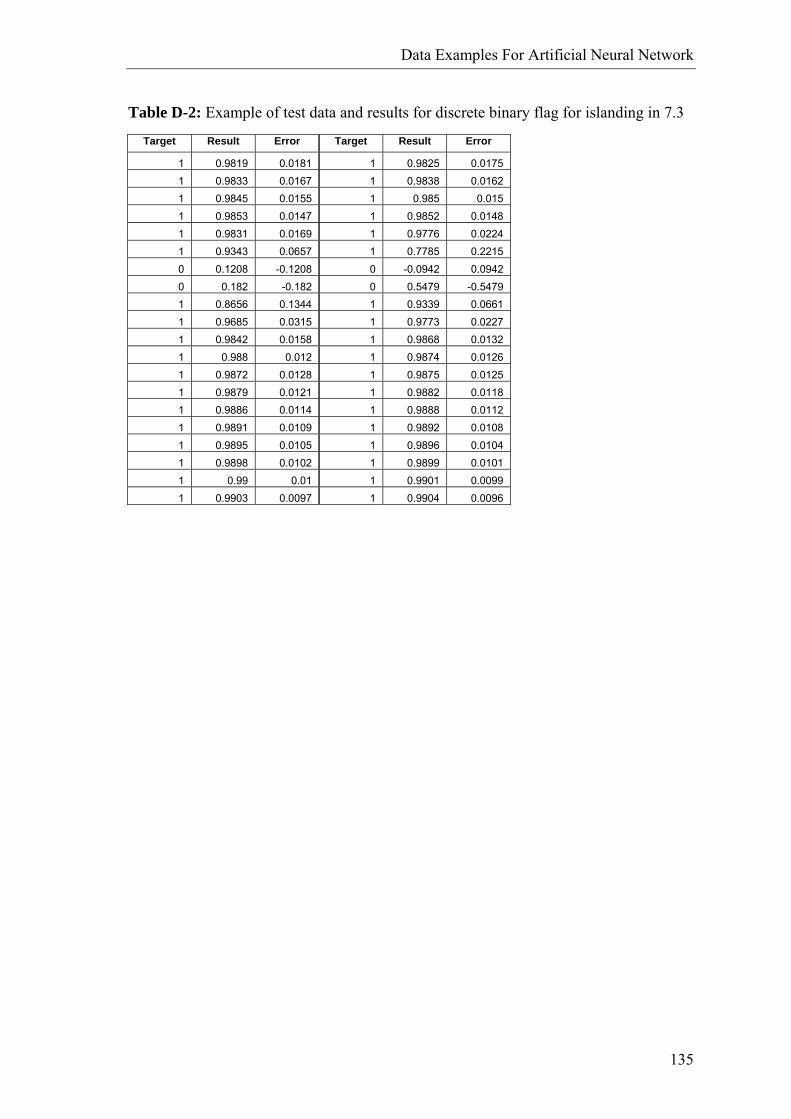
Data Examples For Artificial Neural Network
135
Table D-2: Example of test data and results for discrete binary flag for islanding in 7.3
Target Result Error Target Result Error
1 0.9819 0.0181 1 0.9825 0.0175 1 0.9833 0.0167 1 0.9838 0.0162 1 0.9845 0.0155 1 0.985 0.015 1 0.9853 0.0147 1 0.9852 0.0148 1 0.9831 0.0169 1 0.9776 0.0224 1 0.9343 0.0657 1 0.7785 0.2215 0 0.1208 -0.1208 0 -0.0942 0.0942 0 0.182 -0.182 0 0.5479 -0.5479 1 0.8656 0.1344 1 0.9339 0.0661 1 0.9685 0.0315 1 0.9773 0.0227 1 0.9842 0.0158 1 0.9868 0.0132 1 0.988 0.012 1 0.9874 0.0126 1 0.9872 0.0128 1 0.9875 0.0125 1 0.9879 0.0121 1 0.9882 0.0118 1 0.9886 0.0114 1 0.9888 0.0112 1 0.9891 0.0109 1 0.9892 0.0108 1 0.9895 0.0105 1 0.9896 0.0104 1 0.9898 0.0102 1 0.9899 0.0101 1 0.99 0.01 1 0.9901 0.0099 1 0.9903 0.0097 1 0.9904 0.0096
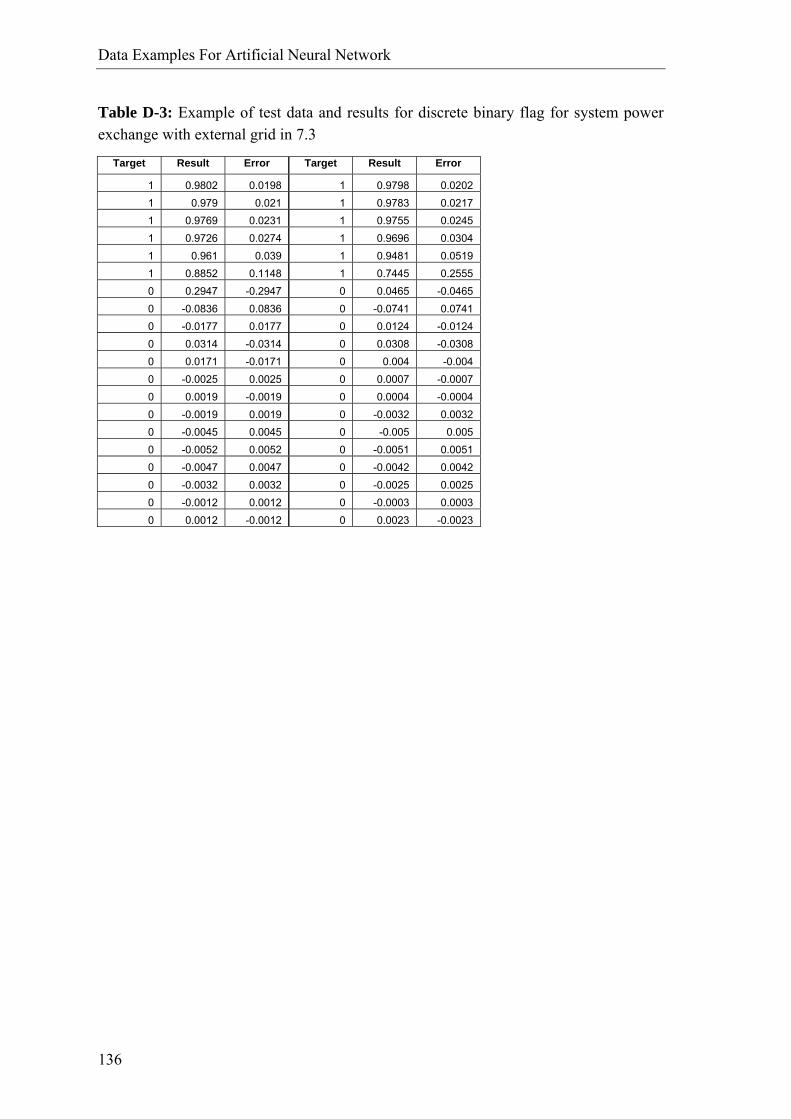
Data Examples For Artificial Neural Network
136
Table D-3: Example of test data and results for discrete binary flag for system power exchange with external grid in 7.3
Target Result Error Target Result Error
1 0.9802 0.0198 1 0.9798 0.0202 1 0.979 0.021 1 0.9783 0.0217 1 0.9769 0.0231 1 0.9755 0.0245 1 0.9726 0.0274 1 0.9696 0.0304 1 0.961 0.039 1 0.9481 0.0519 1 0.8852 0.1148 1 0.7445 0.2555 0 0.2947 -0.2947 0 0.0465 -0.0465 0 -0.0836 0.0836 0 -0.0741 0.0741 0 -0.0177 0.0177 0 0.0124 -0.0124 0 0.0314 -0.0314 0 0.0308 -0.0308 0 0.0171 -0.0171 0 0.004 -0.004 0 -0.0025 0.0025 0 0.0007 -0.0007 0 0.0019 -0.0019 0 0.0004 -0.0004 0 -0.0019 0.0019 0 -0.0032 0.0032 0 -0.0045 0.0045 0 -0.005 0.005 0 -0.0052 0.0052 0 -0.0051 0.0051 0 -0.0047 0.0047 0 -0.0042 0.0042 0 -0.0032 0.0032 0 -0.0025 0.0025 0 -0.0012 0.0012 0 -0.0003 0.0003 0 0.0012 -0.0012 0 0.0023 -0.0023
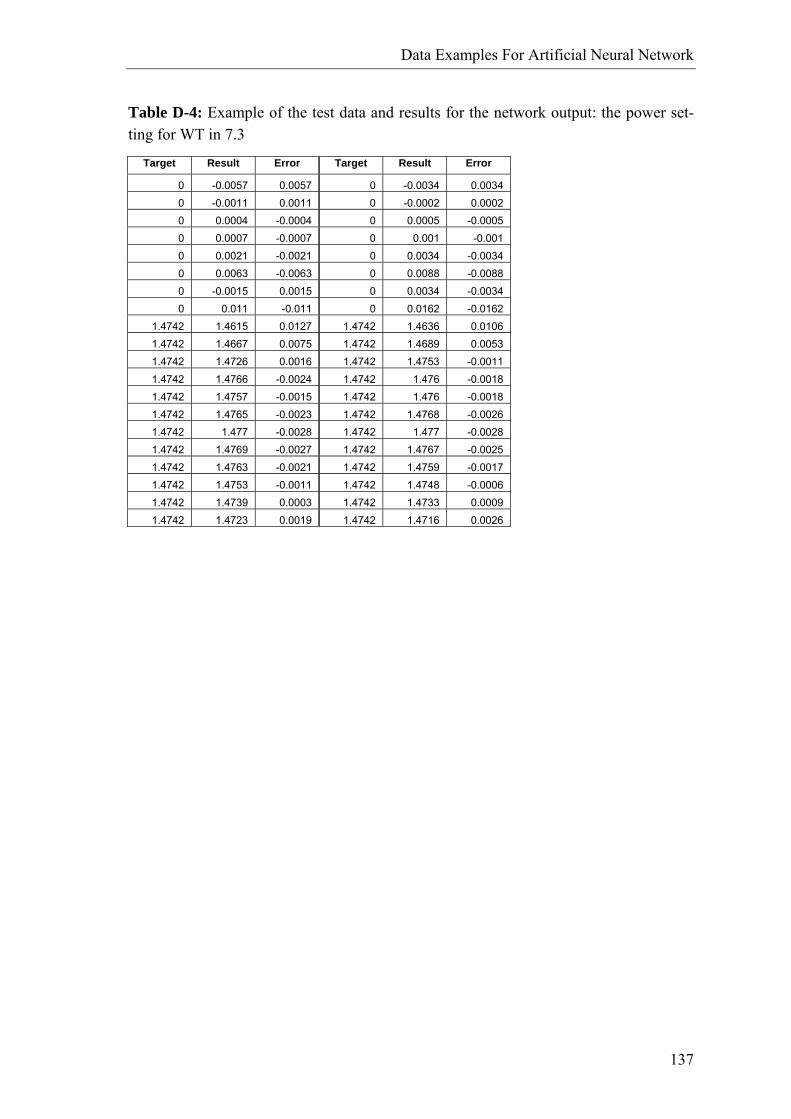
Data Examples For Artificial Neural Network
137
Table D-4: Example of the test data and results for the network output: the power set-ting for WT in 7.3
Target Result Error Target Result Error
0 -0.0057 0.0057 0 -0.0034 0.0034 0 -0.0011 0.0011 0 -0.0002 0.0002 0 0.0004 -0.0004 0 0.0005 -0.0005 0 0.0007 -0.0007 0 0.001 -0.001 0 0.0021 -0.0021 0 0.0034 -0.0034 0 0.0063 -0.0063 0 0.0088 -0.0088 0 -0.0015 0.0015 0 0.0034 -0.0034 0 0.011 -0.011 0 0.0162 -0.0162
1.4742 1.4615 0.0127 1.4742 1.4636 0.0106 1.4742 1.4667 0.0075 1.4742 1.4689 0.0053 1.4742 1.4726 0.0016 1.4742 1.4753 -0.0011 1.4742 1.4766 -0.0024 1.4742 1.476 -0.0018 1.4742 1.4757 -0.0015 1.4742 1.476 -0.0018 1.4742 1.4765 -0.0023 1.4742 1.4768 -0.0026 1.4742 1.477 -0.0028 1.4742 1.477 -0.0028 1.4742 1.4769 -0.0027 1.4742 1.4767 -0.0025 1.4742 1.4763 -0.0021 1.4742 1.4759 -0.0017 1.4742 1.4753 -0.0011 1.4742 1.4748 -0.0006 1.4742 1.4739 0.0003 1.4742 1.4733 0.0009 1.4742 1.4723 0.0019 1.4742 1.4716 0.0026
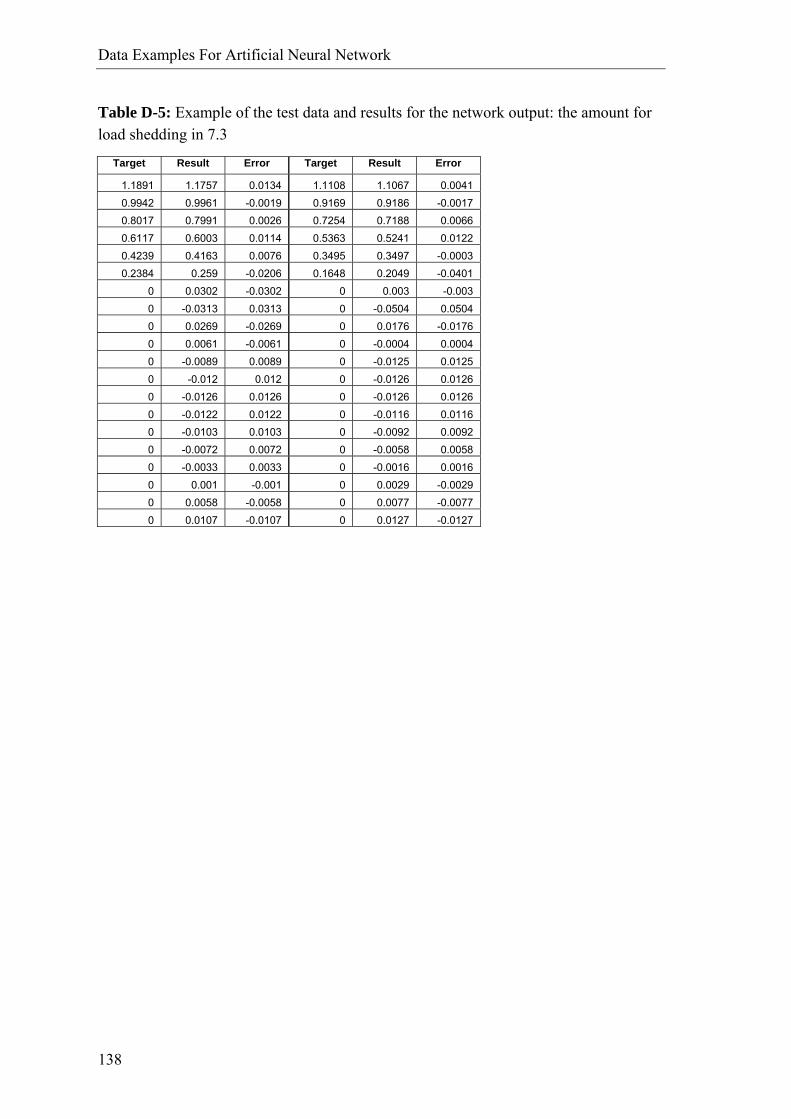
Data Examples For Artificial Neural Network
138
Table D-5: Example of the test data and results for the network output: the amount for load shedding in 7.3
Target Result Error Target Result Error
1.1891 1.1757 0.0134 1.1108 1.1067 0.0041 0.9942 0.9961 -0.0019 0.9169 0.9186 -0.0017 0.8017 0.7991 0.0026 0.7254 0.7188 0.0066 0.6117 0.6003 0.0114 0.5363 0.5241 0.0122 0.4239 0.4163 0.0076 0.3495 0.3497 -0.0003 0.2384 0.259 -0.0206 0.1648 0.2049 -0.0401
0 0.0302 -0.0302 0 0.003 -0.003 0 -0.0313 0.0313 0 -0.0504 0.0504 0 0.0269 -0.0269 0 0.0176 -0.0176 0 0.0061 -0.0061 0 -0.0004 0.0004 0 -0.0089 0.0089 0 -0.0125 0.0125 0 -0.012 0.012 0 -0.0126 0.0126 0 -0.0126 0.0126 0 -0.0126 0.0126 0 -0.0122 0.0122 0 -0.0116 0.0116 0 -0.0103 0.0103 0 -0.0092 0.0092 0 -0.0072 0.0072 0 -0.0058 0.0058 0 -0.0033 0.0033 0 -0.0016 0.0016 0 0.001 -0.001 0 0.0029 -0.0029 0 0.0058 -0.0058 0 0.0077 -0.0077 0 0.0107 -0.0107 0 0.0127 -0.0127

139

www.elektro.dtu.dk/cet Department of Electrical Engineering Centre for Electric Technology (CET) Technical University of Denmark Elektrovej 325 DK-2800 Kgs. Lyngby Denmark Tel: (+45) 45 25 35 00 Fax: (+45) 45 88 61 11 E-mail: [email protected] ISBN 978-87-92465-20-7