Contributions of Nonalcoholic Beverages to the U.S....
69
United States Department of Agriculture Economic Research Service Economic Research Report Number 1 Electronic Report Contributions of Nonalcoholic Beverages to the U.S. Diet Oral Capps, Jr., Annette Clauson, Joanne Guthrie, Grant Pittman, and Matthew Stockton Food Assistance and Nutrition Research Program
Transcript of Contributions of Nonalcoholic Beverages to the U.S....

United StatesDepartmentof Agriculture
EconomicResearchService
EconomicResearchReportNumber 1
ElectronicReport
Contributions of Nonalcoholic Beverages to the U.S. Diet
Oral Capps, Jr., Annette Clauson, Joanne Guthrie, Grant Pittman, andMatthew Stockton
Food Assistance and Nutrition Research Program
ww
w.er
s.usda.gov
Want to learn more about farm structure and farm household well-being? Visit our website at www.ers.usda.gov.
You can also find additional information about ERSpublications, databases, and other products at our website.
Visit Our Website To Learn More!
National Agricultural LibraryCataloging Record:
The U.S. Department of Agriculture (USDA) prohibits discrimination in all its programs and activities on the basis of race, color, national origin, sex, religion, age, disability, political beliefs, sexual orientation, or marital or family status. (Not all prohibited bases apply to all programs.) Persons with disabilities who require alternative means for communication of program information (Braille, large print, audiotape, etc.) should contact USDA's TARGET Center at (202) 720-2600 (voice and TDD).
To file a complaint of discrimination, write USDA, Director, Office of Civil Rights, Room 326-W, Whitten Building, 14th and Independence Ave., SW, Washington, DC20250-9410, or call (202) 720-5964 (voice and TDD). USDA is an equal opportunityprovider and employer.
Contributions of nonalcoholic beverages to the U.S. diet.
(Economic research report (United States. Dept. ofAgriculture. Economic Research Service; No. 1))1. Non-alcoholic beverages-United States. 2. Ingestion-United States.3. Diet-United States. 4. Americans-Nutrition-Statistics. I. Capps, Oral.I. Banker, David E.
II. United States. Dept. of Agriculture. Economic.III. Title.TX360.U6
Abstract
This report analyzes consumer demand and nutritional issues associatedwith nonalcoholic beverages purchased for at-home use by looking at demo-graphic variables such as household size, household income, educationlevel, and region. The beverages include milk, carbonated soft drinks, bot-tled water, fruit juices, fruit drinks, coffee, tea, and isotonics (sports drinks).The report's focus is on the impact of nutritional quality from beverage pur-chase choices that a household makes, looking at the household's availabili-ty of calories, calcium, vitamin C, and caffeine from these beverage choices.Using the Daily Values on the Nutrition Facts portion of the food label as areference, we find that nonalcoholic beverages purchased for at-home con-sumption provided, on a per-person basis:
• 10 percent of daily value for calories.• 20 percent of the daily value for calcium.• 70 percent of daily value for vitamin C.
Statistical analyses included the use of descriptive cross-tabulations andregression analyses, with profiles of households that were more or less like-ly to purchase the beverages, as well as key determinants associated withthe probability of purchasing selected beverages.
Keywords: nonalcoholic beverages, nutrient intake, cross-tabulations, regres-sion analyses, probit analyses
Contributions of NonalcoholicBeverages to the U.S. Diet
Oral Capps, Jr., Annette Clauson, Joanne Guthrie, Grant Pittman, andMatthew Stockton
United States Department of Agriculture
www.ers.usda.gov
Electronic Report from the Economic Research Service
March 2005
EconomicResearchReportNumber 1
The authors are listed in alphabetical order, with no order of importance assigned to anyauthor. Oral Capps, Jr., is Professor and Southwest Dairy Marketing Endowed Chair, TexasA&M University; Annette Clauson is an agricultural economist and Joanne Guthrie is anutritionist, both with ERS; Grant Pittman is an analyst at the Bank of America and MatthewStockton is Visiting Assistant Professor at The University of Idaho. Pittman and Stockmanwere graduate students at Texas A&M University when this report was written.
Acknowledgments
The authors thank reviewers Mark Brown, Elizabeth Dagata, Mark Denbaly,Shannon Fries, J. Michael Harris, Kuo Huang, David Smallwood, andHayden Stewart for their helpful comments and suggestions; TomMcDonald and Priscilla Smith for editorial support; and Juanita Tibbs forlayout and design support.
This project was funded by Food Assistance and Nutrition ResearchProgram (FANRP) cooperative agreement number 43-3AEM-2-80069.
iiContribution of Nonalcoholic Beverages to the U.S. Diet / ERR-1
Economic Research Service/USDA
Contents
Summary . . . . . . . . . . . . . . . . . . . . . . . . . . . . . . . . . . . . . . . . . . . . . . . . . . . .iv
Introduction . . . . . . . . . . . . . . . . . . . . . . . . . . . . . . . . . . . . . . . . . . . . . . . . . .1
Analysis of Average Available Intakes of Calories, Calcium,Vitamin C, and Caffeine . . . . . . . . . . . . . . . . . . . . . . . . . . . . . . . . . . . . . . . .6
How Consumers Decide To Buy or Not To Buy NonalcoholicBeverages . . . . . . . . . . . . . . . . . . . . . . . . . . . . . . . . . . . . . . . . . . . . . . . . . . .10
Regression Analysis of Caloric, Calcium, Vitamin C, andCaffeine Intakes . . . . . . . . . . . . . . . . . . . . . . . . . . . . . . . . . . . . . . . . . . . . . 16
Preparation of the 1999 ACNielsen Homescan Panel Data . . . . . . . . . . . . 19
Conclusions . . . . . . . . . . . . . . . . . . . . . . . . . . . . . . . . . . . . . . . . . . . . . . . . 28
References . . . . . . . . . . . . . . . . . . . . . . . . . . . . . . . . . . . . . . . . . . . . . . . . . 30
Figures 1-41 . . . . . . . . . . . . . . . . . . . . . . . . . . . . . . . . . . . . . . . . . . . . . . . . 32
Appendix: Data tables 1-24 are accessible at www.ers.usda.gov/
publications/err1/DataTables
iiiContribution of Nonalcoholic Beverages to the U.S. Diet / ERR-1
Economic Research Service/USDA
Summary
Obesity is the most urgent nutrition-related health problem in America today,so the potential calorie and nutrient contribution of beverages to that increasein overweight and obesity is important to consider. Consumers are offered anever-increasing number of choices among nonalcoholic beverages, and there isa trend toward decreased consumption of milk and increased consumption ofother beverages, especially soft drinks and bottled water. Beverage choicesmay have important implications for intake of calories and therefore for obesityrisk, as well as for adequacy of important nutrients such as calcium. The focusof this report is the nutrient availability from nonalcoholic beverages purchasedfor at-home consumption. Analyses are based on the 1999 ACNielsenHomescan data from 7,195 household panelists, who were nationally represen-tative of all U.S. household level purchases.
Understanding beverage choices of households has policy significance forthe U.S. Department of Agriculture (USDA) because it is the lead Federalagency that provides nutrition information to the public. Through the FoodGuide Pyramid, the Dietary Guidelines for Americans, and related materials,USDA provides consumers with information on food and beverage choicesthat contribute to a healthful diet. Current USDA dietary guidance publica-tions include advice on beverages. For example, the Food Guide Pyramidfor Children recommends two servings from the milk group daily andincludes a picture of a soft drink in the tip of the Pyramid, indicating thatsoft drinks should be consumed only occasionally.
USDA provided food assistance and nutrition benefits to one out of fiveAmericans at a cost of $41.6 billion in fiscal year 2003. The largest of theseprograms, the Food Stamp Program, allows consumers to make their own foodpurchase choices, while also attempting to educate low-income households touse their food assistance benefits to make wise food choices. Other programs,such as the Special Supplemental Nutrition Program for Women, Infants, andChildren (WIC), the Child and Adult Care Food Program (CACFP), and theSchool Meals Programs mandate certain choices. School Meal Program regula-tions require that soft drinks not be served while USDA-subsidized meals areserved, and WIC vouchers are valid only for certain food purchases, with milkand vitamin C-rich fruit juices the only allowable beverage choices. The ChildNutrition Programs (CACFP, School Meal Programs, and Summer FoodService Program) require that the meals and snacks subsidized through theseprograms follow a nutritious pattern; fruit juice is a reimbursable item choiceand milk is a required meal element.
Concerns have been raised that the trend of decreased milk consumptionmay contribute to excess calorie consumption and declining intakes ofimportant nutrients such as calcium, especially for youths. Most Americansstill eat many of their meals at home, but food prepared away fromhome—i.e., restaurant, fast-food, and take-out foods—plays a much moreimportant role in today's diet than in previous decades. Given this shift, it isuseful to consider how the beverage choices selected for at-home consump-tion may influence the beverage choices made by consumers when they areaway from home.
ivContribution of Nonalcoholic Beverages to the U.S. Diet / ERR-1
Economic Research Service/USDA

Our findings demonstrate that household beverage choice can have animportant impact on the nutritional quality of the household food supply.The beverage choices a household makes have important effects on house-hold calories, an important consideration given America's current obesityproblem. Beverage choices also have an impact on calcium availability inthe home food supply. Our analysis indicates more households purchasedsoft drinks than milk.
A descriptive analysis of the annual purchases (in gallons), annual expendi-ture (in dollars), and prices (dollars per gallon) is part of this report. Cross-tabulations were used to examine the relationship between demographicvariables and nonalcoholic beverages. The list of demographics analyzedincluded: household income (above or below 130 percent of the povertythreshold, the eligibility level for the Food Stamp Program); household size;age, employment status, and education of the female head of household;race; region; ethnicity (Hispanic origin); and seasonality. The probit analy-ses featured ready-to-drink fruit juices (not frozen); ready-to-drink fruitdrinks; isotonics; powdered soft drinks; tea; coffee; carbonated soft drinks;bottled water; and flavored and unflavored milk. Probit analyses for selectednonalcoholic beverages were conducted to determine the drivers associatedwith the decision to purchase the respective products. Cross-tabulations alsowere done to examine the average caloric, calcium, vitamin C, and caffeineavailable intake for all nonalcoholic beverages by demographic category.And, finally, regression analyses of daily nutrient intakes of calories, calci-um, vitamin C, and caffeine were conducted. The purpose was to understandthe key demographic factors associated with daily nutrient availability fromnonalcoholic beverages.
Employment status of the household head, education of the household head,race, region, and the presence of children were statistically important in thedetermination of daily calories available per person. Available calciumintakes derived from nonalcoholic beverages were lower by 21 milligrams(mg) for households below the 130 percent of poverty threshold (table 1).
vContribution of Nonalcoholic Beverages to the U.S. Diet / ERR-1
Economic Research Service/USDA
Table 1—Summary of nutrients available per person per dayfrom the consumption of all nonalcoholic beverages, 1999
Demographic factor Calories Calcium Vitamin C Caffeine(kcal) (mg1) (mg) (mg)
All persons 194.60 196.16 41.42 87.68> 130% poverty 194.29 197.39 41.77 87.47< 130% poverty 199.58 176.47 35.89 91.12
RegionEast 187.33 183.54 45.49 95.56Central 208.75 217.80 39.81 91.31South 197.94 187.34 42.99 83.36West 178.33 196.75 36.64 82.48
RaceWhite 196.22 210.90 39.70 94.55Black 190.99 107.43 55.65 51.30Asian 135.83 133.77 36.99 42.37Other 190.38 146.77 42.37 60.07
1 mg = milligrams.Source: ERS analysis of ACNielsen Homescan data.
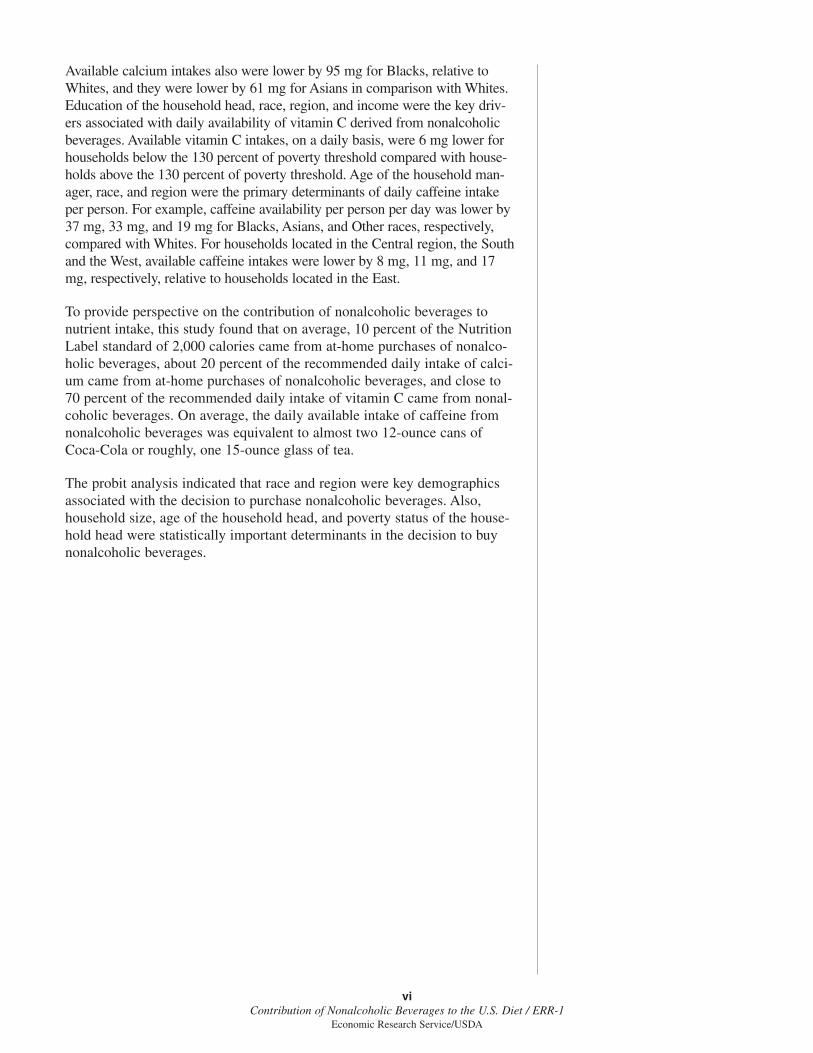
Available calcium intakes also were lower by 95 mg for Blacks, relative toWhites, and they were lower by 61 mg for Asians in comparison with Whites.Education of the household head, race, region, and income were the key driv-ers associated with daily availability of vitamin C derived from nonalcoholicbeverages. Available vitamin C intakes, on a daily basis, were 6 mg lower forhouseholds below the 130 percent of poverty threshold compared with house-holds above the 130 percent of poverty threshold. Age of the household man-ager, race, and region were the primary determinants of daily caffeine intakeper person. For example, caffeine availability per person per day was lower by37 mg, 33 mg, and 19 mg for Blacks, Asians, and Other races, respectively,compared with Whites. For households located in the Central region, the Southand the West, available caffeine intakes were lower by 8 mg, 11 mg, and 17mg, respectively, relative to households located in the East.
To provide perspective on the contribution of nonalcoholic beverages tonutrient intake, this study found that on average, 10 percent of the NutritionLabel standard of 2,000 calories came from at-home purchases of nonalco-holic beverages, about 20 percent of the recommended daily intake of calci-um came from at-home purchases of nonalcoholic beverages, and close to70 percent of the recommended daily intake of vitamin C came from nonal-coholic beverages. On average, the daily available intake of caffeine fromnonalcoholic beverages was equivalent to almost two 12-ounce cans ofCoca-Cola or roughly, one 15-ounce glass of tea.
The probit analysis indicated that race and region were key demographicsassociated with the decision to purchase nonalcoholic beverages. Also,household size, age of the household head, and poverty status of the house-hold head were statistically important determinants in the decision to buynonalcoholic beverages.
viContribution of Nonalcoholic Beverages to the U.S. Diet / ERR-1
Economic Research Service/USDA

Introduction
With so many different types of nonalcoholic beverages from which to choose,what do Americans actually consume? The average American consumed 50gallons of carbonated soft drinks in 1999, followed by 25 gallons of coffee, 23gallons of milk, 16 gallons of bottled water, 16 gallons of fruit juices anddrinks, and 8 gallons of tea, according to Economic Research Service (ERS)food supply data, which includes at-home and away-from-home beverageintake (fig. 1). Almost all fruit juices were consumed at home (82.3 percent),while most soft drink (60.2 percent) and bottled water (69.1 percent) choiceswere consumed away from home (fig. 2).
The nonalcoholic beverage industry is very competitive, with hundreds ofnew products introduced annually. In 1999, the industry spent $165.6million in magazine advertising and $355 million on network televisionadvertising (Statistical Abstract of the United States: 2000). These adver-tising expenditures are lower bounds because these figures do not includethe dairy industry's advertising expenses.
With all of the competing products in this segment, substitution effects aredominant. A study in 1999 revealed that soft drinks had displaced milk andfruit juice (Harnack et al., 1999). The knowledge of such effects is impor-tant in order to be able to understand trends and to monitor the changingenvironment of the nonalcoholic beverage industry.
Articles about nonalcoholic beverages have become common in the press,focusing on their nutrition and the heavy consumption of specific beverages.Articles such as “Obesity Campaign Eyes School Drinks” (Buckley, 2003)and “Legislators Try to Limit Soft Drinks, Sugary Snacks at Schools”(Hellmich, 2003) address the trend of children overconsuming sweetenedbeverages and address ways to correct the problem through various forms ofaction. An article in the Journal of the American Dietetic Association statedthat “consumers who are concerned about energy [caloric] intake should bemade aware of the energy content of beverages, especially soft drinks andalcoholic beverages” (Chanmugan et al., 2003). Excess energy content,measured as calories, is directly related to obesity in children and adults.Obese children are more likely to have health and social problems thanthose who are not obese (Gortmaker et al., 1993).
This study examines the beverage purchase choices made by households andthe nutritional consequences of those choices. The subject has policy signifi-cance for the U. S. Department of Agriculture (USDA) because it is the leadFederal agency for providing nutrition information to the public. Through theFood Guide Pyramid, the Dietary Guidance for Americans (produced jointlyby USDA and the Department of Health and Human Services), and relatedmaterials, USDA provides consumers with information on the food andbeverage choices they should make to have healthy diets. Many governmentprograms tied to nutrition are in need of information on nonalcoholicbeverage consumption. The Food Stamp Program, National School LunchProgram, School Breakfast Program, and Special Supplemental NutritionProgram for Women, Infants, and Children are examples of USDA-sponsoredfood assistance programs. USDA provided food assistance and nutrition
1Contribution of Nonalacoholic Beverages to the U.S. Diet / ERR-1
Economic Research Service/USDA
benefits to one out of five Americans at a cost of $41.6 billion in fiscal year2003. The largest of these programs, the Food Stamp Program, allowsconsumers to make their own food purchase choices. But, through funding forfood stamp nutrition education, the program attempts to educate low-incomehouseholds to use their food assistance benefits to make wise food choices.
Other programs, such as the Special Supplemental Nutrition Program forWomen, Infants, and Children (WIC), Child and Adult Care Food Program(CACFP), and the School Meals Programs, mandate certain choices. WICvouchers can be spent only on certain foods, with milk and vitamin C-rich fruitjuices the only beverage choices allowed for women and young children. TheChild Nutrition Programs (CACFP, School Meal Programs, and Summer FoodService Program) require that meals and snacks subsidized through theseprograms follow a nutritious pattern, with milk a required element in meals.Fruit juice also is allowed.
By contract, School Meal Program regulations require that soft drinks not beserved while USDA-subsidized meals are being served, although soft drinkscan be available in vending machines in other locations in some of theseschools. Despite USDA efforts to encourage milk and juice beverage choices,there has been a trend among schoolchildren to drink less milk and to drinkmore of other beverages, especially soft drinks. Concerns have been raised thatthis trend may contribute to excess calorie consumption and declining intakesof important nutrients such as calcium. More recently, trends seem to beshifting, with bottled water consumption becoming increasingly important.
Policy Implications
Understanding beverage choices made by households, especially low-incomehouseholds and households with children, is important to guiding USDA nutri-tion policy. The media coverage regarding obesity and nutrition-related healthconcerns of the increased consumption of sweetened nonalcoholic beverageshas called attention to the problem. This study provides economic and nutri-tional benefit information on nonalcoholic beverage consumption for futurestudies. The findings are useful for the design of nutrition education programsand may also provide insights into how nutrition guidelines for foods providedthrough WIC and the Child Nutrition Programs can improve the overall nutri-tional quality of children’s diets.
Influence of Beverage Choice on Obesityand Overweight
As a category, beverages vary tremendously in their energy (calorie) contentand nutrient composition. Therefore, beverage choice has an important influ-ence on dietary quality and the risk of obesity and overweight. With over-weight and obesity now considered the most important nutrition-related healthproblem in America (HHS, Healthy People 2010, 2003), the caloric contribu-tion of beverages to the problem is important. Such beverages offer a widerange of calorie options—from 0 calories for bottled water and diet soft drinksto high-calorie coffee drinks that can provide more than 400 calories per 16-ounce cup (Yale-New Haven Nutrition Advisor, 2004).
2Contribution of Nonalcoholic Beverages to the U.S. Diet / ERR-1
Economic Research Service/USDA
Research indicates that calories from liquids (especially clear, nonviscousliquids like soft drinks and juices) are regulated differently than calories fromsolid food (Mattes, 1996). They do not trigger feelings of satiety that limitadditional eating. Therefore, beverage preferences may be important foravoiding excess eating and cutting the risk of obesity. Individuals who preferwater or diet soft drinks run less risk of excess calorie consumption than thosewho prefer caloric beverages.
Impact on Nutrient Intake
Nutrients can be obtained from many different food sources, including bever-ages. Milk, in particular, is a major source of calcium and vitamin D, twonutrients that are of current public health concern (HHS, Healthy People 2010,2003). Yen and Lin (2002), in an analysis of USDA food consumption surveydata, found that on average, for each 1-ounce reduction in milk consumption, achild’s calcium consumption declines by 34 mg.
Juices vary in nutrient content depending on the fruit or vegetable fromwhich they are extracted, but they are generally good sources of vitamin C,either naturally or through fortification. USDA’s WIC program includesvitamin C-rich fruit and vegetable juices in the package it provides to recipi-ents. Fruit-flavored drinks and “-ades” (e.g., lemonade) are commonly forti-fied with vitamin C. They also are sources of added sugars, a nutrientcategory that USDA’s Food Guide Pyramid recommends limiting. Amongthe general population, fruit-flavored drinks and “ades” contribute approxi-mately 10 percent to total consumption of added sugars. They are a moreimportant source of added sugars for young children, contributing approxi-mately 19 percent to the added-sugars intake of children 2-5 years of age(Guthrie and Morton, 2000).
Soft drinks are the major source of added sugars in American diets,contributing approximately a third of the added-sugars intake of Americans 2years of age and older (Guthrie and Morton, 2000). Soft-drink consumptionhas risen dramatically in the past decades; USDA food supply data show thatavailability of regular soft drinks rose from 28.7 gallons per capita in 1977 to ahigh of 38.2 gallons in 1999. Figures for 2000-01 show a slight decline to 37.2gallons per capita in 2001. Despite Americans’ professed concern with losingweight, diet soft drinks grew slowly from 4.3 gallons per capita in 1977 to 11.8gallons per capita in 2001.
Soft drinks may displace more nutritious beverages from the diet and, if thesoft drinks are sweetened (nondiet), they add calories. Yen and Lin found that,on average, for each 1-ounce reduction in milk consumption, a child consumes4.2 ounces of soft drinks, resulting in a net gain of 31 calories, as well as a lossin calcium intake.
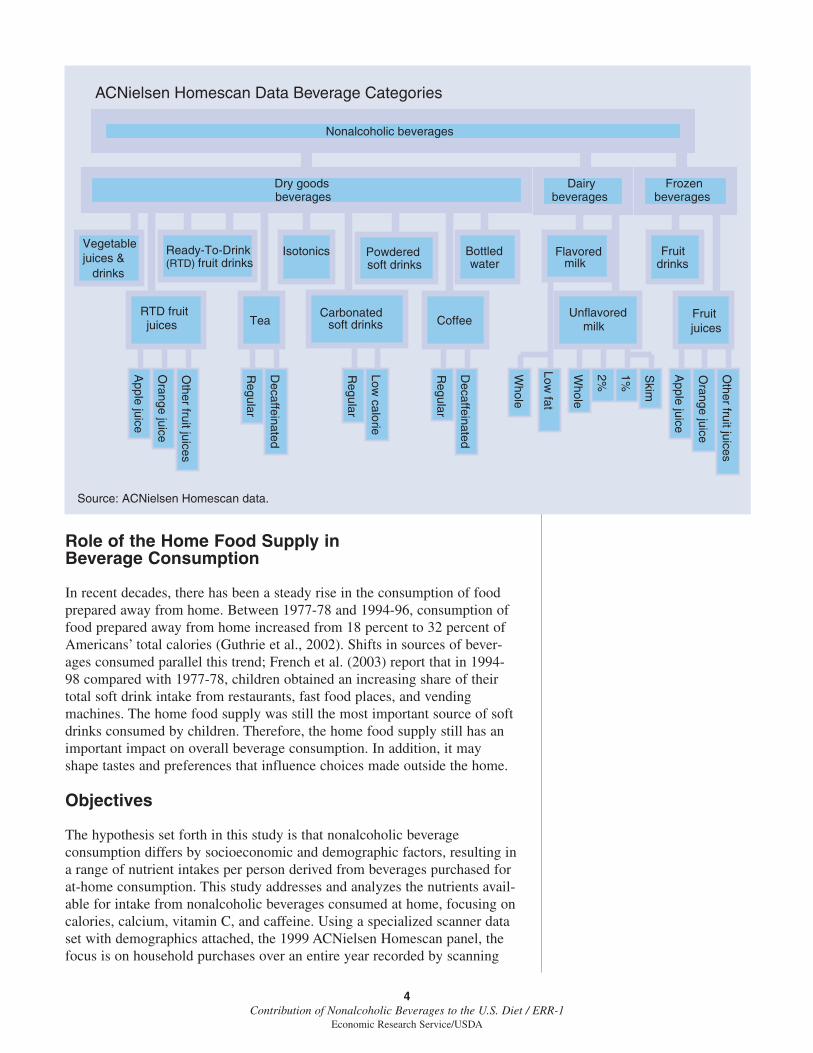
The growth of soft-drink consumption also has made these beverages majorcontributors to caffeine intake, especially among children. Ahuja and Perloff(2001) estimate that caffeine-containing carbonated beverages contribute 52percent of the caffeine in the diets of children 9 years of age and younger.Chocolate milk, coffee, and tea also contribute caffeine to the diets of chil-dren and adults. (See”Beverage Categories” box for list of drinks.)
3Contribution of Nonalcoholic Beverages to the U.S. Diet / ERR-1
Economic Research Service/USDA
Role of the Home Food Supply inBeverage Consumption
In recent decades, there has been a steady rise in the consumption of foodprepared away from home. Between 1977-78 and 1994-96, consumption offood prepared away from home increased from 18 percent to 32 percent ofAmericans’ total calories (Guthrie et al., 2002). Shifts in sources of bever-ages consumed parallel this trend; French et al. (2003) report that in 1994-98 compared with 1977-78, children obtained an increasing share of theirtotal soft drink intake from restaurants, fast food places, and vendingmachines. The home food supply was still the most important source of softdrinks consumed by children. Therefore, the home food supply still has animportant impact on overall beverage consumption. In addition, it mayshape tastes and preferences that influence choices made outside the home.
Objectives
The hypothesis set forth in this study is that nonalcoholic beverageconsumption differs by socioeconomic and demographic factors, resulting ina range of nutrient intakes per person derived from beverages purchased forat-home consumption. This study addresses and analyzes the nutrients avail-able for intake from nonalcoholic beverages consumed at home, focusing oncalories, calcium, vitamin C, and caffeine. Using a specialized scanner dataset with demographics attached, the 1999 ACNielsen Homescan panel, thefocus is on household purchases over an entire year recorded by scanning
4Contribution of Nonalcoholic Beverages to the U.S. Diet / ERR-1
Economic Research Service/USDA
Nonalcoholic beverages
Dry goodsbeverages
Frozenbeverages
Vegetablejuices &
drinks
Flavoredmilk
Fruit juices
Fruitdrinks
Bottledwater
IsotonicsReady-To-Drink(RTD) fruit drinks
RTD fruitjuices
UnflavoredmilkTea
Carbonated soft drinks Coffee
Powderedsoft drinks
Apple juice
Orange juice
Other fruit juices
Decaffeinated
Regular
Low calorie
Regular
Decaffeinated
Whole
1%
Skim
Whole
Low fat
Orange juice
Other fruit juices
Dairybeverages
Regular
2%
Apple juice
Source: ACNielsen Homescan data.
ACNielsen Homescan Data Beverage Categories

equipment. USDA also employs the Continuing Survey of Food Intakes forIndividuals (CSFII), which focuses on food intake, based on individualrecall, over 2 nonconsecutive days (within a 3-week period). Consequently,the Homescan panel offers a potentially richer and more recent databasethan the CSFII, which has not been done since 1994-98.
A limitation of the Homescan panel is that it reflects only household avail-ability of nutrients; there is no further diaggregation into within-householddifferences in consumption. Moreover, some food purchased for homeconsumption may go uneaten or be consumed by guests. Nevertheless,purchasing patterns provide insight into the beverage choices available tohousehold members and can be particularly useful for nutrition educationprograms that include information on improving household purchasingchoices, such as USDA Food Stamp Nutrition Education.
A comparative investigation of both at-home and away-from-home intakesof selected products would be ideal. This study, however, will center atten-tion only on at-home household use of the selected products, for two majorreasons. First, data on away-from-home consumption with household demo-graphic variables are not generally available for such research. Availabledata are focused on at-home consumption and do not reflect away-from-home consumption patterns. Second, available price series are limited tocommodities and products consumed in the at-home market.
5Contribution of Nonalcoholic Beverages to the U.S. Diet / ERR-1
Economic Research Service/USDA
Analysis of Average Available Intakes ofCalories, Calcium, Vitamin C, and Caffeine
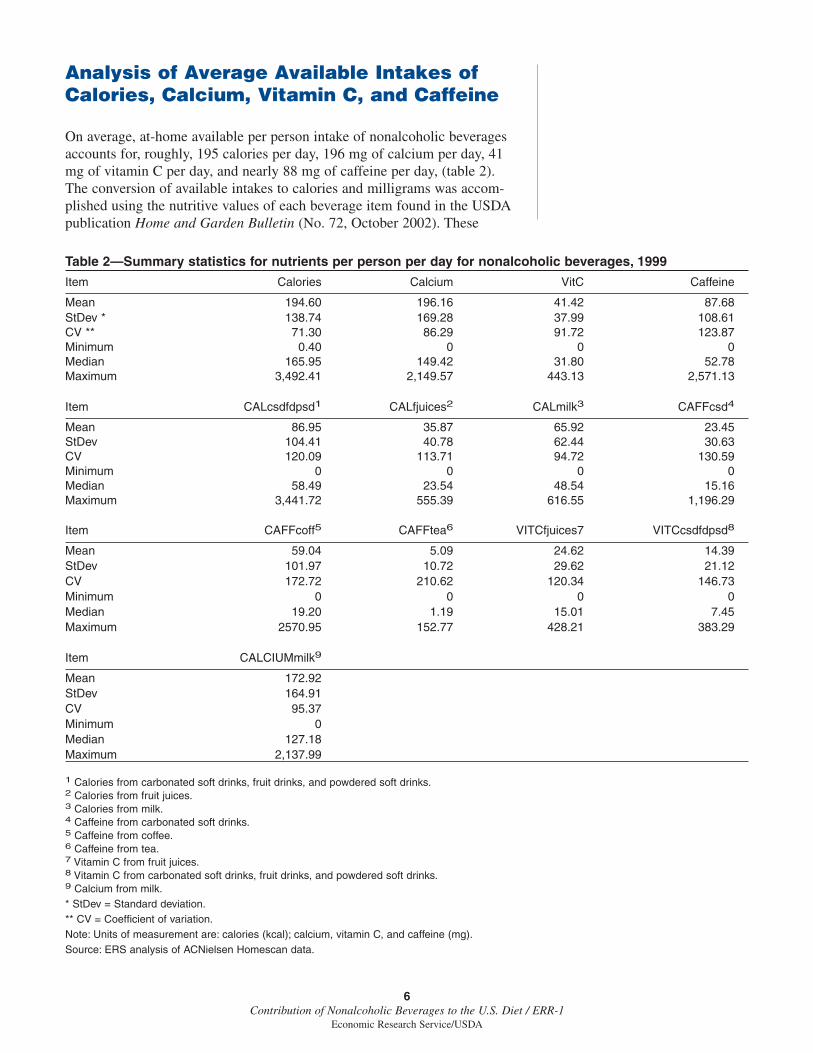
On average, at-home available per person intake of nonalcoholic beveragesaccounts for, roughly, 195 calories per day, 196 mg of calcium per day, 41mg of vitamin C per day, and nearly 88 mg of caffeine per day, (table 2).The conversion of available intakes to calories and milligrams was accom-plished using the nutritive values of each beverage item found in the USDApublication Home and Garden Bulletin (No. 72, October 2002). These
6Contribution of Nonalcoholic Beverages to the U.S. Diet / ERR-1
Economic Research Service/USDA
Table 2—Summary statistics for nutrients per person per day for nonalcoholic beverages, 1999
Item Calories Calcium VitC Caffeine
Mean 194.60 196.16 41.42 87.68StDev * 138.74 169.28 37.99 108.61CV ** 71.30 86.29 91.72 123.87Minimum 0.40 0 0 0Median 165.95 149.42 31.80 52.78Maximum 3,492.41 2,149.57 443.13 2,571.13
Item CALcsdfdpsd1 CALfjuices2 CALmilk3 CAFFcsd4
Mean 86.95 35.87 65.92 23.45StDev 104.41 40.78 62.44 30.63CV 120.09 113.71 94.72 130.59Minimum 0 0 0 0Median 58.49 23.54 48.54 15.16Maximum 3,441.72 555.39 616.55 1,196.29
Item CAFFcoff5 CAFFtea6 VITCfjuices7 VITCcsdfdpsd8
Mean 59.04 5.09 24.62 14.39StDev 101.97 10.72 29.62 21.12CV 172.72 210.62 120.34 146.73Minimum 0 0 0 0Median 19.20 1.19 15.01 7.45Maximum 2570.95 152.77 428.21 383.29
Item CALCIUMmilk9
Mean 172.92StDev 164.91CV 95.37Minimum 0Median 127.18Maximum 2,137.99
1 Calories from carbonated soft drinks, fruit drinks, and powdered soft drinks.2 Calories from fruit juices.3 Calories from milk.4 Caffeine from carbonated soft drinks.5 Caffeine from coffee.6 Caffeine from tea.7 Vitamin C from fruit juices.8 Vitamin C from carbonated soft drinks, fruit drinks, and powdered soft drinks.9 Calcium from milk.* StDev = Standard deviation.** CV = Coefficient of variation.Note: Units of measurement are: calories (kcal); calcium, vitamin C, and caffeine (mg).Source: ERS analysis of ACNielsen Homescan data.
figures subsequently were divided by 365 and were further divided by house-hold size. Major contributors to available calories from nonalcoholic beverageswere carbonated soft drinks; fruit drinks and powdered soft drinks (about 45percent); fruit juices (about 18 percent); and milk (about 34 percent). Milk alsowas responsible for roughly 88 percent of the calcium available from thenonalcoholic beverage category. Fruit juices contributed almost 60 percent ofthe vitamin C available from nonalcoholic beverages, while carbonated softdrinks, fruit drinks, and powdered soft drinks contributed 35 percent of thevitamin C available, on average. Coffee, carbonated soft drinks, and teaaccounted for 67 percent, 27 percent, and 6 percent, respectively, of thecaffeine available from nonalcoholic beverages.
To give these descriptive findings more perspective, using the same 2,000 calo-ries per day standard as is used for nutrition labeling of food, 10 percent ofcalories would come from the at-home purchase of nonalcoholic beverages. Onaverage, about 20 percent of the nutrition label daily value (DV) for calciumand close to 70 percent of the daily value for vitamin C come from nonalco-holic beverages. On average, the daily available intake of caffeine from nonal-coholic beverages was equivalent to almost two 12-ounce cans of Coca-Cola,about one 7-ounce cup of coffee, or roughly a 15-ounce glass of iced tea.
Demographic Analysis
Available nutritional intake from nonalcoholic beverages varied by differentdemographic factors. This section includes a discussion of the factors includingrace, income, education of female head, employment of female head, age offemale head, household size, and the presence of children.
Hispanic/Non-Hispanic
On average, availability of calories, calcium, vitamin C, and caffeine werelower for Hispanics than for non-Hispanics (fig. 3, data table 1). Noteworthydifferences in available intakes for Hispanics and non-Hispanics centered oncalcium and caffeine. Available calcium intake for Hispanics was lower byroughly 30 mg per day in comparison with non-Hispanics. Available caffeineintake for Hispanics was lower by about 20 mg per day relative to non-Hispanics.
Region
Available caloric intake on a per-person-per-day basis from nonalcoholicbeverages was lowest in the West, 178 kcal, and highest in the Central region,209 kcal (fig. 4, data table 2). Available calcium intakes, on average, rangedfrom 184 mg per person per day in the East to 218 mg per person per day inthe Central region. Available vitamin C intake from nonalcoholic beverages, onaverage, varied from 37 mg in the West to 45 mg in the East. Available caffeineintakes, on average, were lowest in the West and South (82 mg and 83 mg,respectively) and highest in the Central region and the East (91 mg and 96 mg,respectively).
Race
On a per-person-per-day basis, Asians had the lowest available intake ofcalories, vitamin C, and caffeine on average, whereas Whites had the
7Contribution of Nonalcoholic Beverages to the U.S. Diet / ERR-1
Economic Research Service/USDA
highest available intake of these nutrients, except for vitamin C, on average(fig. 5, data table 3). Blacks had the highest available intake of vitamin Cper person per day, and Blacks had the lowest available intake of calciumper person per day.
Poverty Status
In households classified below the 130 percent of poverty threshold, avail-able caloric and caffeine intakes on a per-person-per-day basis were about 4to 5 kcal higher than in households classified as above the 130 percent ofpoverty thresholds (fig. 6, data table 4). Available calcium intake and avail-able vitamin C intake, however, were about 20 mg and 6 mg lower forhouseholds below the 130 percent of poverty threshold than for householdsabove the 130 percent of poverty threshold.
Education of Female Head
In households where the female head was a college graduate, availablecaloric, calcium, and caffeine intakes from nonalcoholic beverages on a per-person-per-day basis were lower than in households where the female headwas not a college graduate (fig. 7, data table 5). The situation was thereverse in the case of vitamin C availability.
Employment of Female Head
In households where the female head was not employed for pay, averageavailable intakes of calories, calcium, vitamin C, and caffeine from nonalco-holic beverages were higher in comparison with households where thefemale head was employed (fig. 8, data table 6). These data, however, wereassociated with at-home consumption of nonalcoholic beverages, and assuch, this result was perhaps not too surprising because we suspect thathouseholds with an employed female head eat more away-from-home mealsthan unemployed female headed households.
Age of Female Head
In households where the female head was younger than 25 years of age,available caloric intakes from nonalcoholic beverages, principally for at-home consumption, were highest (fig. 9, data table 7). Available caloricintakes, on average, were lowest for female heads between 25 and 29 yearsof age. Calcium, vitamin C, and caffeine available intakes from nonalco-holic beverages were highest for female heads at least 55 years of age.Calcium and vitamin C available intakes were lowest for female headsbetween 25 and 34 years of age. Caffeine available intakes were lowest forfemale heads younger than 25 years of age.
Household Size
Except for households with eight members, daily per person availableintakes of calories, calcium, vitamin C, and caffeine decreased almostmonotonically with household size (fig. 10, data table 8).
Presence of Children
Average available calcium, vitamin C, and caffeine intakes from nonalco-holic beverages on a per-person-per-day were higher in households with no
8Contribution of Nonalcoholic Beverages to the U.S. Diet / ERR-1
Economic Research Service/USDA
children relative to households with children either younger than 6, 6 to 12,or 13 to 17 years of age (figs. 11a, 11b; data table 9). Households with chil-dren 13 to 17 years of age had higher daily available caloric intakes perperson than did households with no children, but it was difficult to deter-mine if this result was a scale effect.
9Contribution of Nonalcoholic Beverages to the U.S. Diet / ERR-1
Economic Research Service/USDA
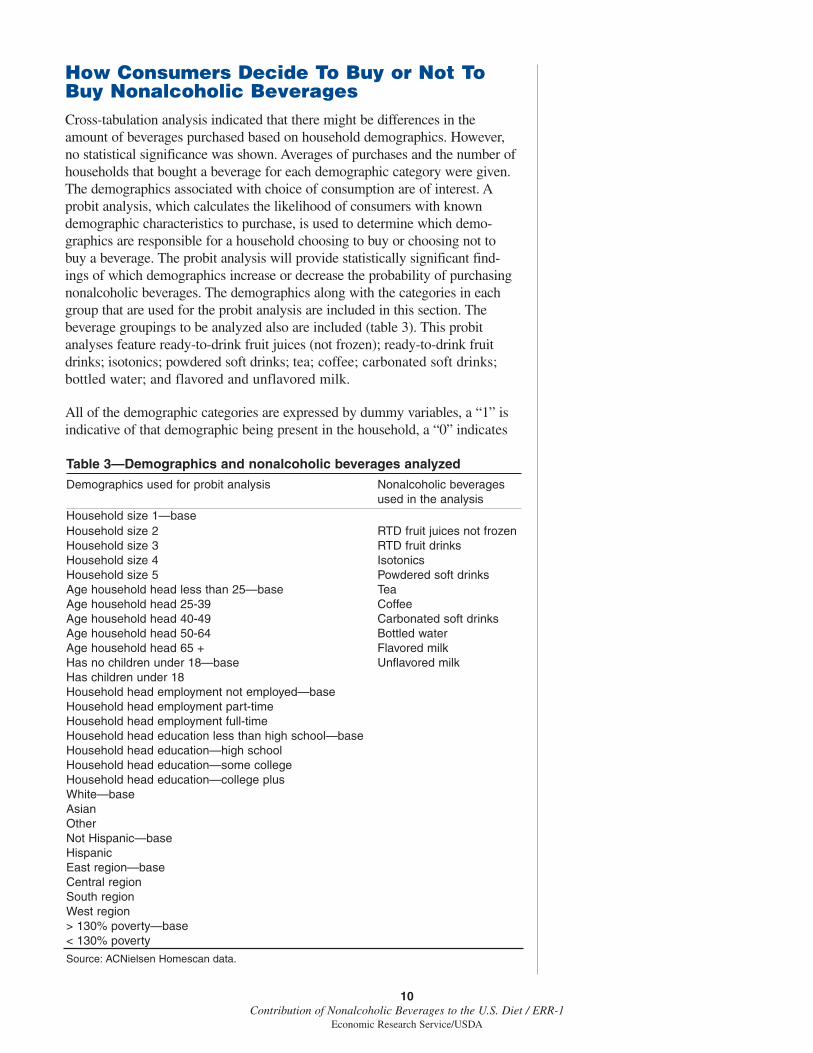
How Consumers Decide To Buy or Not ToBuy Nonalcoholic Beverages Cross-tabulation analysis indicated that there might be differences in theamount of beverages purchased based on household demographics. However,no statistical significance was shown. Averages of purchases and the number ofhouseholds that bought a beverage for each demographic category were given.The demographics associated with choice of consumption are of interest. Aprobit analysis, which calculates the likelihood of consumers with knowndemographic characteristics to purchase, is used to determine which demo-graphics are responsible for a household choosing to buy or choosing not tobuy a beverage. The probit analysis will provide statistically significant find-ings of which demographics increase or decrease the probability of purchasingnonalcoholic beverages. The demographics along with the categories in eachgroup that are used for the probit analysis are included in this section. Thebeverage groupings to be analyzed also are included (table 3). This probitanalyses feature ready-to-drink fruit juices (not frozen); ready-to-drink fruitdrinks; isotonics; powdered soft drinks; tea; coffee; carbonated soft drinks;bottled water; and flavored and unflavored milk.
All of the demographic categories are expressed by dummy variables, a “1” isindicative of that demographic being present in the household, a “0” indicates
10Contribution of Nonalcoholic Beverages to the U.S. Diet / ERR-1
Economic Research Service/USDA
Table 3—Demographics and nonalcoholic beverages analyzed
Demographics used for probit analysis Nonalcoholic beveragesused in the analysis
Household size 1—baseHousehold size 2 RTD fruit juices not frozenHousehold size 3 RTD fruit drinksHousehold size 4 IsotonicsHousehold size 5 Powdered soft drinksAge household head less than 25—base TeaAge household head 25-39 CoffeeAge household head 40-49 Carbonated soft drinksAge household head 50-64 Bottled waterAge household head 65 + Flavored milkHas no children under 18—base Unflavored milkHas children under 18Household head employment not employed—baseHousehold head employment part-timeHousehold head employment full-timeHousehold head education less than high school—baseHousehold head education—high schoolHousehold head education—some collegeHousehold head education—college plusWhite—baseAsianOtherNot Hispanic—baseHispanicEast region—baseCentral regionSouth regionWest region> 130% poverty—base< 130% poverty
Source: ACNielsen Homescan data.

otherwise. The base categories listed are not placed into the probit equationsto avoid perfect collinearity. As a result, the findings must be compared rela-tive to the base category. For example, households in the Central regionwere statistically more likely to purchase powdered soft drinks than werehouseholds in the eastern region (the base category).
The probit results are summarized in table 4. Each beverage is listed alongwith the demographic group. If the demographic category was statisticallysignificant (at the 95-percent confidence level) in affecting the decision toconsume the beverage, then an “X” is presented in the table. An F-test wasconducted on the categories in each demographic group to find the statisti-cally significant drivers.
Race and region of the household were important in the decision topurchase many of the beverages. Household size and age of the head ofhousehold affected the decision to buy for all 10 beverages examined. Thedemographic of household size is understandable since larger householdstypically purchase more goods at grocery stores and would be less apt to eataway from the home. The presence of a child in a household affected thedecision of a household to purchase fruit drinks, isotonics, powdered softdrinks, and flavored milk. Poverty status of the household affected four ofthe beverages studied: fruit juices, isotonics, powdered soft drinks, andbottled water.
11Contribution of Nonalcoholic Beverages to the U.S. Diet / ERR-1
Economic Research Service/USDA
Table 4—Summary of probit analysisHousehold Age of Presence of Female
Item size female Head children employment
RTD fruit juices not frozen X XRTD fruit drinks X X XIsotonics X X XPowdered soft drinks X X XTea X XCoffee X X XCarbonated soft drinks X XBottled water X XFlavored milk X X XUnflavored milk X X
FemaleItem education Race Hispanic Region Poverty
RTD fruit juices not frozen X X X XRTD fruit drinks X XIsotonics X X XPowdered soft drinks X X X XTea XCoffee X X X XCarbonated soft drinks XBottled water X X XFlavored milk X X XUnflavored milk
Note: This table shows which demographics are significant (95% level) in determining whether or not a householdconsumes any of the beverages. If an "X" appears then the demographic is significant.Source: ERS analysis of ACNielsen Homescan data.
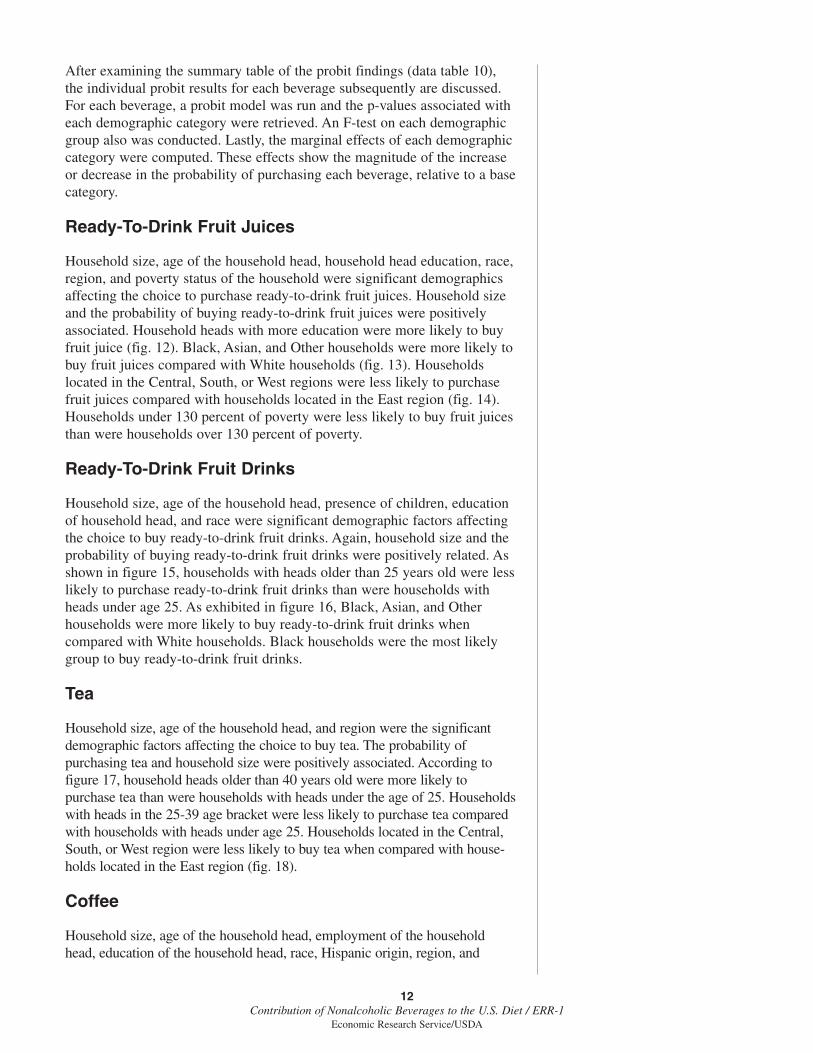
After examining the summary table of the probit findings (data table 10),the individual probit results for each beverage subsequently are discussed.For each beverage, a probit model was run and the p-values associated witheach demographic category were retrieved. An F-test on each demographicgroup also was conducted. Lastly, the marginal effects of each demographiccategory were computed. These effects show the magnitude of the increaseor decrease in the probability of purchasing each beverage, relative to a basecategory.
Ready-To-Drink Fruit Juices
Household size, age of the household head, household head education, race,region, and poverty status of the household were significant demographicsaffecting the choice to purchase ready-to-drink fruit juices. Household sizeand the probability of buying ready-to-drink fruit juices were positivelyassociated. Household heads with more education were more likely to buyfruit juice (fig. 12). Black, Asian, and Other households were more likely tobuy fruit juices compared with White households (fig. 13). Householdslocated in the Central, South, or West regions were less likely to purchasefruit juices compared with households located in the East region (fig. 14).Households under 130 percent of poverty were less likely to buy fruit juicesthan were households over 130 percent of poverty.
Ready-To-Drink Fruit Drinks
Household size, age of the household head, presence of children, educationof household head, and race were significant demographic factors affectingthe choice to buy ready-to-drink fruit drinks. Again, household size and theprobability of buying ready-to-drink fruit drinks were positively related. Asshown in figure 15, households with heads older than 25 years old were lesslikely to purchase ready-to-drink fruit drinks than were households withheads under age 25. As exhibited in figure 16, Black, Asian, and Otherhouseholds were more likely to buy ready-to-drink fruit drinks whencompared with White households. Black households were the most likelygroup to buy ready-to-drink fruit drinks.
Tea
Household size, age of the household head, and region were the significantdemographic factors affecting the choice to buy tea. The probability ofpurchasing tea and household size were positively associated. According tofigure 17, household heads older than 40 years old were more likely topurchase tea than were households with heads under the age of 25. Householdswith heads in the 25-39 age bracket were less likely to purchase tea comparedwith households with heads under age 25. Households located in the Central,South, or West region were less likely to buy tea when compared with house-holds located in the East region (fig. 18).
Coffee
Household size, age of the household head, employment of the householdhead, education of the household head, race, Hispanic origin, region, and
12Contribution of Nonalcoholic Beverages to the U.S. Diet / ERR-1
Economic Research Service/USDA
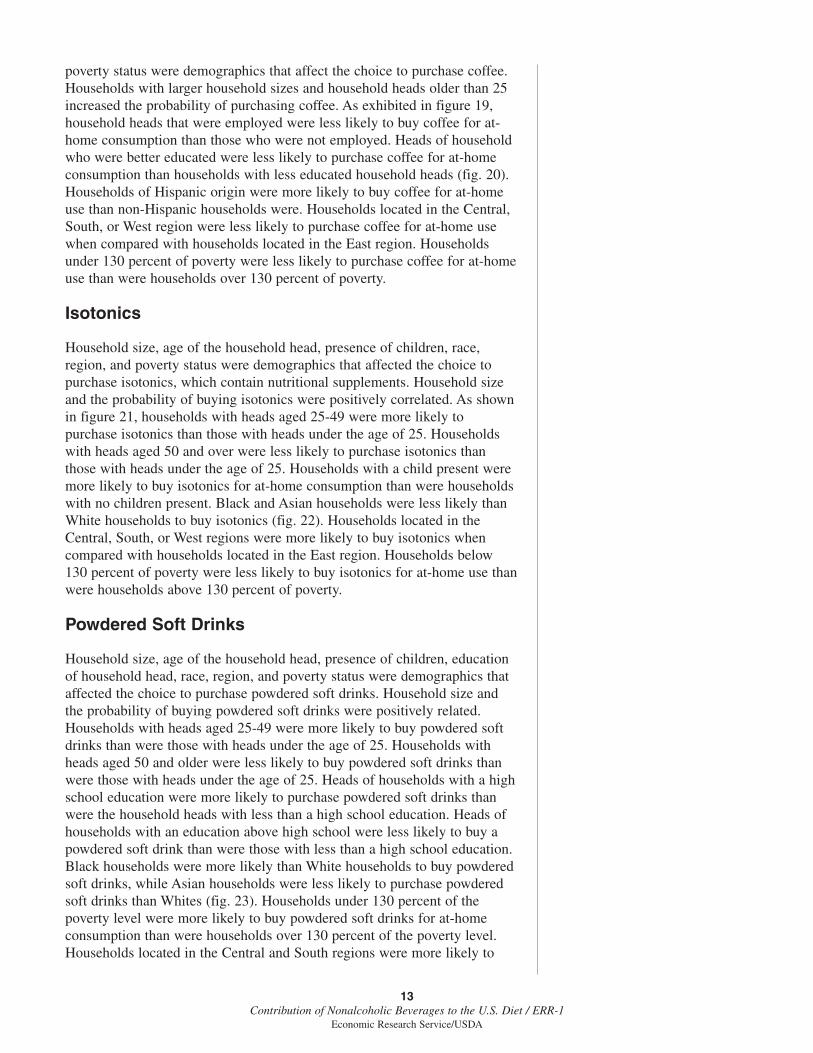
poverty status were demographics that affect the choice to purchase coffee.Households with larger household sizes and household heads older than 25increased the probability of purchasing coffee. As exhibited in figure 19,household heads that were employed were less likely to buy coffee for at-home consumption than those who were not employed. Heads of householdwho were better educated were less likely to purchase coffee for at-homeconsumption than households with less educated household heads (fig. 20).Households of Hispanic origin were more likely to buy coffee for at-homeuse than non-Hispanic households were. Households located in the Central,South, or West region were less likely to purchase coffee for at-home usewhen compared with households located in the East region. Householdsunder 130 percent of poverty were less likely to purchase coffee for at-homeuse than were households over 130 percent of poverty.
Isotonics
Household size, age of the household head, presence of children, race,region, and poverty status were demographics that affected the choice topurchase isotonics, which contain nutritional supplements. Household sizeand the probability of buying isotonics were positively correlated. As shownin figure 21, households with heads aged 25-49 were more likely topurchase isotonics than those with heads under the age of 25. Householdswith heads aged 50 and over were less likely to purchase isotonics thanthose with heads under the age of 25. Households with a child present weremore likely to buy isotonics for at-home consumption than were householdswith no children present. Black and Asian households were less likely thanWhite households to buy isotonics (fig. 22). Households located in theCentral, South, or West regions were more likely to buy isotonics whencompared with households located in the East region. Households below130 percent of poverty were less likely to buy isotonics for at-home use thanwere households above 130 percent of poverty.
Powdered Soft Drinks
Household size, age of the household head, presence of children, educationof household head, race, region, and poverty status were demographics thataffected the choice to purchase powdered soft drinks. Household size andthe probability of buying powdered soft drinks were positively related.Households with heads aged 25-49 were more likely to buy powdered softdrinks than were those with heads under the age of 25. Households withheads aged 50 and older were less likely to buy powdered soft drinks thanwere those with heads under the age of 25. Heads of households with a highschool education were more likely to purchase powdered soft drinks thanwere the household heads with less than a high school education. Heads ofhouseholds with an education above high school were less likely to buy apowdered soft drink than were those with less than a high school education.Black households were more likely than White households to buy powderedsoft drinks, while Asian households were less likely to purchase powderedsoft drinks than Whites (fig. 23). Households under 130 percent of thepoverty level were more likely to buy powdered soft drinks for at-homeconsumption than were households over 130 percent of the poverty level.Households located in the Central and South regions were more likely to
13Contribution of Nonalcoholic Beverages to the U.S. Diet / ERR-1
Economic Research Service/USDA

purchase powdered soft drinks than households located in the East (fig. 24).Households located in the West were less likely to purchase powdered softdrinks compared with the East.
Carbonated Soft Drinks
Household size, household head age, and race influenced the choice to buycarbonated soft drinks. Household size and the probability of buyingcarbonated soft drinks were positively linked. Household heads aged 25 to64 were more likely to buy carbonated soft drinks relative to householdheads under 25, while household heads aged 65 and older were less likely tobuy carbonated soft drinks compared with households with the head underage 25 (fig. 25). Black households were more likely to buy carbonated softdrinks for at-home use than were Whites. Asian and Other races were lesslikely to purchase carbonated soft drinks for at-home use when comparedwith White households (fig. 26).
Bottled Water
Household size, age of the household head, race, region, and poverty statusaffected the choice to purchase bottled water. Household size and the proba-bility of buying bottled water were positively associated. Household headsaged 25 to 64 increased the probability of purchasing bottled water versusthose household heads under age 25. Household heads age 65 and olderlowered the likelihood of bottled water purchases compared with householdheads under age 25. Black, Asian, and Other households were more likely tobuy bottled water than were White households (fig. 27). Households locatedin the central region were less likely than households residing in the East tobuy bottled water, while households located in the West and South weremore likely to buy bottled water relative to households located in the East(fig. 28). Households below 130 percent of poverty level were less likely topurchase bottled water than were households above 130 percent of povertylevel.
Flavored Milk
Household size, age of the household head, presence of children, educationof the household head, race, and region were demographics that influencedthe choice to buy flavored milk. Household size and the probability ofbuying flavored milk were positively correlated. Household heads aged 25to 49 increased the probability of buying flavored milk compared with thosehousehold heads under 25. Household heads age 50 and older lowered thelikelihood of purchasing flavored milk compared with households headedby someone under age 25 (fig. 29). Households with a child present weremore likely to buy flavored milk. Household heads having post-high schooleducation were more likely to purchase flavored milk than were householdheads with less than a high school education. Households where the headhad an education greater than high school were less likely to purchaseflavored milk when compared with households with less than a high schooleducation. Central and South households were more likely to buy flavoredmilk than East households, while West households were less likely to buyflavored milk when compared with East households (fig. 30).
14Contribution of Nonalcoholic Beverages to the U.S. Diet / ERR-1
Economic Research Service/USDA
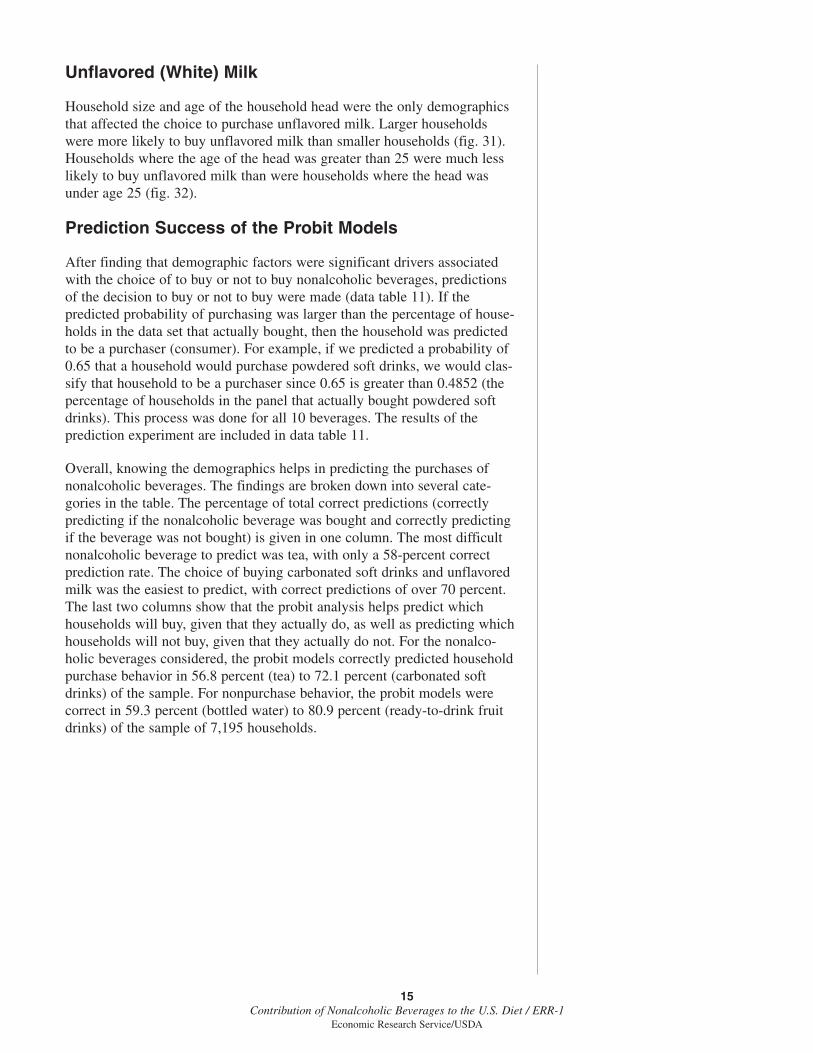
Unflavored (White) Milk
Household size and age of the household head were the only demographicsthat affected the choice to purchase unflavored milk. Larger householdswere more likely to buy unflavored milk than smaller households (fig. 31).Households where the age of the head was greater than 25 were much lesslikely to buy unflavored milk than were households where the head wasunder age 25 (fig. 32).
Prediction Success of the Probit Models
After finding that demographic factors were significant drivers associatedwith the choice of to buy or not to buy nonalcoholic beverages, predictionsof the decision to buy or not to buy were made (data table 11). If thepredicted probability of purchasing was larger than the percentage of house-holds in the data set that actually bought, then the household was predictedto be a purchaser (consumer). For example, if we predicted a probability of0.65 that a household would purchase powdered soft drinks, we would clas-sify that household to be a purchaser since 0.65 is greater than 0.4852 (thepercentage of households in the panel that actually bought powdered softdrinks). This process was done for all 10 beverages. The results of theprediction experiment are included in data table 11.
Overall, knowing the demographics helps in predicting the purchases ofnonalcoholic beverages. The findings are broken down into several cate-gories in the table. The percentage of total correct predictions (correctlypredicting if the nonalcoholic beverage was bought and correctly predictingif the beverage was not bought) is given in one column. The most difficultnonalcoholic beverage to predict was tea, with only a 58-percent correctprediction rate. The choice of buying carbonated soft drinks and unflavoredmilk was the easiest to predict, with correct predictions of over 70 percent.The last two columns show that the probit analysis helps predict whichhouseholds will buy, given that they actually do, as well as predicting whichhouseholds will not buy, given that they actually do not. For the nonalco-holic beverages considered, the probit models correctly predicted householdpurchase behavior in 56.8 percent (tea) to 72.1 percent (carbonated softdrinks) of the sample. For nonpurchase behavior, the probit models werecorrect in 59.3 percent (bottled water) to 80.9 percent (ready-to-drink fruitdrinks) of the sample of 7,195 households.
15Contribution of Nonalcoholic Beverages to the U.S. Diet / ERR-1
Economic Research Service/USDA
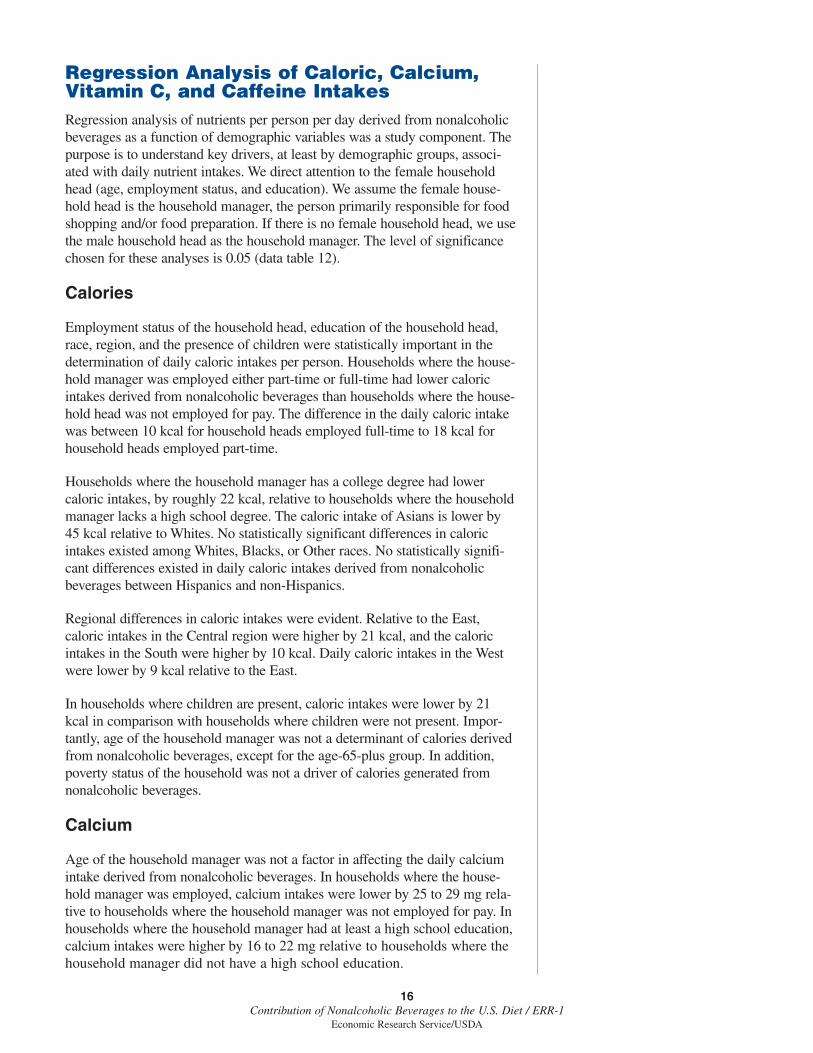
Regression Analysis of Caloric, Calcium,Vitamin C, and Caffeine Intakes Regression analysis of nutrients per person per day derived from nonalcoholicbeverages as a function of demographic variables was a study component. Thepurpose is to understand key drivers, at least by demographic groups, associ-ated with daily nutrient intakes. We direct attention to the female householdhead (age, employment status, and education). We assume the female house-hold head is the household manager, the person primarily responsible for foodshopping and/or food preparation. If there is no female household head, we usethe male household head as the household manager. The level of significancechosen for these analyses is 0.05 (data table 12).
Calories
Employment status of the household head, education of the household head,race, region, and the presence of children were statistically important in thedetermination of daily caloric intakes per person. Households where the house-hold manager was employed either part-time or full-time had lower caloricintakes derived from nonalcoholic beverages than households where the house-hold head was not employed for pay. The difference in the daily caloric intakewas between 10 kcal for household heads employed full-time to 18 kcal forhousehold heads employed part-time.
Households where the household manager has a college degree had lowercaloric intakes, by roughly 22 kcal, relative to households where the householdmanager lacks a high school degree. The caloric intake of Asians is lower by45 kcal relative to Whites. No statistically significant differences in caloricintakes existed among Whites, Blacks, or Other races. No statistically signifi-cant differences existed in daily caloric intakes derived from nonalcoholicbeverages between Hispanics and non-Hispanics.
Regional differences in caloric intakes were evident. Relative to the East,caloric intakes in the Central region were higher by 21 kcal, and the caloricintakes in the South were higher by 10 kcal. Daily caloric intakes in the Westwere lower by 9 kcal relative to the East.
In households where children are present, caloric intakes were lower by 21kcal in comparison with households where children were not present. Impor-tantly, age of the household manager was not a determinant of calories derivedfrom nonalcoholic beverages, except for the age-65-plus group. In addition,poverty status of the household was not a driver of calories generated fromnonalcoholic beverages.
Calcium
Age of the household manager was not a factor in affecting the daily calciumintake derived from nonalcoholic beverages. In households where the house-hold manager was employed, calcium intakes were lower by 25 to 29 mg rela-tive to households where the household manager was not employed for pay. Inhouseholds where the household manager had at least a high school education,calcium intakes were higher by 16 to 22 mg relative to households where thehousehold manager did not have a high school education.
16Contribution of Nonalcoholic Beverages to the U.S. Diet / ERR-1
Economic Research Service/USDA
Calcium intakes were lower by 95 mg for Blacks relative to Whites; alsothey were lower by 61 mg for Asians in comparison with Whites. No statis-tically significant differences existed in daily calcium intakes derived fromnonalcoholic beverages between Hispanics and non-Hispanics.
Daily intakes of calcium were higher by almost 30 mg for the Centralregion relative to the East. No significant differences existed however incalcium intakes between the South, the West, and the East. Importantly,calcium intakes derived from nonalcoholic beverages were lower by 21 mgfor households below the 130 percent of poverty threshold relative to house-holds above the 130 percent of poverty threshold level (table 1). In house-holds where children were present, calcium intakes were lower by nearly 11mg compared with households where children were not present.
Vitamin C
Age of the household manager was not a key factor in affecting dailyvitamin C intakes derived from nonalcoholic beverages. In householdswhere children were present, daily vitamin C intake was lower by almost 7mg relative to households where children were not present.
In households where the household manager was employed either part-timeor full-time, vitamin C intakes were lower by 1 to 4 mg relative to house-holds where the household manager was not employed for pay. In house-holds where the household manager had at least a high school education,vitamin C intakes were higher by 4 to 9 mg relative to households where thehousehold manager did not have a high school education.
Vitamin C intakes were higher by nearly 17 mg for Blacks compared withWhites. They also were higher by 6 mg for Other races, excluding Asians,compared with Whites. No significant differences existed in vitamin Cintake generated from nonalcoholic beverages between Whites and Asians.No significant differences existed in vitamin C intake between Hispanicsand non-Hispanics.
Daily vitamin C intake was highest in the East. The difference in vitamin Cintake between the East and the Central region was slightly more than 5 mg;between the East and the South about 3 mg; and between the East and theWest nearly 9 mg. Vitamin C intakes derived from nonalcoholic beverageswere lower by almost 6 mg for households below the 130 percent of povertythreshold relative to households above this threshold.
Caffeine
Unlike the situation for calories, calcium, and vitamin C, age of the house-hold manager was a determinant of daily intakes of caffeine. Daily caffeineintakes rose in households as the age of the household manager rose—higher by 23 mg for 40 to 49 years old, higher by 59 mg for householdmanagers 50 to 64 years old, and higher by 55 mg for elderly (65-plus)household managers compared with household managers younger than 25years. In households where the household manager was employed, dailycaffeine intake was lower by 7 to 10 mg relative to households where the
17Contribution of Nonalcoholic Beverages to the U.S. Diet / ERR-1
Economic Research Service/USDA

household manager was not employed for pay. Except for the college-plusgroup, education of the household manager was not a significant factor,statistically, of daily intakes of caffeine derived from nonalcoholic bever-ages.
In households where children were present, daily caffeine intakes werelower by roughly 37 mg relative to households where children were notpresent. Caffeine intake was lower by 37 mg, 33 mg, and 19 mg for Blacks,Asians, and Other races, compared with Whites. No significant differencesexisted in caffeine intake between Hispanics and non-Hispanics.
In households located in the Central region, the South, and the West,caffeine intakes were lower by 8 mg, 11 mg, and 17 mg, respectively, rela-tive to households located in the East. No statistically significant differencesexisted in caffeine intake between households above or below the 130percent of poverty threshold.
18Contribution of Nonalcoholic Beverages to the U.S. Diet / ERR-1
Economic Research Service/USDA
Preparation of the 1999 ACNielsenHomescan Panel DataThe data set used in this study is the 1999 ACNielsen Homescan panel data,purchased by USDA in 2002 for use in several projects supported byEconomic Research Service. This project addressed the goal of determiningthe types of nonalcoholic beverages purchased by U.S. households indifferent demographic segments. One of the benefits of using these data forthis study was to determine if this type of scanner data could be used as aviable alternative to other more costly and scarce data sources.
Data Description
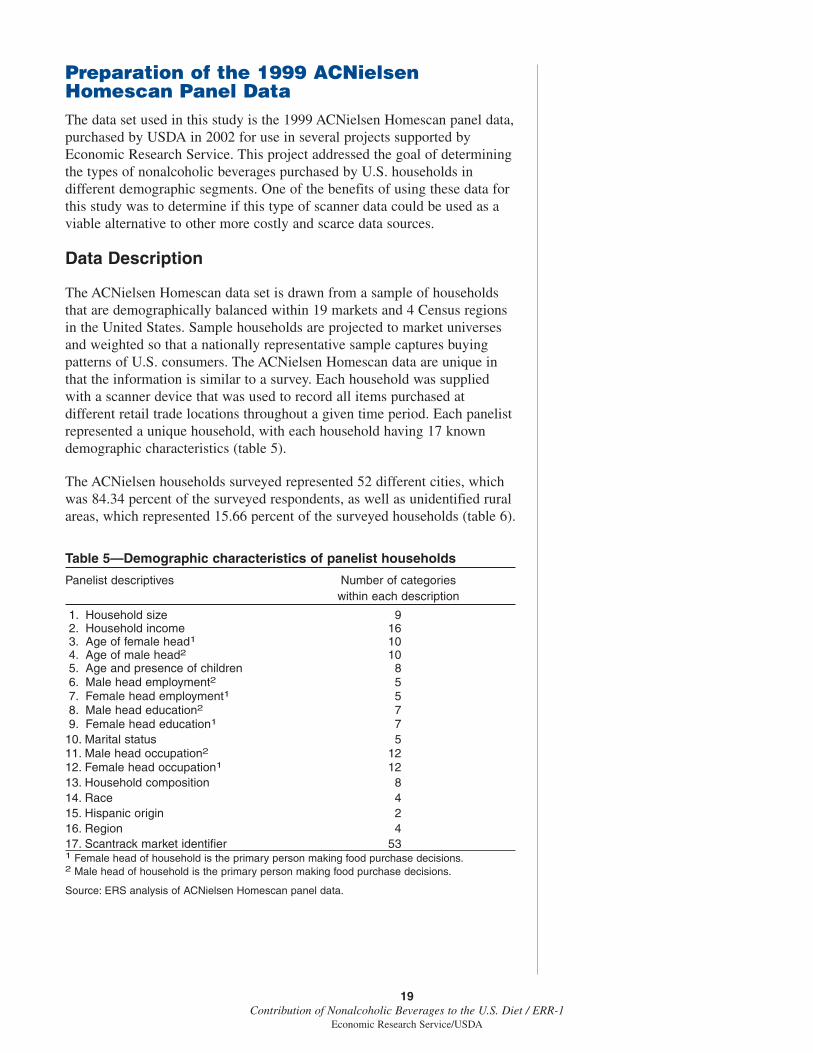
The ACNielsen Homescan data set is drawn from a sample of householdsthat are demographically balanced within 19 markets and 4 Census regionsin the United States. Sample households are projected to market universesand weighted so that a nationally representative sample captures buyingpatterns of U.S. consumers. The ACNielsen Homescan data are unique inthat the information is similar to a survey. Each household was suppliedwith a scanner device that was used to record all items purchased atdifferent retail trade locations throughout a given time period. Each panelistrepresented a unique household, with each household having 17 knowndemographic characteristics (table 5).
The ACNielsen households surveyed represented 52 different cities, whichwas 84.34 percent of the surveyed respondents, as well as unidentified ruralareas, which represented 15.66 percent of the surveyed households (table 6).
19Contribution of Nonalcoholic Beverages to the U.S. Diet / ERR-1
Economic Research Service/USDA
Table 5—Demographic characteristics of panelist households
Panelist descriptives Number of categorieswithin each description
1. Household size 92. Household income 163. Age of female head1 104. Age of male head2 105. Age and presence of children 86. Male head employment2 57. Female head employment1 58. Male head education2 79. Female head education1 7
10. Marital status 511. Male head occupation2 1212. Female head occupation1 1213. Household composition 814. Race 415. Hispanic origin 216. Region 417. Scantrack market identifier 531 Female head of household is the primary person making food purchase decisions.2 Male head of household is the primary person making food purchase decisions.
Source: ERS analysis of ACNielsen Homescan panel data.

The survey covered 4 regions of the lower 48 States of the UnitedStates—East, Central, South, and West.
The regional representation of the surveyed U.S. households was similar to the1999 Bureau of Census regional representation by percent of householdssurveyed:
• East—20.0 percent (Census); 20.3 percent (ACNielsen)• Central—24.0 percent (Census); 25.3 percent (ACNielsen)• South—34.0 percent (Census); 34.3 percent (ACNielsen)• West—22.0 percent (Census); 20.0 percent (ACNielsen).
Although ACNielsen Homescan data include purchases of all consumer itemsbought during a specified time period, the nationally representative data thatwas used in this study included only consumer purchases of food items.Household level purchase data and demographic information were included for7,195 household panelists who were in the sample during at least 10 out of 12months beginning January 3, 1999 through January 1, 2000. The householdlevel food purchase data are divided into four product type groups:
(1) Dry grocery (4,111,719 records)(2) Dairy (873,899 records)(3) Frozen (1,002,851 records)(4) Random weights (507,306 records).
20Contribution of Nonalcoholic Beverages to the U.S. Diet / ERR-1
Economic Research Service/USDA
Table 6—Panelist households' locations
Percent of Percent ofhouseholds households
Scantrack market surveyed Scantrack market surveyed
Rural 15.66 San Diego 0.61Boston 1.30 St. Louis 0.96Chicago 10.46 Tampa 0.77Houston 0.56 Baltimore 4.30Indianapolis 1.27 Birmingham 0.25Jacksonville 0.28 Buffalo-Rochester 1.04Kansas City 0.76 Hartford-New Haven 1.17Los Angeles 11.26 Little Rock 0.15Suburban New York 5.47 Memphis 0.08Urban New York 3.81 New Orleans-Mobile 0.18Non-urban New York 2.79 Oklahoma City-Tulsa 0.13Orlando 0.48 Phoenix 1.83San Francisco 0.64 Raleigh-Durham 0.23Seattle 0.71 Salt Lake City 1.57Atlanta 13.79 Columbus 0.58Cincinnati 0.94 Washington, DC 8.83Cleveland 1.01 Albany 0.49Dallas 0.40 Charlotte 0.56Denver 0.86 Des Moines 0.49Detroit 1.32 Grand Rapids 0.91Miami 0.64 Louisville 0.18Milwaukee 0.63 Omaha 0.56Minneapolis 0.56 Richmond 0.28Nashville 0.16 Sacramento 0.48Philadelphia 1.80 San Antonio 7.51Pittsburgh 1.43 Syracuse 1.45Portland, Oregon 1.09Source: ACNielsen Homescan data.
Each of the four groups contained numerous product modules, with eachproduct module further subdivided into brand, size, flavor, form, formula,container, style, type and variety. Each product was represented by a uniqueunit product code (UPC). In addition to demographic information, totalexpenditure and quantity information were recorded for each transaction.This information was used to impute the price per unit for the food itemsanalyzed in this study.
Data Selection Process
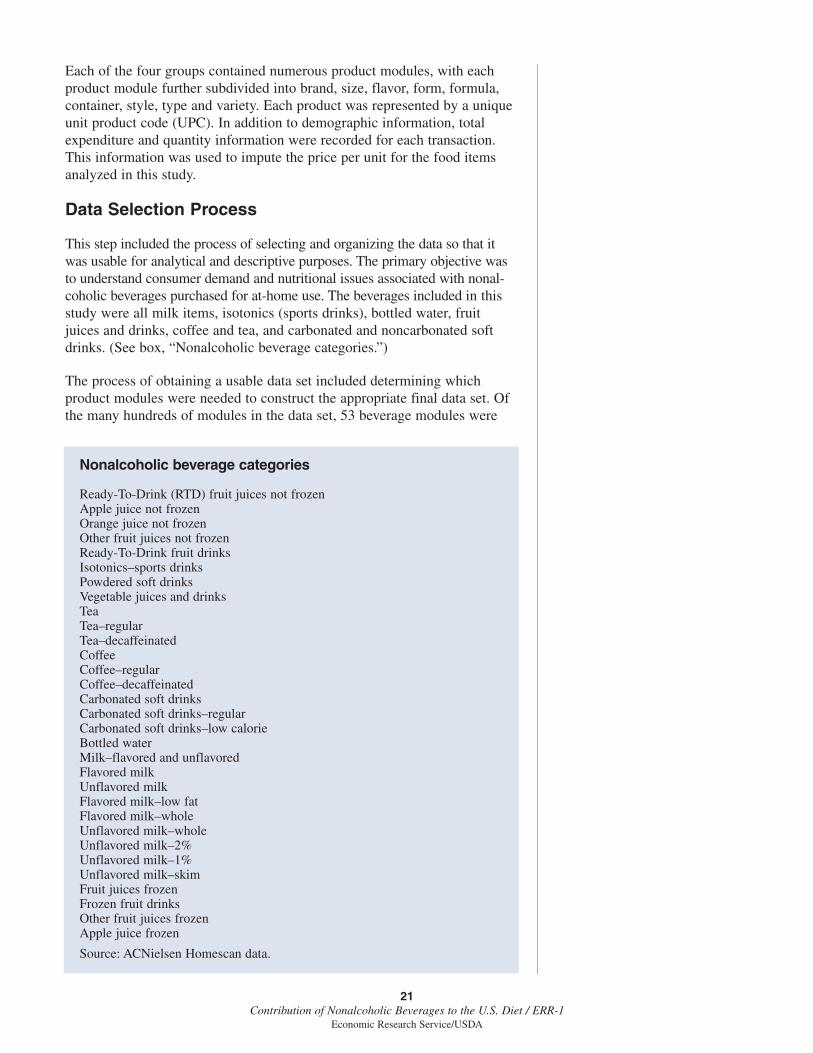
This step included the process of selecting and organizing the data so that itwas usable for analytical and descriptive purposes. The primary objective wasto understand consumer demand and nutritional issues associated with nonal-coholic beverages purchased for at-home use. The beverages included in thisstudy were all milk items, isotonics (sports drinks), bottled water, fruitjuices and drinks, coffee and tea, and carbonated and noncarbonated softdrinks. (See box, “Nonalcoholic beverage categories.”)
The process of obtaining a usable data set included determining whichproduct modules were needed to construct the appropriate final data set. Ofthe many hundreds of modules in the data set, 53 beverage modules were
21Contribution of Nonalcoholic Beverages to the U.S. Diet / ERR-1
Economic Research Service/USDA
Nonalcoholic beverage categories
Ready-To-Drink (RTD) fruit juices not frozenApple juice not frozenOrange juice not frozenOther fruit juices not frozenReady-To-Drink fruit drinksIsotonics–sports drinksPowdered soft drinksVegetable juices and drinksTeaTea–regularTea–decaffeinatedCoffeeCoffee–regularCoffee–decaffeinatedCarbonated soft drinksCarbonated soft drinks–regularCarbonated soft drinks–low calorieBottled waterMilk–flavored and unflavoredFlavored milkUnflavored milkFlavored milk–low fatFlavored milk–wholeUnflavored milk–wholeUnflavored milk–2%Unflavored milk–1%Unflavored milk–skimFruit juices frozenFrozen fruit drinksOther fruit juices frozenApple juice frozen
Source: ACNielsen Homescan data.
selected for analysis. Several of the 53 modules were further disaggregatedor aggregated to create other modules, which also were used in constructingthe final data set. The final data set contained 77 different beverage productmodules (data table 13). The purpose of the aggregation/disaggregationprocess was to group the beverages in modules that would allow for a thor-ough analysis. Not only might the effects of the particular beverage, such asmilk, be important, but the effects from different varieties of milk—flavored, unflavored skim, low fat, etc.—also might be important. A listingof the different aggregations of modules is included in data table 14.
Each of the 77 beverage modules was converted into the common measureof gallons in order to have valid comparisons with the other modules. Thisprocess required two things: First, a knowledge of the form, size and quan-tity of the products in the modules, and second, the rate of conversion foreach form, size, and quantity. The first step was simple since the productform, size, and quantity were included in each record. The second step wasnot as simple and in some cases required actual physical examination of aproduct before it could be converted into gallons.
After the product modules were extracted, created, and converted to gallons,further checking of the actual data was necessary. A very limited number ofrecords were unusable because expenditures were missing. After removing therecords that were unusable, the imputation of prices (ratio of expenditures toquantities) for the remaining records were completed. Price outliers, definedas imputed prices greater than five standard deviations from their means, wereflagged and omitted. Records corresponding to these price outliers also wereeliminated from the analysis. In data table 14, we delineate the number ofmissing expenditure records by product module together with the number ofrecords corresponding to price outliers by product module.
The 1999 ACNielsen Homescan data include transactions that were madeduring the year and recorded by a scanner at home, and as such could beconsidered a panel data set with both cross-sectional and time-series charac-teristics. However, the sporadic nature of the time-series entries associatedwith the data set make it more practical to convert the home scan data to across-sectional type of data set. Since each record included purchase trans-actions by a particular household, each recorded transaction in the sameproduct module was identified and combined to create an annual householdconsumption (purchase) quantity and expenditure amount for each module.Then, the household total purchase quantity and total expenditure amountswere used to impute an average annual household price for each module. Inthis study we explicitly assume that all beverage items purchased areconsumed by the household. Thus we equate household purchases withhousehold consumption and intake. For a summary of the 77 annualconsumption figures, expenditure figures, and average annual prices, seedata table 13. These descriptive statistics take into account the projectionfactors used to make this sample of households nationally representative.
This report serves to summarize the work done on the ERS cooperativeproject, “Demand Projections Segmented by Income for the HighlyCompetitive Nonalcoholic Beverage Complex Using the ACNielsen Home-scan Panel Data.” As the data are for 1999, this work constitutes a baselineanalysis of economic and nutritional issues in conjunction with a choice of
22Contribution of Nonalcoholic Beverages to the U.S. Diet / ERR-1
Economic Research Service/USDA
77 nonalcoholic beverages, for both aggregate and disaggregated analysis.This 1999 baseline will be useful in future work for evaluating consumerimpacts of the advice issued in 2000 and 2005 by the Dietary Guidelines forAmericans, which gave increased emphasis to beverage choice, particularlysoft drinks.
Cross-Tabulations of HouseholdPurchases (Consumption)
Cross-tabulations were used to examine the relationship of householdpurchases of nonalcoholic beverages with various demographic factors. Withthis procedure, a specific demographic variable is identified and summarystatistics are computed for the records in the data set that correspond to onlythose demographic criteria. For example, the average consumption ingallons per household of a selected beverage is calculated for each demo-graphic category. It should be noted that the calculated averages includeonly the households that purchased the selected beverage. After all demo-graphics variables are tabulated, comparisons can be made. To illustrate, thedemographic variable region includes four categories: East, Central, South,and West. Average levels of consumption for the households in each regionwere calculated. A comparison among the households in the four regionsquickly reveals if there is a difference in the level of purchases from oneregion to another. The number of households purchasing each beverage ineach demographic category also is included in this treatment.
The demographic variables used in the analysis include poverty status,household size, age of female head, employment of female head, educationof female head, race, region, Hispanic origin (ethnicity), and seasonality(data tables 15a and 15b). The beverage groupings to be analyzed in thecross-tabulations are shown in the box on page 21. To conform to spacelimitations, both aggregate groupings and disaggregated groupings of bever-ages are used rather than all 77 beverage products previously discussed.
A Look at Prices, Gallons, and Expenditures
The annual consumption (in gallons), expenditure (in dollars), and prices(dollars per gallon) for households who actually bought nonalcoholic bever-ages in 1999 are shown in data table 13. The statistics include a count of thenumber of households who purchased the nonalcoholic beverage in 1999, aswell as the mean, median, standard deviation, minimum and maximumassociated with gallons bought, prices paid, and expenditures made onnonalcoholic beverages.
To illustrate, 4,898 households bought bottled water; 5,304 bought tea;5,584 bought coffee; 7,036 bought milk; and 7,041 bought carbonated softdrinks. These figures correspond to market penetration (the percent ofrespondents who actually consumed the beverage) of 68.1 percent forbottled water; 73.7 percent for tea; 77.6 percent for coffee; 97.8 percent formilk; and 97.9 percent for carbonated soft drinks. Carbonated beverageswere the most popular beverage purchase by households and packaged teawas the least purchased item of the 77 product modules analyzed.
23Contribution of Nonalcoholic Beverages to the U.S. Diet / ERR-1
Economic Research Service/USDA
Average prices paid per gallon for bottled water were $1.99; tea $1.89;coffee, $1.38; milk, $3.08; and carbonated soft drinks, $2.45. The leastexpensive beverages for 1999 are powdered soft drinks, coffee, and tea; themost expensive nonalcoholic beverages are ready-to-drink fruit juices,vegetable juices, and isotonics.
Average annual quantities and expenditures for households who boughtvarious nonalcoholic beverages are as follows: ready-to-drink fruit juices,13.47 gallons ($60.35); ready-to-drink fruit drinks, 8.14 gallons ($27.29);isotonics, 3.58 gallons ($15.36); powdered soft drinks, 17.89 gallons($14.14); vegetable juices and drinks, 2.29 gallons ($12.96); tea, 15.00gallons ($18.58); coffee, 43.06 gallons ($42.81); carbonated soft drinks,51.87 gallons ($121.19); bottled water, 14.32 gallons ($17.73); flavored milk,2.32 gallons ($9.80); unflavored milk, 33.32 gallons ($90.78); frozen fruitjuices, 6.77 gallons ($20.77); and frozen fruit drinks, 3.61 gallons ($9.63).The volume leaders in 1999 were carbonated soft drinks, coffee, and unfla-vored milk, in that order. Average expenditures are greatest for carbonatedsoft drinks, milk, ready-to-drink fruit juices, and coffee, in that order.
Poverty Status
Instead of using only the income demographic given in the ACNielsenHomescan data, a poverty threshold demographic also was calculatedaccording to U.S. Census Bureau poverty specifications. Both income andhousehold size were used for determining households below and above thepoverty threshold. We are using 130 percent of poverty in this study becauseit is the cut-off level for food stamp eligibility and for free school meals.Analysis of the household income levels found that 423 of the 7,195 house-holds fell into the below 130 percent of poverty range. The householdsabove 130 percent of poverty purchased more orange juice, both frozen andnot frozen (fig. 33, data table 16). Households below 130 percent of povertypurchased over 3 more gallons of powdered soft drinks a year andpurchased over 7 more gallons of regular carbonated soft drinks per yearwhen compared with households with incomes over 130 percent of poverty.Above 130 percent poverty households purchased more of the lower caloriesoft drinks and over 4 more gallons of bottled water per year as comparedwith the households below 130 percent of poverty. Above poverty householdsalso purchased more 2-percent, 1-percent, and skim milk, while householdsbelow 130 percent of poverty purchased more unflavored whole milk.
Household Size
The household size demographic has nine categories ranging from onehousehold member to nine or more (fig. 34, data table 17) and includesaverage purchases by household size for those that bought. No householdhad more than nine members with the mean household size in the panelbeing 2.57 members. The largest category was the household size of twothat had 2,704 observations of the 7,195 households in the data set.
As household size increases, purchases, on average, typically increase. Thisfinding is largely due to the fact that the data deal primarily with food-at-home purchases. As family size increases, the household is less apt to dine
24Contribution of Nonalcoholic Beverages to the U.S. Diet / ERR-1
Economic Research Service/USDA
out or eat away from home for budgetary reasons. Every beverage listed isconsumed in greater amounts in households with two or more personscompared with single-person households. The exception to this observationwas frozen fruit drinks. Single-person households are either eating more onthe go or away from home than multi-person households. As household sizeincreases, powdered soft drinks, milk, and carbonated soft drinks are moreheavily consumed at home.
Female Head of Household
Three demographics concerning the female head of household-age, employ-ment status, and education level-were looked at next. It is assumed that thefemale head is largely responsible for food-at-home purchases. Six hundredseventy-one of the households had no female head of household or thehousehold gave no information regarding age, employment, or education ofa female head.
Age of Female Head of Household
There are eight categories of age for female head of households (fig. 35,data table 18). Households with the female head under 25 years old boughtmore powdered soft drinks than did all remaining households with femaleheads that are older. Households with older female heads bought consider-ably more coffee than did households with younger female heads. Coffeepurchases ranged from 15.55 gallons for households with female headsunder age 25, to 50.82 gallons for households with female heads older than65. Carbonated soft drink purchases for households with female heads ages40-44 was the highest level, 68.92 gallons. This figure is 17.05 gallonsabove the overall average of all households in the surveyed panel. Milkpurchases also varied for any age of female-headed households starting at42.19 gallons for those under 25 and then dropping to 31.19 gallons forthose in the 25-29 bracket. From this level it slowly increased until thefemale head turned 45, then the average household purchase of milkdecreased thereafter.
Employment of Female Head of Household
There are four categories of employment, ranging from not employed to threedifferent categories of hours worked per week (fig. 36, data table 19). Themajority of the beverage consumption changes little from one classification tothe next. One notable difference is the purchase of tea for households wherethe female head worked 35-plus hours. The average purchase is 2 gallons lessthan households with different-aged female heads. Households with unem-ployed female heads bought more coffee for at-home consumption than didhouseholds with employed female heads. The average consumption is 49.46gallons per year for unemployed female heads. The unemployed and fullyemployed female-head households bought less carbonated soft drinks onaverage than female heads who work part-time. Lastly, households that containa female head who works fewer than 30 hours per week bought more milk onaverage than did other households, purchasing 40.7 gallons per year.
25Contribution of Nonalcoholic Beverages to the U.S. Diet / ERR-1
Economic Research Service/USDA
Education of Female Head of Household
There are six categories for education ranging from grade school educationto post-college education (fig. 37, data table 20). There were 2,187 of thehouseholds in the data set, including a female head that attained somecollege education, followed by 1,821 households where the female head hadgraduated from college. Households with higher educated female headsbought more apple juice, orange juice, and other fruit juices than did house-holds with less educated female heads. The average purchase of juices grad-ually increased as the education level of the female head rose. Conversely,powdered soft drink purchases per household decreased as education levelincreased, ranging from 20 gallons for households where the female headhad some high school education to 15 gallons for households of femaleheads that attained a post-college education. Coffee and carbonated softdrink purchases decreased for households where the female heads in thehouseholds were more educated, similar to powdered soft drinks. Thisfinding also was true for milk; purchases in households decreased as theeducation level of the female head in those households rose.
Race
The demographic for race had four categories: White, Black, Asian, andOther (fig. 38, data table 21). In the panel data, 83.5 percent of the house-holds were White. Asian households bought more ready-to-drink fruit juicesand orange juice than households of other race classifications did.Consuming only 27.96 gallons of carbonated soft drinks per year, Asianhouseholds drank substantially fewer gallons when compared with Whiteand Black households, who consumed 54.14 gallons and 35.51 gallons,respectively, on average per year. Black households bought more powderedsoft drinks and ready-to-drink fruit drinks and less tea than did householdsof other races. White households purchased the greatest amount of coffeeper year, 45.1 gallons compared with other races. White households alsopurchased the largest amounts of milk, but less bottled water on averagethan did households of different races.
Region
Four regions were studied: East, Central, South, and West (fig. 39, data table22). Households located in the East bought more ready-to-drink fruit juices,orange juice, tea, and coffee than did households from other regions. House-holds located in the East and South purchased the least milk of any region,at about 32 gallons per year per household. Households located in theCentral region bought more milk, carbonated soft drinks, and powdered softdrinks than did other household regions on average. Southern householdspurchased high levels of powdered soft drinks, though slightly less than didCentral region households. Southern households also bought high levels ofcarbonated soft drinks. Households located in the West purchased moregallons of bottled water per year than did households located in otherregions. Western households bought less orange juice and tea than didhouseholds from other regions.
26Contribution of Nonalcoholic Beverages to the U.S. Diet / ERR-1
Economic Research Service/USDA
Hispanic Origin (Ethnicity)
The data indicated that 457 of the 7,195 households in the panel were ofHispanic origin (fig. 40, data table 23). Hispanic households bought moreready-to-drink fruit drinks, powdered soft drinks, carbonated soft drinks,bottled water, and milk than did households that were not Hispanic.Hispanic households purchased less tea and coffee than non-Hispanichouseholds. Hispanics purchased more milk overall than non-Hispanichouseholds, with the majority of that milk being “whole” and 2-percentmilk. Non-Hispanic households purchased more 1 percent and skim milk incontrast to Hispanic ones. Households of Hispanic origin bought morefrozen concentrated orange juice than did non-Hispanic households.
Seasonality
The purchases of nonalcoholic beverages in the data set allowed seasonalityto be analyzed (fig. 41, data table 24). Overall, the number of householdsthat bought nonalcoholic beverages during all four quarters in 1999 and theaverage purchases of each nonalcoholic beverage were relatively stable. Thepurchases of carbonated soft drinks were slightly higher during the secondand third quarter (the warmer months) than in other quarters. Milkpurchases decreased slightly in the third and fourth quarters, relative toother quarters of the year. Coffee purchases were greatest in the fourthquarter (the holiday months) at 15.25 gallons, relative to other quarters ofthe year. Powdered soft drink purchases were the most seasonal beverage,with the number of households purchasing powdered soft drinks almostdouble for the second and third quarters, which includes the summer monthswhen children are out of school.
27Contribution of Nonalcoholic Beverages to the U.S. Diet / ERR-1
Economic Research Service/USDA
Conclusions
Our findings demonstrate that household beverage choice can have animportant impact on the nutritional quality of the household food supply.The beverage choices a household makes have important effects on house-hold calories, an important consideration given America’s current obesityproblem. Beverage choices also impact calcium availability in the homefood supply, another major public health concern.
Limitations of the data used for this study must be noted. For example, foodpurchasing is not equivalent to food consumption. Some purchased itemsmay be wasted—milk may spoil and be discarded uneaten, for example—and some items may be consumed by non-household members (guests). But,it is reasonable to assume that household food purchases will be stronglycorrelated with consumption, and can be considered proxies for the quantityof the foods and beverages consumed from the at-home food supply.
For most Americans, the at-home food supply provides the larger part of theirdiet, but food prepared away from home—i.e., restaurant, fast-food, and take-out foods—plays a much more important role in today’s diet than in previousdecades. In 1977-78, foods from the home food supply made up 82 percent ofAmericans’ daily diets (as measured in calories consumed). By 1995, the shareof diet obtained from the home food supply had dropped to 66 percent. Giventhis shift, it is useful to consider how the beverage choices Americans makeaway from home might complement their at-home choices.
Our analysis indicates more households purchased soft drinks than milk. Linet al. also have found that the calcium density of food obtained from restau-rant and fast-food sources is lower than the calcium density of food fromthe home food supply. Since milk is the major source of calcium in Amer-ican diets, this indicates that milk consumption away from home is likelyeven lower than from home foods. The only exception is foods obtained bychildren at schools and day care, where USDA regulations require thatmeals served as part of the Federal School Meal Programs must containmilk. Clearly, USDA meal programs can play an important role inimproving calcium adequacy of the diets of participating children.
Our study reinforces the need for dietary guidance on beverage choice. Inaddition, the differences in beverage purchases we found to be associatedwith particular household characteristics have implications for content andtargeting of nutrition education messages. Current USDA dietary guidancepublications include advice on beverage choices—for example, the FoodGuide Pyramid for Children recommends two servings from the milk groupdaily, and includes a picture of a soft drink in the tip of the Pyramid, indi-cating they should play an occasional role in the diet. Purchasing habits oflower income households are of particular concern, given USDA’s substan-tial investment in Food Stamp Nutrition Education.
These data were collected in 1999. Since then changes in dietary guidance—most notably the 2000 and 2005 revisions of the Dietary Guidelines for Amer-icans—have created an increased emphasis on beverage choice as a nutritioneducation message. In 2000, the Dietary Guidelines message on sugars was
28Contribution of Nonalcoholic Beverages to the U.S. Diet / ERR-1
Economic Research Service/USDA

changed from “Choose a diet moderate in sugars” to “Choose beverages andfoods to moderate your intake of sugars.” The committee altered thewording of the guidelines to emphasize beverages because soft drinks andfruit-flavored beverages were found to be the No. 1 and No. 3 most impor-tant sources of added sugars in American diets. The 2000 Dietary Guide-lines also emphasized the need for improving American’s calcium intakesand identified both milk and calcium-fortified fruit juice as recommendedsources. This advice was reiterated in the 2005 Dietary Guidelines, whichencourage consumption of 3 cups of fat-free or low-fat milk daily, whilelimiting intake of beverages with added sugars and sweeteners. These datacan be considered a baseline for future studies investigating effects of theDietary Guidelines’ increased emphasis on beverage choices.
Perhaps in response to these new nutrition education emphases, there havebeen important changes in the beverages available for purchase since thesedata were collected. Calcium fortification of juices has become increasinglycommon. New beverage products such as drinkable yogurt have been intro-duced. These changes in the marketplace may have important effects on thenutrient contribution of beverages to the household food supply. As newerdata become available, it will be interesting to assess the impact of dietaryguidance on the beverage marketplace and consumer beverage choices.
29Contribution of Nonalcoholic Beverages to the U.S. Diet / ERR-1
Economic Research Service/USDA
References
ACNielsen 1999 Homescan panel data.
Ahuja, J.K.C. and B.P. Perloff. “Caffeine and theobromine intakes of chil-dren: Results from CSFII 1994-96, 1998.” Family Economics andNutrition Review 13(2): 47-51, 2001.
American Academy of Pediatrics. “Prevention of Rickets and Vitamin DDeficiency: New Guidelines for Vitamin D Intake.” Pediatrics 111(4):908-910, 2003.
Buckley, Neil. “Obesity Campaign Eyes School Drinks.” Financial Times,June 23, 2003.
Chanmugam, P.A., J.F. Guthrie, S Celilio, J.F. Morton, P. Basiotis, and R.Anand. “Did Fat Intake in the United States Really Decline Between1989-1991 and 1994-1996?” J Am Diet Assoc 103:867-872; 2003.
French, S., B-H Lin, and J.F. Guthrie. “National trends in soft drink con-sumption among children and adolescents aged 6-17 years: prevalence,amounts and sources, 1977/78 through 1994/98.” J Am Diet Assoc103:1326-1331; 2003.
Gortmaker, S.L., A. Must, J.M. Perrin, A.M. Sobol, and W.H. Dietz. “Socialand Economic Consequences of Overweight in Adolescence and YoungAdulthood.” New England Jour of Med 329:1008-1012; 1993.
Guthrie, J.F. “Women’s calcium and fat intake patterns by type of milkavoidance.” FASEB Journal 10: A725; 1996.
Guthrie, J.F. and J.F. Morton. “Food sources of added sweeteners in thediets of Americans.” J Am Diet Assoc. 100:43-48, 51; 2000.
Guthrie, J.F., B-H Lin, and E. Frazao. “The role of food prepared away fromhome in the American diet, 1977-78 vs. 1994-96: Changes and conse-quences.” J Nutr Educ Behav 34(3): 140-150; 2002.
Harnack, L., J. Stang, and M. Story. “Soft Drink Consumption Among USChildren and Adolescents: Nutritional Consequences.” J Am Diet Assoc99:436-441; 1999.
Hellmich, N. “Legislators Try to Limit Soft Drinks, Sugary Snacks atSchool.” USA Today, Feb. 13, 2003.
Mattes, R.D. “Dietary compensation by humans for supplemental energyprovided as ethanol or carbohydrate in fluids.” Physio Behav. 59:179-187; 1996.
National Academies Press. “Caffeine for the Sustainment of Mental TaskPerformance: Formulations for Military Operations (2001).” Available at:nap.edu/execsumm/030982587.html. Accessed 5/30/2003.
Statistical Abstract of the United States. Annual publications 1999-2000.
U.S. Department of Health and Human Services. Healthy People 2010:Understanding and Improving Health. 2nd ed. Washington, DC: U.S.Government Printing Office, November 2000.
30Contribution of Nonalcoholic Beverages to the U.S. Diet / ERR-1
Economic Research Service/USDA

USDA/ARS/Nutrient Data Laboratory, National Nutrient Database forStandard Reference. Available at: www.nal.usda.gov/fnic/cgi-bin/nutsearch pl. Accessed 12/30/02.
USDA/ERS/Per Capita Consumption Database. Available at:www.ers.usda.gov/Data/foodconsumption. Accessed 10/3/2003.
Yale-New Haven Nutrition Advisor. “Looking for a cure for the end of sum-mertime blues?” Available at: www.ynhh.org/online/nutrition/advisor/cof-fee_drinks.html. Accessed 8/10/2004.
Yen, Steven T. and Biing-Hwan Lin. “Beverage Consumption Among U.S.Children and Adolescents: Full-Information and Quasi Maximum-Likelihood Estimation of a Censored System.” European Review ofAgricultural Economics 29, 1:85-103; 2002.
31Contribution of Nonalcoholic Beverages to the U.S. Diet / ERR-1
Economic Research Service/USDA

32Contribution of Nonalcoholic Beverages to the U.S. Diet / ERR-1
Economic Research Service/USDA
Source: Economic Research Service, USDA.
Per capita U.S. nonalcoholic beverage consumption, 1992-2002Figure 1
Soft drinks
Tea
Bottled water
Milk
1992 1994 1996 1998 2000 20020
10
20
30
40
50
60
Coffee
Fruit juices & drinks
Gallons per year
Figure 2
Comparison of nonalcoholic beverage consumption data
Total U.S. consumption(ERS/USDA)
-------- Gallons/person---------
Consumption at home(ACNielsen)
Nonalcoholic beverageconsumption at home
Percent
Soft drinks 50.8 20.2 39.8
Milk 23.6 13.2 55.9
Bottled water 18.1 5.6 30.9
Fruit juices 9.6 7.9 82.3
Coffee 25.7 16.8 65.4
Tea 8.4 5.8 69.0
Source: ERS analysis of ACNielsen Homescan data, ERS data.

33Contribution of Nonalacoholic Beverages to the U.S. Diet / ERR-1
Economic Research Service/USDA
* See definitions of abbreviations in table 2 footnotes for all figures.Source: Economic Research Service, USDA, analysis of ACNielsen Homescan data.
Average caloric, calcium, vitamin C, and caffeine availability from all nonalcoholic beverages, by ethnicity*
Figure 3
Non-Hispanic
Hispanic
Available intake per person per day
Calories Calcium(mg)
Vitamin C(mg)
Caffeine(mg)
CALcsdfdp(kcal)
CALjuices(kcal)
CALmilk(kcal)
020406080
100120140160180200
(kcal)
CAFFcsd(mg)
CAFFcoff(mg)
CAFFtea (mg)
VITCjuice(mg)
VITccsdfspsd(mg)
CALCIUMmilk (mg)
020406080
100120140160180200
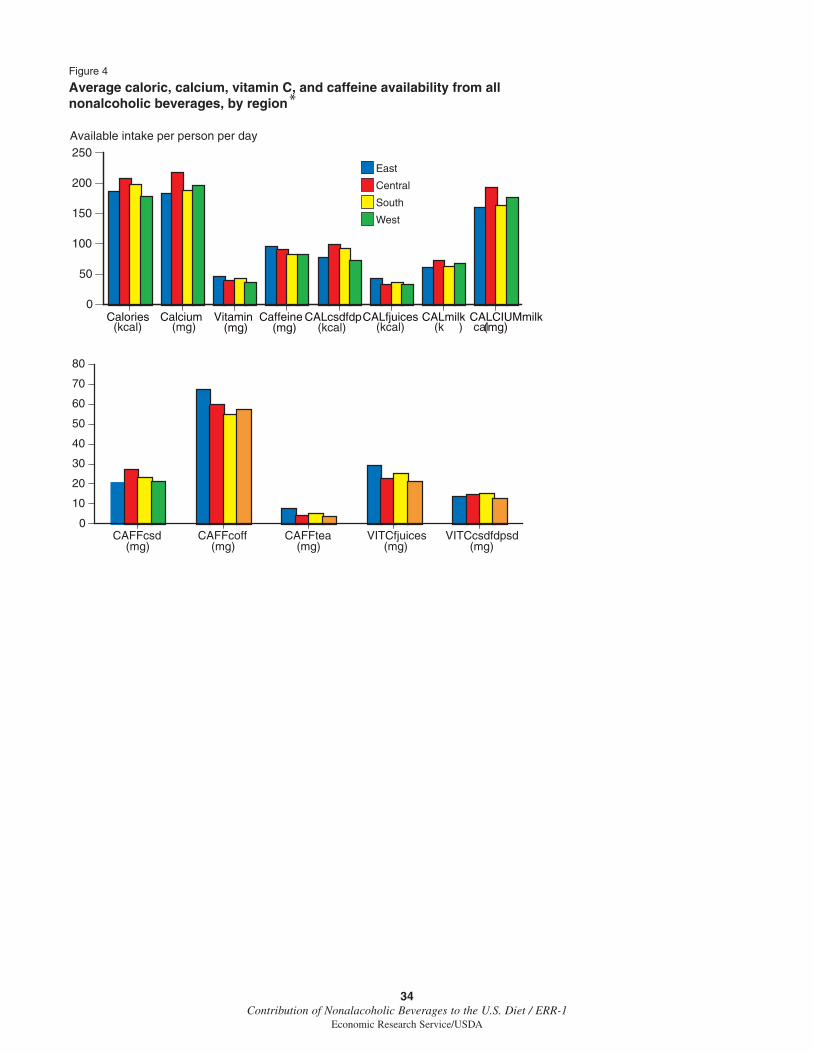
34Contribution of Nonalacoholic Beverages to the U.S. Diet / ERR-1
Economic Research Service/USDA
* See definitions of abbreviations in table 2 footnotes for all figures.Source: Economic Research Service, USDA, analysis of ACNielsen Homescan data.
Average caloric, calcium, vitamin C, and caffeine availability from all nonalcoholic beverages, by region
Figure 4
Available intake per person per day
Central
East
South
West
0
50
100
150
200
250
Calories Calcium Vitamin(mg)
Caffeine(mg)
CALcsdfdpCALfjuices CALmilk CALCIUMmilk(mg)(kcal) (mg) (kcal) (kcal) (k cal)
CAFFcsd (mg)
CAFFcoff (mg)
CAFFtea (mg)
VITCfjuices(mg)
VITCcsdfdpsd(mg)
0
10
20
30
40
50
60
70
80
*

35Contribution of Nonalacoholic Beverages to the U.S. Diet / ERR-1
Economic Research Service/USDA
* See definitions of abbreviations in table 2 footnotes for all figures.Source: Economic Research Service, USDA, analysis of ACNielsen Homescan data.
Average caloric, calcium, vitamin C, and caffeine availability from all nonalcoholic beverages, by race*
Figure 5
Available intake per person per day
Black
White
Asian
Other
Calories(kcal)
Calcium(mg)
Vitamin C(mg)
Caffeine(mg)
CALmilk(kcal)
CALCIUMmilk(mg)
0
50
100
150
200
250
CAFFcsd (mg)
CAFFcoff (mg)
CAFFtea (mg)
VITCfjuices (mg)
VITCcsdfdpsd (mg)
0
10
20
30
40
50
60
70
CALcsdfdp(kcal)
CALjuices(kcal)

36Contribution of Nonalacoholic Beverages to the U.S. Diet / ERR-1
Economic Research Service/USDA
* See definitions of abbreviations in table 2 footnotes for all figures.Source: Economic Research Service, USDA, analysis of ACNielsen Homescan data.
Average caloric, calcium, vitamin C, and caffeine availability from all nonalcoholic beverages, by poverty status*
Figure 6
> 130% poverty
< 130% poverty
Calories Calcium Vitamin(mg)
Caffeine(mg)
CALcsdfdp CALfjuices CALmilk CALCIUMmilk(mg)
0
50
100
150
200
250
(kcal) (mg)
CAFFcsd (mg)
CAFFcoff (mg)
CAFFtea (mg)
VITCfjuices(mg)
VITCcsdfdpsd (mg)
0
10
20
30
40
50
60
70
Available intake per person per day
(kcal) (kcal) (kcal)
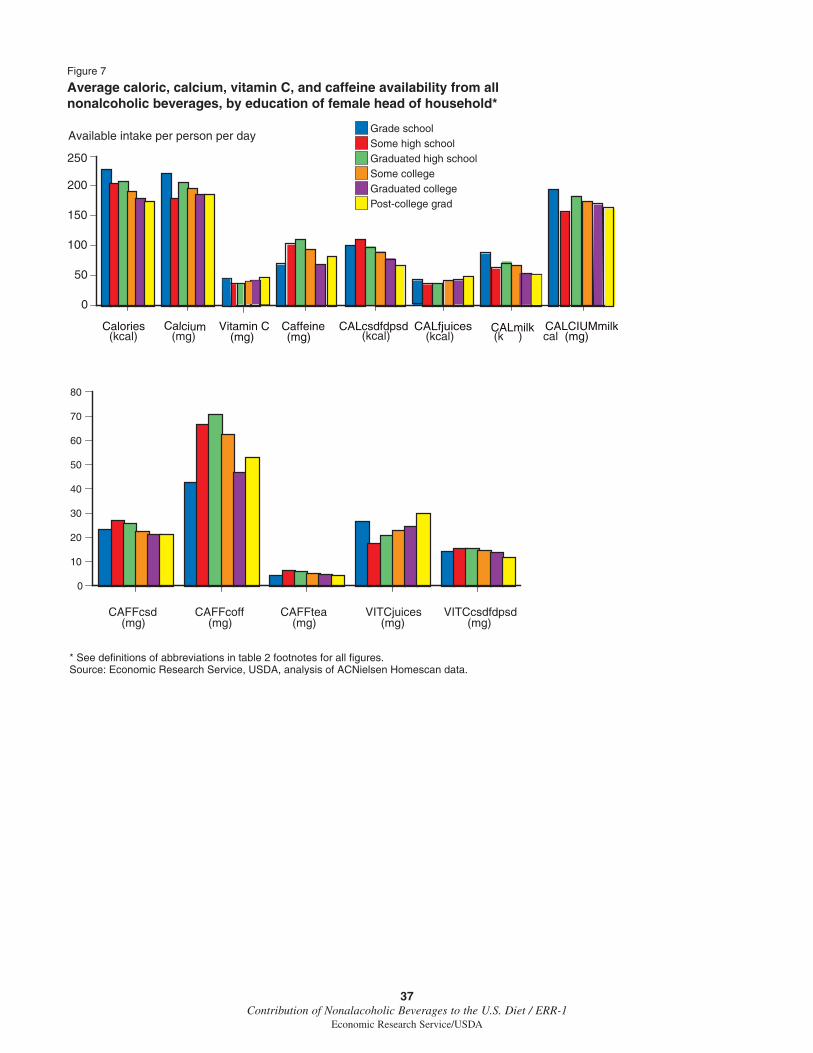
37Contribution of Nonalacoholic Beverages to the U.S. Diet / ERR-1
Economic Research Service/USDA
* See definitions of abbreviations in table 2 footnotes for all figures.Source: Economic Research Service, USDA, analysis of ACNielsen Homescan data.
Average caloric, calcium, vitamin C, and caffeine availability from all nonalcoholic beverages, by education of female head of household*
Figure 7
Available intake per person per day
0
50
100
150
200
250Some high schoolGrade school
Graduated high schoolSome collegeGraduated collegePost-college grad
0
10
20
30
40
50
60
70
80
Calories Calcium Vitamin C(mg)
Caffeine(mg)
CALcsdfdpsd CALfjuices CALmilk CALCIUMmilk(mg)(kcal) (mg) (kcal) (kcal) (k cal)
CAFFcsd (mg)
CAFFcoff (mg)
CAFFtea (mg)
VITCjuices(mg)
VITCcsdfdpsd (mg)
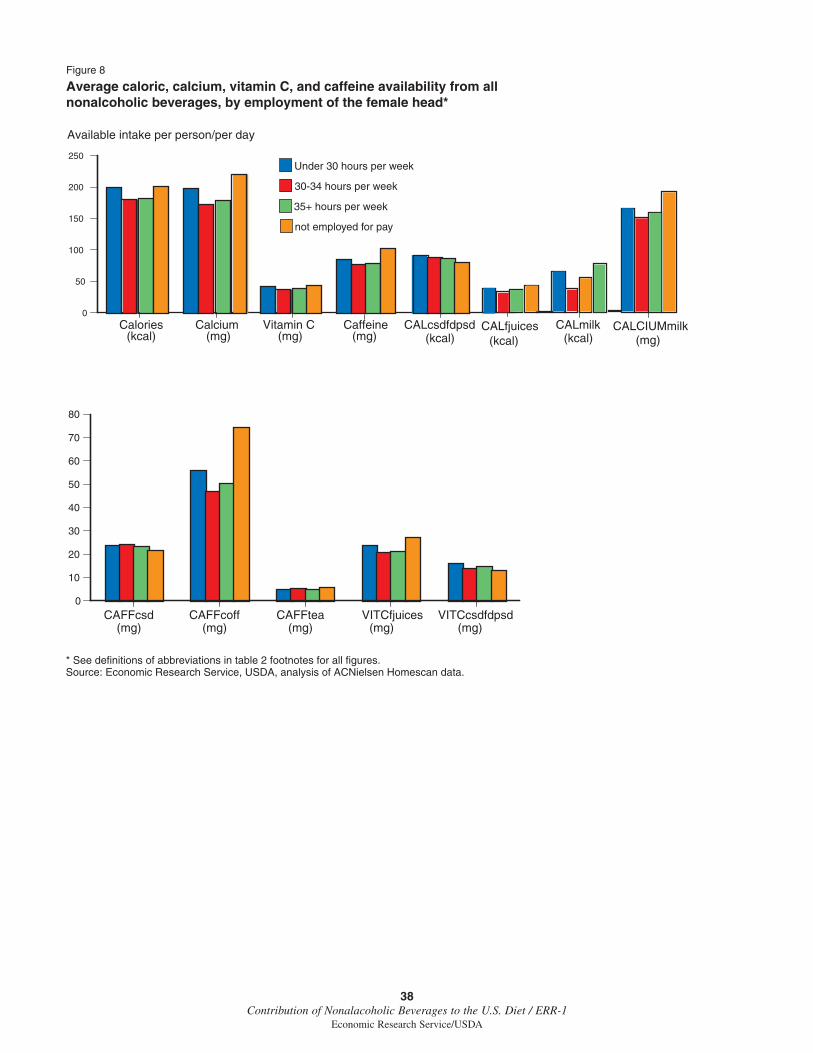
38Contribution of Nonalacoholic Beverages to the U.S. Diet / ERR-1
Economic Research Service/USDA
Average caloric, calcium, vitamin C, and caffeine availability from all nonalcoholic beverages, by employment of the female head*
Figure 8
Available intake per person/per day
30-34 hours per week
Under 30 hours per week
35+ hours per week
not employed for pay
Calories (kcal)
Calcium(mg)
Vitamin C (mg)
Caffeine (mg)
CALcsdfdpsd(kcal)
0
50
100
150
200
250
CAFFcsd (mg)
CAFFcoff(mg)
CAFFtea (mg)
VITCfjuices (mg)
VITCcsdfdpsd (mg)
0
10
20
30
40
50
60
70
80
* See definitions of abbreviations in table 2 footnotes for all figures.Source: Economic Research Service, USDA, analysis of ACNielsen Homescan data.
CALfjuices(kcal)
CALmilk(kcal)
CALCIUMmilk(mg)
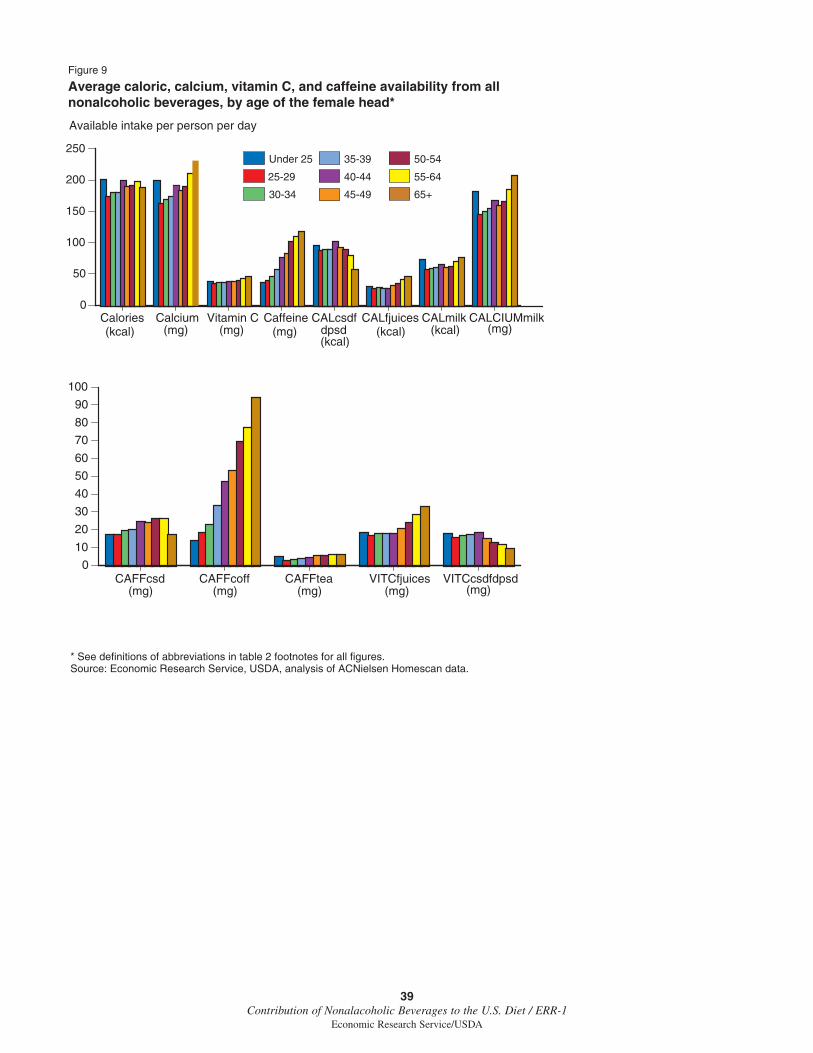
39Contribution of Nonalacoholic Beverages to the U.S. Diet / ERR-1
Economic Research Service/USDA
* See definitions of abbreviations in table 2 footnotes for all figures.Source: Economic Research Service, USDA, analysis of ACNielsen Homescan data.
Average caloric, calcium, vitamin C, and caffeine availability from all nonalcoholic beverages, by age of the female head*
Figure 9
Available intake per person per day
Calories(kcal)
Calcium(mg)
Vitamin C(mg)
Caffeine(mg)
CALcsdfdpsd (kcal)
CALfjuices(kcal)
CALmilk(kcal)
CALCIUMmilk(mg)
0
50
100
150
200
250
40-44
Under 25
25-29
45-4930-34
50-5435-39
55-64
65+
CAFFcsd (mg)
CAFFcoff (mg)
CAFFtea (mg)
VITCfjuices (mg)
VITCcsdfdpsd(mg)
0
10
20
30
40
50
60
70
80
90
100

40Contribution of Nonalacoholic Beverages to the U.S. Diet / ERR-1
Economic Research Service/USDA
Average caloric, calcium, vitamin C, and caffeine availability from all nonalcoholic beverages, by household size*
Figure 10
Available intake per person per day
CAFFcsd (mg)
CAFFcoff (mg)
CAFFtea (mg)
VITCfjuices(mg)
VITCcsdfdpsd (mg)
0
10
20
30
40
50
60
70
80
0
50
100
150
200
250
Calories(kcal)
Calcium(mg)
Vitamin C(mg)
Caffeine(mg)
CALcsdfdpsd (kcal)
CALfjuices(kcal)
CALmilk(kcal)
CALCIUMmilk(mg)
* See definitions of abbreviations in table 2 footnotes for all figures.Source: Economic Research Service, USDA, analysis of ACNielsen Homescan data.
5
1
2
63
74
8
9
Number of people in household

41Contribution of Nonalacoholic Beverages to the U.S. Diet / ERR-1
Economic Research Service/USDA
Average caloric, calcium, vitamin C, and caffeine availability from all nonalcoholic beverages, by presence of children*
Figure 11a
Available intake per person per day
0
50
100
150
200
250
01020304050607080
Calories(kcal)
Calcium(mg)
Vitamin C(mg)
Caffeine(mg)
CALcsdfdpsd(kcal)
CALfjuices(kcal)
CALmilk(kcal)
CALCIUMmilk(mg)
CAFFcsd (mg)
CAFFcoff(mg)
CAFFtea (mg)
VITCfjuices(mg)
VITCcsdfdpsd (mg)
Children ages 13-17
Children ages 6-12
Children under 6 only
No children under age 18
Average caloric, calcium, vitamin C, and caffeine availability from all nonalcoholic beverages, by presence of children*
Figure 11b
Available intake per person per day Children under age 6, 6-12 and 13-17
Children ages 6-12 and 13-17
Children under 6 and 13-17
No children under age 18
0
50
100
150
200
250
01020304050607080
Calories(kcal)
Calcium(mg)
Vitamin C(mg)
Caffeine(mg)
CALcsdfdpsd(kcal)
CALfjuices(kcal)
CALmilk(kcal)
CALCIUMmilk(mg)
CAFFcsd (mg)
CAFFcoff(mg)
CAFFtea (mg)
VITCfjuices(mg)
VITCcsdfdpsd (mg)
*See definitions of abbreviations in table 2 footnotes for all figures.Source: Economic Research Service, USDA, analysis of ACNielsen Homescan data.
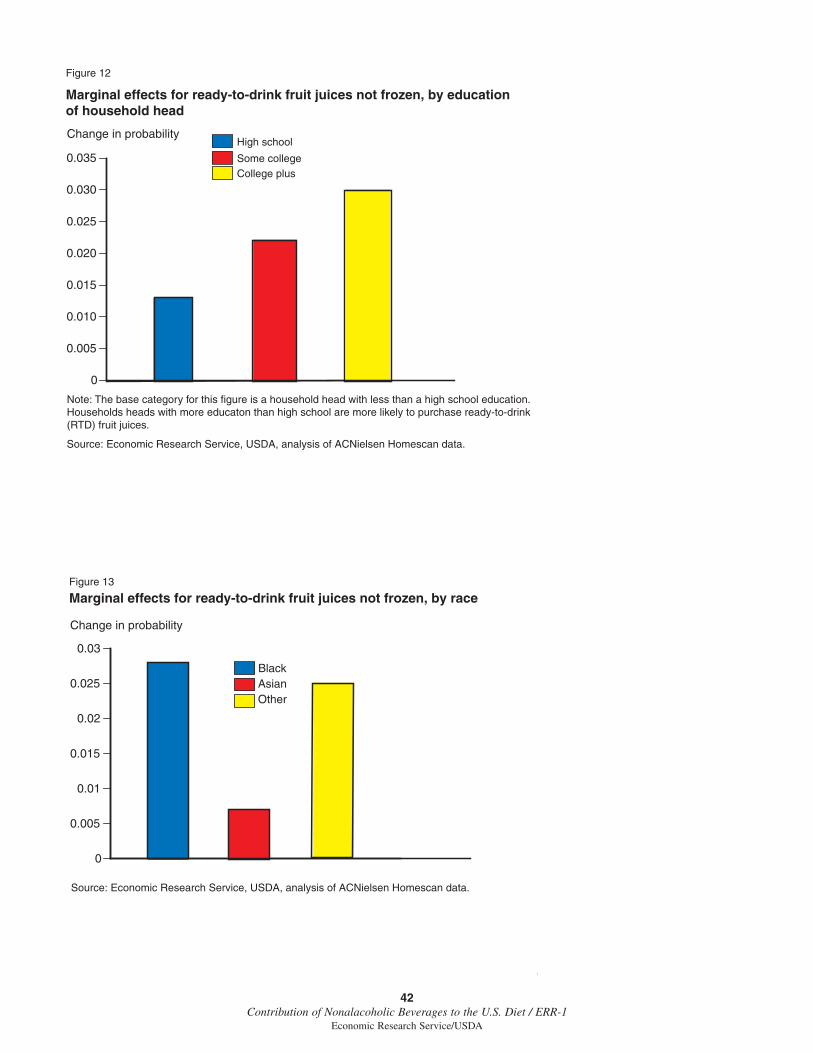
42Contribution of Nonalacoholic Beverages to the U.S. Diet / ERR-1
Economic Research Service/USDA
Source: Economic Research Service, USDA, analysis of ACNielsen Homescan data.
Marginal effects for ready-to-drink fruit juices not frozen, by education of household head
Figure 12
Change in probability
Note: The base category for this figure is a household head with less than a high school education.Households heads with more educaton than high school are more likely to purchase ready-to-drink(RTD) fruit juices.
0
0.005
0.010
0.015
0.020
0.025
0.030
0.035High school
Some collegeCollege plus
Marginal effects for ready-to-drink fruit juices not frozen, by raceFigure 13
Change in probability
BlackAsianOther
0
0.005
0.01
0.015
0.02
0.025
0.03
Source: Economic Research Service, USDA, analysis of ACNielsen Homescan data.

43Contribution of Nonalacoholic Beverages to the U.S. Diet / ERR-1
Economic Research Service/USDA
Marginal effects for ready-to-drink fruit juices not frozen, by regionFigure 14
Change in probability
CentralSouthWest
-0.07
-0.06
-0.05
-0.04
-0.03
-0.02
-0.01
0
Source: Economic Research Service, USDA, analysis of ACNielsen Homescan data.
Note: The base category for this figure is the East region. Households located in regionsother than East are less likely to purchase a ready-to-drink (RTD) fruit juice.
Source: Economic Research Service, USDA, analysis of ACNielsen Homescan data.
Marginal effects for ready-to-drink fruit drink, by age of household headFigure 15
Change in probability
-0.16
-0.14
-0.12
-0.1
-0.08
-0.06
-0.04
-0.02
0
Ages 0-49
Ages 25-39
Ages 50-64
Ages 65+
Note: The base category for this figure is a household head less than 25 years of age. Households heads older than 25 are less likely to purchase a ready-to-drink fruit drink.
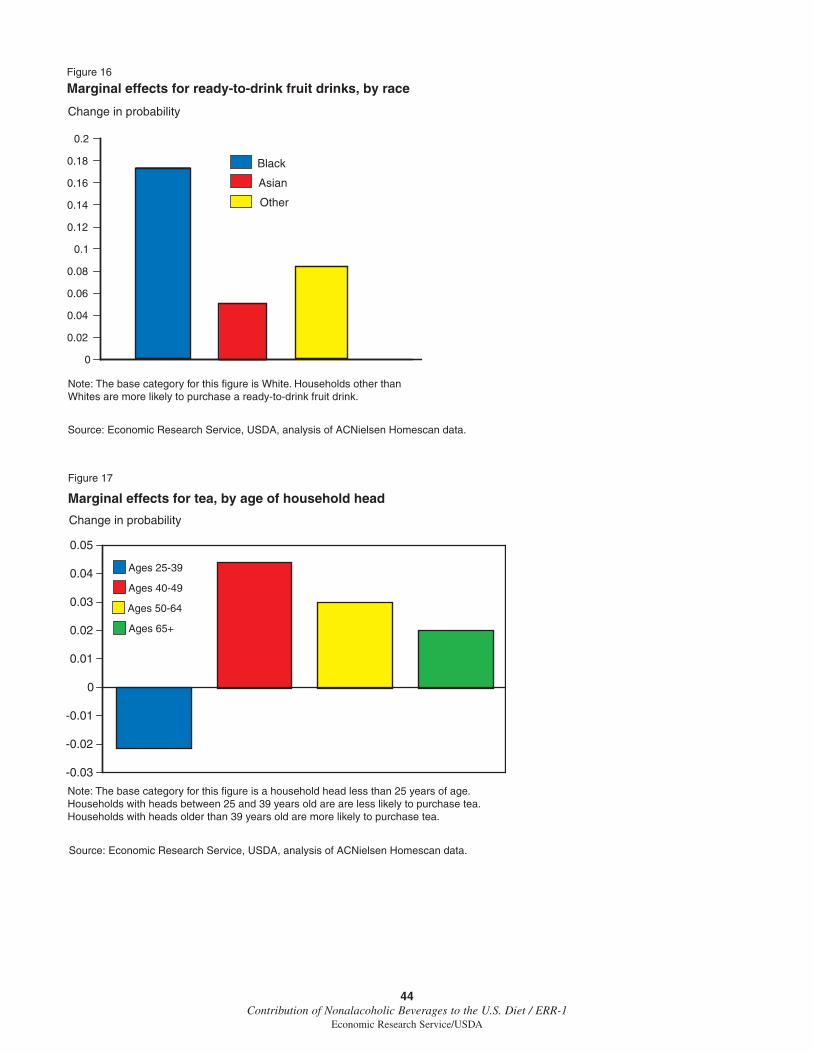
44Contribution of Nonalacoholic Beverages to the U.S. Diet / ERR-1
Economic Research Service/USDA
Source: Economic Research Service, USDA, analysis of ACNielsen Homescan data.
Marginal effects for ready-to-drink fruit drinks, by raceFigure 16
Change in probability
Note: The base category for this figure is White. Households other thanWhites are more likely to purchase a ready-to-drink fruit drink.
0
0.02
0.04
0.06
0.08
0.1
0.12
0.14
0.16
0.18
0.2
Black
Asian
Other
Source: Economic Research Service, USDA, analysis of ACNielsen Homescan data.
Marginal effects for tea, by age of household head
Figure 17
Change in probability
Ages 40-49
Ages 25-39
Ages 50-64
Ages 65+
Note: The base category for this figure is a household head less than 25 years of age. Households with heads between 25 and 39 years old are are less likely to purchase tea.Households with heads older than 39 years old are more likely to purchase tea.
-0.03
-0.02
-0.01
0
0.01
0.02
0.03
0.04
0.05
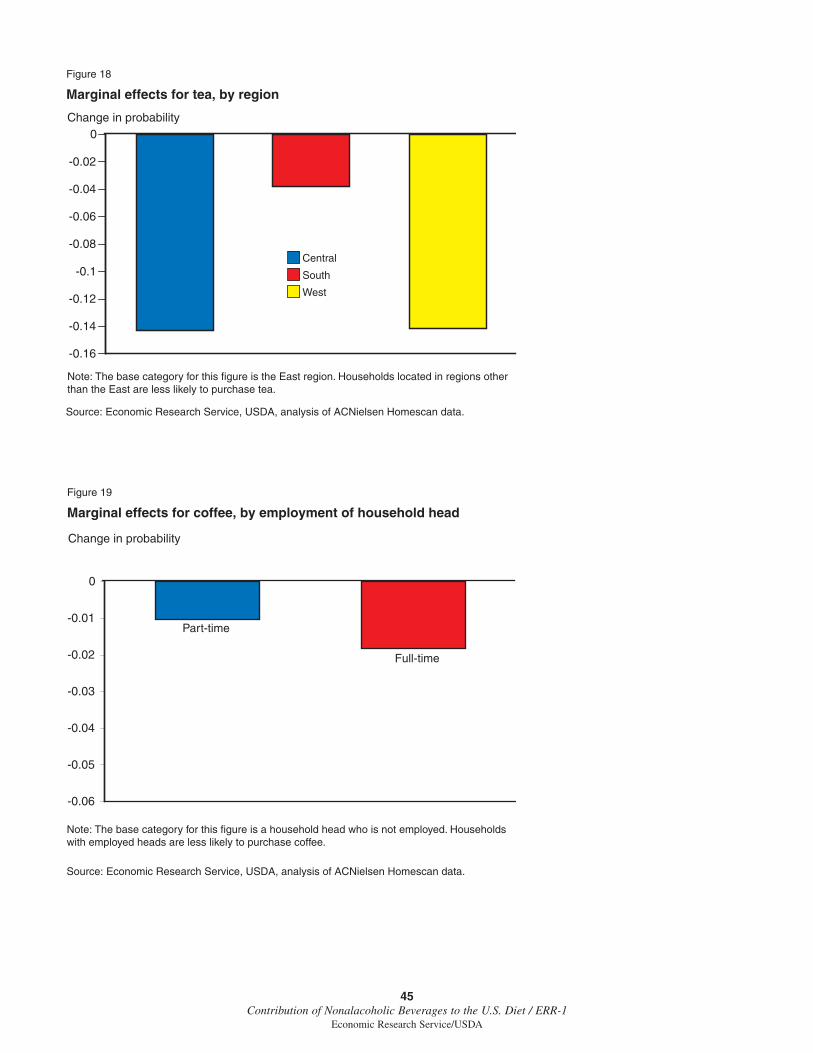
45Contribution of Nonalacoholic Beverages to the U.S. Diet / ERR-1
Economic Research Service/USDA
Source: Economic Research Service, USDA, analysis of ACNielsen Homescan data.
Marginal effects for tea, by region
Figure 18
Change in probability
Note: The base category for this figure is the East region. Households located in regions otherthan the East are less likely to purchase tea.
-0.16
-0.14
-0.12
-0.1
-0.08
-0.06
-0.04
-0.02
0
Central
South
West
Source: Economic Research Service, USDA, analysis of ACNielsen Homescan data.
Marginal effects for coffee, by employment of household head
Figure 19
Change in probability
Note: The base category for this figure is a household head who is not employed. Householdswith employed heads are less likely to purchase coffee.
-0.06
-0.05
-0.04
-0.03
-0.02
-0.01
0
Part-time
Full-time

46Contribution of Nonalacoholic Beverages to the U.S. Diet / ERR-1
Economic Research Service/USDA
Source: Economic Research Service, USDA, analysis of ACNielsen Homescan data.
Marginal effects for coffee, by education of household head
Figure 20
Change in probability
Note: The base category for this figure is a household head with less than a high-school education. Household heads with more education than high school are less likely topurchase coffee for at-home consumption.
-0.05
-0.045
-0.04
-0.035
-0.03
-0.025
-0.02
-0.015
-0.01
-0.005
0
High school
Some college
College plus
Source: Economic Research Service, USDA, analysis of ACNielsen HomeSscan data.
Marginal effects for isotonics, by age of household head
Figure 21
Change in probability
Note: The base category for this figure is a household head less than 25 years old. Householdswith heads between 25 and 40 years old are more likely to purchase isotonics. Households withheads ages 50 and older are less likely to purchase isotonics.
-0.14
-0.12
-0.1
-0.08
-0.06
-0.04
-0.02
0
0.02
0.04
0.06
Ages 40-49
Ages 25-39
Ages 50-64
Ages 65+

47Contribution of Nonalacoholic Beverages to the U.S. Diet / ERR-1
Economic Research Service/USDA
Source: Economic Research Service, USDA, analysis of ACNielsen Homescan data.
Marginal effects for isotonics, by race
Figure 22
Change in probability
Note: The base category for this figure is White. Other (non-White, non-Black, non-Asian)households are more likely to purchase isotonics than Whites, while Black and Asianhouseholds are less likely to purchase isotonics than White households are.
Black
Asian
Other
-0.1
-0.08
-0.06
-0.04
-0.02
0
0.02
0.04
Source: Economic Research Service, USDA, analysis of ACNielsen Homescan data.
Marginal effects for powdered soft drinks, by race
Figure 23
Change in probability
Note: The base category for this figure is White. Black households are more likely topurchase powdered soft drinks than White households are. Asians are less likely topurchase powdered soft drinks than Whites.
-0.3
-0.25
-0.2
-0.15
-0.1
-0.05
0
0.05
0.1
0.15
0.2Black
Asian
Other

48Contribution of Nonalacoholic Beverages to the U.S. Diet / ERR-1
Economic Research Service/USDA
Source: Economic Research Service, USDA, analysis of ACNielsen Homescan data.
Marginal effects for powdered soft drinks, by region
Figure 24
Change in probability
Note: The base category for this figure is the East region. Households in the Central and Southregions are more likely to pruchase powdered soft drinks. Households located in the West areless likely to purchase powdered soft drinks, compared with households located in the East.
Central
South
West
-0.08
-0.06
-0.04
-0.02
0
0.02
0.04
0.06
0.08
Source: Economic Research Service, USDA, analysis of ACNielsen Homescan data.
Marginal effects for carbonated soft drinks, by age of household head
Figure 25
Change in probability
Note: The base category for this figure is a household head less than 25 years of age. Households heads aged 25-64 are more likely to purchase carbonated soft drinks. Households heads older than 64 are less likesly to purchase carbonated soft drinks.
-0.008
-0.006
-0.004
-0.002
0
0.002
0.004
0.006
0.008
0.01
Ages 40-49
Ages 25-39
Ages 50-64
Ages 65+
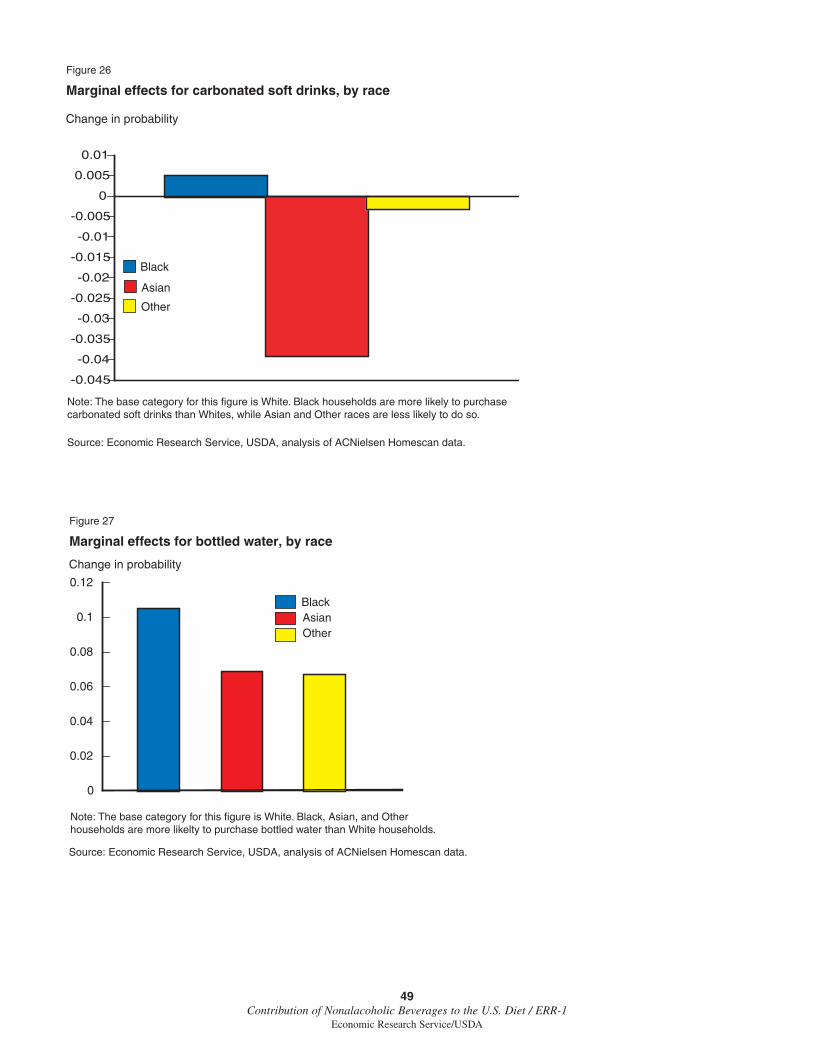
49Contribution of Nonalacoholic Beverages to the U.S. Diet / ERR-1
Economic Research Service/USDA
Source: Economic Research Service, USDA, analysis of ACNielsen Homescan data.
Marginal effects for carbonated soft drinks, by race
Figure 26
Change in probability
Note: The base category for this figure is White. Black households are more likely to purchasecarbonated soft drinks than Whites, while Asian and Other races are less likely to do so.
Black
Asian
Other
-0.045
-0.04
-0.035
-0.03
-0.025
-0.02
-0.015
-0.01
-0.005
0
0.005
0.01
Source: Economic Research Service, USDA, analysis of ACNielsen Homescan data.
Marginal effects for bottled water, by race
Figure 27
Change in probability
Note: The base category for this figure is White. Black, Asian, and Otherhouseholds are more likelty to purchase bottled water than White households.
0
0.02
0.04
0.06
0.08
0.1
0.12
BlackAsianOther

50Contribution of Nonalacoholic Beverages to the U.S. Diet / ERR-1
Economic Research Service/USDA
Source: Economic Research Service, USDA, analysis of ACNielsen Homescan data.
Marginal effects for bottled water, by region
Figure 28
Change in probability
Note: The base category for this figure is the East region. Households located in the Central regionare less likely to purchase bottled water, while households located in the West region are more likely to purchase bottled water.
South
Central
West
-0.05
-0.04
-0.03
-0.02
-0.01
0
0.01
0.02
0.03
0.04
0.05
Source: Economic Research Service, USDA, analysis of ACNielsen Homescan data.
Marginal effects for flavored milk, by age of household head
Figure 29
Change in probability
Note: The base category for this figure is a household head less than 25 years of age. Households heads older than 49 are less likely to purchase flavored milk.
-0.1
-0.08
-0.06
-0.04
-0.02
0
0.02
0.04
0.06
0.08
Ages 40-49
Ages 25-39
Ages 50-64
Ages 65+
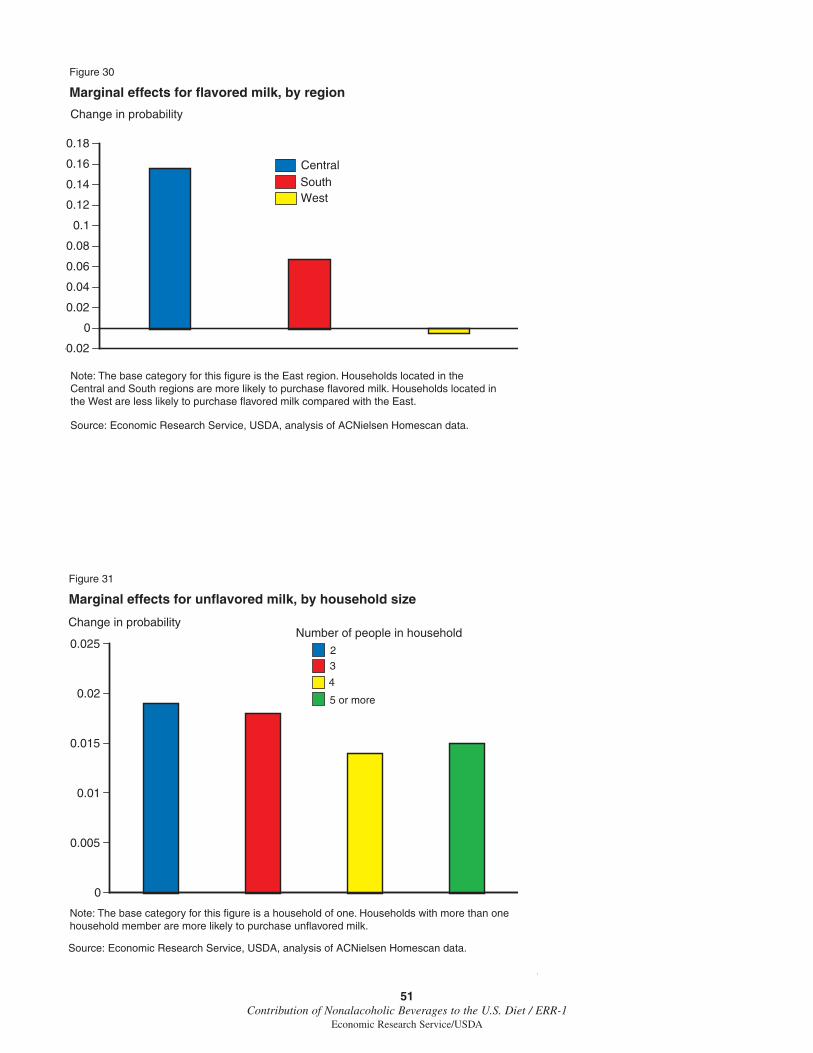
51Contribution of Nonalacoholic Beverages to the U.S. Diet / ERR-1
Economic Research Service/USDA
Source: Economic Research Service, USDA, analysis of ACNielsen Homescan data.
Marginal effects for flavored milk, by region
Figure 30
Change in probability
Note: The base category for this figure is the East region. Households located in the Central and South regions are more likely to purchase flavored milk. Households located in the West are less likely to purchase flavored milk compared with the East.
-0.02
0
0.02
0.04
0.06
0.08
0.1
0.12
0.14
0.16
0.18
Central SouthWest
Source: Economic Research Service, USDA, analysis of ACNielsen Homescan data.
Marginal effects for unflavored milk, by household size
Figure 31
Change in probability
Note: The base category for this figure is a household of one. Households with more than onehousehold member are more likely to purchase unflavored milk.
0
0.005
0.01
0.015
0.02
0.0252
3
4
5 or more
Number of people in household
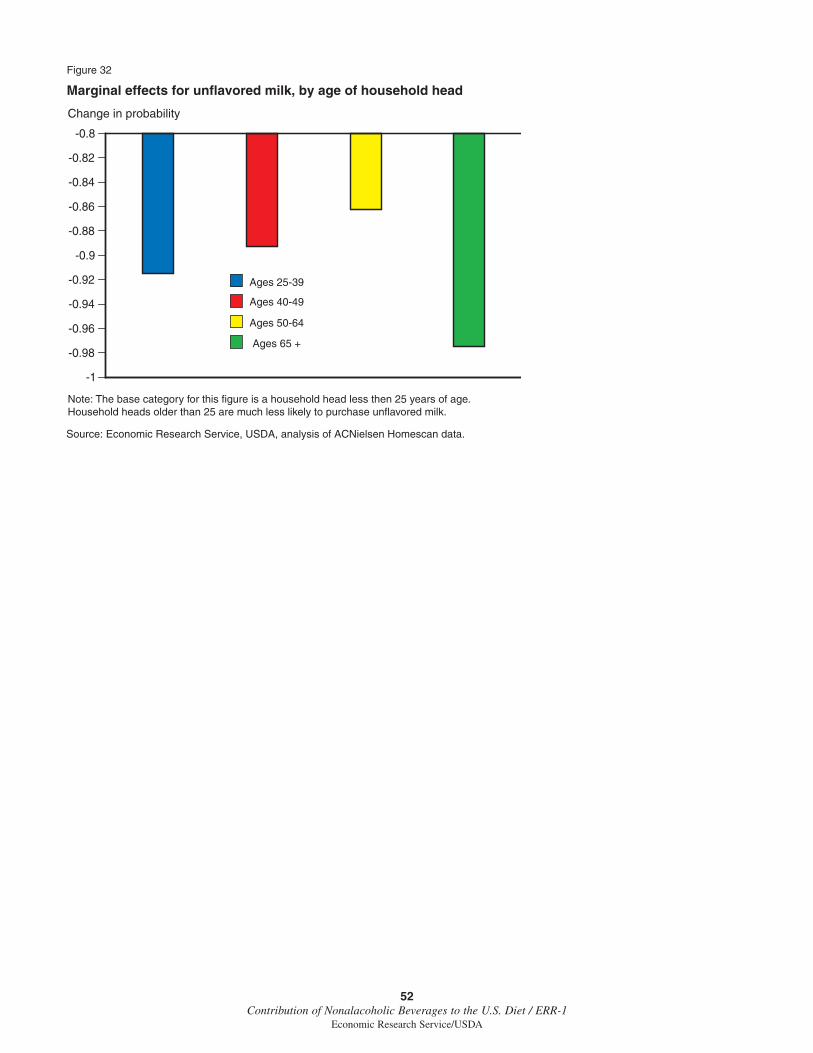
52Contribution of Nonalacoholic Beverages to the U.S. Diet / ERR-1
Economic Research Service/USDA
Source: Economic Research Service, USDA, analysis of ACNielsen Homescan data.
Marginal effects for unflavored milk, by age of household head
Figure 32
Change in probability
Note: The base category for this figure is a household head less then 25 years of age. Household heads older than 25 are much less likely to purchase unflavored milk.
-1
-0.98
-0.96
-0.94
-0.92
-0.9
-0.88
-0.86
-0.84
-0.82
-0.8
Ages 25-39
Ages 40-49
Ages 50-64
Ages 65 +

53Contribution of Nonalacoholic Beverages to the U.S. Diet / ERR-1
Economic Research Service/USDA
Source: Economic Research Service, USDA, analysis of ACNielsen Homescan data.
Average purchases (consumption) of selected nonalcoholic beverages, by poverty status
Figure 33
> 130% poverty
< 130% poverty
Gallons/household/year
Fruit juices Isotonics Tea
0
5
10
15
20
25
Coffee Carbonated soft drinks
Bottled water
Flavoredmilk
Unflavored milk
0
10
20
30
40
50
60
Fruit drinks Powderedsoft drinks
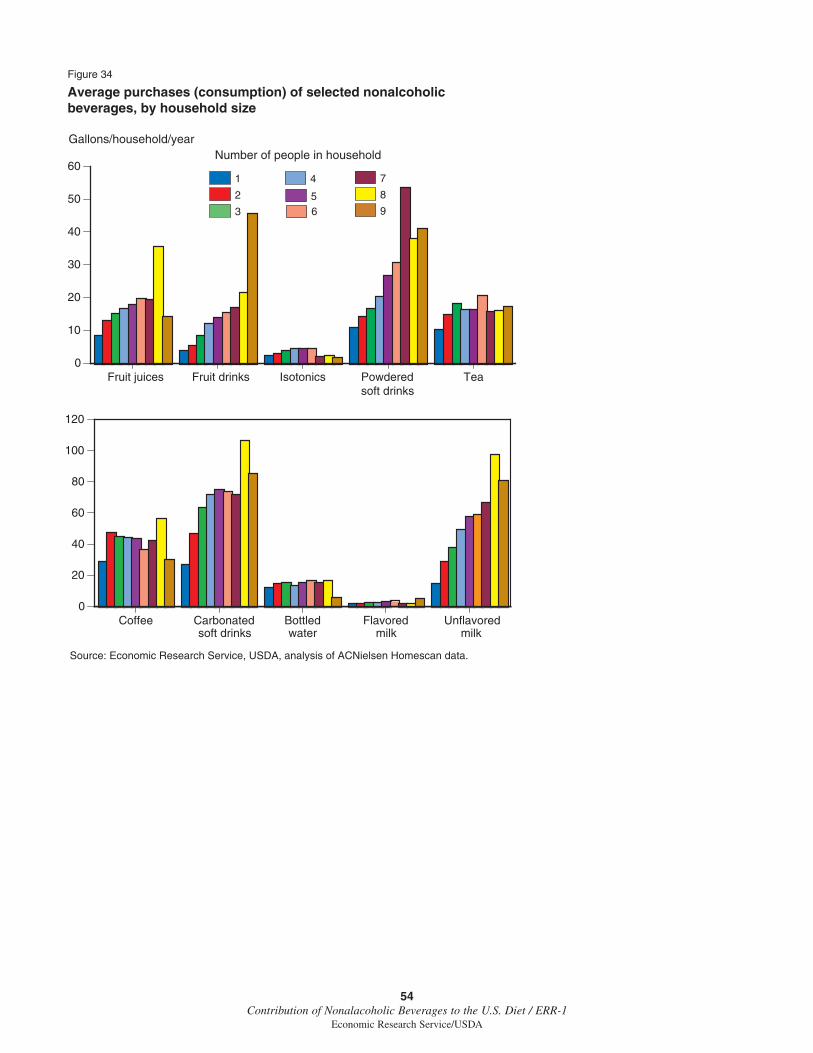
54Contribution of Nonalacoholic Beverages to the U.S. Diet / ERR-1
Economic Research Service/USDA
Source: Economic Research Service, USDA, analysis of ACNielsen Homescan data.
Average purchases (consumption) of selected nonalcoholic beverages, by household size
Figure 34
Gallons/household/year
Fruit juices Fruit drinks Isotonics Powderedsoft drinks
Tea0
10
20
30
40
50
60
Coffee Carbonated soft drinks
Bottled water
Flavored milk
Unflavoredmilk
0
20
40
60
80
100
120
5
1
2
63
74
8
9
Number of people in household
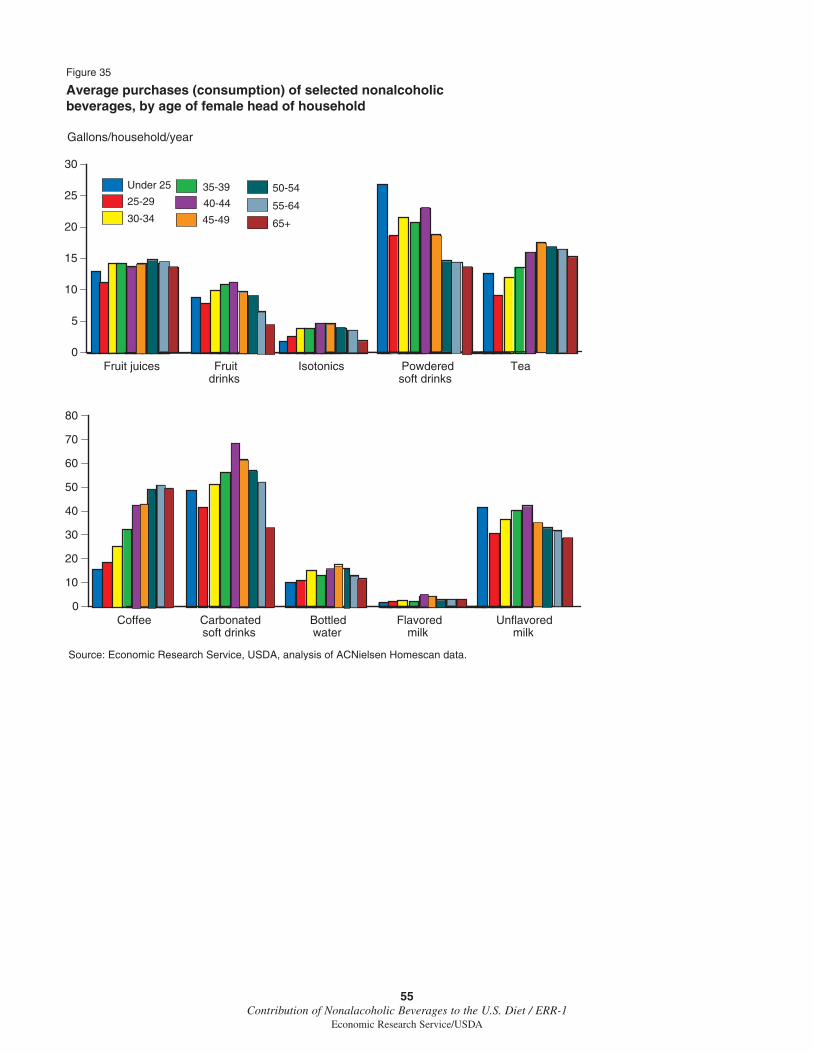
55Contribution of Nonalacoholic Beverages to the U.S. Diet / ERR-1
Economic Research Service/USDA
Source: Economic Research Service, USDA, analysis of ACNielsen Homescan data.
Average purchases (consumption) of selected nonalcoholic beverages, by age of female head of household
Figure 35
Gallons/household/year
Fruit juices Fruit drinks
Isotonics Powdered soft drinks
Tea0
5
10
15
20
25
30
Coffee Carbonatedsoft drinks
Bottled water
Flavored milk
Unflavoredmilk
0
10
20
30
40
50
60
70
80
40-44
Under 25
25-29
45-4930-34
50-5435-39
55-64
65+
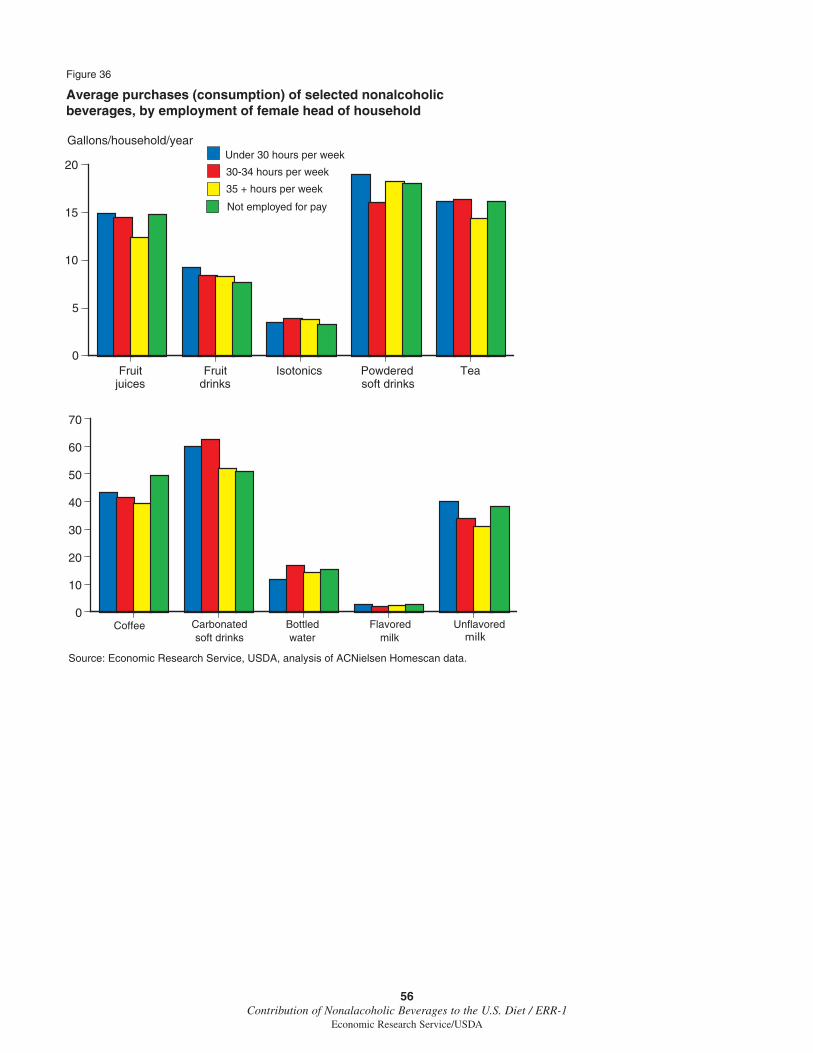
56Contribution of Nonalacoholic Beverages to the U.S. Diet / ERR-1
Economic Research Service/USDA
Source: Economic Research Service, USDA, analysis of ACNielsen Homescan data.
Average purchases (consumption) of selected nonalcoholic beverages, by employment of female head of household
Figure 36
Gallons/household/year
Fruit juices
Fruit drinks
Isotonics Powdered soft drinks
Tea0
5
10
15
20
Coffee Carbonatedsoft drinks
Bottled water
Flavored milk
Unflavored0
10
20
30
40
50
60
70
milk
Under 30 hours per week
30-34 hours per week
35 + hours per week
Not employed for pay
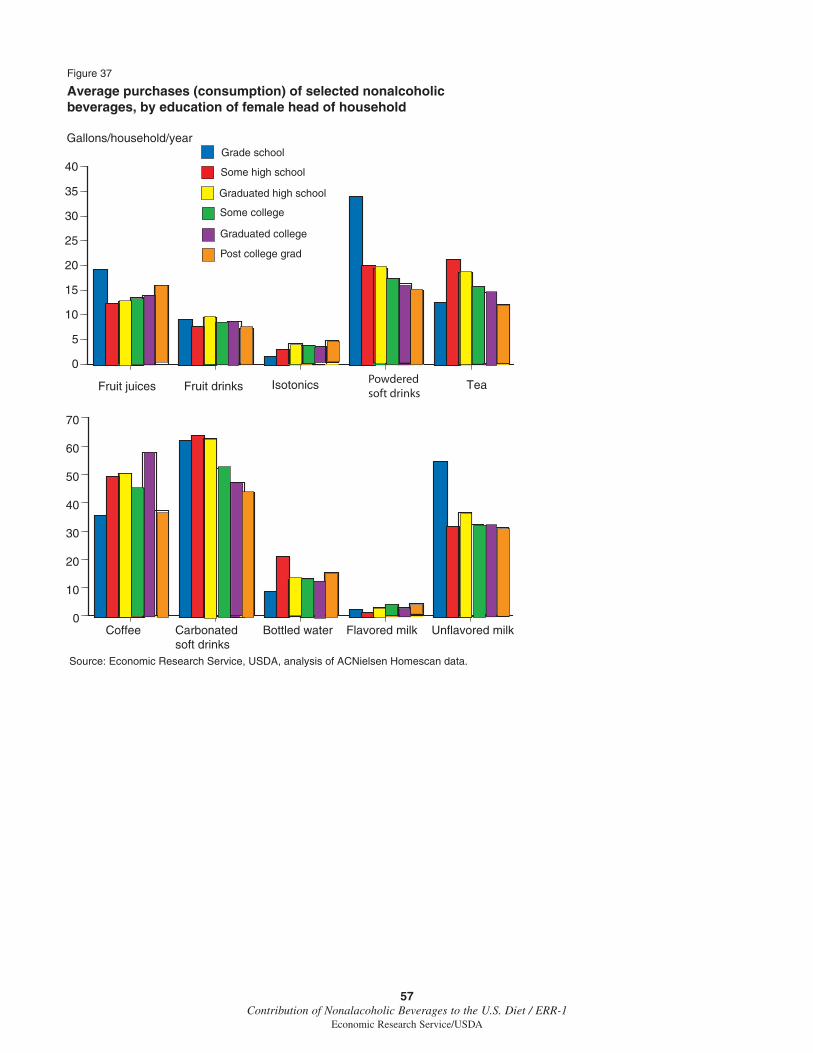
57Contribution of Nonalacoholic Beverages to the U.S. Diet / ERR-1
Economic Research Service/USDA
Source: Economic Research Service, USDA, analysis of ACNielsen Homescan data.
Average purchases (consumption) of selected nonalcoholic beverages, by education of female head of household
Figure 37
Gallons/household/year
Fruit juices Fruit drinks Isotonics Tea
0
5
10
15
20
25
30
35
40
Powderedsoft drinks
Coffee Carbonatedsoft drinks
Bottled water Flavored milk Unflavored milk0
10
20
30
40
50
60
70
Grade school
Some high school
Graduated high school
Some college
Graduated college
Post college grad
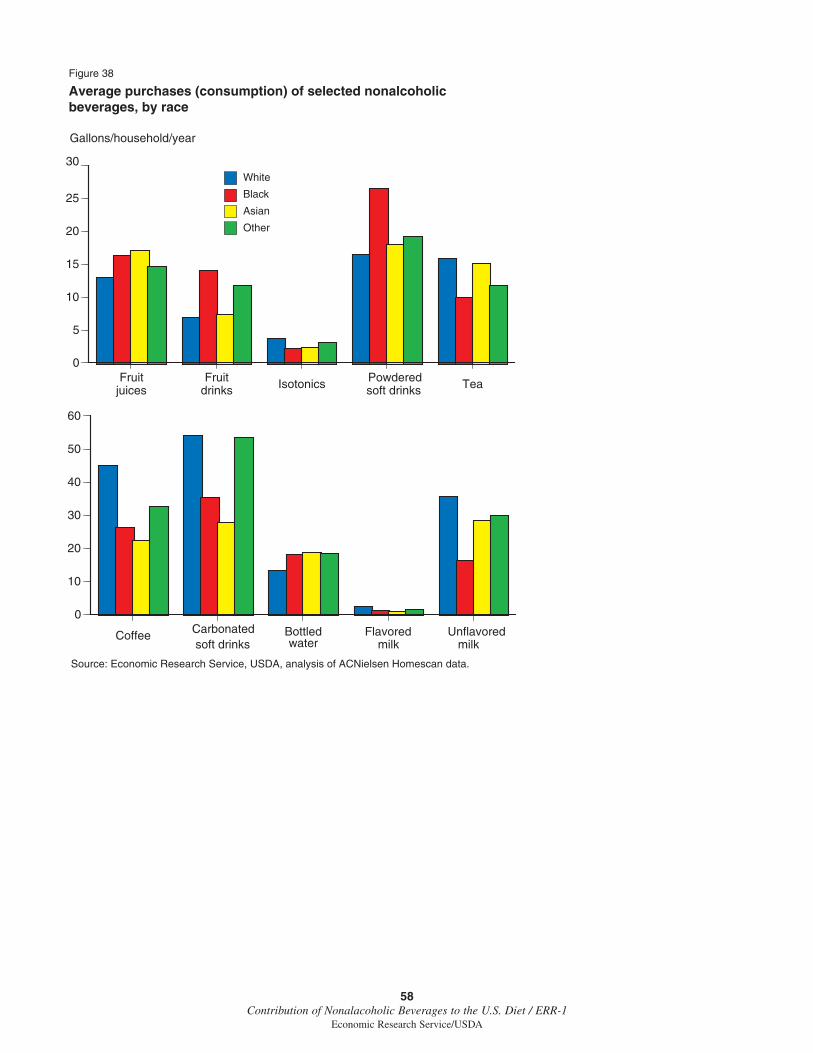
58Contribution of Nonalacoholic Beverages to the U.S. Diet / ERR-1
Economic Research Service/USDA
Source: Economic Research Service, USDA, analysis of ACNielsen Homescan data.
Average purchases (consumption) of selected nonalcoholic beverages, by race
Figure 38
Gallons/household/year
Fruit juices
Fruit drinks Isotonics Powdered
soft drinks Tea
0
5
10
15
20
25
30
Coffee Carbonated soft drinks
Bottled water
Flavored milk
Unflavoredmilk
0
10
20
30
40
50
60
Black
White
Asian
Other
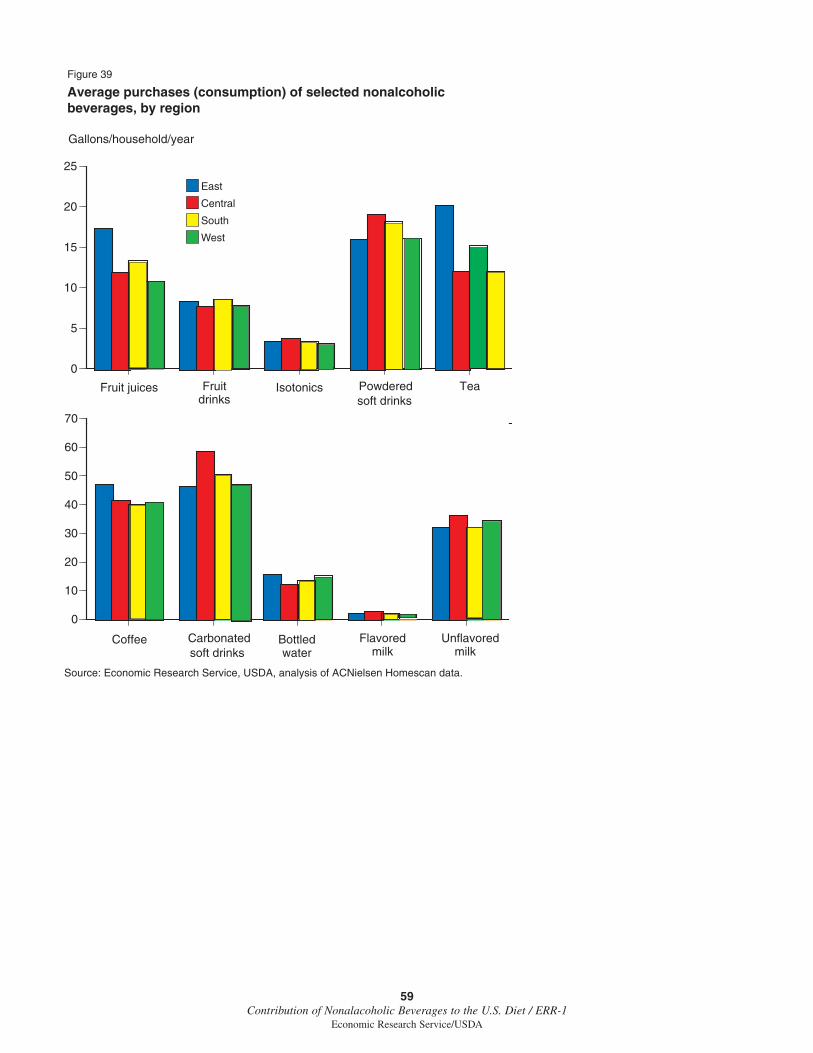
59Contribution of Nonalacoholic Beverages to the U.S. Diet / ERR-1
Economic Research Service/USDA
Source: Economic Research Service, USDA, analysis of ACNielsen Homescan data.
Average purchases (consumption) of selected nonalcoholic beverages, by region
Figure 39
Gallons/household/year
Fruit juices Fruit drinks
Isotonics Powdered soft drinks
Tea
0
5
10
15
20
25
Coffee Carbonated soft drinks
Bottled water
Flavored milk
Unflavored milk
0
10
20
30
40
50
60
70
Central
East
South
West
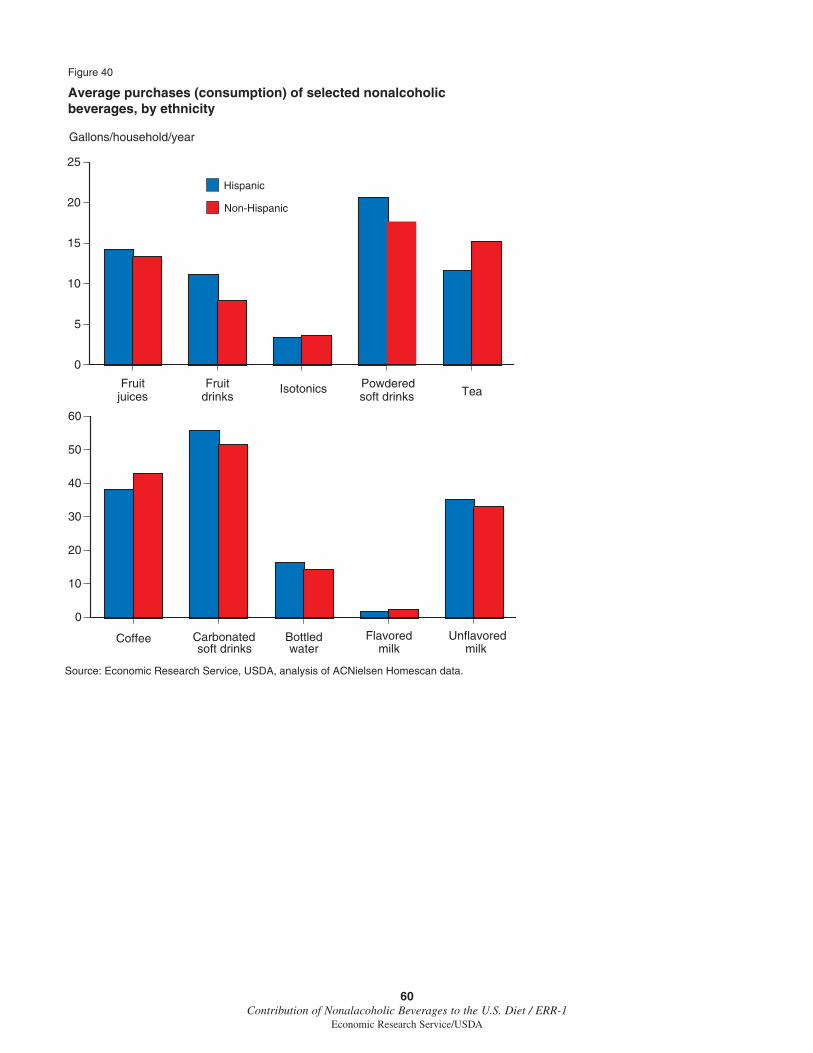
60Contribution of Nonalacoholic Beverages to the U.S. Diet / ERR-1
Economic Research Service/USDA
Source: Economic Research Service, USDA, analysis of ACNielsen Homescan data.
Average purchases (consumption) of selected nonalcoholic beverages, by ethnicity
Figure 40
Gallons/household/year
Fruit juices
Fruit drinks
Isotonics Powdered soft drinks Tea
0
5
10
15
20
25
Coffee Carbonated soft drinks
Bottled water
Flavored milk
Unflavoredmilk
0
10
20
30
40
50
60
Non-Hispanic
Hispanic
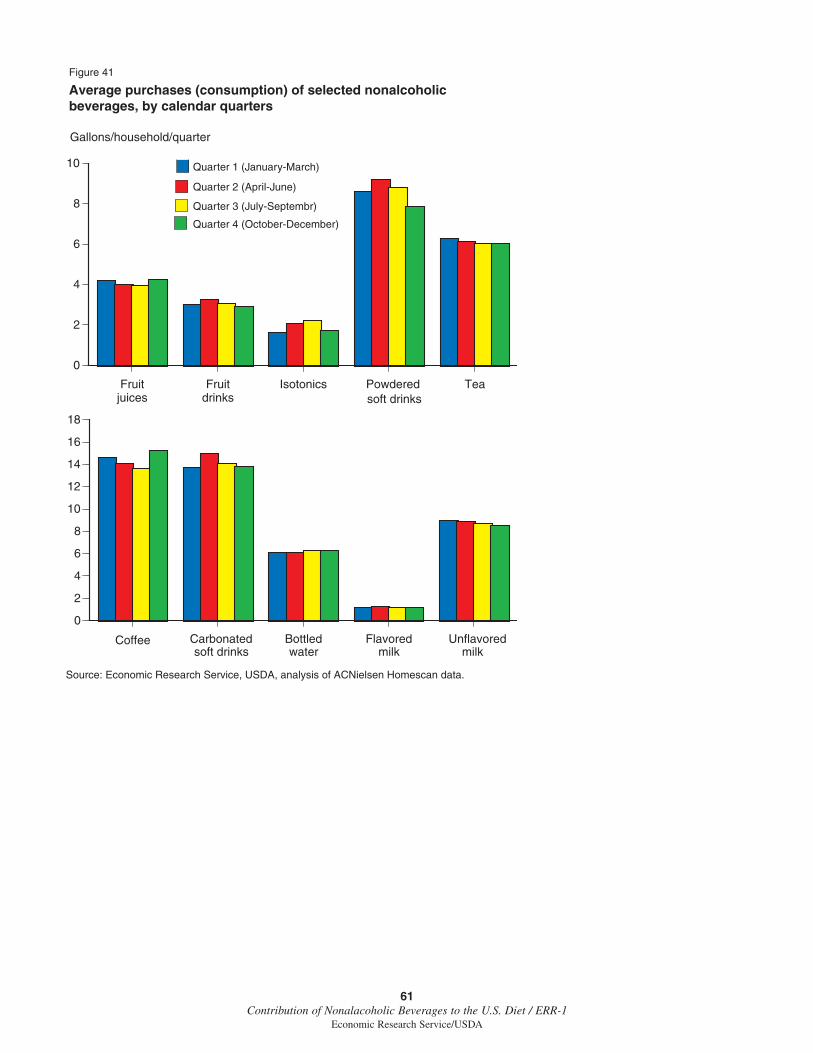
61Contribution of Nonalacoholic Beverages to the U.S. Diet / ERR-1
Economic Research Service/USDA
Source: Economic Research Service, USDA, analysis of ACNielsen Homescan data.
Average purchases (consumption) of selected nonalcoholic beverages, by calendar quarters
Figure 41
Gallons/household/quarter
Fruit juices
Fruit drinks
Isotonics Powdered soft drinks
Tea
0
2
4
6
8
10
Coffee Carbonated soft drinks
Bottled water
Flavored milk
Unflavored milk
0
2
4
6
8
10
12
14
16
18
Quarter 1 (January-March)
Quarter 3 (July-Septembr)
Quarter 2 (April-June)
Quarter 4 (October-December)