Contributions and Challenges of Agro-trade to Food … · 2018-06-18 · 10 7 35 33 19 62 94 348 ....
41
Contributions and Challenges of Agro-trade to Food Security in China Jing ZHU College of Economics & Management Nanjing Agricultural University , P.R.China Prepared for the WTO Agricultural Policy Landscape Symposium, Geneva, Switzerland, June.13-14, 2018
Transcript of Contributions and Challenges of Agro-trade to Food … · 2018-06-18 · 10 7 35 33 19 62 94 348 ....

Contributions and Challenges
of Agro-trade to Food Security in China
Jing ZHU College of Economics & Management
Nanjing Agricultural University , P.R.China
Prepared for the WTO Agricultural Policy Landscape Symposium, Geneva, Switzerland, June.13-14, 2018

Outline
China’s Food Security Status and Progress
China’s Agricultural Trade Development
Contributions of Agro-trade to China’s Food Security
Challenges of Agro-trade to China’s Food Security
Ways Forward
2

Per Capita Consumption of Major Food Items in China ,1960s-2010s
Note: Cereals excludes beer, fruits excludes wine, milk excludes butter, aquatic Products include aquatic animals & plants. Sources: FAOSTAT “Food Balance Sheets”
Improvement in Food Consumptions in China
0.4
1.2
4.8
2.5
2.1
3.8
4.3
79.7
91.2
10
7
35
33
19
62
94
348
150
0 50 100 150 200 250 300 350 400
Aquatic Products
Vegetable Oils
Fish, Seafood
Milk
Eggs
Meat
Fruits
Vegetables
Cereals
kg/capita/yr
2013 1961
3

GFSI Scores Comparison between China and Other Countries (2012-2017)
Notes: score 0-100 where 100=best. Sources: EUI(2017) “Global Food Security Index 2017”.
China Ranked 45th among 113 Countries in the 2017 GFSI Ranking
4

China’s Grain Output Growth,1952-2016
Year Meat Fruits Vegetables 1980 12 7 1985 19 12 1990 29 19 1995 41 42 2000 60 62 2001 61 67 484 2002 62 70 529 2003 64 145 540 2004 66 153 551 2005 69 161 565 2006 71 171 540 2007 69 181 565 2008 73 192 592 2009 76 204 618 2010 79 214 651 2011 80 228 679 2012 84 241 709 2013 85 251 735 2014 87 261 760 2015 86 274 785 2016 85 284 798
China’s Other Major Food Products output growth,1980-2016 (Million tones)
Sources: NBSC “China Statistics Yearbook”(various years)
Domestic Food Production Growth
0
100
200
300
400
500
600
700
1952
1956
1960
1964
1968
1972
1976
1980
1984
1988
1992
1996
2000
2004
2008
2012
2016
Million tones
1958
1978
1984
1996
2013
2015

Source: China Customs data
China’s Cereals Trade, 1949-1978
0
1
2
3
4
5
6
7Billion $ Export Import
0
2
4
6
8
10
1949 1954 1958 1962 1966 1970 1974 1978
Million MT Export Import
– Low level – Net exporter foreign exchange earner
China’s Agricultural Trade, 1949-1978
6
Phase I: 1949-1978

Source: China Customs
China’s Agricultural Trade Balance,1979-1993
1980 1985 1990
Export Live Animals and Meat 0.8 0.8 1.2
Aquatic products 0.4 0.3 1.4 Cereals, Oilseeds and Vegetable Oil 0.5 1.3 1.2
Vegetable and Fruits 1.1 1.3 2.3
Import Live Animals and Meat 0.0 0.0 0.1
Aquatic products 0.0 0.0 0.1 Cereals, Oilseeds and Vegetable Oil 2.5 1.1 2.5
Vegetable and Fruits 0.1 0.1 0.1
China’s Trade of Selected products, 1980-1990
Billion $
-4
-2
0
2
4
6
8
0
2
4
6
8
10
12
14Billion $
Export Import Balance
Phase II: 1979-1993 – Growing in volume – Comparative advantage – Net exporter
7

Source: China Customs
China’s Agricultural Trade Net Import of China’s Cereals (Million MT)
Phase III: 1994-2000 – Fluctuation – Adjusting to domestic production-consumption – Soybean imports growing Preparing to join WTO
8
Cereals Rice Wheat Maize Soybean
1994 2.6 -1.0 7.2 8.7 -0.8
1995 19.8 1.6 11.4 5.1 -0.1
1996 9.6 0.5 7.7 0.2 0.9
1997 -4.2 -0.6 1.5 -6.7 2.7
1998 -5.0 -3.5 1.3 -4.4 3.0
1999 -4.0 -2.5 0.3 -4.3 4.1
2000 -10.7 -2.7 0.7 -10.5 10.2
Notes: “+” means net import, while “-” means net export
0
1
2
3
4
5
6
7
0
2
4
6
8
10
12
14
16
18
1994 1995 1996 1997 1998 1999 2000
Billion $
Export Import Balance

Phase IV: 2001-- - Joined WTO
• Tariff cuts
17.9% in 2001 to 15.2% in 2016
• Establish a Tariff Rate Quota (TRQ) import system
wheat, corn, rice, sugar, cotton, wool
• Reduce the export subsidies and state trading
• Cap domestic agricultural support
– 8.5% AMS
9

• Increasing Trade Volume
Source: China Customs
China Agricultural Trade, 2001-2016
Billion $
10

Source: China Customs
• Growing Net Importer
China Agricultural Trade Balance, 2001-2016
11

• Increasingly Revealed Comparative Advantage/Disadvantage
• Import land-intensive products – cereal, oilseeds (soybeans),
vegetable oil, cotton
• Export labor-intensive products – vegetables,fruits,
aquatic products 12

1996-2000 2001-2010 2011-2016
Soybean
Cotton
Meat
China’s Share of Global Agricultural Import Market
Source: UN Comtrade
• Growing Imports: China vs the World
13
Rank 2000 2005 2010 2012 2014 2016
1 EU EU EU EU EU EU
2 USA USA USA China China USA
3 Japan Japan China USA USA China
4 China China Japan Japan Japan Japan
5 Canada Canada Russia Russia Russia Canada
Changes of Top 5 Importers of Agro-products in the World

Source: UN Comtrade
China’s Share of Global Agricultural Export Market 1996-2000 2001-2010 2011-2016
Vegetables
Fruits
Aquatic Products
14
Changes of Top 5 Exporters of Agro-products in the World • Growing Exports: China vs the World
Rank 2000 2005 2010 2012 2014 2016
1 EU EU EU EU EU EU
2 USA USA USA USA USA USA
3 Canada Canada Brazil Brazil Brazil Brazil
4 China Brazil China China China China
5 Australia China Canada Canada Canada Indonesia

0.08
0.48 0.39
0.86
1.99
1.29
0.12
0.00
0.50
1.00
1.50
2.00
2.50Ha
Land
2.1 8.8
27.5 30.0
21.0
80.2
1.1 0
20
40
60
80
100Km3
Water
Per Capita Land & Water Endowment in China and Selected Countries(2014)
Sources: FAOSTAT
Land and Water Resources: China vs Other Countries
15

Food Supply Quantity Per Capita Year in China & World, 1960s-2010s (kg/capita/yr)
Sources: FAOSTAT “Food Balance Sheets”
Consumption of Food: China vs the World
16
0
10
20
Vegetable Oils
China World Japan
0
20
40
60Sugar & Sweeteners
Korea China World
0
20
40
60
80
Fish, Seafood
China World Japan
0
100
200
300
Milk
China USA World
0
30
60
90
Meat
China World EU
0
40
80
120
Fruits
China World EU

Daily Energy Intake: China vs World
Sources: FAOSTAT “Food Balance Sheets”
17
0
1000
2000
3000
4000
1961 1965 1969 1973 1977 1981 1985 1989 1993 1997 2001 2005 2009 2013
China World USA EU
Daily Energy Intake Per Capita in China & World, 1960s-2010s (kcal/capita/day)

Source: UN Comtrade
Agro-trade: Increasingly Important Supplement
18
0
20
40
60
80
100
2001
2002
2003
2004
2005
2006
2007
2008
2009
2010
2011
2012
2013
2014
2015
2016
2017
Soybean
Million MT

Import Food: Import Virtual Land & Water China’s Net VL& VW Imports via Major Food Products (2000-2015)
(a) VL (b) VW
19 Source: Ali, Huang, Wang & Xie. (2017)

Imports of Virtual Land & Water: Resources Saving Domestically and Globally
Source: Ali, Huang, Wang & Xie. (2017)
Year
Domestic savings
Global savings
Water (km3)
Land (Mha)
Water (km3)
Land (Mha)
2000 18.3 3.6 11.4 1.9
2005 61.4 14.1 28.8 4.9
2010 140.1 31.0 62.0 11.7
2015 215.5 46.7 95.4 15.2
20
China’s Net VL& VW Imports via Major Food Products (2000-2015)

21
Concerns on SSR of Grains
Painful MeMory of Great faMines in China
• Famine in 1942–43 Mainly occurred in Henan province 2 to 3 million people died
• Famine in 1959–61 Claimed the lives of 17~30 million,
the highest number of fatalities of any single historical event ( Qian, Meng & Yared, 2015)
-1.2% -0.8% -0.4% 0.0% 0.4% 0.8% 1.2%0
10
20
30
40
50
60
70
80
90
100+Female Male
Population Pyramid in China (2010)

Groups Items Endowments of Agri. Land
(ha/capita)
Population (1000
person)
% of world population
(%)
Cereal Self- sufficiency
(%)
Net Import
Quantity (1000 ton)
% of world
market (%)
Group A
CHN 0.37 1375157 19.3 98.1 9193 2.5
USA 1.30 313308 4.4 119.5 -62541 -17.0
BRA 1.38 200552 2.8 115.6 -11746 -3.2
Group B
JPN 0.04 128415 1.8 24.2 25718 7.0
KOR 0.04 49955 0.7 21.7 14089 3.8
TPE 0.03 23263 0.3 17.1 5995 1.6
Group C
IND 0.14 1262955 17.7 108.3 -18311.7 -5.0
INA 0.23 248874 3.5 85.2 11503 3.1
PAK 0.20 177936 2.5 118.5 -5480 -1.5
Cereal SSR: China vs Other Economies (2011-2013 average)
Source: calculated from data in FAOSTAT.
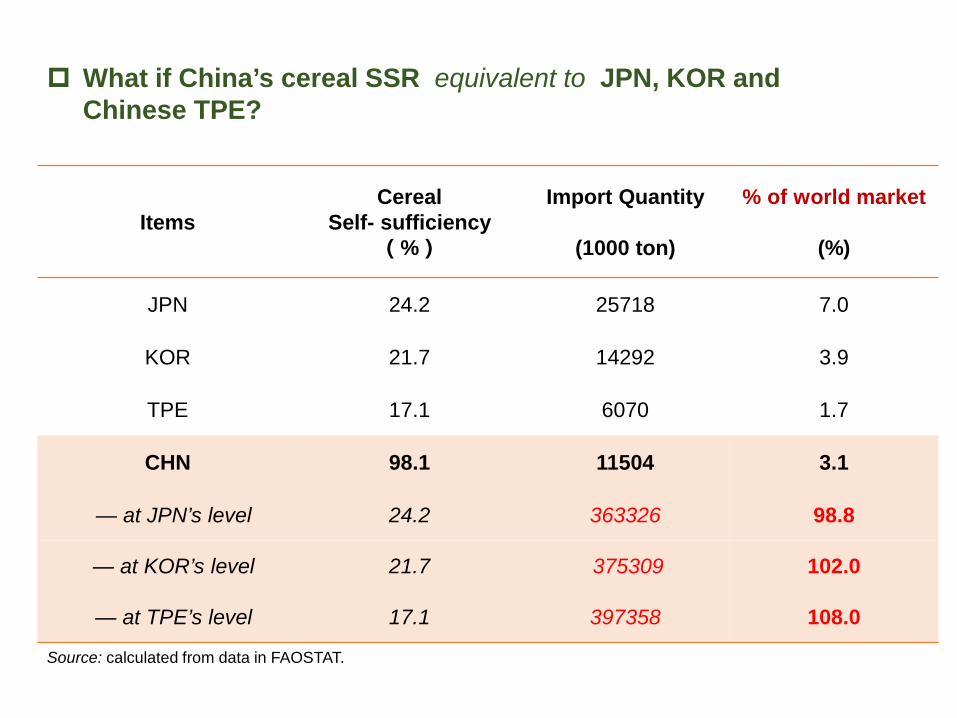
What if China’s cereal SSR equivalent to JPN, KOR and Chinese TPE?
Items Cereal
Self- sufficiency (%)
Import Quantity
(1000 ton)
% of world market
(%)
JPN 24.2 25718 7.0
KOR 21.7 14292 3.9
TPE 17.1 6070 1.7
CHN 98.1 11504 3.1
— at JPN’s level 24.2 363326 98.8
— at KOR’s level 21.7 375309 102.0
— at TPE’s level 17.1 397358 108.0
Source: calculated from data in FAOSTAT.

What if China’s cereal import quantity equivalent to JPN, KOR and Chinese TPE?
Items Import Quantity
(1000 ton)
% of world market
(%)
Cereal Self- sufficiency
(%)
JPN 25718 7.0 24.2
KOR 14292 3.9 21.7
TPE 6070 1.7 17.1
CHN 11504 3.1 98.1
— at JPN’s level 25718 7.0 95.3
— at KOR’s level 14292 3.9 97.5
— at TPE’s level 6070 1.7 99.2
Source: calculated from data in FAOSTAT.

Rice Wheat
Source: USDA
SSRs of Selected Food Products in China, 2001-2016
Maize Soybean
China’s SSRs of major food products have been declining since the WTO accession

26
Changes of China’s rural population and agricultural employment
(1991-2015)
Source: World Bank
Concerns on Farm Employment & Rural Livings
0
200
400
600
800
1000Million people
Rural Population
Agricultural Employment

Source: NBSC and USDA
2010 2011 2012 2013 2014 2015 Growth Rate (2010-2015)
Rice CHN 1.68 1.90 2.17 2.41 2.40 2.41 43.5%
USA 1.75 1.86 1.76 1.75 1.72 1.64 -6.3%
Wheat CHN 1.63 1.78 2.11 2.39 2.21 2.29 40.5%
USA 1.42 1.79 1.57 1.82 1.93 1.76 23.9%
Maize CHN 1.36 1.58 1.83 2.02 2.08 2.15 58.1%
USA 1.00 1.10 1.35 1.06 0.98 0.99 -1.0%
Soybean CHN 2.85 3.27 3.87 4.45 4.56 4.78 67.7%
USA 2.02 2.18 2.33 2.48 2.24 2.27 12.4%
Cotton CHN 14.21 16.00 18.01 20.72 19.07 19.93 40.3%
USA 11.65 18.78 14.71 16.50 14.06 13.37 14.8%
Cost Changes of Selected Crops, China vs. US, 2010-2015 (RMB/kg)
27

28
What if China’s rural population (%) equivalent to EU or USA ?
Items % rural population Rural population (million)
Rural population to migrate (million)
EU 25.2% 128.4 n.a
USA 18.4% 59.0 n.a
CHN 44.4% 608.6 n.a
— at EU’s level 25.2% 345.5 263.1
— at USA’s level 18.4% 252.1 356.6
Source: calculated from data in World Bank Database (2015).

29
Items Agro-land /rural
population (sq. km)
Rural population (million)
Rural population to migrate (million)
EU 0.014 128.4 n.a
USA 0.069 59.0 n.a
CHN 0.009 608.6 n.a
— at EU’s level 0.014 367.4 241.3
— at USA’s level 0.069 76.7 531.9
What if China’s agro-land/rural population labor equivalent to…..
Source: calculated from data in World Bank Database (2015).

Overall Net Effects of Agricultural Trade on Farm Employment in China, 2000-2015
-400
-300
-200
-100
0
100
200
300
2000 2001 2002 2003 2004 2005 2006 2007 2008 2009 2010 2011 2012 2013 2014 2015
Job Creation(10,000 labor)
Job Substitution(10,000 labor)
-264.7
Labor-intensive
Land-intensive
Overall net effects
30 Source: calculated from data in NBSC.

Marginal Nationwide Welfare Effects on Farmers, 1% Reduction in Tariffs
Year Agri. Inc. (1)
Wage Inc. (2)
Agri. Cons.
(3)
Manuf. Cons.
(4)
Agri. Welfare
(5)=(1)-(3)
Total Welfare
(6)=(1)+(2)-(3)-(4)
1997 -0.57 -0.07 -0.44 -0.80 -0.13 0.61
1998 -0.54 -0.07 -0.43 -0.83 -0.11 0.65
1999 -0.53 -0.08 -0.42 -0.85 -0.11 0.67
2000 -0.51 -0.08 -0.39 -0.91 -0.12 0.71
2001 -0.49 -0.09 -0.38 -0.93 -0.11 0.73
2002 -0.48 -0.09 -0.37 -0.96 -0.11 0.76
2003 -0.47 -0.09 -0.37 -0.97 -0.1 0.77
2004 -0.48 -0.09 -0.38 -0.94 -0.1 0.75
2005 -0.45 -0.10 -0.36 -0.97 -0.09 0.79
2006 -0.43 -0.10 -0.35 -1.02 -0.08 0.83
2007 -0.42 -0.10 -0.35 -1.02 -0.07 0.83
2008 -0.41 -0.10 -0.35 -1.00 -0.06 0.84
2009 -0.39 -0.11 -0.33 -1.05 -0.06 0.88
2010 -0.38 -0.11 -0.33 -1.05 -0.05 0.89
Source: Zhu et al. (2015) 31

[6, 9)
[3, 6)
[0, 3)
[9, 12)
Unit: 10000 yuan
The Yangtze River Delta Region
The Pearl River Delta Region
GDP Per Capita: Provinces
Source: NBSC
Concerns on Farm Land Resource Conservation
32

Grain Production: Provinces
Source: You et al. (2011)
1980-82 average The Northeast Area
The Yangtze River Delta Region
The Pearl River Delta Region
2001-2003 average
33

Concerns on Possible Trade Disputes
Average of WTO members 62%
China 15.2%
Brazil 36%
Egypt 95.6%
India 113.1%
Kingdom of Lesotho 199%
Tariffs
Average Agriculture Tariff Rate of WTO Members
Source: WTO 34

Tariff Rates of Major Developing and Developed Countries
Source: WTO 35

China’s Food Security Status and Progress
China’s Agricultural Trade Development
Contributions of Agro-trade to China’s Food Security
Challenges of Agro-trade to China’s Food Security
Ways Forward
36

China’s Food Demand : Still Growing • Rising population & incomes, urbanization, and diet changes
Rising GDP per capita Changing Consumption Pattern, 2009/11 to 2021 (%)
Source: OECD Source: FAO 37

38
Moving Towards Sustainable Agriculture
“Cang-liang-yu-di”: storage food in land
“Cang-liang-yu-ji ”: storage food in technology
Environment friendly: reduce fertilizer &
pesticide use; control soil & water pollution

39
Improving Agricultural Competitiveness
Cut down production cost : foster land rental market and land consolidation; provide social service for agricultural production operations
Reform domestic support policy: separate income support from pricing policy

Open-door Policy
40