Contribution of the Golf Industry to the Arizona Economy ...

Contribution of the Golf Industry to the Arizona Economy in 2014
Dari Duval Ashley Kerna George Frisvold Kai Umeda Runfeng Li
COLLEGE OF AGRICULTURE & LIFE SCIENCES
CooperativeExtension

Contribution of the Golf Industry to the Arizona Economy in 2014Dari Duval Economic Impact Analyst
Ashley Kerna Economic Impact Analyst
George Frisvold Professor and Extension Specialist
Kai Umeda Extension Specialist
Runfeng Li Graduate Research Assistant
December 2016
COLLEGE OF AGRICULTURE & LIFE SCIENCES
CooperativeExtension

© 2016 The Department of Agricultural and Resource Economics, The University of Arizona.Any products, services or organizations that are mentioned, shown or indirectly implied in this publication do not imply endorsement by The University of Arizona.Issued in furtherance of Cooperative Extension work, acts of May 8 and June 30, 1914, in cooperation with the U.S. Department of Agriculture, Jeffrey C. Silvertooth, Associate Dean & Director, Extension & Economic Development, College of Agriculture Life Sciences, The University of Arizona.The University of Arizona is an equal opportunity, affirmative action institution. The University does not discriminate on the basis of race, color, religion, sex, national origin, age, disability, veteran status, or sexual orientation in its programs and activities.

Contribution of the Golf Industry to the Arizona Economy iii
ContentsAcknowledgments viExecutive Summary 7Introduction 10
Overview 10Motivation 10Economic and Industry Context 10
Methods and Data 14Arizona Golf Facility Survey 14Statistical Methodology and Expansion Factor 15Golf-Related Tourism 15Golf-Related Businesses 15Economic Contribution Analysis 15Residential Real Estate Premiums 16Golf Environmental Analysis 16
Arizona Golf Facilities 17Population and Distribution by Facility Characteristics 17Golf Play 19Facility Revenues 20Facility Expenses 21Facility Employment 22Capital Investment and Renovations 23Charitable Contributions 23
Golf Tourism 24Golf Travelers 24
Out-of-State and Foreign Golfers 24Reason for Visit 24Expenditure Pattern 24
Professional Tournament Spectators 25Estimated Direct Impact of Golf Tourism in Arizona 25
Golf-Related Businesses 26Economic Contribution Analysis 27
Golf Facility Operations Economic Contribution Analysis 28Golf Tourism Economic Impact Analysis 28Golf-Related Businesses Contribution Analysis 29Total Economic Contribution 30
Residential Real Estate Premiums 31Water and Conservation Practices 34
Acreage 34Irrigation Water Used 34
US Geological Survey 35Arizona Department of Water Resources 38
Irrigation Methods 43Management Strategies 44Irrigation Audits 45
Contribution of the Golf Industry to the Arizona Economyiv
Turfgrass Reductions 46Efficiency Upgrade Investment Decision Making Process 46Environmental Management and Conservation Partnerships 47
Summary and Conclusions 48References 50Glossary and Acronyms 53 Appendices 54
Appendix A: Survey Instrument 54Appendix B: Survey Invitation Letter 62Appendix C: Scaling and Expansion Method 63Appendix D: Economic Contribution Analysis Methods 64Appendix E: IMPLAN Industry Assignments for Spending Patterns 65
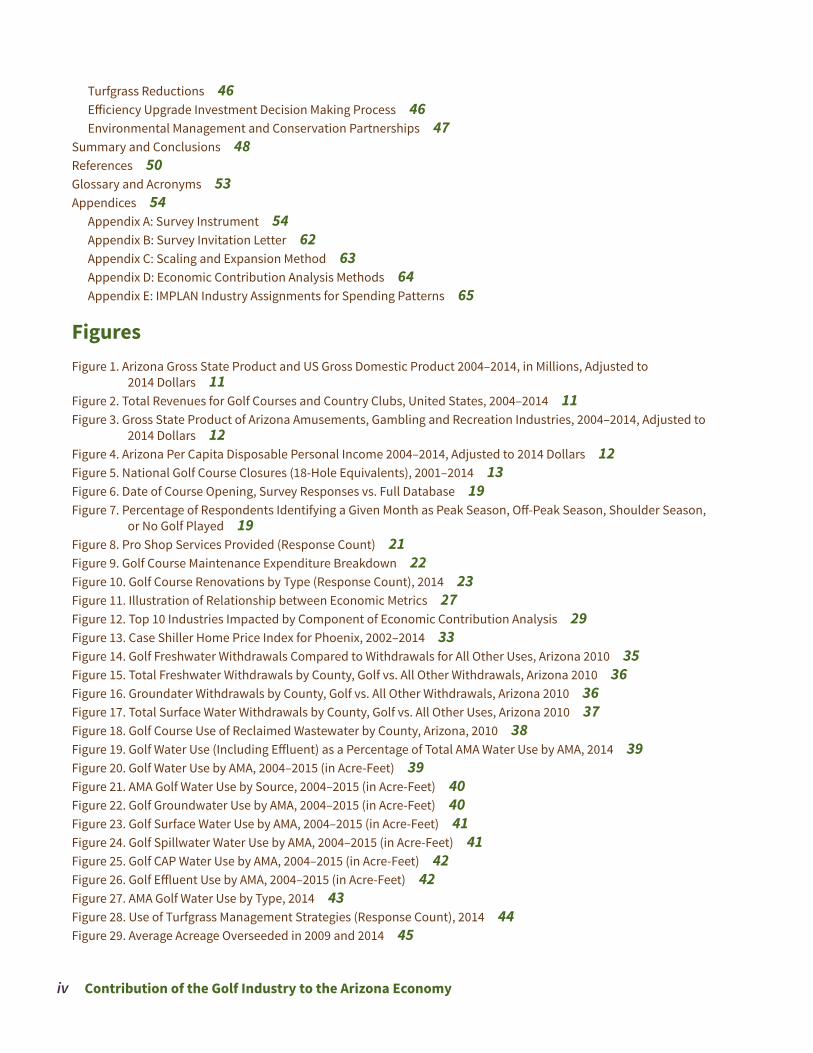
FiguresFigure 1. Arizona Gross State Product and US Gross Domestic Product 2004–2014, in Millions, Adjusted to
2014 Dollars 11Figure 2. Total Revenues for Golf Courses and Country Clubs, United States, 2004–2014 11Figure 3. Gross State Product of Arizona Amusements, Gambling and Recreation Industries, 2004–2014, Adjusted to
2014 Dollars 12Figure 4. Arizona Per Capita Disposable Personal Income 2004–2014, Adjusted to 2014 Dollars 12Figure 5. National Golf Course Closures (18-Hole Equivalents), 2001–2014 13Figure 6. Date of Course Opening, Survey Responses vs. Full Database 19Figure 7. Percentage of Respondents Identifying a Given Month as Peak Season, Off-Peak Season, Shoulder Season,
or No Golf Played 19Figure 8. Pro Shop Services Provided (Response Count) 21Figure 9. Golf Course Maintenance Expenditure Breakdown 22Figure 10. Golf Course Renovations by Type (Response Count), 2014 23Figure 11. Illustration of Relationship between Economic Metrics 27Figure 12. Top 10 Industries Impacted by Component of Economic Contribution Analysis 29Figure 13. Case Shiller Home Price Index for Phoenix, 2002–2014 33Figure 14. Golf Freshwater Withdrawals Compared to Withdrawals for All Other Uses, Arizona 2010 35Figure 15. Total Freshwater Withdrawals by County, Golf vs. All Other Withdrawals, Arizona 2010 36Figure 16. Groundater Withdrawals by County, Golf vs. All Other Withdrawals, Arizona 2010 36Figure 17. Total Surface Water Withdrawals by County, Golf vs. All Other Uses, Arizona 2010 37Figure 18. Golf Course Use of Reclaimed Wastewater by County, Arizona, 2010 38Figure 19. Golf Water Use (Including Effluent) as a Percentage of Total AMA Water Use by AMA, 2014 39Figure 20. Golf Water Use by AMA, 2004–2015 (in Acre-Feet) 39Figure 21. AMA Golf Water Use by Source, 2004–2015 (in Acre-Feet) 40Figure 22. Golf Groundwater Use by AMA, 2004–2015 (in Acre-Feet) 40Figure 23. Golf Surface Water Use by AMA, 2004–2015 (in Acre-Feet) 41Figure 24. Golf Spillwater Water Use by AMA, 2004–2015 (in Acre-Feet) 41Figure 25. Golf CAP Water Use by AMA, 2004–2015 (in Acre-Feet) 42Figure 26. Golf Effluent Use by AMA, 2004–2015 (in Acre-Feet) 42Figure 27. AMA Golf Water Use by Type, 2014 43Figure 28. Use of Turfgrass Management Strategies (Response Count), 2014 44Figure 29. Average Acreage Overseeded in 2009 and 2014 45

Contribution of the Golf Industry to the Arizona Economy v
Figure 30. Overseeding Practices (Response Count) 45Figure 31. Irrigation Audit Performed in Past 5 Years and Resulting Water Savings, 2014 45Figure 32. Turfgrass Acreage Removed Over Past 5 Years, 2014 46Figure 33. Materials Used to Replace Turfgrass (Response Count) 46Figure 34. Factors Considered in Making Efficiency Upgrade Investment Decisions (Response Count) 46Figure 35. Resources Consulted in Making Efficiency Upgrade Investment Decisions (Response Count) 47Figure 36. Facilities’ Partnerships with Conservation Organizations 47
TablesTable 1. Survey Response Rates by Role of Survey Respondent 17Table 2. Survey Responses by Number of Holes at Golf Facility and Role of Survey Respondent 17Table 3. Survey Responses by Type of Facility and Role of Survey Respondent 18Table 4. Survey Responses by Location of Facility and Role of Survey Respondent 18Table 5. Survey Responses by Area of State and Role of Survey Respondent 18Table 6. Percentage of Rounds Played in 2014 by Geographic Origin of Golfer 20Table 7. Estimate of Statewide Golf Facility Revenues by Category, 2014 20Table 8. Estimate of Statewide Golf Facility Expenses by Category, 2014 21Table 9. Estimate of Statewide Golf Facility Full- and Part-Time Employment, 2014 22Table 10. Estimate of Statewide Golf Facility Capital Investment and Amount Purchased In-State, 2014 23Table 11. Geographic Origin of Golfers in Arizona, by Percentage of Total Play, 2014 24Table 12. Golf Traveler Spending Pattern 25Table 13. Major Professional Golf Tournaments in Arizona, 2014 25Table 14. Estimate of Statewide Golf-Related Business Sales (Retailers and Service Providers), 2014 26Table 15. Economic Contribution Summary for Golf Facility Operations, 2014 28Table 16. Estimate of Statewide Golf Facility State and Local Taxes, 2014 28Table 17. Economic Contribution Summary for Golf Tourism, 2014 29Table 18. Economic Contribution Summary for Golf-Related Businesses, 2014 30Table 19. Economic Contribution Summary, Total, 2014 30Table 20. Selected Hedonic Study Estimates of Home Price Premiums for Proximity to Golf Courses 31Table 21. Estimated of Statewide Golf Facility Acreage, 2014 34Table 22. Freshwater Withdrawals for Golf Course Irrigation as a Percentage of Total County Withdrawals for All Uses,
2010 35Table 23. Number of Golf Facilities by AMA in 2014 38Table 24. Number of Facilities Using Water Source by AMA, 2014 38Table 25. Irrigation Method for Arizona Golf Facilities, 2014 (Survey Results) 43

Contribution of the Golf Industry to the Arizona Economyvi
AcknowledgmentsThis study was coordinated by Cactus & Pine GCSA, a member of the Golf Course Superintendent Association of America, with the cooperation of the Club Managers Association of America and Southwest Section PGA. Cactus & Pine GCSA would like to thank the following contributors for their support and generosity in funding the study:
Cactus & Pine, GCSA $6,000 Arizona Golf Association $5,000 CMAA $5,000 Desert Mountain Club, Inc. $5,000 Southwest Section PGA $5,000 The Thunderbirds $5,000 Troon Golf L.L.C. $5,000 Arizona Country Club $2,500 OB Sports Golf Management $2,500 The Antigua Group Inc. $2,500 The Country Club at DC Ranch $2,000 Arizona Women’s Golf Association $1,500 Blue Star Resort & Golf $1,000 Grayhawk Golf Club $1,000 The Golf Club @ Johnson Ranch $1,000 The Estancia Club $1,000 The Mirabel Club $1,000 Apache Sun Golf Club $500 Arizona NGCOA $500 Communication Links $500 Paradise Valley Country Club $500

Executive Summary
Contribution of the Golf Industry to the Arizona Economy 7
Executive SummaryWhat Is the Issue?Golf is an important part of Arizona’s economy and a defining component of the physical landscape of many of its cities and towns. Golf facilities support jobs and income for the state economy, indirectly support other Arizona busi-nesses that serve and supply the facilities, drive tourist spending by attracting visitors from outside the state, and support sales by retailers offering golf equipment and merchandise to Arizona golfers. Additionally, golf facilities exert a positive effect on the value of residential real estate in their proximity. Meanwhile, golf courses require inputs year-round to maintain playable and attractive conditions for golfers on the facility’s turfgrass and other landscape surfaces. Major inputs include irrigation water, fertilizer, and other agricul-tural chemicals. Conservation efforts at golf facilities aim to balance the use of natural resources with the economic viability of the courses.
This study provides an estimate of the economic contribution of the golf industry to Arizona’s economy in 2014, examining the following components:• Golf facility operations (operations spending, jobs, and other contribu-
tions)• Golf-related tourist spending• Golf-related business revenues
This report uses a variety of metrics to describe the golf industry’s con-tribution to the Arizona economy. These include sales (output), value added (GDP), labor income (employee compensation and proprietor income), jobs, and state and local taxes. It’s important to note that many of these economic metrics are interconnected and, therefore, cannot be added together. Fur-thermore, while sales (output) is an easily-interpreted measure of economic activity, value added (also known as gross state product) is the best reflection of an industry’s contribution to the state economy.
The contribution of the golf industry to Arizona’s economy goes beyond the direct effects of facility revenues, tourist spending, and golf-related business sales. The businesses providing those goods and services also require inputs of goods and services in order to operate, many of which are supplied by in-state suppliers. Those local businesses in turn require their own production inputs. These rounds of business-to-business transactions of providing inputs are known as indirect effects. Additionally, incomes (wages, salaries, and profits) generated for individuals employed directly by the golf industry are used to pur-chase household needs, such as rent or mortgages, doctor visits, and groceries. This spending produces rounds of household-to-business transactions, known as induced effects. Because of these indirect and induced multiplier effects, the economic contribution of the golf industry in Arizona is considerably greater than indicated by direct sales and tourist spending.
Other effects of the golf industry are not best measured using regional economic contribution analysis. These effects include the influence of golf courses on residential real estate values and natural resource use and con-servation. The study provides an update to a 2004 estimate of residential real estate premiums attributable to frontage on and proximity to golf courses, and provides a snapshot of golf water use and conservation and management practices at Arizona golf facilities in 2014.
What Did the Study Find?Arizona’s golf industry had a total estimated economic contribution of $3.9 billion in sales (output) to the state economy in 2014. This includes the direct,

Executive Summary
8 Contribution of the Golf Industry to the Arizona Economy
indirect, and induced effects of golf course operations ($2.5 billion), golf tour-ism ($1.1 billion), and golf-related businesses ($347 million).
Economic Contribution• Golf facility operations generated a direct contribution of $1.1 billion
in sales to the state economy in 2014, directly supporting an estimated 18,695 full- and part-time jobs. Including multiplier effects, the total contribution was $2.5 billion in sales, $1.4 billion in value added (gross state product), and approximately 29,500 full- and part-time jobs. An estimated $72 million in state and local taxes was directly supported, including $39 million in direct state and local sales tax revenues. An esti-mated 11.6 million rounds of golf were played in Arizona in 2014.
• Golf tourism, both golf travelers and golf spectators, attracted an esti-mated $598 million in spending from out-of-state visitors in 2014, for a total estimated impact of $1.1 billion in sales and approximately 10,500 jobs. Direct sales tax impacts were estimated at $32 million in 2014. Roughly a third of rounds played in Arizona in 2014 were by out-of-state and out-of-country visitors.
• Golf-related businesses, such as equipment and apparel retailers, practice ranges, and golf cart dealers, had estimated annual sales of $270 million, for a total estimated contribution of $347 million in sales, approximately 1,800 jobs, and directly-supported sales tax revenues of $6.5 million.
Residential Real Estate Premiums• Hedonic studies have shown that frontage on and proximity to golf
courses is associated with a sales price premium for residential real estate.
• Residential real estate premiums associated with all homes ever built in golf course communities in Arizona were estimated to be nearly $2.1 billion.
Water Use• Survey Results• Statewide use—According to survey results, Arizona golf facilities
used an estimated 167,397 acre-feet (AF) of irrigation water in 2014, occupying a total of 45,000 acres for the golf courses, of which 32,000 acres was turfgrass.
• Use of effluent—Statewide, according to survey results from this study, an estimated 35% of golf water use was effluent in 2014. This percent-age from the survey is somewhat higher than estimates from water resource agencies (see below).
• USGS Statewide Data (2010)• Statewide use—In 2010, 130,116 AF of self-supplied freshwater was
used to irrigate golf courses, accounting for 1.9% of Arizona’s total freshwater withdrawals. This figure includes groundwater and surface water, but excludes effluent.
• Use of effluent—Statewide, 49,488 AF of reclaimed wastewater was used for golf course irrigation in 2010, accounting for 28% of golf ’s total statewide water use.
• Share of statewide use by source—In 2010, golf irrigation accounted for 3% of state groundwater withdrawals and 1.1% of state surface wa-ter withdrawals, but 34% of state reclaimed water use for irrigation.

Executive Summary
Contribution of the Golf Industry to the Arizona Economy 9
• ADWR Active Management Area (AMA) Data• Share of statewide AMA use—According to Arizona Department of
Water Resources (ADWR) data, golf water use represented 3.5% of total AMA water use in Arizona in 2014.
• Breakdown of golf AMA use by source—In 2014, groundwater repre-sented 48.1% of AMA golf water use, surface water, 10.9%, CAP, 14.6%, and effluent, 26.3%. Whereas some AMAs rely on a varied mix of wa-ter sources, others rely heavily on one or two sources, such as effluent or groundwater.
• Use of effluent—Use of effluent by golf facilities in AMAs was 33,977 AF in 2014, an increase of 27% since 2004.
• 10-year trend—Between 2004 and 2014, ADWR reported a net increase of 24,736 AF of golf facility water use in Arizona’s AMAs, with all types of water use increasing. During that time, the number of facilities in Arizona’s AMAs also increased, from 239 facilities to 252 facilities.
Conservation Practices• 51% of respondents reported performing irrigation audits for their golf
course irrigation systems, and among respondents conducting irrigation audits, 95% made adjustments to their irrigation systems, for an average irrigation water savings of 19.5 AF of water per facility per year.
• 31% of respondents reported having removed turfgrass in the past 5 years. Another 39% reported having a partnership with conservation organizations, the most common of which was Audubon International.
How was the study conducted?This study relies on the results of a statewide survey of golf facilities per-formed between April and August of 2016. In order to capture all compo-nents of golf facility operations, the survey was directed at three key staff positions at each facility: General Manager/Director of Club Operations, Head Golf Professional/Director of Golf, and Golf Course Superintendent/Director of Agronomy. The survey response rate was 44% for General Man-agers, 26% for Golf Professionals, and 45% for Superintendents. With some unusable responses having been submitted, the useable response rate was 42% for General Managers, 25% for Golf Professionals, and 39% for Superin-tendents. Unbiased estimates were calculated from the survey response data using scaling and an expansion factor. Survey data were complemented with secondary data on golf business establishments, golf tourism, real estate, and golf water use from a variety of sources. The economic multiplier effects of the golf industry were estimated using IMPLAN 3.1, the premier input-out-put model used for regional economic impact analysis.
Introduction
10 Contribution of the Golf Industry to the Arizona Economy
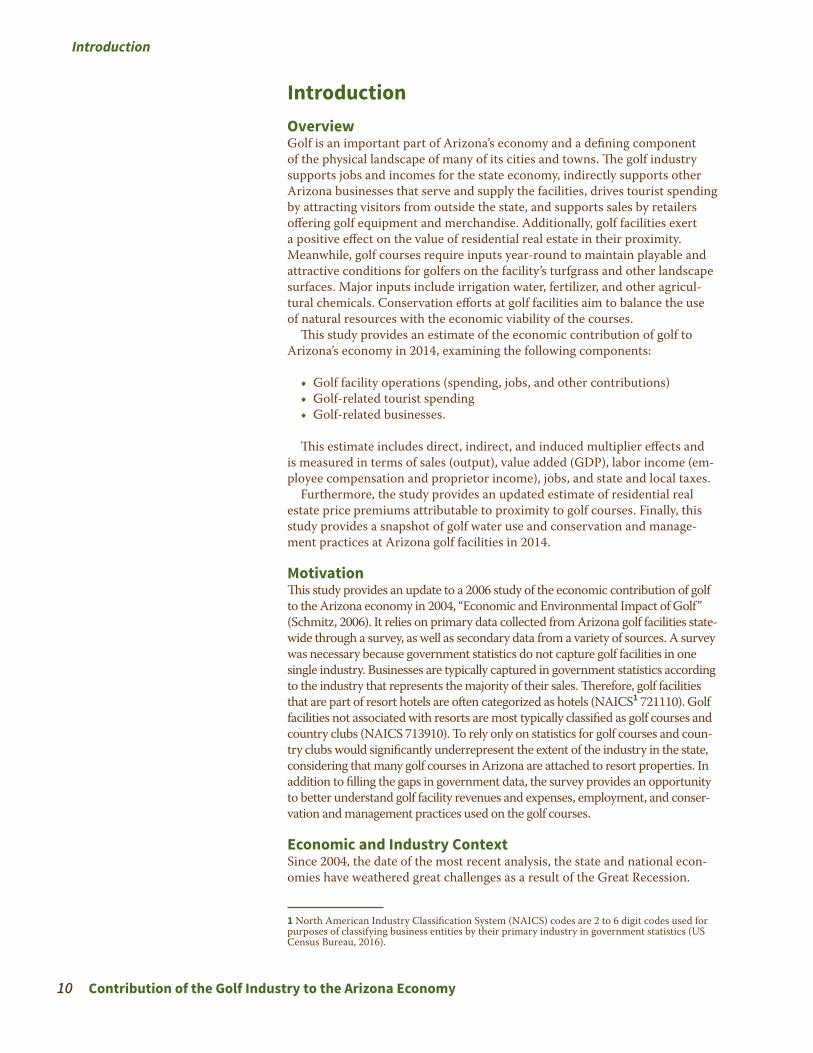
IntroductionOverviewGolf is an important part of Arizona’s economy and a defining component of the physical landscape of many of its cities and towns. The golf industry supports jobs and incomes for the state economy, indirectly supports other Arizona businesses that serve and supply the facilities, drives tourist spending by attracting visitors from outside the state, and supports sales by retailers offering golf equipment and merchandise. Additionally, golf facilities exert a positive effect on the value of residential real estate in their proximity. Meanwhile, golf courses require inputs year-round to maintain playable and attractive conditions for golfers on the facility’s turfgrass and other landscape surfaces. Major inputs include irrigation water, fertilizer, and other agricul-tural chemicals. Conservation efforts at golf facilities aim to balance the use of natural resources with the economic viability of the courses.
This study provides an estimate of the economic contribution of golf to Arizona’s economy in 2014, examining the following components:
• Golf facility operations (spending, jobs, and other contributions)• Golf-related tourist spending• Golf-related businesses.
This estimate includes direct, indirect, and induced multiplier effects and is measured in terms of sales (output), value added (GDP), labor income (em-ployee compensation and proprietor income), jobs, and state and local taxes.
Furthermore, the study provides an updated estimate of residential real estate price premiums attributable to proximity to golf courses. Finally, this study provides a snapshot of golf water use and conservation and manage-ment practices at Arizona golf facilities in 2014.
MotivationThis study provides an update to a 2006 study of the economic contribution of golf to the Arizona economy in 2004, “Economic and Environmental Impact of Golf” (Schmitz, 2006). It relies on primary data collected from Arizona golf facilities state-wide through a survey, as well as secondary data from a variety of sources. A survey was necessary because government statistics do not capture golf facilities in one single industry. Businesses are typically captured in government statistics according to the industry that represents the majority of their sales. Therefore, golf facilities that are part of resort hotels are often categorized as hotels (NAICS1 721110). Golf facilities not associated with resorts are most typically classified as golf courses and country clubs (NAICS 713910). To rely only on statistics for golf courses and coun-try clubs would significantly underrepresent the extent of the industry in the state, considering that many golf courses in Arizona are attached to resort properties. In addition to filling the gaps in government data, the survey provides an opportunity to better understand golf facility revenues and expenses, employment, and conser-vation and management practices used on the golf courses.
Economic and Industry ContextSince 2004, the date of the most recent analysis, the state and national econ-omies have weathered great challenges as a result of the Great Recession.
1 North American Industry Classification System (NAICS) codes are 2 to 6 digit codes used for purposes of classifying business entities by their primary industry in government statistics (US Census Bureau, 2016).

Introduction
Contribution of the Golf Industry to the Arizona Economy 11
Arizona was hit especially hard by the downturn, and golf, an activity linked closely with both disposable personal income as well as real estate, suffered heavily as a result. The state and national economies both experienced signif-icant contractions between 2008 and 2009, as evidenced by gross domestic product and gross state product (Figure 1).
$0$2,000,000$4,000,000$6,000,000$8,000,000
$10,000,000$12,000,000$14,000,000$16,000,000$18,000,000$20,000,000
Natio
nal G
DP—
Mill
ions
201
4 US
D
2004 2005 2006 2007 2008 2009 2010 2011 2012 2013 2014
National Arizona
$0
$50,000
$100,000
$150,000
$200,000
$250,000
$300,000
Ariz
ona
GDP—
Mill
ions
201
4 US
D
Figure 1. Arizona Gross State Product and US Gross Domestic Product 2004–2014, in Millions, Adjusted to 2014 Dollars
Source: Bureau of Economic Analysis, Bureau of Labor Statistics
2004 2005 2006 2007 2008 2009 2010 2011 2012 2013 201417,000
17,500
18,000
18,500
19,000
19,500
20,000
20,500
21,000
21,500
22,000
MIll
ions
of D
olla
rs
Total Revenue for Golf Courses and Country Clubs, All Establishments, Employer Firms* Brown bar denotes period of economic recession.
Figure 2. Total Revenues for Golf Courses and Country Clubs, United States, 2004–2014
Source: US Census Bureau
At the national level, golf courses and country clubs saw a significant de-cline in revenues between 2007 and 2010 (Figure 2).
Amusements, gambling, and recreation industries’ direct contribution to Arizona’s gross state product, which includes golf courses and country clubs,

Introduction
12 Contribution of the Golf Industry to the Arizona Economy
experienced a considerable slump starting in 2007, but has since resumed growth since 2011 (Figure 3).
The economic downturn’s effect on households in Arizona is evidenced by trends in per capita disposable income (Figure 4). After increasing to a sharp peak in 2007, Arizona per capita disposable personal income declined, bot-toming out in 2011, and has gradually increased since that time.
In recent years, the national supply of golf courses has been decreasing in what is considered a market correction after significant increases in golf course construction during the 1990s (Hueber & Worzala, 2010). Golf course closures in the U.S. began to increase in the early 2000s and have averaged
$800
$900
$1,000
$1,100
$1,200
$1,300
$1,400
2004 2005 2006 2007 2008 2009 2010 2011 2012 2013 2014
Gros
s Sta
te P
rodu
ct (M
illio
n, 2
014
USD)
Figure 3. Gross State Product of Arizona Amusements, Gambling and Recreation Industries, 2004–2014, Adjusted to 2014 Dollars
Source: Bureau of Economic Analysis; Bureau of Labor Statistics
$31,500
$32,000
$32,500
$33,000
$33,500
$34,000
$34,500
$35,000
$35,500
$36,000
$36,500
$37,000
2004 2005 2006 2007 2008 2009 2010 2011 2012 2013 2014Per C
apita
Dis
posa
ble
Pers
onal
Inco
me
(201
4 Do
llars
)
Figure 4. Arizona Per Capita Disposable Personal Income 2004–2014, Adjusted to 2014 Dollars
Source: Bureau of Economic Analysis, Bureau of Labor Statistics

Introduction
Contribution of the Golf Industry to the Arizona Economy 13
0
20
40
60
80
100
120
140
160
180
200
2001 2002 2003 2004 2005 2006 2007 2008 2009 2010 2011 2012 2013 2014
Golf
Cour
se C
losu
res (
18-H
ole
Equi
vale
nts)
Figure 5. National Golf Course Closures (18-Hole Equivalents), 2001–2014
Source: National Golf Foundation
140 closures per year between 2006 and 2014 (Figure 5). This, coupled with relatively low levels of new construction since that time, have led to a net re-duction in the number of 18-hole equivalent courses in the U.S. The National Golf Foundation projects golf course openings in the U.S. to average 20 or fewer annually in the near future (NGF, 2013).
In Arizona, a similar trend has emerged with 17 facilities closing during that same period. Yet, an estimated 19 new golf facilities have opened be-tween 2004 and 2014, resulting in a net increase of two facilities. This is not including facilities that have undergone significant renovations, closed and reopened, or transferred ownership since that time. Another important trend includes the privatization of public municipal courses. In recent years, such courses have struggled to remain financially solvent, prompting municipal-ities to sell to or partner with third-party management companies (Keegan, 2010). This trend has affected municipal courses in Arizona.
Methods and Data
14 Contribution of the Golf Industry to the Arizona Economy
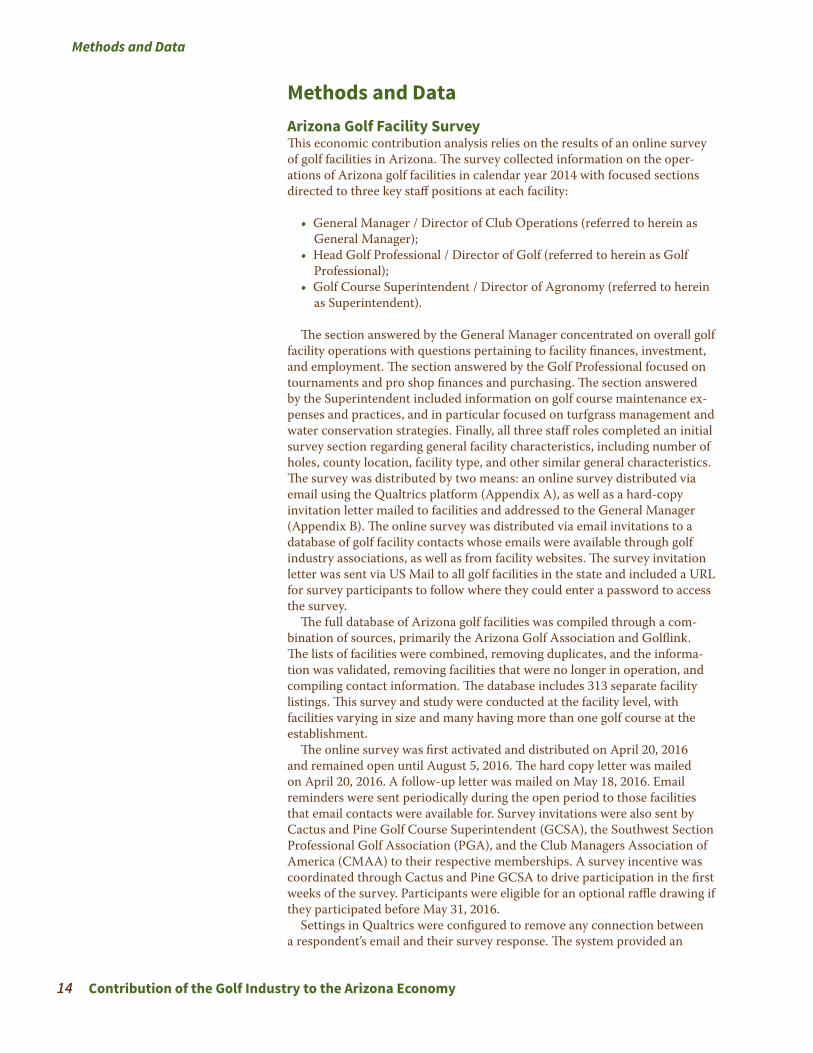
Methods and DataArizona Golf Facility SurveyThis economic contribution analysis relies on the results of an online survey of golf facilities in Arizona. The survey collected information on the oper-ations of Arizona golf facilities in calendar year 2014 with focused sections directed to three key staff positions at each facility:
• General Manager / Director of Club Operations (referred to herein as General Manager);
• Head Golf Professional / Director of Golf (referred to herein as Golf Professional);
• Golf Course Superintendent / Director of Agronomy (referred to herein as Superintendent).
The section answered by the General Manager concentrated on overall golf facility operations with questions pertaining to facility finances, investment, and employment. The section answered by the Golf Professional focused on tournaments and pro shop finances and purchasing. The section answered by the Superintendent included information on golf course maintenance ex-penses and practices, and in particular focused on turfgrass management and water conservation strategies. Finally, all three staff roles completed an initial survey section regarding general facility characteristics, including number of holes, county location, facility type, and other similar general characteristics.The survey was distributed by two means: an online survey distributed via email using the Qualtrics platform (Appendix A), as well as a hard-copy invitation letter mailed to facilities and addressed to the General Manager (Appendix B). The online survey was distributed via email invitations to a database of golf facility contacts whose emails were available through golf industry associations, as well as from facility websites. The survey invitation letter was sent via US Mail to all golf facilities in the state and included a URL for survey participants to follow where they could enter a password to access the survey.
The full database of Arizona golf facilities was compiled through a com-bination of sources, primarily the Arizona Golf Association and Golflink. The lists of facilities were combined, removing duplicates, and the informa-tion was validated, removing facilities that were no longer in operation, and compiling contact information. The database includes 313 separate facility listings. This survey and study were conducted at the facility level, with facilities varying in size and many having more than one golf course at the establishment.
The online survey was first activated and distributed on April 20, 2016 and remained open until August 5, 2016. The hard copy letter was mailed on April 20, 2016. A follow-up letter was mailed on May 18, 2016. Email reminders were sent periodically during the open period to those facilities that email contacts were available for. Survey invitations were also sent by Cactus and Pine Golf Course Superintendent (GCSA), the Southwest Section Professional Golf Association (PGA), and the Club Managers Association of America (CMAA) to their respective memberships. A survey incentive was coordinated through Cactus and Pine GCSA to drive participation in the first weeks of the survey. Participants were eligible for an optional raffle drawing if they participated before May 31, 2016.
Settings in Qualtrics were configured to remove any connection between a respondent’s email and their survey response. The system provided an

Methods and Data
Contribution of the Golf Industry to the Arizona Economy 15
anonymized unique identifier for each response. Similarly, the optional raffle was a separate survey with no connection to golf facility survey responses and raffle responses to preserve the anonymity of responses. The survey was reviewed by the University of Arizona’s Human Subjects Protection Program and was determined not to constitute human research. Best practices were followed with regards to survey design, allowing respondents to opt out of any question, either by including questions where no response was required, or by including the option of “I prefer not to respond.” After the survey closed, anonymized results data were downloaded and analyzed according to methods described in subsequent sections.
Statistical Methodology and Expansion FactorThe golf survey was divided into four sections. The first section asked all respondents to provide general characteristics of their facility. The other three sections were directed towards each role at the facility. The survey presented a combination of qualitative and quantitative responses.
Questions that presented yes-no options or asked respondents to select among multiple options were analyzed using a simple count method. These are questions where the response is not a number and therefore should not vary depending upon the size of the facility.
For those questions where respondents were asked to provide a number (revenues, rounds of golf, etc.), a scaling and expansion method was used to obtain an unbiased estimate of statewide values based on the survey sample, assuming that numerical responses (revenues, costs, acreage, etc.) are propor-tional to the size of the facility in terms of number of holes. For a full descrip-tion of the scaling and expansion method, please consult Appendix C.
Golf-Related TourismData from the survey regarding the percent of annual rounds played by geo-graphic origin on the golfer were coupled with golf tourist expenditure and travel behavior data from two separate research reports to account for the contribution of golf tourists, as well as professional golf tournament specta-tors to the state economy.
Golf-Related BusinessesThe golf-related businesses section of this study relies on a variety of second-ary data sources, including ReferenceUSA, MelissaData, and Census Industry Snapshots. These data are used to produce an establishment count, as well as an estimate of annual revenues for those golf-related businesses whose eco-nomic activity is not captured through the survey response.
Economic Contribution AnalysisIntegrating results from previous sections, the indirect and induced multiplier effects of golf facility operations, golf-related tourism, and golf-related busi-nesses, were calculated using the IMPLAN 3.1 model and software in order to obtain a total economic contribution estimate. IMPLAN is an input-output model that captures the linkages between economic sectors through local buyer-supplier relationships, whereby purchases of goods and services from local providers across the supply chain create additional rounds of transac-tions in the economy, supporting additional sales, incomes, and jobs. Both business-to-business (indirect effects) as well as business-to-household (in-duced effects) transactions were captured using this model.

Methods and Data
16 Contribution of the Golf Industry to the Arizona Economy
Residential Real Estate PremiumsFor the current study, Schmitz’s 2006 estimates of the total statewide resi-dential real estate premiums attributable to frontage on or proximity to golf courses were updated. Schmitz estimated per-community residential real es-tate premiums for golf course communities, applying the estimated per-com-munity premium to the total estimated number of golf course communities in the state. The estimate was updated by calculating a premium proportional to the underlying value of the home versus a fixed value per house, and ac-counting for underlying real estate value fluctuations between 2004 and 2014 using data from the Case Schiller Home Price Index for Phoenix. Finally, the estimate was adjusted to account for changes in the number of golf course communities in the state since the previous study.
Golf Environmental AnalysisThis final section of this study focuses on golf facility irrigation water use and conservation practices, relying on both primary and secondary data. Survey results were used to derive statewide estimates of water use, turfgrass man-agement practices, and conservation activities. That information was sup-plemented with US Geological Survey (USGS) and Arizona Department of Water Resources (ADWR) data for a higher level picture of golf water use in Arizona.
Arizona Golf Facilities
Contribution of the Golf Industry to the Arizona Economy 17
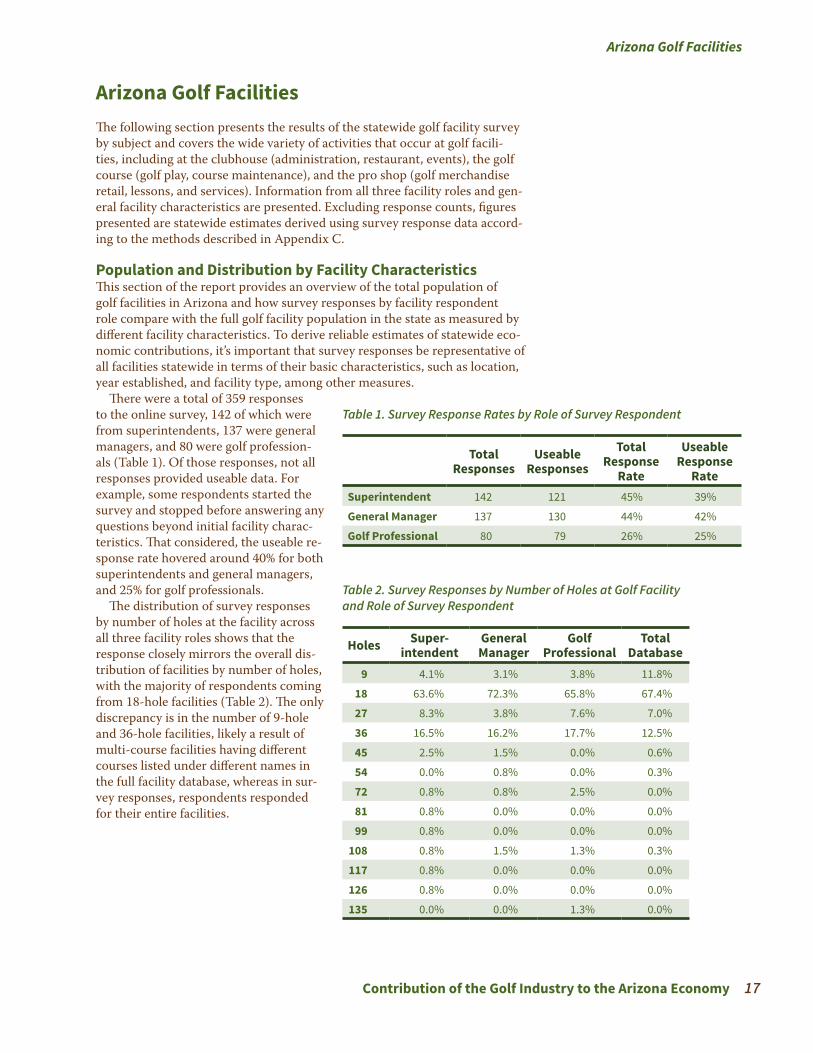
Arizona Golf FacilitiesThe following section presents the results of the statewide golf facility survey by subject and covers the wide variety of activities that occur at golf facili-ties, including at the clubhouse (administration, restaurant, events), the golf course (golf play, course maintenance), and the pro shop (golf merchandise retail, lessons, and services). Information from all three facility roles and gen-eral facility characteristics are presented. Excluding response counts, figures presented are statewide estimates derived using survey response data accord-ing to the methods described in Appendix C.
Table 1. Survey Response Rates by Role of Survey Respondent
Total Responses
Useable Responses
Total Response
Rate
Useable Response
RateSuperintendent 142 121 45% 39%
General Manager 137 130 44% 42%
Golf Professional 80 79 26% 25%
Table 2. Survey Responses by Number of Holes at Golf Facility and Role of Survey Respondent
Holes Super- intendent
General Manager
Golf Professional
Total Database
9 4.1% 3.1% 3.8% 11.8%
18 63.6% 72.3% 65.8% 67.4%
27 8.3% 3.8% 7.6% 7.0%
36 16.5% 16.2% 17.7% 12.5%
45 2.5% 1.5% 0.0% 0.6%
54 0.0% 0.8% 0.0% 0.3%
72 0.8% 0.8% 2.5% 0.0%
81 0.8% 0.0% 0.0% 0.0%
99 0.8% 0.0% 0.0% 0.0%
108 0.8% 1.5% 1.3% 0.3%
117 0.8% 0.0% 0.0% 0.0%
126 0.8% 0.0% 0.0% 0.0%
135 0.0% 0.0% 1.3% 0.0%
Population and Distribution by Facility CharacteristicsThis section of the report provides an overview of the total population of golf facilities in Arizona and how survey responses by facility respondent role compare with the full golf facility population in the state as measured by different facility characteristics. To derive reliable estimates of statewide eco-nomic contributions, it’s important that survey responses be representative of all facilities statewide in terms of their basic characteristics, such as location, year established, and facility type, among other measures.
There were a total of 359 responses to the online survey, 142 of which were from superintendents, 137 were general managers, and 80 were golf profession-als (Table 1). Of those responses, not all responses provided useable data. For example, some respondents started the survey and stopped before answering any questions beyond initial facility charac-teristics. That considered, the useable re-sponse rate hovered around 40% for both superintendents and general managers, and 25% for golf professionals.
The distribution of survey responses by number of holes at the facility across all three facility roles shows that the response closely mirrors the overall dis-tribution of facilities by number of holes, with the majority of respondents coming from 18-hole facilities (Table 2). The only discrepancy is in the number of 9-hole and 36-hole facilities, likely a result of multi-course facilities having different courses listed under different names in the full facility database, whereas in sur-vey responses, respondents responded for their entire facilities.

Arizona Golf Facilities
18 Contribution of the Golf Industry to the Arizona Economy
Similarly, response by role according to the type of golf facility reflects the general golf facility population with the highest proportion of facilities being public, followed by private, and then semi-private (Table 3).
Most facilities were located in either residen-tial real estate developments or in resorts (Table 4). Columns may not sum to 100% as facilities can be located in more than one type of location, or in none. A comparison with the full course population is not provided because the location definitions in the database differ from those op-tions provided in the survey.
Survey response by geographic location of the
Location Super- intendent
General Manager
Golf Professional
A residential real estate development (including retirement communities or any housing development)
68.6% 66.2% 58.2%
A resort 13.2% 6.2% 12.7%
A park or recreation area (municipal, county, etc.) 5.0% 6.2% 5.1%
A military installation 1.7% 1.5% 1.3%
Tribal land 5.0% 1.5% 6.3%
Other 9.1% 10.0% 12.7%
Table 4. Survey Responses by Location of Facility and Role of Survey Respondent
Table 3. Survey Responses by Type of Facility and Role of Survey Respondent
Type Superintendent General Manager Golf Professional Total DatabasePublic 48.8% 47.7% 50.6% 61.3%
Semi-private 24.0% 17.7% 17.7% 15.3%
Private 27.3% 33.1% 30.4% 23.3%
Other 0.0% 1.5% 1.3% 0.0%
Area Super- intendent
General Manager
Golf Professional
Total Database
Phoenix and Central
69% 67% 66% 63%
Tucson and Southern
12% 16% 19% 17%
Northern 13% 12% 13% 12%
Western 5% 5% 3% 8%
Table 5. Survey Responses by Area of State and Role of Survey Respondent
facility also closely resembles the full facility population in the state (Table 5). Roughly two-thirds of golf facilities are located in the metro Phoenix area, a little less than a fifth are located in Tucson and Southern Arizona, and the remaining fifth are located in Northern and Western Arizona.
In regard to the year that the golf facility was first established, survey re-sponses closely resemble the pattern observed in the full database of facilities in the state. As can be seen in Figure 6, most facilities were first established between the mid-1980s and the mid-2000s. Since 2004, it is estimated that 17 golf facilities have closed and 19 new golf facilities have opened in Arizona, resulting in a net increase of 2 facilities.

Arizona Golf Facilities
Contribution of the Golf Industry to the Arizona Economy 19
Golf PlayAn estimated 11,573,579 rounds of golf were played in Arizona in 2014.2 Of total rounds, 7,678,120 were rounds played by members of private or semi-private facilities. 60.8% of total rounds were played during peak season, 19.6% during off-peak season, and 19.6% during shoulder seasons.Respondents were asked to indicate the months corresponding to peak sea-son, off-peak season, shoulder seasons, and times when no golf was played at their facilities. A clear trend emerges, showing peak season beginning around November and peaking in March (Figure 7). Off-season begins in June and ends by October. Shoulder seasons were clustered around May and Octo-ber. Months when no golf was played were spaced fairly consistently across
01020304050607080
0
10
20
30
40
50
60
70
1900–1909
1950–1959
1960–1969
1970–1979
2000–2009
2010–2014
Cour
ses b
y Ye
ar O
pene
d
Resp
onse
s by
Year
Ope
ned
Database Golf Course Superintendent General Manager Head Golf Professional
1910–1919
1920–1929
1930–1939
1940–1949
1980–1989
1990–1999
Figure 6. Date of Course Opening, Survey Responses vs. Full Database
Figure 7. Percentage of Respondents Identifying a Given Month as Peak Season, Off-Peak Season, Shoulder Season, or No Golf Played
0%10%20%30%40%50%60%70%80%90%
100%
Jan Feb Mar Apr May Jun Jul Aug Sep Oct Nov Dec
Perc
enta
ge o
f Res
pons
es
Peak O�-Peak Shoulder No Golf
2 This estimate was corroborated using independent estimates of number of rounds played and matches closely with national estimates of average rounds per 18-hole equivalent course (Reit-man, 2014) and numbers published by the Arizona Office of Tourism (2013).

Arizona Golf Facilities
20 Contribution of the Golf Industry to the Arizona Economy
the year. Statewide seasonal trends are reflective of the concentration of courses in Phoenix and Central Arizona where winter months are peak season and summer months are off-peak season. For example, 79% of respondents consider August as off-peak season, 9% consider it peak season, 7% consider it as shoulder season, and 4% report no golf being played during the month of August.
Survey respondents were also asked to provide a breakdown of the geographic origin of golfers in terms
Source: Authors’ estimates from survey
Table 6. Percentage of Rounds Played in 2014 by Geographic Origin of Golfer
From Arizona (including seasonal
residents)US Visitors from Outside Arizona
International Visitors
67.7% 24.3% 8.0%
Table 7. Estimate of Statewide Golf Facility Revenues by Category, 2014
Source: Authors’ estimates from survey
Revenue Category Statewide EstimateInitiation fees, annual membership fees and golf course dues $386,325,091
Golf course green fees $337,693,953
Restaurant, food and beverage services (golf facility only) $201,517,614
Retail sales (golf shop, gift shop) $86,805,260
Golf cart fees $38,872,021
Flat fees paid for tournament events $17,529,592
Driving range fees $17,254,931
Flat fees for non-tournament private events (weddings, etc.) $10,768,954
Private lessons given by facility personnel $8,062,260
Flat fees for lessons given by third parties $753,849
Other $41,783,270
TOTAL $1,147,366,795
of the percent of total play. Results indicate that roughly two-thirds of rounds are played by Arizona golfers, including seasonal residents. Roughly a quarter are played by visitors from other states, and the remainder (8%) are played by international visitors (Table 6).
Facility RevenuesRespondents were asked to provide a breakdown of facility revenue by cate-gory. This was done in one of two methods—either providing exact values by category or by providing a range of total revenues and a percentage break-down by category. In the case that a range and percentages were provided, those percentages were applied to the range midpoint to yield estimated category values and were folded into the overall weighted average estimate. Total Arizona golf facility revenues were estimated to be $1.1 billion in 2014 (Table 7).
While most golf facility revenue is generated by golf play, a significant amount of golf revenue is generated through golf pro shops. Golf pro shops are located at golf facilities, are staffed by golf professionals, and provide a variety of services and goods to golfers, including lessons, sales of hard and soft goods, and cart and equipment rental. About 88% of responding golf pro-fessionals indicated they are directly employed by the golf facility, 5% own and operate the pro shop on behalf of the facility, and another 5% work for a third-party management company. Of pro shop services provided, the most com-mon responses (with 76 in all) were equipment and apparel sales and equip-

Arizona Golf Facilities
Contribution of the Golf Industry to the Arizona Economy 21
Figure 8. Pro Shop Services Provided (Response Count)
0 10 20 30 40 50 60 70 80
Equipment andApparel Sales
Equipment Rental
Equipment Repair
Lessons
Locker Rental
Pro
Shop
Ser
vice
s
ment rental. Based on survey responses, 17% of golf pro shop merchandise was purchased from in-state manufacturers of golf equipment and goods, such as Ping and AM&E. The second most common response was providing lessons (74 respondents). In fact, in 2014, golf professionals provided an estimated 150,545 half-hour lessons statewide, generating an estimated $8 million in revenue for Arizona golf facilities. Less common responses were equip-ment repair (57 respondents) and locker rental (32 respon-dents) (Figure 8).
Table 8. Estimate of Statewide Golf Facility Expenses by Category, 2014
Source: Authors’ estimates from survey
Expense Category Statewide EstimateClubhouse payroll (employees whose work is based in the clubhouse or golf shop, including fringe benefits)
$200,165,974
Golf course maintenance payroll $155,658,825
Utilities (water, electric, gas, etc.) $95,841,042
Golf course maintenance supplies and services $94,628,735
General administrative expenses (excluding utilities, payroll, and advertising)
$82,826,999
Cost of food and beverage $76,510,958
Golf shop merchandise $48,981,076
Lease expenses (both operating and capital) $27,063,231
Payments on debt $16,207,130
Advertising / Marketing / Promotion $13,704,628
Facility insurance $12,786,030
Cash contributions to charities $1,196,438
Other expenses $54,198,163
TOTAL $879,769,229
Facility ExpensesSimilar to revenues, respondents were asked to provide estimates of facility expenses by category, either providing exact values by category or by pro-viding a total expense range and percentage breakdown by category (Table 8). Once again, in the case of a range and percentages, the percentages were applied to the midpoint of the expense range provided. Total Arizona golf facility expenses were estimated to be $880 million in 2014 (Table 8). This implies that net of operating expenses, golf facilities retained an estimated $268 million in profits in 2014.

Arizona Golf Facilities
22 Contribution of the Golf Industry to the Arizona Economy
Employment Full-Time Part-Time Total % of TotalCourse Maintenance
5,016 555 5,571 29.8%
Golf Shop 1,783 2,810 4,593 24.6%
Food and Beverage
2,324 3,115 5,439 29.1%
Administra-tive
835 207 1,042 5.6%
Other 1,076 973 2,050 11.0%
TOTAL 11,035 7,660 18,695
Table 9. Estimate of Statewide Golf Facility Full- and Part-Time Employment, 2014
Source: Authors’ estimates from survey
As would be expected, payroll is the primary expense for golf facilities. Approximately 40% of total golf facility expenses are dedicated to clubhouse and golf course mainte-nance payroll (Table 8). Other major expenses are related to maintaining the courses.
Golf course maintenance staff works year round to maintain playable and attractive conditions on golf courses in Arizona. This requires a variety of in-puts. Survey responses by superintendents suggest that spending on golf course maintenance is dominated by spending on payroll, which represented roughly half of all maintenance expenditures. The second highest expense category is irrigation water at roughly 13%, followed by chemicals (fertilizers, herbicides, and pesticides) at 5.3% of expenditures (Figure 9).
Figure 9. Golf Course Maintenance Expenditure Breakdown
Chemicals5.3%
Irrigationwater12.7%
Lease expenses(Both operating
and capital)3.8%
Purchase ofcapital equipment(tractors, mowers,
aerifiers, etc.)2.4%
Utilities:electric4.6%
Fuel: dieseland gasoline
3.3%
Other maintenancesupplies and expenses
11.7%
Plant material0.4%
Seed4.1%
Sand and soil1.4%
Maintenance payroll(including all fringe benefits
paid by the facility)50.3%
Facility EmploymentAn estimated 18,700 full-time and part-time jobs were directly linked to golf facilities in 2014 (Table 9). Total jobs were fairly evenly split between course maintenance, pro shop, and food and beverage service. Administrative and other jobs accounted for the smallest portion of total direct jobs.

Arizona Golf Facilities
Contribution of the Golf Industry to the Arizona Economy 23
Table 10. Estimate of Statewide Golf Facility Capital Investment and Amount Purchased In-State, 2014
Source: Authors’ estimates from survey
Total Purchased in AZFurniture $17,812,758 $10,465,807
Equipment $30,856,655 $18,273,506
Buildings $36,511,494 $32,014,841
Other $2,227,001 $2,102,121
Golf Course $86,823,095 $37,791,883
TOTAL $174,231,003 $100,648,158
Capital Investment and RenovationsGolf facility capital investment occurs on an annual basis in order to maintain buildings, equipment, furnishings, and golf courses. Survey respondents were asked to provide a breakdown of capital investments by category as well as the portion of the investment that was spent in-state. Based upon those responses, Arizona golf facilities spent an estimated $174 million on capital investment in 2014, of which $101 million was spent in Arizona (Table 10).
This investment in assets such as buildings, furnishings, and equipment adds to the overall value of assets owned by golf facili-ties, expanding the state and local tax base. As of December 2014, the assessed value of total owned assets of Arizona golf facilities was an estimated $3.7 billion.
In addition to annual capital investments in 2014, a review of publically available documents and news articles suggests that there were several Arizona golf facilities that underwent significant reno-vations in 2014. Facilities were reported as completing bunker renovations, adding tee boxes, relocating and resurfacing greens, replacing cart paths, re-landscaping desert areas, and even installing new irrigation systems. Survey respondents also reported course renovations, particularly bunker
Figure 10. Golf Course Renovations by Type (Response Count), 2014
02468
10121416
New Greens
Bunker Renovatio
n
Cart Paths
Revegetation
Re-sodding or R
esurfa
cing
Irrigatio
n System Renovatio
n
Irrigatio
n Computer Syste
m
New Tees
Drainage
Practice Facilty
Expansion
Num
ber o
f Res
pons
es
and cart path renovations (Figure 10).
In total, it is estimated that more than $20 million was spent on golf facility renovations in 2014. How-ever, because capital invest-ments and renovations can be funded through facility revenues, these values are not included in the total economic contribution analysis so as to avoid double-counting.
Charitable ContributionsAnother major contribution of golf facilities is their generation of revenue for charitable causes. This occurs through a variety of channels. Many local golf tournaments serve as fundraisers for charitable organizations. Accord-ing to survey results, roughly 32% of tournaments in 2014 in Arizona were hosted by a group whose purpose was to raise money for a charitable cause. Golf facilities also provide in-kind contribution of rounds of golf, lessons, and other goods and services for fundraising purposes. Finally, golf facilities make cash contributions to support charitable organizations. Statewide, an estimated $3.9 million in in-kind contributions were donated to charitable causes in 2014. Cash contributions totaled an estimated $1.2 million. Those cash contributions represent income for charitable organizations, supporting staff and programs.

Golf Tourism
24 Contribution of the Golf Industry to the Arizona Economy
Golf TourismThis section presents an estimate of the money that is brought into the state from golf tourism. Two types of golf tourism are examined: travelers who visit Arizona for the primary purpose of playing golf, either recreationally, or in amateur tournaments, and travelers who visit Arizona to spectate at major professional tournaments. The calculations incorporate survey data on num-ber of rounds played by visitor origin, information on golf traveler expendi-tures and visitation habits from a July 2016 study focusing on the Tucson and Phoenix/Scottsdale markets (Sports & Leisure Research Group, 2016), data from a 2012 study on the economic impact of the 2012 Waste Management Phoenix Open (Mokwa, et al, 2012), and reported attendance at major profes-sional tournaments from local news media.
Golf Travelers
Out-of-State and Foreign GolfersAs presented in the previous section on golf play, roughly two-thirds of golf play in Arizona was by Arizona residents (Table 11). The remaining third was by out-of-state and foreign visitors. Based upon the estimated 11.6 million rounds played in 2014, 3.7 million rounds were played by out-of-state and for-eign golfers. Those visitors create an impact on the state economy by bringing money from out of state and spending it on golf, lodging, restaurants, enter-tainment, and other local expenditures (Sports & Leisure Research Group, 2016).
Reason for VisitWhile many travelers play golf while on vacation or business, not all of those trips can be attributed to golf. For example, travelers may take a trip to a destination in order to visit friends or family or see specific attractions, and during the trip go golfing. In order to estimate tourist spending attributable to golf, it’s necessary to have information on the proportion of golf travel for which the primary motivation for the trip was to play golf versus other activities. Recall that 3.7 million rounds of golf were played by out-of-state and foreign golfers. According to the 2016 Sports & Leisure Research Group study, the median number of annual golf trips taken per golf traveler is 6 trips per year, 3 for which golf was the primary motivation (either a golf vacation or travel to participate in an amateur golf tournament). Therefore, for the pur-poses of this study, 50% of travel rounds (1.9 million rounds) will be consid-ered as attributable to golf. The same study reported an average of 6.1 rounds of golf played per trip. Dividing the estimated travel rounds attributable to golf by the average number of rounds per trip yields an estimate of 306,415 unique visits attributable to golf in 2014.
Expenditure PatternWhile some of the expenditures of out-of-state and foreign golfers are captured in the golf facility survey, such as rounds of golf played, revenues from greens fees and cart rentals, and total revenues from food and beverage purchases at the golf facility, other expenditures that happen outside the golf facility are not captured by the survey. These expenditures constitute an eco-nomic impact attributable to golf and therefore need to be estimated based upon golf traveler expenditure patterns. In the case of food and beverages purchased during travel, it can be assumed that some of these purchases occurred at the golf facility, while others occurred elsewhere. The estimated
Table 11. Geographic Origin of Golfers in Arizona, by Percentage of Total Play, 2014
Origin Percentage of Total Play
From Arizona (including sea-sonal residents)
67.7%
US visitors from outside Arizona
24.3%
International visitors
8.0%

Golf Tourism
Contribution of the Golf Industry to the Arizona Economy 25
spending on food and beverage is split half-and-half between the golf facility and outside the golf facility to exclude traveler spending at the golf facility that would be captured in survey data. Expenditures on airfare and fuel costs driving to the destination were assumed to have occurred out-of-state and therefore were excluded.
For this report, we use a golf traveler expenditure pattern from the 2016 Sports & Leisure Research Group report (Table 12).
Using the above spending pattern and the calculated number of trips attributable to golf tourists coming to play in Arizona, the estimated direct economic impact of golf travel to the Arizona economy in 2014 was $539,465,000.3
3 Were all golf trips attributable to golf as the primary reason for the travel, the estimated direct contribution would be $1,078,931,000.
Table 12. Golf Traveler Spending Pattern
Source: 2016 Sports & Leisure Research Group “Visit Tucson” Report, Adjusted to 2014 Dollars
Item Amount per Trip Include or ExcludeAirfare $439 Exclude
Car Rental $209 Include
Fuel Cost $153 Exclude
Golf $448 Exclude
Lodging/accommodations $609 Include
Local Transportation $129 Include
Food/Dining/Beverage $407 Include half
Entertainment/attractions $255 Include
Shopping & other retails sales
$356 Include
Total $3,004 $1,761
Professional Tournament SpectatorsTourists come to Arizona from outside the state not only to play golf, they also come to watch golf. Professional tournaments are a major attraction for out-of-state visitors. Furthermore, large professional tournaments require support staff and vendors who travel from out of state to support professional golf-ers, provide media coverage, and sell goods and ser-vices. Four of the largest professional tournaments in Arizona were included in this analysis (Table 13), estimating the number of unique out-of-town visi-tors based upon reported attendance in 2014.
A 2012 economic impact study of the Waste Management Phoenix Open estimated that there
Table 13. Major Professional Golf Tournaments in Arizona, 2014
* Attendance not known, estimated at 40,000.Sources: Arizona Republic (2016); Davis (2014a); Davis (2014b)
Tournament 2014 Attendance HostWaste Management Phoenix Open
563,008 TPC Scottsdale
Charles Schwab Cup Championship
40,000 Desert Mountain
Accenture Match Play 40,000* Dove Mountain
LPGA JTBC Founders Cup 56,250 Desert Ridge
were 67,320 unique visitors to the metropolitan Phoenix region attending the event. With a conservative assumption that half of those visitors were from out-of-state, this equates to unique out-of-state visitors representing 6.5% of reported attendance. That rate was applied to the attendance estimates for the other three tournaments (Table 13). In addition, the 2012 report provides an estimate of the number of support professionals attending the tourna-ment, estimated at 234 individuals. That same number was used for the other three tournaments as well. All tournaments were either 4 or 5 days in length, therefore the average stay of 4.4 days used in the 2012 study was used for all 4 tournaments. Applying the spending pattern provided in the 2012 study, adjusted to 2014 dollars and excluding spending on airfare, an estimated $58 million in out-of-state visitor direct spending can be attributed to major professional golf tournaments.
Estimated Direct Impact of Golf Tourism in ArizonaCombining golf travelers and professional golf tournament spectators, the total direct impact of golf tourism to Arizona’s economy in 2014 was an estimated $598,300,000.
Golf-Related Businesses
26 Contribution of the Golf Industry to the Arizona Economy
Golf-Related BusinessesMany businesses in the state supply and supplement the operations of golf facilities around Arizona. Supplying businesses are businesses whose goods and services would show up amongst itemized facility expenses, for exam-ple, businesses that supply golf course maintenance equipment, turfgrass irrigation consulting services, or wholesalers of golf apparel. Businesses that supplement golf course operations include standalone retailers, golf cart re-tailers, and other businesses that sell directly to consumers separate from golf facilities. As can be seen from survey results, most people golfing at Arizona golf facilities are in fact in-state Arizona residents, and therefore were it not for that in-state play, the demand for golf-related retail goods would be con-siderably less. For purposes of this analysis, supplying businesses are excluded because the economic activity they generate is captured by the golf facility operations survey data.
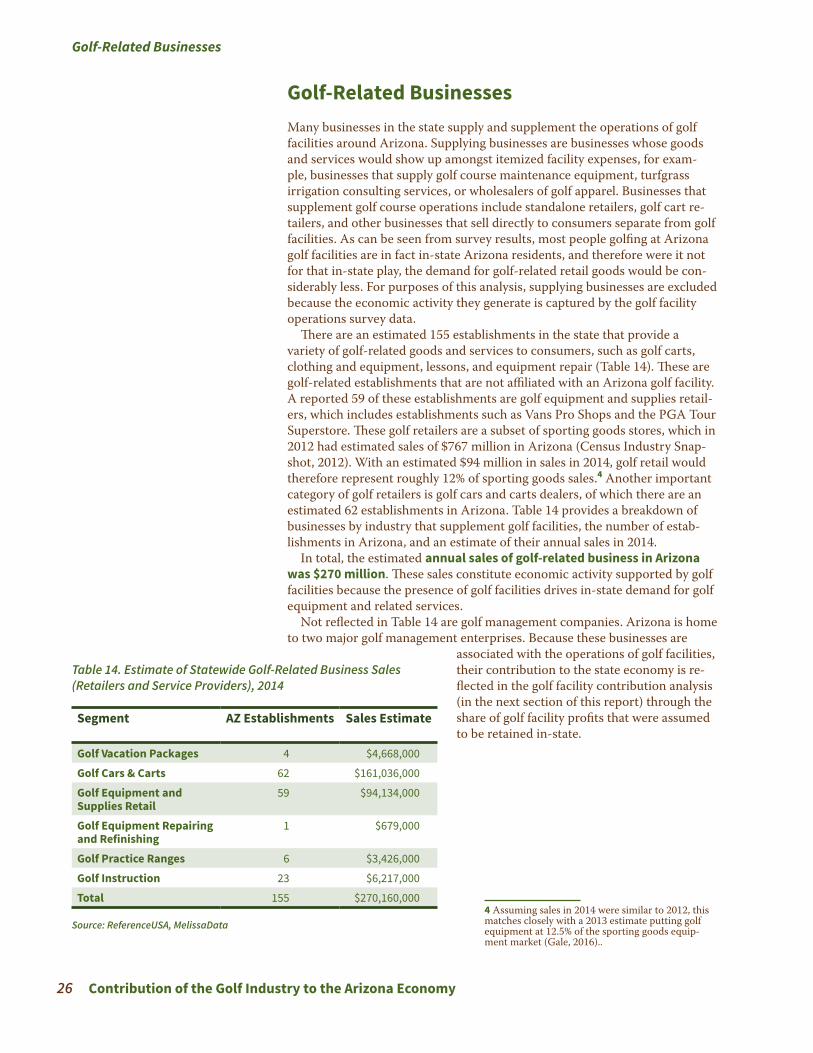
There are an estimated 155 establishments in the state that provide a variety of golf-related goods and services to consumers, such as golf carts, clothing and equipment, lessons, and equipment repair (Table 14). These are golf-related establishments that are not affiliated with an Arizona golf facility. A reported 59 of these establishments are golf equipment and supplies retail-ers, which includes establishments such as Vans Pro Shops and the PGA Tour Superstore. These golf retailers are a subset of sporting goods stores, which in 2012 had estimated sales of $767 million in Arizona (Census Industry Snap-shot, 2012). With an estimated $94 million in sales in 2014, golf retail would therefore represent roughly 12% of sporting goods sales.4 Another important category of golf retailers is golf cars and carts dealers, of which there are an estimated 62 establishments in Arizona. Table 14 provides a breakdown of businesses by industry that supplement golf facilities, the number of estab-lishments in Arizona, and an estimate of their annual sales in 2014.
In total, the estimated annual sales of golf-related business in Arizona was $270 million. These sales constitute economic activity supported by golf facilities because the presence of golf facilities drives in-state demand for golf equipment and related services.
Not reflected in Table 14 are golf management companies. Arizona is home to two major golf management enterprises. Because these businesses are
Table 14. Estimate of Statewide Golf-Related Business Sales (Retailers and Service Providers), 2014
Source: ReferenceUSA, MelissaData
Segment AZ Establishments Sales Estimate
Golf Vacation Packages 4 $4,668,000
Golf Cars & Carts 62 $161,036,000
Golf Equipment and Supplies Retail
59 $94,134,000
Golf Equipment Repairing and Refinishing
1 $679,000
Golf Practice Ranges 6 $3,426,000
Golf Instruction 23 $6,217,000
Total 155 $270,160,000
associated with the operations of golf facilities, their contribution to the state economy is re-flected in the golf facility contribution analysis (in the next section of this report) through the share of golf facility profits that were assumed to be retained in-state.
4 Assuming sales in 2014 were similar to 2012, this matches closely with a 2013 estimate putting golf equipment at 12.5% of the sporting goods equip-ment market (Gale, 2016)..

Economic Contribution Analysis
Contribution of the Golf Industry to the Arizona Economy 27
Economic Contribution AnalysisThe following section presents economic contribution analyses for the three major components examined in this analysis—golf facility operations, golf tourism, and golf-related businesses. These contribution analyses utilize input-output modeling techniques and the IMPLAN 3.1 software, a regional economic model used to estimate the linkages between local industries.
The contribution of the golf industry to Arizona’s economy goes beyond the revenues of golf facilities, golf tourist spending, and the sales of golf-re-lated businesses, known as direct effects. Providing those goods and services requires inputs of other goods and services, including machinery, fertilizers, water, wholesale goods, and labor. Many of those goods and services are sup-plied by local businesses that themselves require inputs to operate and pro-duce, and so on. Each additional round of transactions eventually dissipates as money leaks out of the state economy. These rounds of business-to-business transactions providing inputs to production are known as indirect effects. Another critical component of economic activity supported by the golf industry is the set of effects resulting from salaries and wages paid to people employed by the golf industry and its supplying industries. When these em-ployees spend their paychecks on household expenses such as rent or mort-gages, visits to the doctor, or groceries, more rounds of household-to-busi-ness transactions take place, known as induced effects. The total economic contribution of an industry is the sum of these three types of effects. For a detailed explanation of the methods used to calculate the economic contribu-tion analysis, please see Appendices D and E.
A variety of economic metrics are used to describe the golf industry’s con-tribution to the Arizona economy. These include sales (output), value added (GDP), labor income (employee compensation and proprietor income), jobs, and state and local taxes. It’s important to note that many of these economic metrics are interconnected and, therefore, cannot be added together. Figure 11 demonstrates the relationship between sales, value added, and income.
Sales, or output, measures the total final value of goods and services pro-duced by an industry. Sales is a gross measure of economic activity as it includes the value of economic activity generated in the industry (value added) as well as the costs of inputs. While sales is the easiest metric to understand,
LaborIncome
SalesValueAdded
Wages, Salaries, and Benefits of Employees
ProprietorIncome
Other Property Type Income
Profits
TaxesInput Costs
Value AddedLabor Income
Figure 11. Illustration of Relationship between Economic Metrics
Economic Contribution Analysis
28 Contribution of the Golf Industry to the Arizona Economy
the most precise metric to measure an industry’s contribution to the Arizona economy is value added. Value added is the net incremental change in value from the last stage of production. It measures the additional gain in economic activity that can be attributed a particular industry. This metric is synonymous to the official measure of gross domestic product (GDP), the measure that is most often used to measure the size of an economy. Value added is comprised of the incomes paid to workers, the profits of the industry, and the taxes paid to the government (IMPLAN Group, LLC). Finally, labor income measures the total personal income supported by the industry. It includes the wages, salaries, and benefits of employees as well as the income of proprietors.
The following section of the report summarizes the results of the eco-nomic contribution analyses for golf facility operations, golf-tourism, and other golf-related businesses. Additionally, Figure 12 demonstrates the other industries in Arizona that are most affected through the multiplier effects generated by the golf industry.
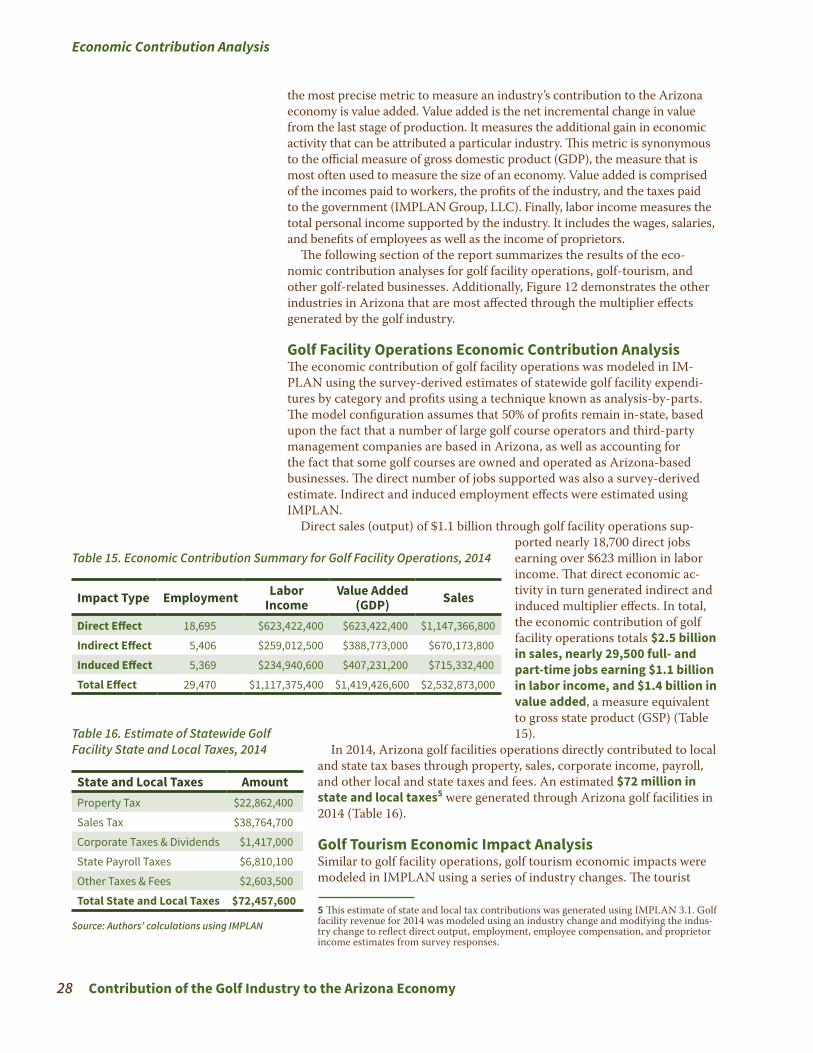
Golf Facility Operations Economic Contribution AnalysisThe economic contribution of golf facility operations was modeled in IM-PLAN using the survey-derived estimates of statewide golf facility expendi-tures by category and profits using a technique known as analysis-by-parts. The model configuration assumes that 50% of profits remain in-state, based upon the fact that a number of large golf course operators and third-party management companies are based in Arizona, as well as accounting for the fact that some golf courses are owned and operated as Arizona-based businesses. The direct number of jobs supported was also a survey-derived estimate. Indirect and induced employment effects were estimated using IMPLAN.
Direct sales (output) of $1.1 billion through golf facility operations sup-
Table 15. Economic Contribution Summary for Golf Facility Operations, 2014
Impact Type Employment Labor Income
Value Added (GDP) Sales
Direct Effect 18,695 $623,422,400 $623,422,400 $1,147,366,800
Indirect Effect 5,406 $259,012,500 $388,773,000 $670,173,800
Induced Effect 5,369 $234,940,600 $407,231,200 $715,332,400
Total Effect 29,470 $1,117,375,400 $1,419,426,600 $2,532,873,000
ported nearly 18,700 direct jobs earning over $623 million in labor income. That direct economic ac-tivity in turn generated indirect and induced multiplier effects. In total, the economic contribution of golf facility operations totals $2.5 billion in sales, nearly 29,500 full- and part-time jobs earning $1.1 billion in labor income, and $1.4 billion in value added, a measure equivalent to gross state product (GSP) (Table 15).Table 16. Estimate of Statewide Golf
Facility State and Local Taxes, 2014
Source: Authors’ calculations using IMPLAN
State and Local Taxes AmountProperty Tax $22,862,400
Sales Tax $38,764,700
Corporate Taxes & Dividends $1,417,000
State Payroll Taxes $6,810,100
Other Taxes & Fees $2,603,500
Total State and Local Taxes $72,457,600
In 2014, Arizona golf facilities operations directly contributed to local and state tax bases through property, sales, corporate income, payroll, and other local and state taxes and fees. An estimated $72 million in state and local taxes5 were generated through Arizona golf facilities in 2014 (Table 16).
Golf Tourism Economic Impact AnalysisSimilar to golf facility operations, golf tourism economic impacts were modeled in IMPLAN using a series of industry changes. The tourist
5 This estimate of state and local tax contributions was generated using IMPLAN 3.1. Golf facility revenue for 2014 was modeled using an industry change and modifying the indus-try change to reflect direct output, employment, employee compensation, and proprietor income estimates from survey responses.

Economic Contribution Analysis
Contribution of the Golf Industry to the Arizona Economy 29
spending pattern provided in previous sections was used to simulate eco-nomic activity in the hotel and restaurant industries and other industries where golf tourists would spend their moneys. Retail margins were applied to retail industries for purposes of calculating indirect and induced effects, while maintaining direct output as gross sales figures. Direct employment, labor income, and value added were calculated using IMPLAN.
As reported in previous sections, out-of-state tourist spending attributable to golf had an estimated direct sales impact of $598 million in 2014. Those sales, including indirect and induced multiplier effects, supported $1.1 bil-lion in sales, $576 million in value added, and nearly 10,500 jobs earning $343 million in labor income (Table 17). Because this spending is by out-of-state visitors, it represents money coming into Arizona from outside the state. This represents exogenously demanded goods and services and therefore can be considered an economic impact (versus an economic contribution).
Table 17. Economic Contribution Summary for Golf Tourism, 2014
Impact Type Employment Labor Income Value Added Sales
Direct Effect 7,102 $192,571,900 $320,162,700 $598,300,200
Indirect Effect 1,478 $68,497,100 $113,541,400 $208,667,400
Induced Effect 1,875 $82,044,400 $142,217,800 $249,836,200
Total Effect 10,455 $343,113,500 $575,921,800 $1,056,803,800
Golf Facility Operations Golf-Related Businesses Golf Tourism
• Other amusement and recreation industries
• Wholesale trade• Real estate• Office administrative
services• Owner-occupied
dwellings• Other local government
enterprises• Electric power transmis-
sion and distribution• Landscape and
horticultural services• Insurance carriers• Hospitals
• Hotels and motels, including casino hotels
• Full-service restaurants• Automotive equipment
rental and leasing• Retail: Clothing and
clothing accessories stores
• Retail: Miscellaneous store retailers
• Other amusement and recreation industries
• Amusement parks and arcades
• Real estate• Transit and ground
passenger transportation• Owner-occupied
dwellings
• Retail: Motor vehicle and parts dealers
• Retail: Sporting goods, hobby, musical instru-ment, and book stores
• Real estate• Other educational
services• Owner-occupied
dwellings• Travel arrangement and
reservation services• Other amusement and
recreation industries• Wholesale trade• Insurance carriers• Hospitals
Figure 12. Top 10 Industries Impacted by Component of Economic Contribution Analysis
Top industries impacted by golf tourism include hotels and motels ($199 million total sales impact), restaurants ($88 million total sales impact), and car rental ($68 million total sales impact), closely mirroring the tourist spending pattern (Figure 12). Hotel and motel sales supported by golf tourism support an estimated 1,960 full- and part-time jobs in that industry. Golf tourism directly generated an estimated $32 million in state and local sales tax revenues.

Economic Contribution Analysis
30 Contribution of the Golf Industry to the Arizona Economy
Table 19. Economic Contribution Summary, Total, 2014
Impact Type Employment Labor Income Value Added Sales
Direct Effect 27,013 $855,173,300 $1,002,200,900 $2,015,827,000
Indirect Effect 7,101 $337,132,100 $519,041,200 $909,074,400
Induced Effect 7,595 $332,317,900 $576,027,200 $1,011,858,200
Total Effect 41,708 $1,524,623,300 $2,097,269,200 $3,936,759,600
Golf-Related Businesses Contribution AnalysisEstimates of sales from golf-related businesses were modeled in IMPLAN as a series of industry changes according to their corresponding IMPLAN in-dustries (Appendix E). Direct employment effects were estimated using IM-PLAN, as were indirect and induced effects. Retail margins were applied to all retail industries in order to calculate indirect and induced effects, while the direct effects were measured as gross sales. This can be observed in the results (Table 18) in the relatively small indirect effects across employment, labor income, value added, and sales.
Table 18. Economic Contribution Summary for Golf-Related Businesses, 2014
Impact Type Employment Labor Income Value Added Sales
Direct Effect 1,216 $39,179,000 $58,615,800 $270,160,000
Indirect Effect 217 $9,622,600 $16,726,800 $30,233,100
Induced Effect 350 $15,332,900 $26,578,200 $46,689,600
Total Effect 1,784 $64,134,400 $101,920,800 $347,082,800
In total, including multiplier effects, golf-related business direct sales of $270 million supported a total of $347 million in sales, $102 million in value added, $64 million in labor income, and nearly 1,800 full- and part-time jobs.
Similar to the case of golf facilities, the top industries affected by spending at golf-related businesses includes those same golf-related businesses (direct effects), but also industries affected when individuals employed by supporting industries go out and spend their incomes on household expenditures such as rent or mortgage or medical care (Figure 12). Golf-related businesses gener-ated an estimated $6.5 million in direct sales tax revenues for local and state governments.
Total Economic ContributionThe total contribution of the golf industry in 2014, including golf facility operations, golf tourism, and golf-related businesses, totaled $3.9 billion in direct, indirect, and induced sales (Table 19). Nearly 42,000 jobs were supported, both directly and through multiplier effects, earning $1.5 billion in labor income. The golf industry contributed $2.1 billion to gross state product (value added) through direct and multiplier effects.

Residential Real Estate Premiums
Contribution of the Golf Industry to the Arizona Economy 31
Residential Real Estate PremiumsThe hedonic price method is a common method used in real estate and environmental economics to estimate the economic value of attributes of a neighborhood such as quality of schools, environmental goods (such as proximity to parks or open space), or environmental risks (such as proximity to Superfund sites). The basic idea behind this approach is that a house can be characterized as a bundle of attributes. Some of these attributes are spe-cific to the house (square footage, lot size, whether it has a swimming pool), while others are attributes of the neighborhood where the house is located. Multivariate regression analysis is used to estimate the value of a home as a function of its various attributes. Several studies have included proximity to golf courses as one variable for analysis, either as a main factor of interest or simply as a control variable.
Such hedonic studies have consistently found that homes near golf courses receive price premiums. Table 20 provides a sample of such studies from different areas across the United States. Models either estimate how home values decline with distance from a golf course or create categorical variables to measure whether a home fronts on a golf course or is within some distance of a course.
Table 20. Selected Hedonic Study Estimates of Home Price Premiums for Proximity to Golf Courses
Study Years Market Estimated PremiumGrudnitski (2003). Golf course communi-ties: the effect of course type on housing prices. The Appraisal Journal.
1998–2001 Las Vegas, NV Private course–12.5%; Semi-private course–6% Public course–5.7%
Do & Grudnitski (1995). Golf courses and residential house prices: An empirical examination. Journal of Real Estate Finance & Economics, Vol 10 No 3.
1990–1993 Rancho Bernardo, CA 7.6% adjacent to course
Grudnitski & Do (1997). Adjusting the value of houses located on a golf course. The Appraisal Journal, Vol 65 No 3.
1990–1993 Rancho Bernardo, CA 4.8% adjacent to course
Asabere & Huffman (1996). Negative and positive impacts of golf course proximity on home prices. The Appraisal Journal.
1992–1994 Mount Laurel, NJ 7–8% premium for frontage
Nicholls & Crompton (2007). The Impact of a Golf Course on Residential Property Values. Journal of Sport Management, Vol 21.
1997–2001 College Station, TX Adjacent to course: Sales price–25.8% Assessed valuation–19.2%
Owusu-Edusei & Espey (2003). Does proximity to a golf course matter? Clemson University Working Paper, WP 012203.
1994–2001 Greenville, SC Course-abutting houses sell for 27% more than those beyond 1,100 feet away, 15% more for houses between 300 and 1,100 feet away
Shultz & Schmitz (2009). Augmenting Housing Sales Data to Improve Hedonic Estimates of Golf Course Frontage. Jour-nal of Real Estate Research, Vol 31 No 1.
2000–2006 Omaha, NE For adjacent houses: Private non-equity: 28% Public: 15% Municipal: 9% Private-equity: 5%
Shin, Saginor & Van Zandt (2011). Evaluating Subdivision Characteristics on Single-Family Housing Value Using Hierarchical Linear Modeling. Journal of Real Estate Research, Vol 33 No 3.
2008 College Station, TX 16.25% (attached to golf course)

Residential Real Estate Premiums
32 Contribution of the Golf Industry to the Arizona Economy
Turning to studies in Arizona, two from the Phoenix metropolitan area, Seo et al. (2014) and by Larson and Perrings (2013), found strong statistical evidence that – controlling for other factors—housing prices declined with distance from golf courses. Larson and Perrings found robust results examin-ing effects within individual Phoenix metro area school districts. They stated:
“The consistency of the coefficient signs for vegetation abundance and proximity to golf and large parks highlight their importance across the entire metropolitan area.” (p. 52)
“Our findings confirm the importance of water-related environmen-tal amenities in a desert environment. Vegetation abundance and proximity to water-intensive land uses such as golf and lakes are all amenities, reflecting the influence of the hot desert cli-mate on homeowner choice.” (p. 54).6
In studies of the Tucson metropolitan area, Shultz and King (2001) and Bark et al. (2011) also found statistically significant premiums for proximity to golf courses. Shultz and King found housing values fell with distance from golf courses, with the effects being consistently stronger for private than for public courses. Bark et al. (2011) found statistically significant premiums for homes adjacent to golf courses, but no premiums for homes close to, but not adjacent to, courses.
While hedonic studies have consistently found home price premiums for proximity to golf courses, these studies have, by their nature, focused on housing sub-markets of urban areas. Hedonic studies have encountered various estimation problems when extending their geographic scope too far. These problems often have to do with particulars of different sub-markets. For this reason, they are not amenable to developing statewide estimates of golf course premiums.
In contrast to a hedonic approach, Schmitz (2006) developed statewide estimates for the premium attributable to all homes ever built in golf course communities in Arizona. This was in turn based on an SRI International (2002) report that estimated that golf course communities on average had between 100 and 200 frontage lots and between 300 and 400 non-adjacent community lots. Home price premiums were reported to average $50,000 for frontage lots and $10,000 for non-adjacent lots. Schmitz (2006) assumed golf communities would—on average—have the midpoint number of each type of home: 150 frontage lots and 350 non-adjacent lots. The total premium per community was then estimated to be $11 million. Based on a survey conducted for the study, Schmitz (2006) estimated there were 187 residential golf courses in the state. Multiplying per-community premiums times the 187 courses, Schmitz estimated that the total premiums attributable to all homes built in golf course communities was $2,057,000,000.
For the current study, we update estimates of this total statewide pre-mium in two ways. First, the hedonic home value literature has consistently estimated the golf amenity premium as proportional to the underlying value of a home. For example, a 10% golf course proximity premium would be $40,000 for a $400,000 home, but $100,000 for a million dollar home. Because of this, one would expect the golf course premium to change with baseline home values. The real estate market in Arizona has gone through
6 Emphasis by author.
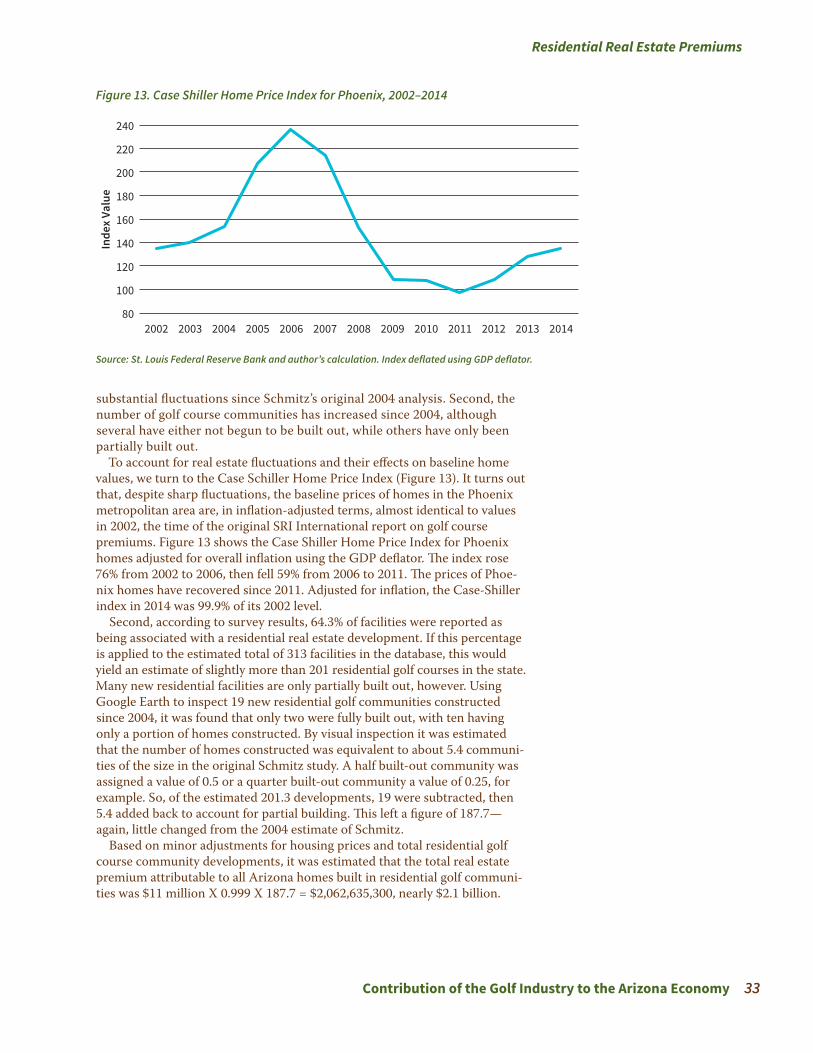
Residential Real Estate Premiums
Contribution of the Golf Industry to the Arizona Economy 33
80
100
120
140
160
180
200
220
240
2002 2003 2004 2005 2006 2007 2008 2009 2010 2011 2012 2013 2014
Inde
x Va
lue
Figure 13. Case Shiller Home Price Index for Phoenix, 2002–2014
Source: St. Louis Federal Reserve Bank and author’s calculation. Index deflated using GDP deflator.
substantial fluctuations since Schmitz’s original 2004 analysis. Second, the number of golf course communities has increased since 2004, although several have either not begun to be built out, while others have only been partially built out.
To account for real estate fluctuations and their effects on baseline home values, we turn to the Case Schiller Home Price Index (Figure 13). It turns out that, despite sharp fluctuations, the baseline prices of homes in the Phoenix metropolitan area are, in inflation-adjusted terms, almost identical to values in 2002, the time of the original SRI International report on golf course premiums. Figure 13 shows the Case Shiller Home Price Index for Phoenix homes adjusted for overall inflation using the GDP deflator. The index rose 76% from 2002 to 2006, then fell 59% from 2006 to 2011. The prices of Phoe-nix homes have recovered since 2011. Adjusted for inflation, the Case-Shiller index in 2014 was 99.9% of its 2002 level.
Second, according to survey results, 64.3% of facilities were reported as being associated with a residential real estate development. If this percentage is applied to the estimated total of 313 facilities in the database, this would yield an estimate of slightly more than 201 residential golf courses in the state. Many new residential facilities are only partially built out, however. Using Google Earth to inspect 19 new residential golf communities constructed since 2004, it was found that only two were fully built out, with ten having only a portion of homes constructed. By visual inspection it was estimated that the number of homes constructed was equivalent to about 5.4 communi-ties of the size in the original Schmitz study. A half built-out community was assigned a value of 0.5 or a quarter built-out community a value of 0.25, for example. So, of the estimated 201.3 developments, 19 were subtracted, then 5.4 added back to account for partial building. This left a figure of 187.7—again, little changed from the 2004 estimate of Schmitz.
Based on minor adjustments for housing prices and total residential golf course community developments, it was estimated that the total real estate premium attributable to all Arizona homes built in residential golf communi-ties was $11 million X 0.999 X 187.7 = $2,062,635,300, nearly $2.1 billion.

Water and Conservation Practices
34 Contribution of the Golf Industry to the Arizona Economy
Water and Conservation PracticesThe following section provides information on golf facility water use, water
conservation practices, and turfgrass management practices used in Arizona. Additionally, it presents government data on golf water use in the state to supplement survey-based estimates.
7 Active Management Areas (AMAs) are areas in Arizona where groundwater use is regulated and monitored according the Arizona Groundwater Code. There are five AMAs in Arizona: Phoenix, Tucson, Prescott, Pinal, and Santa Cruz. (ADWR, 2016)8 Consumptive use is the water requirement of a crop or plant and includes losses through evapotranspiration and evaporation from soils.
Table 21. Estimated of Statewide Golf Facility Acreage, 2014
Estimated Golf Facility Acreage by Type AcreageTotal acres of golf course(s) 45,270
Turfgrass acres maintained 31,883
Acres irrigated 34,430
Total acres of golf facility (incl. clubhouse, golf shop, golf courses, restaurants, etc.)
54,786
AcreageIn 2014, golf facilities used an estimated 55,000 acres of land in Arizona. Approximately 80% of facility land is dedicated to the golf course with the remainder of the land supporting clubhouses, pro shops, restaurants, parking and roads. Maintained turfgrass occupies just 70% of the land dedicated to the golf course. According to US Geological Survey (USGS) estimates, in 2010 there were 29,680 acres of turfgrass dedicated to golf in Arizona.
Irrigation Water UsedBased upon survey responses, golf facilities used an estimated 167,397 acre-feet (AF) of irrigation water in 2014 statewide. Respondents reported that on average 15.7% of golf irrigation water was Central Arizona Project (CAP) water, 1.9% was surface water, 38.5% was groundwater, 35.0% was reclaimed water, and 9.0% was from other water sources. This percentage for reclaimed water is somewhat higher than estimates from water resource agencies (see below).
According to the Arizona Department of Water Resources (ADWR), in 2014 golf facility water use in Active Management Areas7 (AMAs) stood at 129,003 AF, with roughly 34,000 AF of this being effluent. While most golf facilities are located within AMAs, which encompass the state’s major popu-lation centers, some facilities do fall outside the AMAs and are not reflected in that total. We therefore would expect that the statewide golf water use estimate to be higher than what is reported by the ADWR.
According to another source, the USGS, 130,116 AF of self-supplied freshwater was withdrawn for golf use in 2010. That same year, according to the USGS, 49,488 AF of reclaimed wastewater was used for golf course irrigation statewide in 2010. This suggests that in 2010 statewide golf water use was closer to 179,000 AF.
From another angle, turfgrass has a consumptive use8 of roughly 4.38 AF per acre per year (Brown & Frisvold, 2016), which would indicate roughly 139,648 AF of consumptive use in 2014 based upon maintained tufgrass acreage estimates for 2014. Factoring in additional irrigation for landscape, water features, and any irriga-tion inefficiencies, a statewide estimate of 167,397 AF is in line with expectations.
The following two sub-sections present golf irrigation water use data in Arizona from the US Geological Survey and the Arizona Department of Wa-ter Resources. This data supplements survey response data, providing a more nuanced look at golf irrigation water use statewide, regionally, by source of water used, and by year since 2004.
US Geological SurveyThe US Geological Survey conducts a national survey of U.S. water use every five years, with the most recent conducted in 2010, with results published in

Water and Conservation Practices
Contribution of the Golf Industry to the Arizona Economy 35
2014 (Maupin et al., 2014). The 2010 survey was the first to report data on water use by golf courses. The USGS reports data on freshwater withdraw-als for golf course irrigation along with data for other withdrawals (e.g. for mining, residences, agriculture, etc.). In addition to reporting data for total
3.0% 1.1% 1.9%
97.0% 98.9% 98.1%
0%
10%
20%
30%
40%
50%
60%
70%
80%
90%
100%
Groundwater Surface Water Total Withdrawals
% o
f With
draw
als
Golf All Other
Figure 14. Golf Freshwater Withdrawals Compared to Withdrawals for All Other Uses, Arizona 2010
Source: USGS, 2010
Table 22. Freshwater Withdrawals for Golf Course Irrigation as a Percentage of Total County Withdrawals for All Uses, 2010
Source: USGS, 2010
Share of Total County Groundwater
Withdrawals
Share of County Surface Water Withdrawals
Share of Total County Freshwater
WithdrawalsApache 0.0% 0.0% 0.0%
Cochise 0.5% 0.0% 0.5%
Coconino 0.5% 0.2% 0.3%
Gila 4.3% 0.0% 4.2%
Graham 0.4% 0.0% 0.2%
Greenlee 0.0% 0.0% 0.0%
La Paz 0.7% 0.0% 0.1%
Maricopa 4.4% 3.8% 4.1%
Mohave 3.8% 0.0% 2.1%
Navajo 3.2% 0.9% 2.9%
Pima 3.8% 3.0% 3.7%
Pinal 1.6% 0.3% 0.7%
Santa Cruz
8.9% 0.0% 8.9%
Yavapai 3.2% 2.5% 3.1%
Yuma 1.1% 0.2% 0.3%
Arizona 3.0% 1.1% 1.9%
withdrawals, USGS reports freshwa-ter withdrawals from groundwater and surface water sources separately.
Data are available for 2010 for Arizona counties and the state as a whole (USGS, 2016). Freshwater withdrawals for irrigation by golf courses accounted for 1.9% of total freshwater withdrawals in Arizona in 2010. Focusing on the source of freshwater (groundwater or surface water), golf withdrawals accounted for 3.0% of total groundwater with-drawals and 1.1% of all surface water withdrawals in the state (Figure 14).
By county, golf freshwater with-drawals (including both groundwa-ter and surface water) ranged from less than 1% of total freshwater withdrawals to 8.9% of total freshwa-ter withdrawals (Table 22). How-ever, only one county in Arizona (Santa Cruz County) has golf course irrigation freshwater withdrawals that accounts for more than 5% of total freshwater withdrawals. Figures 15 to 17 present data from Table 22 graphically.

Water and Conservation Practices
36 Contribution of the Golf Industry to the Arizona Economy
0%
10%
20%
30%
40%
50%
60%
70%
80%
90%
100%
% o
f With
draw
als
0.0% 0.5% 0.3%4.2%
0.2% 0.0% 0.1%4.1% 2.1% 2.9% 3.7% 0.7%
8.9%3.1% 0.3% 1.9%
Apache
Cochise
CoconinoGila
Graham
GreenleeLa Paz
Maricopa
Mohave
NavajoPim
aPinal
Santa Cruz
YavapaiYuma
Arizona
Golf All Other
Figure 15. Total Freshwater Withdrawals by County, Golf vs. All Other Withdrawals, Arizona 2010
Source: USGS
0.0% 0.5% 0.5%4.3%
0.4% 0.0% 0.7% 3.8% 3.2% 3.8% 1.6%8.9%
3.2% 1.1% 3.0%4.4%
Apache
Cochise
CoconinoGila
Graham
GreenleeLa Paz
Maricopa
Mohave
NavajoPim
aPinal
Santa Cruz
YavapaiYuma
Arizona
Golf All Other
0%
10%
20%
30%
40%
50%
60%
70%
80%
90%
100%
% o
f All
With
draw
als
Source: USGS, 2010
Figure 16. Groundwater Withdrawals by County, Golf vs. All Other Withdrawals, Arizona 2010

Water and Conservation Practices
Contribution of the Golf Industry to the Arizona Economy 37
Figure 15 presents total freshwater withdrawals for golf by county, includ-ing both surface water and groundwater. In Santa Cruz County, golf irrigation withdrawals accounted for 8.9% of freshwater withdrawals. This is the only county that exceeds 5% of total country freshwater withdrawals. Golf course irrigation accounted for approximately 4% of freshwater withdrawals in Gila, Maricopa, and Pima Counties, 3% of freshwater withdrawals for Yavapai and Navajo Counties, 2% for Mohave County, and less than 1% for all other Arizona counties.
Turning to groundwater withdrawals in Figure 16, groundwater withdraw-als for golf irrigation were 8.9% of total Santa Cruz County groundwater withdrawals (Table 22 and Figure 16). In Mohave, Pima, Maricopa, and Gila Counties, golf groundwater withdrawals ranged from 3.8% to 4.4% of county totals. In six counties, golf course irrigation accounted for less than 1% of county groundwater withdrawals.
Figure 17 presents the percentage of golf surface water withdrawals com-pared with total surface water withdrawals by county. Golf course irrigation accounted for 2.5% to 3.8% of surface water withdrawals in Yavapai, Pima, and Maricopa Counties (Table 22). According to USGS data, these three counties are the most reliant on surface water withdrawals for golf course irrigation. Elsewhere golf irrigation withdrawals were less than 1% of total surface water withdrawals.
The USGS also reports on golf course use of reclaimed wastewater for golf course irrigation. Statewide, 49,488 AF of reclaimed wastewater was used for golf course irrigation in 2010, accounting for 34% of total statewide reclaimed wastewater use for irrigation. Figure 18 presents golf course reclaimed waste-water use by county. According to the USGS, more than half of all golf course reclaimed water use takes place in Maricopa County, with more than 27,000 AF of reclaimed water used.
0.0% 0.0% 0.2% 0.0% 0.0% 0.0% 0.0%3.8%
0.0% 0.9% 3.0% 0.3% 0.0% 2.5% 0.2% 1.1%0%
10%
20%
30%
40%
50%
60%
70%
80%
90%
100%
% o
f With
draw
als
Apache
Cochise
CoconinoGila
Graham
GreenleeLa Paz
Maricopa
Mohave
NavajoPim
aPinal
Santa Cruz
YavapaiYuma
Arizona
Golf All Other
Figure 17. Total Surface Water Withdrawals by County, Golf vs All Other Uses, Arizona 2010
Source: USGS, 2010

Water and Conservation Practices
38 Contribution of the Golf Industry to the Arizona Economy
Arizona Department of Water ResourcesActive Management Areas (AMAs) are designated areas of the state that regu-late the use of groundwater. As part of reporting requirements, golf course irri-gation water use within AMAs is tracked by the Arizona Department of Water Resources (ADWR). Out of the state’s 313 golf facilities, 252 (81%) are located in AMAs, and 183 of those are located in the Phoenix AMA (Table 23).
Golf courses within AMAs use a variety of water sources for irrigation, including groundwater, surface water, spillwater (defined in subsequent sec-tions), Central Arizona Project (CAP) water (defined in subsequent sections), and effluent. Whereas some AMA golf courses rely on a variety of water sources, others rely heavily on a single source, such as effluent or groundwa-ter, as is the case in the Prescott and Santa Cruz AMAs, respectively (Table 24).
0
5,000
10,000
15,000
20,000
25,000
30,000
Apache
Cochise
CoconinoGila
Graham
GreenleeLa Paz
Maricopa
Mohave
NavajoPim
aPinal
Santa Cruz
YavapaiYuma
Acre
-Fee
t of R
ecla
imed
Wat
er U
se
Source: USGS, 2010
Figure 18. Golf Course Use of Reclaimed Wastewater by County, Arizona, 2010
Table 23. Number of Golf Facilities by AMA in 2014
Source: ADWR
AMA Golf FacilitiesPhoenix AMA 183
Pinal AMA 14
Prescott AMA 6
Santa Cruz AMA 4
Tucson AMA 45
Total 252
Table 24. Number of Facilities Using Water Source by AMA, 2014
Source: ADWR
AMA Ground- water
Surface Water SPIL CAP Effluent
Phoenix AMA
112 51 33 57 66
Pinal AMA
7 0 0 2 5
Prescott AMA
2 0 0 0 4
Santa Cruz AMA
3 0 0 0 1
Tucson AMA
25 1 0 1 25
TOTAL 149 52 33 60 101
In 2014, golf represented 3.5% of total AMA water use in Arizona (Figure 19). For the Phoenix AMA, golf represented 4.6% of total AMA water use and in the Tucson AMA, golf represented 5.7% of total AMA water use. The Prescott and Santa Cruz AMAs, smaller in terms of population, had higher percentages of total AMA water use represented by golf, at 9.1% and 7.5%, respectively. These AMAs also have relatively low concentrations of irri-gated agriculture. Conversely, the Pinal AMA represents an area with a high concentration of irrigated agriculture and relatively few golf courses. Golf water use represented 0.4% of to-tal AMA water use in the Pinal AMA in 2014.
Golf facility water use by AMA reflects the overall number of courses in each AMA by year. For example, in 2004 total golf water use is split fairly proportionally according to the share of 239 courses spread across the state’s

Water and Conservation Practices
Contribution of the Golf Industry to the Arizona Economy 39
AMAs. Similarly, water use data for 2014 reflects the share of 252 golf facili-ties located in all five AMAs.
Between 2004 and 2014 there was a net increase of 24,736 AF of annual golf facility water use across Arizona’s AMAs (Figure 20). Most of the in-crease came from net increases in the Phoenix AMA (21,418 AF annually) and the Pinal AMA (2,348 AF annually). There was a net decrease in the Tucson AMA (1,869 AF), and a small increase in the Santa Cruz AMA. One potential reason for the net increase in water use from 2004 to 2014 is that the number of facilities in Arizona’s AMAs has increased from 239 facilities to 252 facilities.
Figure 19. Golf Water Use (Including Effluent) as a Percentage of Total AMA Water Use by AMA, 2014
Source: ADWR
4.6% 0.4%9.1% 7.5% 5.7% 3.5%
0%10%20%30%40%50%60%70%80%90%
100%
PhoenixAMA
PinalAMA
PrescottAMA
Santa CruzAMA
TucsonAMA
All AMAsTOTAL
Perc
enta
ge o
f Tot
al A
MA
Wat
er U
se
Golf Non-Golf
Figure 20. Golf Water Use by AMA, 2004–2015 (in Acre-Feet)
0
20,000
40,000
60,000
80,000
100,000
120,000
140,000
2004 2005 2006 2007 2008 2009 2010 2011 2012 2013 2014 2015
Acre
-Fee
t of W
ater
Phoenix Pinal Prescott Santa Cruz Tucson

Water and Conservation Practices
40 Contribution of the Golf Industry to the Arizona Economy
Total golf facility water use by source of water in Arizona’s AMAs also remains relatively consistent across the years, while total use experiences some year-to-year fluctuation (Figure 21). Overall there was a net increase in water use from all sources between 2004 and 2014. In 2014, groundwater represented 48.1% of AMA golf water use, surface water, 10.9%, CAP, 14.6%, and effluent, 26.3%.
Figures 22 through 26 take a closer look at each source of water for golf use (groundwater, surface water, spillwater, CAP, and effluent) by AMA.
Most groundwater use occurs in the Phoenix AMA, followed by the Tucson AMA, also the two AMAs with the largest number of golf facilities (Figure 22).
Figure 21. AMA Golf Water Use by Source, 2004–2015 (in Acre-Feet)
Groundwater Surface Water Spillwater CAP Eluent
Acre
-Fee
t of W
ater
0
20,000
40,000
60,000
80,000
100,000
120,000
140,000
2004 2005 2006 2007 2008 2009 2010 2011 2012 2013 2014 2015
Figure 22. Golf Groundwater Use by AMA, 2004–2015 (in Acre-Feet)
Acre
-Fee
t of W
ater
0
10,000
20,000
30,000
40,000
50,000
60,000
70,000
2004 2005 2006 2007 2008 2009 2010 2011 2012 2013 2014 2015
Phoenix Pinal Prescott Santa Cruz Tucson

Water and Conservation Practices
Contribution of the Golf Industry to the Arizona Economy 41
Nearly all surface water use by golf occurs in the Phoenix AMA, reflecting Salt River Project water (Figure 23).
Spillwater represents a very small fraction of golf facility water use and occurs only in the Phoenix AMA. Spillwater is surface water released from storage (excluding Colorado River Water) to avoid spills that would otherwise occur when surface water inflows exceed facility capacities at storage, diver-sion, or distribution facilities (ADWR, 2016). Use of this water source peaked in 2010 at over 3,500 AF (Figure 24).
Figure 23. Golf Surface Water Use by AMA, 2004–2015 (in Acre-Feet)
2004 2005 2006 2007 2008 2009 2010 2011 2012 2013 2014 2015
Phoenix Pinal Prescott Santa Cruz Tucson
Acre
-Fee
t of W
ater
0
4,000
6,000
8,000
10,000
12,000
14,000
16,000
2,000
Figure 24. Golf Spillwater Water Use by AMA, 2004–2015 (in Acre-Feet)
Acre
-Fee
t of W
ater
0
1,000
1,500
2,000
2,500
3,000
3,500
4,000
500
2004 2005 2006 2007 2008 2009 2010 2011 2012 2013 2014 2015
Phoenix

Water and Conservation Practices
42 Contribution of the Golf Industry to the Arizona Economy
Central Arizona Project (CAP) water use occurs predominantly in the Phoenix AMA, with some use in the Pinal and Tucson AMAs (Figure 25). This result is a function of the location of the physical infrastructure for water delivery (Prescott and Santa Cruz AMAs do not have access to CAP infra-structure), as well as the practice of CAP recharge in the Tucson AMA.
Use of effluent or reclaimed water is split primarily between the Phoenix and Tucson AMAs (Figure 26). Use of effluent in AMAs increased by 27% from 26,675 AF to 33,977 AF between 2004 and 2014.
Figure 26. Golf Effluent Use by AMA, 2004–2015 (in Acre-Feet)
Acre
-Fee
t of W
ater
0
10,000
15,000
20,000
25,000
30,000
35,000
40,000
5,000
2004 2005 2006 2007 2008 2009 2010 2011 2012 2013 2014 2015
Phoenix Pinal Prescott Santa Cruz Tucson
Figure 25. Golf CAP Water Use by AMA, 2004–2015 (in Acre-Feet)
2004 2005 2006 2007 2008 2009 2010 2011 2012 2013 2014 2015
Phoenix Pinal Prescott Santa Cruz Tucson
Acre
-Fee
t of W
ater
0
5,000
10,000
15,000
20,000
25,000

Water and Conservation Practices
Contribution of the Golf Industry to the Arizona Economy 43
Figure 27 depicts the breakdown of AMA golf water use by water source throughout the state. The split varies significantly between AMAs, with some AMAs relying on a mix of sources while other AMAs depend almost exclu-sively on one source of water. In terms of total golf water use in the Phoenix AMA, roughly half is groundwater, and the remaining half is split between ef-fluent, CAP, and surface water. The Pinal AMA relies heavily on groundwater, at 60% of golf water use. Approximately 27% of Pinal AMA water use is from the Central Arizona Project, and the remainder of use is met through effluent. In the Prescott AMA, golf facilities rely heavily on effluent, which represents 75% of golf water use in 2014. Groundwater made up the remaining 25%. In the Santa Cruz AMA, golf use consists almost exclusively of groundwater, with a small portion of use supplied through effluent. In the Tucson AMA, golf water use is dominated by effluent and groundwater, at 54% and 44% of use, respectively. CAP and surface water make up the remainder of use.
Irrigation MethodsGolf survey respondents provided a breakdown of irrigation methods used on Arizona golf courses (Table 25). On average, 93% of golf facility irrigation oc-curred using sprinklers and over 7% using drip irrigation. Turfgrass irrigation occurs almost exclusively using sprinklers (USGS, 2010), while drip irrigation is used for landscaping.
Figure 27. AMA Golf Water Use by Source, 2014
PrescottAMA
PhoenixAMA
PinalAMA
Santa CruzAMA
TucsonAMA
Groundwater25%
Groundwater60%
Groundwater98%
Groundwater44%
Groundwater48%
E�luent75%
E�luent13%
E�luent2%
E�luent54%
E�luent21%
Surface Water1%
Surface Water14%
CAP17%
CAP1%
CAP27%
Table 25. Irrigation Method for Arizona Golf Facilities, 2014 (Survey Results)
Gravity Sprinkler Drip Other0.0% 92.8% 7.2% 0.1%

Water and Conservation Practices
44 Contribution of the Golf Industry to the Arizona Economy
Management StrategiesGolf course superintendents use a variety of turfgrass management strategies to monitor and maintain the health of turfgrass. These strategies are critical in maximizing the efficiency of use for water, chemicals, and other inputs. Survey respondents indicated whether they employed a series of turfgrass management practices at their facility (Figure 28). Some of the most common practices, according to survey results, include aerification of fairways and greens, using soil wetting agents (both associated with water use efficiency), and scouting for insect pests, weeds, and diseases. Other common practices associated with optimizing the application of irrigation include hand water-ing, modifying irrigation scheduling, and the use of moisture sensors.
Another common management strategy used to maintain turfgrass con-ditions is overseeding. Overseeding is the practice of applying cool-season turfgrass seed over existing warm-season turfgrass so that it germinates and grows-in as the existing turfgrass goes dormant. This is common in particular for turfgrass varieties such as Bermuda grass (GCSAA, 2016). Without over-seeding, turfgrass in southern climates turns brown during winter months, losing much of its appeal to golfers, both aesthetically, as well as in terms of turf conditions. The process of overseeding requires significant amounts of water, and therefore many facilities pursue strategic reductions in overseeding to balance water conservation with economic viability of the course during peak season winter months. Survey respondents were asked to provide the average number of acres overseeded in 2009 and 2014. On average, there was a reduction from 89 acres overseeded in 2009 to 76 acres overseeded in 2014 (Figure 29).
Overseeding was most commonly practiced on fairways, followed by greens. Fewer respondents indicated overseeding rough areas of the course, and even fewer indicated overseeding wall-to-wall (Figure 30). The fewest respondents indicated painting or coloring greens instead of overseeding. These results indicate that most respondents are overseeding in areas that are higher priority for play, and less frequently overseeding in areas purely for aesthetics. Overseeding primarily in high-priority areas for play is associated with water conservation (both proactively as well as in response to water supply restrictions and high water prices), though it also can be a response to fewer golf course maintenance staff in the face of tightening budgets.
Figure 28. Use of Turfgrass Management Strategies (Response Count), 2014
Water treatment or recirculation system for fertilizer or pesticide applicationsEliminated irrigation in selected areas
Walk mowed greensReduced rough or fairway irrigation
Used in-ground moisture sensors and/or hand-held moisture metersRaised mowing heights
Modified current irrigation systemInstalled or improved drainage systems on the golf course on fairways, greens, bunkers
Used automated weather stationsModified irrigation scheduling to manage insects, weeds, or diseases
Hand watered greens and/or area in fairwaysAdjusted fertilization practices
Scouted for insect pests, weeds, and diseasesSoil wetting agent
Aerified fairways and/or greens
0 10 20 30 40 50 60 70 80 90 100
Number of A�irmative Responses
Turf
gras
s Man
agem
ent S
trat
egy

Water and Conservation Practices
Contribution of the Golf Industry to the Arizona Economy 45
Figure 29. Average Acreage Overseeded in 2009 and 2014
89.3
75.8
65
70
75
80
85
90
95
2009 2014
n = 74
Aver
age
Acre
s Ove
rsee
ded
Figure 30. Overseeding Practices (Response Count)
0
10
20
30
40
50
60
70
OverseedingRough Areas
OverseedingGreens
OverseedingFairways
OverseedWall-to-Wall
Paint or ColorGreens insteadof Overseeding
Overseeding Practice
Num
ber o
f A�i
rmat
ive
Resp
onse
s
Irrigation AuditsIrrigation audits are a strategy to reduce irrigation inefficiencies and losses,
and reduce spending on irrigation water. Survey respondents were asked to indicate if their facility had performed an irrigation audit in the past 5 years, and if so, whether adjustments were made to the system and whether there were any resulting water savings. Just over a half of respondents indicated that their facility had performed an irrigation audit in the past five years (Fig-ure 31). Of that half, 95% made adjustments to their irrigation systems, for an average irrigation water savings of 19.5 AF per year.
Figure 31. Irrigation Audit Performed in Past 5 Years and Resulting Water Savings, 2014
Irrigation AuditPerformed?
n=89
Yes
51%
AdjustmentsMade95%
Average AnnualWater Savings
19.5 AF
No AdjustmentsMade
5%
No
49%
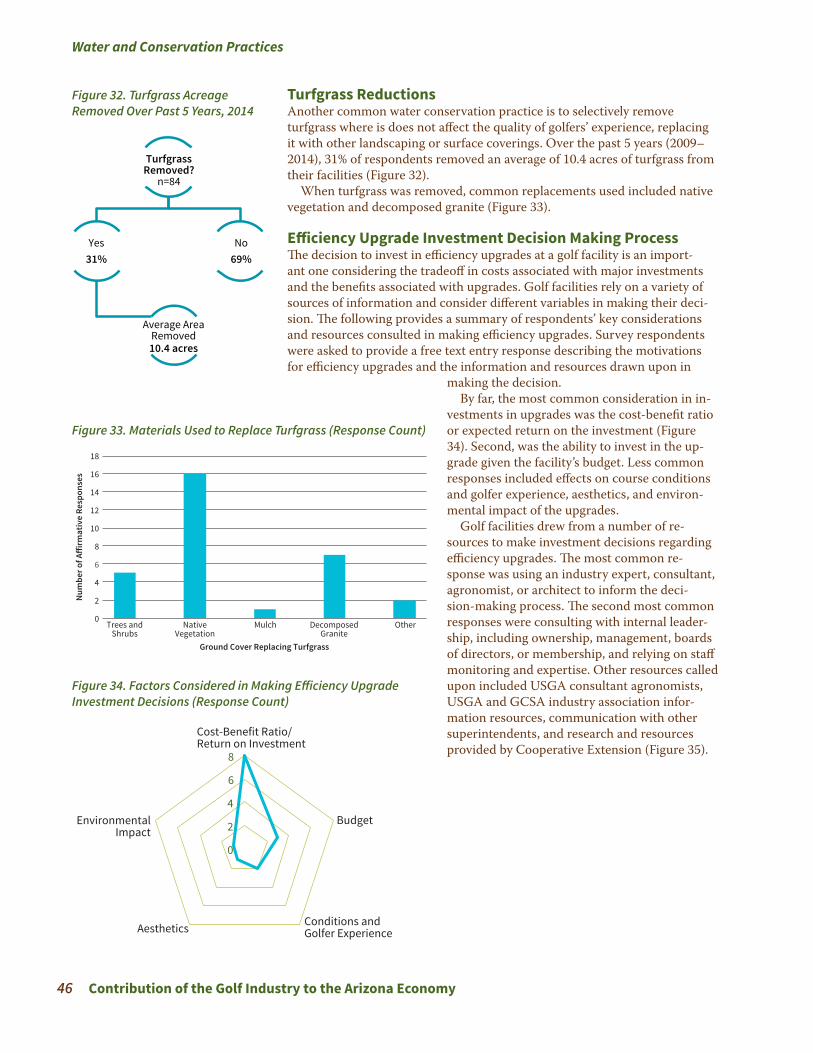
Water and Conservation Practices
46 Contribution of the Golf Industry to the Arizona Economy
Turfgrass ReductionsAnother common water conservation practice is to selectively remove turfgrass where is does not affect the quality of golfers’ experience, replacing it with other landscaping or surface coverings. Over the past 5 years (2009–2014), 31% of respondents removed an average of 10.4 acres of turfgrass from their facilities (Figure 32).
When turfgrass was removed, common replacements used included native vegetation and decomposed granite (Figure 33).
Efficiency Upgrade Investment Decision Making ProcessThe decision to invest in efficiency upgrades at a golf facility is an import-ant one considering the tradeoff in costs associated with major investments and the benefits associated with upgrades. Golf facilities rely on a variety of sources of information and consider different variables in making their deci-sion. The following provides a summary of respondents’ key considerations and resources consulted in making efficiency upgrades. Survey respondents were asked to provide a free text entry response describing the motivations for efficiency upgrades and the information and resources drawn upon in
Figure 32. Turfgrass Acreage Removed Over Past 5 Years, 2014
TurfgrassRemoved?
n=84
Yes31%
Average AreaRemoved10.4 acres
No69%
Figure 33. Materials Used to Replace Turfgrass (Response Count)
0
2
4
8
10
12
14
16
18
Trees andShrubs
NativeVegetation
Mulch DecomposedGranite
Other
Ground Cover Replacing Turfgrass
Num
ber o
f A�i
rmat
ive
Resp
onse
s
6
Figure 34. Factors Considered in Making Efficiency Upgrade Investment Decisions (Response Count)
0
2
4
6
8
Cost-Benefit Ratio/Return on Investment
Budget
Conditions andGolfer ExperienceAesthetics
EnvironmentalImpact
making the decision.By far, the most common consideration in in-
vestments in upgrades was the cost-benefit ratio or expected return on the investment (Figure 34). Second, was the ability to invest in the up-grade given the facility’s budget. Less common responses included effects on course conditions and golfer experience, aesthetics, and environ-mental impact of the upgrades.
Golf facilities drew from a number of re-sources to make investment decisions regarding efficiency upgrades. The most common re-sponse was using an industry expert, consultant, agronomist, or architect to inform the deci-sion-making process. The second most common responses were consulting with internal leader-ship, including ownership, management, boards of directors, or membership, and relying on staff monitoring and expertise. Other resources called upon included USGA consultant agronomists, USGA and GCSA industry association infor-mation resources, communication with other superintendents, and research and resources provided by Cooperative Extension (Figure 35).
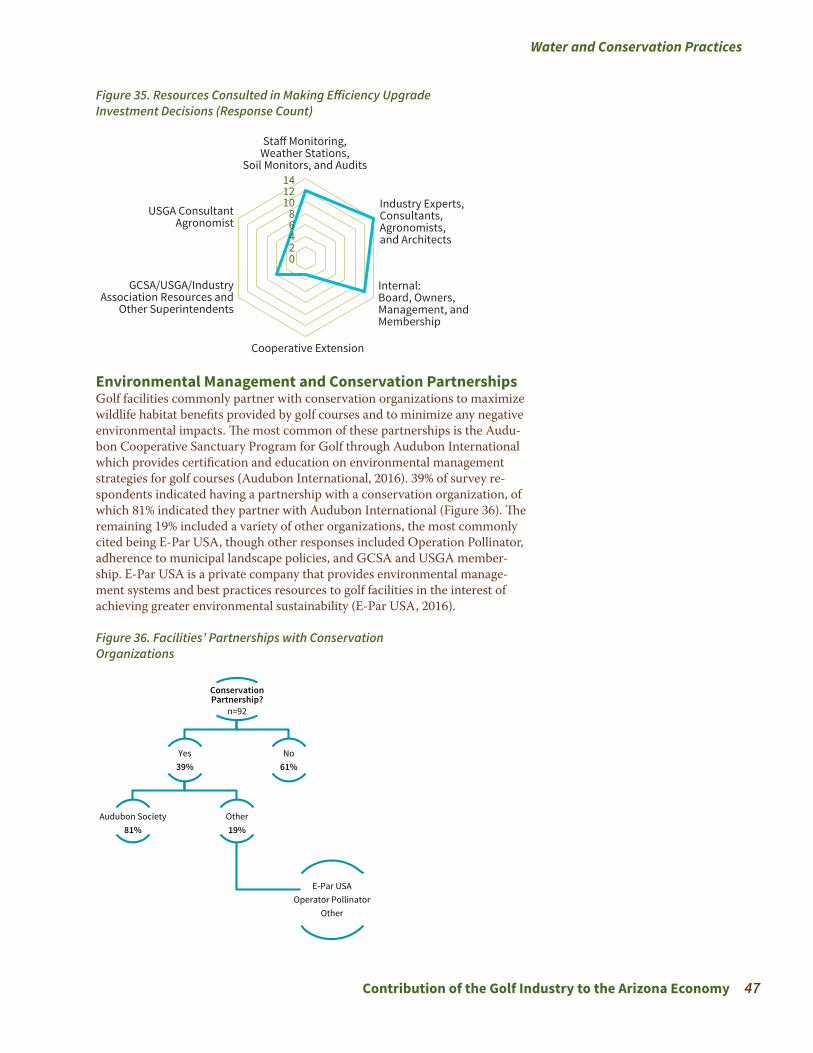
Water and Conservation Practices
Contribution of the Golf Industry to the Arizona Economy 47
Figure 36. Facilities’ Partnerships with Conservation Organizations
ConservationPartnership?
n=92
Yes39%
Audubon Society81%
Other19%
E-Par USAOperator Pollinator
Other
No61%
Figure 35. Resources Consulted in Making Efficiency Upgrade Investment Decisions (Response Count)
02468
101214
Sta� Monitoring,Weather Stations,
Soil Monitors, and Audits
Industry Experts,Consultants,Agronomists,and Architects
Internal: Board, Owners, Management, and Membership
Cooperative Extension
GCSA/USGA/IndustryAssociation Resources and
Other Superintendents
USGA ConsultantAgronomist
Environmental Management and Conservation PartnershipsGolf facilities commonly partner with conservation organizations to maximize wildlife habitat benefits provided by golf courses and to minimize any negative environmental impacts. The most common of these partnerships is the Audu-bon Cooperative Sanctuary Program for Golf through Audubon International which provides certification and education on environmental management strategies for golf courses (Audubon International, 2016). 39% of survey re-spondents indicated having a partnership with a conservation organization, of which 81% indicated they partner with Audubon International (Figure 36). The remaining 19% included a variety of other organizations, the most commonly cited being E-Par USA, though other responses included Operation Pollinator, adherence to municipal landscape policies, and GCSA and USGA member-ship. E-Par USA is a private company that provides environmental manage-ment systems and best practices resources to golf facilities in the interest of achieving greater environmental sustainability (E-Par USA, 2016).

Summary and Conclusions
48 Contribution of the Golf Industry to the Arizona Economy
Summary and ConclusionsThis report presents an analysis of the golf industry’s contribution to Ari-zona’s economy and its influence on the environment including water use, conservation practices, as well as recent trends in both measures. Arizona’s golf industry had a total estimated economic contribution of $3.9 billion in sales (output) to the state economy in 2014. This includes the direct, indirect, and induced effects of golf course operations ($2.5 billion), golf tourism ($1.1 billion), and golf-related businesses ($347 million).
Golf facility operations had a direct contribution of $1.1 billion in sales to the state economy. 18,700 full- and part-time jobs were directly supported by golf facility operations, earning more than $623 million in wages, salaries, and business income. Including multiplier effects, the total contribution was $2.5 billion in sales, $1.4 billion in value added (gross state product), and approx-imately 29,500 full- and part-time jobs. An estimated 11.6 million rounds of golf were played in Arizona in 2014.
Arizona’s golf courses attract visitors from around the country and globe to play golf and spectate at professional tournaments. About one-third of rounds played in Arizona are by visitors from out-of-state, bringing in an estimated $598 million in tourist spending. In total, golf tourism’s impact to the state economy was an estimated $1.1 billion in sales and approximately 10,500 jobs in 2014.
Finally, golf-related businesses provide equipment, apparel, and other goods and services to in-state golfers, who constituted roughly two-thirds of rounds played in 2014. These businesses represented an estimated $270 million in annual sales, primarily in retail industries, and nearly 1,200 jobs. Including multiplier effects, the total contribution of golf-related businesses was $347 million in sales and nearly 1,800 jobs.
Other effects of the golf industry are not best measured using regional economic contribution analysis. These effects include the influence of golf courses on residential real estate values and natural resource use and con-servation. The study provides an update to a 2004 estimate of residential real estate premiums attributable to frontage on and proximity to golf courses. Accounting for changes in the real estate market and new construction since 2004, residential real estate premiums associated with all homes ever built in golf course communities in Arizona was estimated to be nearly $2.1 billion.
Finally, the study provides a snapshot of golf water use and conservation and management practices at Arizona golf facilities, drawing upon survey results and government water use data. According to survey results, Arizona golf facilities, statewide, used an estimated 167,397 AF of irrigation water in 2014, occupying a total of 45,000 acres for the golf courses, of which 32,000 acres was turfgrass. Survey estimates suggest that 35% of golf water use was effluent in 2014. According to USGS data for 2010, 130,116 AF of self-sup-plied freshwater was used to irrigate golf courses, accounting for 1.9% of Arizona’s total freshwater (groundwater and surface water) withdrawals. Golf irrigation accounted for 3% of state groundwater withdrawals and 1.1% of state surface water withdrawals in 2010. An additional 49,488 AF of reclaimed wastewater was used for golf course irrigation in 2010, accounting for 28% of golf ’s total statewide water use. AMAs encompass most major urban areas of the state and roughly 80% of golf facilities statewide. Golf course irrigation represented 3.5% of total AMA water use in Arizona in 2014, according to the ADWR. In 2014, groundwater represented 48.1% of AMA golf water use, sur-face water, 10.9%, CAP, 14.6%, and effluent, 26.3%. Whereas some AMAs rely on a varied mix of water sources, others rely heavily on one or two sources,

Summary and Conclusions
Contribution of the Golf Industry to the Arizona Economy 49
such as effluent or groundwater. Between 2004 and 2014 the ADWR reported a net increase of 24,736 AF of golf facility water use in Arizona’s AMAs, with all types of water use increasing. During that time, the number of facilities in Arizona’s AMAs also increased, from 239 facilities to 252 facilities. Use of effluent in AMAs was 33,977 AF in 2014, increasing by 27% (from 26,675 AF) since 2004.
Conservation efforts at golf facilities aim to balance the use of natural re-sources with the economic viability of the courses. Arizona golf facilities em-ploy a variety of water conservation strategies on their golf courses, invest in efficiency upgrades by consulting with industry experts and other resources in their decision-making process, and commonly partner with conservation organizations to institute best practices for wildlife management and promot-ing sustainability. 51% of responding facilities reported performing irrigation audits for their golf course irrigation systems in the previous 5 years, 95% of which made adjustments to their irrigation systems, for an average irriga-tion water savings of 19.5 AF of water per facility per year. 31% of facilities reported having removed turfgrass in the past 5 years. Another 39% reported having a partnership with conservation organizations, most commonly with Audubon International.

References
50 Contribution of the Golf Industry to the Arizona Economy
ReferencesArizona Department of Water Resources (2016). Active Management Areas
(AMAs) & irrigation Non-expansion Areas (INAs). Accessed at http://www.azwater.gov/AzDWR/WaterManagement/AMAs/.
Arizona Office of Tourism (2013). Golf Travel Outlook—U.S. and Arizona Market Trends.
Arizona Republic (2016). Waste Management Phoenix Open Attendance Records. Arizona Republic. February 7, 2016. Accessed at http://www.azcentral.com/story/sports/golf/phoenix-open/2015/01/21/waste-man-agement-phoenix-open-attendance-records/22116155/
Asabere & Huffman (1996). Negative and positive impacts of golf course proximity on home prices. The Appraisal Journal.
Audubon International (2016). Audubon Cooperative Sanctuary Program for Golf. Accessed at http://www.auduboninternational.org/acspgolf
Bark, R., et al (2011). How Do Homebuyers Value Different Types of Green Space? Journal of Agricultural and Resource Economics, 36(2):395–415.
Brown, Paul & George Frisvold (2016). Turfgrass in Arizona: Water Require-ments & Economic Impact. University of Arizona Cooperative Exten-sion. Accessed at https://extension.arizona.edu/sites/extension.arizona.edu/files/attachments/w.BOS_Brown_Turfgrass%20in%20Az.Water%20Requirements%20and%20Economic%20Impacts.pdf
Davis, John (2014a). LPGA returns to northeast Phoenix. Arizona Republic. March 21, 2014. Accessed at http://www.azcentral.com/story/sports/golf/2014/03/19/lpga-returns-northeast-phoenix/6611407/
Davis, John (2014b). Desert Mountain gets high marks as host of Charles Schwab Cup. Arizona Republic. November 4, 2014. Accessed at http://www.azcentral.com/story/sports/golf/2014/11/04/desert-mountain-gets-high-marks-host-charles-schwab-cup-championship/18469299/
Do & Grudnitski (1995). Golf courses and residential house prices: An em-pirical examination. Journal of Real Estate Finance & Economics, Vol 10 No 3.
E-Par USA (2016). EMS for Golf Course Maintenance. Accessed at http://www.eparusa.com/pages/GolfCourseMaintenance
Gale (2016). “Sporting Goods Equipment Market, 2013.” Market Share Re-porter. Ed. Robert S. Lazich. 2016 ed. Farmington Hills, MI: Gale, 2016. Business Insights: Essentials. Web. 16 Nov. 2016.
GCSAA (2016). Overseeding: darned if you do and darned if you don’t. Ac-cessed at https://www.gcsaa.org/course/communication/information-forgolfers/overseeding-darned-if-you-do-and-darned-if-you-don-t

References
Contribution of the Golf Industry to the Arizona Economy 51
Grudnitski (2003). Golf course communities: the effect of course type on housing prices. The Appraisal Journal, April 2003.
Grudnitski & Do (1997). Adjusting the value of houses located on a golf course. The Appraisal Journal, Vol 65 No 3.
Hueber, David & Elaine Worzala (2010). “Code Blue” for U.S. Golf Course Real Estate Development: “Code Green” for Sustainable Golf Course Redevelopment. Prepared for the Journal of Sustainable Real Estate. Richard H. Pennel Center for Real Estate Development, Clemson Uni-versity.
Keegan, Jim (2010). Surge in Privatization of Municipal Golf Courses. Golf Operator Magazine. December 21, 2010. Accessed at http://golfopera-tormagazine.com/surge-in-privatization-of-municipal-golf-courses/.
Larson, E.K. & C. Perrings (2013). The value of water-related amenities in an arid city: The case of the Phoenix metropolitan area. Landscape and Urban Planning, Vol 209, pp 45–55.
Maupin, M.A., Kenny, J.F., Hutson, S.S., Lovelace, J.K., Barber, N.L., and Linsey, K.S., 2014, Estimated use of water in the United States in 2010: U.S. Geological Survey Circular 1405, 56 p., http://dx.doi.org/10.3133/cir1405
Mokwa, Michael, et al (2012). 2012 Waste Management Phoenix Open Eco-nomic Impact Study. ASU W.P. Carey School of Business, Arizona State University.
NGF (2013). 2012 Golf Course Openings & Closures Update. February 2013.
Nicholls & Crompton (2007). The Impact of a Golf Course on Residential Property Values. Journal of Sport Management, Vol 21.
Reitman, John (2014). Construction, play, number of golfers decline in 2013. January 31, 2014. Turfnet.com. Accessed at http://www.turfnet.com/news.html/_/construction-play-number-of-golfers-decline-in-2013-r249
Schmitz, Troy (2006). Economic and Environmental Impact of Golf. Morri-son School of Agribusiness and Resource Management, Arizona State University.
Schultz, S. & D. King (2001). The Use of Census Data for Hedonic Price Es-timates of Open-Space Amenities and Land Use. Journal of Real Estate Finance and Economics, 22:2/3, 239–252.
Seo, K., A. Golub, & M. Kuby (2014). Combined impacts of highways and light rail transit on residential property values: a spatial hedonic price model for Phoenix, Arizona. Journal of Transport Geography, Vol 41, pp 53–62.
Sports & Leisure Research Group (2016). Golf Market Consumer Assessment Research. Prepared for Visit Tucson. July 2016.

References
52 Contribution of the Golf Industry to the Arizona Economy
US Census Bureau (2016). Introduction to NAICS. Accessed at http://www.census.gov/eos/www/naics/.
U.S. Geological Survey (USGS) (2016). Estimated Use of Water in the United States: County-Level Data for 2010. http://water.usgs.gov/watuse/data/2010/index.html Accessed 11/19/2016.
Young, Bob (2012). Golf has deep roots in state’s history. Arizona Republic. Feb. 11, 2012. Accessed at http://archive.azcentral.com/sports/golf/arti-cles/20120212golf-arizona-centennial-history.html

Glossary and Acronyms
Contribution of the Golf Industry to the Arizona Economy 53
Glossary and AcronymsADWR—Arizona Department of Water Resources
AF—Acre-Foot: a measure of water equivalent to the amount of water needed to cover an acre one foot deep with water
AMA—Active Management Area: Designated areas in Arizona with heavy reliance on groundwater that are subject to regulation according to Arizona’s Groundwater Code (ADWR, 2016)
CAP—Central Arizona Project
CMAA—Club Managers Association of America
GCSA—Golf Course Superintendents Association
GDP—Gross Domestic Product
GSP—Gross State Product
IMPLAN—IMpacts for PLANning: Regional input-output model developed by IMPLAN Group, premier software and data package used for re-gional economic impact and contribution analysis
NAICS Code—North American Industry Classification System code: 2 to 6 digit codes used for purposes of classifying business entities by their primary industry in government statistics (US Census Bureau, 2016)
NGF—National Golf Foundation
PGA—Professional Golf Association
SIC Code—Standard Industry Classification Code: Industry classification codes later replaced by NAICS codes
SRP—Salt River Project
USGA—United States Golf Association
USGS—United States Geological Survey

Appendices
54 Contribution of the Golf Industry to the Arizona Economy
AppendicesAppendix A: Survey Instrument
1
Ariz
ona
Golf
Faci
lity
Surv
ey
The
follo
win
g su
rvey
pre
sent
s a se
ries
of q
uest
ions
rega
rdin
g go
lf fa
cilit
y op
erat
ions
in A
rizo
na in
cale
ndar
ye
ar 2
014.
Thi
s is a
one
-‐tim
e on
line
surv
ey w
hich
take
s app
roxi
mat
ely
20 m
inut
es to
com
plet
e. Q
uest
ions
are
ta
ilore
d to
you
r rol
e(s)
at t
he fa
cilit
y an
d th
e in
form
atio
n yo
u pr
ovid
e w
ill b
e us
ed in
agg
rega
te fo
rm to
hel
p us
und
erst
and
the
econ
omic
cont
ribu
tion
of th
e go
lf in
dust
ry to
the
stat
e of
Ari
zona
. Thi
s sur
vey
is
dist
ribu
ted
to th
e fo
llow
ing
thre
e in
divi
dual
s at e
ach
golf
cour
se fa
cilit
y in
Ari
zona
(for
def
initi
ons o
f rol
es,
plea
se h
over
curs
or o
ver e
ach
title
):
• Ge
nera
l Man
ager
/ D
irec
tor
of C
lub
Ope
rati
ons
Ques
tions
cove
r gol
f fac
ility
ope
ratio
ns, i
nclu
ding
reve
nues
and
exp
ense
s, ca
pita
l inv
estm
ent a
nd
cons
truc
tion,
em
ploy
men
t, an
d go
lf pl
ay
• Go
lf Co
urse
Sup
erin
tend
ent /
Dir
ecto
r of
Agr
onom
y Qu
estio
ns co
ver m
aint
enan
ce e
xpen
ditu
res,
golf
cour
se re
nova
tions
, gol
f cou
rse
wat
er u
se a
nd
irri
gatio
n, tu
rfgr
ass m
anag
emen
t pra
ctic
es, a
nd co
nser
vatio
n pr
actic
es
• H
ead
Golf
Prof
essi
onal
/ D
irec
tor
of G
olf
Ques
tions
cove
r gol
f sho
p re
venu
es a
nd e
xpen
ses,
golf
tour
nam
ents
, gol
f les
sons
, and
char
itabl
e gi
ving
It m
ay b
e he
lpfu
l to
have
201
4 fin
anci
al in
form
atio
n re
leva
nt to
you
r rol
e at
the
faci
lity
on h
and
in a
nsw
erin
g so
me
of th
e qu
estio
ns.
Your
par
ticip
atio
n in
this
surv
ey is
vol
unta
ry a
nd if
at a
ny ti
me
you
wis
h to
stop
, you
are
free
to d
o so
. All
surv
ey a
nsw
ers a
re a
nony
mou
s.
Thank you for your participation!
** G
ENER
AL F
ACIL
ITY
INFO
RMAT
ION
**
The fo
llowin
g se
ctio
n in
clud
es gen
eral
que
stio
ns abo
ut th
e go
lf fa
cilit
y. If
the go
lf fa
cilit
y in
clud
es m
ultip
le gol
f co
urse
s, pl
ease
resp
ond fo
r the
ent
ire go
lf fa
cilit
y.
Num
ber
of g
olf c
ours
es a
t thi
s go
lf fa
cilit
y:
0
1
2
3
4
5
6
7
8
9
10
I pre
fer
not t
o re
spon
d
Num
ber o
f 9-‐h
ole
cour
ses
m
m
m
m
m
m
m
m
m
m
m
m
Num
ber o
f 18-‐
hole
cour
ses
m
m
m
m
m
m
m
m
m
m
m
m
Othe
r (pl
ease
spec
ify)
m
m
m
m
m
m
m
m
m
m
m
m
Type
of g
olf f
acili
ty:

Appendices
Contribution of the Golf Industry to the Arizona Economy 55
2
m
Publ
ic
m
Sem
i-‐pri
vate
m
Pr
ivat
e m
I p
refe
r not
to re
spon
d m
Ot
her (
plea
se sp
ecify
): __
____
____
____
____
__
The
golf
faci
lity
is lo
cate
d w
ithi
n: (p
leas
e se
lect
all
that
app
ly)
q
A re
side
ntia
l rea
l est
ate
deve
lopm
ent (
incl
udin
g re
tirem
ent c
omm
uniti
es o
r any
hou
sing
dev
elop
men
t)
q
A re
sort
q
A
park
or r
ecre
atio
n ar
ea (m
unic
ipal
, cou
nty,
etc
.) q
A
mili
tary
inst
alla
tion
q
Trib
al la
nd
q
Non
e of
the
abov
e q
I p
refe
r not
to re
spon
d q
Ot
her (
plea
se sp
ecify
): __
____
____
____
____
__
Is y
our
golf
faci
lity
man
aged
by
a th
ird-‐
part
y m
anag
emen
t com
pany
?
m
Yes
m
No
In w
hich
Ari
zona
cou
nty
is y
our
faci
lity
loca
ted?
m
Apac
he
m
Coch
ise
m
Coco
nino
m
Gi
la
m
Grah
am
m
Gre
enle
e
m
La P
az
m
Mar
icop
a m
M
ohav
e m
N
avaj
o m
Pi
ma
m
Pina
l
m
Sant
a Cr
uz
m
Yava
pai
m
Yum
a m
I p
refe
r not
to re
spon
d
3
Year
that
the
golf
faci
lity
first
ope
ned
for
oper
atio
n: __
____
____
____
__
m
I do
not k
now
m
I p
refe
r not
to re
spon
d If
the
golf
faci
lity
open
ed in
201
4, h
ow m
any
mon
ths
was
it o
pera
tion
al d
urin
g th
at y
ear?
m
1 m
2
m
3 m
4
m
5 m
6
m
7 m
8
m
9 m
10
m
11
m
12
D
id y
our
golf
faci
lity
cons
truc
t a n
ew g
olf c
ours
e or
any
new
hol
es in
201
4? T
his q
uestio
n re
fers
on
ly to
NEW
con
stru
ctio
n, and
doe
s NOT
includ
e re
nova
tion
of E
XIST
ING
cour
ses o
r hol
es.
m
Yes
m
No
m
I pre
fer n
ot to
resp
ond
Plea
se in
dica
te y
our
role
(s) a
t the
gol
f fac
ility
. If y
ou s
erve
mul
tipl
e ro
les
at th
e go
lf fa
cilit
y (f
or e
xam
ple,
you
ser
ve a
s bo
th th
e ge
nera
l man
ager
and
sup
erin
tend
ent)
, ple
ase
sele
ct a
ll th
at a
pply
.
q
Gene
ral M
anag
er /
Dir
ecto
r of C
lub
Oper
atio
ns
q
Golf
Cour
se S
uper
inte
nden
t / D
irec
tor o
f Agr
onom
y q
H
ead
Golf
Prof
essi
onal
/ D
irec
tor o
f Gol
f Fo
r go
lf fa
cilit
ies
and/
or g
olf c
ours
es th
at o
pene
d fo
r op
erat
ion
in 2
014
or 2
015,
ple
ase
prov
ide
esti
mat
es o
f all
cons
truc
tion
cos
ts in
curr
ed in
cal
enda
r ye
ar 2
014:
Tota
l con
stru
ctio
n co
sts
____
____
____
____
Go
lf co
urse
____
____
____
____
Cl
ubho
use
____
____
____
____
Al
l Oth
er
____
____
____
____
Tota
l gol
f cou
rse
cons
truc
tion
cos
ts in
201
4: __
____
____
____
__
**TH
ESE
QU
ESTI
ON
S AR
E FO
R T
HE
HEA
D G
OLF
PR
OFE
SSIO
NAL
/ D
IREC
TOR
OF
GOLF
**
Plea
se ans
wer
que
stio
ns w
ith re
gard
s to th
e go
lf sh
op you
man
age an
d/or
own
Plea
se in
dica
te th
e na
ture
of y
our
empl
oym
ent r
elat
ions
hip
wit
h th
e go
lf fa
cilit
y
m
I am
dir
ectly
em
ploy
ed b
y th
e go
lf fa
cilit
y m
I o
wn
and
oper
ate
the
golf
shop
m
Ot
her (
plea
se sp
ecify
) ___
____
____
____
____
_

Appendices
56 Contribution of the Golf Industry to the Arizona Economy
4
Incl
udin
g yo
urse
lf, h
ow m
any
indi
vidu
als
are
empl
oyed
at t
he g
olf s
hop?
Full-‐
time
____
____
____
____
Pa
rt-‐t
ime
____
____
____
____
Plea
se in
dica
te w
hich
of t
he fo
llow
ing
good
s an
d se
rvic
es y
our
golf
shop
pro
vide
s:
q
Equi
pmen
t and
app
arel
sale
s q
Eq
uipm
ent r
enta
l q
Eq
uipm
ent r
epai
r q
Le
sson
s q
Lo
cker
rent
al
The fo
llowin
g se
ctio
n as
ks que
stio
ns abo
ut re
venu
es and
exp
ense
s for
the go
lf sh
op
It m
ay be he
lpfu
l to ha
ve 201
4 fin
ancial
reco
rds f
or th
e go
lf sh
op ava
ilabl
e in
filli
ng out
this se
ctio
n of
th
e su
rvey
. App
roxim
ate va
lues
are
acc
epta
ble.
Plea
se e
stim
ate
the
brea
kdow
n of
rev
enue
s fo
r th
e go
lf sh
op, e
ithe
r as
dol
lar
valu
es o
r pe
rcen
tage
s. P
leas
e co
mpl
ete
only
one
colu
mn.
Do
llar V
alue
($
) Pe
rcen
t of T
otal
Rev
enue
s (%
) H
ard
good
s
Soft
good
s
Equi
pmen
t ren
tal (
club
s, ca
rt, l
ocke
r, ba
g st
orag
e,
etc.)
Othe
r (ex
. Equ
ipm
ent r
epai
r, bo
oks,
vide
os, e
tc.)
Plea
se e
stim
ate
the
num
ber
of p
aid
half
hour
less
ons
give
n by
gol
f fac
ility
per
sonn
el in
201
4:
____
____
____
___
Plea
se e
stim
ate
the
brea
kdow
n of
exp
ense
s fo
r th
e go
lf sh
op, e
ithe
r as
dol
lar
valu
es o
r pe
rcen
tage
s. P
leas
e co
mpl
ete
only
one
colu
mn.
Ex
pens
es ($
) Pe
rcen
t of T
otal
Exp
ense
s (%
) H
ard
good
s
Soft
good
s
Equi
pmen
t ren
tal (
club
s, ca
rt, l
ocke
r, ba
g st
orag
e,
etc.)
5
Othe
r (ex
. Equ
ipm
ent r
epai
r, bo
oks,
vide
os, e
tc.)
In r
egar
ds to
tota
l gol
f sho
p ex
pend
itur
es o
n ha
rd a
nd s
oft g
ood
mer
chan
dise
, wha
t is
the
perc
enta
ge p
urch
ased
from
Ari
zona
sup
plie
rs (e
x: P
ing,
AM
&E)
? An
app
roxi
mat
e pe
rcen
tage
is
acce
ptab
le. _
____
____
____
The ne
xt se
ctio
n re
late
s to to
urna
men
t eve
nts h
eld at
you
r gol
f fac
ility
Did
you
r go
lf fa
cilit
y ho
ld a
ny to
urna
men
t eve
nts
in 2
014?
m
Yes
m
No
Num
ber
of g
olf t
ourn
amen
ts o
f any
siz
e th
at w
ere
host
ed a
t you
r go
lf fa
cilit
y in
201
4:
Tota
l num
ber o
f tou
rnam
ents
____
____
____
_ Du
ring
the
peak
seas
on
__
____
____
___
Duri
ng th
e of
f-‐pea
k se
ason
____
____
____
_ Du
ring
the
shou
lder
seas
on(s
)
____
____
____
_
Plea
se e
stim
ate
the
reve
nues
gen
erat
ed th
roug
h to
urna
men
ts in
201
4:
Reve
nues
gen
erat
ed fo
r fac
ility
thro
ugh
PROF
ESSI
ONAL
tour
nam
ents
__
____
____
___
Reve
nues
gen
erat
ed fo
r fac
ility
thro
ugh
ALL
OTH
ER to
urna
men
ts
__
____
____
___
Plea
se e
stim
ate
the
tota
l num
ber
of s
pect
ator
s at
tend
ing
prof
essi
onal
tour
nam
ent e
vent
(s) i
n 20
14, i
f app
licab
le: _
____
____
____
Perc
enta
ge o
f tou
rnam
ents
hel
d in
201
4 ho
sted
by
a gr
oup
who
se p
urpo
se w
as to
rai
se m
oney
fo
r a
char
itab
le c
ause
: ___
____
____
__
Plea
se e
stim
ate
char
itab
le c
ontr
ibut
ions
mad
e by
the
golf
faci
lity
in 2
014:
Estim
ated
reve
nue
(cas
h co
ntri
butio
ns) g
ener
ated
for c
hari
ties _
____
____
_ Es
timat
ed m
onet
ary
valu
e of
in-‐k
ind
cont
ribu
tions
to ch
ariti
es (f
ree
golf
roun
ds, f
ree
less
ons,
etc.)
____
____
_
**TH
E FO
LLO
WIN
G Q
UES
TIO
NS
ARE
FOR
THE
GEN
ERAL
MAN
AGER
/ D
IREC
TOR
OF
CLU
B O
PER
ATIO
NS*
*
If th
e go
lf fa
cilit
y in
clud
es m
ultip
le gol
f cou
rses
, pleas
e re
spon
d fo
r the
ent
ire go
lf fa
cilit
y (a
ll go
lf co
urse
s, club
hous
e, gol
f sho
p, etc
.)
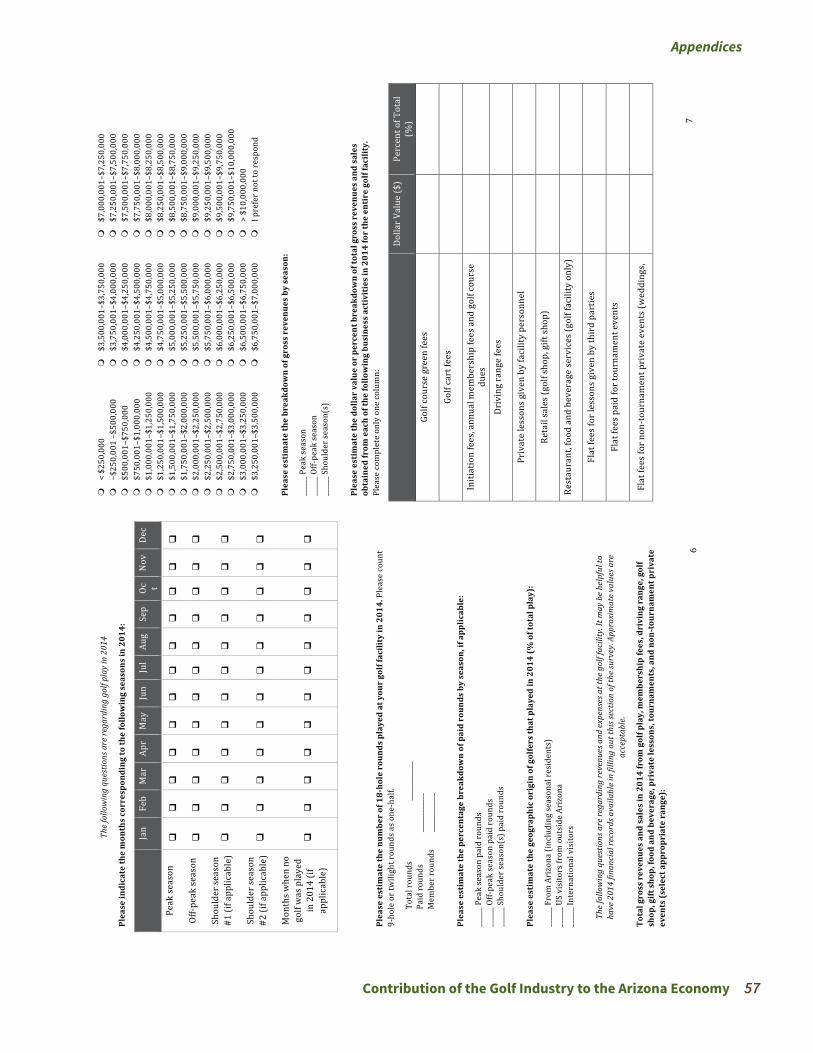
Appendices
Contribution of the Golf Industry to the Arizona Economy 57
6
The fo
llowin
g qu
estio
ns are
rega
rdin
g go
lf pl
ay in
201
4
Plea
se in
dica
te th
e m
onth
s co
rres
pond
ing
to th
e fo
llow
ing
seas
ons
in 2
014:
Ja
n
Feb
M
ar
Apr
May
Ju
n
Jul
Aug
Se
p
Oc t N
ov
Dec
Peak
seas
on
q
q
q
q
q
q
q
q
q
q
q
q
Off-‐p
eak
seas
on
q
q
q
q
q
q
q
q
q
q
q
q
Shou
lder
seas
on
#1 (i
f app
licab
le)
q
q
q
q
q
q
q
q
q
q
q
q
Shou
lder
seas
on
#2 (i
f app
licab
le)
q
q
q
q
q
q
q
q
q
q
q
q
Mon
ths w
hen
no
golf
was
pla
yed
in 2
014
(if
appl
icab
le)
q
q
q
q
q
q
q
q
q
q
q
q
Plea
se e
stim
ate
the
num
ber
of 1
8-‐ho
le r
ound
s pl
ayed
at y
our
golf
faci
lity
in 2
014.
Ple
ase
coun
t 9-‐
hole
or t
wili
ght r
ound
s as o
ne-‐h
alf.
Tota
l rou
nds
__
____
____
__
Paid
roun
ds
____
____
____
M
embe
r rou
nds
____
____
____
Plea
se e
stim
ate
the
perc
enta
ge b
reak
dow
n of
pai
d ro
unds
by
seas
on, i
f app
licab
le:
____
__ P
eak
seas
on p
aid
roun
ds
____
__ O
ff-‐pe
ak se
ason
pai
d ro
unds
__
____
Sho
ulde
r sea
son(
s) p
aid
roun
ds
Plea
se e
stim
ate
the
geog
raph
ic o
rigi
n of
gol
fers
that
pla
yed
in 2
014
(% o
f tot
al p
lay)
:
____
__ F
rom
Ari
zona
(inc
ludi
ng se
ason
al re
side
nts)
__
____
US
visi
tors
from
out
side
Ari
zona
__
____
Inte
rnat
iona
l vis
itors
The fo
llowin
g qu
estio
ns are
rega
rdin
g re
venu
es and
exp
ense
s at t
he gol
f fac
ility
. It m
ay be he
lpfu
l to
have
201
4 fin
ancial
reco
rds a
vaila
ble in
filli
ng out
this se
ctio
n of
the su
rvey
. App
roxim
ate va
lues
are
ac
cept
able.
Tota
l gro
ss r
even
ues
and
sale
s in
201
4 fr
om g
olf p
lay,
mem
bers
hip
fees
, dri
ving
ran
ge, g
olf
shop
, gift
sho
p, fo
od a
nd b
ever
age,
pri
vate
less
ons,
tour
nam
ents
, and
non
-‐tou
rnam
ent p
riva
te
even
ts (s
elec
t app
ropr
iate
ran
ge):
7
m
< $2
50,0
00
m
–$25
0,00
1 –$
500,
000
m
$500
,001
–$75
0,00
0 m
$7
50,0
01–$
1,00
0,00
0 m
$1
,000
,001
–$1,
250,
000
m
$1,2
50,0
01–$
1,50
0,00
0 m
$1
,500
,001
–$1,
750,
000
m
$1,7
50,0
01–$
2,00
0,00
0 m
$2
,000
,001
–$2,
250,
000
m
$2,2
50,0
01–$
2,50
0,00
0 m
$2
,500
,001
–$2,
750,
000
m
$2,7
50,0
01–$
3,00
0,00
0 m
$3
,000
,001
–$3,
250,
000
m
$3,2
50,0
01–$
3,50
0,00
0
m
$3,5
00,0
01–$
3,75
0,00
0 m
$3
,750
,001
–$4,
000,
000
m
$4,0
00,0
01–$
4,25
0,00
0 m
$4
,250
,001
–$4,
500,
000
m
$4,5
00,0
01–$
4,75
0,00
0 m
$4
,750
,001
–$5,
000,
000
m
$5,0
00,0
01–$
5,25
0,00
0 m
$5
,250
,001
–$5,
500,
000
m
$5,5
00,0
01–$
5,75
0,00
0 m
$5
,750
,001
–$6,
000,
000
m
$6,0
00,0
01–$
6,25
0,00
0 m
$6
,250
,001
–$6,
500,
000
m
$6,5
00,0
01–$
6,75
0,00
0 m
$6
,750
,001
–$7,
000,
000
m
$7,0
00,0
01–$
7,25
0,00
0 m
$7
,250
,001
–$7,
500,
000
m
$7,5
00,0
01–$
7,75
0,00
0 m
$7
,750
,001
–$8,
000,
000
m
$8,0
00,0
01–$
8,25
0,00
0 m
$8
,250
,001
–$8,
500,
000
m
$8,5
00,0
01–$
8,75
0,00
0 m
$8
,750
,001
–$9,
000,
000
m
$9,0
00,0
01–$
9,25
0,00
0 m
$9
,250
,001
–$9,
500,
000
m
$9,5
00,0
01–$
9,75
0,00
0 m
$9
,750
,001
–$10
,000
,000
m
>
$10,
000,
000
m
I pre
fer n
ot to
resp
ond
Plea
se e
stim
ate
the
brea
kdow
n of
gro
ss r
even
ues
by s
easo
n:
____
__ P
eak
seas
on
____
__ O
ff-‐pe
ak se
ason
__
____
Sho
ulde
r sea
son(
s)
Plea
se e
stim
ate
the
dolla
r va
lue
or p
erce
nt b
reak
dow
n of
tota
l gro
ss r
even
ues
and
sale
s ob
tain
ed fr
om e
ach
of th
e fo
llow
ing
busi
ness
act
ivit
ies
in 2
014
for
the
enti
re g
olf f
acili
ty.
Plea
se co
mpl
ete
only
one
colu
mn:
Do
llar V
alue
($)
Perc
ent o
f Tot
al
(%)
Golf
cour
se g
reen
fees
Golf
cart
fees
Initi
atio
n fe
es, a
nnua
l mem
bers
hip
fees
and
gol
f cou
rse
dues
Driv
ing
rang
e fe
es
Priv
ate
less
ons g
iven
by
faci
lity
pers
onne
l
Reta
il sa
les (
golf
shop
, gift
shop
)
Rest
aura
nt, f
ood
and
beve
rage
serv
ices
(gol
f fac
ility
onl
y)
Flat
fees
for l
esso
ns g
iven
by
thir
d pa
rtie
s
Flat
fees
pai
d fo
r tou
rnam
ent e
vent
s
Flat
fees
for n
on-‐t
ourn
amen
t pri
vate
eve
nts (
wed
ding
s,
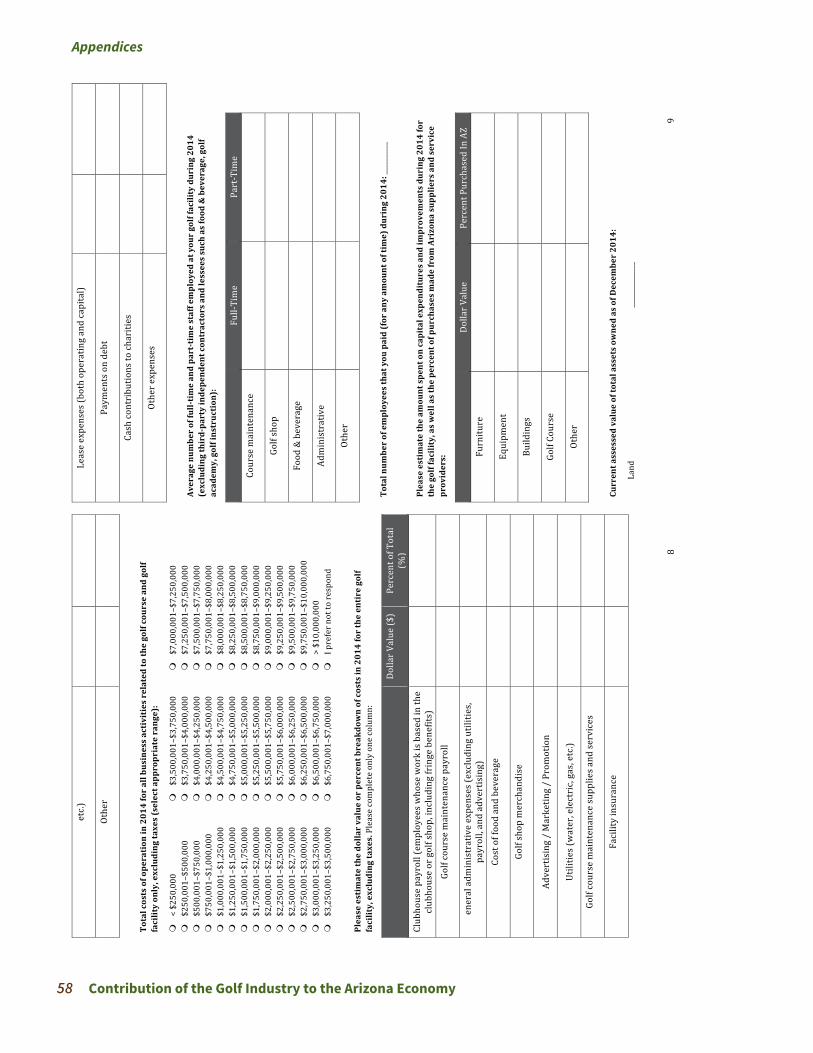
Appendices
58 Contribution of the Golf Industry to the Arizona Economy
8
etc.)
Othe
r
Tota
l cos
ts o
f ope
rati
on in
201
4 fo
r al
l bus
ines
s ac
tivi
ties
rel
ated
to th
e go
lf co
urse
and
gol
f fa
cilit
y on
ly, e
xclu
ding
taxe
s (s
elec
t app
ropr
iate
ran
ge):
m
< $2
50,0
00
m
$250
,001
–$50
0,00
0 m
$5
00,0
01–$
750,
000
m
$750
,001
–$1,
000,
000
m
$1,0
00,0
01–$
1,25
0,00
0 m
$1
,250
,001
–$1,
500,
000
m
$1,5
00,0
01–$
1,75
0,00
0 m
$1
,750
,001
–$2,
000,
000
m
$2,0
00,0
01–$
2,25
0,00
0 m
$2
,250
,001
–$2,
500,
000
m
$2,5
00,0
01–$
2,75
0,00
0 m
$2
,750
,001
–$3,
000,
000
m
$3,0
00,0
01–$
3,25
0,00
0 m
$3
,250
,001
–$3,
500,
000
m
$3,5
00,0
01–$
3,75
0,00
0 m
$3
,750
,001
–$4,
000,
000
m
$4,0
00,0
01–$
4,25
0,00
0 m
$4
,250
,001
–$4,
500,
000
m
$4,5
00,0
01–$
4,75
0,00
0 m
$4
,750
,001
–$5,
000,
000
m
$5,0
00,0
01–$
5,25
0,00
0 m
$5
,250
,001
–$5,
500,
000
m
$5,5
00,0
01–$
5,75
0,00
0 m
$5
,750
,001
–$6,
000,
000
m
$6,0
00,0
01–$
6,25
0,00
0 m
$6
,250
,001
–$6,
500,
000
m
$6,5
00,0
01–$
6,75
0,00
0 m
$6
,750
,001
–$7,
000,
000
m
$7,0
00,0
01–$
7,25
0,00
0 m
$7
,250
,001
–$7,
500,
000
m
$7,5
00,0
01–$
7,75
0,00
0 m
$7
,750
,001
–$8,
000,
000
m
$8,0
00,0
01–$
8,25
0,00
0 m
$8
,250
,001
–$8,
500,
000
m
$8,5
00,0
01–$
8,75
0,00
0 m
$8
,750
,001
–$9,
000,
000
m
$9,0
00,0
01–$
9,25
0,00
0 m
$9
,250
,001
–$9,
500,
000
m
$9,5
00,0
01–$
9,75
0,00
0 m
$9
,750
,001
–$10
,000
,000
m
>
$10,
000,
000
m
I pre
fer n
ot to
resp
ond
Plea
se e
stim
ate
the
dolla
r va
lue
or p
erce
nt b
reak
dow
n of
cos
ts in
201
4 fo
r th
e en
tire
gol
f fa
cilit
y, e
xclu
ding
taxe
s. P
leas
e co
mpl
ete
only
one
col
umn:
D
olla
r Val
ue ($
) Pe
rcen
t of T
otal
(%
) Cl
ubho
use
payr
oll (
empl
oyee
s who
se w
ork
is b
ased
in th
e cl
ubho
use
or g
olf s
hop,
incl
udin
g fr
inge
ben
efits
)
Golf
cour
se m
aint
enan
ce p
ayro
ll
Gene
ral a
dmin
istr
ativ
e ex
pens
es (e
xclu
ding
util
ities
, pa
yrol
l, an
d ad
vert
isin
g)
Cost
of f
ood
and
beve
rage
Golf
shop
mer
chan
dise
Adve
rtis
ing
/ M
arke
ting
/ Pr
omot
ion
Utili
ties (
wat
er, e
lect
ric,
gas,
etc.)
Golf
cour
se m
aint
enan
ce su
pplie
s and
serv
ices
Faci
lity
insu
ranc
e
9
Leas
e ex
pens
es (b
oth
oper
atin
g an
d ca
pita
l)
Paym
ents
on
debt
Cash
cont
ribu
tions
to ch
ariti
es
Othe
r exp
ense
s
Aver
age
num
ber
of fu
ll-‐ti
me
and
part
-‐tim
e st
aff e
mpl
oyed
at y
our
golf
faci
lity
duri
ng 2
014
(exc
ludi
ng th
ird-‐
part
y in
depe
nden
t con
trac
tors
and
less
ees
such
as
food
& b
ever
age,
gol
f ac
adem
y, g
olf i
nstr
ucti
on):
Fu
ll-‐Ti
me
Part
-‐Tim
e Co
urse
mai
nten
ance
Golf
shop
Food
& b
ever
age
Adm
inis
trat
ive
Othe
r
Tota
l num
ber
of e
mpl
oyee
s th
at y
ou p
aid
(for
any
am
ount
of t
ime)
dur
ing
2014
: ___
____
___
Plea
se e
stim
ate
the
amou
nt s
pent
on
capi
tal e
xpen
ditu
res
and
impr
ovem
ents
dur
ing
2014
for
the
golf
faci
lity,
as
wel
l as
the
perc
ent o
f pur
chas
es m
ade
from
Ari
zona
sup
plie
rs a
nd s
ervi
ce
prov
ider
s:
Do
llar V
alue
Pe
rcen
t Pur
chas
ed In
AZ
Furn
iture
Equi
pmen
t
Build
ings
Golf
Cour
se
Othe
r
Curr
ent a
sses
sed
valu
e of
tota
l ass
ets
owne
d as
of D
ecem
ber
2014
:
Land
__
____
____
____

Appendices
Contribution of the Golf Industry to the Arizona Economy 59
10
Vehi
cles
and
equ
ipm
ent
____
____
____
__
Irri
gatio
n sy
stem
s
____
____
____
__
Golf-‐
owne
d bu
ildin
gs a
nd in
stal
latio
ns
__
____
____
____
To
tal
____
____
____
__
Plea
se p
rovi
de a
bre
akdo
wn
of fe
dera
l, st
ate,
and
loca
l tax
es p
aid
in 2
014:
Prop
erty
tax
____
____
____
__
Sale
s tax
__
____
____
____
St
ate
corp
orat
e in
com
e ta
x
____
____
____
__
Stat
e pa
yrol
l tax
____
____
____
__
All t
axes
pai
d to
the
fede
ral g
over
nmen
t __
____
____
____
Plea
se e
stim
ate
the
mon
etar
y va
lue
of in
-‐kin
d co
ntri
buti
ons
to c
hari
ties
in 2
014
(incl
ude
only
no
n-‐ca
sh co
ntri
butio
ns su
ch a
s fre
e go
lf ro
unds
, fre
e le
sson
s, et
c.). _
____
____
____
_
**TH
ESE
QU
ESTI
ON
S AR
E FO
R TH
E GO
LF C
OU
RSE
SUPE
RIN
TEN
DEN
T /
DIR
ECTO
R O
F AG
RON
OM
Y**
For g
olf f
acili
ties w
ith m
ultip
le gol
f cou
rses
, pleas
e an
swer
the fo
llowin
g qu
estio
ns w
ith re
gard
s to AL
L go
lf co
urse
s at t
he gol
f fac
ility
Did
any
gol
f cou
rse(
s) a
t the
gol
f fac
ility
und
ergo
any
maj
or r
enov
atio
n pr
ojec
ts in
201
4? T
his
ques
tion
refe
rs o
nly
to re
nova
tion
of E
XIST
ING
cour
ses,
and
does
NOT
incl
ude
cons
truc
tion
of N
EW
cour
ses.
m
Yes
m
No
Plea
se e
stim
ate
the
cost
of a
ny r
enov
atio
ns u
nder
gone
in 2
014
for
the
golf
cour
se(s
) and
if a
n Ar
izon
a-‐ba
sed
cont
ract
or w
as u
sed
for
the
proj
ect.
Plea
se d
o N
OT in
clud
e co
nstr
uctio
n of
NEW
go
lf co
urse
s. Fo
r pro
ject
s inv
olvi
ng m
ultip
le co
ntra
ctor
s, th
e pr
ojec
t sho
uld
be co
nsid
ered
Ari
zona
-‐ba
sed
if m
ore
than
hal
f of t
he p
roje
ct (i
n te
rms o
f dol
lar v
alue
) was
per
form
ed b
y an
Ari
zona
-‐bas
ed
cont
ract
or.
Co
st
AZ-‐B
ased
Con
trac
tor U
sed?
Bu
nker
reno
vatio
n
m
New
gre
ens
m
New
tees
m
Cart
pat
hs
m
Reve
geta
tion
m
Re-‐s
oddi
ng o
r res
urfa
cing
(bey
ond
gene
ral
mai
nten
ance
)
m
11
Irri
gatio
n sy
stem
reno
vatio
n
m
Irri
gatio
n co
mpu
ter s
yste
m u
pgra
des
m
Othe
r (pl
ease
spec
ify)
m
The fo
llowin
g qu
estio
ns are
rega
rdin
g m
aint
enan
ce ope
ratio
ns at t
he gol
f cou
rse(
s)
Plea
se e
stim
ate
the
tota
l gol
f cou
rse
mai
nten
ance
exp
ense
s fo
r 20
14 fo
r th
e go
lf co
urse
(s),
excl
udin
g ta
xes:
____
____
____
____
____
Plea
se e
stim
ate
the
brea
kdow
n of
tota
l exp
ense
s pa
id in
201
4 fo
r th
e go
lf co
urse
(s) a
s a
dolla
r va
lue
or p
erce
ntag
e, e
xclu
ding
taxe
s. P
leas
e co
mpl
ete
only
one
col
umn:
D
olla
r Val
ue ($
) Pe
rcen
t of T
otal
(%
) M
aint
enan
ce p
ayro
ll (i
nclu
ding
all
frin
ge b
enef
its p
aid
by
the
faci
lity)
Chem
ical
s
Irri
gatio
n w
ater
Plan
t mat
eria
l
Seed
Sand
and
soil
Leas
e ex
pens
es (b
oth
oper
atin
g an
d ca
pita
l)
Purc
hase
of c
apita
l equ
ipm
ent (
trac
tors
, mow
ers,
aeri
fiers
, etc
.)
Utili
ties–
elec
tric
Fuel
–die
sel &
gas
olin
e
Othe
r mai
nten
ance
supp
lies a
nd e
xpen
ses
Aver
age
num
ber
of fu
ll-‐ti
me
and
part
-‐tim
e st
aff e
mpl
oyed
at y
our
golf
faci
lity
duri
ng 2
014
for
cour
se m
aint
enan
ce:

Appendices
60 Contribution of the Golf Industry to the Arizona Economy
12
Full-‐
time
empl
oyee
s
____
____
____
__
Part
-‐tim
e em
ploy
ees
__
____
____
____
The fo
llowin
g se
ctio
n pr
esen
ts que
stio
ns on
wat
er u
se and
oth
er m
anag
emen
t str
ateg
ies
Area
(in
acre
s) u
sed
by th
e go
lf co
urse
(s) i
n 20
14:
Tota
l acr
es o
f gol
f fac
ility
(inc
ludi
ng cl
ubho
use,
gol
f sho
p, g
olf c
ours
es, r
esta
uran
ts, e
tc.)
____
____
To
tal a
cres
of g
olf c
ours
e(s)
__
____
__
Turf
gras
s acr
es m
aint
aine
d
____
____
Ac
res i
rrig
ated
__
____
__
Tota
l am
ount
of i
rrig
atio
n w
ater
use
d in
201
4 (a
cre-‐
feet
per
yea
r). I
f you
pre
fer n
ot to
resp
ond,
pl
ease
mar
k w
ith a
n ‘X
.’ ___
____
_
Perc
ent o
f tot
al w
ater
use
d fo
r ir
riga
tion
, by
sour
ce:
____
__ %
Cen
tral
Ari
zona
Pro
ject
(CAP
) __
____
% S
urfa
ce w
ater
__
____
% G
roun
dwat
er
____
__ %
Rec
laim
ed w
ater
__
____
% O
ther
Is
you
r go
lf co
urse
faci
lity
in a
n Ac
tive
Man
agem
ent A
rea
(AM
A)?
(hov
er cu
rsor
ove
r for
de
finiti
on)
m
Yes
m
No
Plea
se in
dica
te w
hich
irri
gati
on m
etho
d(s)
you
r go
lf fa
cilit
y us
es a
nd th
e es
tim
ated
per
cent
of
irri
gate
d ac
reag
e un
der
each
met
hod:
Us
ed b
y Fa
cilit
y?
Perc
ent o
f Irr
igat
ed A
crea
ge
Grav
ity
q
Spri
nkle
r q
Drip
q
Othe
r (pl
ease
spec
ify)
q
Plea
se in
dica
te w
hich
, if a
ny, o
f the
follo
win
g m
anag
emen
t str
ateg
ies
wer
e us
ed o
n yo
ur g
olf
faci
lity
in 2
014
(ple
ase
sele
ct a
ll th
at a
pply
)
13
q
Soil
wet
ting
agen
t q
Ad
just
ed fe
rtili
zatio
n pr
actic
es
q
Elim
inat
ed ir
riga
tion
in se
lect
ed a
reas
q
Re
duce
d ro
ugh
or fa
irw
ay ir
riga
tion
q
Aeri
fied
fair
way
s and
/or g
reen
s q
H
and
wat
ered
gre
ens a
nd/o
r are
a in
fair
way
s q
Us
ed in
-‐gro
und
moi
stur
e se
nsor
s and
/or h
and-‐
held
moi
stur
e m
eter
s q
Us
ed a
utom
ated
wea
ther
stat
ions
q
M
odifi
ed c
urre
nt ir
riga
tion
syst
em
q
Inst
alle
d or
impr
oved
dra
inag
e sy
stem
s on
the
golf
cour
se o
n fa
irw
ays,
gree
ns, b
unke
rs
q
Wat
er tr
eatm
ent o
r rec
ircu
latio
n sy
stem
for f
ertil
izer
or p
estic
ide
appl
icat
ions
q
Ra
ised
mow
ing
heig
hts
q
Wal
k m
owed
gre
ens
q
Scou
ted
for i
nsec
t pes
ts, w
eeds
, and
dis
ease
s q
M
odifi
ed ir
riga
tion
sche
dulin
g to
man
age
inse
cts,
wee
ds, o
r dis
ease
s Pl
ease
des
crib
e th
e fa
cilit
y’s
deci
sion
mak
ing
proc
ess
for
sele
ctin
g an
d in
vest
ing
in m
ajor
ef
ficie
ncy
upgr
ades
, inc
ludi
ng in
form
atio
n us
ed, o
utsi
de e
xper
ts o
r re
sour
ces
cons
ulte
d, o
r ot
her
inte
rnal
or
exte
rnal
fact
ors
cons
ider
ed.
____
____
____
____
____
____
____
____
____
____
____
____
____
____
____
____
____
____
____
____
____
____
_
Has
an
irri
gati
on s
yste
m a
udit
bee
n pe
rfor
med
in th
e pa
st 5
yea
rs?
m
Yes
m
No
Wer
e ad
just
men
ts a
nd c
orre
ctio
ns m
ade
to th
e ir
riga
tion
sys
tem
aft
er th
e au
dit?
m
Yes
m
No
Esti
mat
ed w
ater
sav
ings
per
yea
r (i
n ac
re-‐f
eet)
as
a re
sult
of a
djus
tmen
ts a
nd c
orre
ctio
ns
from
irri
gati
on a
udit
, if a
pplic
able
: ___
____
_
The fo
llowin
g qu
estio
ns are
rega
rdin
g tu
rfgr
ass a
nd la
ndsc
ape m
aint
enan
ce, a
nd oth
er m
anag
emen
t pr
actic
es
How
man
y, if
any
, acr
es o
f tur
fgra
ss h
ave
been
rem
oved
in th
e pa
st 5
yea
rs?
____
____
If tu
rfgr
ass
was
rem
oved
, wha
t veg
etat
ion
or m
ater
ial w
as u
sed
to r
epla
ce th
e tu
rfgr
ass
rem
oved
? (p
leas
e se
lect
all
that
app
ly)
q
Tree
s & sh
rubs
q
Ot
her (
plea
se sp
ecify
): __
____
____
____
____
__

Appendices
Contribution of the Golf Industry to the Arizona Economy 61
14
q
Nat
ive
vege
tatio
n q
M
ulch
q
N
ot a
pplic
able
If y
our
faci
lity
prac
tice
s ov
erse
edin
g, p
leas
e es
tim
ate
the
area
(in
acre
s) o
vers
eede
d in
201
4 an
d 20
09:
Acre
s ove
rsee
ded
in 2
014
____
____
Ac
res o
vers
eede
d in
200
9 __
____
__
Plea
se in
dica
te w
hich
, if a
ny o
f the
follo
win
g, y
our
golf
faci
lity
prac
tice
s:
q
Over
seed
ing
roug
h ar
eas
q
Over
seed
ing
gree
ns
q
Over
seed
ing
fair
way
s
q
Over
seed
wal
l-‐to-‐
wal
l q
Pa
int o
r col
or g
reen
s ins
tead
of o
vers
eedi
ng
Doe
s yo
ur g
olf f
acili
ty h
ave
a pa
rtne
rshi
p w
ith,
con
sult
wit
h, h
ave
a ce
rtifi
cati
on fr
om, o
r is
ot
herw
ise
invo
lved
wit
h an
y w
ildlif
e co
nser
vati
on o
rgan
izat
ions
?
q
Yes–
Audu
bon
Soci
ety
q
Yes–
Othe
r (pl
ease
spec
ify):
____
____
____
____
____
q
N
o H
ave
you
ever
att
ende
d a
Uni
vers
ity
of A
rizo
na C
oope
rati
ve E
xten
sion
turf
gras
s or
inte
grat
ed
pest
man
agem
ent w
orks
hop,
sem
inar
, fie
ld d
ay, e
tc.?
m
Yes
m
No
m
I pre
fer n
ot to
resp
ond
Plea
se in
dica
te if
you
r go
lf fa
cilit
y ha
s ad
opte
d tu
rfgr
ass
man
agem
ent o
r in
tegr
ated
pes
t m
anag
emen
t pra
ctic
es a
s a
resu
lt o
f att
endi
ng a
nd le
arni
ng a
bout
topi
cs a
t Uni
vers
ity
of
Ariz
ona
Coop
erat
ive
Exte
nsio
n se
min
ars,
mee
ting
s, o
r ev
ents
(ple
ase
sele
ct a
ll th
at a
pply
)
q
Over
seed
ing
prac
tices
q
Sp
ring
tran
sitio
n pr
actic
es
q
Turf
gras
s var
iety
sele
ctio
n q
W
eed
cont
rol p
ract
ices
q
Inse
ct p
est m
anag
emen
t q
Di
seas
e m
anag
emen
t q
Ir
riga
tion
man
agem
ent
q
Othe
r (pl
ease
spec
ify):
____
____
____
____
____

Appendices
62 Contribution of the Golf Industry to the Arizona Economy
Appendix B: Survey Invitation Letter

Appendices
Contribution of the Golf Industry to the Arizona Economy 63
Scaling Down Factor by Number of Holes
Holes Scaling Down Factor
9 2.00
18 1.00
27 0.67
36 0.50
45 0.40
54 0.33
72 0.25
81 0.22
99 0.18
108 0.17
117 0.15
126 0.14
135 0.13
Appendix C: Scaling and Expansion MethodAccording to basic characteristics of responding facilities, the total survey response by respondent role mirrors the overall distribution of golf facili-ties in Arizona. Individual question response varied, however, and for that reason it was necessary to use a method to adjust for bias for each question’s response. To correct for bias in survey responses, the data collected for each question with a numeric response was segmented by facility size as measured by number of holes. For each question, an average and number (n) of obser-vations was calculated for each facility size. The averages were then scaled according to the table at right as if they were an 18-hole facility, multiplying by the scaling factor.
Each scaled average was multiplied by the number of observations for each size category, and then summed and divided by the total number of observa-tions to get a weighted 18-hole average for the entire response. This weighted 18-hole average was then scaled back up according to the number of facilities by size in the full golf facility database to obtain a statewide estimate (table below right).
This scaling method accounts for the varying response rate by facility size for each question, and captures variation in per-hole values by using weighted averages.
Holes Scaling Up Factor Facilities Total Scaling
Factor9 0.5 37 18.5
18 1.0 211 211
27 1.5 22 33
36 2.0 39 78
45 2.5 2 5
54 3.0 1 3
72 4.0 0 0
81 4.5 0 0
99 5.5 0 0
108 6.0 1 6
117 6.5 0 0
126 7.0 0 0
135 7.5 0 0
Total 313 354.5
Scaling Up Factor by Number of Holes

Appendices
64 Contribution of the Golf Industry to the Arizona Economy
Appendix D: Economic Contribution Analysis MethodsThe economic contribution of the golf industry was estimated using the 2014 IMPLAN Version 3.1 input-output model. The IMPLAN model captures the linkages between economic sectors in a particular region and is used to understand how specific industries or economic events affect the regional economy overall. The data used in this model represent Arizona’s state econ-omy in 2014.
The economic contribution of golf facility operations in 2014 was modeled using a technique known as analysis-by-parts, in which spending on wages and salaries is modeled separately from expenditures on goods and services. Furthermore, profits were modeled as proprietor income, of which 50% was assumed to be retained in-state. Local purchase percentages were set to SAM values. The breakdown and spending pattern can be found in Appendix E. The tax contribution of golf facility operations was modeled using an industry change for industry ‘496 Other amusement and recreation,’ the IMPLAN in-dustry which contains golf courses. Proprietor income, employee compensa-tion, and employment were customized to match statewide estimates derived from survey results.
The economic impact of golf tourism was modeled using a series of indus-try changes. Tourist spending attributable to golf, estimated in previous sec-tions, was used model the impacts to industries (Appendix E). Retail indus-tries were margined, meaning that retail margins were retained in-state, while the cost of merchandise was considered as a leakage from the state economy. Direct effects were measured as gross sales for all retail industries. Local purchase percentages were set to 100% as the direct spending is all assumed to occur in-state.
The economic contribution of golf-related businesses was also modeled as a series of industry changes (Appendix E). Again, retail industries were margined and direct effects of retail industries were measured as gross sales. Local purchase percentages were set to 100% as all direct spending is assumed to occur in-state.

Appendices
Contribution of the Golf Industry to the Arizona Economy 65
Appendix E: IMPLAN Industry Assignments for Spending Patterns
Golf Facility Operations
General Breakdown
Item Amount Modeled As:Payroll $355,824,799 Labor Income Change (Employee Compensation)
Operating Expenses
$523,944,430 Industry Spending Pattern
Profits $267,597,566 Labor Income Change (Proprietor Income, 50% Leakage)
Industry Spending Pattern (Operating Expenses)
IMPLAN Industry % of Spending3010 All other crops 2.7091
3031 Sand and gravel 0.9030
3049 Electricity transmission and distribution 7.3169
3050 Natural gas distribution 1.8292
3051 Water, sewage and other systems 9.1461
3169 Nitrogenous fertilizer 1.8061
3170 Phosphatic fertilizer 1.8061
3395 Wholesale trade distribution services 23.9514
3402 Retail services–Gasoline stores 2.7091
3434 Nondepository credit intermediation and related activities 3.0933
3437 Insurance 2.4403
3440 Real estate buying and selling, leasing, managing, and related services 5.1653
3457 Advertising, public relations, and related services 2.6157
3462 Office administrative services 15.8084
3469 Landscape and horticultural services 8.1274
3496 Other amusement and recreation 10.3443
3514 Grantmaking, giving, and social advocacy services 0.2284

Appendices
66 Contribution of the Golf Industry to the Arizona Economy
Golf Tourism
Golf-Related Businesses
Expenditure IMPLAN Industry AmountLodging 499 Hotels and motels, including casino
hotels$198,894,182
Car Rental 442 Automotive equipment rental and leasing
$65,711,964
Food / Dining 501 Full-service restaurants $82,365,863
Entertainment 496 Other amusement and recreation industries
$45,871,833
494 Amusement parks and arcades $45,871,833
Local Transportation 412 Transit and ground passenger transportation
$40,805,608
Shopping / Retail 403 Retail–Clothing and clothing accessories stores
$57,402,273
406 Retail–Miscellaneous store retailers $57,402,273
Groceries 400 Retail–Food and beverage stores $3,974,413
Industry IMPLAN Industry AmountGolf Vacation Packages 466 Travel arrangement and reservation
services$4,668,000
Golf Cars & Carts 396 Retail–Motor vehicle and parts dealers $161,036,000
Golf Equipment & Supplies—Retail
404 Retail–Sporting goods, hobby, musical instrument and book stores
$94,134,000
Golf Equipment— Repairing & Refinishing
508 Personal and household goods repair and maintenance
$679,000
Golf Practice Ranges 496 Other amusement and recreation industries
$3,426,000
Golf Instruction 474 Other educational services $6,217,000