Contribution of Particle Size and Moisture Content to ...
138
Contribution of Particle Size and Moisture Content to Flowability of Fractionated Ground Loblolly Pine by Oluwatosin Jerry Oginni A thesis submitted to the Graduate Faculty of Auburn University in partial fulfillment of the requirements for the Degree of Master of Science Auburn, Alabama August 2, 2014 Keywords: Loblolly pine, particle size, moisture content, physical and flow properties, fraction Copyright 2014 by Oluwatosin Jerry Oginni Approved by Oladiran Fasina, Chair, Professor of Biosystems Engineering Sushil Adhikari, Associate Professor of Biosystems Engineering John Fulton, Associate Professor of Biosystems Engineering
Transcript of Contribution of Particle Size and Moisture Content to ...

Contribution of Particle Size and Moisture Content to Flowability of Fractionated
Ground Loblolly Pine
by
Oluwatosin Jerry Oginni
A thesis submitted to the Graduate Faculty of
Auburn University
in partial fulfillment of the
requirements for the Degree of
Master of Science
Auburn, Alabama
August 2, 2014
Keywords: Loblolly pine, particle size, moisture content, physical and flow properties, fraction
Copyright 2014 by Oluwatosin Jerry Oginni
Approved by
Oladiran Fasina, Chair, Professor of Biosystems Engineering
Sushil Adhikari, Associate Professor of Biosystems Engineering
John Fulton, Associate Professor of Biosystems Engineering

ii
Abstract
The use of woody biomass requires feedstock materials in particulate form; therefore there
is a need for size reduction of the feedstock materials. Ground biomass typically has a non-uniform
particle size and as a biological material, biomass will exchange moisture with the environment.
Thus, ground biomass feedstock will have typical flow problems associated with bulk materials
during storage. The objective of this research is to investigate the contribution of particle size and
moisture content to flowability of fractionated ground loblolly pine. In this study, ground loblolly
pines were fractionated into six size classes at five moisture content levels. The physical and flow
characteristics of the fractionated samples that are related to flowability and design of the storage
vessels were quantified. The geometric mean diameters for the fractions were in the range 0.10 -
2.38 mm. Bulk and tap densities of the fractions increased with fraction size but particle density
was not affected by fraction size. The densities (bulk, particle and tap) decreased with increase in
moisture content. Porosity, Hausner ratio and compressibility increased with increase in moisture
content and reduction in fraction size. The flowability of the fractions decreased with decrease in
fraction size and increase in moisture content. Flow index values of 4.11, 4.17 and 4.29 were
recorded for 1.40 mm fractions at moisture levels of 4.78%, 8.69% and 16.53%, respectively which
implies easy flowing. However, a reduction in flowability from easy flowing to cohesive flowing
was observed when 1.40 mm fractions were dosed with 0.50 mm fractions at 10:1, 10:2 and 10:3
mass ratio respectively. Cohesive strength and angle of internal friction decreased with increase in
fraction size. Moisture content caused an increase in angle of internal friction but had no significant

iii
effect on the cohesive strength of the fractions. Particle size and moisture content had a significant
effect on the angle of wall friction of the fractions. There was a reduction in wall friction angle
with increase in fraction size. Lower wall friction angles were obtained at lower moisture content
when stainless and mild steel surfaces were used while Tivar 88 surface had a consistent low angle
of wall friction at all moisture levels. The adjusted hopper outlet size varied between 1.20 and
28.56 mm with 1.40mm fraction having the highest minimum hopper outlet size. The wall normal
and vertical pressure acting on the cylindrical section of the silo increased from 9.35 to 45.42 kPa
and 15.34 to 48.91 kPa, respectively with increase in fraction size and decrease in moisture content.
The initial fill and flow induced pressures acting on the hopper section of the silo increased from
15.34 to 48.91 kPa and 24.71 to 78.79 kPa, respectively with increase in fraction size and decrease
in moisture content. The heating values (18-19 MJ/kg) and volatile matter (84.91 - 87.48% d.b)
were not affected by the fraction size while ash content was found to increase with reduction in
the fraction size.

iv
Acknowledgments
First of all, I thank God for his strength and grace on my life to successfully complete this
research work. I would like to express my sincere gratitude to my academic advisor, Dr Oladiran
Fasina for the opportunity he gave me to learn from his vast wealth of knowledge and experience
in this research area and to earn my degree. I appreciate his patience and professional advice during
the course of the program. My appreciation also goes to my committee members, Dr Sushil
Adhikari and Dr John Fulton for the professional support and knowledge they gave during the
research work. I would like to acknowledge Alabama Agricultural Experiment Station,
Department of Energy (DOE), Southeastern Partnership for Integrated Biomass Supply Systems
(IBSS) and National Institute of Food and Agriculture for the provision of research fund. In
addition, I would like to appreciate Dr. Sunday Ogunsina and Mr Gbenga Olatunde for all their
academic and moral supports.
My appreciation goes to my parents, Mr and Mrs Oginni for all the encouragement and
prayers they offered throughout the course of my master’s program. Many thanks to my siblings
Ayo and his wife Bukola, Titi, Mayowa, Tolulope for the moral supports I got from them. To all
my families and friends back in Nigeria, thank you all.
To all the group members under Dr Fasina; Anshu, Gurdeep, Jaskaran, Gbenga, Ujjain and
Oluwafemi, I appreciate the time we spent working together. Thanks to all my Auburn friends and
family for the time we had together.

v
Table of Contents
Abstract ...........................................................................................................................................ii
Acknowledgments .........................................................................................................................iv
List of Figures .............................................................................................................................viii
List of Tables ..................................................................................................................................x
Chapter 1 Introduction…………………………………………………………………………….1
Chapter 2 Literature review ………………………………………………………………………4
2.1 Biomass: A Source of Renewable Energy………………………………………..…...4
2.2 Biomass Supply Logistics …………………………………………………………….6
2.3 Size reduction and particle size ……………………………………………………….7
2.4 Flow patterns and flow problems………………………………………………….....10
2.5 Physical Properties …………………………………………………………………..14
2.5.1 Bulk density ……………………………………………………………………..14
2.5.2 Particle density …………………………………………………………………..16
2.5.3 Porosity ………………………………………………………………………….18
2.5.4 Compressibility ………………………………………………………………….19
2.5.5 Hausner ratio …………………………………………………………………….21
2.6 Flow Properties ……………………………………………………………………..23
2.6.1 Cohesion ………………………………………………………………………...25
2.6.2 Angle of wall friction ……………………………………………………………27
2.6.3 Flow function and index ………………………………………………………...28
2.6.4 Design of hopper for flow ……………………………………………………….30
Summary ………………………………………………………………………………...33
Chapter 3 Particle Size and Moisture Effect on Physical of Fractionated Ground Loblolly Pine 34
3.1. Abstract ……………………………………………………………………………...34
3.2. Introduction ………………………………………………………………………….35
3.3. Materials and Methods ……………………………………………………………....37

vi
3.3.1 Sample preparation and fractionation …………………………………………...37
3.3.2 Particle size distribution …………………………………………………………38
3.3.3 Bulk density ……………………………………………………………………..39
3.3.4 Particle density …………………………………………………………………..39
3.3.5 Tap density, compressibility and hausner ratio ………………………………….40
3.3.6 Composition and energy determination …………………………………………41
3.3.6.1 Sample preparation ………………………………………………………...41
3.3.6.2 Energy content ..............................................................................................41
3.3.6.3 Ash content ......................………………………………………………….41
3.3.6.4 Volatile matter ...................... ……………………………………………...42
3.3.7 Experimental design and statistical analysis …………………………...………43
3.4 Results and Discussion ...............................................................................................43
3.4.1 Particle size distribution …………………………………………………………43
3.4.2 Bulk density …………………………………………………………….……….49
3.4.3 Tap density.......…………………………………………………………………..51
3.4.4 Hausner ratio....…………………………………………………………..............53
3.4.5 Compressibility …………………………………………………………….……54
3.4.6 Particle density .………………………………………………………………….56
3.4.7 Porosity.............…………………………………………………………….……57
3.4.8 Compositional analysis…………………………………………………………..59
3.4.8.1 Energy content……………………………………………………………..59
3.4.8.2 Ash content ………………………………………………………………..60
3.4.8.3 Volatile matter …………………………………………………………….61
3.5 Conclusion …………………………………………………………………………..62
Chapter 4 Sensitivity of Hopper Design Parameters to Measured Physical and Flow Properties of
Fractionated Ground Loblolly Pine ...............................................................................................64
4.1 Abstract……………………………………………………………………………..65
4.2 Introduction ………………………………………………………………………...65
4.3 Materials and Methods ……………………………………………………………..67
4.3.1 Sample preparation………………….…………………………………………...67
4.3.2 Flow properties .....................................................................................................67

vii
4.3.3 Wall friction properties ………………………………………………...…...…69
4.3.4 Hopper design calculation …………………………………………….…………69
4.3.4.1 Hopper half angle ……………………………………………….…………69
4.3.4.2 Minimum hopper outlet size …………………………………….………69
4.3.4.3 Silo wall loads ……………………………………………………………..70
4.3.5 Experimental design and statistical analysis ............................................................72
4.4 Results and Discussion ……………………………………………....…………....73
4.4.1 Flow classification of fractionated ground loblolly pine …………...………..….71
4.4.2 Angle of internal friction ……………………………………….…....………..78
4.4.3 Cohesive strength………….. …………………………………….………….…..79
4.4.4 Wall friction properties…………………..……………………….………….…..80
4.4.5 Hopper half angle and minimum discharge outlet size .........................................85
4.4.6 Silo wall loads .......................................................................................................90
4.5 Conclusion ………………………………………………………………………….95
Chapter 5 Summary and Recommendation ……………………………………………………..96
5.1 Summary …………………………………………………………………………….96
5.2 Recommendation ……………………………………………………………………97
References. ………………………………………………………………………………………99
Appendix A..……………………………………………... .........................................................112
Appendix B: SAS codes for statistical analysis………........…………………………………...123
viii
List of Figures
Figure 1.1 Hammer rash on bins with flow problems......................................................................2
Figure 2.1 Flow chart of biomass supply logistics ..........................................................................7
Figure 2.2 Types of flow patterns in storage vessel: (a) Funnel flow; (b) Mass flow ..................11
Figure 2.3 Typical flow problems associated with bulk solids ......................................................12
Figure 2.4 Jenike shear cell ............................................................................................................24
Figure 2.5 Typical plot of yield locus ............................................................................................25
Figure 2.6 Flow function: easy versus difficult flow .....................................................................29
Figure 2.7 Hopper design chart for a conical hopper based on the Jenike’s theory ......................32
Figure 2.8 Evaluation of critical applied stress ..............................................................................32
Figure 3.1 Particle size distribution of unfractionated loblolly pine fractions ..............................44
Figure 3.2a Particle size distribution of fractionated loblolly pine at 4.78% moisture level .........45
Figure 3.2b Particle size distribution of fractionated loblolly pine at 8.69% moisture level ........45
Figure 3.2c Particle size distribution of fractionated loblolly pine at 16.53% moisture level .......46
Figure 3.2d Particle size distribution of fractionated loblolly pine at 22.21% moisture level ......46
Figure 3.2e Particle size distribution of fractionated loblolly pine at 25.53% moisture level .......47
Figure 3.2f Particle size distribution of fractions retained on screen size 0.05mm .......................47
Figure 3.3 Particle size effect on energy content of fractionated loblolly pine .............................60
Figure 3.4 Particle size effect on ash content of fractionated loblolly pine ...................................61
Figure 3.5 Particle size effect on volatile matter of fractionated loblolly pine ..............................62
Figure 4.1 Typical flow problems associated with bulk solids ......................................................65
Figure 4.2: Powder flow tester and accessories ............................................................................68
Figure 4.3 Silo subdivision into vertical and hopper section .........................................................71
Figure 4.4 Initial fill and flow induced pressure on hopper section of a silo ................................72
Figure 4.5a Flow function of fractionated loblolly pine at 4.78% moisture content......................73

ix
Figure 4.5b Flow function of fractionated loblolly pine at 8.69% moisture content……….…….74
Figure 4.5c Flow function of fractionated loblolly pine at 16.53% moisture content……….…...74
Figure 4.5d Flow function of fractionated loblolly pine at 22.21% moisture content……….…...75
Figure 4.5e Flow function of fractionated loblolly pine at 25.53% moisture content ……….…..75
Figure 4.6 SEM images of stainless steel, mild steel and tivar 88 wall surfaces .............................84
Figure 4.7 Effect of moisture content on hopper angle of 0.25mm fraction..................................87
Figure 4.8 Effect of fraction size on hopper half angle at 4.78% moisture level...........................87
Figure 4.9 Plot of wall friction angles and hopper half angle of ground loblolly pine……….…..88
Figure 4.10 Flow function and flow factor of fraction size 0.25mm at 8.69 % moisture content..89
Figure 4.11 Effect of moisture content on pressures acting on silo wall for 0.25 mm fraction .....92
Figure 4.12 Effect of particle size on pressures acting on the cylindrical and hopper section of the
silo wall .........................................................................................................................................92 .
Figure 4.13 Plot of vertical and wall pressure against cylindrical height for 0.05 mm fraction at
4.78 % moisture level ...................................................................................................................93
Figure 4.14 Plot of initial and flow induced loads against hopper height for 0.05 mm fraction at
4.78 % moisture level.….……………………………………………………………………......93

x
List of Tables
Table 2.1 Flowability classification of bulk solids based on mechanical compressibility.......20
Table 2.2 Flowability classification using Hausner ratio ..............................................................22
Table 2.3 Jenike classification of powder flowability by flow index (ffc) ....................................28
Table 3.1 Geometric mean diameters of fractionated ground loblolly pine ..................................49
Table 3.2 Bulk density (kg/m3) of fractionated ground loblolly pine .……..……………….........50
Table 3.3 Tap density (kg/m3) of fractionated ground loblolly pine .............................................52
Table 3.4 Hausner ratio of fractionated ground loblolly pine ........................................................54
Table 3.5 Compressibility of fractionated ground loblolly pine ....................................................55
Table 3.6 Particle density (kg/m3) of fractionated ground loblolly pine .......................................57
Table 3.7 Porosity of fractionated ground loblolly pine ................................................................59
Table 4.1 Jenike classification of powder flowability by flow index (ffc).....................................76
Table 4.2 Flow classification of fractionated ground loblolly pine................................................76
Table 4.3 Flow indices of mixture of 1.40mm and 0.50mm fractions……………………….......77
Table 4.4 Angle of internal friction of fractionated loblolly pine……………………….…….....78
Table 4.5 Cohesive strength (kPa) of fractionated ground loblolly pine…………………….…...80
Table 4.6 Angle of wall friction of fractionated ground loblolly pine using stainless steel wall...81
Table 4.7 Angle of wall friction of fractionated ground loblolly pine using mild steel wall.........82
Table 4.8 Angle of wall friction of fractionated ground loblolly pine using Tivar 88 wall ……..83
Table 4.9 Evaluation of hopper half angle, flow factor and hopper opening diameter (Dmin) for a
cylindrical hopper using Jenike’s method .....................................................................................86
Table 4.10 Silo wall loads of fractionated ground loblolly pine....................................................91
Table A.1 Symbols and Nomenclatures .................................................................................….112
Table B.1: ANOVA result of particle size and moisture effect on particle density of fractionated
ground loblolly pine……..……………………………………………………………………...113
Table B.2: ANOVA result of particle size and moisture effect on bulk density of fractionated
ground loblolly pine ……………………………………………………………………………113
Table B.3: ANOVA result of particle size and moisture effect on tap density of fractionated ground
loblolly pine……………………………………………………………………............……….114

xi
Table B.4: ANOVA result of particle size and moisture effect on compressibility of fractionated
ground loblolly pine ………………………………………………………………………….…114
Table B.5: ANOVA result of particle size and moisture effect on Hausner ratio of fractionated
ground loblolly pine ………………………………………………………………………….…115
Table B.6: ANOVA result of particle size and moisture effect on porosity of fractionated ground
loblolly pine …………………………………………………………………………………….115
Table B.7: ANOVA result of particle size and moisture effect on angle of internal friction of
fractionated ground loblolly pine ………………………………………………………………116
Table B.8: ANOVA result of particle size and moisture effect on cohesion of fractionated ground
loblolly pine ……………………………………………………………………………………116
Table B.9-1: ANOVA result of particle size and moisture effect on angle of wall friction of
fractionated ground loblolly pine using stainless steel ………………………………………....117
Table B.9-2: ANOVA result of particle size and moisture effect on angle of wall friction of
fractionated ground loblolly pine using mild steel ……………………………………………..117
Table B.9-3: ANOVA result of particle size and moisture effect on angle of wall friction of
fractionated ground loblolly pine using Tivar 88 surface …….…………………………….….118
Table B.10: ANOVA result of particle size effect on volatile matter (% db) of fractionated ground
loblolly pine ………………………………………………………………………….............…118
Table B.11: ANOVA result of particle size effect on energy content of fractionated ground loblolly
pine ……………………………………………………………………………..............………119
Table B.12: ANOVA result of particle size effect on ash content (% db) of fractionated ground
loblolly pine .................................................................................................................................119
Table B.13 Effect of wall surface on angle of wall friction at 4.78% moisture level .................120
Table B.14 Effect of wall surface on angle of wall friction at 8.69% moisture level………..…120
Table B.15 Effect of wall surface on angle of wall friction at 16.53% moisture level…………121
Table B.16 Effect of wall surface on angle of wall friction at 22.21% moisture level…………121
Table B.17 Effect of wall surface on angle of wall friction at 25.53% moisture level…………122

Chapter 1
Introduction
Almost every manufactured product passes through a powder, granular or particulate
phase in its manufacturing cycle which means that a large quantity of these materials are processed,
handled, stored and conveyed in bulk. The size range of these bulk materials varies from sub-
micron sizes to sizes as large as 3 – 6 mm diameter. The selection and implementation of suitable
handling systems for these materials is therefore important and crucial to efficiency and cost of
processing. Low cost automation, efficiency of handling, reliability of equipment, installed and
operating costs, clean operating environment, suitability of equipment to handle the required
materials and best available technology are factors that influence the design and selection of
storage and handling equipment (Velan, 2012).
Ineffective and unreliable handling systems contribute to processing plant startup delays,
process inefficiencies and equipment downtime. The extent of this was confirmed in a six-year
study by the Rand Corp. of 40 solids processing plants in the U.S. and Canada (Merrow, 1988).
The findings revealed that 80% of all plants studied experienced bulk solids handling problems.
Also, the affected facilities were slow in coming up to speed, with an average startup time for some
types (raw, unprocessed solids feedstock) approaching 18 months. Once startup began, poor
performance continued to affect these operations with capacity ranging between 40% and 50% of
design values (Purutyan et al., 2001).
Inconsistent or no flow of bulk materials from storage equipment is one of the problems
associated with bulk solid handling. Bulk materials form an arch or rat-hole inside the storage

2
vessel, preventing discharge and requiring the action of hammering, vibration, aeration or other
methods to promote flow. This results in hopper damage from hammering, popularly known as
hammer rash (Figure 1.1). The flow interruptions give rise to production difficulties and
inefficiencies, including operators diverting from the main tasks to hammering of storage vessels.
Hammering leads to safety and health issues such as noise, hand injuries and back strain (Bradley
et al., 2011).
Figure 1.1: Hammer rash on bins with flow problems (Source: Bradley et al., 2011).
Therefore to ensure successful processing operations and enhance production rate in these
industries, a consistent and reliable flow of bulk materials from storage equipment without flow
obstruction, excessive spillage or dust generation is required (Fitzpatrick et al., 2004). The design
of storage hoppers and bins for reliable flow requires information on flow properties of the stored
material. The flow properties are also needed in handling and processing operations (Knowlton et
al., 1994; Peleg, 1977). Bulk material properties that influence flow or flowability are termed flow
properties. Some key factors that influence flow properties include moisture, particle size and
shape (Fasina, 2006).

3
According to EISA (2007), over 1 billion dry tons of biomass is estimated to be produced
annually from the abundant biomass resources in the United States. The biomass can be converted
to liquid fuel - a sustainable replacement for fossil fuel. Biomass logistics often requires the use of
storage equipment to hold feedstock for certain amount of time. Also, the use of biomass requires
feedstock in particulate form. As a biological material, biomass will exchange moisture with the
environment. These changes in particle size and moisture content of biomass will influence
biomass flow behavior during discharge out of storage equipment and structures. Thus, biomass
feedstock will have typical flow problems associated with bulk solid materials. Therefore, the use
of this large quantity of biomass resources requires an effective design and selection of storage
and handling system which will ensure consistent flow of the feedstock material for its intended
use. Improper designs can results in biomass degradation, material loss, flow blockage and/or
safety problems (Gil et al., 2013).
To our knowledge at the time of conducting this research, there is no reported study on
the contribution of particle size and moisture to the flowability of fractionated ground loblolly
pine. Therefore, the main objective of this study was to investigate the contribution of particle size
and moisture content to flowability of fractionated ground loblolly pine. The specific objectives of
this study were to:
1. quantify the physical properties of fractionated ground loblolly pine and the effect of moisture
content on these properties.
2. quantify the flow properties of fractionated ground loblolly pine and perform sensitivity
analyses on the physical and flow properties in relation to silo design.

4
Chapter 2 Literature Review
2.1 Biomass: A Source of Renewable Energy
In recent years, there has been a continuous increase in energy demand due to technological
development and industrialization but development of energy sources is not keeping pace with the
spiraling consumption. The major energy supply is obtained from fossil fuels which, according to
the US Energy Information Administration (2014), meet around 72% of U.S. energy demand and
87% of world energy demand. Fossil fuels are fuels formed by natural processes such as anaerobic
decomposition of buried dead organisms and it primarily consist of coal, natural gas and petroleum
(Saxena et al., 2009).
Due to the adverse environmental impacts, non-renewable and finite nature of fossil fuels,
it becomes imperative to develop sustainable and environmental friendly energy sources which
will reduce world’s dependency on fossil fuels (Kirtay, 2011; Moriarty and Honnery, 2008; Guo
et al., 2012). These energy sources are termed renewable energy sources (e.g. biomass, wind, solar
and geothermal) because they are continuously replenished and therefore are abundant on earth.
About 9% of the energy consumed (total of 97 quadrillion Btu energy) in United States was
obtained from renewable resources in 2011 (EIA, 2013). In the spectrum of renewable energy
sources, biomass is the only renewable carbon source which can be converted into carbon-based
fuels that can then be substituted for fossil fuel (EIA, 2008; Ozbay et al., 2001). Biomass can be
transformed into heat, power, transportation fuels and chemicals by two main pathways;
thermochemical and biochemical conversion. The choice of the conversion technique depends on
5
factors such as amount and type of feedstock, desired form of energy, economic and environmental
conditions (McKendry, 2002).
Biomass are organic materials that are plant or animal based including but not limited to
dedicated energy crops, agricultural crops and trees, food, feed and fiber crop residues, aquatic
plants, forestry and wood residues, agricultural wastes, bio-based segments of industrial and
municipal wastes, processing by-products and other non-fossil organic materials (ASABE, 2011).
It accounts for 10% of global primary energy consumption making it the largest primary source of
renewable energy (OECD/IEA, 2010). In the United States, biomass contributes nearly 3.9 quads
and accounts for more than 4% of total U.S. primary energy consumption (EIA, 2010).
The United States has abundant biomass resources and has continued to increase bioenergy
production in order to reduce energy insecurity and environmental problems posed by the use of
fossil fuel. Perlack and Stokes (2011) stated that the United States has the resources to produce
over 1 billion dry tons of biomass annually which can be converted into 90 billion gallons of liquid
fuels. This quantity can replace about 30% of the nation’s current annual petroleum consumption.
According to the Energy Independence and Security Act (2007), the goal is to increase the amount
of renewable fuels used in the United States transportation sector from 2012 level of 15 billion
gallons to 36 billion gallons by 2022. The mandate further stipulates that, of the 36 billion gallons
of renewable fuel, the goal is to produce 21 billion gallons of advanced biofuels derived mainly
from cellulosic feedstock. The cellulosic feedstock will be from forest resources and dedicated
energy crops.
Woody biomass has been identified as a reliable and viable biomass source due to the
abundant quantity of forest trees in United States. Forest trees are grown approximately on one
third (749 million hectare) of the nation’s total land (Simmons et al., 2008). On a national basis,

6
forest lands in the contiguous United States are estimated to produce 370 million dry tons of woody
biomass annually on a sustainable basis. The current discussion of using woody biomass continues
a long history of relying on wood for energy production, both in the United States and in the world
(White, 2010; Perlack and Stokes, 2011). Loblolly pine is an example of a potential significant
source of woody biomass in the southeast United States.
Loblolly pine is a commercially important species in the southeast United States. This is
due to its rapid growth and ease of establishment making it dominant on about 11.7 million ha (29
million acres) and makes up over one-half of the standing pine volume (Baker and Langdon, 2013;
Cunningham et al., 2008). According to Williams and Gresham (2006), 15.2 Mg/ha of total
biomass can be produced every year from loblolly pine tree by intensive management. This means
that about 177.84 million tons of loblolly pine per year is potentially available for bioenergy.
2.2 Biomass Supply Logistics
Biomass supply logistics involves the unit operations that are used to prepare biomass
feedstock for the bio-refinery process (Figure 2.1). These unit operations include biomass
harvesting and collection, storage, pre-processing, transportation and handling. Without assurance
of efficient feedstock flow from point of origin to the throat of bio-refinery conversion, biofuel
production can be limited by capacity and cost-prohibitive factors (BRDB, 2010). Biomass supply
logistics represent one of the major challenges for cost effective production in the emerging lingo-
cellulosic bio-refining industries (Sokhansanj and Hess, 2009).
The low density and high moisture content of woody biomass make biomass supply
logistics cost intensive. For example, the bulk density of switchgrass was reported to vary between
49.4 to 266.5 kg/m3 within the moisture content range of 8 to 60% (wb). A similar trend was also
observed for wheat straw in which the bulk density ranged from 24.2 to 111.1 kg/m3 within the

7
same moisture content range (Lam et al., 2007). This limits the amount of biomass that can be
handled, transported and delivered to the bio-refinery. Also, there exist flowability problems due
to irregular particle size and high moisture content of woody biomass. This is the focus of this
research which is to quantify the influence of particle size and moisture content on the flowability
of ground loblolly pine.
Figure 2.1: Flow chart of biomass supply logistics (Source: www.fs.fed.us; www.directindustry.com; www.glosco-wood.com; www.southeasttree.com).
2.3 Size reduction and particle size
Size reduction of woody biomass is necessary because current conversion technologies
require the use of small sized particles that are typically less than 1 mm (Wei et al, 2009; Kumar
et al, 2009). Size reduction as a pretreatment process changes the particle size, shape, particle
density and bulk density of biomass. It increases the total surface area of the material and the
Woody biomass harvesting Wood chipping
Size reduction Biomass storage

8
number of contact points for inter-particle bonding (Drzymala, 1993). More importantly, size
reduction of lingo-cellulosic biomass minimizes mass and heat transfer limitations during
conversion processes (Schell and Harwood, 1994). Chundawat et al. (2006) found that size
reduction of corn stover and separation to various size fractions affected pretreatment and
hydrolysis processes. The author further found that glucan and xylan conversions were enhanced
by 15–20% when corn stover was ground to particle size of <0.15 mm.
Size reduction of woody biomass usually involves two steps. The first step is wood
chipping where a wood log is fed to the disk chipper and the wood chips produced usually have
sizes ranging from 5 to 50 mm (Naimi et al., 2006). The second step is biomass milling, which
further reduces the wood chips into smaller particles. Wood particles produced by biomass milling
usually have sizes ranging from 0.1 to 10 mm (Zhang et al., 2010). Equipment such as hammer
mills, knife mills, ball mills, needle mills, shredders, linear knife grids, and disk attrition mills are
used for biomass milling (Igathinathane et al., 2009; Zhu et al., 2009). Hammer mill is the most
commonly used size reduction equipment because it is relatively cheap, easy to operate, high
throughput rate, versatility in grinding different materials and produce wide range of particles
(Bitra et al., 2009; Lopo, 2002). Hammer mill utilizes impact load produced by a rotating shaft
with attached fixed or swinging hammers to break down larger sized particles into smaller size
particles (Austin, 2002).
Size reduction is an energy intensive operation accounting for up to one-third of the power
requirements of the entire bioconversion to ethanol (US Department of Energy, 1993). Energy
consumption for grinding depends on biomass initial and final particle size, moisture content,
material properties, mass feed rate and machine variables such as screen size and type of grinding
equipment (Mani et al., 2004). Specific energies between 46 kJ/kg and 107 kJ/kg were reported

9
for size reduction of corn stover (Dilts, 2007). Mani et al. (2004) observed an increase in energy
requirement with decreasing final particle size and increased moisture content for corn stover and
barley straw. Size reduction of corn stover from particle size of 12.5 mm to particle sizes of 3.2 -
0.8 mm respectively with increase in moisture content from 6.2 to 12% (wb) resulted in increased
average energy requirement from 25.06 to 123.5 kJ/kg. Increase in average energy requirement
from 49.6 to 358.2 kJ/kg was also reported for barley straw with size reduction from particle size
of 20.52 mm to size range of 3.2-0.8 mm and moisture content increase from 6.2 to 12.0% (wb).
Datta (1981) reported that coarse size reduction of hardwood chips (0.2–0.6 mm) required 72–144
kJ/kg of energy. The grinding energy requirement increased five times (360- 720 kJ/kg) when the
chips were ground to smaller particle size of 0.15–0.3 mm.
Particles generated during size reduction are not uniformly sized. Therefore, particle size
distribution is sometimes used as a measure of efficiency for the size reduction process (Bitra et
al., 2009). Particle size distribution is a measure of the variation in size of particles after size
reduction. The distribution for biomass materials are skewed (i.e., log-normal distribution).
Examples of this can be found in studies published on alfalfa forage grinds (Yang et al., 1996),
corn stover grind (Mani et al., 2004), barley, canola, oat and wheat straw (Adapa et al., 2009) and
peanut hull (Fasina, 2008). This skewness is typically obtained for naturally occurring particle
population (Rhodes, 1998).
An effective way of expressing and comparing particle size distribution of ground material
on a statistical basis is the geometric mean diameter and the geometric standard deviation. The
geometric mean diameter is the median size of particles by mass or median size of particles
retained on a sieve during a sieve analysis. It is used to describe the particle size and distribution
of ground materials. The geometric standard deviation is the deviation of particle diameters by

10
mass in a log-normal size distribution curve (ASABE Standards, 2008). These two parameters are
often used in characterizing the particle size of ground materials measured either by a sieving
analysis or an image analysis.
Particle size is dependent on the screen size of the milling equipment and the biomass
material. Mani et al. (2004) reported geometric mean diameters for corn stover and switchgrass
using a hammer mill screen size of 0.8, 1.6 and 3.2 mm to be 0.19 and 0.25 mm; 0.26 and 0.28
mm; 0.41 and 0.44 mm respectively. It can be observed from the results that increase in the screen
size resulted in increase in the geometric mean diameter. Also, although the same screen sizes
were used for the two feedstock materials, there was a difference in the geometric mean diameters
with switch grass having a higher geometric mean diameter as compared to corn stover. The
variation in the particle sizes of ground biomass is an underlying factor which influences physical
and flow behavior off ground biomass.
2.4 Flow patterns and flow problems
Flow is defined as the relative movement of bulk particles in comparison to neighboring
particles or along the wall of a storage container. Flowability therefore is a measure of the
cohesiveness and adhesiveness of bulk material (Peleg, 1977; Woodcock and Mason, 1987).
Particles that do not flow well tend to have strong tendency to stick to one another (high cohesion)
due to attractive forces between particles. Adhesion occurs when particles in storage silos or bins
‘stick’ to the walls or exterior surface of the storage container. The two main types of flow patterns
that exist when bulk materials are discharged from storage equipment are funnel flow and mass
flow.
Funnel flow (Figure 2.2a) occurs when the particles move out through a central ‘funnel’
that forms within the material, followed by collapse of particles against the walls and moving of
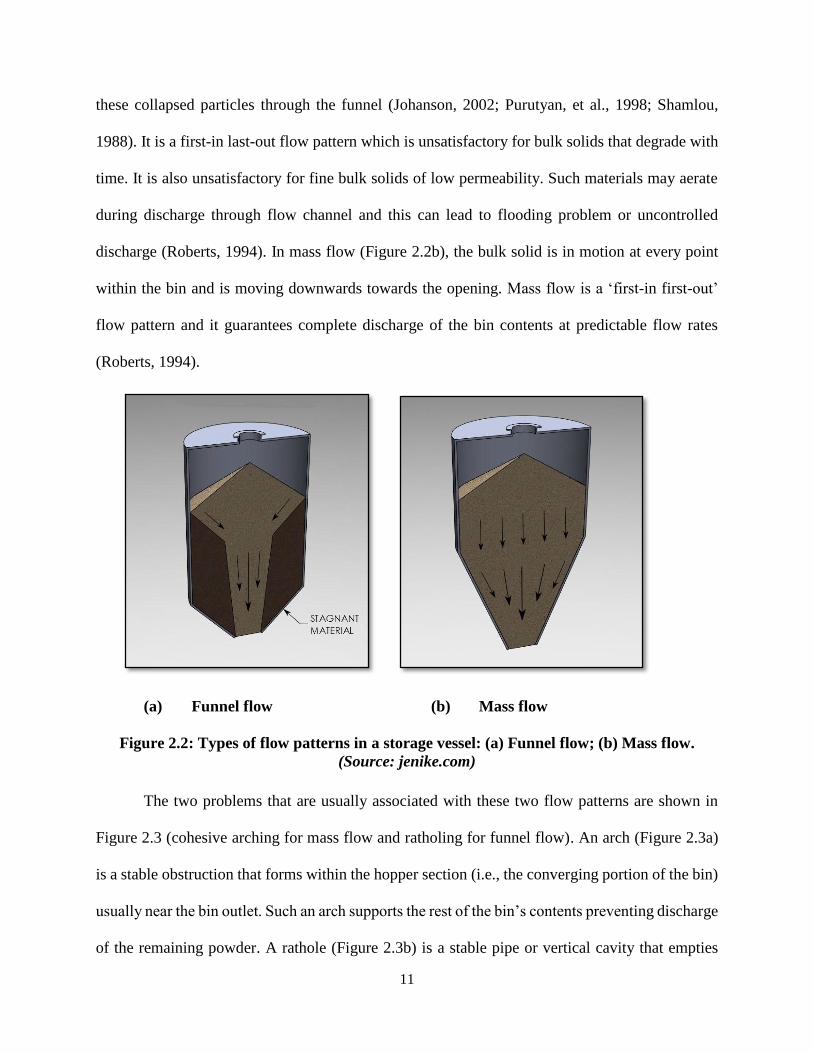
11
these collapsed particles through the funnel (Johanson, 2002; Purutyan, et al., 1998; Shamlou,
1988). It is a first-in last-out flow pattern which is unsatisfactory for bulk solids that degrade with
time. It is also unsatisfactory for fine bulk solids of low permeability. Such materials may aerate
during discharge through flow channel and this can lead to flooding problem or uncontrolled
discharge (Roberts, 1994). In mass flow (Figure 2.2b), the bulk solid is in motion at every point
within the bin and is moving downwards towards the opening. Mass flow is a ‘first-in first-out’
flow pattern and it guarantees complete discharge of the bin contents at predictable flow rates
(Roberts, 1994).
(a) Funnel flow (b) Mass flow
Figure 2.2: Types of flow patterns in a storage vessel: (a) Funnel flow; (b) Mass flow.
(Source: jenike.com)
The two problems that are usually associated with these two flow patterns are shown in
Figure 2.3 (cohesive arching for mass flow and ratholing for funnel flow). An arch (Figure 2.3a)
is a stable obstruction that forms within the hopper section (i.e., the converging portion of the bin)
usually near the bin outlet. Such an arch supports the rest of the bin’s contents preventing discharge
of the remaining powder. A rathole (Figure 2.3b) is a stable pipe or vertical cavity that empties

12
above the bin outlet. Material is left stranded in stagnant zones that usually remain in place until
an external force is applied to dislodge it. Flow problems such as ratholing and arching can result
in structural failure and damaging of silos, process inefficiencies, and frequent equipment
downtime (Prescott and Barnum, 2000; Johanson, 2002; Merrow, 1988).
(a) Cohesive arching (b) Ratholing
Figure 2.3: Typical flow problems associated with bulk solids (Source: jenike.com)
These flow problems have been documented to exist during the storage and handling of
ground biomass feedstock. This is due to the non-uniform particle sizes obtained after size
reduction and change in moisture content of biomass feedstock. Liu (2008) stated that ground corn
and DDGS are a mix of particulate materials in which the relative amounts of particles present,
sorted according to size affects the handling characteristics of the materials. The ground material
possesses a distribution of particle sizes which contributes differently to its flow behavior during
discharge from storage vessels. For example, Gil et al. (2012) carried out an experiment on the
handling characteristics of Cardoon (Cynara cardunculus L.), a herbaceous perennial plant used

13
as a biomass feedstock. Frequent and continuous bridging was observed during the discharge of
the ground whole cardoon (comprising of the capitula, stems and leaves) with particle size range
of 0.5 – 1.0 mm. This problem was attributed to the interlocking elongated particles of the stem
and the capitula hairs which possess a small diameter and a great length, hence having a tendency
to entangle, build up structures that trap other small sized particles which ultimately impeded the
flow. A better understanding of the contribution of the varying particle fractions to the overall
flowability of the whole ground feedstock can be achieved through fractionation.
Fractionation is the separation of a material into multiple component parts (Adapa et al.,
2004). Size sensitive fractionating or screening is a unit operation in which a mixture of various
sizes of solid particles can be separated into two or more fractions by passing over a screen. Screens
usually made from metal bars, perforated plates, perforated cylinders, woven cloth or fabrics are
employed for this operation. Screening (known as sieving) is also used for particle size analysis to
determine the size distribution of granular and powder materials (Brennan et al., 1969). Rosentrater
et al. (2006) however stated that size sensitive fractionation has the potential to achieve the
following: (i) more controlled particle size range manipulation to achieve desired specifications
for certain applications. For example; a decrease in particle size of a given mass of material leads
to an increase in the exposed surface area of the solid. This increase in area is of great importance
in many rate-dependent processes; (ii) separation of desired constituents from a composite stream.
Fractionation of ground woody biomass into size classes therefore will help in quantifying the
contribution of particle size to the physical and flow properties of the whole ground material, which
is the main focus of this research.

14
2.5 Physical Properties
Physical properties that are relevant to the handling, storage, and processing of biological
materials include bulk density, particle density, tap density, porosity and compressibility (Ortega-
Rivas, 2003). Ground loblolly pine is a bulk solid and therefore will possess typical flow issues
associated with bulk material. Physical properties are used to design new and retrofit existing bins,
hoppers and feeders; determine the basis of flow problems and understand differences between
various bulk materials or grades of the same material (Fitzpatrick et al., 2004). Particle size and
moisture content are two intrinsic factors that influence these physical properties; hence the need
to study the effect of particle size and moisture on physical properties of ground loblolly pine.
2.5.1 Bulk density
Bulk density is the ratio of the mass of a bulk material to its bulk volume. Bulk density
significantly impacts supply logistics, engineering design and operation of transportation
equipment, material handling systems and processing in the bio-refinery (Sokhansanj and Fenton,
2006; Woodcock and Mason, 1987). This is because bulk density is used in estimating storage
capacity and the amount of space needed during biomass logistics. Bulk density of granular and
biological materials, which is affected by particle size and moisture content, is also used in
describing the flowability of the materials. Flow indicators such as compressibility index and
Hausner ratio (HR) are calculated from the density values of the material (Abdullah and Geldart,
1999; Probst et al., 2013).
Bulk density generally decreases with increase in particle size. The larger particles
occupies more pore volume than the smaller particles, hence the higher bulk density of the smaller
particles up to a certain diameter. Mani et al. (2004) found an inverse relationship between bulk
density and particle sizes of corn stover and switchgrass. The bulk density of corn stover decreased

15
from 158 to 131 kg/m3 with an increase in the particle size from 0.19 to 0.41 mm. A similar trend
was reported for switchgrass with a decrease in the bulk density from 182 to 115 kg/m3 as particle
size increased from 0.25 to 0.46 mm. Manickam and Suresh (2011) reported a decrease in the bulk
density of coir pith from 200 to 100 kg/m3 with increased particle size from 0.655 to 0.925 mm.
Similar trend was reported for the bulk densities of ground canola (203 to 144 kg/m3), barley (155
to 99 kg/m3), oat (196 to 111 kg/m3) and wheat (154 to 107 kg/m3) with increase in particle size
from 0.37 to 0.89 mm, 0.46 to 0.88mm, 0.40 to 0.94 mm and 0.45 to 0.99 mm respectively (Adapa
et al., 2011).
However, when switchgrass was fractionated into size classes from 0.25 to 0.71mm, Lam
et al. (2008) reported that the bulk density was found to increase from 149 to 194 kg/m3 with
increased particle size. This change is attributed to the fact that biomass grinds collected after
fractionation exhibit different packing as compared to the unfractionated biomass grinds. A similar
observation was reported for the bulk density of fractionated ibuprofen powder (a pharmaceutical
powder). The bulk density increased from 350 kg/m3 to 440 kg/m3 with increase in particle size
from 46 to 215 µm. The bulk density of the larger fractions was also reported to be higher than the
bulk density (401 kg/m3) of the bulk mixture (Liu et al., 2008). This is an indication that the larger
particles have a strong effect on the bulk density of a bulk material.
Moisture content is the amount of water present in the biomass feedstock. Several
published studies have shown that moisture content significantly influences the bulk density of
biomass. As moisture content increases, there is a corresponding decrease in bulk density. This is
a result of the increase in mass due to moisture gain being lower than the accompanying volumetric
expansion of the bulk. The amount of storage space required for a given material will therefore
increase with moisture content increase (Colley et al., 2006). Peleg et al. (1973) and Peleg and

16
Moreyra (1979) studied the effect of moisture content on food powders’ bulk density. They
observed reduced bulk density of water-soluble powders upon increasing moisture content. The
reduction in powder bulk density was attributed to the presence of inter-particle liquid bridges
which kept them further apart and produced a more-open structure than if the particles were non-
cohesive. This effect also produced greater compressibility for moist powders than for dry
powders.
Bahram et al. (2013) reported a reduction in the bulk density of wormy compost from 854
to 658 kg/m3 as moisture content increased from 25 to 35 % (wb). Probst et al. (2013) also reported
that the bulk density of ground corn was found to decrease from 627.4 to 607.8 kg/m3 as moisture
content increased from 10.4 to 19.6% (wb). Similar trends were documented for granular
biological materials such as rice (Kibar et al., 2010), soybean (Deshpande et al., 1993) and green
gram (Nimkar and Chattopadhyay, 2001). This shows that the volume necessary to store or
transport biological materials (with identical mass) will increase as moisture content increases
(Littlefield et al., 2011).
2.5.2 Particle density
Particle density is the ratio of the average mass to average volume of particle that form the
bulk solid. Particle density measures the density of the particle matter excluding the air pores,
hence it is called true density (Ileleji and Rosentrater, 2008). Although, particle density is not
required in the design of storage silo, however it is an important parameter that is needed in the
design of systems for ventilation and cooling of biomass during storage (Fasina and Sokhansanj,
1995; Pabis et al., 1998). Particle density is also used as an indicator of the pelletability of a
material. Higher values result in good quality pellets and easier pelletability since less energy is
needed to achieve densification of the material (MacBain, 1966; Leaver, 1985). The relationship

17
between particle size and particle density of biological materials have been reported by several
authors. Gil et al. (2013) reported an increase in particle densities of poplar and cornstover from
1293 to 1457 kg/m3 and 1450 to 1472 kg/m3 respectively with a reduction in particle size from
0.70 to 0.26 mm. Mani et al. (2004) also reported an increase in the particle density of switchgrass
from 950 to 1170 kg/m3 as the particle size decreases from 0.46 to 0.25 mm at a moisture content
of 8% (wb). The increased particle density due to particle size reduction is because the smaller the
particle size, the lesser the air pores in the particle. This phenomenon has been confirmed for
DDGS particles (Ileleji et al., 2007).
Due to the exclusion of air pores during the measurement of particle density, the values
reported for most biological materials are relatively higher than bulk density. For example, Adapa
et al (2011) reported the particle density of barley at particle size of 0.46 mm to be 1149 kg/m3
while bulk density was reported to be 155 kg/m3. This shows that reduction of pore spaces among
particles will lead to higher density therefore enhancing effective logistics of biomass. However,
this will result in reduced flowability as the material will become compacted.
Similarly, particle density of biological material has been reported to generally decrease
linearly with increase in moisture content. For example, at a geometric mean diameter of 0.68 mm,
corn stover was reported to decrease in particle density from 1120 to 1112 kg/m3 with an increase
in moisture content from 7 to 15% (wb) (Mani et al., 2004). Bahram et al. (2013) reported a particle
density reduction from 1652 to 1443 kg/m3 of wormy compost with an increase in moisture content
from 25 to 35% (wb). This implies that the volume of biological materials increases at a higher
rate than the increase in mass as moisture content increases (McMullen et al., 2005).

18
2.5.3 Porosity
Porosity is a measure of the void spaces in a material, and is a fraction of the volume of
voids over the total volume with values that range between 0 and 100%. Porosity of a material can
be classified based on the bulk density and particle density of the material. For example, food
powders have bulk densities in the range of 300 to 800 kg/m3 while the particle density of most
food powders is about 1,400 kg/m3, so these values are an indication that food powders have high
porosity, which can be internal, external or both (Ortega- Rivas, 2009). Porosity can be a good
prediction of the sphericity or irregularity of the particles in a bulk solid. An average porosity
calculation of 0.4 is normal for spheroid particles, whereas irregular shaped or very small
particulates have higher porosity values (Woodcock and Mason, 1987). High porosity values are
a sign of logistical and economic problems that can be encountered during the storage and
transportation of biomass, unless some form of densification is utilized (Fasina, 2007).
Particle size and moisture content have a significant effect on porosity of biological
materials. Lam et al., (2008) reported an increase in porosity of ground corn stover from 0.91 to
0.94 with an increase in particle size from 0.25 to 0.71 mm. Littlefield (2010) also found the
porosity of pecan shell to significantly increased (p < 0.05) from 0.67 to 0.71 as particle size
increased from the 0.21 to 2.19 mm. However, Lam et al. (2008) reported that the porosity of
switchgrass decreased from 0.87 to 0.82 with increase in particle size from 0.25 to 0.71 mm. The
change in the trend may be due to the particle shape and type of the biomass. Although there was
a reduction in the porosity of switchgrass and increase in the porosities of pecan shell and corn
stover with increase in particle size, the values obtained for these three materials are typical of
extremely irregular-shaped particles that have cohesive tendencies (Woodcock and Mason, 1987).

19
Bahram et al. (2013) reported the particle and bulk densities of wormy compost at a
moisture content range of 25 to 35% (wb) and hammer mill screen size of 0.6mm to be 1554 –
1531 kg/m3 and 814 - 685 kg/m3. Based on these data, the porosity of wormy compost varies
between 0.52 – 0.45, which indicates a reduction in porosity with increase in moisture content.
Manickam and Suresh (2011) also reported a reduction in the porosity of coir pith from 0.86 to
0.62 with an increase in moisture content from 10.1% to 60.2% (wb). Increase in moisture content
of biological material causes volumetric expansion which is faster than increase in the mass of the
material, therefore this results to less air space among particles thereby leading to reduction in
porosity.
2.5.4 Compressibility
Compressibility is a measure of the increase in strength (or density) of powder-like
materials with increase in consolidating (normal) pressure and it is sometimes used to assess the
flowability of bulk material (Table 2.1, Fayed and Skocir, 1997). It is a direct function of the
elasticity of the material under applied pressure (Schulze, 1996). The two types of compressibility
in relation to biological materials are vibrational and mechanical compressibility.
Mechanical compressibility occurs due to applied weight above the material while
vibrational compressibility occurs when a bulk solid material is subjected to tapping/vibration (e.g
during transportation). Both mechanical and vibrational compressibility can occur at the same
time. For example, during transportation of a deep bed sample, the portion of the sample at the
bottom of the bed will experience both mechanical and vibrational compression (Fasina, 2008).
Mechanical compressibility is used as a measure of flowability. Table 2.1 shows that materials
with high compressibility are deemed to have low flowability (Fayed and Skocir, 1997).
20
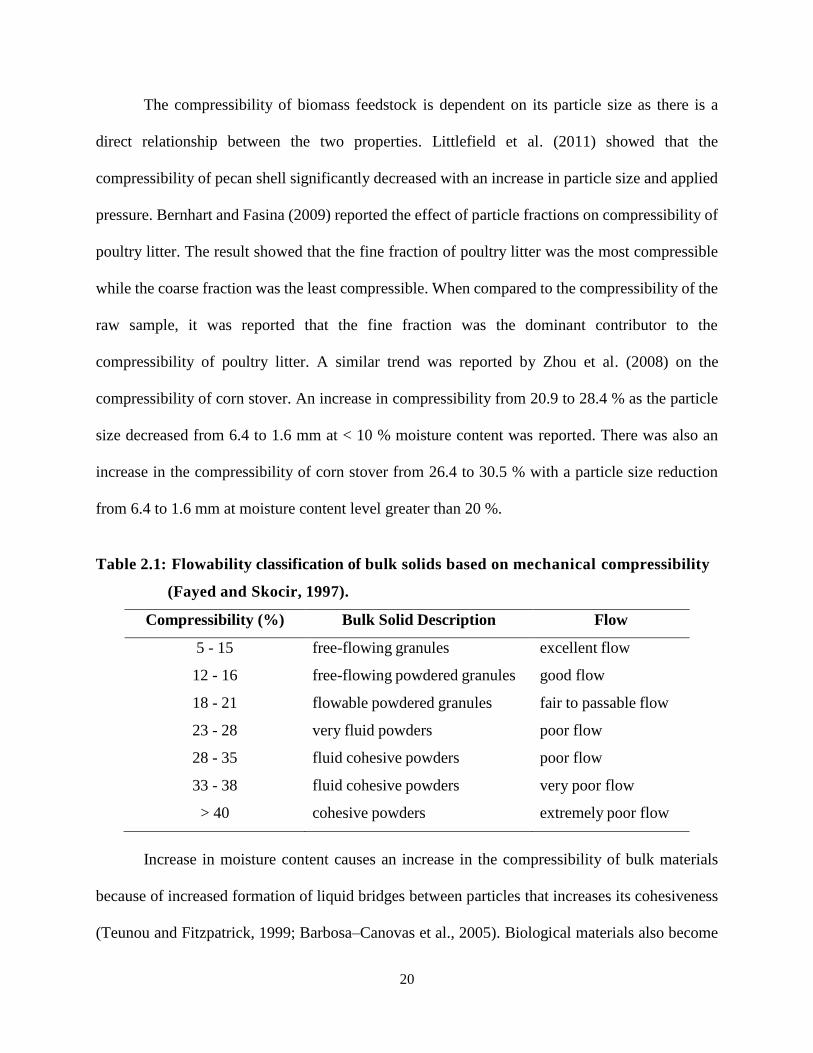
The compressibility of biomass feedstock is dependent on its particle size as there is a
direct relationship between the two properties. Littlefield et al. (2011) showed that the
compressibility of pecan shell significantly decreased with an increase in particle size and applied
pressure. Bernhart and Fasina (2009) reported the effect of particle fractions on compressibility of
poultry litter. The result showed that the fine fraction of poultry litter was the most compressible
while the coarse fraction was the least compressible. When compared to the compressibility of the
raw sample, it was reported that the fine fraction was the dominant contributor to the
compressibility of poultry litter. A similar trend was reported by Zhou et al. (2008) on the
compressibility of corn stover. An increase in compressibility from 20.9 to 28.4 % as the particle
size decreased from 6.4 to 1.6 mm at < 10 % moisture content was reported. There was also an
increase in the compressibility of corn stover from 26.4 to 30.5 % with a particle size reduction
from 6.4 to 1.6 mm at moisture content level greater than 20 %.
Table 2.1: Flowability classification of bulk solids based on mechanical compressibility
(Fayed and Skocir, 1997).
Compressibility (%) Bulk Solid Description Flow
5 - 15 free-flowing granules excellent flow
12 - 16 free-flowing powdered granules good flow
18 - 21 flowable powdered granules fair to passable flow
23 - 28 very fluid powders poor flow
28 - 35 fluid cohesive powders poor flow
33 - 38 fluid cohesive powders very poor flow
> 40 cohesive powders extremely poor flow
Increase in moisture content causes an increase in the compressibility of bulk materials
because of increased formation of liquid bridges between particles that increases its cohesiveness
(Teunou and Fitzpatrick, 1999; Barbosa–Canovas et al., 2005). Biological materials also become

21
softer and therefore deform more when they absorb moisture. The compressibility of ground corn
stover with particle size of 1.6mm was reported to increase from 28.4 to 30.5 % as the moisture
content increased from 10 to 20 % (wb). Littlefield et al. (2011) and Bernhart and Fasina (2009)
also reported the effect of moisture content on compressibility of pecan shells and poultry litter
respectively and found that the compressibility of pecan shells and poultry litter increased with
moisture content.
2.5.5 Hausner ratio
The ratio between tapped (defined as a certain number of taps) and aerated bulk density is
known as the Hausner ratio (Geldart et al., 1984). Hausner ratio (HR) is an empirical constant that
is sometimes used to assess the flowability of a bulk material (Table 2.2) (Fitzpatrick, 2003).
Abdullah et al. (2010) observed a reduction in the Hausner ratio of silica gel with increase in
particle size. Two distinctive sizes were observed as bordering criteria; silica gel of less than 28
µm particle size had a Hausner ratio < 1.25, hence classified as cohesive, silica gel with particle
size greater than 36 µm had a Hausner ratio >1.4, hence classified as free- flowing powder and
silica gel with particle size in between 28 and 36 µm were said to be in transition group (i.e
exhibiting mixed cohesive and free flowing powder behavior). Liu et al. (2008) also reported a
reduction in the Hausner ratio of fractionated ibuprofen powder 1.39 to ~1.25 with increased
particle size from 46 to 215 µm. This is an indication of improved flowability with increase in
particle size. Liu et al. (2008) further observed that the fractionated powder had a lower Hausner
ratio as compared to the bulk powder in which even the smallest size fraction has a Hausner ratio
smaller than that of the bulk powder. Similar trend of reduction in Hausner ratio with increased
particle size were also reported for biological materials (wheat straw, switchgrass and corn stover)
by Lam et al. (2008).

22
Table 2.2: Flowability classification using Hausner ratio (Source: Carr, 1965).
Hausner ratio Flow character
1.00-1.11 Excellent
1.12-1.18 Good
1.19-1.25 Fair
1.26-1.34 Passable
1.35-1.45 Poor
1.46-1.59 Very poor
>1.60 Very, very poor
On the other hand, moisture content has been reported not to have significant effect on
Hausner ratio. This is because the reduction rate of bulk density is similar to the rate of decrease
of tap density as moisture content decreases (Bernhart and Fasina, 2009). Zhou et al. (2008)
observed that there was no significant difference between the Hausner ratio values obtained for
wet (> 20% MC) and dry (< 10% MC) corn stover samples within the particle size range of 6.4-
1.6 mm. The values were in the range of 1.3-1.5 which was indicative of poor flow characteristic.
This was also in accordance to the result obtained by Emery et al. (2009) for Hydroxypropyl
Methylcellulose (HPMC, a pharmaceutical powder). Moisture content (0% – 10 % wb) was
observed not to have any significant effect on the Hausner ratio of HPMC. Also, a similar trend
was observed by Emery et al. (2009) for Aspartame powder with moisture content range of 2 to
10% (wb). However the values reported for both powders (1.3–1.7) were above the threshold value
of 1.25, which is an indication of poor flow characteristics. Probst et al. (2013) also reported that
moisture content (10.39 – 19.64% wb) had no significant effect on Hausner ratio (1.5- 1.6) of
ground corn.

23
2.6 Flow Properties
Bulk material properties that influence flow or flowability are termed flow properties. Flow
properties are used in designing and sizing equipment for storage, transportation, or general
handling of bulk solids that will lead to reliable and consistent flow of bulk solids out of hoppers
and feeders. Flow properties are also used in investigating the cause of flow problems of bulk
solids (Prescott and Barnum, 2000; Schwedes, 2003). Flow properties of bulk solid materials
includes: flow function, cohesion, angle of internal friction and angle of wall friction.
Particle size and moisture content are one of the most important intrinsic bulk material
characteristics which affect the flowability (or flow properties) of bulk materials. In general,
materials with narrow particle size distribution have a better flow than materials with wider particle
size distribution (Benkovic and Bauman, 2009). Also, it is generally considered that materials with
particle sizes larger than 200 µm are free flowing, while fine powders with particle sizes less than
200 µm are subject to cohesion and flowability problem. The reduced flowability at smaller
particle sizes is because of the increased surface area per unit mass of the material. There is more
surface area or surface contacts available for frictional forces to resist flow (Fitzpatrick, 2005;
Teunou et al., 1999; Fitzpatrick, 2007).
Flowability of bulk solids is commonly determined using procedures developed by Jenike
(1964). The procedure employs the principle of plastic failure with the Mohr Coulomb failure
criteria. The Jenike shear cell unit (Figure 2.4) is used in quantifying properties such as unconfined
yield strength, major consolidation stress, angle of internal friction and flow function (Bhadra et
al., 2009; Thomson, 1997).

24
Figure 2.4 Jenike shear cell (Zulfiqar et al., 2006).
Jenike’s method involves pre-consolidating the samples to be tested under different normal
stresses until a steady state is reached. Upon reaching a steady state, a consolidating pressure and
a horizontal shear force are applied to the sample. The shear stress required to cause the sample to
fail under the applied consolidation stress will be measured. A yield locus (Figure 2.5), which is a
plot of the failure shear stress versus normal stress for a given consolidation stress is then plotted.
The test can be replicated to obtain different yield loci (Chen et al., 2012; Bhadra et al., 2009;
Fitzpatrick et al., 2004).
Measurement of wall friction properties with Jenike shear tester involves replacing the base
of the shear cell with a sample of the wall material to be examined (such as stainless steel, mild
steel or galvanized steel) as shown in Figure 2.4 (Chen et al., 2012). This test is used in determining
the wall material needed for consistent and reliable flow out of a storage silo or bin.

25
Figure 2.5: Typical plot of yield loci of a bulk solid (Schulze, 2008).
2.6.1 Cohesion
Cohesion is the mutual attraction and resistance to separation of contacting particles of
identical material (Nokhodchi, 2005). Cohesion in bulk solid materials is commonly caused by
liquid bridges and Van der Waals forces (Weber et al., 2004). Liquid bridges are formed by small
regions of liquid in the contact area of particles, in which due to surface tension effects, a low
capillary pressure prevails. Van der Waals’ force is a weak intermolecular force that exists between
particles (Schulze, 2006). High moisture content and small particle size enhances high cohesive
strength in biological materials which can lead to flow problems such as caking, arching and
ratholing.
Krantz et al. (2009) measured the flow properties of two coating powder samples
(Polyester-Epoxy and Polyurethane) with particle sizes ranging between 22 and 31 µm. The
authors found that the cohesion increased with decreasing particle size for both powder
formulations. This resulted because the finer the particle size, the more contact area between
particles, which leads to greater cohesive forces among the particles (Marinelli and Carson, 1992).

26
Gil et al. (2013) reported the particle size effect on cohesion of ground poplar and corn stover. The
authors also observed an increase in cohesion from 0.14 to 0.64 kPa for ground poplar with
reduction in particle size from 0.61 to 0.30 mm. The cohesion of ground corn stover was also
reported to increase from 0.16 to 0.68 kPa with reduction in particle size from 0.70 to 0.26 mm. A
similar trend was documented for wormy compost where cohesion increased from 0.23 to 0.81
kPa as particle size reduced from 1.18 to 0.30 mm (Bahram et al., 2013).
Moisture content is an important variable that also affects cohesive strength of bulk solids
(Johanson, 1978) during storage with cohesion generally increasing with moisture content
(Fitzpatrick et al., 2004). The cohesion of pecan shells was found to increase from 0.36 to 1.69
kPa as moisture content increased from 4.2 to 24.6% wb (Littlefield et al., 2011). Increased
cohesion due to increase in moisture content was reported for flour powder, tea powder and whey
permeate powder by Teunou and Fitzpatrick (1999). The authors observed that the strength of
liquid bridges formed between particles depends on the amount of moisture adsorbed by the
particles. This trend was also in accordance with Rennie et al. (1999) work on whole milk powder
and skimmed milk powder. Buma (1971) hence concluded that increase in cohesion at higher
moisture content was due to increased plasticity of powder particles. The increased moisture
content could have softened the water soluble constituents of the bulk material, resulting in
deformation of the particles hence leading to higher contact surface and cohesiveness. In another
research, Hargreaves et al. (2010) reported the cohesion of superheated steam dried distiller’s spent
grain of 0% soluble content to increase between 0.078 to 0.324 kPa within moisture content range
of 5 to 15% (wb). Unloading of bulk material using gravity discharge alone requires that cohesive
strength do not exceed a critical value of 2 kPa (Puri, 2002).
27
2.6.2 Angle of wall friction
Angle of wall friction is the resistance to flow of bulk solids along the hopper/silo wall
material. Wall friction also represents the adhesion of bulk solid to the wall material of the storage
equipment. Increase in angle of wall friction during storage can lead to difficulties in unloading
bulk material from storage equipment. This flow property is a function of the bulk material and
the wall surface in contact with it (Prescott et al., 1999; Iqbal and Fitzpatrick, 2006).
Wall friction is a critical parameter in the design and selection of storage equipment. A low
wall friction value results in higher normal loads being transferred onto the wall surfaces of the
silo (Iqbal and Fitzpatrick, 2006).Wall friction value is also required in determining the minimum
hopper angle of hopper and selection of the type of surface finish to be used in lining wall of the
storage equipment. Wall friction characteristics are influenced by factors such as wall surface
characteristics (e.g surface roughness, wear and corrosion), properties of the bulk solids (e.g.
particle size and moisture content) and storage/handling conditions (Iqbal and Fitzpatrick, 2006).
Smaller particle sizes tend to increase wall friction angle, as there is greater contact surface
area between smaller particles and the wall surface. This is in accordance with Fitzpatrick et al.
(2004). The wall friction angle (18.20) of soy flour with particle size of 20.2 µm was found to be
higher than wall friction angle (130) of corn flour with particle size of 49 µm.
Moisture content plays a fundamental role in combination with the kind of wall surface.
The effect of moisture content on angle of wall friction varies with the type of wall surface used.
Increased moisture content will cause the particles to become stickier resulting in increased
adhesion of the particles to the wall of storage containers (Iqbal and Fitzpatrick, 2006). Duffy and
Puri (1996) observed that the angle of wall friction of confectionery sugar on stainless and
aluminum surface decreased from 31.00 to 24.20 and 32.20 to 29.20 respectively with increase in

28
moisture content from 0.3 to 3.2% (wb). However, increase in angle of wall friction was observed
for detergent powder on stainless steel (14.60 to 20.80), galvanized steel (16.40 to 29.00) and
aluminum surface (25.60 to 33.40) with increase in moisture content from 1.38 to 4.22 % (wb).
Increased wall friction angle with increase in moisture content have been documented for ground
poplar and corn stover (Gil et al., 2013) and flour, tea and whey permeate flour (Iqbal and
Fitzpatrick, 2006).
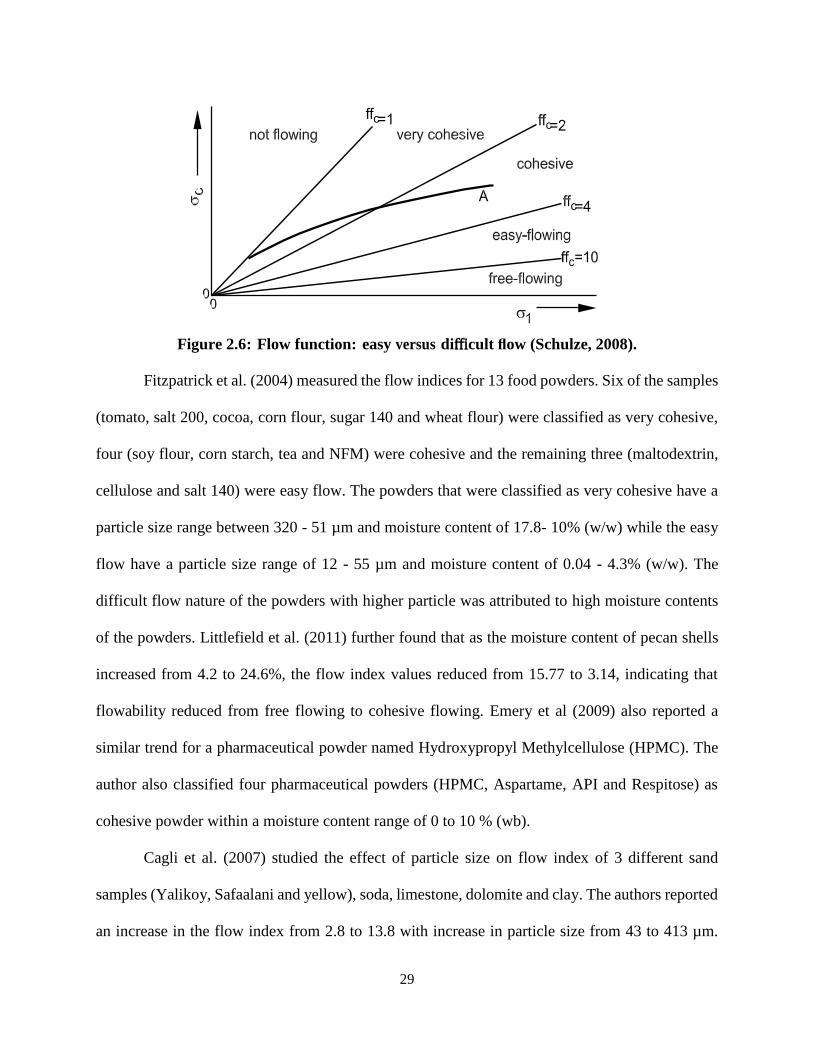
2.6.3 Flow function and index
Flowability of a bulk solid is characterized mainly by its unconfined yield strength as a
function of the consolidating normal stress. The unconfined yield strength of a material is the force
or stress required to deform or break a material when it is not confined by a container (free
unstressed surface. It can also be expressed as the stress required to fail or fracture a consolidated
mass of material to initialize flow. Major consolidation stress is the force required to
consolidate/compress a mass of material. The slope of the plot of the unconfined yield strength of
the powder versus major consolidating stress is the flow function (Figure 2.6). A flow function
lying towards the bottom of the graph represents easy flow, and more difficult flow is represented
as the flow function move upwards in an anticlockwise direction. The flow index (ffc) is defined
as the inverse of the flow function. Jenike (1964) used the flow index to classify powder flowability
(Table 2.3).
Table 2.3: Jenike classification of powder flowability by flow index (ffc).
Flowability Hardened Very cohesive Cohesive Easy flow Free flowing
Flow index (ffc )
<1 <2 <4 <10 >10
29
Figure 2.6: Flow function: easy versus difficult flow (Schulze, 2008).
Fitzpatrick et al. (2004) measured the flow indices for 13 food powders. Six of the samples
(tomato, salt 200, cocoa, corn flour, sugar 140 and wheat flour) were classified as very cohesive,
four (soy flour, corn starch, tea and NFM) were cohesive and the remaining three (maltodextrin,
cellulose and salt 140) were easy flow. The powders that were classified as very cohesive have a
particle size range between 320 - 51 µm and moisture content of 17.8- 10% (w/w) while the easy
flow have a particle size range of 12 - 55 µm and moisture content of 0.04 - 4.3% (w/w). The
difficult flow nature of the powders with higher particle was attributed to high moisture contents
of the powders. Littlefield et al. (2011) further found that as the moisture content of pecan shells
increased from 4.2 to 24.6%, the flow index values reduced from 15.77 to 3.14, indicating that
flowability reduced from free flowing to cohesive flowing. Emery et al (2009) also reported a
similar trend for a pharmaceutical powder named Hydroxypropyl Methylcellulose (HPMC). The
author also classified four pharmaceutical powders (HPMC, Aspartame, API and Respitose) as
cohesive powder within a moisture content range of 0 to 10 % (wb).
Cagli et al. (2007) studied the effect of particle size on flow index of 3 different sand
samples (Yalikoy, Safaalani and yellow), soda, limestone, dolomite and clay. The authors reported
an increase in the flow index from 2.8 to 13.8 with increase in particle size from 43 to 413 µm.

30
Clay which has a particle size of 43 µm was found to have the lowest flow index of 2.8, which is
an indication of cohesive flow while the soda with flow index of 13.8, is classified as free flowing
material. The other materials were classified as easy flowing. The high flow indices observed for
these materials is in accordance with Woodcock and Mason (1993) conclusion, that free flowing
materials such as dry sand, have zero unconfined yield stress, and hence a cohesive arch cannot
occur. Similarly, Liu et al. (2008) observed an increase in the flow index of fractionated
magnesium stearate lubricated ibuprofen powder from 5.1 to 11.1 with increase in particle size
from 53 to 250 µm. It was also noted that the smallest fraction with particle size 53 µm has a flow
index slightly lower than the bulk mixture. However, based on Jenike classification, the
fractionated magnesium stearate lubricated ibuprofen powder is classified as east flowing.
2.6.4 Design of hopper for mass flow
A hopper is the conical or converging section of a powder storage vessel through which
the stored materials flows out (Holdich, 2002). The storage equipment is very crucial in any bulk
solids handling installation. This is because occurrence of flow problems adversely affects the
downstream production line because of the erratic supply of material. For a system to operate
satisfactorily, bulk solid must flow from the hopper when required and in a predictable manner.
Thus, as with any other part of the handling system, gravity-flow storage hoppers should be
designed or selected to handle the actual product under consideration (Woodcock and Mason,
1987).
One of the important applications of flow properties is the design of discharge hoppers.
Design of a discharge hopper to ensure consistent and reliable discharge involves determining the
minimum hopper half angle (to the vertical) and discharge opening size. The minimum hopper half
angle is designed to ensure a mass flow (Figure 2.2b), which is the preferred flow pattern for a

31
consistent and reliable flow. If the hopper half angle is less than this angle, then it is likely that a
funnel flow pattern (Figure 2.2a) will exist (Holdich, 2002; Teunou et al., 1999; Fitzpatrick, 2007;
Iqbal and Fitzpatrick, 2006). The flow properties required for designing a discharge hopper are
flow function (FF), the effective angle of internal friction, angle of wall friction and bulk density.
Jenike’s mathematical methodology is the engineering standard practice for designing a
hopper i.e for calculating the minimum hopper angle and opening size for mass flow. Jenike’s
design approach is based on calculation of stresses inside the hopper and postulates that the major
consolidating stress (σ1) in the lower part of hopper is proportional to the distance from the vertical
hopper apex. Jenike (1964) solved the stress equations and determined the borderlines between
funnel flow and mass flow in conical or wedge shaped hoppers as a function of angle of wall
friction, hopper half angle and the effective angle of internal friction, as shown in design chart
(Figure 2.7). The steps employed in using the flow properties are (Fitzpatrick et al., 2004):
Values of effective angle of internal friction and angle of wall friction are used in calculating
the hopper half angle (θ) and the flow factor (ff).
The critical applied stress (CAS) is determined from the intersection of the flow function and
the flow factor line (Figure 2.8)
The hopper opening size is then calculated using the values of CAS, hopper half angle and
bulk density. For example, the opening diameter for a conical hopper is given below
𝐷 =𝐻(θ). CAS
𝜌𝐵.𝑔
where H is a function of the hopper half angle, ρB is the bulk density and g is the gravitational
acceleration constant.

32
Figure 2.7 Hopper design chart for a conical hopper based on the Jenike’s theory.
(Source: Maynard, 2013)
Figure 2.8: Evaluation of critical applied stress (CAS).
(UYS is the unconfined yield strength and MCS is the major consolidation stress).
Flow factor
line
Flow function
Critical
Applied Stress
Major Consolidation Stress (kPa)
Unconfined
Yield Stress
(kPa)
Funnel Flow
Mass Flow

33
Summary
The necessity for an effective and efficient storage and handling vessels for lignocellulosic
biomass is due to the large amount estimated to be produced annually from the abundant biomass
resources in the United States. Therefore. improper design and selection of storage vessels can
results in biomass degradation, material loss, flow blockage and/or safety problems.
The use of biomass requires feedstock in particulate form. However, ground biomass
obtained after size reduction have non- uniform particle size and also as a biological material, it
has a tendency to exchange moisture with the environment. Therefore, ground biomass will have
the typical flow problems associated with bulk materials during storage.
Characterization of particle size and moisture effect on physical and flow properties of
biomass will enhance a better prediction of biomass flow behavior and design of an appropriate
storage vessel. Obtaining a reliable and consistent flow out of storage equipment is critical to
successful biofuel production. Hence, the design of storage equipment requires the understanding
of the physical and flow properties of the biomass. The physical and flow properties include
density (bulk, tap and particle), compressibility, Hausner ratio, porosity, flow index and frictional
properties (cohesion, angles of wall friction and internal friction).
Loblolly pine, an energy feedstock which has been identified as a potentially significant
source of fuel, is the most commercially important species in the southeast United States due to its
rapid growth and ease of establishment. Hence, the focus of this research is to investigate the
contribution of particle size and moisture content to flowability of fractionated ground loblolly
pine in order to ensure a proper design of silo which will allow easy flow of biomass without
obstruction or dust generation.

34
Chapter 3: Particle Size and Moisture Effect on Physical Properties of Fractionated
Ground Loblolly Pine
3.1 Abstract
Particle size and moisture content are two intrinsic biomass characteristics that influence its
physical properties. This study focused on the contribution of particle size and moisture content to
the physical properties of fractionated ground loblolly pine. Loblolly pine chips were ground
through a hammer mill fitted with a 3.18 mm screen and the moisture content of the ground
biomass was adjusted between 4.78 and 25.53% (wb). The moisture adjusted ground biomass was
fractionated into six size classes with 250 µm to 1.40 mm screen aperture and the physical
properties of the fractions were quantified. The particle size distribution of the unfractionated
sample was unimodal and skewed to the left. An increase in moisture content resulted in a wider
spread of the particles in the particle size distribution of the fractionated samples. The geometric
mean diameters for the fractions ranged from 0.10 mm to 2.38 mm. Bulk and tap densities of the
fractions increased with fraction size while particle density generally decreased with increase in
fraction size. The densities (bulk, particle and tap) and porosity decreased with increased moisture
content. Moisture content had no significant effect on compressibility and Hausner ratio. The
heating values (18-19 MJ/kg) and volatile matter (84.91 - 87.48% d.b) were not affected by the
fraction size while ash content (0.22 - 2.64% d.b) increased with reduction in the fraction size.
35
3.2 Introduction
Loblolly pine grows naturally in the southern region of the United States because of its
adaptability to variety of soil, its rapid growth rate and ease of establishment. It grows on about
11.7 million ha (29 million acres) in the south, which is about one-half of the standing pine volume
in this region. Therefore, it has been identified as the most commercially important species in the
southeast United States (Baker and Langdon, 2013; Cunningham et al., 2008) and also as a
potentially significant renewable and sustainable source of biomass feedstock that can be
converted to useful energy forms.
In the southern United States, woody biomass for energy is typically harvested, pre-
processed, transported and used, all within several days. Due to supply and demand imbalances
that relate to inclement weather and energy prices (Rupar and Sanati, 2004), there is a need for
adequate storage capabilities. Proper storage of woody biomass during excess production when
demand exceeds supply is an important step in ensuring a reliable, continuous supply of feedstock.
Selection and design of biomass handling and storage equipment strongly depends on the physical
properties of biomass feedstock, therefore, the physical properties of biomass need to be
determined (Wu et al., 2011).
Physical properties of biomass are used in designing handling and logistic systems,
estimating capacity of storage vessels, determining quality of feedstock supplied to the refinery
and final conversion process (Tumuluru et al., 2014). Physical properties required in the selection
and design of an appropriate storage vessel includes densities (bulk, tap and particle), porosity,
compressibility and Hausner ratio.

36
Bulk density is the ratio of the mass of a bulk material to the bulk volume. Knowledge of
bulk density is essential in designing and estimating the capacity of storage bins, hoppers,
conveying and conversion equipment. Particle density is the ratio of the average mass to the
average volume of the particles. Higher particle density signifies higher compression and energy
density (Mani et al., 2006). Tap density is an increased bulk density attained after mechanically
tapping a vessel containing the material (US Pharmacopeiai, 2011). Porosity is a measure of the
void spaces in a material (Rahman, 2005). Compressibility is a measure of the increase in strength
of powder-like material with increase in consolidating normal pressure (Schulze, 1996). Hausner
ratio is an empirical constant which indicates the ratio of tapped density and bulk density. It is used
to assess flowability of bulk solid (Fitzpatrick, 2003).
The use of loblolly pine will require the feedstock to be ground into particulate form.
However, ground biomass obtained after the size reduction process possesses non-uniform particle
sizes. Particle size and moisture content have been documented to significantly affect the physical
properties of biological materials (Manickam and Suresh, 2011; Adapa et al., 2011; Bahram et al.,
2013; Probst et al., 2013). Also, fractionation of biomass into size classes has been documented to
enable the fundamental understanding of contribution of fractions to the properties of bulk
biological materials (Ndegawa et al., 1991; Bernhart and Fasina, 2009). Therefore, the objectives
of this study were (1) to quantify the effect of particle size on the physical and compositional
properties, and (2) quantify the effect of moisture content on the physical properties of fractionated
ground loblolly pine.

37
3.3 Materials and Methods
3.3.1 Sample preparation
Clean loblolly pine wood chips used in this study were collected from West Fraser Inc.
Sawmill, Opelika, Alabama. Before use, the samples were ground through 3.18 mm screen using
a hammer mill (Model 358, New Holland grinder, New Holland, PA).
Experiments were carried out on the ground samples that were adjusted to five moisture
content levels between 4.78% and 25.56% (wb). The initial moisture content of the samples after
grinding was 8.69% (w.b). To adjust the moisture content of the samples to the desired level, the
samples were either dried using a humidity chamber (ESL-2CA, Espec North America, Inc.) set
at a temperature of 50 0C and relative humidity of 20% (for moisture content reduction) or the
samples were sprayed with a known volume of water (to increase the moisture content of samples).
After moisture adjustment, the samples were stored in an air tight container for 24 hours to allow
moisture equilibration to take place. The moisture contents of samples were then verified with a
moisture analyzer (model MB 45, Ohaus Corporation, Pine Brook, NJ).
A sieve shaker (RO-TAP Model RX- 29, WS Tyler, OH) was used in fractionating the
moisture adjusted ground samples into six fractions by fitting the sieve shaker with a #12 (1.4 mm
aperture), #18 (1.0 mm aperture), #25 (710 µm aperture), #35 (500 µm aperture), #60 (250 µm
aperture) screens and pan. The choice of sieve sizes was based on preliminary study on the particle
size distribution of the raw ground samples. The particle size distributions of the raw and
fractionated samples were determined according to ASABE Standard S319.3 (ASABE Standards,
2008). The physical properties of the fractions were carried out at each moisture level while the
compositional properties were carried out on a dry basis.

38
3.3.2 Particle size distribution
A digital image analysis system (Model Camsizer, Retsch Technology, Haan, Germany)
equipped with two digital cameras was used to measure the particle size of the sample fractions.
Approximately, 50 g mass of the sample was loaded onto the hopper of the instrument. The sample
was then conveyed and dropped via a vibratory feeder onto the measurement field of the cameras.
The particle size distribution on volume basis of the sample was recorded and analyzed by the
software provided by the equipment manufacturer. The procedure was carried out in triplicate after
which the geometric mean diameter and geometric mean standard deviation were calculated from
the data obtained from the equipment software according to ASABE Standard S319.3 (2008) as
follows:
dgw= log-1
[∑ (Wilogd̅i)
ni=1
∑ Wini=1
] 3.1
Slog= [∑ (logd̅i-log dgw)
2ni=1
∑ Wini=1
]
1/2
3.2
Sgw= 1
2dgw [log
-1Slog-(log
-1Slog)
-1] 3.3
where; dgw = geometric mean diameter or median size of particles by mass (mm);
Slog = geometric standard deviation of log normal distribution by mass in 10-based logarithm
(dimensionless);
Sgw = geometric standard deviation of particle diameter by mass (mm);
Wi = mass on ith sieve (g);
n= number of sieves plus one pan;
di = (di×di+1)1/2
di = nominal sieve aperture size of the ith sieve (mm);
di+1 = nominal sieve aperture size of the ith+1 sieve (mm)

39
3.3.3 Bulk density
Bulk density was determined by a bulk density measuring apparatus (Burrows Co.,
Evanston, Illinois, US) and according to ASABE Standard S269.4 (ASABE, 2007). This method
involves pouring the sample fraction into a container (volume of 1137 mm3) from a funnel. The
material was leveled across the top of the surface of the container and weighed. The bulk density
(ρb) of the fraction was taken as the mass of sample in the container (mc) divided by the volume
(Vc) of the container (Equation 3.4) (Littlefield et al., 2011). This procedure was performed in
triplicate.
ρ𝑏 = 𝑚𝑐
𝑉𝑐 3.4
3.3.4 Particle density
A gas comparison pycnometer (Model AccuPyc 1340, Micromeritics Instrument Corp.,
Norcross, GA) was used to determine the particle density of the sample. In the pycnometer, helium
under pressure was allowed to flow from a previously known reference volume into a cell
containing a sample of the material. By applying the ideal gas law to the pressure change from the
reference cell to the sample cell, the pycnometer calculates the volume of the material in the sample
cell. Particle density was taken as the ratio of the mass of material in the sample cell to the volume
measured by the pycnometer. A digital balance accurate to 0.001 g (Model AR3130, Ohaus Corp,
Pinebrook, NJ) was used to measure the sample mass. The particle density measurements were
conducted in triplicate and the average values were used (Bernhart and Fasina, 2009).
Porosity (ø) was calculated from the values of bulk density and particle density using the
equation below:
ø = 1 - 𝜌bulk
𝜌particle 3.5

40
3.3.5 Tap density, compressibility and hausner ratio
Tap bulk density of the sample was measured using an automated tap density meter (Model
TD-12, Pharma-Alliance Group Inc., Valencia, CA) and according to ASTM Standard B527
(ASTM, 2005). A 250 mL graduated cylinder was filled with the sample and weighed. The cylinder
was then placed in the tap density tester. Tapping of the cylinder (500 times) at a rate of 300
taps/min was then carried out by the tester. Each tap consisted of the cylinder being raised 14 mm
and then dropped under its own weight. After the first 500 taps, the new volume of the sample was
recorded. The cylinder was then tapped 750 times and a second new volume recorded. If the
difference in volume after the 500 taps and the 750 taps was >2%, the process was repeated;
otherwise the experiment was completed. After the completion of tapping, the tap density (ρt) of
the sample was taken as the mass of sample in the container (mc) divided by the volume (Vt) of
the sample after the completion of the tapping (Equation 3.6) (Bernhart and Fasina, 2009). This
procedure was performed in triplicate.
ρt = 𝑚𝑐
𝑉𝑡 3.6
Compressibility is a measure of the relative volume change of a fluid or solid as a response
to a pressure change. The compressibility values for the sample fractions at each moisture level
were obtained from the same equipment used for tap density.
Hausner ratio is the ratio of average tap density to average bulk density of the sample
(Equation 3.7). The Hausner ratio for each fraction was also provided by the software of the tap
density equipment.
𝐻𝑟 =ρ𝑡
ρ𝑏 3.7

41
3.3.6 Composition and energy determination
3.3.6.1 Sample preparation
According to ASTM standards E 872, the fractionated samples with geometric mean
diameter above 1 mm were ground through a Wiley mill with screen size of 1mm for further size
reduction to ensure thorough intermix and homogeneity of the samples. The size-adjusted samples
were analyzed for energy, ash and volatile content.
3.3.6.2 Energy content
The heating value of the sample fractions was measured using a bomb calorimeter (Model
No. C200, IKA Works Inc., Wilmington, NC). Approximately 0.5 g of a sample was compressed
with a press (Model No.-C21, IKA Works Inc., Wilmington, NC) to form a pellet and then placed
in a steel container. Cotton thread connected to an ignition wire was used to ignite the sample after
the sample was placed in the container and pressurized to 30 bars. The bomb calorimeter was filled
with water and the pressurized steel container placed in the bomb calorimeter where combustion
occurred. The heating value after the combustion process was displayed on the software screen
provided by the manufacturer.
3.3.6.3 Ash content
Ash content of the sample fractions was determined according to the NREL Laboratory
Analytical Procedure (LAP, 2005). About 1g ± 0.1 of the sample was placed in a crucible and then
transferred into a muffle furnace (Model No.-F6020C, Thermoscientific, Dubue, IO). The furnace
was programmed to heat up to 105˚C, ramped to 250˚C at 10˚C/minute and held at this temperature
for 30 minutes. After this, the temperature was ramped to 575˚C at 20˚C/min and held for 180
minutes and then finally lowered to 105˚C. Crucibles and contents were then placed in the
desiccator for 1 hour and allowed to cool to room temperature. The mass of the samples was

42
measured to 0.1 mg using a weighing balance. Ash content on dry basis was calculated according
to equation 3.8.
Ash (% d.b) = [100(Mcs-Mca)
Mcs- Mc] - (
100 Mwb
100-Mwb) 3.8
Mca is the mass of crucible and ash (g)
Mc is the mass of the crucible (g)
Mcs is the mass of crucible and sample before heating (g)
Mwb is the moisture content on wet basis (% w.b)
3.3.6.4 Volatile matter
Volatile matter of the sample fractions was measured according to ISO 562 (ISO 562,
2010). About 1g ± 0.1 of sample was placed in crucibles. The crucibles were placed in a volatile
matter furnace (Model No.-VMF 10/6/3216P, Carbolite, Hope Valley, England) at 900˚C for 7
mins. Crucibles and contents were then removed from the furnace and placed in a desiccator to
cool down to room temperature. The final mass of the crucibles with sample was measured and
the volatile matter (Vd) on dry basis was calculated as follows;
Vd= [100(M2-M3)
M2- M1] - (
100 Mwb
100-Mwb) 3.9
M1 is the mass of the empty crucibles with lid (g);
M2 is the mass of the crucibles and sample with lid before heating (g);
M3 is the final mass of the crucibles and sample with lid after heating (g);
Mwb is the moisture content on wet basis (% w.b)

43
3.3.7 Experimental design and statistical analysis
Particle size and moisture content of fractionated ground loblolly pine were the predictors
while the response variable was the physical properties. Aside from the particle size distribution,
all the experiments were carried out in triplicate.
Microsoft Excel 2010 was used in summarizing and generating graphs. A significant test
(α <0.05) using the Proc GLM procedure in the statistical software SAS 9.3 (SAS Institute Inc.,
Cary, NC) was conducted to show the effect of particle size and moisture content on the physical
properties. The Tukey test was also used to compare the means of values of these properties at the
different moisture contents and particle sizes. The results were presented in mean and standard
deviation.
3.4 Results and Discussion
3.4.1 Particle size distribution
Figure 3.1 shows the particle size distribution of the unfractionated ground loblolly pine.
The curves are left skewed which represent naturally occurring particle population (Rhodes, 1998).
A similar trend has been reported for biological materials (Probst et al., 2013; Yang et al., 1996;
Mani et al., 2004).The particle size distributions of the unfractionated ground samples are
unimodal. Also, at the 25.53% moisture levels, a wider distribution existed with most of the
particles falling uniformly between 0 and 6 mm as compared to the other curves. This result is an
indication of wider spread of particles at higher moisture level. Probst et al. (2013) also reported a
similar result for ground corn at 10.39% moisture content having a narrower distribution and a
wider distribution at higher moisture content of 16.02 and 19.64% (wb).

44
Figure 3.1: Particle size distribution of unfractionated ground loblolly pine.
Figure 3.2(a-f) shows the particle size distributions of the fractionated ground loblolly pine
at the five moisture levels. As the size of the fraction increases, the particle size distribution move
from been left skewed to a symmetric distribution. This change was more vivid with the particle
distribution of fraction size 1.40 mm. The change in particle size distribution with increase in
fraction size, shows that the log-normal distribution of biological materials is as a result of fine
particles in the material. Benkovic and Bauman (2009) observed that powders with narrow particle
size distributions have a better flow than powders with wider particle size distributions. Therefore,
an increase in moisture content may cause a reduction in flowability. In Figure 3.2f, the particle
size distributions of fractions retained on the pan (hereafter referred to as size 0.05mm based on
ASABE Standards S319.3, 2008) are similar for all moisture levels except for 8.69% which had a
narrow distribution. The narrow distribution is an indication of better flow. The distributions have
multi-peaks which indicate that the samples can still be further separated into different fractions
based on these peaks (Bernhart and Fasina, 2008).
0
5
10
15
20
25
0 2 4 6 8
Volu
me
Ret
ain
ed (
%)
Sieve Size (mm)
4.78% MC
8.69% MC
16.53% MC
22.21% MC
25.53% MC

45
Figure 3.2a: Particle size distribution of fractionated ground loblolly pine at 4.78%
moisture level.
Figure 3.2b: Particle size distribution of fractionated ground loblolly pine at moisture
content of 8.69% (wb).
0
4
8
12
16
20
24
28
32
36
40
0 1 2 3 4 5 6 7
Volu
me
Ret
ain
ed (
%)
Sieve Size (mm)
1.40mm
1.00mm
0.71mm
0.50mm
0.25mm
0
4
8
12
16
20
24
28
32
36
40
0 1 2 3 4 5 6 7
Volu
me
Ret
ain
ed (
%)
Sieve Size (mm)
1.40mm
1.00mm
0.71mm
0.50mm
0.25mm

46
Figure 3.2c: Particle size distribution of fractionated ground loblolly pine at moisture
content of 16.53% (wb).
Figure 3.2d: Particle size distribution of fractionated ground loblolly pine at moisture
content of 22.21% (wb).
0
4
8
12
16
20
24
28
32
36
40
0 1 2 3 4 5 6
Volu
me
Ret
ain
ed (
%)
Sieve Size (mm)
1.40mm
1.00mm
0.71mm
0.50mm
0.25mm
0
4
8
12
16
20
24
28
32
36
40
0 1 2 3 4 5 6 7
Volu
me
Ret
ain
ed (
%)
Sieve Size (mm)
1.40mm
1.00mm
0.71mm
0.50mm
0.25mm

47
Figure 3.2e: Particle size distribution of fractionated ground loblolly pine at moisture
content of 25.53% (wb).
Figure 3.2f: Particle size distribution of fractions retained on the pan (size 0.05mm).
0
4
8
12
16
20
24
28
32
36
40
0 1 2 3 4 5 6 7
Volu
me
Ret
ain
ed (
%)
Sieve Size (mm)
1.40mm
1.00mm
0.71mm
0.50mm
0.25mm
0
10
20
30
40
50
60
70
0.02 0.07 0.12 0.17 0.22 0.27
Volu
me
Ret
ain
ed (
%)
Sieve Size (mm)
4.78% MC
8.69% MC
16.53% MC
22.21% MC

48
Table 3.1 shows the geometric mean diameters and geometric standard deviations of the
fractionated and unfractionated ground samples. There was no fraction of size 0.05mm at 25.53%
moisture level. Due to the high moisture content leading to increase particle size and stickiness
between particles, particles did not pass through a screen size of 0.25mm, hence there was no
fraction retained on screen size 0.05mm. The geometric mean diameters of the fractionated
samples varied between 0.10 and 2.38 mm with fractions at the 25.53% moisture level having the
highest geometric mean diameters. This shows that increased moisture content will lead to particle
swelling hence increase in the particle size. However, it is generally considered that particles with
sizes larger than 200 µm are free flowing, while particle with sizes less than 200 µm are subject to
cohesion and flowability problem. The reduced flowability at smaller particle sizes is because of
the increased surface area per unit mass of the powder. There is more surface area or surface
contacts available for frictional forces to resist flow (Fitzpatrick, 2005; Teunou et al., 1999;
Molenda et al., 2002). Therefore, ground loblolly pine fraction of size 0.05 mm and having
geometric mean diameters between 0.10 and 0.15 mm is expected to be a source of flowability
problem. An increase in the quantity of this fraction within the unfractionated ground sample will
results in reduced flowability as well. Furthermore, the geometric mean diameter of the
unfractionated ground sample which varies between 1.31 and 2.19 mm falls within the range of
acceptable particle sizes needed for most biomass conversion processes.

49
Table 3.1: Geometric mean diameters (mm) and geometric standard deviations of
fractionated ground loblolly pine.
Screen size
(mm)
Moisture content (% wb)
4.78 8.69 16.53 22.21 25.53
0.05 0.11 ± 0.06 0.15 ± 0.03 0.10 ± 0.06 0.10 ± 0.05 NC*
0.25 0.85 ± 0.68 0.81 ± 0.72 0.70 ± 0.51 0.64 ± 0.41 0.86 ± 0.92
0.50 1.16 ± 0.69 0.97 ± 0.59 1.01 ± 0.55 0.84 ± 0.42 1.33 ± 0.90
0.71 1.38 ± 0.67 1.28 ± 0.68 1.33 ± 0.62 1.17 ± 0.53 1.46 ± 0.84
1.00 1.72 ± 0.70 1.54 ± 0.69 1.69 ± 0.69 1.55 ± 0.6 1.73 ± 0.75
1.40 2.16 ± 0.66 2.14 ± 0.83 2.17 ± 0.63 2.18 ± 0.67 2.38 ± 0.82
Raw 1.31 ± 1.00 1.36 ±1.27 1.33 ± 1.12 1.39 ± 0.99 2.19 ± 1.39
NC*: Experiment was not conducted at this moisture level
3.4.2 Bulk Density
Statistical analysis indicated that particle size and moisture content had a significant effect
(p<0.05) on the bulk density (Table 3.2). Bulk density of the loblolly pine fractions significantly
increased with increase in fraction size and with decrease in moisture content. The bulk densities
ranged from 136.7 to 277.7 kg/m3. Lam et al. (2008) reported a similar result with an increase in
the bulk density of fractionated switchgrass from 149 to 194 kg/m3 as the particle size increased
from 0.25 to 0.71 mm. The increased bulk density is attributed to the fact that biomass grinds
collected after fractionation exhibit different packing as a result of particles having the same size
as compared to the unfractionated biomass grinds which comprises of different particle size range.
Liu et al. (2008) also reported an increase in the bulk density of fractionated ibuprofen powder
from 350 to 440 kg/m3 as particle size increased from 46 to 215 µm.

50
Table 3.2: Bulk density (kg/m3) of fractionated ground loblolly pine.
Screen
size (mm)
Moisture content level (% w.b)
4.78 8.69 16.53 22.21 25.53
0.05 162.53[f,w] ±0.81 159.40[f,w] ±3.27 141.69[g,x] ± 0.47 136.67[f,y] ±0.62 NC*
0.25 184.60[e,w] ±2.25 179.28[e,w] ±1.85 157.99[f,x] ±1.81 146.64[e,y] ±1.57 140.84[f,z] ±2.88
0.50 205.02[d,w] ±2.21 210.38[d,w] ±2.98 176.02[e,x] ±1.58 165.94[d,y] ±5.46 159.46[e,y] ±0.62
0.71 247.11[c,w] ±2.47 247.58[c,w] ±3.80 204.05[d,x] ±1.76 186.65[c,y] ±1.46 185.96[d,y] ±1.86
1.00 265.30[b,w] ±0.57 255.98[b,x] ±1.69 227.09[c,y] ±2.89 217.86[b,z] ±2.75 220.52[c,z] ±1.86
1.40 277.66[a,w] ±1.31 272.37[a,w] ±2.24 238.46[b,y] ±2.29 234.22[a,y] ±3.53 244.68[a,x] ±0.35
Raw 266.83[b,x] ±0.81 275.53[a,w] ±1.93 232.51[a,y] ±1.52 227.36[a,z] ±0.46 234.04[b,y] ± 1.84
Particle size effect: values in each column with same letter (a-f) are not significantly different (p<0.05).
Moisture effect: values in each row with same letter (w-z) are not significantly different (p<0.05).
NC* experiment was not conducted because there was no fraction at 25.53% moisture level.
Effect of moisture content on bulk density of fractionated ground loblolly pine is similar
to other published works on biological materials such as wormy compost (Bahram et al., 2013),
switchgrass (Lam et al., 2007), soybean (Kashaninejad et al., 2008). The reduction in bulk density
with increased moisture content is because of the increase in mass due to moisture gain being lower
than the accompanying volumetric expansion of the bulk (Colley et al., 2006). The amount of
storage space required for a ground loblolly pine will therefore increase with moisture content
which will lead to increased cost of logistics. However, there was no significant difference in the
bulk density at a moisture level of 4.78% and 8.69 % (wb) while there was a sharp drop in the bulk
density from moisture content level of 8.69% to 16.53% (wb). The difference indicated that at
lower moisture content, there was no significant change in bulk density hence, there may be no
need to expend energy in drying the material to a moisture level of 4.78% (wb).

51
Abdullah and Geldart (1999) stated that a bulk solid with a strong structural strength will
resist collapse when dispersed in a container and will have a low bulk density, while a structurally
weak bulk solid will collapse easily and have a high bulk density. High friction between the
particles results in a low bulk density. As fraction size decreases, the bulk density decreases, this
implies that 0.05 mm and 0.25 mm fractions will have higher friction between their particles hence
resulting in low bulk density values. High friction between particles is an indication of possible
flowability problem. It is more pronounced as the moisture content increase. Fractions of sizes
1.40 mm and 1.00 mm had the highest bulk density values. Therefore, increased quantity of 1.40
mm and 1.00 mm fractions in the unfractionated ground sample may improve flowability of ground
loblolly pine.
3.4.3 Tap Density
Tap density represents an increased bulk density attained after mechanically tapping a bulk
material and allowing it to fall under its own mass. Result of the statistical analysis of particle size
and moisture effect on tap density of fractionated ground loblolly pine is presented in Table 3.3.
The result showed that particle size and moisture content had a significant (p<0.05) on tap density
of the fractionated samples. The tap density significantly increased with increase in fraction size
and reduction in moisture content. The tap density ranged from 218.3 to 330.0 kg/m3. The tap
density of the unfractionated sample was significantly higher than the fractionated sample. Tap
density value is observed to have a higher value as compared to bulk density. This depicts that a
reduction in volume of bulk material due to efficient packing of particles when subjected to
vibration (e.g. during transportation) will result in increased density.

52
Table 3.3: Tap density (kg/m3) of fractionated ground loblolly pine.
Screen
size (mm)
Moisture content level (w.b)
4.78 % 8.69% 16.53% 22.21% 25.53%
0.05 262.67[d,w] ± 4.04 267.00[de,w] ±1.00 232.00[e,x] ±2.65 230.00[d,x] ±1.00 NC*
0.25 247.00[e,x] ± 2.00 258.33[e,w] ±1.16 218.33[d,z] ±2.08 223.00[d,z] ±6.08 235.67[e,y] ±1.53
0.50 264.67[d,x] ± 0.58 276.67[d,w] ±2.52 226.67[e,y] ±0.58 222.00[d,z] ±1.73 230.00[e,y] ±1.00
0.71 309.67[c,x] ± 1.53 318.00[bc,w] ±1.73 252.00[d,y] ±1.00 249.33[c,y] ±2.31 251.00[d,y] ±1.00
1.00 323.67[b,w] ± 2.08 314.67[c,x] ±1.53 275.33[c,y] ±4.04 270.67[b,y] ±0.58 277.33[c,y] ±3.06
1.40 327.67[b,w] ± 2.31 330.00[b,w] ±3.46 287.00[b,x] ±2.00 279.00[b,y] ±2.65 286.67[b,x] ±3.22
Raw 354.33[a,w] ± 5.86 359.67[a,w]± 11.02 303.67[a,x] ±0.58 303.67[a,x] ±3.06 311.67[a,x] ±1.53
Particle size effect: values in each column with same letter (a-f) are not significantly different (p<0.05).
Moisture effect: values in each row with same letter (w-z) are not significantly different (p<0.05).
NC* experiment was not conducted because there was no fraction at 25.53% moisture level.
Volume reduction due to re-arrangement of particles after tapping may lead to difficulty in
unloading the material from storage vessels (Bernhart and Fasina, 2009). The reduction in tap
density with moisture increase further confirms the moisture content – density relationship
previously discussed indicating that bulk volume increased at a rate faster than the mass of the
bulk. This result signifies that a flow problem will exist due to vibration during the transport,
loading and unloading of ground loblolly pine from storage vessels. The material will compact as
a result of vibrations hence resulting in difficulties in unloading ground loblolly pine from
transport vehicles. Similar trends have been reported for other biological materials (Lam et al.,
2008; Bernhart and Fasina, 2009).
Because the inter-particulate interactions influencing the properties of a bulk material are
also the interactions that interfere with its flow, a comparison of the bulk and tapped densities can

53
provide a measure of the relative importance of these interactions in a given material. Such a
comparison is often used as an index representing the ability of the powder to flow (WHO, 2012).
Such index include compressibility value and Hausner ratio.
3.4.4 Hausner ratio
Hausner ratio (ratio of tap density to bulk density) is used at times to characterize the
flowability of bulk material (Table 2.2). The Hausner ratio of fractionated loblolly pine
significantly decrease (p<0.05) from 1.6 to 1.2 with increase in fraction size from 0.05 to 1.40 mm
(Table 3.4). Moisture content had no significant effect (p<0.05) on the Hausner ratio of
unfractionated loblolly pine: 0.05, 1.00 and 1.40 mm fractions. However, there was a significant
increase in the Hausner ratio with moisture content for 0.25, 0.50 and 0.71 mm fractions.
Size fractions of 0.05, 0.25, 0.50 and 0.71mm had a poor flow behavior while 1.00 and
1.40 mm fractions had a fair/good flow behavior. The results obtained for the Hausner ratio
confirms that the reduction in volume after tapping of the 0.05 mm fractions was higher than the
1.40 mm fractions. Therefore, 0.05 mm fractions have higher tendency of becoming compacted or
compressed due to vibration hence, resulting in flow problems.

54
Table 3.4: Hausner ratio of fractionated ground loblolly pine.
Screen
size (mm)
Moisture Content Level (w.b)
4.78 % 8.69% 16.53% 22.21% 25.53%
0.05 1.50[a,w] ± 0.06 1.59[a,w] ±0.09 1.52[a,w] ±0.01 1.59[a,w] ±0.01 NC*
0.25 1.27[bc,z] ± 0.01 1.39[b,xy] ±0.02 1.35[b,y] ±0.02 1.44[b,x] ±0.01 1.62[a,w] ±0.05
0.50 1.27[bc,y] ± 0.05 1.30[bc,xy] ±0.03 1.28[c,y] ±0.03 1.38[c,wx] ±0.01 1.43[b,w] ±0.01
0.71 1.24[bc,y] ± 0.03 1.27[bc,xy] ±0.03 1.26[cd,xy] ±0.03 1.31[d,wx] ±0.01 1.34[c,w] ±0.03
1.00 1.22[c,w] ± 0.00 1.25[c,w] ±0.01 1.22[de,w] ±0.01 1.25[e,w] ±0.00 1.25[d,w] ±0.03
1.40 1.21[c,w] ± 0.04 1.23[c,w] ±0.07 1.17[e,w] ±0.01 1.21[f,w] ±0.01 1.21[d,w] ±0.01
Raw 1.34[b,w] ± 0.06 1.31[bc,w] ±0.02 1.31[bc,w] ±0.02 1.33[d,w] ± 0.01 1.34[c,w] ± 0.04
Particle size effect: values in each column with same letter (a-f) are not significantly different (p<0.05).
Moisture effect: values in each row with same letter (w-z) are not significantly different (p<0.05).
NC* experiment was not conducted because there was no fraction at 25.53% moisture level.
3.4.5 Compressibility
Compressibility is a measure of the increase in strength of powder-like materials with
increase in consolidating pressure. Statistical analysis showed that there was a significant reduction
(p<0.05) in compressibility with increase in particle size. As reported earlier for moisture effect
on the Hausner ratio, moisture content had no significant effect on compressibility of
unfractionated samples and size fraction of 0.05, 1.00 and 1.40mm while there was a significant
increase (p<0.05) in compressibility of size fractions 0.25, 0.50 and 0.71mm with increase in
moisture content (Table 3.5). This is because Hausner ratio and compressibility values are obtained
from the same values of bulk and tap density. The compressibility value ranged from 17.3% to
38.3%.

55
Table 3.5: Compressibility (%) of fractionated ground loblolly pine.
Screen
size (mm)
Moisture content level (w.b)
4.78 % 8.69% 16.53% 22.21% 25.53%
0.05 33.07[a,w] ±2.81 36.93[a,w] ±3.45 34.27[a,w] ±0.61 37.20[a,w] ±0.40 NC*
0.25 21.47[bc,z] ±0.61 28.00[b,xy] ±0.80 25.73[b,y] ±1.29 30.53[b,x] ±0.61 38.27[a,w] ±1.80
0.50 21.33[bc,y] ±3.23 23.20[bc,xy] ±1.60 21.60[c,y] ±1.83 27.33[c,wx] ±0.61 30.27[b,w] ±0.23
0.71 19.33[bc,y] ±1.80 21.20[c,xy] ±1.83 20.27[cd,y] ±1.89 23.73[d,wx] ±0.46 25.20[c,w] ±1.44
1.00 18.13[c,w] ±0.23 19.73[c,w] ±0.46 17.73[de,w] ±0.92 20.13[e,w] ±0.23 19.87[d,w] ±1.97
1.40 17.33[c,w] ±2.44 18.67[c,w] ±4.62 14.80[e,w] ±0.40 17.33[f,w] ±0.46 17.60[d,w] ±0.69
Raw 25.33[b,w] ±3.63 23.73[bc,w] ± 0.92 23.73[bc,w] ± 0.92 24.93[d,w] ± 0.61 25.07[c,w] ±2.05
Particle size effect: values in each column with same letter (a-f) are not significantly different (p<0.05).
Moisture effect: values in each row with same letter (w-z) are not significantly different (p<0.05).
NC* experiment was not conducted because there was no fraction at 25.53% moisture level.
Compressibility is a measure of flowability - the greater the compressibility of a bulk solid,
the less flowable it is (Ganesan et al., 2008). This shows that 0.05 mm fraction is more
compressible and would be less flowable during unloading from storage vessels. This is also in
accordance with the results obtained for the other physical properties showing that at increased
moisture content and reduced particle size; the material becomes more compressible hence
resulting in flowability problem. The difficult flow behavior that characterizes ground loblolly
pine at high moisture content is attributable to the formed liquid bridges between particles thereby
making them more cohesive (Teunou and Fitzpatrick, 1999). Also as moisture content increases,
biological materials become softer thus deformation of the material is greater at higher moisture
contents (Bernhart and Fasina, 2009) which might result in unloading difficulty of materials from
storage or transport vessels.

56
3.4.6 Particle density
Table 3.6 shows the effect of particle size and moisture content on the particle density of
ground loblolly pine fractions. Significant test (p< 0.05) showed that particle size and moisture
had a significant effect on particle density. The particle density of the fractionated ground loblolly
pine varied from 1382.8 to 1497.1 kg/m3. The particle density was observed to generally decrease
with increase in fraction size however at a moisture content level of 4.78 % (wb), there was no
significant difference (p<0.05) in the particle densities of the loblolly pine fractions. This may be
due to shrinkage of the particles hence nullifying particle size effect on particle density at lower
moisture content. Mani et al. (2004) reported a reduction in the particle density of corn stover from
1210 to 1085 kg/m3 with increase in particle size from 0.41 to 0.68 mm. The authors asserted that
the decrease in particle density may be due to reduction in porosity of the ground corn stover when
the particles are reduced to a smaller size.
Particle density was highest at 16.53% moisture level giving a distinction between the
particle densities at 4.78% and 8.69% moisture levels and the particle densities at 22.21% and
25.53% moisture levels. The particle densities at 4.78% and 8.69% moisture levels were higher
than that of 22.21% and 25.53% moisture levels. The decline in particle density with increased
moisture content is due to the volumetric expansion of the particles, occurring at a faster rate than
the increase in mass of particles due to addition of moisture (McMullen et al., 2005). Bahram et
al., (2013) reported a particle density reduction from 1652 to 1443 kg/m3 of wormy compost with
an increase in moisture content from 25 to 35% (wb).

57
Table 3.6: Particle density (kg/m3) of fractionated ground loblolly pine.
Screen
size (mm)
Moisture content level (% w.b)
4.78 8.69 16.53 22.21 25.53
0.05 1464.10[a,x] ± 2.63 1460.23[b,x] ± 5.95 1485.60[a,w] ± 6.18 1440.47[a,y] ± 2.74 NC*
0.25 1464.23[a,wx] ±0.15 1459.77[b,wx] ± 5.53 1486.50[a,w] ±2.71 1437.47[a,xy] ±2.71 1411.53[ab,y] ±2.82
0.50 1464.53[a,x] ±0.99 1454.27[bc,x] ± 3.35 1493.83[a,w] ±7.41 1423.33[b,y] ±0.25 1421.97[a,y] ±9.58
0.71 1462.93[a,w] ±2.19 1448.80[bc,x] ± 4.46 1455.83[bc,wx] ±5.07 1412.50[c,y] ±2.85 1411.27[ab,y] ±6.44
1.00 1462.43[a,w] ±1.08 1443.93[c,x] ± 4.80 1462.03[b,w] ±7.49 1413.20[c,y] ±3.92 1401.10[ab,y] ±8.67
1.40 1459.43[a,x] ±4.22 1497.13[a,w] ± 6.25 1459.20[bc,x] ±1.31 1415.60[c,y] ±2.46 1382.77[b,z] ±3.42
Raw 1459.30[a,w] ± 2.85 1445.13[c,x] ± 3.89 1444.10[c,x] ± 5.37 1417.80[bc,y] ± 0.40 1387.50[ab,z] ±0.40
Particle size effect: values in each column with same letter (a-f) are not significantly different (p<0.05).
Moisture effect: values in each row with same letter (w-z) are not significantly different (p<0.05).
NC* experiment was not conducted because there was no fraction at 25.53% moisture level.
Particle density measures the density of the particle matter excluding the air pores, hence
it is called true density (Ileleji and Rosentrater, 2008). This shows that reduction of pore spaces
within particles will lead to higher density hence resulting in flowability problem as the material
will have higher compressibility. Therefore, the higher particle density of the fine fraction at screen
size of 0.05 mm and 0.25 mm is an indication of reduced flowability. Also, their particle densities
are significantly higher than the particle density of the unfractionated sample. This shows that a
large quantity of these fine fractions in unfractionated ground loblolly pine will lead to difficulty
in effective discharge of ground loblolly pine from storage vessels.
3.4.7 Porosity
Porosity measures the pore spaces between particles. It was found to significantly increased
(p< 0.05) from 0.81 to 0.91 with decrease in fraction size from 1.40mm to 0.05mm and increase
in moisture content from 4.78% to 25.53% (wb) (Table 3.7). An average porosity calculation of

58
0.4 is normal for spheroid particles, whereas irregular shaped or very small particulates have higher
porosity values (Woodcock and Mason, 1987). The porosities of the loblolly pine fractions are
higher than 0.4 which is an indication of highly irregular shaped particles. The shape irregularities
of the particles can be attributed to the size reduction process of using hammer mill for loblolly
pine wood chips. Lam et al., (2008) reported that the porosity of switchgrass decreased from 0.87
to 0.82 with increase in particle size from 0.25 to 0.71 mm. Based on the data of Bahram et al.
(2013), the porosity of wormy compost varied between 0.52 – 0.45, and reduced with increase in
moisture content. Manickam and Suresh (2011) also reported a reduction in the porosity of coir
pith from 0.86 to 0.62 with an increase in moisture content from 10.1% to 60.2% (wb). The values
obtained for these biological materials are also typical of extremely irregular-shaped particles that
have cohesive tendencies (Woodcock and Mason, 1987).
High porosity value is an indication of highly compressible material. Therefore, the
reduced particle size and increase in moisture content resulting in increased porosity leads to
ground loblolly pine becoming more compressible and compactable. This will therefore lead to
flow problem as the particles sticks tightly together after compression and compaction.

59
Table 3.7: Porosity of fractionated ground loblolly pine.
Screen
Size (mm)
Moisture Content Level (w.b)
4.78 % 8.69% 16.53% 22.21% 25.53%
0.05 0.889[a,x] 0.891[a,x] 0.905[a,w] 0.905[a,w] NC*
0.25 0.874[b,y] 0.877[b,y] 0.893[b,x] 0.898[b,wx] 0.900[a,w]
0.50 0.860[c,y] 0.855[c,y] 0.882[c,x] 0.883[c,wx] 0.887[b,w]
0.71 0.831[d,y] 0.829[d,y] 0.859[d,x] 0.867[d,w] 0.868[c,w]
1.00 0.818[e,x] 0.823[e,x] 0.845[e,w] 0.846[e,w] 0.843[d,w]
1.40 0.810[f,z] 0.818[f,y] 0.839[f,w] 0.835[f,w] 0.823[f,x]
Raw 0.817[e,y] 0.809[g,z] 0.837[f,w] 0.840[f,w] 0.831[e,x]
Particle size effect: values in each column with same letter (a-f) are not significantly different (p<0.05).
Moisture effect: values in each row with same letter (w-z) are not significantly different (p<0.05).
NC* experiment was not conducted because there was no fraction at 25.53% moisture level.
3.4.8 Compositional analysis
3.4.8.1 Energy content
Figure 3.3 shows the effect of particle size on energy content of fractionated ground
loblolly pine. Statistical analysis showed that particle size had no significant effect (p<0.05) on
energy content of ground loblolly pine. The energy content was between 18-19 MJ/kg. Similar
results were reported by Garcia et al. (2012) for miscanthus (18.1 MJ/kg), coffee husk (18.3 MJ/kg)
and walnut shell (18.4 MJ/kg) but higher than other biological materials such as sorghum (11.9
MJ/kg), barley (16.5 MJ/kg) and wheat bran (17.4 MJ/kg). The high energy content value recorded
for loblolly pine as compared to other biological materials is confirmed by its low ash content (see
Figure 3.5), which is an indication of large amount of combustible material which are primarily
carbon and hydrogen (Fasina, 2006).
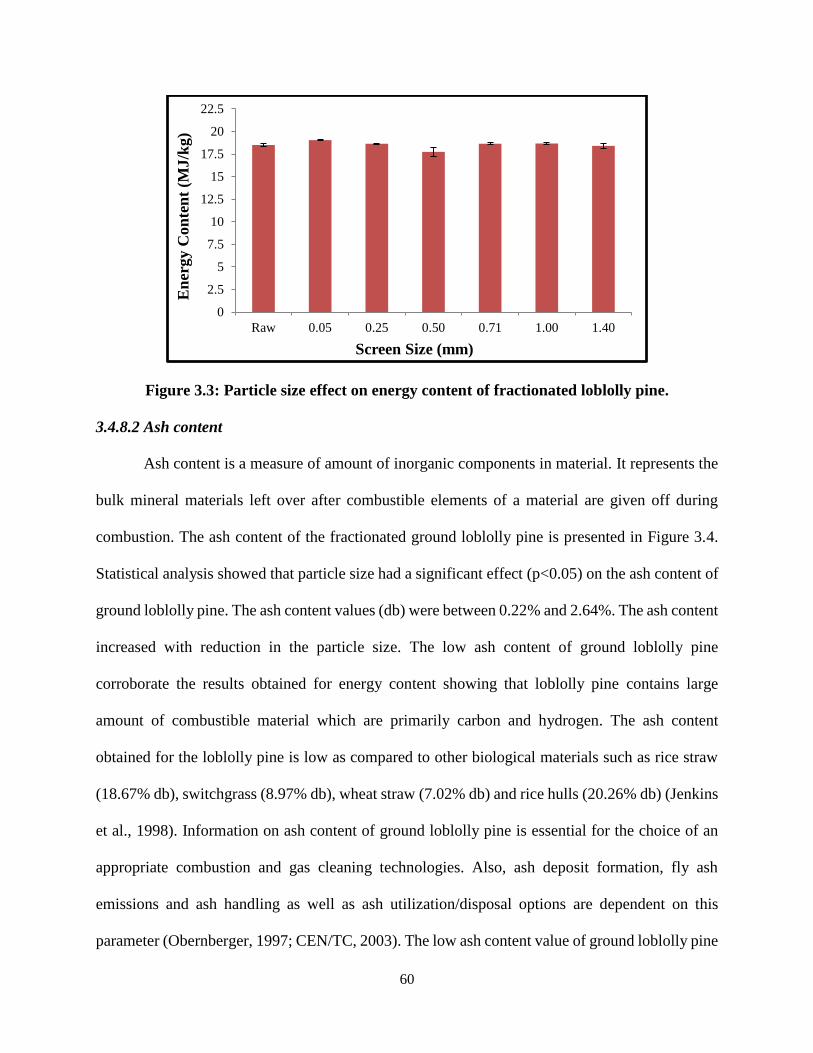
60
Figure 3.3: Particle size effect on energy content of fractionated loblolly pine.
3.4.8.2 Ash content
Ash content is a measure of amount of inorganic components in material. It represents the
bulk mineral materials left over after combustible elements of a material are given off during
combustion. The ash content of the fractionated ground loblolly pine is presented in Figure 3.4.
Statistical analysis showed that particle size had a significant effect (p<0.05) on the ash content of
ground loblolly pine. The ash content values (db) were between 0.22% and 2.64%. The ash content
increased with reduction in the particle size. The low ash content of ground loblolly pine
corroborate the results obtained for energy content showing that loblolly pine contains large
amount of combustible material which are primarily carbon and hydrogen. The ash content
obtained for the loblolly pine is low as compared to other biological materials such as rice straw
(18.67% db), switchgrass (8.97% db), wheat straw (7.02% db) and rice hulls (20.26% db) (Jenkins
et al., 1998). Information on ash content of ground loblolly pine is essential for the choice of an
appropriate combustion and gas cleaning technologies. Also, ash deposit formation, fly ash
emissions and ash handling as well as ash utilization/disposal options are dependent on this
parameter (Obernberger, 1997; CEN/TC, 2003). The low ash content value of ground loblolly pine
0
2.5
5
7.5
10
12.5
15
17.5
20
22.5
Raw 0.05 0.25 0.50 0.71 1.00 1.40
En
ergy C
on
ten
t (M
J/k
g)
Screen Size (mm)

61
shows that there will be a low deposit of bulk inorganic material after its combustion. Published
works had shown that woody biomass has a relatively low amount of ash. For example, coniferous
and deciduous wood without bark have 0.30% (db) of ash content and short rotation coppice
willow has a 2.0% (db) ash content (CEN/TC, 2003).
Figure 3.4: Particle size effect on ash content of fractionated loblolly pine.
3.4.8.3 Volatile matter
Volatile matter refers to the components of a material except for moisture, which are
liberated at a high temperature in the absence of air. It is an indication of the burning characteristics
of a material. Statistical analysis showed that particle size had no significant effect (p<0.05) on the
volatile matter of the fractionated ground loblolly pine (Figure 3.5). The volatile matter ranged
from 84.55% to 85.38% (db). The high volatile matter value is an indication that ground loblolly
pine possesses low fixed carbon and can therefore be easily ignited. Jenkins et al (1998) reported
similar results for sugarcane bagasse (85.61% db) and hybrid poplar (84.81% db) while lower
values were reported for biological materials such as wheat straw (75.27% db), switchgrass
(76.69% db) and rice hulls (63.52% db).
0.0
0.5
1.0
1.5
2.0
2.5
3.0
Raw 1.40 1.00 0.71 0.50 0.25 0.05
Ash
Con
ten
t (%
db
)
Screen Size (mm)

62
Figure 3.5: Particle size effect on volatile matter of fractionated loblolly pine.
3.5 Conclusion
In this study, ground loblolly pine was fractionated into six sizes. The physical and
compositional properties of the fractionated samples were quantified at five moisture levels. It was
found that:
Reduction in particle size and increased moisture content were found to influence the
physical properties of the ground loblolly pine and resulting into possible flow problem.
This is further characterized in chapter 4. The bulk and tap densities were found to increase
with increase in fraction size while particle density generally decreased with increase in
fraction size. The porosity, Hausner ratio and compressibility of the fractions were also
found to decrease with increase in the size of the fraction. Furthermore, increased moisture
content was found to significantly cause a reduction in the densities (bulk, tap and particle)
and porosity however, it had no significant effect on hausner ratio and compressibility.
80
81
82
83
84
85
86
87
Raw 1.40 1.00 0.71 0.50 0.25 0.05
Vola
tile
Matt
er (
% d
b)
Screen Size (mm)
63
The heating value of the fractions which was found to be 18-19 MJ/kg and volatile matter
(84.91 - 87.48% d.b) were not significant affected by particle size but the ash content was
found to increase with reduction in the size of the fraction.
The results of this work can be used in conjunction with the flow properties of the ground
loblolly pine in designing and selecting the appropriate storage and handling vessels. Also,
information on the compositional properties influences the choice of an appropriate conversion
system and gas cleaning technologies for ground loblolly pine.
64
CHAPTER 4: Particle size and moisture effect on flow properties of fractionated ground
loblolly pine and sensitivity of silo design parameters to flow properties
4.1 Abstract
The flow properties of fractionated ground loblolly pine were quantified with analysis conducted
on the sensitivity of silo design parameters to change in flow and physical properties. Flow index
values of 4.11, 4.17 and 4.29 were recorded for fractions of size 1.40 mm at moisture content levels
of 4.78%, 8.69% and 16.53% respectively. However, a reduction in flowability was observed when
the 1.40 mm fraction was dosed with 0.50 mm fractions. Lower angles of wall friction were
obtained at lower moisture contents when stainless steel and mild steel surfaces were used. Tivar
88 wall surface had low angles of wall friction ranging from 10.88 to 15.540 at all the moisture
levels. Sensitivity analysis indicated that there was a reduction in the hopper half angle with
increased moisture content and reduction in the fraction size. The hopper half angle also decreased
with increase in angle of wall friction. The adjusted hopper outlet sizes varied between 1.20 and
28.56 mm. The wall normal and vertical pressure acting on the cylindrical section of the silo
increased from 9.35 to 45.42 kPa and 15.34 to 48.91 kPa respectively with increase in fraction size
and decrease in moisture content. The initial fill and flow induced pressures acting on the hopper
section of the silo increased from 15.34 to 48.91 kPa and 24.71 to 78.79 kPa respectively with
increase in fraction size and decrease in moisture content.

65
4.2 Introduction
Bulk material handling operations are key operations in process industries such as food,
chemicals and pharmaceuticals industries (Opalinski et al., 2012). In order to ensure a successful
production operation, a consistent and reliable flow of bulk materials from storage vessels without
dust generation and flow obstruction are required. However, two major flow problems are
associated with bulk solid handling, namely ratholing and arching. An arch (Figure 4.1a) is a stable
obstruction that forms with the hopper section usually near the bin outlet. The arch has enough
strength to supports the rest of the bin’s content hence preventing the discharge of the remaining
content. A rathole (Figure 4.1b) is a stable pipe or vertical cavity that empties above the bin outlet.
The silo content in the stagnant zones remains stationary until an external force is applied to
dislodge it. Ratholing and arching can result in structural failure of silos, process inefficiencies
and frequent equipment downtime (Prescott and Barnum, 2000; Johanson, 2002; Merrow, 1988).
(a) Cohesive arching (b) Ratholing
Figure 4.1: Typical flow problems associated with bulk solids (Source: jenike.com).

66
Silo design requires information about the flow properties of the bulk material. These
include unconfined yield strength, major consolidation stress, flow index, angle of internal friction,
angle of wall friction, cohesion and bulk density. Flow properties are used in the design of
discharge hoppers, hopper opening size, hopper half angle (to the vertical) and estimation of silo
wall pressures. The hopper opening size is selected in order to ensure that arching (the flow
problem related with mass flow pattern) does not occur and the required flow rate is achieved
(Roberts, 1994). The minimum hopper half angle is needed for mass flow, the preferred flow
pattern for a consistent and reliable flow. If the hopper half angle is less than the minimum, then
it is likely that a funnel flow pattern will exist (Holdich, 2002; Teunou et al., 1999; Fitzpatrick,
2007; Iqbal and Fitzpatrick, 2006). A detailed description of Jenike’s methodology for hopper
design is found in the chapter 2 (subsection 2.6.4) of this thesis work.
Several studies have been documented on the contribution of particle size and moisture
content to flow properties of biological materials (Kashaninejad et al., 2008; Bahram et al., 2013;
Iqbal and Fitzpatrick, 2006; Teunou et al., 1999). The design and selection of an efficient storage
vessel for ground loblolly pine requires a fundamental understanding of the impact of particle size
and moisture content on the flow properties of the ground material. Therefore the objectives of
this work are to:
1. quantify the effect of particle size and moisture content on the flow properties of fractionated
ground loblolly pine;
2. investigate the sensitivity of silo design parameters to the physical and flow properties.
67
4.3 Materials and Methods
4.3.1 Sample preparation
Clean loblolly pine wood chips used in this study were collected from West Fraser Inc.
Sawmill, Opelika, Alabama. Before use, the samples were ground through a 3.18 mm screen using
a hammer mill (Model 358, New Holland grinder, New Holland, PA).
Experiments were carried out on the ground samples at five moisture content levels
between 4.78% and 25.56% (wb). The initial moisture content of the samples after grinding was
8.69% (wb). To adjust the moisture content of the samples to the desired level, the samples were
either dried using a humidity chamber (ESL-2CA, Espec North America, Inc.) set at a temperature
of 500C and relative humidity of 20% (for moisture content reduction) or the samples were sprayed
with a known quantity of water (to increase the moisture content of samples). After moisture
adjustment, the samples were stored in an air tight container for 24 hours to allow moisture
equilibration to take place. The moisture contents of the samples were then verified with a moisture
analyzer (Model MB 45, Ohaus Corporation, Pine Brook, NJ).
A sieve shaker (RO-TAP Model RX- 29, WS Tyler, OH) was thereafter used in
fractionating the moisture adjusted ground samples into six fractions by fitting the sieve shaker
with #12 (1.4 mm aperture), #18 (1.0 mm aperture), #25 (710 µm aperture), #35 (500 µm aperture),
#60 (250 µm aperture) screens and pan. The choice of sieve sizes was based on preliminary study
on the particle size distribution of the unfractionated ground samples. At each moisture level, the
flow properties of the fractions were carried out and recorded.
4.3.2 Flow properties
A powder flow tester (Powder Flow 230VAC, Brookfield Engineering Laboratories, Inc.,
Middleboro, MA) was used to quantify the flow behavior of the samples. The tester (Figure 4.2a)

68
is equipped with a 152.4 mm diameter annular split cell (Figure 4.2c) and a vane lid (with 18 small
compartments). The vane lid (Figure 4.2b) is used to trap the sample particles and cause them to
shear against the sample particles in the trough.
Figure 4.2: Powder flow tester and accessories.
To run a flow test, the mass of a test sample that filled the space between the inner and
outer rings of the sample trough was recorded. The software provided by the equipment
manufacturer was activated. This caused the lid to descend to a position slightly above the sample
in the trough. The axial load and the torsional load test data were automatically recorded by the
software. These load data are then used to calculate the cohesion, angle of internal friction, flow
function, major consolidating stress, and unconfined yield strength. This procedure was carried
out in triplicate for each test sample.
b) Vane Lid
c) Sample Trough a) Powder Flow Tester
69
4.3.3 Wall friction properties
Wall friction properties were determined by the flow tester using the procedure similar to
that used for the flow properties determination. Instead of the annular vane lid, the flow tester was
fitted with a smooth bottom surface lid that was manufactured with the wall material of interest.
The three wall surfaces that were tested in this study are stainless steel, mild steel or Tivar 88. The
angles of wall friction of the sample on these surfaces were obtained from this test.
4.3.4 Hopper design calculation
Silo design involves the bulk material properties, geometric design (to prevent arching,
ratholing and to ensure proper flow pattern) and structural design (distribution of pressure and
shear stresses on walls caused by stored materials). Conical hopper geometry was designed using
the works of Enstad (1981) and Jenike (1964). Details of the symbols and nomenclatures used in
the equations are presented in Appendix A.
4.3.4.1 Hopper half angle
Hopper half angle was determined using the following equations:
α =π
2 –
1
2cos-1
[1-sinδ
2sinδ] - β 4.1
where: β = ф
w+sin
-1
[sinф
w
sinδ]
2 4.2
As a margin of safety in silo design, the hopper half angle is reduced by 30.
4.3.4.2 Minimum hopper outlet size
Hopper outlet size was determined by evaluating for cohesive arching tendency. The
procedure involves calculation of flow function (FF) and flow factor (ff) from equations 4.3 and
4.4 respectively.
Flow Function: FF = Unconfined yield stress
Major consolidating stress =
UYS
MCS 4.3

70
Flow factor: ff =Y(1+sinδ)H(α)
2(X-1)sinα 4.4
where 1
H(α)= [
65
130+α]
m
[200
200+α]
1-m
4.5
(m =1 for conical hoppers)
X =2
msinδ
1-sinδ{
sin(2β+α)
sinα +1} 4.6
A=[2(1- cos(β+α))]m(β+α)1-msinα 4.7
B=sinβ sin1+m(β+α) 4.8
C=(1-sinδ)sin2+m(β+α) 4.9
Y=A+B
C 4.10
The critical applied stress (σc) represents the critical value of the unconfined yield strength
at which a stable arch can be formed. This was obtained by the intersection of the flow function
and flow factor (Figure 2.8). The value of the critical applied stress was used in equation 4.11 to
calculate the minimum hopper outlet size.
Dmin.=H(α)
ρgσc 4.11
The hopper outlet size was multiplied by 1.20 (0.20% greater) in order to achieve the desired flow
rate.
4.3.4.3 Silo wall loads
The silo is divided in to two sections: cylindrical and hopper sections (Figure 4.3). The
vertical and wall normal pressure exerted by the ground loblolly pine in a 100 feet (30.48 m) high
and 50 feet (15.24 m) diameter silo was estimated using Janseen’s equations (Janseen, 1985).
4.3.4.3.1 Stresses in the cylindrical section
Janseen’s equations for estimating the vertical and wall normal pressure in the cylindrical
section are given below:

71
Vertical pressure: Pv= ρgA
KμC[1-exp (-
μKC
Ah)] 4.12
Wall pressure: Pw= ρgA
μC[1-exp (-
μKC
Ah)] 4.13
Figure 4.3: Silo subdivision into vertical and hopper section (Schulze, 2008).
4.3.4.3.2 Stresses in the hopper section
The stresses exerted by ground loblolly pine during storage and flow (Figure 4.4) were
estimated using the equations below (Rotter, 2001).
Initial fill load: Pvf= Pvft (x
hh)
n
+ γhh
n-1[(
x
hh) - (
x
hh)
n
] 4.14
n=2aμh
cot (α) 4.15
Flow induced load: Pve= Pvft (x
hh)
n
+ γhh
n-1[(
x
hh) - (
x
hh)
n
] 4.16
ε= ∅w+ sin-1 (
sin ∅w
sinδ) 4.17
Fe= 1+sinδcosε
1-sinδcos (2α+ε) 4.18
n=2(Feμh
cot(α) +Fe-1) 4.19

72
Figure 4.4: Initial fill and flow induced pressure on the hopper section of a silo.
4.3.5 Experimental design and statistical analysis
Particle size and moisture content of fractionated ground loblolly pine were the predictors
while the response variables was the flow properties. The type of wall material was also used as a
predictor during the angle of wall friction experiment. All the experiments were carried out in
triplicate.
Microsoft Excel 2010 was used in summarizing and generating graphs. A significant test
(α <0.05) using the Proc GLM procedure in the statistical software SAS 9.3 (SAS Institute Inc.,
Cary, NC) was conducted to show the effect of particle size and moisture content on the flow
properties. The Tukey test was used to compare the means of values of these properties at the
different moisture contents and particle sizes. The results were presented in mean and standard
deviation.

73
4.4 Results and Discussion
4.4.1 Flow classification of fractionated ground loblolly pine
The flow function curves (plot of unconfined yield strength and major consolidating stress)
for the fractions at the five moisture levels are shown in Figure 4.5(a-e). The curves show that a
linear increase of unconfined yield strength (UYS) occurred as major consolidating stress (MCS)
increased. The flow index (inverse of the flow function) was used to compare the effects of particle
size and moisture content on the UYS versus MCS relationship and to characterize the flow
properties of the fractions.
Figure 4.5a: Flow function of fractionated loblolly pine at 4.78% moisture content.
0
1
2
3
4
5
6
7
8
0 2 4 6 8 10 12 14 16
Un
con
fin
ed Y
ield
Str
ength
(k
Pa)
Major Consolidating Stress (kPa)
1.40mm
1.00mm
0.71mm
0.50mm
0.25mm
0.05mm
Raw

74
Figure 4.5b: Flow function of fractionated loblolly pine at 8.69% moisture content.
Figure 4.5c: Flow function of fractionated loblolly pine at 16.53% moisture content.
0
1
2
3
4
5
6
7
8
0 2 4 6 8 10 12 14 16
Un
con
fin
ed Y
ield
Str
ength
(k
Pa)
Major Consolidating Stress (kPa)
1.40mm
1.00mm
0.71mm
0.50mm
0.25mm
0.05mm
Raw
0
1
2
3
4
5
6
7
8
0 2 4 6 8 10 12 14 16
Un
con
fin
ed Y
ield
Str
ength
(k
Pa)
Major Consolidating Stress (kPa)
1.40mm
1.00mm
0.71mm
0.50mm
0.25mm
0.05mm
Raw

75
Figure 4.5d: Flow function of fractionated loblolly pine at 22.21% moisture content.
Figure 4.5e: Flow function of fractionated loblolly pine at 25.53% moisture content.
The flowability classification of the fractionated ground loblolly pine using flow index was
based on Jenike’s powder flow classification (Table 4.1). The flow index increased with increase
0
1
2
3
4
5
6
7
8
0 2 4 6 8 10 12 14 16
Un
con
fin
ed Y
ield
Str
ength
(k
Pa)
Major Consoliodating Stress (kPa)
1.40mm
1.00mm
0.71mm
0.50mm
0.25mm
0.05mm
Raw
0
1
2
3
4
5
6
7
8
0 2 4 6 8 10 12 14 16
Un
con
fin
ed Y
ield
Str
ength
(k
Pa)
Major Consolidating Stress (kPa)
1.40mm
1.00mm
0.71mm
0.50mm
0.25mm
Raw

76
in particle size and decrease in moisture content. Except for 1.40 mm fraction at moisture levels
of 4.78%, 8.69% and 16.53%, all of the samples were cohesive (Table 4.2). Based on Jenike’s
classification, flow index value greater than 4 is classified as easy flowing material. Hence, the
1.40mm fraction at moisture levels of 4.78%, 8.69% and 16.53% were classified as easy flowing
materials. However, at moisture levels of 22.21% and 25.53%, the flow indices of 1.40mm
fractions were 3.37 and 3.41 respectively, which indicates cohesive flow. The flow indices
obtained for the unfractionated ground loblolly pine was between 2.54 and 3.19, which also
indicate a cohesive flow. This result is due to the fact that all the other fractions below size 1.40
mm were classified as cohesive therefore, making the whole ground material a cohesive material.
The implication is that ground loblolly pine with large amount of fractions from size 0.05 to 1.00
mm will experience flowability problem during discharge out of storage bins and hopper.
Table 4.1: Jenike classification of powder flowability by flow index (ffc).
Flowability Hardened Very cohesive Cohesive Easy flow Free flowing
Flow index (ffc )
<1 <2 <4 <10 >10
Table 4.2: Flow classification of fractionated ground loblolly pine.
Screen
(mm)
Flow Index Classification
4.78% 8.69% 16.53% 22.21% 25.53%
1.40 4.29 4.17 4.11 3.37* 3.41* Easy flow
1.00 3.80 3.80 3.49 3.37 2.73 Cohesive
0.71 3.62 2.92 2.91 2.63 2.83 Cohesive
0.50 3.16 2.86 2.44 2.34 2.29 Cohesive
0.25 2.52 2.21 2.24 2.29 2.48 Cohesive
0.05 2.38 2.26 2.27 2.08 NC* Cohesive
Raw 3.19 2.89 2.54 2.70 2.61 Cohesive
NC* experiment was not conducted because there was no fraction at 25.53% moisture level.
* Material have a cohesive flow

77
Grafton et al. (2009) characterize the flowability of 11 commercial agricultural limes with
5% moisture addition by weight. The authors observed the flowability of the materials altering
from easy flow to cohesive flow with increase in moisture content. Teunou et al. (1999) also
classified the flowability of four food powders (flour, skim milk, tea and whey permeate) and
determined the flow index to be 2.71, 11.04, 4.22 and 5.85 respectively. The authors reported that
skim milk powder was classified as free flowing due to its low moisture content (4.6% wb) and
large particle size (197 µm). However, flour with a flow index of 2.71 was classified as cohesive.
This was due to its high moisture content of 12.6% (wb) and low particle size of 73 µm.
Further analysis was carried out to examine the change in flowability of fraction of size
1.40mm when mixed with different quantity of fractions with smaller particle size. The flow
analysis was based on the assumption that reduction in the void spaces among the large particles
will result in reduced flowability. Table 4.3 presents the flowability results of mixture of fractions
retained on screen sizes 1.40 mm and 0.50mm at three mixing ratios of 10:1, 10:2 and 10:3 (Table
3.4). As expected, increase in the amount of 0.50 mm fraction and moisture content resulted in
flowability reduction from easy flow to cohesive flow. This implies that the presence of fine
fraction in unfractionated ground loblolly pine is responsible for ratholing and cohesive arching
flow problems.
Table 4.3: Flow indices of mixture of 1.40mm and 0.50mm fractions.
Moisture content
(% wb)
Ratio
10:1 10:2 10:3
4.78 3.92 3.75 3.45
8.69 4.00 3.90 3.41
16.53 3.70 3.23 -
*Ratio 10:1 represent mixture mass ratio of 1.40mm: 0.50mm fractions

78
4.4.2 Angle of internal friction
The angle of internal friction represents friction between particles during movement of bulk
materials. Table 4.4 shows the angle of internal friction obtained for the fractionated and
unfractionated ground loblolly pine. The angle of internal friction for the fractionated sample
varied between 40.400 and 52.660. The angle of internal friction significantly increased (p<0.05)
with decrease in fraction size and increase in moisture content. The angles of internal friction of
the unfractionated samples were also found to increase with moisture content from 43.29 and
48.930. Gil et al. (2013) reported a similar result for corn stover and poplar. The angle of internal
friction for poplar (300 - 320) and corn stover (260 - 290) increased with moisture content increase
from 7 to 33% (wb) and decrease in particle size from 0.61 to 0.30mm for poplar and 0.70 to 0.26
mm. Kibar et al. (2010) also reported increase in angle of internal friction from 29.700 to 32.530
as the moisture content increased from 10% to 14% (db) for rice grains.
Table 4.4: Angle of internal friction of fractionated ground loblolly pine.
Screen
size (mm)
Moisture content levels (% wb)
4.78 8.69 16.53 22.21 25.53
0.05 49.88[a,x] ± 0.89 52.66[a,v] ± 0.91 51.74[a,vw] ±1.12 51.55[a,w] ± 1.12 NC*
0.25 46.57[b,y] ± 0.99 48.15[b,x] ± 0.99 49.43[b,w] ± 1.09 50.89[ab,v] ± 1.17 50.69[a,v] ±1.36
0.50 43.88[c,x] ± 2.23 45.29[c,x] ±2.18 47.37[c,w] ± 1.28 49.52[bc,v] ± 1.43 49.49[b,v] ± 1.12
0.71 42.12[cd,x] ± 2.46 43.85[cd,w] ±1.86 46.67[cd,v] ± 1.04 47.95[c,v] ± 0.91 48.09[c,v] ± 0.55
1.00 41.63[e,x] ± 1.82 42.78[d,x] ± 1.88 46.13[d,w] ± 0.88 48.23[c,v] ± 1.75 48.36[c,v] ± 0.90
1.40 40.40[e,z] ± 1.55 42.09[d,y] ± 1.50 44.70[e,x] ± 0.61 48.15[c,v] ±1.86 46.41[d,w] ± 0.88
Raw 43.29[cd,x] ±2.60 45.51[c,w] ± 1.89 47.40[c,v] ± 0.99 48.93[c,v] ± 1.88 48.08[c,v] ± 0.80
Particle size effect: values in each column with same letter (a-f) are not significantly different (p<0.05).
Moisture effect: values in each row with same letter (v-z) are not significantly different (p<0.05).
NC* experiment was not conducted because there was no fraction at 25.53% moisture level.

79
The increased angle of internal friction with moisture content and reduction in fraction size
of fractionated ground loblolly pine was an indication of increased frictional resistance between
particles of smaller sizes. This implies that increasing amount of the smaller particles at higher
moisture content in the unfractionated ground loblolly pine will cause the typical flow problems
associated with bulk solids therefore leading to difficulty in unloading the ground material from
storage vessels.
Also, the measured angles of internal friction for the fractionated and raw samples were
greater than the critical values of less than 300 required for gravity discharge of bulk materials
from storage bins and silos (Puri, 2002). Therefore, it shows that unloading ground loblolly pine
will be impossible with gravity discharge alone; there would be a need for a flow aid. Zulfiqar et
al. (2006) reported the angle of internal friction for different blends of coal and sawdust/coal
mixture to be in the range of 54.360 to 62.080. The angle of internal friction documented for other
biological materials such as switchgrass (39.40 – 46.70), wheat straw (41.60- 46.70), corn stover
(46.70 - 49.50) and 41.250 for pecan shell are above the critical values making them not amendable
to gravity discharge also (Chevanan et al., 2009; Littlefield et al., 2011).
4.4.3 Cohesive strength
Statistical analysis showed that particle size had a significant effect (p<0.05) on cohesive
strength (Table 4.5). However, moisture content was found to have no significant effect (p<0.05)
on the cohesive strength of the fractions. The cohesive strength of the fractionated and
unfractionated ground loblolly pine ranged between 0.42 and 1.05 kPa. Cohesive strength
decreased with increase in particle size i.e. fractions of size 0.05 mm had the highest cohesive
strength while fractions of size 1.40 mm had the lowest cohesive strength. The increased cohesive

80
strength in finer fraction is attributable to the increased total surface area and number of contact
points for inter-particle bonding (Drzymala, 1993) that exists in fraction with smaller particles.
4.4.4 Wall friction properties
Particle size and moisture effect on wall friction properties of the fractions were measured
on three wall surfaces (stainless steel, mild steel and Tivar 88). Statistical analysis showed that
particle size and moisture content had a significant effect on angle of wall friction of fractionated
ground loblolly pine with an increase in the angle of wall friction as fraction size decrease and
moisture content increased.
Table 4.5: Cohesive strength (kPa) of fractionated ground loblolly pine.
Screen size
(mm)
Moisture content levels (% wb)
4.78 8.69 16.53 22.21 25.53
0.05 1.05[a,v] ± 0.47 1.01[a,v] ±0.45 0.92[a,v] ±0.42 0.91[a,v] ±0.40 NC*
0.25 0.82[ab,v] ±0.33 0.88[ab,v] ± 0.37 0.90[ab,v] ± 0.44 0.93[a,v] ± 0.45 0.91[a,v] ±0.44
0.50 0.63[bc,v] ± 0.24 0.70[bc,v] ± 0.29 0.76[ab,v] ±0.37 0.87[ab,v] ± 0.44 0.88[a,v] ± 0.45
0.71 0.52[bc,v] ± 0.21 0.58[c,v] ± 0.27 0.66[ab,v] ± 0.33 0.73[ab,v] ± 0.37 0.72[a,v] ± 0.39
1.00 0.48[c,v] ± 0.21 0.49[c,v] ± 0.22 0.55[ab,v] ± 0.28 0.46[c,v] ± 0.35 0.74[a,v] ± 0.41
1.40 0.43[c,v] ± 0.20 0.45[c,v] ± 0.22 0.45[b,v] ± 0.22 0.39[c,v] ± 0.33 0.60[a,v] ± 0.32
Raw 0.65[bc,v] ± 0.26 0.69[bc,v] ± 0.31 0.78[ab,v] ± 0.40 0.70[ab,v] ± 0.45 0.75[a,v] ± 0.38
Particle size effect: values in each column with same letter (a-f) are not significantly different (p<0.05).
Moisture effect: values in each row with same letter (v-z) are not significantly different (p<0.05).
NC* experiment was not conducted because there was no fraction at 25.53% moisture level.
The angle of wall friction on stainless steel surface (Table 4.6) varied between 8.96 and
24.800. The implication is that a high value of wall friction caused by reduction in particle and
increase in moisture content leads to greater adhesion of the particles to the surface of storage wall

81
hence resulting in flow problem during material discharge. Fitzpatrick et al. (2004) stated that
angle of wall friction represents the adhesion of powder to the silo wall (the higher the angle, the
more difficult it is to move the powder along the surface). This implies that a strong adhesion will
be developed by fractionated ground loblolly pine at low fraction size or increased moisture
content, hence making it difficult for the ground biomass to flow along the wall surface of the
storage vessel.
Table 4.6: Angle of wall friction of fractionated loblolly pine using stainless steel wall.
Screen
size (mm)
Moisture Content Level (% wb)
4.78 8.69 16.53 22.21 25.53
0.05 12.30[a,y] ±1.28 14.90[a,x] ± 2.05 17.14[a,w] ± 2.75 26.49[a,v] ± 4.61 NC*
0.25 9.83[b,z] ± 0.52 12.39[b,y] ± 1.27 14.00[c,x] ± 1.54 19.50[b,w] ± 2.64 24.80[a,v] ± 3.96
0.50 9.45[c,z] ± 0.50 11.24[c,y] ± 0.90 13.79[c,x] ± 1.43 17.60[cd,w] ± 1.96 21.62[b,v] ± 2.80
0.71 9.39[c,z] ± 0.49 12.72[b,y] ± 1.48 14.22[c,x] ± 1.47 16.72[d,w] ± 1.73 20.98[bc,v] ± 2.58
1.00 9.49[c,z] ± 0.50 11.44[c,y] ±1.00 14.40[c,x] ± 1.38 17.35[cd,w] ± 1.83 20.06[cd,v] ± 2.51
1.40 8.96[d,z] ± 0.38 10.82[c,y] ± 0.97 14.18[c,x] ± 1.31 16.52[d,w] ± 1.65 18.76[d,v] ± 2.05
Raw 9.53[bc,z] ± 0.53 10.92[c,y] ± 1.27 16.23[b,x] ± 2.21 18.13[c,w] ± 1.85 20.56[bc,v] ± 2.54
Particle size effect: values in each column with same letter (a-f) are not significantly different (p<0.05)
Moisture effect: values in each row with same letter (v-z) are not significantly different (p<0.05)
NC* experiment was not conducted because there was no fraction at 25.53% moisture level
The angle of wall friction on mild steel surface ranged between 10.480 and 19.730 (Table
4.7) with the fractions of size 0.05 mm having the highest wall friction value while the fractions
on sieve size 1.40 mm had the lowest wall friction angle. However, the angles of wall friction
recorded on mild steel surface were in the range of the values obtained for stainless steel.

82
Table 4.7: Angle of wall friction of fractionated loblolly pine using mild steel wall.
Screen
size (mm)
Moisture Content Level (% wb)
4.78 8.69 16.53 22.21 25.53
0.05 12.33[a,x] ± 1.10 16.10[a,w] ± 2.63 15.22[a,w] ± 1.72 21.35[a,v] ± 3.15 NC*
0.25 10.48[d,z] ± 0.45 13.11[b,y] ± 1.21 14.29[c,x] ± 1.32 18.12[bc,w] ± 2.08 22.56[a,v] ± 3.42
0.50 10.50[cd,z] ± 0.39 12.09[c,y] ± 0.72 15.07[a,x] ± 1.36 18.18[bc,w] ± 1.70 19.52[b,v] ± 2.55
0.71 10.54[cd,z] ± 0.35 12.17[c,y] ± 0.71 15.31[a,x] ± 1.34 17.42[c,w] ± 1.58 19.73[b,v] ± 2.28
1.00 10.81[b,z] ±0.36 12.43[c,y] ± 0.76 15.01[ab,x] ± 1.34 17.99[c,w] ± 1.53 18.87[bc,v] ± 2.18
1.40 10.76[bc,y] ± 0.31 12.38[c,x] ± 0.59 14.22[c,w] ± 1.13 18.00[c,v] ± 1.42 18.30[c,v] ± 1.90
Raw 10.55[bc,y] ±0.37 12.16[c,x] ±0.92 14.53[bc,w] ±1.30 19.04[b,v] ±1.77 19.39[bc,v] ±2.29
Particle size effect: values in each column with same letter (a-f) are not significantly different (p<0.05).
Moisture effect: values in each row with same letter (w-z) are not significantly different (p<0.05).
NC* experiment was not conducted because there was no fraction at 25.53% moisture level.
The angle of wall friction recorded using the Tivar 88 surface (ultra-high weight molecular
polyethylene) surface ranged between 10.880 and 15.540 (Table 4.8). There was a significant
increase (p<0.05) in the angles of wall friction with reduction in fraction size for the three wall
surfaces. This is because there is greater contact surface area between smaller particles and the
wall surface (Iqbal and Fitzpartick, 2006) which led to the high wall friction angle recorded for
fractions of size 0.05 mm.
The increased wall friction angle due to increase in moisture content had also been reported
for other biological materials using different wall surfaces. Mani et al. (2004) reported a significant
increase in angle of wall friction of corn stover grinds from 0.180 to 0.260 as the moisture content
increased from 7% to 15% (wb) using a steel surface. The authors asserted that the increased wall
friction angle is due to increased adhesion between corn stover grinds and the steel surface at
higher moisture content. Iqbal and Fitzpatrick (2006) observed an increase from 9.50 to 14.60 of

83
wall friction angle for flour as moisture content increased from 12.6% to 15.1% (wb). The authors
reported similar trend for tea and whey permeate powder. Grafton et al. (2009) also reported an
increase in wall friction angle of different commercial agricultural limes with increased moisture
content.
Table 4.8: Angle of wall friction of fractionated loblolly pine using Tivar 88 wall surface.
Screen
size (mm)
Moisture Content Level (% wb)
4.78 8.69 16.53 22.21 25.53
0.05 14.80[a,vw] ±1.71 15.54[a,v] ±2.25 14.52[a,w] ± 1.79 15.50[a,v] ± 2.64 NC*
0.25 13.61[b,w] ±1.09 13.48[bc,w] ± 1.31 13.14[b,w] ± 1.28 13.33[c,w] ±1.70 15.23[a,v] ± 2.46
0.50 12.48[c,w] ± 0.87 12.87[cd,vw] ±1.07 12.83[b,vw] ±1.12 12.36[d,w] ± 1.35 13.06[b,v] ± 1.64
0.71 12.10[cd,v] ± 0.98 12.32[de,v] ± 1.03 12.01[c,v] ± 1.05 12.02[d,v] ±1.58 11.76[c,v] ± 1.47
1.00 11.59[d,w] ± 0.87 11.72[ef,w] ± 0.97 11.24[d,w] ± 0.99 12.81[cd,v] ± 1.89 11.46[c,w] ± 1.40
1.40 10.88[e,y] ± 0.96 11.47[f,vw] ± 1.15 11.61[cd,w] ± 1.02 12.44[cd,v] ± 1.74 10.98[c,xy] ± 1.32
Raw 11.75[d,x] ±0.90 14.07[b,v] ±1.35 12.17[c,wx] ±1.30 14.45[b,v] ±2.28 12.55[b,w] ±1.58
Particle size effect: values in each column with same letter (a-f) are not significantly different (p<0.05).
Moisture effect: values in each row with same letter (v-z) are not significantly different (p<0.05).
NC* experiment was not conducted because there was no fraction at 25.53% moisture level.
Statistical analysis showed that the wall surface had a significant effect (p<0.05) on the
angle of wall friction of the fractionated ground loblolly pine (see appendix for tables). At lower
moisture level, the stainless steel and mild steel had a lower wall friction angle compared to Tivar
88 surface but as the moisture content increased, the angle of wall friction for the stainless steel
and mild steel surface increased significantly. The high angles of wall friction recorded by stainless
steel and mild steel can be attributed to their roughness factors which are 45µm and 15 µm
respectively while Tivar 88 (classified as plastic) has a roughness factor of 1.5 µm (Darby, 2001).

84
Also, a scanning electron microscope images (Figure 4.6) of the stainless steel, mild steel and
ultra- high weight molecular polyethylene surfaces showed that Tivar 88 surface has the smoothest
surface which enhanced its low wall friction angles. This indicates that Tivar 88 surfaces will be a
good wall lining material in the design of storage and handling vessel for ground loblolly pine with
high moisture content while stainless and mild steel will perform well at lower moisture content.
a) stainless steel b) mild steel c) ultra- high weight molecular
polyethylene (Tivar 88)
Figure 4.6: SEM images of stainless steel, mild steel and Tivar 88 wall surfaces
(Sources: Zhou and Komvopoulos, 2005; Günen et al., 2014; Farhat and Quraishi, 2010).
Previous studies had shown the effect of wall material on angle of wall friction on
biological materials. For example, Wu et al. (2011) compared the effect of four wall surfaces (Tivar
88, concrete, mild steel and stainless steel) on wall friction angles of wood pellets and wood chips.
The authors observed that Tivar 88 surface had the lowest wall friction angles (11-170) when
compared with the other three surfaces with wall friction angle varying between 16 and 350. This
difference was attributed to the surface roughness of material with concrete having the coarsest
surface, hence having the highest angle of wall friction and Tivar 88 having the smoothest surface
hence it low wall friction angle. Fitzpatrick et al. (2004) reported the angle of wall friction for 13
85
different biological materials using a stainless steel surface. The wall friction angles ranged
between 11.80 and 27.30. Chen et al. (2012) found the angle of wall friction for brown coal, hard
coal and saw dust to be 260, 27.80 and 31.40 respectively using a stainless steel as well. The wall
friction between the hopper wall material and the bulk materials is very important in determining
whether mass flow or funnel flow pattern will be obtained during discharge from a silo (Fitzpatrick,
2007). Therefore, in order to ensure reliable flow, the angle of wall friction of the storage vessel
wall lining material must be low. This is an indication of a limited adhesion of the bulk material
to the wall surface of the storage vessel.
4.4.5 Hopper half angle and minimum hopper outlet size
Jenike’s methodology for estimating the conical hopper half angle was employed (Jenike,
1964). The measured angle of internal friction and wall frictions using the three surfaces were
applied in the methodology. The hopper half angle varied between 18.370 and 41.440. As a margin
of safety during hopper design, the hopper half angle was reduced by 30 making the angle varied
between 15.370 and 38.440 (Table 4.9). There was a reduction in the hopper half angle with
increased moisture content and reduction in the fraction size (Figure 4.7 & 4.8). However, moisture
content does not have an effect on hopper half angle using Tivar 88 surface when compared to
stainless and mild steel surface (Figure 4.7). This is attributable to the low variation in angles of
wall friction of Tivar 88 surface at all moisture levels.

86
Table 4.9: Evaluation of hopper half angle, flow factor and minimum hopper opening size
(Dmin) for a cylindrical hopper using Jenike’s method.
Screen
Size (mm)
Moisture
Content (%)
Particle
diameter
(mm)
Reduced Hopper Half Angle Flow
factor
Adjusted
Dmin (mm) Stainless
Steel
Mild
Steel
Tivar
88
0.05
4.78 0.11 32.19 32.15 29.27 1.06 1.32
8.69 0.15 28.82 27.45 28.09 1.04 1.80
16.53 0.10 26.34 28.55 29.36 1.05 1.20
22.21 0.10 15.37 21.42 28.25 1.09 1.20
0.25
4.78 0.85 35.72 34.94 31.17 1.09 10.20
8.69 0.81 32.36 31.51 31.07 1.08 9.72
16.53 0.70 30.27 29.93 31.28 1.07 8.40
22.21 0.64 23.66 25.28 30.84 1.07 7.68
25.53 0.86 17.39 20.06 28.67 1.09 10.32
0.50
4.78 1.16 36.82 35.52 33.07 1.13 13.92
8.69 0.97 34.29 33.26 32.30 1.12 11.64
16.53 1.01 30.83 29.29 31.97 1.09 12.12
22.21 0.84 26.01 25.33 32.17 1.08 10.08
25.53 1.33 21.23 23.74 31.36 1.09 15.96
0.71
4.78 1.38 37.37 35.92 33.95 1.17 16.56
8.69 1.28 32.78 33.46 33.28 1.14 15.36
16.53 1.33 30.42 29.10 33.08 1.11 15.96
22.21 1.17 27.20 26.36 32.79 1.09 14.04
25.53 1.46 22.08 23.59 33.12 1.11 17.52
1.00
4.78 1.72 37.39 35.71 34.72 1.18 20.64
8.69 1.54 34.62 33.38 34.27 1.16 18.48
16.53 1.69 30.29 29.55 34.12 1.11 20.28
22.21 1.55 26.46 25.69 31.87 1.09 18.60
25.53 1.73 23.18 24.61 33.43 1.10 20.76
1.40
4.78 2.16 38.44 36.12 35.97 1.20 25.92
8.69 2.14 35.58 33.60 34.75 1.17 25.68
16.53 2.17 30.81 30.76 33.97 1.13 26.04
22.21 2.18 27.47 25.70 32.34 1.09 26.16
25.53 2.38 24.93 25.49 34.37 1.12 28.56
Raw
4.78 1.31 36.87 35.61 34.11 1.15 15.72
8.69 1.36 34.63 33.13 30.80 1.12 16.32
16.53 1.33 27.89 29.93 32.76 1.10 15.96
22.21 1.39 25.44 24.36 29.81 1.09 16.68
25.53 2.19 22.59 24.01 32.19 1.10 26.28

87
Figure 4.7: Effect of moisture content on hopper half angle of 0.25 mm fraction.
Figure 4.8: Effect of fraction size on hopper half angle at the 4.78% moisture level.
Figure 4.9 illustrates angles of wall friction versus hopper half angles obtained for the
fractionated ground loblolly pine. The hopper half angle decreased with increase in angle of wall
friction. The angles of wall friction recorded for stainless steel and mild steel had a wider spread
of hopper half angles while tivar 88 had a small variation in its hopper half angle. The variation in
15
18
21
24
27
30
33
36
39
0 5 10 15 20 25 30
Hop
per
Half
An
gle
(0)
Moisture Content (% wb)
Stainless steel
Mild steel
Tivar 88
25
27
29
31
33
35
37
39
41
0.00 0.25 0.50 0.75 1.00 1.25 1.50
Hop
per
Half
An
gle
(0)
Fraction Size (mm)
Stainless Steel
Mild Steel
Tivar 88
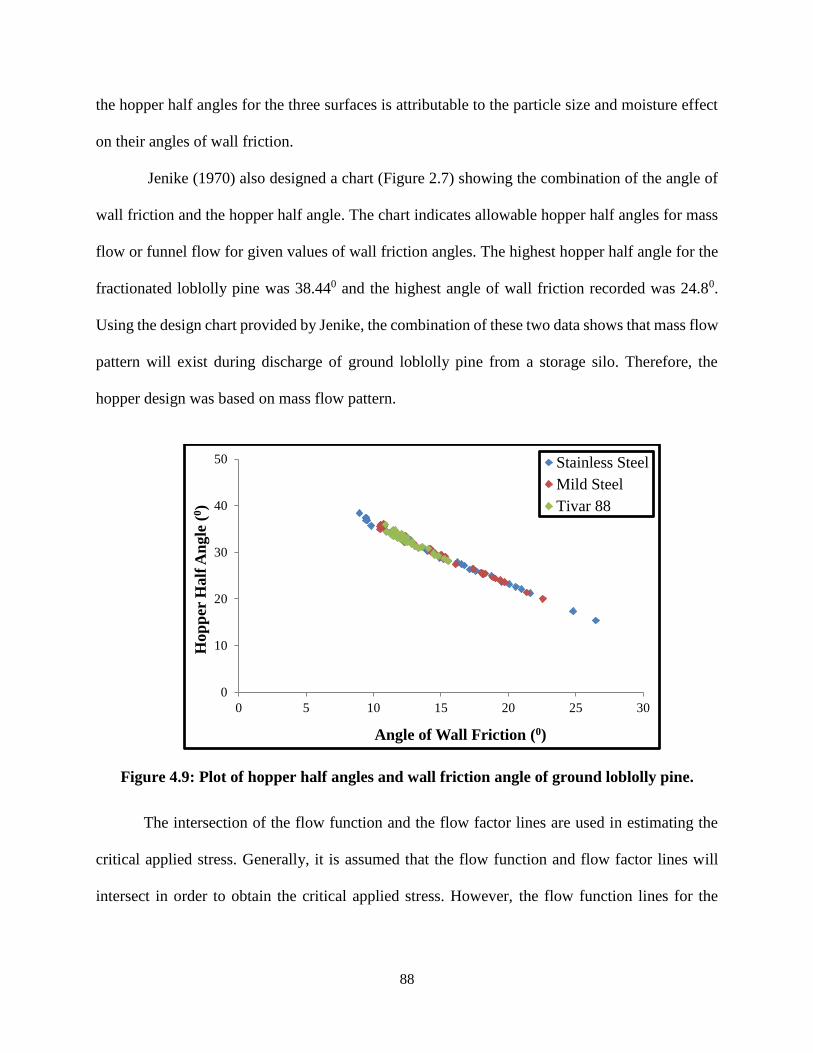
88
the hopper half angles for the three surfaces is attributable to the particle size and moisture effect
on their angles of wall friction.
Jenike (1970) also designed a chart (Figure 2.7) showing the combination of the angle of
wall friction and the hopper half angle. The chart indicates allowable hopper half angles for mass
flow or funnel flow for given values of wall friction angles. The highest hopper half angle for the
fractionated loblolly pine was 38.440 and the highest angle of wall friction recorded was 24.80.
Using the design chart provided by Jenike, the combination of these two data shows that mass flow
pattern will exist during discharge of ground loblolly pine from a storage silo. Therefore, the
hopper design was based on mass flow pattern.
Figure 4.9: Plot of hopper half angles and wall friction angle of ground loblolly pine.
The intersection of the flow function and the flow factor lines are used in estimating the
critical applied stress. Generally, it is assumed that the flow function and flow factor lines will
intersect in order to obtain the critical applied stress. However, the flow function lines for the
0
10
20
30
40
50
0 5 10 15 20 25 30
Hop
per
Half
An
gle
(0)
Angle of Wall Friction (0)
Stainless Steel
Mild Steel
Tivar 88

89
fractions lie below the flow factor lines (Figure 4.10) resulting in no critical applied stress. This
result implies that the applied stress exceeds the unconfined yield strength of the fraction.
The calculation of the minimum hopper outlet size was therefore not on the basis of
cohesive arching but rather to prevent formation of mechanical arching. Purutyan and Barnam
(2001) stated that in estimating the minimum hopper outlet size designed to ensure mass flow and
prevent mechanical arching; the hopper outlet size should be at least six to eight times bigger than
the largest particle diameter of the material. The minimum hopper outlet sizes were estimated by
multiplying the geometric mean diameter by 10. The actual outlet dimensions were then multiplied
by 1.20 (20% greater) in order to ensure the desired flow rate (Table 4.9). As expected, the
minimum hopper outlet size followed the trend of the geometric mean diameters and it varied
between 1.20 and 28.56 mm with 1.40 mm fraction having the highest minimum hopper outlet
sizes.
Figure 4.10: Flow function and flow factor of fraction size 0.25 mm at 16.53% moisture
content.
0
3
6
9
12
15
0 3 6 9 12 15
Un
con
fin
ed Y
ield
Str
ength
(k
Pa)
Major Consolidating Stress (kPa)
Flow function
Flow factor

90
The non- intersection of the flow function and flow factor lines (leading to design of hopper
outlet size to prevent mechanical arching) is in contrast to the results obtained from the flow
properties tests, which showed that fractionated ground loblolly pine was cohesive in nature.
However, due to the small sizes obtained for the hopper outlets, there is tendency for cohesive
arching to occur at the hopper outlet. Even though the hopper outlet sizes were calculated to
prevent mechanical arching, the selection of the hopper outlet sizes must be large enough to
prevent formation of cohesive arch as well.
4.4.6 Silo wall loads
Table 4.10 presents the estimated vertical and wall pressure exerted on the cylindrical
section and also the initial fill and flow induced pressure exerted on hopper section of the designed
silo with a height of 30.48 m (100 feet) and diameter of 15.24 m (50 feet). The wall pressure acting
on the cylindrical section of the silo varied between 9.35 and 45.42 kPa while the vertical pressure
ranged between 15.34 and 48.91 kPa. The pressures acting on the cylindrical and hopper section
of the silo increased with increase in fraction size and decrease in moisture content (Figure 4.11 &
4.12). These results imply that during storage of ground loblolly pine in a storage bin, a large
quantity of big particles at lower moisture content will exert more pressure on the cylindrical
section of the silo wall.

91
Table 4.10: Silo wall loads of fractionated ground loblolly pine.
Screen Size
(mm)
Moisture
Content (%)
Cylindrical Section Hopper section
Wall Pressure
(kPa)
Vertical
Pressure (kPa)
Initial Fill
Load(kPa)
Flow Induced
Pressure (kPa)
0.05
4.78 21.71 25.07 25.07 41.07
8.69 18.46 22.59 22.59 36.39
16.53 14.64 18.87 18.87 30.40
22.21 9.35 15.34 15.34 24.71
0.25
4.78 28.58 31.33 31.33 50.46
8.69 23.82 27.57 27.57 44.41
16.53 19.20 23.02 23.02 37.08
22.21 13.54 18.47 18.47 29.76
25.53 10.32 16.16 16.16 26.03
0.50
4.78 32.50 35.35 35.35 56.95
8.69 29.89 33.75 33.75 54.37
16.53 21.63 25.82 25.82 41.59
22.21 16.76 21.84 21.84 35.19
25.53 13.38 19.25 19.25 31.02
0.71
4.78 39.33 42.72 42.72 68.82
8.69 32.29 37.64 37.64 60.63
16.53 24.50 29.52 29.52 47.56
22.21 19.69 25.13 25.13 40.48
25.53 16.05 22.73 22.73 36.61
1.00
4.78 41.95 45.67 45.67 73.57
8.69 35.94 40.75 40.75 65.65
16.53 27.00 32.67 32.67 52.64
22.21 22.28 28.86 28.86 46.49
25.53 19.84 27.45 27.45 44.22
1.40
4.78 45.42 48.91 48.91 78.79
8.69 39.68 44.41 44.41 71.54
16.53 28.69 34.55 34.55 55.65
22.21 24.96 31.70 31.70 51.07
25.53 23.38 31.33 31.33 50.47
Raw
4.78 42.09 45.86 45.86 73.87
8.69 39.90 44.75 44.75 72.08
16.53 25.14 31.72 31.72 51.10
22.21 22.39 29.55 29.55 47.60
Raw 20.58 28.84 28.84 46.46

92
Figure 4.11: Effect of moisture content on pressures acting on silo wall for 0.25 mm fraction
at a wall height of 100 feet (30.48m).
Figure 4.12: Effect of particle size on pressures acting on the cylindrical and hopper section
of the silo wall at a wall height of 100 feet (30.48m).
Figure 4.13 illustrates the vertical and wall pressure versus the cylindrical height (from top
of the silo to the bottom) for the 0.05 mm fractions at the 4.78 % moisture level. The vertical and
the wall pressures exerted on the cylindrical section of the silo by the material increased with
0
10
20
30
40
50
60
0 5 10 15 20 25 30
Pre
ssu
re (
kP
a)
Moisture Content (% wb)
Wall pressure
Vertical Pressure
Initial Fill load
Flow Induced Pressure
0
10
20
30
40
50
60
70
80
90
0.00 0.25 0.50 0.75 1.00 1.25 1.50
Pre
ssu
re (
kP
a)
Fraction Size (mm)
Wall Pressure
Vertical Pressure
Initial Fill Pressure
Flow Induced Pressure

93
height. These pressures increased downward which indicated that there is a tendency for the silo
to expand at the lower part of the silo due to the pressures exerted on the silo wall.
Figure 4.14 shows the change in the initial fill and flow induced pressures as the hopper
height changes. The initial and flow induced pressures represent the pressures exerted on the
hopper section of the silo when the silo is filled with bulk solid and during discharge respectively.
The estimated initial fill and flow induced pressures for the fractionated ground loblolly pines are
presented in Table 4.10. The initial fill loads varied between 15.34 and 48.91 kPa while the flow
induced pressures varied between 24.71 and 78.79 kPa. The initial fill and flow induced pressures
also increased with increase in fraction size and decrease in moisture content. The values obtained
for the initial fill and flow induced pressures indicates the estimated peak pressures that can be
attained when a silo of height 100 feet (30.48m) and diameter 50 feet (15.24m) is filled to capacity.
Figure 4.13:Plot of vertical and wall pressure against cylindrical height for the 0.05 mm
fraction at 4.78 % moisture level.
0
5
10
15
20
25
30
35
0 5 10 15 20 25 30
Cy
lin
der
ical
Hei
gh
t (m
)
Pressure (kPa)
Wall Pressure (kPa)
Vertical Pressure (kPa)

94
Figure 4.14:Plot of initial and flow induced loads against hopper height for the 0.05 mm
fraction at 4.78 % moisture level.
The initial fill and flow induced pressures increased as the hopper height increased.
However, the initial fill pressure became constant at a certain hopper height. This shows that the
pressure exerted on the hopper wall as the silo is filled with material reaches a maximum and
remains constant at a certain hopper height.
4.5 Conclusion
The design of a silo bin to allow easy flow of material represents important aspect of bulk
solid handling. In this study, the flow properties of fractionated ground loblolly pine were
quantified and a sensitivity analysis carried out on the silo design parameters. It was found that;
The flowability of the fractions increased with increase in fraction size and decrease in
moisture content. Dosing of large and small sized fractions resulted in reduced flowability.
This result implied that the presence of small particles resulted in reduced flowability. Also,
the wall friction properties were found to perform differently using three different wall
0
2
4
6
8
10
12
14
0 10 20 30 40 50
Hop
per
Hei
gh
t (m
)
Pressure (kPa)
Initial Fill
Flow induced

95
surfaces. Stainless steel and mild steel had better performance at lower moisture content
while Tivar 88 surface had a good performance at higher moisture content.
The hopper half angle (varied between 15.370 and 38.440) decreased with increase in
moisture content and decrease in fraction size. The minimum hopper outlet sizes ranged
from 1.20 to 28.56 mm. The vertical and wall normal pressures acting on the cylindrical
section increased with increase in fraction size and decrease in moisture content. The initial
fill and flow induced pressure also increased with increase in fraction size and decrease in
moisture content.

96
Chapter 5: Summary and Recommendation
5.1 Summary
Particle size and moisture content contributed significantly to the physical and flow
properties of ground loblolly pine. At varying fraction size and moisture content, the physical and
flow properties of the fractionated ground loblolly pine was found to behave differently. The bulk
and tap densities were found to increase with increase in fraction size while particle density was
not significantly affected by fraction size. The porosity, Hausner ratio and compressibility of the
fractions were also found to decrease with increase in the size of the fraction. Also, increased
moisture content was found to significantly cause a reduction in the densities (bulk, tap and
particle) and porosity while it had no significant effect on Hausner ratio and compressibility.
Meanwhile, the flowability of the fraction increased with increase in fraction size and reduced
moisture content. Dosing of large sized fraction and small sized fraction resulted in reduced
flowability. This implies that the presence of small particles results in reduced flowability. Also,
wall friction characteristics were found to perform differently. Stainless and mild steel had better
performance at lower moisture content while Tivar 88 surface had a consistent and desirable results
at different moisture content levels and across the particle sizes. The heating value of the fractions
and volatile matter were not significant affected by fraction size. However, the ash content was
found to increase with reduction in the size of the fraction. These compositional data are needed
to design appropriate biomass conversion systems.
The sensitivity analysis indicated that the flow factor and flow function lines did not
intersect and therefore a critical applied stress was not obtained. This implies that the design of the
minimum hopper outlet size is to handle mechanical arching. This is in contrast to the flow
properties test carried out on the fractions describing the loblolly fraction as a cohesive material.

97
However, the minimum discharge outlet sizes obtained for the fractions varied from 1.20 to 28.56
mm. This implies that with such minimum hopper outlet size, there is a tendency for cohesive
arching to occur during material discharge. The vertical and wall normal pressures acting on the
cylindrical section of the silo alongside the initial fill and flow induced pressures increased with
increase in fraction size and decrease in moisture content. Also, the pressures increased as the
height of the cylindrical and hopper sections increased.
The results obtained from this work shows that an increasing quantity of small sized
fractions and moisture content will lead to typical flow problems associated with bulk materials.
Therefore, in the design and selection of appropriate storage, handling and transport vessels for
ground woody biomass (e.g loblolly pine), it is imperative to understand the proportion of varying
sizes of fractions in the bulk material as this tends to significantly influence the physical and flow
properties of ground loblolly pine. The design and selection of storage vessels should take into
consideration the change in flow problems caused by particle size and moisture content especially
in the estimation of hopper outlet size for mass flow in order to prevent cohesive and mechanical
arching.
5.2 Recommendation and future works
This work investigated the contribution of particle size and moisture content to the physical
and flow properties of fractionated ground loblolly pine. In order to avoid flow problem during
unloading of ground loblolly pine from storage vessels, ensuring large particles of sizes 1.40 mm
and moisture content range of 4 – 10% (wb) will be appropriate. Also, in the selection of the type
of wall lining material to be used for storage vessel, Tivar 88 surface will be desirable because of
its low angle of wall friction at all moisture levels and particle sizes.

98
This research work focused mainly on characterization of the instantaneous physical and
flow properties of the fractionated ground loblolly pine. Since there is a time difference between
the storage of ground loblolly pine and when it is used, it is recommended that further analysis
should be carried out on the effect of storage time (time consolidation) on the physical and flow
properties of fractionated ground loblolly pine at different moisture content. Also, in the present
study, a dosing experiment of two fractions was only carried out. Therefore, it is recommended
that a dosing experiment involving the mixture of varying quantity of each fraction to determine
the point at which flowability will change from easy flow to cohesive flow should be conducted.
99
References
Abdullah, E. C., and D. Geldart. 1999. The use of bulk density measurements as flowability
indicators. Powder Technology 102(2): 151-165.
Adapa, P. K., G. J. Schoenau, and E. A. Arinze. 2004. Fractionation of alfalfa into leaves and
stems using a three pass rotary drum dryer. Biosystems Engineering 91(4): 455-463.
Adapa, P., L. Tabil, G. Schoenau. 2009. Compaction characteristics of barley, canola, oat and
wheat straw. Biosystems Engineering 104:335 – 344.
Adapa, P.K., L.G. Tabil and G.J. Schoenau. 2011. Grinding performance and physical properties
of non-treated and steam exploded barley, canola, oat and wheat straw. Journal of Biomass and
Bioenergy, doi:10.1016/j.biombioe.2010.10.004, 35(2011), pp. 549-561.
ASABE Standards. 2007. S269.4: Definition of methods for determining density, durability and
moisture content, ASABE, St. Joseph, MI.
ASABE Standards. 2008. S319.4: Method of determining and expressing fineness of feed
materials by sieving, ASABE, St. Joseph, MI.
ASABE Standards. 2011. S593.1: Terminology and Definitions for Biomass Production,
Harvesting and Collection, Storage, Processing, Conversion and Utilization. ASABE, St. Joseph,
MI 49085-9659.
Austin, L.G. 2002. A treatment of impact breakage of particles. Powder Technology 126: 85-
90.
Bahram, H., M.H., Kianmehr, S.R Hassan-Beygi, I., Valaei and H., Alikhani. 2013. Characterizing
of Flow Property for Wormy Compost by Using Newest Methods. World Applied Sciences Journal
25 (2): 306-313. ISSN 1818-4952.
Barbosa-Canovas, G.V., E., Ortega-Rivas, P., Juliano, and H., Yan. 2005. Food Powders: Physical
properties, processing and functionality. Kluwer Academic Publishers, New York, NY.
Baker, J.B. and O.G., Langdon. 2013. Pinus taeda L.- Loblolly Pine.
http://forestry.about.com/library/silvics/blsilpintae.htm. Accessed 08/20/2013.
Benkovic, M. and I. Bauman. 2009. Flow properties of commercial infant formula powders. World
Academy of Science, Engineering and Technology 30.
Bernhart, M and O.O. Fasina. 2009. Physical properties and pyrolysis behavior of fractionated
poultry litter. Transactions of the ASABE 52: 531–538.
Bhadra, R., K. Muthukumarappan and K.A. Rosentrater. 2009. Flowability properties of
commercial Distillers Dried Grains with Solubles (DDGS) Cereal Chemistry 86(2):170–180.

100
Biomass Research and Development Board (BRDB). 2010. Biofuel feedstock logistics:
Recommendations for research and commercialization.
http://www.biomassboard.gov/pdfs/biomass_logistics_2011_web.pdf.
Bitra, V.S.P., A.R. Womac, N. Chevanan, P.I. Miu, C. Igathinathane, S. Sokhansanj, D.R. Smith.
2009. Direct mechanical energy measures of hammermill comminution of switchgrass, wheat
straw, and corn stover and analysis of their particle size distributions. Powder Technology 193:32–
45.
Bradley, M.S.A, R.J. Berry, R.J. Farnish. 2011. Methods for Design of Hoppers for Reliable
Gravity Flow, for Pharmaceutical, Food, Mineral and Other Applications. www.bulksolids.com.
Bravo-Osuna, I., C. Ferrero, M.R. Jiménez-Castellanos. 2007. Influence of moisture content on
the mechanical properties of methyl methacrylate-starch copolymers. European Journal of
Pharmaceutics and Biopharmaceutics 66: 63-72.
Brennan, J.G., J.R. Butters, N.D. Cowell, and A.E.V. Lilly. 1969. Food engineering operations.
NY: American Elsevier Publishing Company.
Bridgewater, A.V. (Ed.), 2001. Progress in Thermochemical Biomass Conversion. Blackwell
Science, Oxford, pp. 1468–1481.
Buma, T.J. 1971. Free fat in spray dried whole milk 5. Cohesion; determination, influence of
particle size, moisture content and free-fat content. Netherlands Milk and Dairy Journal 25: 107-
122.
Cagli, A.S., B.N. Deveci, C.H. Okutan, D.A.A. Sirkeci and E.Y. Teoman. 2007. Flow property
measurement using the Jenike shear cell for 7 different bulk solids. Proceedings of European
Congress of Chemical Engineering (ECCE-6).
Carr, R.L. 1965. Evaluating flow properties of solids. Chemical Engineering 72:163-168.
CEN/TC 335-WG 2 N94 Final draft. 2003. Solid biofuels - Fuel Specifications and Classes,
European Committee for Standardization (ed.), Brussels, Belgium.
Chen, P., Y. Zhulin, X. Shen, and Y. Zhang. 2012. Flow properties of three fuel powders.
Particuology.10: 438– 443.
Chevananan, N., A.R., Womac, V.S.P., Bitra, D.C., Yoder and S., Sokhansanj. 2009. Flowability
parameters for chopped switchgrass, wheat straw and corn stover. Powder Technology 193:79-86
Chundawat, S.P.S., B. Venkatesh and B.E. Dale. 2006. Effect of particle size based separation of
milled corn stover on AFEX pretreatment and enzymatic digestibility. Biotechnology and
Bioengineering 92: 219–231.

101
Colley, Z., Fasina, O.O., Bransby, D. and Lee Y.Y. 2006. Moisture effect on the physical
characteristics of switchgrass pellets. Transactions of the ASABE. 49(6): 1845-1851.
Cunningham, K., K., Barry and T., Walkingstick. Managing loblolly pine stands … from A to Z.
Agriculture and Natural Resources FSA5023. http://www.uaex.edu. Accessed 02/12/2014.
Datta, R., 1981. Energy requirement for lignocellulose pretreatment processes. Process
Biochemistry 16- 42.
Darby, R. 2001. Chemical Engineering Fluid Mechanics. 2nd Edition, Revised and Expanded.
Marcel Dekker, Inc. 270 Madison Avenue, New York, NY 10016.
Deshpande, S.D., S. Bal and T.P. Ojha, 1993. Physical properties of soybean. Journal of
Agricultural Engineering Research 56(2): 89-98.
Dilts, M. D. 2007. Application of the rollermill and hammermill for biomass fractionation. MS
thesis. Ames, Iowa: Iowa State University, Department of Agricultural Engineering.
Drzymala, Z., 1993. Industrial briquetting – fundamentals and methods. Studies in Mechanical
Engineering Volume 13. PWN-Polish Scientific Publishers, Warszawa.
Duffy, S.P. and V.M. Puri. 1996. Flowability parameters and flow functions for confectionery
sugar and detergent powder at two moisture contents. Applied Engineering in Agriculture 12(5):
601-606.
Emery, E., J. Oliver, T. Pugsley, J. Sharma and J. Zhou. 2009. Flowability of moist pharmaceutical
powders. Powder Technology 189: 409-415.
Energy Independence and Security Act (EISA). 2007. Available online:
http://www.energy.wsu.edu/ documents/EnergyIndependenceAndSecurityActOf2007.pdf
Accessed on 01/22/ 2014.
Energy Information Administration (EIA). 2008. Annual Energy Outlook 2008. Washington, DC:
DOE Energy Information Administration. Available at:
http://www.eia.doe.gov/piaf/aeo/index.html. Accessed on 05/07/2013.
Energy Information Administration. 2009. Annual energy review Tech. Rep. DOE/EIA-
0384(2009) 2010. http://www.eia.doe.gov/totalenergy/data/annual/pdf/aer.pdf. Accessed on
05/07/2013.
Energy Information Administration (EIA). 2010. Monthly Energy Review. U.S Department of
Energy. Accessed at http://tonto.eia.doe.gov/FTPROOT/multifuel/mer/00351005.pdf on
05/07/2013.
Energy Information Administration (EIA). 2013. Monthly Energy Review February.
www.eia.gov/totalenergy/data/monthly/pdf/sec1_7.pdf. Accessed on 01/22/ 2014.
102
Enstad, G.G. 1981. A novel theory on the arching and doming in mass flow hoppers. Bergen: The
Michelsen Institute. 172p.
Farhat, A.A. and M. A. Quraishi. 2010. Inhibitive Performance of Gemini Surfactants as Corrosion
Inhibitors for Mild Steel in Formic Acid. Portugaliae Electrochimica Acta 28(5): 321-335. DOI:
10.4152/pea.201005321.
Fasina, O.O. and Sokhansanj, S. 1995. Modelling the bulk cooling of alfalfa pellets. Drying
Technology 13: 1881-1904.
Fasina, O.O. 2006. Flow and physical properties of switchgrass, peanut hull and poultry litter.
Trans. ASABE 49:721–728.
Fasina, O.O. 2007. Physical properties of peanut hull pellets. ASABE Paper No. 076161. St.
Joseph, MI: ASABE.
Fasina, O.O. 2008. Physical properties of peanut hull pellets. Bioresource Technology 99:1259–
1266.
Fayed, M.E., and T.S. Skocir. 1997. Mechanical Conveyors: Selection and Operation. Lancaster,
Pa.: Technomic Publishing.
Fitzpatrick, J.J., 2003. Food powder flowability. In: Onwulata, C. (Ed.), Encapsulated and
Powdered Foods. Taylor and Francis Group, New York, NY, pp. 247–260.
Fitzpatrick, J. J. 2005. Food powder flowability, In Encapsuled and powdered foods, C. Onwulata,
Ed. Boca Raton: CRC Press, pp. 247-258.
Fitzpatrick, J.J., T. Iqbal, C. Delaney, T. Twomey, and M.K. Keogh. 2004. Effect of powder
properties on the flowability of milk powders with different fat contents. Journal of Food
Engineering 64(4): 435–444.
Fitzpatrick, J.J., S.A. Barringer, T. Iqbal. 2004. Flow property measurement of food powders and
sensitivity of Jenike's hopper design methodology to the measured values. Journal of Food
Engineering 61: 399–405.
Fitzpatrick, J.J. and L. Ahrne. 2005. Food powder handling and processing: Industry problems,
knowledge barriers and research opportunities. Chem Eng Proc. 44(2): 209–214.
Fitzpatrick, J. J. 2007. Particle properties and the design of solid food particle processing
operations. Trans IChemE, Part C, Food and Bioproducts Processing. 85(4):308–314.
Freeman, R. 2007. Measuring the flow properties of consolidated, conditioned and aerated
powders — A comparative study using a powder rheometer and a rotational shear cell. Powder
Technology 174: 25–33.

103
Ganesan, V., K.A. Rosentrater, K. Muthukumarappan. 2009. Physical and Flow Properties of
Regular and Reduced Fat Distillers Dried Grains with Solubles (DDGS). Food Bioprocess
Technology 2:156–166. DOI 10.1007/s11947-007-0026-x.
García, R., C. Pizarro, A.G. Lavín and J.L. Bueno. 2012. Characterization of Spanish biomass
wastes for energy use. Bioresource Technology 103: 249–258.
Geldart, D., N. Harnby, and A.C. Wong. 1984. Fluidization of cohesive powder. Powder
Technology 37: 25-37.
Gil, M., I. Arauzo, E. Teruel, C. Bartolome. 2012. Milling and handling Cynara Cardunculus L.
for use as solid biofuel: Experimental tests. Biomass and Bioenergy 41: 145-156.
Gil, M., D. Schott, I. Arauzo, E. Teruel. 2013. Handling behavior of two milled biomass: SRF
poplar and corn stover. Fuel Processing Technology 112: 76–85.
Günen, A., M.S. Karakas, B. Kurt, A. Çalik. 2014. Corrosion behavior of borided AISI 304
austenitic stainless steel. Anti-Corrosion Methods and Materials 61(2): 112 – 119.
Gray, K.A., L.S. Zhao and M. Emptage. 2006. Bioethanol. Current Opinion in Chemical Biology
10 (2): 141–146.
Grafton, M.C.E., I.J. Yule, C.E. Davies, J.R. Jones. 2009. Comparative study of the cohesive
properties of commercial agricultural crushed limestones of New Zealand. ASABE Paper number
096346.
Greene, D., S. Baker, B. Mendell, A.H. Lang. 2011. Integrating woody biomass into the U.S. South
wood supply chain. 34th Council on Forest Engineering, June 12-15, 2011, Quebec City (Quebec).
Guo, Q., X. Chen, H. Liu. 2012. Experimental research on shape and size distribution of biomass
particle. Fuel. 94:551-555.
Hargreaves, K., M. Zielinska, and S. Cenkowski. 2010. Flowability of Distiller’s Spent Grains
Processed with Air and Superheated Steam Drying. ASABE Paper number MBSK10-503.
Holdich, R.G. 2002. Fundamentals of Particle Technology. Midland Information Technology and
Publishing, Leicestershire, UK. www.midlandit.co.uk. ISBN 0-9543881-0-0.
Igathinathane, C., A.R. Womac, S. Sokhansanj, S. Narayan. 2009. Size reduction of high- and low-
moisture corn stalks by linear knife grid system. Biomass Bioenergy 33: 547–557.
Ileleji, K. and K. Rosentrater. 2008. On the physical properties of distillers dried grains with
solubles (DDGS). ASABE Paper Number: 084576.
Ileleji, K.E., K.S. Prakash, R.L. Stroshine and C.L. Clementson. 2007. An Investigation of

104
Particle Segregation in Corn Processed Dried Distillers Grains with Solubles (DDGS) induced by
Three Handling Scenarios. Bulk Solids & Powder - Science & Technology 2: 84 – 94.
Iqbal, T and J.J. Fitzpatrick. 2006. Effect of storage conditions on the wall friction characteristics
of three food powders. Journal of Food Engineering 72: 273–280.
Jannasch, R., Y. Quan, R. Samson. 2001. Final Report: A Process and energy analysis of
pelletizing switchgrass. Resource efficient agricultural production (REAP-Canada), Ste. Anne de
Bellevue, OC, Canada, Available at: http://www.reap-canada.com/library.htm.
Janssen, H.A. Getreidedruck in Silozellen, Z. Ver. Dt. Ing. 39 (1895), pp. 1045-1049.
Jenike, A. W. 1964. Storage and flow of solids. Bulletin No. 123.Bulletin of the University of
Utah. Salt Lake City: Utah Engineering Station.
Jenike, A. W. 1970. Storage and flow of solids. Bulletin No. 123.Bulletin of the University of
Utah. Salt Lake City: Utah Engineering Station. (Revised edition).
Jenkins, B.M., L.L., Baxter, T.R., Miles Jr., and T.R., Miles. 1998. Combustion properties of
biomass. Fuel Processing Technology 54: 17–46.
Johanson, J. R. 1978. Know your material—How to predict and use the properties of bulk solids.
Chemical Engineering.
Johanson, J.R. 2002. Troubleshooting bins, hoppers and feeders. Chemical Engineering Progress
24–36.
Kashaninejad, M., M. Ahmadi, A. Daraei, D. Chabra. 2008. Handling and frictional characteristics
of soybean as a function of moisture content and variety. Powder technology 188: 1-8.
Kibar, H., T. Öztürk and B. Esen. 2010. The effect of moisture content on physical and mechanical
properties of rice (Oryza sativa L.). Spanish Journal of Agricultural Research 8(3): 741-749.
Kirtay, E. 2011.Recent advances in production of hydrogen from biomass. Energy Conversion
Management 52:1778-1789.
Knowlton, T.M., J.W. Carson, G.E. Klinzing and W.C. Yang. 1994. The importance of storage,
transfer and collection. Chemical Engineering Progress 90(4): 44–54.
Krantz, M., H. Zhang, and J. Zhu. 2009. Characterization of powder flow: Static and dynamic
testing. Powder Technology. 194: 239–245.
Kumar, P., D.M. Barrett, M.J. Delwiche, and P. Stroeve. 2009. Methods of pretreatment of
lignocellulosic biomass for efficient hydrolysis and biofuel production. Industrial and Engineering
Chemistry Research 48: 3713–3729.

105
Lam, P.S., S. Sokhansanj, X. Bi, S. Mani, A.R. Womac, M. Hoque, J. Peng, T. JayaShankar, L.J.
Naimi, S. Narayan. 2007. Physical Characterization of Wet and Dry Wheat Straw and Switchgrass
– Bulk and Specific Density. Paper No. 076058. ASABE, St. Joseph, Michigan.
Lam, P.S., S. Sokhansanj, X. Bi, C.J. Lim, L.J. Naimi, M. Hoque, S. Mani, A.R. Womac, X.P.
Ye, S. Narayan. 2008. Bulk density of wet and dry wheat straw and switchgrass particles. Applied
Engineering in Agriculture 24: 351–358.
Leaver, R. H. 1985. Pelleting dies: Characteristics and selection. Sprout-Waldron Feed Pointers
26:1-6.
Littlefield, B., O.O. Fasina, J. Shaw, S. Adhikari and B. Via. 2011. Physical and flow properties
of pecan shells—Particle size and moisture effects. Powder Technology 212: 173–180.
Littlefield, B. 2010. Characterization of pecan shells for value-added applications. Master’s Thesis
submitted to The Graduate School, Auburn University, Auburn, AL.
Liu, K.S. 2008. Particle size distribution of distillers dried grains with solubles (DDGS) and
relationships to compositional and color properties. Bioresource Technology 99: 8421–8428.
Liu, L.X., I. Marziano, A.C. Bentham, J.D. Litster, E.T. White and T. Howes. 2008. Effect of
particle properties on the flowability of ibruprofen powders. International Journal of
Pharmaceutics 362: 109-117.
Lopo, P., 2002. The right grinding solution for you: roll, horizontal or vertical. Feed Management
53: 6–23.
MacBain, R. 1966. Pelleting Animal Feed. Arlington, Va.: American Feed Manufacturers
Association.
Mani, S., L. Tabil, and S. Sokhansanj. 2004. Grinding performance and physical properties of
wheat and barley straws, corn stover and switchgrass. Biomass Bioenergy. 27: 339-352.
Mani, S., L.G. Tabil, S. Sokhansanj. 2006. Effects of compressive force, particle size and moisture
content on mechanical properties of biomass pellets from grasses. Biomass Bioenergy. 30:648–
654.
Manickam, I.N. and S.R. Suresh. 2011. Effect of moisture content and particle size on bulk density,
porosity, particle density and coefficient of friction of coir pith. International Journal of
Engineering Science and Technology 3: 2596-2602. ISSN: 0975-5462.
Marinelli, J and J.W. Carson. 1992. Solve solids flow problems in bins, hoppers, and feeders.
Chemical Engineering Progress 88:22-28.
Maynard, E. 2013. Ten steps to an effective bin design. American Institute of Chemical Engineers
(AIChE). www.aiche.org/cep.

106
McGlinchey, D. 2005. Bulk property characterization. In: McGlinchey, D. (Ed.), Characterization
of Bulk Solids. CRC Press, New York, NY, pp. 48–84.
McKendry, P. 2002. Energy production from biomass (part 2): conversion technologies.
Bioresource Technology 83(1):47-54.
McMullen , J., O.O. Fasina, C.W. Wood, Y. Feng. 2005. Storage and handling characteristics of
pellets from poultry litter. Applied Engineering in Agriculture 21: 645-651.
Merrow, E. W. 1988. Estimating Startup Times for Solids-Processing Plants. Chemical
Engineering Journal: 89.
Miao, Z., T.E. Grift, A.C. Hansena, and K.C. Ting. 2011. Energy requirement for comminution of
biomass in relation to particle physical properties. Industrial Crops and Products 33:504–513.
Miu P.I., R. Alvin, C. Igathinathane, and S. Sokhansanj. 2006. Analysis of biomass comminution
and Separation, Processes in Rotary Equipment – A Review, ASABE paper no. 066169. St. Joseph,
Mich.: ASABE.
Moriarty, P. and D. Honnery. 2008. Low-mobility: the future of transport. Futures. 40 (10): 865–
872.
Molenda, M., M.D. Montross, J. Horabik, and I.J. Ross. 2002. Mechanical properties of corn and
soybean meal. Transactions of ASAE 45(6): 1929-1936.
Munsell, J.F. and T.R. Fox. 2010. An analysis of the feasibility for increasing woody biomass
production from pine plantations in the southern United States. Biomass Bioenergy. 34(12):1631-
1642.
Naimi, L.J., S. Sokhansanj, S. Mani, et al. 2006. Cost and performance of woody biomass size
reduction for energy production. CSBE/SCGAB Paper No. 06-107. 13p.
Newman, A.W. 1995. Micromeritics. In: Brittain, H.G. (Ed.), Physical Characterization of
Pharmaceutical Solids. Marcel Dekker Inc., New York, NY, pp. 253–280.
Nimkar, P.M. and P.K. Chattopadhyay, 2001. Some physical properties of green gram. Journal of
Agricultural Engineering Research 80(2): 183-189.
Nokhodchi, A. 2005. An overview of the effect of moisture on compaction and compression.
Pharmaceutical Technology 46-66.
OECD/IEA. 2010. Sustainable Production of Second-Generation Biofuels: Potential and
perspectives in major economies and developing countries. Information paper. Anselm Eisentraut.

107
Opalinski, I., M. Chutkowski, M. Stasiak. 2012. Characterising moist food-powder flowability
using Jenike shear tester. Journal of Food Engineering 108:51-58.
Ortega-Rivas, E. 2003. Review and research trends in food powder processing. Powder Handling
and Processing 15(1): 18-25.
Ortega-Rivas, E. 2009. Bulk properties of food particulate materials: an appraisal of their
characterisation and relevance in processing. Food Bioprocess Technology 2:28–44. DOI
10.1007/s11947-008-0107-5.
Ozbay N., A.E. Putun, B.B. Uzun and E. Putun. 2001. Biocrude from biomass: pyrolysis of cotton
seed cake. Renewable Energy 24:615-625.
Pabis, S., Jayas, D.S., Cenkowski, S., 1998. Grain Drying: Theory and Practice. John Wiley &
Sons, Inc., New York, NY.
Peleg, M. 1977. Flowability of food powders and methods for its evaluation— A review. Journal
of Food Process Engineering 1:303-328.
Peleg, M., C.H. Manheim, and N. Passy.1973. Flow properties of some food powders. Journal of
Food Science 38(6): 959–963.
Peleg, M. and M.R.Moreyra.1979. Effect of moisture on the stress relaxation pattern of compacted
powders. Powder Technology 23(2): 277–279.
Perlack, R. D and B. J. Stokes. 2011. U.S. Billion-Ton Update: Biomass supply for a bioenergy
and bioproducts industry. Tech. Rep. ORNL/TM-2011/224, Oak Ridge National Laboratory.
http://www1.eere.energy.gov/biomass/pdfs/billion ton update.pdf. p.227.
Prescott, J.K., D.A. Ploof, and J.W. Carson. 1999. Developing a better understanding of wall
friction. Powder Handling and Processing. 19–26.
Prescott, J. K., and R.A. Barnum. 2000. On powder flowability. Pharmaceutical Technology 60-
84.
Probst, K. V., R. P. K. Ambrose, R. L. Pinto, R. Bali, P. Krishnakumar, K. E. Ileleji. 2013. The
effect of moisture content on the grinding performance of corn and corncobs by hammermilling.
Transactions of the ASABE 56(3): 1025-1033.
Puri, V. M. 2002. Characterizing powder flowability. Chemical Processing 65(1): 39-42.
Purutyan, H., B.H. Pittenger, and J.W. Carson. 1998. Solve solids handling problems by
retrofitting. Chemical Engineering Progress. 27–39.
Purutyan, H., R. Barnum and M. Schimmelpfennig. 2001. Fuel handling consideration when
switching to PRB coal. Power 53- 64. www.platts.com/engineering.

108
Ramavath, P., M. Swathi, M. Buchi Suresh, R. Johnson. 2013. Flow properties of spray dried
alumina granules using powder flow analysis technique. Advanced Powder Technology 24: 667-
673.
Ranney, J. W., J. L. Trimble, L. L. Wright and R. D. Perlack. 1985. Short-rotation woody crops
production research in the south. In: Proceedings of the 3rd Southern Biomass Energy Research
Conference, Gainesville, Fla, USA.
Rennie, P.R, X.D. Chen, C. Hargreaves, A.R. Mackereth. 1999. A study of the cohesion of dairy
powders. Journal of Food Engineering 39: 277-284.
Rhodes, M. 1998. Introduction to particle technology. John Wiley and Sons, New York, 320 pp.
Roberts, A. W. 1994. Developments in silo design for the safe and efficient storage and handling
of grain. Proceedings of the 6th International Working Conference on Stored-Product Protection.
Rosentrater, K.C., D. Subramanian, P.G. Krishnan. 2006. Fractionation techniques to concentrate
nutrient streams in distillers grains. ASABE Meeting Presentation Paper Number: 066166.
Rotter, J.M. 2001. Guide for the economic design of circular metal silos. Spon Press, Taylor and
Francis group, London and New York. 235p.
Rupar, K. and M. Sanati. 2004. The release of terpenes during storage of biomass. Biomass and
Bioenergy 28(1): 29–34.
SAS. 2010. SAS Users’ Guide. SAS Institute Inc., Cary, NC.
Saxena, R.C., D.K. Adhikari, and H.B. Goyal. 2009. Biomass-based energy fuel through
biochemical routes: A review. Renewable and Sustainable Energy Reviews 13:167–178.
Schell, D.J., and C. Harwood. 1994. Milling of lignocellulosic biomass: results of pilot scale
testing. Applied Biochemistry and Biotech 45(46): 159–168.
Schwedes, J. 2003. Review on testers for measuring flow properties of bulk solids. Granular
Matter. 5:1-43.
Schulze, D. 1996. Measuring powder flowability: A comparison of test methods. Powder Bulk
Engineering 45–61.
Schulze, D. 2006. Storage of powders and bulk solids in silos. Available at http://www.dietmer-
schulze.de/storagepr.html. Dietmar Schulze: Wolfenbüttel, Germany.
Schulze, D. 2008. Powders and bulk solids: behavior, characterization, storage and flow. ISBN
978-3-540-73767-4 Springer Berlin Heidelberg New York. p 42.

109
Shamlou, P. A. 1988. Handling of bulk solids––theory and practice. London, UK: Butterworths.
Simmons, B. A., D. Loque, and H. W Blanch. 2008. Next-generation biomass feedstocks for
biofuel production. Genome Biology 9(12):9.
Sokhansanj, S. and J. Fenton. 2006. Cost benefit of biomass supply and pre-processing, BIOCAP
research integration program synthesis paper. Ottawa, Canada: BIOCAP Canada Foundation.
Sokhansanj, S and J.R. Hess. 2009. Biomass Supply Logistics and Infrastructure. Biofuels
Methods in Molecular Biology. 58:1-25.
Teunou, E. and J.J. Fitzpatrick. 1999. Effect of relative humidity and temperature on food powder
flowability. Journal of Food Engineering 42:109–116.
Teunou, E., J.J., Fitzpartrick, and E.C., Synnott. 1999. Characterization of food powder
flowability. Journal of Food Engineering 39:31–37.
Thomson, F.M. 1997. Storage and flow of particulate solids. In Fayed, M.E. and Otten, L.
Handbook of Powder Science and Technology, Chapman and Hall, New York, pp. 389-436
The United States Pharmacopeia (USP). 1995. The National Formulary, USP23/NF18; United
States Pharmacopeial Convention, Inc.: Rockville, MD, USA.
The United States Pharmacopeia. 2011. Bulk Density and Tapped Density of Powders. The United
States Pharmacopeia Convention, Inc.: Rockville, MD, USA.
Tomas, J. and D. Schubert. 1979. Particle characterization. Proc. of Partec 79, Nuremberg,
Germany. 301-319.
Tumuluru, J.S., L.G. Tabil, Y. Song, K.L. Iroba and V. Meda. 2014. Grinding energy and physical
properties of chopped and hammer-milled barley, wheat, oat, and canola straws. Biomass and
Bioenergy 60: 58-67.
US Department of Energy. 1993. Assessment of costs and benefits of flexible and alternative fuel
use in the US transportation sector. In: Evaluation of a Wood-to-Ethanol Process. Technical Report
No. 11, DOE/EP-0004. US Department of Energy, Washington, DC.
U.S. Energy Information Administration (EIA). 2014. Monthly Energy Review, February.
www.eia.gov/totalenergy/data/monthly/pdf/mer.pdf.
van der Stelt, M.J.C., H. Gerhauser, J.H.A. Kiel, K.J. Ptasinski. 2011. Biomass upgrading by
torrefaction for the production of biofuels: A review. Biomass Bioenergy. 35: 3748-3762
Velan, B. 2012. Selecting in-plant bulk handling systems and equipment. www.bulk-solids-
handling.com.
110
Verlinden, A.2000. Experimental assessment of shear testers for measuring flow properties of bulk
solids, PhD-Thesis, Univ. of Bradford, UK.
Weber, M.W., D.K. Hoffman and C.M. Hrenya .2004. Discrete particle simulations of cohesive
granular flow using a square-well potential. Granular Matter 6(4): 239-254
Wei, L., L.O. Pordesimo, C. Igathinathane, and W.D. Batchelor. 2009. Process engineering
evaluation of ethanol production from wood through bioprocessing and chemical catalysis.
Biomass Bioenergy 33:255–266.
Werther, J., M. Saenger, E.U. Hartge, T. Ogada, and Z. Siagi. 2000. Combustion of agricultural
residues. Prog. Energ. Combust. 26:1-27.
Williams, T. M., and C. A. Gresham. 2006. Biomass accumulation in rapidly growing loblolly
pine and sweetgum. Biomass and Bioenergy 30(4):370-377.
White, E.M. 2010. Woody biomass for bioenergy and biofuels in the United States—a briefing
paper. General Technical Report PNW-GTR-825. 45 p.
White, P. 2013. Biomass Energy. http://pdsblogs.org/chargerapes713/tag/renewables/. Accessed
11/01/2013
Womac, A. 2005. Integrated size reduction and separation to prefractionated biomass. In:
Proceedings of the DOE/USDA Biomass Feedstock Gate Review Meeting.
Woodcock, C. R. and J. S. Mason. 1987. Bulk Solids Handling: An Introduction to the Practice
and Technology. New York, N. Y.: Chapman and Hall
World Health Organization. 2012. S.3.6. Bulk density and tapped density of powders. Final text
for addition to The International Pharmacopoeia. Document QAS/11.450 FINAL. March 2012
Wu, M.R., D.L. Schott, G. Lodewijks. 2011. Physical properties of solid biomass. Biomass and
Bioenergy 35: 2093-2105
Yang, W., S. Sokhansanj, W.J. Crerer and S. Rohani. 1996. Size and shape related characteristics
of alfalfa grind. Canadian Agricultural Engineering 38: 201– 205.
Zhang, M., X. X. Song, Z. J. Pei, and D. H. Wang. 2010. Effects of mechanical comminution on
enzymatic conversion of cellulosic biomass in biofuel manufacturing: a review. In: Proceedings
of the ASME International Conference on Manufacturing Science and Engineering, Erie, Pa, USA.
Zhu, J.Y., G.S. Wang, X.J. Pan and R. Gleisner. 2009. Specific surface to evaluate the efficiencies
of milling and pretreatment of wood for enzymatic saccharification. Chemical Engineering
Science 64:474–485.
Zhou, B., K. Ileleji, and G. Ejeta. 2008. Physical property relationships of bulk corn stover
particles. Transaction of the ASABE. 51(2): 581-590.

111
Zhou, J. and K. Komvopoulos. 2005. Wear Mechanisms of Untreated and Gamma Irradiated Ultra-
High Molecular Weight Polyethylene for Total Joint Replacements. Journal of Tribology 127:
273-279.
Zulfiqar, M., B. Moghtaderi, T.F. Wall. 2006. Flow properties of biomass and coal blends. Fuel
Processing Technology 87: 281–288.
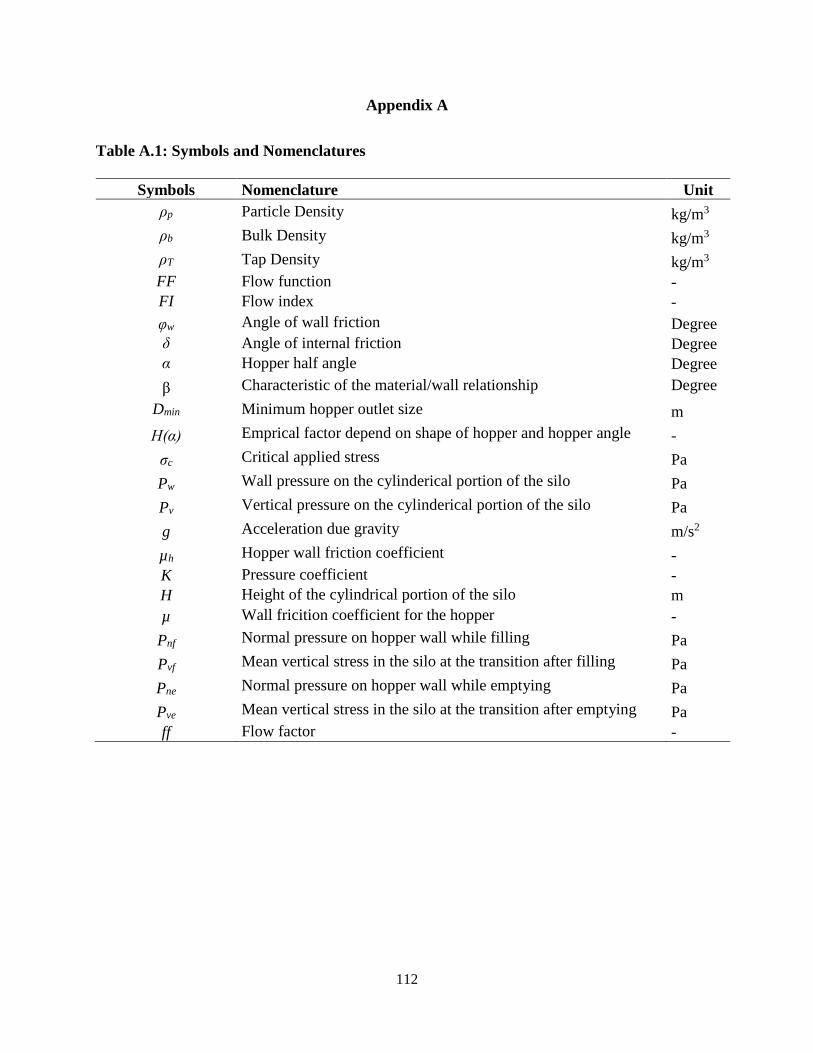
112
Appendix A
Table A.1: Symbols and Nomenclatures
Symbols Nomenclature Unit
ρp Particle Density kg/m3
ρb Bulk Density kg/m3
ρT Tap Density kg/m3
FF Flow function -
FI Flow index -
φw Angle of wall friction Degree
δ Angle of internal friction Degree
α Hopper half angle Degree
β Characteristic of the material/wall relationship Degree
Dmin Minimum hopper outlet size m
H(α) Emprical factor depend on shape of hopper and hopper angle -
σc Critical applied stress Pa
Pw Wall pressure on the cylinderical portion of the silo Pa
Pv Vertical pressure on the cylinderical portion of the silo Pa
g Acceleration due gravity m/s2
µh Hopper wall friction coefficient -
K Pressure coefficient -
H Height of the cylindrical portion of the silo m
µ Wall fricition coefficient for the hopper -
Pnf Normal pressure on hopper wall while filling Pa
Pvf Mean vertical stress in the silo at the transition after filling Pa
Pne Normal pressure on hopper wall while emptying Pa
Pve Mean vertical stress in the silo at the transition after emptying Pa
ff Flow factor -

113
ANOVA results
Table B.1: ANOVA result of particle size and moisture effect on particle density of
fractionated ground loblolly pine
The GLM Procedure Dependent Variable: PD Sum of Source DF Squares Mean Square F Value Pr > F Model 33 83672.22520 2535.52198 57.95 <.0001 Error 68 2975.26000 43.75382 Corrected Total 101 86647.48520 R-Square Coeff Var Root MSE PD Mean 0.965662 0.457950 6.614667 1444.407 Source DF SS Mean Square F Value Pr > F
PS 6 9909.45586 1651.57598 37.75 <.0001 MC 4 62010.71172 15502.67793 354.32 <.0001 PS*MC 23 11752.05762 510.95903 11.68 <.0001
Table B.2: ANOVA result of particle size and moisture effect on bulk density of
fractionated ground loblolly pine
The GLM Procedure
Dependent Variable: BD Sum of Source DF Squares Mean Square F Value Pr > F Model 33 189319.0971 5736.9423 1164.84 <.0001 Error 68 334.9062 4.9251 Corrected Total 101 189654.0033 R-Square Coeff Var Root MSE BD Mean 0.998234 1.064513 2.219255 208.4761 Source DF SS Mean Square F Value Pr > F PS 6 148915.5648 24819.2608 5039.35 <.0001 MC 4 37276.7487 9319.1872 1892.19 <.0001 PS*MC 23 3126.7836 135.9471 27.60 <.0001

114
Table B.3: ANOVA result of particle size and moisture effect on tap density of fractionated
ground loblolly pine
The GLM Procedure Dependent Variable: TD Sum of Source DF Squares Mean Square F Value Pr > F Model 33 153584.7941 4654.0847 469.55 <.0001 Error 68 674.0000 9.9118 Corrected Total 101 154258.7941 R-Square Coeff Var Root MSE TD Mean 0.995631 1.141295 3.148296 275.8529 Source DF SS Mean Square F Value Pr > F PS 6 100864.2775 16810.7129 1696.04 <.0001 MC 4 48920.4694 12230.1174 1233.90 <.0001 PS*MC 23 3800.0472 165.2194 16.67 <.0001
Table B.4: ANOVA result of particle size and moisture effect on compressibility of
fractionated ground loblolly pine
The GLM Procedure
Dependent Variable: Compressibility Sum of Source DF Squares Mean Square F Value Pr > F Model 33 3837.140392 116.276982 36.41 <.0001 Error 68 217.173333 3.193725 Corrected Total 101 4054.313725 R-Square Coeff Var Root MSE Compressibility Mean 0.946434 7.382317 1.787100 24.20784 Source DF SS Mean Square F Value Pr > F PS 6 3029.655059 504.942510 158.10 <.0001 MC 4 429.032254 107.258063 33.58 <.0001 PS*MC 23 378.453079 16.454482 5.15 <.0001

115
Table B.5: ANOVA result of particle size and moisture effect on Hausner ratio of
fractionated ground loblolly pine
The GLM Procedure Dependent Variable: HR Sum of Source DF Squares Mean Square F Value Pr > F Model 33 1.38885502 0.04208652 38.91 <.0001 Error 68 0.07354733 0.00108158 Corrected Total 101 1.46240235 R-Square Coeff Var Root MSE HR Mean 0.949708 2.474156 0.032887 1.329235 Source DF SS Mean Square F Value Pr > F PS 6 1.07234157 0.17872359 165.24 <.0001 MC 4 0.15379908 0.03844977 35.55 <.0001 PS*MC 23 0.16271437 0.00707454 6.54 <.0001
Table B.6: ANOVA result of particle size and moisture effect on porosity of fractionated
ground loblolly pine
The GLM Procedure Dependent Variable: Porosity Sum of Source DF Squares Mean Square F Value Pr > F Model 33 0.09110681 0.00276081 1003.67 <.0001 Error 68 0.00018705 0.00000275 Corrected Total 101 0.09129386 R-Square Coeff Var Root MSE Porosity Mean 0.997951 0.193844 0.001659 0.855599 Source DF SS Mean Square F Value Pr > F PS 6 0.07559100 0.01259850 4580.06 <.0001 MC 4 0.01367591 0.00341898 1242.94 <.0001 PS*MC 23 0.00183990 0.00008000 29.08 <.0001

116
Table B.7: ANOVA result of particle size and moisture effect on angle of internal friction of
fractionated ground loblolly pine
The GLM Procedure Dependent Variable: Internal_friction Sum of Source DF Squares Mean Square F Value Pr > F Model 33 4909.529588 148.773624 69.32 <.0001 Error 476 1021.613333 2.146246 Corrected Total 509 5931.142922 R-Square Coeff Var Root MSE Internal_friction Mean 0.827754 3.117284 1.465007 46.99627 Source DF SS Mean Square F Value Pr > F
Particle_size 6 2380.074955 396.679159 184.82 <.0001 Moisture 4 2191.393605 547.848401 255.26 <.0001 Particle_si*Moisture 23 338.061029 14.698306 6.85 <.0001
Table B.8: ANOVA result of particle size and moisture effect on cohesion of fractionated
ground loblolly pine
The GLM Procedure
Dependent Variable: Cohesion Sum of Source DF Squares Mean Square F Value Pr > F Model 33 16.79996855 0.50908996 4.07 <.0001 Error 476 59.48413173 0.12496666 Corrected Total 509 76.28410028 R-Square Coeff Var Root MSE Cohesion Mean 0.220229 50.26351 0.353506 0.703306 Source DF SS Mean Square F Value Pr > F Particle_size 6 13.96265015 2.32710836 18.62 <.0001 Moisture 4 1.33298185 0.33324546 2.67 0.0318 Particle_si*Moisture 23 1.50433655 0.06540594 0.52 0.9681

117
Table B.9-1: ANOVA result of particle size and moisture effect on angle of wall friction of
fractionated ground loblolly pine using stainless steel
The GLM Procedure Dependent Variable: Stainless Sum of Source DF Squares Mean Square F Value Pr > F Model 33 52568.53652 1592.98596 417.67 <.0001 Error 2516 9595.99760 3.81399 Corrected Total 2549 62164.53412 R-Square Coeff Var Root MSE Stainless Mean 0.845635 12.85727 1.952944 15.18941 Source DF SS Mean Square F Value Pr > F Particle_size 6 3182.27183 530.37864 139.06 <.0001 Moisture 4 46157.07183 11539.26796 3025.51 <.0001 Particle_si*Moisture 23 3229.19286 140.39969 36.81 <.0001
Table B.9-2: ANOVA result of particle size and moisture effect on angle of wall friction of
fractionated ground loblolly pine using mild steel
The GLM Procedure
Dependent Variable: Mildsteel Sum of Source DF Squares Mean Square F Value Pr > F Model 33 30789.45774 933.01387 350.22 <.0001 Error 2516 6702.77707 2.66406 Corrected Total 2549 37492.23481 R-Square Coeff Var Root MSE Mildsteel Mean 0.821222 10.70273 1.632195 15.25027 Source DF SS Mean Square F Value Pr > F Particle_size 6 532.79849 88.79975 33.33 <.0001 Moisture 4 28973.33199 7243.33300 2718.91 <.0001 Particle_si*Moisture 23 1283.32725 55.79684 20.94 <.0001

118
Table B.9-3: ANOVA result of particle size and moisture effect on angle of wall friction of
fractionated ground loblolly pine using Tivar 88 surface
The GLM Procedure
Dependent Variable: TIVAR Sum of Source DF Squares Mean Square F Value Pr > F Model 33 4169.265400 126.341376 57.05 <.0001 Error 2516 5572.281067 2.214738 Corrected Total 2549 9741.546467 R-Square Coeff Var Root MSE TIVAR Mean 0.427988 11.65509 1.488200 12.76867 Source DF SS Mean Square F Value Pr > F Particle_size 6 3206.808280 534.468047 241.32 <.0001 Moisture 4 260.570614 65.142653 29.41 <.0001 Particle_si*Moisture 23 701.886506 30.516805 13.78 <.0001
Table B.10: ANOVA result of particle size effect on volatile matter (% db) of fractionated
ground loblolly pine
The GLM Procedure
Dependent Variable: matter Sum of Source DF Squares Mean Square F Value Pr > F Model 5 17.57471921 3.51494384 1.24 0.3502 Error 12 34.04084058 2.83673671 Corrected Total 17 51.61555979 R-Square Coeff Var Root MSE matter Mean 0.340493 1.964800 1.684261 85.72176 Source DF SS Mean Square F Value Pr > F size 5 17.57471921 3.51494384 1.24 0.3502

119
Table B.11: ANOVA result of particle size effect on energy content of fractionated ground
loblolly pine
The GLM Procedure Dependent Variable: energy_content Sum of Source DF Squares Mean Square F Value Pr > F Model 5 1.08365667 0.21673133 1.28 0.3361 Error 12 2.03869333 0.16989111 Corrected Total 17 3.12235000 R-Square Coeff Var Root MSE Mean 0.347064 2.214783 0.412178 18.61033 Source DF SS Mean Square F Value Pr > F sample 5 1.08365667 0.21673133 1.28 0.3361
Table B.12: ANOVA result of particle size effect on ash content (% db) of fractionated
ground loblolly pine
The GLM Procedure Dependent Variable: content Sum of Source DF Squares Mean Square F Value Pr > F Model 5 12.55626822 2.51125364 286.03 <.0001 Error 12 0.10535626 0.00877969 Corrected Total 17 12.66162447 R-Square Coeff Var Root MSE content Mean 0.991679 10.83524 0.093700 0.864771 Source DF Type I SS Mean Square F Value Pr > F size 5 12.55626822 2.51125364 286.03 <.0001

120
Table B.13: Effect of wall surface on angle of wall friction at 4.78% moisture level.
Screen
size (mm)
Type of Wall Materials
Stainless steel Mild steel Tivar 88
0.05 12.30[b] ± 1.28 12.33[b] ±1.10 14.80[a] ±1.71
0.25 9.83[c] ± 0.52 10.48[b] ± 0.45 13.61[a] ± 1.09
0.50 9.45[c] ± 0.50 10.50[b] ± 0.39 12.48[a] ±0.87
0.71 9.39[c] ± 0.49 10.54[b] ± 0.35 12.10[a] ± 0.98
1.00 9.49[c] ± 0.50 10.81[b] ± 0.36 11.59[a] ± 0.87
1.40 8.96[b] ± 0.38 10.76[a] ± 0.31 10.88[a] ± 0.96
Raw 9.53[c] ± 0.53 10.55[b] ± 0.37 11.75[a] ± 0.90
Superscripts shows comparison of means using Tukey test at α< 0.05 significant level
Values across the row with the same letter are not significantly different
Table B.14: Effect of wall surface on angle of wall friction at 8.69%moisture level.
Screen
size (mm)
Type of Wall Materials
Stainless steel Mild steel Tivar 88
0.05 14.9[b] ± 2.05 16.10[a] ± 2.63 15.54[a,b] ±2.25
0.25 12.39[b] ± 1.27 13.11[a] ± 1.21 13.48[a] ±1.31
0.50 11.24[c] ± 0.90 12.09[b] ± 0.72 12.87[a] ± 1.07
0.71 12.72[a] ± 1.48 12.17[b] ± 0.71 12.32[a,b] ± 1.03
1.00 11.44[b] ± 1.00 12.43[a] ± 0.76 11.72[b] ± 0.97
1.40 10.82[c] ± 0.97 12.38[a] ± 0.59 11.47[b] ± 1.15
Raw 10.92[c] ± 1.27 12.16[b] ± 0.92 14.07[a] ± 1.35
Superscripts shows comparison of means using Tukey test at α< 0.05 significant level
Values across the row with the same letter are not significantly different

121
Table B.15: Effect of wall surface on angle of wall friction at 16.53%moisture level.
Screen
size (mm)
Type of Wall Materials
Stainless steel Mild steel Tivar 88
0.05 17.14[a] ± 2.75 15.22[b] ± 1.72 14.52[b] ±1.79
0.25 14.00[a] ± 1.54 14.29[a] ± 1.32 13.14[b] ± 1.28
0.50 13.79[b] ± 1.43 15.07[a] ± 1.36 12.83[c] ± 1.12
0.71 14.22[b] ± 1.47 15.31[a] ± 1.34 12.01[c] ± 1.05
1.00 14.40[b] ± 1.38 15.01[a] ± 1.34 11.24[c] ± 0.99
1.40 14.18[a] ± 1.31 14.22[a] ± 1.14 11.61[b] ± 1.02
Raw 16.23[c] ± 2.21 14.53[b] ± 1.30 12.17[a] ± 1.30
Superscripts shows comparison of means using Tukey test at α< 0.05 significant level
Values across the row with the same letter are not significantly different
Table B.16: Effect of wall surface on angle of wall friction at 22.21% moisture level.
Screen
size (mm)
Type of Wall Materials
Stainless steel Mild steel Tivar 88
0.05 26.49[a] ± 4.61 21.38[b] ± 3.15 15.50[c] ± 2.64
0.25 19.50[a] ± 2.64 18.12[b] ± 2.08 13.33[c] ± 1.70
0.50 17.60[a] ± 1.96 18.18[a] ± 1.70 12.36[b] ± 1.35
0.71 16.72[b] ± 1.73 17.42[a] ± 1.58 12.02[c] ± 1.58
1.00 17.35[a] ± 1.83 17.99[a] ± 1.53 12.81[b] ± 1.89
1.40 16.52[b] ± 1.65 18.00[a] ± 1.42 12.44[c] ± 1.74
Raw 18.13[b] ± 1.85 19.04[a] ± 1.77 14.45[c] ± 2.28
Superscripts shows comparison of means using Tukey test at α< 0.05 significant level
Values across the row with the same letter are not significantly different

122
Table B.17: Effect of wall surface on angle of wall friction at 25.53% moisture level.
Screen
size (mm)
Type of Wall Materials
Stainless steel Mild steel Tivar 88
0.25 24.80[a] ± 3.96 22.56[b] ± 3.42 15.23[c] ± 2.46
0.50 21.62[a] ± 2.80 19.52[b] ± 2.55 13.06[c] ± 1.64
0.71 20.98[a] ± 2.58 19.73[b] ± 2.28 11.76[c] ± 1.47
1.00 20.06[a] ± 2.51 18.87[b] ± 2.18 11.46[c] ± 1.40
1.40 18.76[a] ± 2.05 18.30[a] ± 1.90 10.98[b] ± 1.32
Raw 20.56[a] ± 2.54 19.39[b] ± 2.29 12.55[c] ± 1.58
Superscripts shows comparison of means using Tukey test at α< 0.05 significant level
Values across the row with the same letter are not significantly different

123
Appendix B: SAS codes for statistical analysis
/*Importing files for physical properties*/
proc import datafile = 'C:\Users\ojo0002\Dropbox\Final_arrangement.xlsx'
out = properties DBMS=EXCEL Replace;
Getnames= yes;
SCANTEXT=YES;
USEDATE=YES;
SCANTIME=YES;
Range = 'physical$A1:H103';
Run;
/*ANOVA test on physical properties using GLM*/
proc glm data = properties;
class ps mc;
model PD BD TD Compressibility HR Porosity= ps mc ps*mc;
means ps mc ps*mc/tukey;
run;
/*ANOVA test of particle size effect on physical properties using GLM*/
proc glm data = properties;
class ps mc;
model PD BD TD Compressibility HR Porosity= ps;
means ps/tukey;
by mc;
run;
/*Data sorting for effect of Moisture content on physical properties*/
proc sort data = properties
Out = sortedproperties;
by ps;
run;
/*ANOVA test of moisture content effect on physical properties using GLM*/
proc glm data = sortedproperties;
class ps mc;
model PD BD TD Compressibility HR Porosity= mc;
means mc/tukey;
by ps;
run;
/*Analysis for internal friction and cohesion*/
proc import datafile = 'C:\Users\ojo0002\Dropbox\Final_arrangement.xlsx'
out = cohesion DBMS=EXCEL Replace;
Getnames= yes;
SCANTEXT=YES;
USEDATE=YES;
SCANTIME=YES;
Range = 'Angleofinternalfriction$A1:d511';
Run;
/*General ANOVA test on internal friction and cohesion*/
proc glm data = cohesion;
class Particle_size Moisture;
model internal_friction Cohesion = Particle_size|Moisture;

124
means Particle_size|Moisture/tukey;
run;
/*Effect of particle size on internal friction and cohesion*/
proc glm data = cohesion;
class Particle_size Moisture;
model internal_friction Cohesion = Particle_size;
means Particle_size/tukey;
by moisture;
run;
/*Sorting data for effect of moisture content*/
proc sort data = cohesion
Out = sortedcohesion;
by Particle_size;
run;
/*Effect of moisture content on internal friction and cohesion*/
proc glm data = sortedcohesion;
class Particle_size Moisture;
model internal_friction Cohesion = Moisture;
means moisture/tukey;
by Particle_size;
run;
/*Analysis for wall friction*/
proc import datafile = 'C:\Users\ojo0002\Dropbox\Final_arrangement.xlsx'
out = WF DBMS=EXCEL Replace;
Getnames= yes;
SCANTEXT=YES;
USEDATE=YES;
SCANTIME=YES;
Range = 'Angleofwallfriction$A1:e2551';
Run;
/*General ANOVA test on angle of wall friction*/
proc glm data = WF;
class Particle_size Moisture;
model Stainless Mildsteel TIVAR =Particle_size|Moisture;
means Particle_size|Moisture/tukey;
run;
/*Effect of particle size on angle of wall friction*/
proc glm data = WF;
class Particle_size Moisture;
model Stainless Mildsteel TIVAR =Particle_size;
means Particle_size/tukey;
by Moisture;
run;
/*Sorting data for effect of moisture content on wall friction*/
proc sort data = WF
Out = sortedWF;
by Particle_size;
run;
proc print data = sortedWF;run;
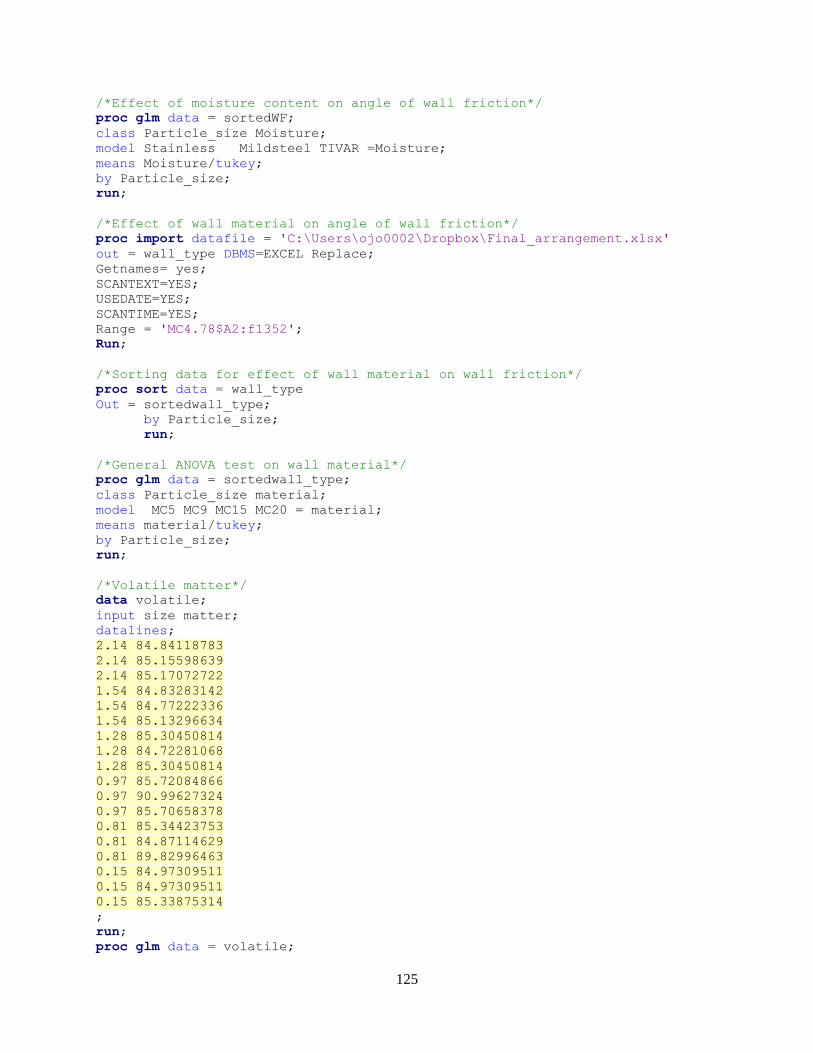
125
/*Effect of moisture content on angle of wall friction*/
proc glm data = sortedWF;
class Particle_size Moisture;
model Stainless Mildsteel TIVAR =Moisture;
means Moisture/tukey;
by Particle_size;
run;
/*Effect of wall material on angle of wall friction*/
proc import datafile = 'C:\Users\ojo0002\Dropbox\Final_arrangement.xlsx'
out = wall_type DBMS=EXCEL Replace;
Getnames= yes;
SCANTEXT=YES;
USEDATE=YES;
SCANTIME=YES;
Range = 'MC4.78$A2:f1352';
Run;
/*Sorting data for effect of wall material on wall friction*/
proc sort data = wall_type
Out = sortedwall_type;
by Particle_size;
run;
/*General ANOVA test on wall material*/
proc glm data = sortedwall_type;
class Particle_size material;
model MC5 MC9 MC15 MC20 = material;
means material/tukey;
by Particle_size;
run;
/*Volatile matter*/
data volatile;
input size matter;
datalines;
2.14 84.84118783
2.14 85.15598639
2.14 85.17072722
1.54 84.83283142
1.54 84.77222336
1.54 85.13296634
1.28 85.30450814
1.28 84.72281068
1.28 85.30450814
0.97 85.72084866
0.97 90.99627324
0.97 85.70658378
0.81 85.34423753
0.81 84.87114629
0.81 89.82996463
0.15 84.97309511
0.15 84.97309511
0.15 85.33875314
;
run;
proc glm data = volatile;

126
class size;
model matter = size;
means size/tukey;
run;
proc means data =volatile;
var matter;
class size;
run;
*Ash content of fraction;
data ash;
input size content;
datalines;
2.14 0.217727694
2.14 0.326916507
2.14 0.217080337
1.54 0.217944338
1.54 0.217511479
1.54 0.218596866
1.28 0.541742825
1.28 0.677109678
1.28 0.691328245
0.97 0.426178823
0.97 0.554948894
0.97 0.391909849
0.81 0.938467972
0.81 0.92103963
0.81 1.077430782
0.15 2.45407148
0.15 2.721530982
0.15 2.754333398
; run;
proc glm data = ash;
class size;
model content = size;
means size/tukey;
run;
proc means data =ash;
var content;
class size;
run;
/*Energy content*/
data energy;
input sample energy_content;
datalines;
1.40 18.101
1.40 18.514
1.40 18.618
1.00 18.614
1.00 18.623
1.00 18.798
0.71 18.532
0.71 18.663
0.71 18.710

127
0.50 18.802
0.50 17.149
0.50 18.816
0.25 18.639
0.25 18.559
0.25 18.710
0.24 19.019
0.24 19.081
0.24 19.038
;
run;
proc glm data = energy;
class sample;
model energy_content = sample;
means sample/tukey;
run;