Contribution of General Aviation to the US Economy in 2013 · Contribution of General Aviation to...
54
www.pwc.com/us/nes Contribution of General Aviation to the US Economy in 2013 Prepared for: Aircraft Electronics Association, Aircraft Owners and Pilots Association, Experimental Aircraft Association, General Aviation Manufacturers Association, Helicopter Association International, National Air Transportation Association, National Association of State Aviation Officials, and National Business Aviation Association Contribution of General Aviation to the US Economy in 2013 February 11, 2015
Transcript of Contribution of General Aviation to the US Economy in 2013 · Contribution of General Aviation to...
www.pwc.com/us/nes
Contribution of General Aviation to the US Economy in 2013
Prepared for:
Aircraft Electronics Association, Aircraft Owners and Pilots Association, Experimental Aircraft Association, General Aviation Manufacturers
Association, Helicopter Association International, National Air Transportation
Association, National Association of State Aviation
Officials, and National Business Aviation Association
Contribution of General Aviation to the US Economy in 2013 February 11, 2015

Contribution of General Aviation to the US Economy in 2013
This document has been prepared pursuant to an engagement between PricewaterhouseCoopers LLP and its Client. As to all other parties, it is for general information purposes only, and should not be used as a substitution for consultation with professional advisors.
Contribution of General Aviation to the US Economy in 2013
Table of Contents
Executive Summary E-1
I. Introduction 1
II. Industry Background 2
A. General Aviation Aircraft and Component Manufacturing 2
B. International Trade 4
C. General Aviation Operations 5
D. General Aviation Traveler Expenditures 8
III. Contribution of General Aviation to the US Economy 10
A. National Results 10
B. State-Level Results 13
Appendix A: Detailed State-Level Results 25
Appendix B: Data Sources and Methodology 41

Contribution of General Aviation to the US Economy in 2013
E-1
Contribution of General Aviation to the US Economy in 2013
Executive Summary PwC was engaged by the general aviation industry trade associations to quantify the contribution of general aviation to the US national and state economies.1
General aviation is defined as the manufacture and operation of any type of aircraft that has been issued an airworthiness certificate by the FAA, other than aircraft used for scheduled commercial air service or operated by the military.2 For this study, the general aviation industry is defined to include aircraft and component manufacturing, flight operations, maintenance, and other activities. The economic impact of the general aviation industry is measured in terms of employment, labor income, output, and value added for 2013, the most recent year for which a full, consistent set of national and state-level data are available.3
This report considers four types of economic impacts—direct, indirect, induced, and enabled—that in aggregate provide a measure of the total economic contribution of general aviation:
1. Direct impact is economic activity within the general aviation industry, 2. Indirect impact is economic activity occurring throughout the supply chain associated with
general aviation, 3. Induced impact is economic activity resulting from household spending of labor and
proprietor’s income earned directly or indirectly from general aviation-related activities, and 4. Enabled impact is economic activity resulting from the visitors’ destination expenditures
associated with general aviation flights. Nationwide 255,000 full- and part-time workers were directly employed in general aviation in 2013 (see Table E-1, below). Including indirect, induced, and enabled impacts, general aviation, in total, supported 1.1 million jobs and $219 billion in output. General aviation also generated $69 billion in labor income (including wages and salaries and benefits as well as proprietors’ income) and contributed $109 billion to US gross domestic product (GDP). Overall, total GDP impact attributable to general aviation amounted to $346 per person in the United States in 2013. At the national level, each direct job in the general aviation industry supported 3.3 jobs elsewhere in the economy.
The economic impact of general aviation reaches all 50 states and the District of Columbia. At 139,000 jobs, California has the largest number of jobs directly or indirectly attributable to the general aviation industry. The top 10 states ranked by the total number of jobs attributable to general aviation (from the direct, indirect, induced, and enabled impacts) in 2013 were California, Texas, Florida, Georgia, Illinois, Kansas, Arizona, Ohio, New York, and Washington (Table E-2, below). Combined, these 10 states accounted for 54 percent of the total jobs attributable to general aviation in the US in 2013. 1 The general aviation industry trade associations include: Aircraft Electronics Association (AEA), Aircraft Owners and Pilots Association (AOPA), Experimental Aircraft Association (EAA), General Aviation Manufacturers Association (GAMA), Helicopter Association International (HAI), National Air Transportation Association (NATA), National Association of State Aviation Officials (NASAO), and National Business Aviation Association (NBAA). 2 This definition includes on-demand Federal Aviation Regulations (FAR) Part 135 operations. 3 US gross domestic product (“GDP”) is the sum of value added in all industries. Value added consists of: employee compensation, proprietors' income, income to capital owners from property, and taxes on production and imports. Throughout this report, we refer to value added as contribution to GDP. By comparison, output represents the total value of sales, including the cost of intermediate goods. Value added excludes the value of intermediate inputs.

Contribution of General Aviation to the US Economy in 2013
E-2
Table E-1. – Total Economic Impact of General Aviation on the US Economy, 2013 [Dollar Amounts in Billions]
Item Direct Indirect
and Induced
Enabled Total Percent of
US Economy
Employment (Jobs)(1) 255,000 736,500 110,300 1,101,800 0.60%
Labor Income(2) $22.7 $41.9 $4.5 $69.1 0.68%
Output $75.2 $130.1 $13.3 $218.6 0.75%
Contribution to GDP $29.5 $72.1 $7.6 $109.3 0.65%
Source: PwC calculations using the IMPLAN modeling system. (1) Employment is defined as the number of payroll and self-employed jobs, including part-time jobs. (2) Labor income is defined as wages and salaries and benefits as well as proprietors’ income.
Table E-2. – Total Impact of General Aviation, Top 10 States, 2013 [Ranked by Total Employment Impact, Dollar Amounts in Billions]
State Total Jobs(1) Total Labor Income(2)
Total Output Total
Contribution to GDP
California 139,100 $10.3 $30.2 $16.2
Texas 88,300 $6.0 $21.6 $10.3
Florida 77,600 $4.3 $12.3 $6.7
Georgia 51,300 $3.4 $13.7 $4.9
Illinois 42,400 $3.0 $9.1 $4.8
Kansas 42,300 $2.8 $8.3 $3.7
Arizona 41,200 $2.6 $7.9 $3.8
Ohio 39,200 $2.3 $7.1 $3.4
New York 37,800 $2.9 $7.1 $4.5
Washington 30,400 $2.2 $6.6 $3.6 Source: PwC calculations using the IMPLAN modeling system. (1) Employment is defined as the number of payroll and self-employed jobs, including part-time jobs. (2) Labor income is defined as wages and salaries and benefits as well as proprietors’ income.
The total (direct, indirect, induced, and enabled) contribution of general aviation to output is largest in California at $30.2 billion. The top 10 states ranked by total output attributable to general aviation in 2013 were California, Texas, Georgia, Florida, Illinois, Kansas, Arizona, Connecticut, Ohio, and New York (Table E-3, below). These 10 states accounted for 57 percent of the total output attributable to general aviation in the US in 2013.

Contribution of General Aviation to the US Economy in 2013
E-3
Table E-3. – Total Impact of General Aviation, Top 10 States, 2013 [Ranked by Total Output Impact, Dollar Amounts in Billions]
State Total Jobs(1) Total Labor
Income(2) Total Output
Total Contribution
to GDP
California 139,100 $10.3 $30.2 $16.2
Texas 88,300 $6.0 $21.6 $10.3
Georgia 51,300 $3.4 $13.7 $4.9
Florida 77,600 $4.3 $12.3 $6.7
Illinois 42,400 $3.0 $9.1 $4.8
Kansas 42,300 $2.8 $8.3 $3.7
Arizona 41,200 $2.6 $7.9 $3.8
Connecticut 30,300 $2.6 $7.5 $3.8
Ohio 39,200 $2.3 $7.1 $3.4
New York 37,800 $2.9 $7.1 $4.5 Source: PwC calculations using the IMPLAN modeling system. (1) Employment is defined as the number of payroll and self-employed jobs, including part-time jobs. (2) Labor income is defined as wages and salaries and benefits as well as proprietors’ income.
The total (direct, indirect, induced, and enabled) contribution of general aviation to GDP is largest in California at $16.2 billion. The top 10 states ranked by total GDP attributable to general aviation in 2013 were California, Texas, Florida, Georgia, Illinois, New York, Arizona, Connecticut, Kansas, and Washington (Table E-4, below). These 10 states accounted for 57 percent of the total GDP attributable to general aviation in the US in 2013.
Table E-4. – Total Impact of General Aviation, Top 10 States, 2013 [Ranked by Total GDP Impact, Dollar Amounts in Billions]
State Total Jobs(1) Total Labor
Income(2) Total Output
Total Contribution
to GDP
California 139,100 $10.3 $30.2 $16.2
Texas 88,300 $6.0 $21.6 $10.3
Florida 77,600 $4.3 $12.3 $6.7
Georgia 51,300 $3.4 $13.7 $4.9
Illinois 42,400 $3.0 $9.1 $4.8
New York 37,800 $2.9 $7.1 $4.5
Arizona 41,200 $2.6 $7.9 $3.8
Connecticut 30,300 $2.6 $7.5 $3.8
Kansas 42,300 $2.8 $8.3 $3.7
Washington 30,400 $2.2 $6.6 $3.6 Source: PwC calculations using the IMPLAN modeling system. (1) Employment is defined as the number of payroll and self-employed jobs, including part-time jobs. (2) Labor income is defined as wages and salaries and benefits as well as proprietors’ income.
The top 10 states ranked by total general aviation output impact per capita are: Kansas, Connecticut, Alaska, Georgia, Arizona, North Dakota, Vermont, Iowa, Wyoming, and Arkansas (see Table E-5).

Contribution of General Aviation to the US Economy in 2013
E-4
Table E-5. – Top 10 States, Ranked by Total Output Impact Per Capita, 2013
State Total Output Impact
($ Billions)
Per Capita Output Impact
($)
Kansas $8.3 $2,881
Connecticut $7.5 $2,080
Alaska $1.1 $1,524
Georgia $13.7 $1,374
Arizona $7.9 $1,191
North Dakota $0.9 $1,183
Vermont $0.7 $1,171
Iowa $3.1 $998
Wyoming $0.6 $992
Arkansas $2.9 $989
Source: PwC calculations using the IMPLAN modeling system and data from the US Census Bureau.
The top 10 states ranked by total general aviation GDP impact per capita are: Kansas, Connecticut, Alaska, Arizona, North Dakota, Washington, Vermont, Georgia, Minnesota, and Oregon (see Table E-6).4
Table E-6. – Top 10 States, Ranked by Total GDP Impact Per Capita, 2013
State Total Contribution to
GDP ($ Billions)
Per Capita Contribution to GDP
($)
Kansas $3.7 $1,287
Connecticut $3.8 $1,046
Alaska $0.7 $915
Arizona $3.8 $578
North Dakota $0.4 $547
Washington $3.6 $511
Vermont $0.3 $495
Georgia $4.9 $489
Minnesota $2.6 $479
Oregon $1.8 $471 Source: PwC calculations using the IMPLAN modeling system and data from the US Census Bureau.
4 See Table 11a and Table 11b in the text for full state-level results.

Contribution of General Aviation to the US Economy in 2013
1
Contribution of General Aviation to the US Economy in 2013
I. Introduction
PwC was engaged by the general aviation industry trade associations to quantify the contribution of general aviation to the US national and state economies.5
General aviation is defined as the manufacture and operation of any type of aircraft that has been issued an airworthiness certificate by the FAA, other than aircraft used for scheduled commercial air service or operated by the military.6 For the study, the general aviation industry is defined to include aircraft and component manufacturing, flight operations, maintenance, and other activities. The economic impact of the general aviation industry is measured in terms of employment, labor income, output, and value added for 2013, the most recent year for which a full, consistent set of national and state-level data are available.7
This report considers four types of economic impacts—direct, indirect, induced, and enabled—that in aggregate provide a measure of the total economic contribution of general aviation:
1. Direct impact is economic activity within the general aviation industry, 2. Indirect impact is economic activity occurring throughout the supply chain associated with
general aviation, 3. Induced impact is economic activity resulting from household spending of labor and
proprietor’s income earned directly or indirectly from general aviation related activities, and 4. Enabled impact is economic activity resulting from the visitors’ destination expenditures
associated with general aviation flights.
This report is organized as follows. Section II provides background information on general aviation in the US, including statistics on general aviation aircraft manufacturing and operations. Section III presents estimates of general aviation’s total economic impacts at the national and state levels in 2013. A summary by state is presented in Appendix A. A description of the data sources and methodology is included in Appendix B.
5 The general aviation trade associations include: Aircraft Electronics Association (AEA), Aircraft Owners and Pilots Association (AOPA), Experimental Aircraft Association (EAA), General Aviation Manufacturers Association (GAMA), Helicopter Association International (HAI), National Air Transportation Association (NATA), National Association of State Aviation Officials (NASAO), and National Business Aviation Association (NBAA). 6 This definition includes on-demand Federal Aviation Regulations (FAR) Part 135 operations. 7 US gross domestic product (“GDP”) is the sum of value added in all industries. Value added consists of: employee compensation, proprietors' income, income to capital owners from property, and taxes on production and imports. Throughout this report, we refer to value added as contribution to GDP. By comparison, output represents the total value of sales, including the cost of intermediate inputs. Value added excludes the value of intermediate inputs.

Contribution of General Aviation to the US Economy in 2013
2
II. Industry Background
General aviation includes the manufacture and operation of any type of aircraft that has been issued an airworthiness certificate by the FAA, other than aircraft used for scheduled commercial air service or operated by the military. General aviation includes personal-use aircraft, business aircraft, helicopters, aircraft operated by flight schools, and on-demand passenger or cargo transportation under Federal Aviation Regulation Part 135.8
In 2013, nearly 200,000 general aviation aircraft logged 22.9 million flight hours in the United States. The general aviation fleet ranges from small, amateur-built aircraft to large business jets and includes fixed-wing piston and turboprop airplanes, jet-powered airplanes, helicopters, gliders, and hot-air balloons. General aviation aircraft may be wholly-owned, jointly-owned, rented, chartered, or leased. General aviation covers everything from the use of personal aircraft by recreational pilots to business-owned aircraft used to transport people and/or cargo for business purposes. General aviation operations include air tours and sight-seeing flights as well as specialized activities such as air medical services, aerial applications in agriculture, forestry, and other industries, and flight training.
The economic impact of the general aviation industry includes: aircraft and component manufacturing, flight operations and maintenance, and destination visitor expenditures enabled by general aviation flights.
A. General Aviation Aircraft and Component Manufacturing General aviation aircraft can be grouped into five categories: (1) piston-powered airplanes, (2) turboprop airplanes, (3) jet-powered airplanes, (4) rotorcraft (i.e., helicopters), and (5) experimental and other aircraft.9 Experimental aircraft may have piston or turbine engines, but are usually piston-powered, and include home-built or kit aircraft flown by aviation enthusiasts, light-sport aircraft primarily flown for personal recreation, and certain vintage aircraft and rebuilt military aircraft flown for aerial exhibitions. Other aircraft includes gliders and lighter-than-air aircraft (i.e., hot air balloons).
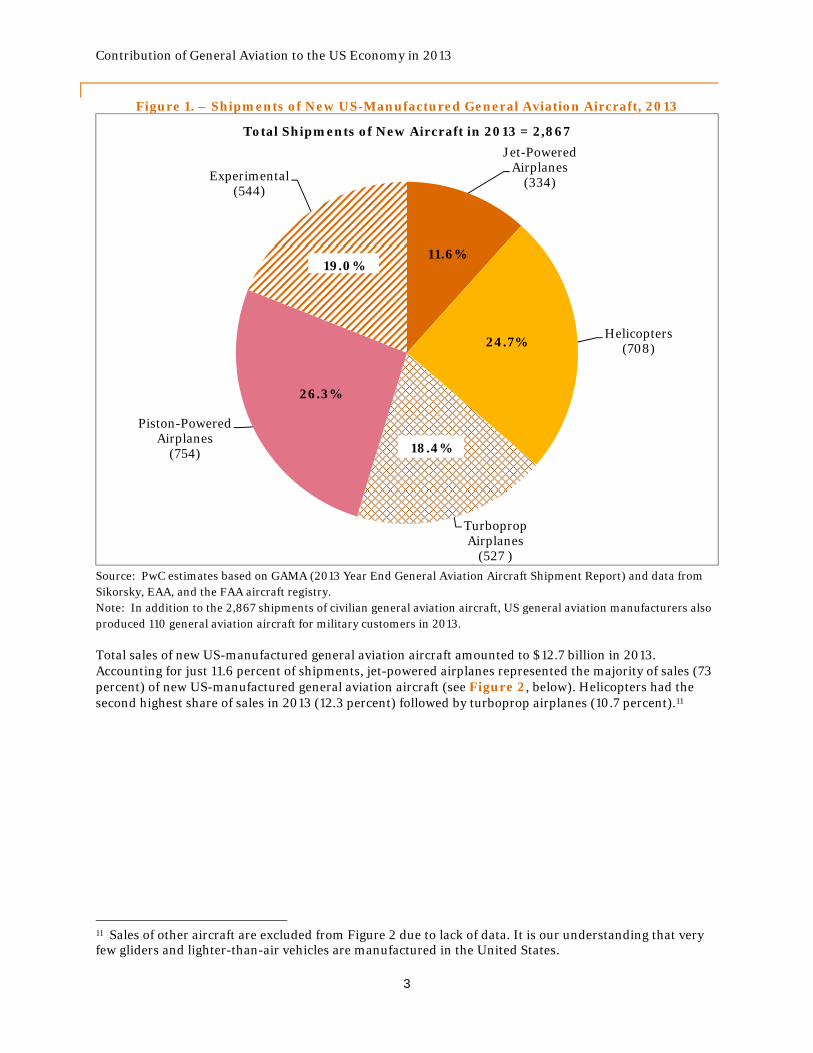
Nearly 2,900 US manufactured general aviation aircraft were shipped in 2013. Piston-powered aircraft accounted for 26 percent of all shipments of general aviation aircraft, followed by helicopters which accounted for 25 percent of all shipments (see Figure 1, below).10
8 FAR Part 135 covers the operators that provide air transportation of persons or property for compensation or hire and generally includes commuter airlines and on-demand air transportation service. The latter operates without a set schedule and thus qualifies as general aviation under the definition used for this study. 9 In accordance with industry norms, the term “aircraft” refers to any vehicle that is intended to be used for flight in the air, including: airplanes, helicopters, gliders, balloons, etc. Aircraft does not include ultralight vehicles which do not have an airworthiness certificate. The term “airplane” refers to fixed-wing aircraft, while rotorcraft refers to rotary-wing aircraft (i.e., helicopters). 10 Due to the lack of data on shipments of US manufactured gliders and hot-air balloons, such aircraft are excluded from Figure 1.
Contribution of General Aviation to the US Economy in 2013
3
Figure 1. – Shipments of New US-Manufactured General Aviation Aircraft, 2013
Source: PwC estimates based on GAMA (2013 Year End General Aviation Aircraft Shipment Report) and data from Sikorsky, EAA, and the FAA aircraft registry. Note: In addition to the 2,867 shipments of civilian general aviation aircraft, US general aviation manufacturers also produced 110 general aviation aircraft for military customers in 2013.
Total sales of new US-manufactured general aviation aircraft amounted to $12.7 billion in 2013. Accounting for just 11.6 percent of shipments, jet-powered airplanes represented the majority of sales (73 percent) of new US-manufactured general aviation aircraft (see Figure 2, below). Helicopters had the second highest share of sales in 2013 (12.3 percent) followed by turboprop airplanes (10.7 percent).11
11 Sales of other aircraft are excluded from Figure 2 due to lack of data. It is our understanding that very few gliders and lighter-than-air vehicles are manufactured in the United States.
Jet-Powered Airplanes
(334)
Helicopters(708)
Turboprop Airplanes
(527 )
Piston-Powered Airplanes
(754)
Experimental (544)
Total Shipments of New Aircraft in 2013 = 2,867
19.0%11.6%
24.7%
18.4%
26.3%

Contribution of General Aviation to the US Economy in 2013
4
Figure 2. – Sales of New US-Manufactured General Aviation Aircraft, 2013
Source: PwC estimates based GAMA (2013 Year End General Aviation Aircraft Shipment Report) and data from Sikorsky and Dun & Bradstreet. Detail may not add up to the total due to rounding.
In addition to the manufacture of new aircraft, US manufacturers also produce a variety of parts and components for use in the manufacture, repair, and upkeep of general aviation aircraft around the world, including aircraft engines and engine components, aircraft assemblies and subassemblies, aircraft parts (such as propellers, wheels, tires, brakes, aircraft interiors, and lighting), and avionics and other electrical components. Aircraft component manufacturers produce parts for both new aircraft and for use in repairing and refurbishing existing aircraft. PwC estimates that total sales of US-manufactured general aviation aircraft components for both new and existing aircraft were approximately $30 billion in 2013.
B. International Trade International trade plays an important role in the US civil aviation manufacturing industry (which includes both commercial and general aviation). Exports of commercial and general aviation aircraft, engines, and parts reached $105 billion in 2013.12 Overall, the US civil aircraft manufacturing industry (including aircraft components) continues to be a net exporter. According to the US Census Bureau, the US had a favorable balance of trade in civil aircraft, engines, and parts; with exports exceeding imports by $58 billion in 2013.
12 The Census Bureau trade data on aircraft and parts does not separately identify commercial and general aviation exports. However, data published by AIA indicate that 80 percent of the sales of US-manufactured civil aircraft are accounted for by commercial aircraft. This implies that exports of general aviation aircraft and parts were approximately $21 billion (20 percent of $105 billion) in 2013.
Jet-Powered Airplanes ($9.3B)
Helicopters($1.6B)
Turboprop Airplanes ($1.4B)
Piston-Powered Airplanes ($0.5B)
Experimental 0.6% ($0.1B )
Total Sales of New Aircraft in 2013 = $12.7 Billion
72.8%
12.3%
10.7%
3.6%

Contribution of General Aviation to the US Economy in 2013
5
Table 1. – Balance of Trade: Civil Aircraft, Engines, Equipment, and Parts, 2004-2013 [Dollars Amounts in Billions]
Year Exports Imports Balance
2004 $46.1 $24.3 $21.8
2005 $55.9 $25.8 $30.1
2006 $64.5 $28.4 $36.1
2007 $73.0 $34.4 $38.6
2008 $74.0 $35.4 $38.6
2009 $74.8 $30.6 $44.1
2010 $71.9 $31.3 $40.6
2011 $80.4 $35.5 $44.8
2012 $94.3 $40.1 $54.2
2013 $105.0 $46.9 $58.1
Source: US Census Bureau, Country and Product Trade Data, End-Use Tables (downloaded November 21, 2014).
C. General Aviation Operations The FAA estimates that there were 199,926 active aircraft in the US general aviation fleet, including on-demand FAR Part 135 aircraft, in 2013.13 Single-engine piston airplanes made up the majority of the US fleet, accounting for 62 percent of active general aviation aircraft while twin-engine piston airplanes accounted for an additional 7 percent of the US fleet (See Figure 3, below). Experimental aircraft, including special light-sport aircraft, accounted for 13.5 percent of the US fleet. Jet-powered airplanes accounted for just 5.8 percent of the US general aviation fleet in 2013.
Overall, the US general aviation fleet logged 22.9 million flight hours in 2013 (see Figure 4, below). Single-engine piston airplanes accounted for 47 percent of all flight hours in 2013 (10.7 million hours), followed by jet-powered airplanes (15 percent) and helicopters (13 percent).
13 There were 265,989 registered general aviation aircraft in the US in 2013.

Contribution of General Aviation to the US Economy in 2013
6
Figure 3. – US General Aviation Fleet Size by Type of Aircraft, 2013
Figure 4. –US General Aviation Flight Hours by Type of Aircraft, 2013
[Thousands of Hours]
124,399
13,255 9,619 11,636 9,766
26,973
4,278
0
20,000
40,000
60,000
80,000
100,000
120,000
Single-enginepiston
airplanes
Twin-enginepiston
airplanes
Turbopropairplanes
Jet-poweredairplanes
Helicopters Experimentalaircraft*
Otheraircraft**
Source: FAA, General Aviation and Part 135 Activity Survey, 2013 (December 2014). *Includes special light-sport aircraft. **Includes gliders and lighter-than-air.
10,706
1,646
2,587
3,488 2,949
1,364
135 0
2,000
4,000
6,000
8,000
10,000
12,000
Single-enginepiston
airplanes
Twin-enginepiston
airplanes
Turbopropairplanes
Jet-poweredairplanes
Helicopters Experimentalaircraft*
Otheraircraft**
Source: FAA, General Aviation and Part 135 Activity Survey, 2013 (December 2014). *Includes special light-sport aircraft. **Includes gliders and lighter-than-air.

Contribution of General Aviation to the US Economy in 2013
7
The FAA classifies general aviation flights into 15 separate use types based on flight information reported by aircraft owners. To develop flight cost profiles, we combined these use types into four major categories14:
1. Personal: Operation of general aviation aircraft for personal/recreational reasons. The pilots of personal-use aircraft are typically the owner of the aircraft and it is assumed that owners tie-down their aircraft, rather than rent hangar space.15
2. Business without a paid professional crew: Operation of general aviation aircraft for business transportation without a paid, professional flight crew. Such aircraft are typically flown by the owner or operator of the aircraft who does not earn a salary. It is assumed that owners rent space in a shared hangar and pay a business insurance rate on the aircraft.
3. Business with a paid professional crew: Operation of general aviation aircraft for business transportation with a paid, professional flight crew. Owners of such aircraft are assumed to rent a hangar, pay a lower business insurance rate, and hire a professional pilot and flight crew. Air taxi and air medical services are assumed to have this cost profile.
4. Other: Operation of general aviation aircraft for all other purposes, including flight instruction, aerial application in agriculture and other industries, aerial observation, and sight-seeing. It is assumed that other-use aircraft operate with a paid pilot, but no other paid crew.
Personal-use aircraft accounts for the majority of flight hours for piston-powered and experimental aircraft (see Figure 5, below). Business-use with a paid crew accounts for the largest share of flight hours for turboprop and jet-powered airplanes. The “other-use” category accounts for the majority (61 percent) of flight hours for rotorcraft.16
14 See Appendix B for a detailed mapping of FAA use types to the four use categories reported in this study. 15 This assumption is conservative as many personal-use aircraft owners rent space in shared hangars. 16 Due to the lack of data on the operating costs of gliders and lighter-than-air, such aircraft are excluded from Figure 5 and our economic impact estimates. Gliders and lighter-than-air accounted for approximately 0.6 percent of total general aviation flight hours in 2013. Based on data from the Balloon Federation of America (BFA), PwC estimates that total operating costs for lighter-than-air were between $35 million and $50 million nationwide.

Contribution of General Aviation to the US Economy in 2013
8
Figure 5. –General Aviation Flight Hours by Type of Aircraft and Reason for Use, 2013
There are over 4,000 paved airports in the United States that service general aviation flights, compared to just over 550 airports that service scheduled commercial air transportation. When other types of landing facilities, such as heliports, seaplane bases, and other facilities, are included, there are more than 19,000 landing facilities in the United States that service general aviation aircraft.
D. General Aviation Traveler Expenditures It is estimated that 166 million passengers travel on general aviation flights each year in the US. These passengers purchase goods and services in the destination cities. For example, a business traveler on a business aircraft may incur expenses for a hotel room, local meals, and even souvenirs. These travel expenditures provide additional economic benefits to the communities served by general aviation.
PwC estimates that overnight passengers on general aviation aircraft spent $1.9 billion on meals and $3.6 billion on lodging in 2013 (see Table 2, below). These estimates do not include spending by general aviation travelers on souvenirs, snacks, and other miscellaneous items.17
17 For a complete description of the methodology used to estimate travel spending see Appendix B.
45%
8% 8% 3%
73%64%
11%
7% 4%
2%
3%
1%7%
42%
76%
35%
5%37%
43%
12%
61%
19%
35%
0%
10%
20%
30%
40%
50%
60%
70%
80%
90%
100%
Pistonairplanes
Turbopropairplanes
Jet-poweredairplanes
Helicopters Experimental Other
Personal Business without paid crew Business with paid crew Other
Source: FAA, General Aviation and Part 135 Activity Survey, 2013 (December 2014).*Includes aircraft used for business travel with or without a paid crew. **Includes flight instruction and all other purposes.

Contribution of General Aviation to the US Economy in 2013
9
Table 2. – Estimated Destination Expenditures Enabled by General Aviation Flights, 2013
Type of Expenditure General Aviation Travel
Expenditures ($ billions)
Meals $1.9
Lodging $3.6
Total $5.5
Source: PwC estimates based on data from the FAA and per diem rates published by the General Services Administration and the Department of Defense.

Contribution of General Aviation to the US Economy in 2013
10
III. Contribution of General Aviation to the US Economy
This section presents estimates of the general aviation industry’s contribution to the US national and state economies in 2013, the most recent year for which a consistent set of data were available. The total contribution of the general aviation industry includes direct, indirect, induced, and enabled impacts:
1. Direct impact is economic activity within the general aviation industry, 2. Indirect impact is economic activity occurring throughout the supply chain associated with
general aviation, 3. Induced impact is economic activity resulting from household spending of labor and
proprietor’s income earned directly or indirectly from general aviation-related activities, and 4. Enabled impact is economic activity resulting from the visitors’ destination expenditures
associated with general aviation flights.
The estimates do not account for all of the economic impact of the general aviation industry due to data limitations.18
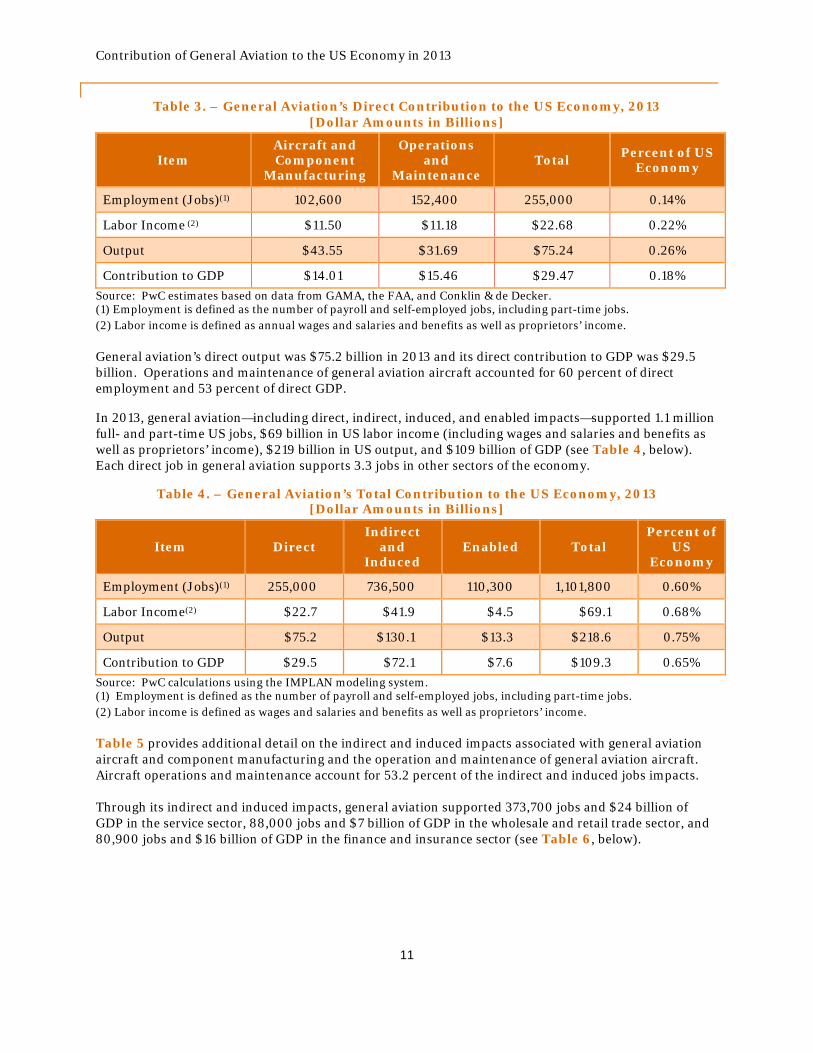
A. National Results Nationwide, 30,900 full- and part-time workers were employed in the manufacture of general aviation aircraft in 2013 (see Table 3, below). Another 71,700 workers were employed in the manufacture of components for general aviation aircraft, for a combined direct employment impact of 102,600 jobs. These workers earned $11.5 billion in labor income in 2013, an average of $112,000 per job.
In addition, another 152,400 workers were employed in jobs directly related to the operation and maintenance of general aviation aircraft, including jobs in flight training, nonscheduled air transportation, scenic and sightseeing, and support activities for air transportation (such as fixed base operators and other maintenance and repair facilities).19 These workers earned an average labor income per job of $73,400 in 2013.
18 The estimates do not include economic impacts associated with: (1) manufacture and operation of gliders and hot-air balloons, (2) payments to aircraft brokers and certain other sales transactions costs, (3) capital expenditures by general aviation aircraft manufacturers, and (4) expenditures for expansion and improvement of general aviation airports. 19 A fixed base operator is an airport-based business which parks, services, fuels and may repair aircraft; it often rents aircraft and may provide flight training.
Contribution of General Aviation to the US Economy in 2013
11
Table 3. – General Aviation’s Direct Contribution to the US Economy, 2013 [Dollar Amounts in Billions]
Item Aircraft and Component
Manufacturing
Operations and
Maintenance Total
Percent of US Economy
Employment (Jobs)(1) 102,600 152,400 255,000 0.14%
Labor Income (2) $11.50 $11.18 $22.68 0.22%
Output $43.55 $31.69 $75.24 0.26%
Contribution to GDP $14.01 $15.46 $29.47 0.18%
Source: PwC estimates based on data from GAMA, the FAA, and Conklin & de Decker. (1) Employment is defined as the number of payroll and self-employed jobs, including part-time jobs. (2) Labor income is defined as annual wages and salaries and benefits as well as proprietors’ income.
General aviation’s direct output was $75.2 billion in 2013 and its direct contribution to GDP was $29.5 billion. Operations and maintenance of general aviation aircraft accounted for 60 percent of direct employment and 53 percent of direct GDP.
In 2013, general aviation—including direct, indirect, induced, and enabled impacts—supported 1.1 million full- and part-time US jobs, $69 billion in US labor income (including wages and salaries and benefits as well as proprietors’ income), $219 billion in US output, and $109 billion of GDP (see Table 4, below). Each direct job in general aviation supports 3.3 jobs in other sectors of the economy.
Table 4. – General Aviation’s Total Contribution to the US Economy, 2013 [Dollar Amounts in Billions]
Item Direct Indirect
and Induced
Enabled Total Percent of
US Economy
Employment (Jobs)(1) 255,000 736,500 110,300 1,101,800 0.60%
Labor Income(2) $22.7 $41.9 $4.5 $69.1 0.68%
Output $75.2 $130.1 $13.3 $218.6 0.75%
Contribution to GDP $29.5 $72.1 $7.6 $109.3 0.65%
Source: PwC calculations using the IMPLAN modeling system. (1) Employment is defined as the number of payroll and self-employed jobs, including part-time jobs. (2) Labor income is defined as wages and salaries and benefits as well as proprietors’ income.
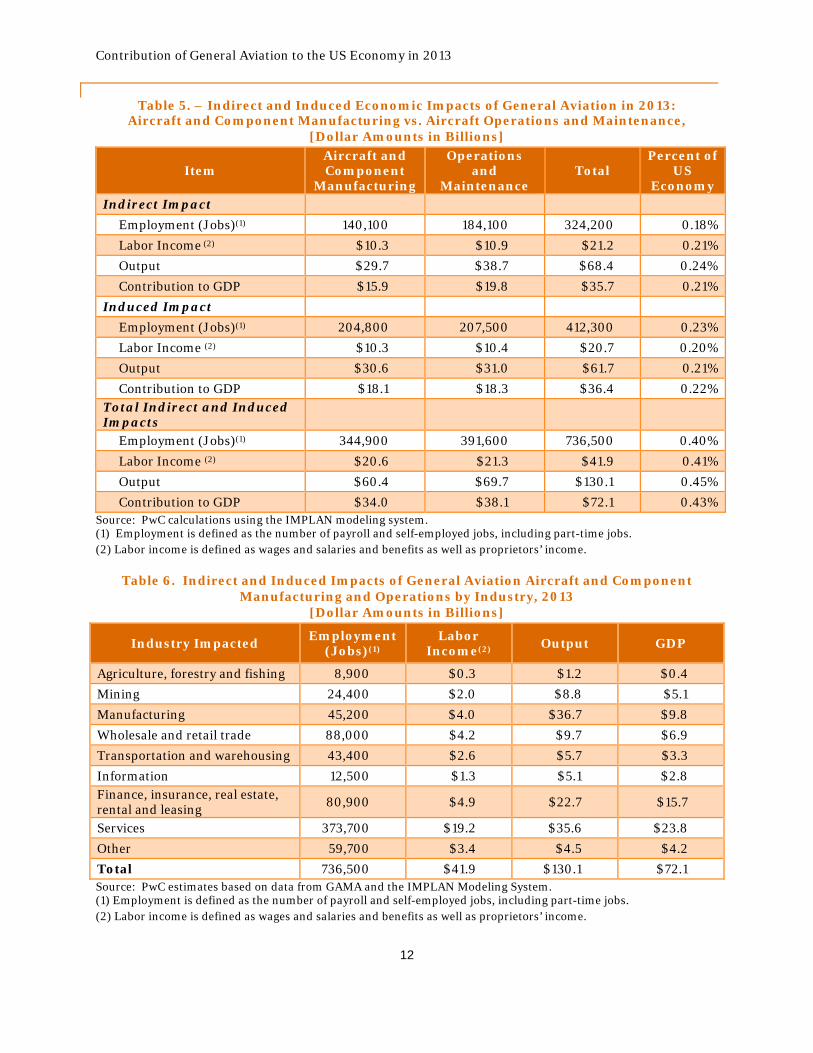
Table 5 provides additional detail on the indirect and induced impacts associated with general aviation aircraft and component manufacturing and the operation and maintenance of general aviation aircraft. Aircraft operations and maintenance account for 53.2 percent of the indirect and induced jobs impacts.
Through its indirect and induced impacts, general aviation supported 373,700 jobs and $24 billion of GDP in the service sector, 88,000 jobs and $7 billion of GDP in the wholesale and retail trade sector, and 80,900 jobs and $16 billion of GDP in the finance and insurance sector (see Table 6, below).
Contribution of General Aviation to the US Economy in 2013
12
Table 5. – Indirect and Induced Economic Impacts of General Aviation in 2013: Aircraft and Component Manufacturing vs. Aircraft Operations and Maintenance,
[Dollar Amounts in Billions]
Item Aircraft and Component
Manufacturing
Operations and
Maintenance Total
Percent of US
Economy Indirect Impact
Employment (Jobs)(1) 140,100 184,100 324,200 0.18%
Labor Income (2) $10.3 $10.9 $21.2 0.21%
Output $29.7 $38.7 $68.4 0.24%
Contribution to GDP $15.9 $19.8 $35.7 0.21%
Induced Impact
Employment (Jobs)(1) 204,800 207,500 412,300 0.23%
Labor Income (2) $10.3 $10.4 $20.7 0.20%
Output $30.6 $31.0 $61.7 0.21%
Contribution to GDP $18.1 $18.3 $36.4 0.22% Total Indirect and Induced Impacts
Employment (Jobs)(1) 344,900 391,600 736,500 0.40%
Labor Income (2) $20.6 $21.3 $41.9 0.41%
Output $60.4 $69.7 $130.1 0.45%
Contribution to GDP $34.0 $38.1 $72.1 0.43% Source: PwC calculations using the IMPLAN modeling system. (1) Employment is defined as the number of payroll and self-employed jobs, including part-time jobs. (2) Labor income is defined as wages and salaries and benefits as well as proprietors’ income.
Table 6. Indirect and Induced Impacts of General Aviation Aircraft and Component Manufacturing and Operations by Industry, 2013
[Dollar Amounts in Billions]
Industry Impacted Employment
(Jobs)(1) Labor
Income(2) Output GDP
Agriculture, forestry and fishing 8,900 $0.3 $1.2 $0.4
Mining 24,400 $2.0 $8.8 $5.1
Manufacturing 45,200 $4.0 $36.7 $9.8
Wholesale and retail trade 88,000 $4.2 $9.7 $6.9
Transportation and warehousing 43,400 $2.6 $5.7 $3.3
Information 12,500 $1.3 $5.1 $2.8 Finance, insurance, real estate, rental and leasing
80,900 $4.9 $22.7 $15.7
Services 373,700 $19.2 $35.6 $23.8
Other 59,700 $3.4 $4.5 $4.2
Total 736,500 $41.9 $130.1 $72.1 Source: PwC estimates based on data from GAMA and the IMPLAN Modeling System. (1) Employment is defined as the number of payroll and self-employed jobs, including part-time jobs. (2) Labor income is defined as wages and salaries and benefits as well as proprietors’ income.

Contribution of General Aviation to the US Economy in 2013
13
B. State-Level Results General aviation operations and aircraft manufacturing have an economic impact in all 50 states and the District of Columbia. General aviation’s economic impact varies from state to state, depending on factors such as the availability of alternative modes of transportation, each state’s industry mix, wage structure, spending and saving patterns, and connections to other economies.
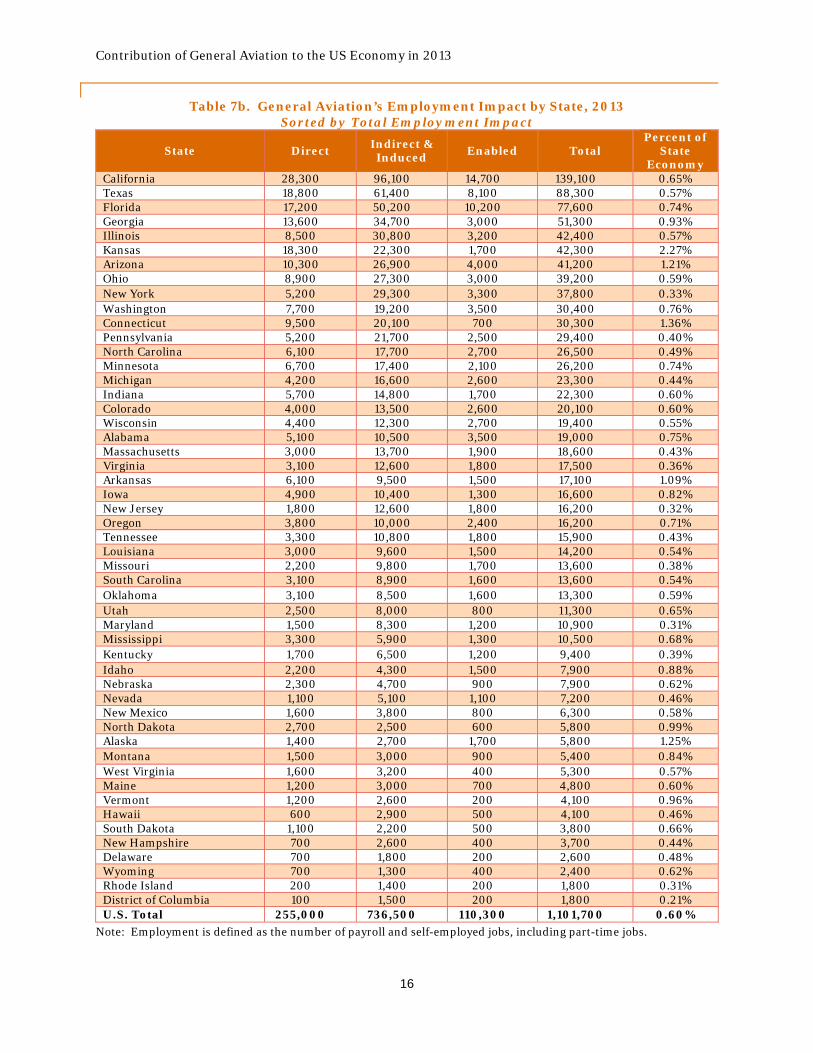
Table 7a shows general aviation’s state-by-state employment impacts, including direct, indirect and induced, and enabled impacts, where the states are shown alphabetically. Table 7b is the same as Table 7a, except that the states are ranked by total jobs supported by general aviation. Total jobs supported by general aviation in 2013 ranged from a low of 1,800 in the District of Columbia to a high of 139,100 in California. The top 10 states in terms of total jobs supported were California, Texas, Florida, Georgia, Illinois, Kansas, Arizona, Ohio, New York, and Washington. Combined, these 10 states account for 54 percent of the total jobs attributable to general aviation in the US. The total number of jobs supported by general aviation as a share of statewide employment was highest in Kansas, where 2.27 percent of all employment was supported by general aviation, followed by Connecticut (1.36 percent) and Alaska (1.25 percent).
Table 8a provides general aviation’s total impact on labor income (including wages and salaries and benefits as well as proprietors’ income) where the states are shown alphabetically. Table 8b shows general aviation’s labor income impact ranked by total labor income supported by general aviation. General aviation’s total labor income impact ranges from a low of $104 million in Rhode Island to a high of $10.3 billion in California. The top 10 states in terms of total labor income supported were California ($10.3 billion), Texas ($6.0 billion), Florida ($4.3 billion), Georgia ($3.4 billion), Illinois ($3.0 billion), New York ($2.9 billion), Kansas ($2.8 billion), Connecticut ($2.6 billion), Arizona ($2.6), and Ohio ($2.3 billion). Total labor income supported by general aviation as a percent of total labor income in the state is highest in Kansas (3.02 percent), Connecticut (1.74 percent), Arizona (1.53 percent), and Arkansas (1.36 percent).
Table 9a provides general aviation’s total impact on output by state, including direct, indirect and induced, and enabled impacts, where the states are shown alphabetically. Table 9b shows general aviation’s output impact ranked by total output supported by general aviation. General aviation’s total output impact ranges from a low of $304 million in Rhode Island to a high of $30.2 billion in California. The top 10 states in terms of total impact on output were California ($30.2 billion), Texas ($21.6 billion), Georgia ($13.7 billion), Florida ($12.3 billion), Illinois ($9.1 billion), Kansas ($8.3 billion), Arizona ($7.9 billion), Connecticut ($7.5 billion), Ohio ($7.1 billion), and New York ($7.1 billion). Total output supported by general aviation as a percent of total output in the state is highest in Kansas (2.72 percent), Connecticut (1.87 percent), and Georgia (1.66 percent).
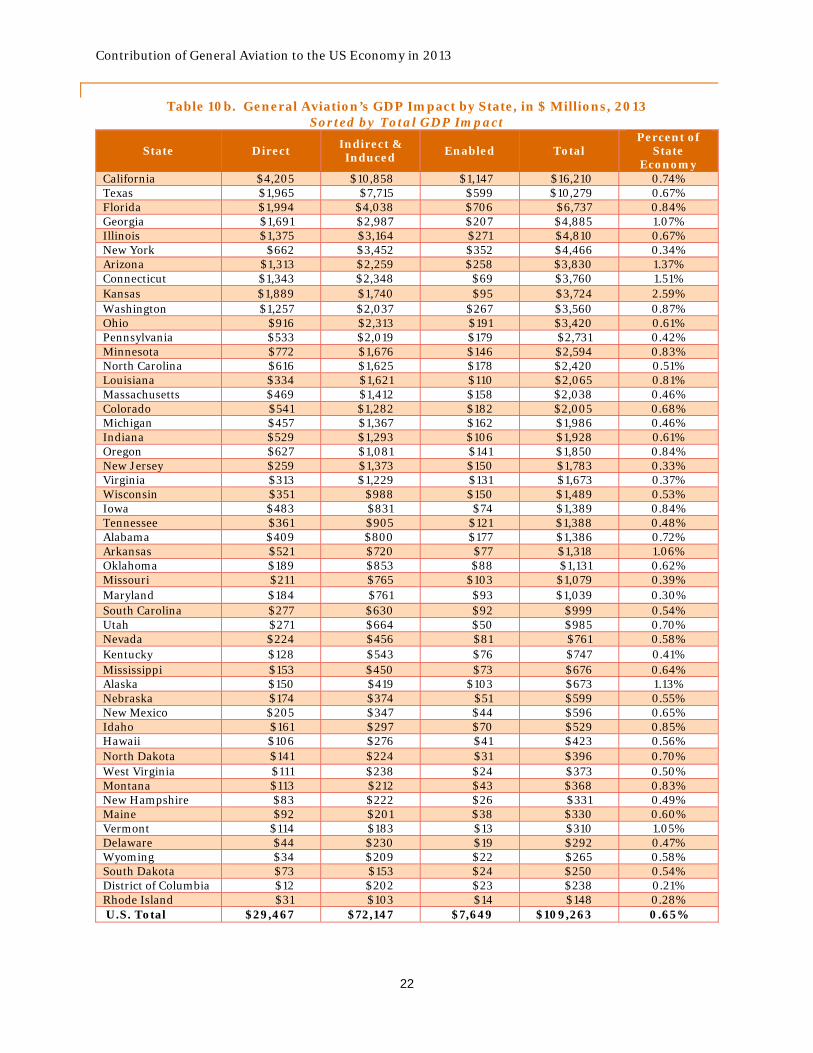
Table 10a provides general aviation’s total impact on GDP by state, including direct, indirect and induced, and enabled impacts, where the states are shown alphabetically. Table 10b shows general aviation’s GDP impact ranked by total GDP supported by general aviation. General aviation’s total GDP impact ranges from a low of $148 million in Rhode Island to a high of $16.2 billion in California. The top 10 states in terms of total impact on GDP were California ($16.2 billion), Texas ($10.3 billion), Florida ($6.7 billion), Georgia ($4.9 billion), Illinois ($4.8 billion), New York ($4.5 billion), Arizona ($3.8 billion), Connecticut ($3.8 billion), Kansas ($3.7), and Washington ($3.6 billion). Total GDP supported by general aviation as a percent of total GDP in the state is highest in Kansas (2.59 percent), Connecticut (1.51 percent), and Arizona (1.37 percent).
It is important to note that general aviation can have a disproportionate impact on the economies of large, sparsely populated states where there are fewer alternative modes of transportation for passengers and cargo. To reflect this, Table 11a and Table 11b provide general aviation’s total GDP impact per capita by state in 2013 (sorted alphabetically and ranked by per capita GDP impact).

Contribution of General Aviation to the US Economy in 2013
14
Nationwide, including direct, indirect and induced, and enabled impacts, general aviation supported $346 in GDP per capita in 2013. The top 10 states in terms of general aviation’s total GDP impact per capita were Kansas ($1,287 per person), Connecticut ($1,046 per person), Alaska ($915 per person), Arizona ($578 per person), North Dakota ($547 per person), Washington ($511 per person), Vermont ($495 per person), Georgia ($489 per person), Minnesota ($479 per person), and Oregon ($471 per person).
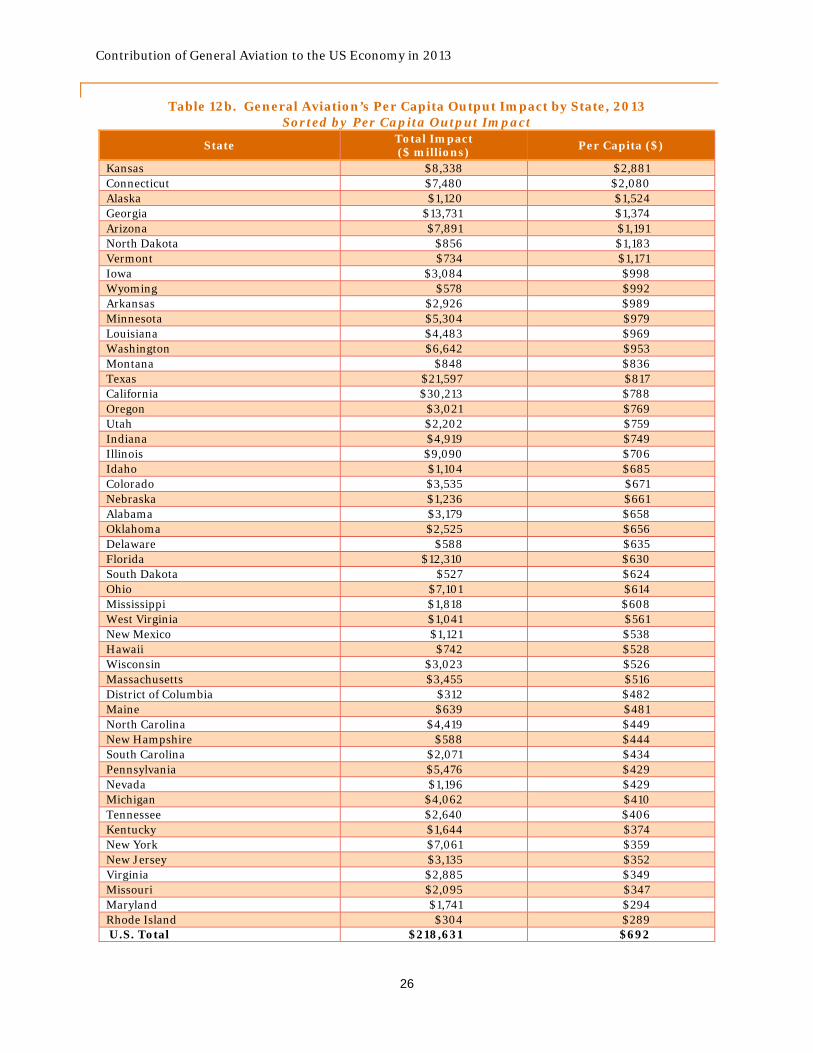
Table 12a and Table 12b provide general aviation’s total output impact per capita by state in 2013 (sorted alphabetically and ranked by per capita output impact).
Nationwide, including direct, indirect and induced, and enabled impacts, general aviation supported $692 in output per capita in 2013. The top 10 states in terms of general aviation’s total output impact per capita were Kansas ($2,881 per person), Connecticut ($2,080 per person), Alaska ($1,524 per person), Georgia ($1,374 per person), Arizona ($1,191 per person), North Dakota ($1,183 per person), Vermont ($1,171 per person), Iowa ($998 per person), Wyoming ($992 per person), and Arkansas ($989 per person).

Contribution of General Aviation to the US Economy in 2013
15
Table 7a. General Aviation’s Employment Impact by State, 2013 Sorted Alphabetically
State Direct Indirect & Induced Enabled Total
Percent of State
Economy Alabama 5,100 10,500 3,500 19,000 0.75% Alaska 1,400 2,700 1,700 5,800 1.25% Arizona 10,300 26,900 4,000 41,200 1.21% Arkansas 6,100 9,500 1,500 17,100 1.09% California 28,300 96,100 14,700 139,100 0.65% Colorado 4,000 13,500 2,600 20,100 0.60% Connecticut 9,500 20,100 700 30,300 1.36% Delaware 700 1,800 200 2,600 0.48% District of Columbia 100 1,500 200 1,800 0.21% Florida 17,200 50,200 10,200 77,600 0.74% Georgia 13,600 34,700 3,000 51,300 0.93% Hawaii 600 2,900 500 4,100 0.46% Idaho 2,200 4,300 1,500 7,900 0.88% Illinois 8,500 30,800 3,200 42,400 0.57% Indiana 5,700 14,800 1,700 22,300 0.60% Iowa 4,900 10,400 1,300 16,600 0.82% Kansas 18,300 22,300 1,700 42,300 2.27% Kentucky 1,700 6,500 1,200 9,400 0.39% Louisiana 3,000 9,600 1,500 14,200 0.54% Maine 1,200 3,000 700 4,800 0.60% Maryland 1,500 8,300 1,200 10,900 0.31% Massachusetts 3,000 13,700 1,900 18,600 0.43% Michigan 4,200 16,600 2,600 23,300 0.44% Minnesota 6,700 17,400 2,100 26,200 0.74% Mississippi 3,300 5,900 1,300 10,500 0.68% Missouri 2,200 9,800 1,700 13,600 0.38% Montana 1,500 3,000 900 5,400 0.84% Nebraska 2,300 4,700 900 7,900 0.62% Nevada 1,100 5,100 1,100 7,200 0.46% New Hampshire 700 2,600 400 3,700 0.44% New Jersey 1,800 12,600 1,800 16,200 0.32% New Mexico 1,600 3,800 800 6,300 0.58% New York 5,200 29,300 3,300 37,800 0.33% North Carolina 6,100 17,700 2,700 26,500 0.49% North Dakota 2,700 2,500 600 5,800 0.99% Ohio 8,900 27,300 3,000 39,200 0.59% Oklahoma 3,100 8,500 1,600 13,300 0.59% Oregon 3,800 10,000 2,400 16,200 0.71% Pennsylvania 5,200 21,700 2,500 29,400 0.40% Rhode Island 200 1,400 200 1,800 0.31% South Carolina 3,100 8,900 1,600 13,600 0.54% South Dakota 1,100 2,200 500 3,800 0.66% Tennessee 3,300 10,800 1,800 15,900 0.43% Texas 18,800 61,400 8,100 88,300 0.57% Utah 2,500 8,000 800 11,300 0.65% Vermont 1,200 2,600 200 4,100 0.96% Virginia 3,100 12,600 1,800 17,500 0.36% Washington 7,700 19,200 3,500 30,400 0.76% West Virginia 1,600 3,200 400 5,300 0.57% Wisconsin 4,400 12,300 2,700 19,400 0.55% Wyoming 700 1,300 400 2,400 0.62% U.S. Total 255,000 736,500 110,300 1,101,700 0.60%
Note: Employment is defined as the number of payroll and self-employed jobs, including part-time jobs.
Contribution of General Aviation to the US Economy in 2013
16
Table 7b. General Aviation’s Employment Impact by State, 2013 Sorted by Total Employment Impact
State Direct Indirect & Induced Enabled Total
Percent of State
Economy California 28,300 96,100 14,700 139,100 0.65% Texas 18,800 61,400 8,100 88,300 0.57% Florida 17,200 50,200 10,200 77,600 0.74% Georgia 13,600 34,700 3,000 51,300 0.93% Illinois 8,500 30,800 3,200 42,400 0.57% Kansas 18,300 22,300 1,700 42,300 2.27% Arizona 10,300 26,900 4,000 41,200 1.21% Ohio 8,900 27,300 3,000 39,200 0.59% New York 5,200 29,300 3,300 37,800 0.33% Washington 7,700 19,200 3,500 30,400 0.76% Connecticut 9,500 20,100 700 30,300 1.36% Pennsylvania 5,200 21,700 2,500 29,400 0.40% North Carolina 6,100 17,700 2,700 26,500 0.49% Minnesota 6,700 17,400 2,100 26,200 0.74% Michigan 4,200 16,600 2,600 23,300 0.44% Indiana 5,700 14,800 1,700 22,300 0.60% Colorado 4,000 13,500 2,600 20,100 0.60% Wisconsin 4,400 12,300 2,700 19,400 0.55% Alabama 5,100 10,500 3,500 19,000 0.75% Massachusetts 3,000 13,700 1,900 18,600 0.43% Virginia 3,100 12,600 1,800 17,500 0.36% Arkansas 6,100 9,500 1,500 17,100 1.09% Iowa 4,900 10,400 1,300 16,600 0.82% New Jersey 1,800 12,600 1,800 16,200 0.32% Oregon 3,800 10,000 2,400 16,200 0.71% Tennessee 3,300 10,800 1,800 15,900 0.43% Louisiana 3,000 9,600 1,500 14,200 0.54% Missouri 2,200 9,800 1,700 13,600 0.38% South Carolina 3,100 8,900 1,600 13,600 0.54% Oklahoma 3,100 8,500 1,600 13,300 0.59% Utah 2,500 8,000 800 11,300 0.65% Maryland 1,500 8,300 1,200 10,900 0.31% Mississippi 3,300 5,900 1,300 10,500 0.68% Kentucky 1,700 6,500 1,200 9,400 0.39% Idaho 2,200 4,300 1,500 7,900 0.88% Nebraska 2,300 4,700 900 7,900 0.62% Nevada 1,100 5,100 1,100 7,200 0.46% New Mexico 1,600 3,800 800 6,300 0.58% North Dakota 2,700 2,500 600 5,800 0.99% Alaska 1,400 2,700 1,700 5,800 1.25% Montana 1,500 3,000 900 5,400 0.84% West Virginia 1,600 3,200 400 5,300 0.57% Maine 1,200 3,000 700 4,800 0.60% Vermont 1,200 2,600 200 4,100 0.96% Hawaii 600 2,900 500 4,100 0.46% South Dakota 1,100 2,200 500 3,800 0.66% New Hampshire 700 2,600 400 3,700 0.44% Delaware 700 1,800 200 2,600 0.48% Wyoming 700 1,300 400 2,400 0.62% Rhode Island 200 1,400 200 1,800 0.31% District of Columbia 100 1,500 200 1,800 0.21% U.S. Total 255,000 736,500 110,300 1,101,700 0.60%
Note: Employment is defined as the number of payroll and self-employed jobs, including part-time jobs.

Contribution of General Aviation to the US Economy in 2013
17
Table 8a. General Aviation’s Labor Income Impact by State, in $ Millions, 2013 Sorted Alphabetically
State Direct Indirect & Induced
Enabled Total Percent of
State Economy
Alabama $293 $476 $105 $874 0.74% Alaska $130 $174 $62 $366 1.22% Arizona $1,079 $1,360 $156 $2,595 1.53% Arkansas $490 $417 $43 $951 1.36% California $3,227 $6,339 $709 $10,275 0.77% Colorado $379 $784 $112 $1,276 0.70% Connecticut $1,121 $1,457 $39 $2,617 1.74% Delaware $43 $104 $9 $156 0.49% District of Columbia $10 $150 $15 $175 0.21% Florida $1,459 $2,479 $410 $4,349 0.89% Georgia $1,414 $1,838 $119 $3,370 1.20% Hawaii $61 $175 $24 $260 0.57% Idaho $124 $177 $42 $342 0.88% Illinois $962 $1,927 $153 $3,042 0.68% Indiana $450 $713 $58 $1,221 0.67% Iowa $396 $483 $43 $922 0.92% Kansas $1,699 $1,054 $55 $2,808 3.02% Kentucky $113 $301 $40 $454 0.41% Louisiana $290 $504 $56 $850 0.63% Maine $53 $130 $23 $206 0.58% Maryland $127 $492 $54 $673 0.32% Massachusetts $339 $957 $98 $1,394 0.48% Michigan $355 $848 $97 $1,299 0.48% Minnesota $512 $977 $82 $1,572 0.81% Mississippi $129 $247 $44 $420 0.64% Missouri $154 $494 $64 $712 0.40% Montana $75 $120 $27 $222 0.84% Nebraska $107 $228 $30 $365 0.55% Nevada $122 $271 $51 $444 0.58% New Hampshire $55 $142 $15 $211 0.47% New Jersey $162 $868 $96 $1,126 0.34% New Mexico $122 $179 $26 $327 0.65% New York $504 $2,237 $208 $2,949 0.36% North Carolina $428 $881 $97 $1,406 0.51% North Dakota $79 $118 $17 $215 0.70% Ohio $754 $1,406 $113 $2,272 0.65% Oklahoma $181 $468 $52 $702 0.61% Oregon $273 $489 $84 $846 0.76% Pennsylvania $442 $1,258 $109 $1,809 0.44% Rhode Island $15 $80 $8 $104 0.31% South Carolina $218 $391 $53 $662 0.57% South Dakota $51 $95 $14 $161 0.58% Tennessee $184 $553 $71 $808 0.43% Texas $1,728 $3,889 $336 $5,953 0.67% Utah $217 $371 $30 $618 0.75% Vermont $92 $117 $8 $217 1.13% Virginia $226 $754 $77 $1,058 0.37% Washington $867 $1,144 $143 $2,153 0.91% West Virginia $95 $146 $15 $256 0.60% Wisconsin $245 $600 $88 $933 0.52% Wyoming $29 $70 $12 $111 0.54% U.S. Total $22,678 $41,931 $4,495 $69,104 0.68%
Note: Labor income is defined as wages and salaries and benefits as well as proprietors’ income.

Contribution of General Aviation to the US Economy in 2013
18
Table 8b. General Aviation’s Labor Income Impact by State, in $ Millions, 2013 Sorted by Total Labor Income Impact
State Direct Indirect & Induced Enabled Total
Percent of State
Economy California $3,227 $6,339 $709 $10,275 0.77% Texas $1,728 $3,889 $336 $5,953 0.67% Florida $1,459 $2,479 $410 $4,349 0.89% Georgia $1,414 $1,838 $119 $3,370 1.20% Illinois $962 $1,927 $153 $3,042 0.68% New York $504 $2,237 $208 $2,949 0.36% Kansas $1,699 $1,054 $55 $2,808 3.02% Connecticut $1,121 $1,457 $39 $2,617 1.74% Arizona $1,079 $1,360 $156 $2,595 1.53% Ohio $754 $1,406 $113 $2,272 0.65% Washington $867 $1,144 $143 $2,153 0.91% Pennsylvania $442 $1,258 $109 $1,809 0.44% Minnesota $512 $977 $82 $1,572 0.81% North Carolina $428 $881 $97 $1,406 0.51% Massachusetts $339 $957 $98 $1,394 0.48% Michigan $355 $848 $97 $1,299 0.48% Colorado $379 $784 $112 $1,276 0.70% Indiana $450 $713 $58 $1,221 0.67% New Jersey $162 $868 $96 $1,126 0.34% Virginia $226 $754 $77 $1,058 0.37% Arkansas $490 $417 $43 $951 1.36% Wisconsin $245 $600 $88 $933 0.52% Iowa $396 $483 $43 $922 0.92% Alabama $293 $476 $105 $874 0.74% Louisiana $290 $504 $56 $850 0.63% Oregon $273 $489 $84 $846 0.76% Tennessee $184 $553 $71 $808 0.43% Missouri $154 $494 $64 $712 0.40% Oklahoma $181 $468 $52 $702 0.61% Maryland $127 $492 $54 $673 0.32% South Carolina $218 $391 $53 $662 0.57% Utah $217 $371 $30 $618 0.75% Kentucky $113 $301 $40 $454 0.41% Nevada $122 $271 $51 $444 0.58% Mississippi $129 $247 $44 $420 0.64% Alaska $130 $174 $62 $366 1.22% Nebraska $107 $228 $30 $365 0.55% Idaho $124 $177 $42 $342 0.88% New Mexico $122 $179 $26 $327 0.65% Hawaii $61 $175 $24 $260 0.57% West Virginia $95 $146 $15 $256 0.60% Montana $75 $120 $27 $222 0.84% Vermont $92 $117 $8 $217 1.13% North Dakota $79 $118 $17 $215 0.70% New Hampshire $55 $142 $15 $211 0.47% Maine $53 $130 $23 $206 0.58% District of Columbia $10 $150 $15 $175 0.21% South Dakota $51 $95 $14 $161 0.58% Delaware $43 $104 $9 $156 0.49% Wyoming $29 $70 $12 $111 0.54% Rhode Island $15 $80 $8 $104 0.31% U.S. Total $22,678 $41,931 $4,495 $69,104 0.68%
Note: Labor income is defined as wages and salaries and benefits as well as proprietors’ income.

Contribution of General Aviation to the US Economy in 2013
19
Table 9a. General Aviation’s Output Impact by State, in $ Millions, 2013 Sorted Alphabetically
State Direct Indirect & Induced Enabled Total
Percent of State
Economy Alabama $1,249 $1,588 $342 $3,179 0.80% Alaska $318 $624 $179 $1,120 1.30% Arizona $3,813 $3,648 $430 $7,891 1.64% Arkansas $1,404 $1,367 $155 $2,926 1.22% California $9,119 $19,183 $1,911 $30,213 0.87% Colorado $1,097 $2,131 $306 $3,535 0.71% Connecticut $3,907 $3,467 $105 $7,480 1.87% Delaware $152 $404 $31 $588 0.59% District of Columbia $19 $261 $31 $312 0.22% Florida $4,601 $6,555 $1,155 $12,310 0.92% Georgia $8,245 $5,121 $365 $13,731 1.66% Hawaii $179 $498 $65 $742 0.60% Idaho $410 $556 $138 $1,104 0.86% Illinois $2,958 $5,677 $455 $9,090 0.70% Indiana $1,964 $2,748 $208 $4,919 0.74% Iowa $1,396 $1,538 $150 $3,084 0.90% Kansas $4,927 $3,227 $184 $8,338 2.72% Kentucky $312 $1,189 $142 $1,644 0.42% Louisiana $679 $3,599 $205 $4,483 0.82% Maine $212 $356 $70 $639 0.63% Maryland $347 $1,246 $148 $1,741 0.35% Massachusetts $939 $2,268 $248 $3,455 0.50% Michigan $1,043 $2,718 $301 $4,062 0.47% Minnesota $2,010 $3,031 $263 $5,304 0.92% Mississippi $604 $1,074 $141 $1,818 0.80% Missouri $451 $1,451 $193 $2,095 0.41% Montana $268 $496 $85 $848 0.99% Nebraska $429 $703 $104 $1,236 0.60% Nevada $351 $718 $127 $1,196 0.55% New Hampshire $165 $379 $43 $588 0.48% New Jersey $469 $2,418 $248 $3,135 0.37% New Mexico $383 $657 $82 $1,121 0.74% New York $1,369 $5,175 $517 $7,061 0.37% North Carolina $1,323 $2,778 $319 $4,419 0.51% North Dakota $350 $446 $59 $856 0.88% Ohio $2,270 $4,470 $361 $7,101 0.67% Oklahoma $685 $1,671 $169 $2,525 0.74% Oregon $1,092 $1,676 $253 $3,021 0.81% Pennsylvania $1,221 $3,928 $327 $5,476 0.47% Rhode Island $56 $224 $24 $304 0.34% South Carolina $696 $1,205 $170 $2,071 0.58% South Dakota $192 $287 $49 $527 0.63% Tennessee $738 $1,684 $218 $2,640 0.47% Texas $4,975 $15,550 $1,072 $21,597 0.77% Utah $793 $1,314 $95 $2,202 0.86% Vermont $374 $336 $24 $734 1.28% Virginia $721 $1,947 $217 $2,885 0.40% Washington $2,561 $3,648 $433 $6,642 0.99% West Virginia $474 $521 $46 $1,041 0.75% Wisconsin $830 $1,898 $295 $3,023 0.54% Wyoming $104 $434 $41 $578 0.78% U.S. Total $75,243 $130,087 $13,300 $218,631 0.75%

Contribution of General Aviation to the US Economy in 2013
20
Table 9b. General Aviation’s Output Impact by State, in $ Millions, 2013 Sorted by Total GDP Impact
State Direct Indirect & Induced Enabled Total
Percent of State
Economy California $9,119 $19,183 $1,911 $30,213 0.87% Texas $4,975 $15,550 $1,072 $21,597 0.77% Georgia $8,245 $5,121 $365 $13,731 1.66% Florida $4,601 $6,555 $1,155 $12,310 0.92% Illinois $2,958 $5,677 $455 $9,090 0.70% Kansas $4,927 $3,227 $184 $8,338 2.72% Arizona $3,813 $3,648 $430 $7,891 1.64% Connecticut $3,907 $3,467 $105 $7,480 1.87% Ohio $2,270 $4,470 $361 $7,101 0.67% New York $1,369 $5,175 $517 $7,061 0.37% Washington $2,561 $3,648 $433 $6,642 0.99% Pennsylvania $1,221 $3,928 $327 $5,476 0.47% Minnesota $2,010 $3,031 $263 $5,304 0.92% Indiana $1,964 $2,748 $208 $4,919 0.74% Louisiana $679 $3,599 $205 $4,483 0.82% North Carolina $1,323 $2,778 $319 $4,419 0.51% Michigan $1,043 $2,718 $301 $4,062 0.47% Colorado $1,097 $2,131 $306 $3,535 0.71% Massachusetts $939 $2,268 $248 $3,455 0.50% Alabama $1,249 $1,588 $342 $3,179 0.80% New Jersey $469 $2,418 $248 $3,135 0.37% Iowa $1,396 $1,538 $150 $3,084 0.90% Wisconsin $830 $1,898 $295 $3,023 0.54% Oregon $1,092 $1,676 $253 $3,021 0.81% Arkansas $1,404 $1,367 $155 $2,926 1.22% Virginia $721 $1,947 $217 $2,885 0.40% Tennessee $738 $1,684 $218 $2,640 0.47% Oklahoma $685 $1,671 $169 $2,525 0.74% Utah $793 $1,314 $95 $2,202 0.86% Missouri $451 $1,451 $193 $2,095 0.41% South Carolina $696 $1,205 $170 $2,071 0.58% Mississippi $604 $1,074 $141 $1,818 0.80% Maryland $347 $1,246 $148 $1,741 0.35% Kentucky $312 $1,189 $142 $1,644 0.42% Nebraska $429 $703 $104 $1,236 0.60% Nevada $351 $718 $127 $1,196 0.55% New Mexico $383 $657 $82 $1,121 0.74% Alaska $318 $624 $179 $1,120 1.30% Idaho $410 $556 $138 $1,104 0.86% West Virginia $474 $521 $46 $1,041 0.75% North Dakota $350 $446 $59 $856 0.88% Montana $268 $496 $85 $848 0.99% Hawaii $179 $498 $65 $742 0.60% Vermont $374 $336 $24 $734 1.28% Maine $212 $356 $70 $639 0.63% New Hampshire $165 $379 $43 $588 0.48% Delaware $152 $404 $31 $588 0.59% Wyoming $104 $434 $41 $578 0.78% South Dakota $192 $287 $49 $527 0.63% District of Columbia $19 $261 $31 $312 0.22% Rhode Island $56 $224 $24 $304 0.34% U.S. Total $75,243 $130,087 $13,300 $218,631 0.75%

Contribution of General Aviation to the US Economy in 2013
21
Table 10a. General Aviation’s GDP Impact by State, in $ Millions, 2013 Sorted Alphabetically
State Direct Indirect & Induced Enabled Total
Percent of State
Economy Alabama $409 $800 $177 $1,386 0.72% Alaska $150 $419 $103 $673 1.13% Arizona $1,313 $2,259 $258 $3,830 1.37% Arkansas $521 $720 $77 $1,318 1.06% California $4,205 $10,858 $1,147 $16,210 0.74% Colorado $541 $1,282 $182 $2,005 0.68% Connecticut $1,343 $2,348 $69 $3,760 1.51% Delaware $44 $230 $19 $292 0.47% District of Columbia $12 $202 $23 $238 0.21% Florida $1,994 $4,038 $706 $6,737 0.84% Georgia $1,691 $2,987 $207 $4,885 1.07% Hawaii $106 $276 $41 $423 0.56% Idaho $161 $297 $70 $529 0.85% Illinois $1,375 $3,164 $271 $4,810 0.67% Indiana $529 $1,293 $106 $1,928 0.61% Iowa $483 $831 $74 $1,389 0.84% Kansas $1,889 $1,740 $95 $3,724 2.59% Kentucky $128 $543 $76 $747 0.41% Louisiana $334 $1,621 $110 $2,065 0.81% Maine $92 $201 $38 $330 0.60% Maryland $184 $761 $93 $1,039 0.30% Massachusetts $469 $1,412 $158 $2,038 0.46% Michigan $457 $1,367 $162 $1,986 0.46% Minnesota $772 $1,676 $146 $2,594 0.83% Mississippi $153 $450 $73 $676 0.64% Missouri $211 $765 $103 $1,079 0.39% Montana $113 $212 $43 $368 0.83% Nebraska $174 $374 $51 $599 0.55% Nevada $224 $456 $81 $761 0.58% New Hampshire $83 $222 $26 $331 0.49% New Jersey $259 $1,373 $150 $1,783 0.33% New Mexico $205 $347 $44 $596 0.65% New York $662 $3,452 $352 $4,466 0.34% North Carolina $616 $1,625 $178 $2,420 0.51% North Dakota $141 $224 $31 $396 0.70% Ohio $916 $2,313 $191 $3,420 0.61% Oklahoma $189 $853 $88 $1,131 0.62% Oregon $627 $1,081 $141 $1,850 0.84% Pennsylvania $533 $2,019 $179 $2,731 0.42% Rhode Island $31 $103 $14 $148 0.28% South Carolina $277 $630 $92 $999 0.54% South Dakota $73 $153 $24 $250 0.54% Tennessee $361 $905 $121 $1,388 0.48% Texas $1,965 $7,715 $599 $10,279 0.67% Utah $271 $664 $50 $985 0.70% Vermont $114 $183 $13 $310 1.05% Virginia $313 $1,229 $131 $1,673 0.37% Washington $1,257 $2,037 $267 $3,560 0.87% West Virginia $111 $238 $24 $373 0.50% Wisconsin $351 $988 $150 $1,489 0.53% Wyoming $34 $209 $22 $265 0.58% U.S. Total $29,467 $72,147 $7,649 $109,263 0.65%
Contribution of General Aviation to the US Economy in 2013
22
Table 10b. General Aviation’s GDP Impact by State, in $ Millions, 2013 Sorted by Total GDP Impact
State Direct Indirect & Induced Enabled Total
Percent of State
Economy California $4,205 $10,858 $1,147 $16,210 0.74% Texas $1,965 $7,715 $599 $10,279 0.67% Florida $1,994 $4,038 $706 $6,737 0.84% Georgia $1,691 $2,987 $207 $4,885 1.07% Illinois $1,375 $3,164 $271 $4,810 0.67% New York $662 $3,452 $352 $4,466 0.34% Arizona $1,313 $2,259 $258 $3,830 1.37% Connecticut $1,343 $2,348 $69 $3,760 1.51% Kansas $1,889 $1,740 $95 $3,724 2.59% Washington $1,257 $2,037 $267 $3,560 0.87% Ohio $916 $2,313 $191 $3,420 0.61% Pennsylvania $533 $2,019 $179 $2,731 0.42% Minnesota $772 $1,676 $146 $2,594 0.83% North Carolina $616 $1,625 $178 $2,420 0.51% Louisiana $334 $1,621 $110 $2,065 0.81% Massachusetts $469 $1,412 $158 $2,038 0.46% Colorado $541 $1,282 $182 $2,005 0.68% Michigan $457 $1,367 $162 $1,986 0.46% Indiana $529 $1,293 $106 $1,928 0.61% Oregon $627 $1,081 $141 $1,850 0.84% New Jersey $259 $1,373 $150 $1,783 0.33% Virginia $313 $1,229 $131 $1,673 0.37% Wisconsin $351 $988 $150 $1,489 0.53% Iowa $483 $831 $74 $1,389 0.84% Tennessee $361 $905 $121 $1,388 0.48% Alabama $409 $800 $177 $1,386 0.72% Arkansas $521 $720 $77 $1,318 1.06% Oklahoma $189 $853 $88 $1,131 0.62% Missouri $211 $765 $103 $1,079 0.39% Maryland $184 $761 $93 $1,039 0.30% South Carolina $277 $630 $92 $999 0.54% Utah $271 $664 $50 $985 0.70% Nevada $224 $456 $81 $761 0.58% Kentucky $128 $543 $76 $747 0.41% Mississippi $153 $450 $73 $676 0.64% Alaska $150 $419 $103 $673 1.13% Nebraska $174 $374 $51 $599 0.55% New Mexico $205 $347 $44 $596 0.65% Idaho $161 $297 $70 $529 0.85% Hawaii $106 $276 $41 $423 0.56% North Dakota $141 $224 $31 $396 0.70% West Virginia $111 $238 $24 $373 0.50% Montana $113 $212 $43 $368 0.83% New Hampshire $83 $222 $26 $331 0.49% Maine $92 $201 $38 $330 0.60% Vermont $114 $183 $13 $310 1.05% Delaware $44 $230 $19 $292 0.47% Wyoming $34 $209 $22 $265 0.58% South Dakota $73 $153 $24 $250 0.54% District of Columbia $12 $202 $23 $238 0.21% Rhode Island $31 $103 $14 $148 0.28% U.S. Total $29,467 $72,147 $7,649 $109,263 0.65%

Contribution of General Aviation to the US Economy in 2013
23
Table 11a. General Aviation’s Per Capita GDP Impact by State, 2013 Sorted Alphabetically
State Total Impact ($ millions) Per Capita ($)
Alabama $1,386 $287 Alaska $673 $915 Arizona $3,830 $578 Arkansas $1,318 $445 California $16,210 $423 Colorado $2,005 $381 Connecticut $3,760 $1,046 Delaware $292 $316 District of Columbia $238 $368 Florida $6,737 $345 Georgia $4,885 $489 Hawaii $423 $301 Idaho $529 $328 Illinois $4,810 $373 Indiana $1,928 $293 Iowa $1,389 $449 Kansas $3,724 $1,287 Kentucky $747 $170 Louisiana $2,065 $447 Maine $330 $249 Maryland $1,039 $175 Massachusetts $2,038 $305 Michigan $1,986 $201 Minnesota $2,594 $479 Mississippi $676 $226 Missouri $1,079 $179 Montana $368 $362 Nebraska $599 $321 Nevada $761 $273 New Hampshire $331 $250 New Jersey $1,783 $200 New Mexico $596 $286 New York $4,466 $227 North Carolina $2,420 $246 North Dakota $396 $547 Ohio $3,420 $296 Oklahoma $1,131 $294 Oregon $1,850 $471 Pennsylvania $2,731 $214 Rhode Island $148 $141 South Carolina $999 $209 South Dakota $250 $296 Tennessee $1,388 $214 Texas $10,279 $389 Utah $985 $340 Vermont $310 $495 Virginia $1,673 $203 Washington $3,560 $511 West Virginia $373 $201 Wisconsin $1,489 $259 Wyoming $265 $455 U.S. Total $109,263 $346

Contribution of General Aviation to the US Economy in 2013
24
Table 11b. General Aviation’s Per Capita GDP Impact by State, 2013 Sorted by Per Capita GDP Impact
State Total Impact ($ millions) Per Capita ($)
Kansas $3,724 $1,287 Connecticut $3,760 $1,046 Alaska $673 $915 Arizona $3,830 $578 North Dakota $396 $547 Washington $3,560 $511 Vermont $310 $495 Georgia $4,885 $489 Minnesota $2,594 $479 Oregon $1,850 $471 Wyoming $265 $455 Iowa $1,389 $449 Louisiana $2,065 $447 Arkansas $1,318 $445 California $16,210 $423 Texas $10,279 $389 Colorado $2,005 $381 Illinois $4,810 $373 District of Columbia $238 $368 Montana $368 $362 Florida $6,737 $345 Utah $985 $340 Idaho $529 $328 Nebraska $599 $321 Delaware $292 $316 Massachusetts $2,038 $305 Hawaii $423 $301 South Dakota $250 $296 Ohio $3,420 $296 Oklahoma $1,131 $294 Indiana $1,928 $293 Alabama $1,386 $287 New Mexico $596 $286 Nevada $761 $273 Wisconsin $1,489 $259 New Hampshire $331 $250 Maine $330 $249 North Carolina $2,420 $246 New York $4,466 $227 Mississippi $676 $226 Pennsylvania $2,731 $214 Tennessee $1,388 $214 South Carolina $999 $209 Virginia $1,673 $203 West Virginia $373 $201 Michigan $1,986 $201 New Jersey $1,783 $200 Missouri $1,079 $179 Maryland $1,039 $175 Kentucky $747 $170 Rhode Island $148 $141 U.S. Total $109,263 $346

Contribution of General Aviation to the US Economy in 2013
25
Table 12a. General Aviation’s Per Capita Output Impact by State, 2013 Sorted Alphabetically
State Total Impact ($ millions) Per Capita ($)
Alabama $3,179 $658 Alaska $1,120 $1,524 Arizona $7,891 $1,191 Arkansas $2,926 $989 California $30,213 $788 Colorado $3,535 $671 Connecticut $7,480 $2,080 Delaware $588 $635 District of Columbia $312 $482 Florida $12,310 $630 Georgia $13,731 $1,374 Hawaii $742 $528 Idaho $1,104 $685 Illinois $9,090 $706 Indiana $4,919 $749 Iowa $3,084 $998 Kansas $8,338 $2,881 Kentucky $1,644 $374 Louisiana $4,483 $969 Maine $639 $481 Maryland $1,741 $294 Massachusetts $3,455 $516 Michigan $4,062 $410 Minnesota $5,304 $979 Mississippi $1,818 $608 Missouri $2,095 $347 Montana $848 $836 Nebraska $1,236 $661 Nevada $1,196 $429 New Hampshire $588 $444 New Jersey $3,135 $352 New Mexico $1,121 $538 New York $7,061 $359 North Carolina $4,419 $449 North Dakota $856 $1,183 Ohio $7,101 $614 Oklahoma $2,525 $656 Oregon $3,021 $769 Pennsylvania $5,476 $429 Rhode Island $304 $289 South Carolina $2,071 $434 South Dakota $527 $624 Tennessee $2,640 $406 Texas $21,597 $817 Utah $2,202 $759 Vermont $734 $1,171 Virginia $2,885 $349 Washington $6,642 $953 West Virginia $1,041 $561 Wisconsin $3,023 $526 Wyoming $578 $992 U.S. Total $218,631 $692
Contribution of General Aviation to the US Economy in 2013
26
Table 12b. General Aviation’s Per Capita Output Impact by State, 2013 Sorted by Per Capita Output Impact
State Total Impact ($ millions) Per Capita ($)
Kansas $8,338 $2,881 Connecticut $7,480 $2,080 Alaska $1,120 $1,524 Georgia $13,731 $1,374 Arizona $7,891 $1,191 North Dakota $856 $1,183 Vermont $734 $1,171 Iowa $3,084 $998 Wyoming $578 $992 Arkansas $2,926 $989 Minnesota $5,304 $979 Louisiana $4,483 $969 Washington $6,642 $953 Montana $848 $836 Texas $21,597 $817 California $30,213 $788 Oregon $3,021 $769 Utah $2,202 $759 Indiana $4,919 $749 Illinois $9,090 $706 Idaho $1,104 $685 Colorado $3,535 $671 Nebraska $1,236 $661 Alabama $3,179 $658 Oklahoma $2,525 $656 Delaware $588 $635 Florida $12,310 $630 South Dakota $527 $624 Ohio $7,101 $614 Mississippi $1,818 $608 West Virginia $1,041 $561 New Mexico $1,121 $538 Hawaii $742 $528 Wisconsin $3,023 $526 Massachusetts $3,455 $516 District of Columbia $312 $482 Maine $639 $481 North Carolina $4,419 $449 New Hampshire $588 $444 South Carolina $2,071 $434 Pennsylvania $5,476 $429 Nevada $1,196 $429 Michigan $4,062 $410 Tennessee $2,640 $406 Kentucky $1,644 $374 New York $7,061 $359 New Jersey $3,135 $352 Virginia $2,885 $349 Missouri $2,095 $347 Maryland $1,741 $294 Rhode Island $304 $289 U.S. Total $218,631 $692

Contribution of General Aviation to the US Economy in 2013
27
Appendix A: State-by-State Summary

Contribution of General Aviation to the US Economy in 2013
28
Table A-1. General Aviation’s Contribution to Alabama’s Economy, 2013 [Dollar Amounts in Millions]
Item Direct Indirect & Induced
Enabled Total Percent of
State Economy
Employment (Jobs)(1) 5,100 10,500 3,500 19,000 0.75%
Labor Income(2) $293 $476 $105 $874 0.74%
Output $1,249 $1,588 $342 $3,179 0.80%
Contribution to GDP $409 $800 $177 $1,386 0.72% Notes at the end of section.
Table A-2. General Aviation’s Contribution to Alaska’s Economy, 2013 [Dollar Amounts in Millions]
Item Direct Indirect & Induced
Enabled Total Percent of
State Economy
Employment (Jobs)(1) 1,400 2,700 1,700 5,800 1.25%
Labor Income(2) $130 $174 $62 $366 1.22%
Output $318 $624 $179 $1,120 1.30%
Contribution to GDP $150 $419 $103 $673 1.13% Notes at the end of section.
Table A-3. General Aviation’s Contribution to Arizona’s Economy, 2013 [Dollar Amounts in Millions]
Item Direct Indirect & Induced Enabled Total
Percent of State
Economy
Employment (Jobs)(1) 10,300 26,900 4,000 41,200 1.21%
Labor Income(2) $1,079 $1,360 $156 $2,595 1.53%
Output $3,813 $3,648 $430 $7,891 1.64%
Contribution to GDP $1,313 $2,259 $258 $3,830 1.37% Notes at the end of section.
Table A-4. General Aviation’s Contribution to Arkansas’s Economy, 2013 [Dollar Amounts in Millions]
Item Direct Indirect & Induced
Enabled Total Percent of
State Economy
Employment (Jobs)(1) 6,100 9,500 1,500 17,100 1.09%
Labor Income(2) $490 $417 $43 $951 1.36%
Output $1,404 $1,367 $155 $2,926 1.22%
Contribution to GDP $521 $720 $77 $1,318 1.06% Notes at the end of section.

Contribution of General Aviation to the US Economy in 2013
29
Table A-5. General Aviation’s Contribution to California’s Economy, 2013 [Dollar Amounts in Millions]
Item Direct Indirect & Induced
Enabled Total Percent of
State Economy
Employment (Jobs)(1) 28,300 96,100 14,700 139,100 0.65%
Labor Income(2) $3,227 $6,339 $709 $10,275 0.77%
Output $9,119 $19,183 $1,911 $30,213 0.87%
Contribution to GDP $4,205 $10,858 $1,147 $16,210 0.74% Notes at the end of section.
Table A-6. General Aviation’s Contribution to Colorado’s Economy, 2013 [Dollar Amounts in Millions]
Item Direct Indirect & Induced
Enabled Total Percent of
State Economy
Employment (Jobs)(1) 4,000 13,500 2,600 20,100 0.60%
Labor Income(2) $379 $784 $112 $1,276 0.70%
Output $1,097 $2,131 $306 $3,535 0.71%
Contribution to GDP $541 $1,282 $182 $2,005 0.68% Notes at the end of section.
Table A-7. General Aviation’s Contribution to Connecticut’s Economy, 2013 [Dollar Amounts in Millions]
Item Direct Indirect & Induced
Enabled Total Percent of
State Economy
Employment (Jobs)(1) 9,500 20,100 700 30,300 1.36%
Labor Income(2) $1,121 $1,457 $39 $2,617 1.74%
Output $3,907 $3,467 $105 $7,480 1.87%
Contribution to GDP $1,343 $2,348 $69 $3,760 1.51% Notes at the end of section.
Table A-8. General Aviation’s Contribution to Delaware’s Economy, 2013 [Dollar Amounts in Millions]
Item Direct Indirect & Induced
Enabled Total Percent of
State Economy
Employment (Jobs)(1) 700 1,800 200 2,600 0.48%
Labor Income(2) $43 $104 $9 $156 0.49%
Output $152 $404 $31 $588 0.59%
Contribution to GDP $44 $230 $19 $292 0.47% Notes at the end of section.

Contribution of General Aviation to the US Economy in 2013
30
Table A-9. General Aviation’s Contribution to the District of Columbia’s Economy, 2013 [Dollar Amounts in Millions]
Item Direct Indirect & Induced
Enabled Total Percent of
State Economy
Employment (Jobs)(1) 100 1,500 200 1,800 0.21%
Labor Income(2) $10 $150 $15 $175 0.21%
Output $19 $261 $31 $312 0.22%
Contribution to GDP $12 $202 $23 $238 0.21% Notes at the end of section.
Table A-10. General Aviation’s Contribution to Florida’s Economy, 2013 [Dollar Amounts in Millions]
Item Direct Indirect & Induced Enabled Total
Percent of State
Economy
Employment (Jobs)(1) 17,200 50,200 10,200 77,600 0.74%
Labor Income(2) $1,459 $2,479 $410 $4,349 0.89%
Output $4,601 $6,555 $1,155 $12,310 0.92%
Contribution to GDP $1,994 $4,038 $706 $6,737 0.84% Notes at the end of section.
Table A-11. General Aviation’s Contribution to Georgia’s Economy, 2013 [Dollar Amounts in Millions]
Item Direct Indirect & Induced
Enabled Total Percent of
State Economy
Employment (Jobs)(1) 13,600 34,700 3,000 51,300 0.93%
Labor Income(2) $1,414 $1,838 $119 $3,370 1.20%
Output $8,245 $5,121 $365 $13,731 1.66%
Contribution to GDP $1,691 $2,987 $207 $4,885 1.07% Notes at the end of section.
Table A-12. General Aviation’s Contribution to Hawaii’s Economy, 2013 [Dollar Amounts in Millions]
Item Direct Indirect & Induced
Enabled Total Percent of
State Economy
Employment (Jobs)(1) 600 2,900 500 4,100 0.46%
Labor Income(2) $61 $175 $24 $260 0.57%
Output $179 $498 $65 $742 0.60%
Contribution to GDP $106 $276 $41 $423 0.56% Notes at the end of section.
Contribution of General Aviation to the US Economy in 2013
31
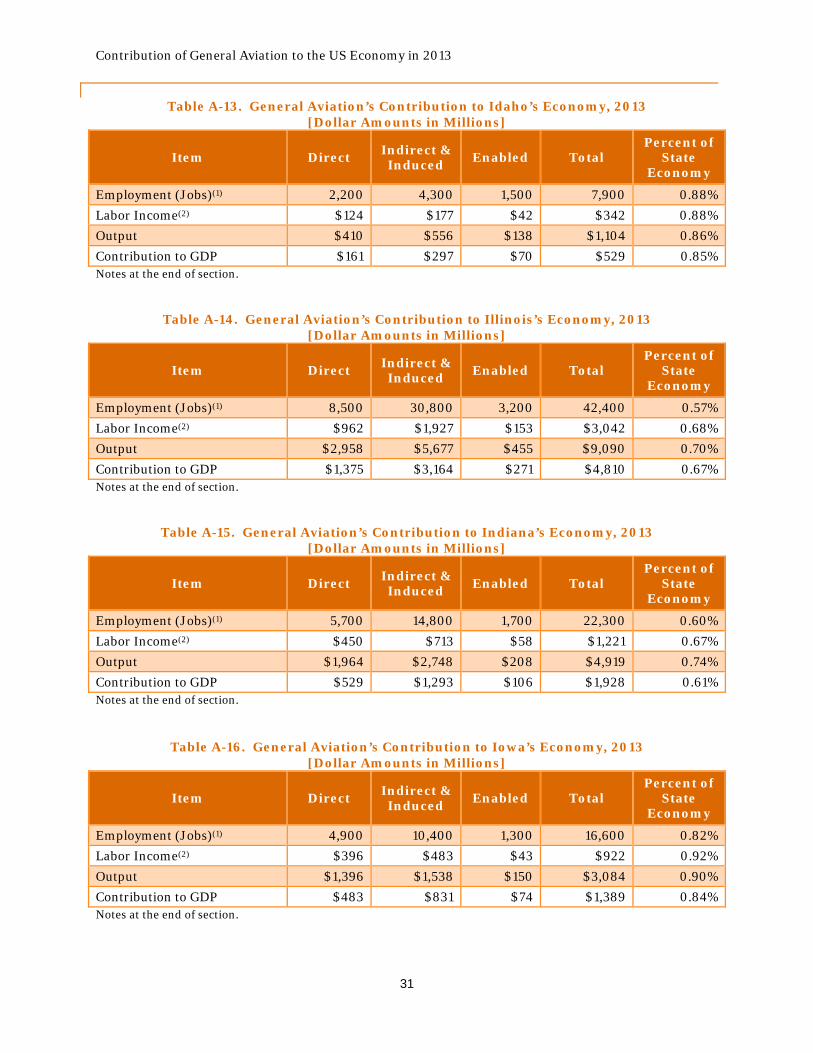
Table A-13. General Aviation’s Contribution to Idaho’s Economy, 2013 [Dollar Amounts in Millions]
Item Direct Indirect & Induced
Enabled Total Percent of
State Economy
Employment (Jobs)(1) 2,200 4,300 1,500 7,900 0.88%
Labor Income(2) $124 $177 $42 $342 0.88%
Output $410 $556 $138 $1,104 0.86%
Contribution to GDP $161 $297 $70 $529 0.85% Notes at the end of section.
Table A-14. General Aviation’s Contribution to Illinois’s Economy, 2013 [Dollar Amounts in Millions]
Item Direct Indirect & Induced
Enabled Total Percent of
State Economy
Employment (Jobs)(1) 8,500 30,800 3,200 42,400 0.57%
Labor Income(2) $962 $1,927 $153 $3,042 0.68%
Output $2,958 $5,677 $455 $9,090 0.70%
Contribution to GDP $1,375 $3,164 $271 $4,810 0.67% Notes at the end of section.
Table A-15. General Aviation’s Contribution to Indiana’s Economy, 2013 [Dollar Amounts in Millions]
Item Direct Indirect & Induced Enabled Total
Percent of State
Economy
Employment (Jobs)(1) 5,700 14,800 1,700 22,300 0.60%
Labor Income(2) $450 $713 $58 $1,221 0.67%
Output $1,964 $2,748 $208 $4,919 0.74%
Contribution to GDP $529 $1,293 $106 $1,928 0.61% Notes at the end of section.
Table A-16. General Aviation’s Contribution to Iowa’s Economy, 2013 [Dollar Amounts in Millions]
Item Direct Indirect & Induced
Enabled Total Percent of
State Economy
Employment (Jobs)(1) 4,900 10,400 1,300 16,600 0.82%
Labor Income(2) $396 $483 $43 $922 0.92%
Output $1,396 $1,538 $150 $3,084 0.90%
Contribution to GDP $483 $831 $74 $1,389 0.84% Notes at the end of section.

Contribution of General Aviation to the US Economy in 2013
32
Table A-17. General Aviation’s Contribution to Kansas’s Economy, 2013 [Dollar Amounts in Millions]
Item Direct Indirect & Induced
Enabled Total Percent of
State Economy
Employment (Jobs)(1) 18,300 22,300 1,700 42,300 2.27%
Labor Income(2) $1,699 $1,054 $55 $2,808 3.02%
Output $4,927 $3,227 $184 $8,338 2.72%
Contribution to GDP $1,889 $1,740 $95 $3,724 2.59% Notes at the end of section.
Table A-18. General Aviation’s Contribution to Kentucky’s Economy, 2013 [Dollar Amounts in Millions]
Item Direct Indirect & Induced
Enabled Total Percent of
State Economy
Employment (Jobs)(1) 1,700 6,500 1,200 9,400 0.39%
Labor Income(2) $113 $301 $40 $454 0.41%
Output $312 $1,189 $142 $1,644 0.42%
Contribution to GDP $128 $543 $76 $747 0.41% Notes at the end of section.
Table A-19. General Aviation’s Contribution to Louisiana’s Economy, 2013 [Dollar Amounts in Millions]
Item Direct Indirect & Induced
Enabled Total Percent of
State Economy
Employment (Jobs)(1) 3,000 9,600 1,500 14,200 0.54%
Labor Income(2) $290 $504 $56 $850 0.63%
Output $679 $3,599 $205 $4,483 0.82%
Contribution to GDP $334 $1,621 $110 $2,065 0.81% Notes at the end of section.
Table A-20. General Aviation’s Contribution to Maine’s Economy, 2013 [Dollar Amounts in Millions]
Item Direct Indirect & Induced
Enabled Total Percent of
State Economy
Employment (Jobs)(1) 1,200 3,000 700 4,800 0.60%
Labor Income(2) $53 $130 $23 $206 0.58%
Output $212 $356 $70 $639 0.63%
Contribution to GDP $92 $201 $38 $330 0.60% Notes at the end of section.

Contribution of General Aviation to the US Economy in 2013
33
Table A-21. General Aviation’s Contribution to Maryland’s Economy, 2013 [Dollar Amounts in Millions]
Item Direct Indirect & Induced
Enabled Total Percent of
State Economy
Employment (Jobs)(1) 1,500 8,300 1,200 10,900 0.31%
Labor Income(2) $127 $492 $54 $673 0.32%
Output $347 $1,246 $148 $1,741 0.35%
Contribution to GDP $184 $761 $93 $1,039 0.30% Notes at the end of section.
Table A-22. General Aviation’s Contribution to Massachusetts’s Economy, 2013 [Dollar Amounts in Millions]
Item Direct Indirect & Induced Enabled Total
Percent of State
Economy
Employment (Jobs)(1) 3,000 13,700 1,900 18,600 0.43%
Labor Income(2) $339 $957 $98 $1,394 0.48%
Output $939 $2,268 $248 $3,455 0.50%
Contribution to GDP $469 $1,412 $158 $2,038 0.46% Notes at the end of section.
Table A-23. General Aviation’s Contribution to Michigan’s Economy, 2013 [Dollar Amounts in Millions]
Item Direct Indirect & Induced
Enabled Total Percent of
State Economy
Employment (Jobs)(1) 4,200 16,600 2,600 23,300 0.44%
Labor Income(2) $355 $848 $97 $1,299 0.48%
Output $1,043 $2,718 $301 $4,062 0.47%
Contribution to GDP $457 $1,367 $162 $1,986 0.46% Notes at the end of section.
Table A-24. General Aviation’s Contribution to Minnesota’s Economy, 2013 [Dollar Amounts in Millions]
Item Direct Indirect & Induced
Enabled Total Percent of
State Economy
Employment (Jobs)(1) 6,700 17,400 2,100 26,200 0.74%
Labor Income(2) $512 $977 $82 $1,572 0.81%
Output $2,010 $3,031 $263 $5,304 0.92%
Contribution to GDP $772 $1,676 $146 $2,594 0.83% Notes at the end of section.

Contribution of General Aviation to the US Economy in 2013
34
Table A-25. General Aviation’s Contribution to Mississippi’s Economy, 2013 [Dollar Amounts in Millions]
Item Direct Indirect & Induced
Enabled Total Percent of
State Economy
Employment (Jobs)(1) 3,300 5,900 1,300 10,500 0.68%
Labor Income(2) $129 $247 $44 $420 0.64%
Output $604 $1,074 $141 $1,818 0.80%
Contribution to GDP $153 $450 $73 $676 0.64% Notes at the end of section.
Table A-26. General Aviation’s Contribution to Missouri’s Economy, 2013 [Dollar Amounts in Millions]
Item Direct Indirect & Induced
Enabled Total Percent of
State Economy
Employment (Jobs)(1) 2,200 9,800 1,700 13,600 0.38%
Labor Income(2) $154 $494 $64 $712 0.40%
Output $451 $1,451 $193 $2,095 0.41%
Contribution to GDP $211 $765 $103 $1,079 0.39% Notes at the end of section.
Table A-27. General Aviation’s Contribution to Montana’s Economy, 2013 [Dollar Amounts in Millions]
Item Direct Indirect & Induced Enabled Total
Percent of State
Economy
Employment (Jobs)(1) 1,500 3,000 900 5,400 0.84%
Labor Income (2) $75 $120 $27 $222 0.84%
Output $268 $496 $85 $848 0.99%
Contribution to GDP $113 $212 $43 $368 0.83% Notes at the end of section.
Table A-28. General Aviation’s Contribution to Nebraska’s Economy, 2013 [Dollar Amounts in Millions]
Item Direct Indirect & Induced
Enabled Total Percent of
State Economy
Employment (Jobs)(1) 2,300 4,700 900 7,900 0.62%
Labor Income(2) $107 $228 $30 $365 0.55%
Output $429 $703 $104 $1,236 0.60%
Contribution to GDP $174 $374 $51 $599 0.55% Notes at the end of section.

Contribution of General Aviation to the US Economy in 2013
35
Table A-29. General Aviation’s Contribution to Nevada’s Economy, 2013 [Dollar Amounts in Millions]
Item Direct Indirect & Induced
Enabled Total Percent of
State Economy
Employment (Jobs)(1) 1,100 5,100 1,100 7,200 0.46%
Labor Income(2) $122 $271 $51 $444 0.58%
Output $351 $718 $127 $1,196 0.55%
Contribution to GDP $224 $456 $81 $761 0.58% Notes at the end of section.
Table A-30. General Aviation’s Contribution to New Hampshire’s Economy, 2013 [Dollar Amounts in Millions]
Item Direct Indirect & Induced
Enabled Total Percent of
State Economy
Employment (Jobs)(1) 700 2,600 400 3,700 0.44%
Labor Income(2) $55 $142 $15 $211 0.47%
Output $165 $379 $43 $588 0.48%
Contribution to GDP $83 $222 $26 $331 0.49% Notes at the end of section.
Table A-31 General Aviation’s Contribution to New Jersey’s Economy, 2013 [Dollar Amounts in Millions]
Item Direct Indirect & Induced
Enabled Total Percent of
State Economy
Employment (Jobs)(1) 1,800 12,600 1,800 16,200 0.32%
Labor Income(2) $162 $868 $96 $1,126 0.34%
Output $469 $2,418 $248 $3,135 0.37%
Contribution to GDP $259 $1,373 $150 $1,783 0.33% Notes at the end of section.
Table A-32. General Aviation’s to New Mexico’s Economy, 2013 [Dollar Amounts in Millions]
Item Direct Indirect & Induced
Enabled Total Percent of
State Economy
Employment (Jobs)(1) 1,600 3,800 800 6,300 0.58%
Labor Income(2) $122 $179 $26 $327 0.65%
Output $383 $657 $82 $1,121 0.74%
Contribution to GDP $205 $347 $44 $596 0.65% Notes at the end of section.

Contribution of General Aviation to the US Economy in 2013
36
Table A-33. General Aviation’s Contribution to New York’s Economy, 2013 [Dollar Amounts in Millions]
Item Direct Indirect & Induced
Enabled Total Percent of
State Economy
Employment (Jobs)(1) 5,200 29,300 3,300 37,800 0.33%
Labor Income(2) $504 $2,237 $208 $2,949 0.36%
Output $1,369 $5,175 $517 $7,061 0.37%
Contribution to GDP $662 $3,452 $352 $4,466 0.34% Notes at the end of section.
Table A-34. General Aviation’s Contribution to North Carolina’s Economy, 2013 [Dollar Amounts in Millions]
Item Direct Indirect & Induced Enabled Total
Percent of State
Economy
Employment (Jobs)(1) 6,100 17,700 2,700 26,500 0.49%
Labor Income(2) $428 $881 $97 $1,406 0.51%
Output $1,323 $2,778 $319 $4,419 0.51%
Contribution to GDP $616 $1,625 $178 $2,420 0.51% Notes at the end of section.
Table A-35. General Aviation’s Contribution to North Dakota’s Economy, 2013 [Dollar Amounts in Millions]
Item Direct Indirect & Induced
Enabled Total Percent of
State Economy
Employment (Jobs)(1) 2,700 2,500 600 5,800 0.99%
Labor Income(2) $79 $118 $17 $215 0.70%
Output $350 $446 $59 $856 0.88%
Contribution to GDP $141 $224 $31 $396 0.70% Notes at the end of section.
Table A-36. General Aviation’s Contribution to Ohio’s Economy, 2013 [Dollar Amounts in Millions]
Item Direct Indirect & Induced
Enabled Total Percent of
State Economy
Employment (Jobs)(1) 8,900 27,300 3,000 39,200 0.59%
Labor Income(2) $754 $1,406 $113 $2,272 0.65%
Output $2,270 $4,470 $361 $7,101 0.67%
Contribution to GDP $916 $2,313 $191 $3,420 0.61% Notes at the end of section.
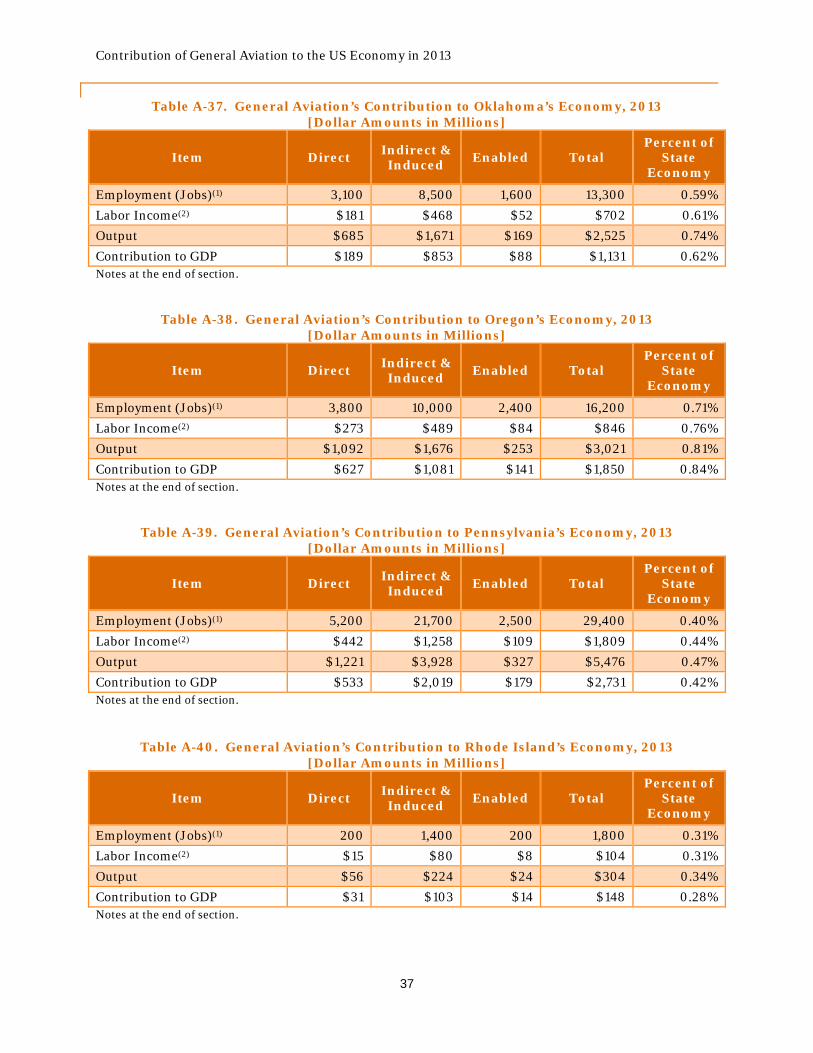
Contribution of General Aviation to the US Economy in 2013
37
Table A-37. General Aviation’s Contribution to Oklahoma’s Economy, 2013 [Dollar Amounts in Millions]
Item Direct Indirect & Induced
Enabled Total Percent of
State Economy
Employment (Jobs)(1) 3,100 8,500 1,600 13,300 0.59%
Labor Income(2) $181 $468 $52 $702 0.61%
Output $685 $1,671 $169 $2,525 0.74%
Contribution to GDP $189 $853 $88 $1,131 0.62% Notes at the end of section.
Table A-38. General Aviation’s Contribution to Oregon’s Economy, 2013 [Dollar Amounts in Millions]
Item Direct Indirect & Induced
Enabled Total Percent of
State Economy
Employment (Jobs)(1) 3,800 10,000 2,400 16,200 0.71%
Labor Income(2) $273 $489 $84 $846 0.76%
Output $1,092 $1,676 $253 $3,021 0.81%
Contribution to GDP $627 $1,081 $141 $1,850 0.84% Notes at the end of section.
Table A-39. General Aviation’s Contribution to Pennsylvania’s Economy, 2013 [Dollar Amounts in Millions]
Item Direct Indirect & Induced Enabled Total
Percent of State
Economy
Employment (Jobs)(1) 5,200 21,700 2,500 29,400 0.40%
Labor Income(2) $442 $1,258 $109 $1,809 0.44%
Output $1,221 $3,928 $327 $5,476 0.47%
Contribution to GDP $533 $2,019 $179 $2,731 0.42% Notes at the end of section.
Table A-40. General Aviation’s Contribution to Rhode Island’s Economy, 2013 [Dollar Amounts in Millions]
Item Direct Indirect & Induced
Enabled Total Percent of
State Economy
Employment (Jobs)(1) 200 1,400 200 1,800 0.31%
Labor Income(2) $15 $80 $8 $104 0.31%
Output $56 $224 $24 $304 0.34%
Contribution to GDP $31 $103 $14 $148 0.28% Notes at the end of section.

Contribution of General Aviation to the US Economy in 2013
38
Table A-41. General Aviation’s Contribution to South Carolina’s Economy, 2013 [Dollar Amounts in Millions]
Item Direct Indirect & Induced
Enabled Total Percent of
State Economy
Employment (Jobs)(1) 3,100 8,900 1,600 13,600 0.54%
Labor Income(2) $218 $391 $53 $662 0.57%
Output $696 $1,205 $170 $2,071 0.58%
Contribution to GDP $277 $630 $92 $999 0.54% Notes at the end of section.
Table A-42. General Aviation’s Contribution to South Dakota’s Economy, 2013 [Dollar Amounts in Millions]
Item Direct Indirect & Induced
Enabled Total Percent of
State Economy
Employment (Jobs)(1) 1,100 2,200 500 3,800 0.66%
Labor Income(2) $51 $95 $14 $161 0.58%
Output $192 $287 $49 $527 0.63%
Contribution to GDP $73 $153 $24 $250 0.54% Notes at the end of section.
Table A-43. General Aviation’s Contribution to Tennessee’s Economy, 2013 [Dollar Amounts in Millions]
Item Direct Indirect & Induced
Enabled Total Percent of
State Economy
Employment (Jobs)(1) 3,300 10,800 1,800 15,900 0.43%
Labor Income(2) $184 $553 $71 $808 0.43%
Output $738 $1,684 $218 $2,640 0.47%
Contribution to GDP $361 $905 $121 $1,388 0.48% Notes at the end of section.
Table A-44. General Aviation’s Contribution to Texas’s Economy, 2013 [Dollar Amounts in Millions]
Item Direct Indirect & Induced
Enabled Total Percent of
State Economy
Employment (Jobs)(1) 18,800 61,400 8,100 88,300 0.57%
Labor Income(2) $1,728 $3,889 $336 $5,953 0.67%
Output $4,975 $15,550 $1,072 $21,597 0.77%
Contribution to GDP $1,965 $7,715 $599 $10,279 0.67% Notes at the end of section.
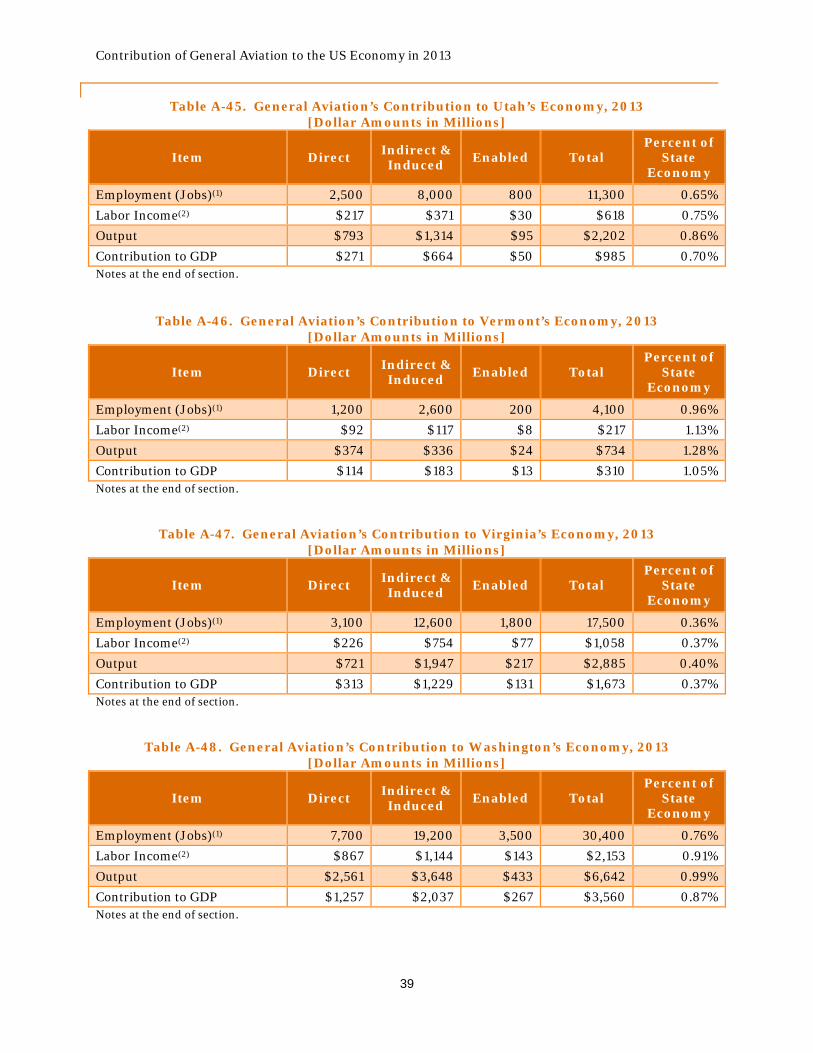
Contribution of General Aviation to the US Economy in 2013
39
Table A-45. General Aviation’s Contribution to Utah’s Economy, 2013 [Dollar Amounts in Millions]
Item Direct Indirect & Induced
Enabled Total Percent of
State Economy
Employment (Jobs)(1) 2,500 8,000 800 11,300 0.65%
Labor Income(2) $217 $371 $30 $618 0.75%
Output $793 $1,314 $95 $2,202 0.86%
Contribution to GDP $271 $664 $50 $985 0.70% Notes at the end of section.
Table A-46. General Aviation’s Contribution to Vermont’s Economy, 2013 [Dollar Amounts in Millions]
Item Direct Indirect & Induced Enabled Total
Percent of State
Economy
Employment (Jobs)(1) 1,200 2,600 200 4,100 0.96%
Labor Income(2) $92 $117 $8 $217 1.13%
Output $374 $336 $24 $734 1.28%
Contribution to GDP $114 $183 $13 $310 1.05% Notes at the end of section.
Table A-47. General Aviation’s Contribution to Virginia’s Economy, 2013 [Dollar Amounts in Millions]
Item Direct Indirect & Induced
Enabled Total Percent of
State Economy
Employment (Jobs)(1) 3,100 12,600 1,800 17,500 0.36%
Labor Income(2) $226 $754 $77 $1,058 0.37%
Output $721 $1,947 $217 $2,885 0.40%
Contribution to GDP $313 $1,229 $131 $1,673 0.37% Notes at the end of section.
Table A-48. General Aviation’s Contribution to Washington’s Economy, 2013 [Dollar Amounts in Millions]
Item Direct Indirect & Induced
Enabled Total Percent of
State Economy
Employment (Jobs)(1) 7,700 19,200 3,500 30,400 0.76%
Labor Income(2) $867 $1,144 $143 $2,153 0.91%
Output $2,561 $3,648 $433 $6,642 0.99%
Contribution to GDP $1,257 $2,037 $267 $3,560 0.87% Notes at the end of section.

Contribution of General Aviation to the US Economy in 2013
40
Table A-49. General Aviation’s Contribution to West Virginia’s Economy, 2013 [Dollar Amounts in Millions]
Item Direct Indirect & Induced
Enabled Total Percent of
State Economy
Employment (Jobs)(1) 1,600 3,200 400 5,300 0.57%
Labor Income(2) $95 $146 $15 $256 0.60%
Output $474 $521 $46 $1,041 0.75%
Contribution to GDP $111 $238 $24 $373 0.50% Notes at the end of section.
Table A-50. General Aviation’s Contribution to Wisconsin’s Economy, 2013 [Dollar Amounts in Millions]
Item Direct Indirect & Induced
Enabled Total Percent of
State Economy
Employment (Jobs)(1) 4,400 12,300 2,700 19,400 0.55%
Labor Income(2) $245 $600 $88 $933 0.52%
Output $830 $1,898 $295 $3,023 0.54%
Contribution to GDP $351 $988 $150 $1,489 0.53% Notes at the end of section.
Table A-51. General Aviation’s Contribution to Wyoming’s Economy, 2013 [Dollar Amounts in Millions]
Item Direct Indirect & Induced Enabled Total
Percent of State
Economy
Employment (Jobs)(1) 700 1,300 400 2,400 0.62%
Labor Income(2) $29 $70 $12 $111 0.54%
Output $104 $434 $41 $578 0.78%
Contribution to GDP $34 $209 $22 $265 0.58% Notes at the end of section. Source: PwC calculations using the IMPLAN modeling system. (1) Employment is defined as the number of direct, indirect, and induced payroll and self-employed jobs, including part-time jobs. (2) Labor income is defined as wages and salaries and benefits as well as proprietors’ income.

Contribution of General Aviation to the US Economy in 2013
41
Appendix B: Data Sources and Methodology
This appendix describes the data sources and methodology used to derive the results for the study.
I. Industry Data
A. Manufacturing of General Aviation Aircraft and Components
General Aviation Aircraft Manufacturing
PwC received data on sales of new general aviation aircraft manufactured in the United States from GAMA, along with employment data for general aviation aircraft manufacturers by location of the manufacturing facility. These data were collected by GAMA through a survey of its membership and exclude the manufacture and sale of commercial and military aircraft. These data were supplemented with information from Dun & Bradstreet and other publicly available data sources. The GAMA data cover piston airplanes, turboprop airplanes, business jets, and helicopters, but excludes certain non-member companies, manufacturers of experimental airplanes and aircraft kits and certain light-sport aircraft manufacturers. PwC developed a list of experimental and light-sport aircraft manufacturers and their principal business locations using the Experimental Aircraft Association (EAA)’s website, ByDanJohnson.com, and other sources. GAMA also provided a list of major general aviation aircraft manufacturers not included in their data. PwC then estimated sales and employment by location for each manufacturer using data from Dun & Bradstreet and other public sources.20 The estimates of employment and sales for experimental, light-sport, and certain non-GAMA aircraft manufacturers were combined with the GAMA data set to develop the state-level estimates of the employment and output in the aircraft manufacturing industry.
General Aviation Aircraft Component Manufacturing
As described above, GAMA collected data on employment by location from its member companies, including manufacturers of aircraft components and other suppliers to the general aviation industry.21 This data was mapped to NAICS industries based on the provided description of each facility and consultation with GAMA. Employment in major non-GAMA aircraft component manufacturers by industry and location was estimated using Dun & Bradstreet and other publicly available sources.
The manufacture of aircraft components by first-tier suppliers to the general aviation aircraft manufacturing industry generally was mapped to one of three main industries22:
20 For companies that manufacture aircraft for the military, PwC used publically available data (such as revenue shares from company annual reports) to adjust overall employment and sales to remove the portion attributable to military production. 21 The GAMA data also includes employment at repairs and maintenance facilities as well as employment for certain service providers. With the exception of complete factory rebuilds, this employment is estimated in the economic impact of general aviation aircraft operations and maintenance and is excluded from our estimates of the direct impact from general aviation aircraft and component manufacturing. 22 A small number of the facilities of first-tier suppliers were mapped to other manufacturing industries. For example, manufacture of rubber tires for general aviation aircraft is mapped to NAICS 326211 (Tire
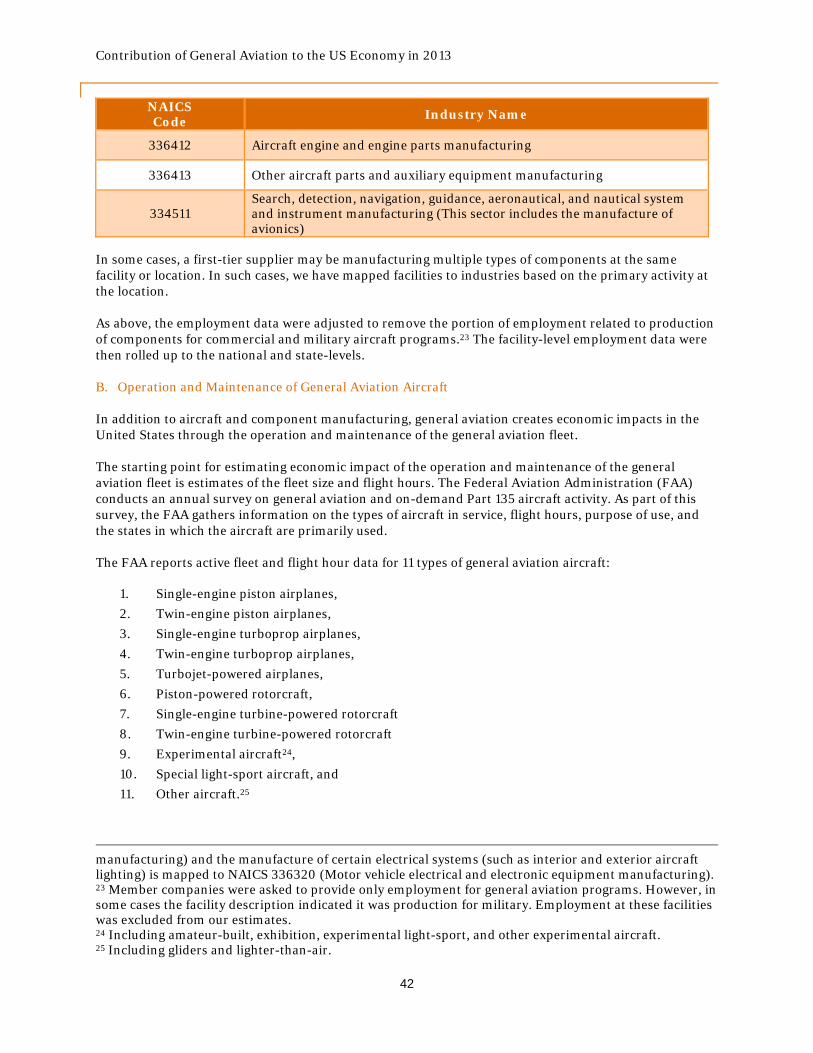
Contribution of General Aviation to the US Economy in 2013
42
NAICS Code Industry Name
336412 Aircraft engine and engine parts manufacturing
336413 Other aircraft parts and auxiliary equipment manufacturing
334511 Search, detection, navigation, guidance, aeronautical, and nautical system and instrument manufacturing (This sector includes the manufacture of avionics)
In some cases, a first-tier supplier may be manufacturing multiple types of components at the same facility or location. In such cases, we have mapped facilities to industries based on the primary activity at the location.
As above, the employment data were adjusted to remove the portion of employment related to production of components for commercial and military aircraft programs.23 The facility-level employment data were then rolled up to the national and state-levels.
B. Operation and Maintenance of General Aviation Aircraft
In addition to aircraft and component manufacturing, general aviation creates economic impacts in the United States through the operation and maintenance of the general aviation fleet.
The starting point for estimating economic impact of the operation and maintenance of the general aviation fleet is estimates of the fleet size and flight hours. The Federal Aviation Administration (FAA) conducts an annual survey on general aviation and on-demand Part 135 aircraft activity. As part of this survey, the FAA gathers information on the types of aircraft in service, flight hours, purpose of use, and the states in which the aircraft are primarily used.
The FAA reports active fleet and flight hour data for 11 types of general aviation aircraft:
1. Single-engine piston airplanes,
2. Twin-engine piston airplanes,
3. Single-engine turboprop airplanes,
4. Twin-engine turboprop airplanes,
5. Turbojet-powered airplanes,
6. Piston-powered rotorcraft,
7. Single-engine turbine-powered rotorcraft
8. Twin-engine turbine-powered rotorcraft
9. Experimental aircraft24,
10. Special light-sport aircraft, and
11. Other aircraft.25
manufacturing) and the manufacture of certain electrical systems (such as interior and exterior aircraft lighting) is mapped to NAICS 336320 (Motor vehicle electrical and electronic equipment manufacturing). 23 Member companies were asked to provide only employment for general aviation programs. However, in some cases the facility description indicated it was production for military. Employment at these facilities was excluded from our estimates. 24 Including amateur-built, exhibition, experimental light-sport, and other experimental aircraft. 25 Including gliders and lighter-than-air.

Contribution of General Aviation to the US Economy in 2013
43
The FAA also reports flight hours by reason for use. For general aviation, the majority of the flight hours (nearly 80 percent) fall into three use types: (1) personal, (2) business (with or without a paid crew), and (3) instructional. Other uses of general aviation aircraft include agricultural and forestry applications, aerial observation and sight-seeing, non-Part 135 air medical services, and other work uses. On-demand Part 135 uses include air taxis, air tours, and air medical services.
From the 2013 General Aviation and Part 135 Activity Survey we obtained data on (1) the active fleet by type of aircraft and primary reason for use, and (2) flight hours by type of aircraft and primary reason for use.26 These data were combined with estimates of the average operating costs by type of aircraft and use to estimate total expenditures on operation and maintenance of general aviation aircraft in 2013.
The primary source of data on aircraft operating costs was the Aircraft Cost Evaluator software published by Conklin & de Decker. Aircraft Cost Evaluator is a benchmarking tool used to compare the performance and operating costs of alternative aircraft models. The database includes information on the average variable cost per flight hour and the annual fixed costs for more than 500 aircraft models (see Table B-1, below).
Table B-1. Variable and Fixed Costs in Conklin & de Decker Variable Costs Per Hour Annual Fixed Costs
Fuel Captain’s salary (if any)
Fuel additives Co-pilot’s salary (if any)
Lubricants Flight attendant’s salary (if any)
Maintenance labor Crew benefits (if any)
Parts Typical hangar fees
Engine restoration Hull insurance
Thrust reverser allowance (jets only) Single limit liability insurance
Propeller allowance (turboprop and piston) Recurrent training
Major periodic maintenance Aircraft modernization
Auxiliary power unit allowance Navigational chart service
Landing and parking fees Refurbishing
Crew expenses (if any) Computerized maintenance program
Supplies Weather service Note: Not all aircraft or aircraft use types will have all of these costs. For more information and definitions for each type of operational cost see the sample report at: https://www.conklindd.com/p-33-aircraft-cost-evaluator.aspx.
Conklin & de Decker does not provide cost data for experimental and special light-sport aircraft.
For experimental aircraft, the Experimental Aircraft Association (EAA) provided a list of piston aircraft models that would have similar cost profiles to the majority of experimental aircraft types. These models were used as a proxy to determine the operating costs for experimental and special light-sport aircraft. Because detailed cost data were not available for gliders and lighter-than-air, they were excluded from our estimates.27 Such aircraft accounted for just 0.59 percent of all general aviation flight hours in 2013.
26 Tabulations from the 2013 General Aviation and Part 135 Activity Survey were completed in early December 2014, but has not yet been posted on the FAA’s website. 27 Based on data from the Balloon Federation of America (BFA), PwC estimates that total operating costs for light-than-air were between $35 million and $50 million nationwide.

Contribution of General Aviation to the US Economy in 2013
44
Using data on the number of active aircraft of each model from the FAA registry28 and JetNet LLC29, PwC developed weighted-average cost profiles for each type of aircraft. For each type of aircraft, PwC developed four cost profiles based on the primary use of the aircraft (as defined by the FAA reason for use categories). Broadly speaking these four cost profiles are as follows:
1. Personal – Operation of general aviation aircraft for personal/recreational reasons. It is assumed that personal flights do not have a paid crew and that personal use aircraft incur a tie-down fee rather than hangar charges.30
2. Business without a paid professional crew – Operation of general aviation aircraft for business transportation without a paid, professional flight crew.
3. Business with a paid professional crew – Operation of general aviation aircraft for business purposes with a paid, professional flight crew.
4. Other – Operation of general aviation aircraft for all other purposes with a paid professional pilot and no other crew.
Table B-2, below, provides a crosswalk between the FAA and Conklin & de Decker aircraft use categories.
28 The number of active registrations for the sampled single- and twin-engine piston airplanes was obtained by searching the FAA registry by make and model. The FAA registry can be accessed online at: http://registry.faa.gov/aircraftinquiry/acftref_inquiry.aspx. 29 JetNet’s Evolution Aerodex includes, among other things, estimates of the active fleet by make and model for turboprop and jet-powered airplanes and all types of rotorcraft. 30 The later assumption is conservative because many personal use aircraft are stored in hangars. We have assumed that personal use jets incur hangar fees, while all other personal use aircraft incur tie-down charges. We have estimated an average national tie-down fee of $1,500 per year for single-engine aircraft and $2,000 per year for twin-engine.

Contribution of General Aviation to the US Economy in 2013
45
Table B-2. Weighted-Average Cost Profiles by FAA Use Category
FAA Use Type PwC Cost Profile
Definition
General Aviation:
Personal Personal Conklin & de Decker business-use costs, remove pilot and crew costs, replace hangar costs with average tie-down
Business without a paid professional crew Business
without a paid crew
Conklin & de Decker business-use costs
Business with a paid professional crew Business with
a paid crew Conklin & de Decker corporate-use costs
Instructional Other Conklin & de Decker corporate-use costs with pilot but no other paid crew (pilot cost used as proxy for flight instructor)
Aerial application in agriculture Other Conklin & de Decker corporate-use costs with pilot but no other paid crew Aerial observation Other Conklin & de Decker corporate-use costs with pilot but no other paid crew Other aerial application Other Conklin & de Decker corporate-use costs with pilot but no other paid crew External load Other Conklin & de Decker corporate-use costs with pilot but no other paid crew Other work use Other Conklin & de Decker corporate-use costs with pilot but no other paid crew Sight-seeing Other Conklin & de Decker corporate-use costs with pilot but no other paid crew
Non-Part 135 air medical services Business with
a paid crew Conklin & de Decker corporate-use costs
Other Other Conklin & de Decker corporate-use costs with pilot but no other paid crew On-Demand Part 135 Use
Air taxi Business with
a paid crew Conklin & de Decker corporate-use costs
Air tours Other Conklin & de Decker corporate-use costs with pilot but no other paid crew
Air medical services Business with
a paid crew Conklin & de Decker corporate-use costs

Contribution of General Aviation to the US Economy in 2013
46
For each aircraft type and use category, weighted average variable costs were multiplied by the total number of flight hours from the FAA data. Similarly, annual fixed costs were multiplied by the FAA’s estimate of the active fleet. For these calculations, it was assumed that all experimental and light-sport aircraft are for personal use.
The results were aggregated to derive estimates of total operating expenditures by detailed cost type at the national level. Operating expenditures were allocated across the states based on data on take-offs and landings for general aviation flights from the FAA’s Terminal Area Forecast.
II. Quantifying General Aviation’s Indirect and Induced Economic Impacts
The initial round of output, income, and employment generated by general aviation leads to successive rounds of re-spending throughout its supply chain. The “multiplier” impact of general aviation activity is measured using input-output models developed by the IMPLAN Group, which are widely used by government, academics, and private-sector researchers. The IMPLAN model measures indirect impacts (attributable to an industry’s upstream supply chain) and induced impacts (attributable to expenditures from payrolls of employees in the industry and its supply chain).
Using the IMPLAN model, PwC separately quantified the indirect and induced impacts attributable to general aviation aircraft and component manufacturing and general aviation flight operations.
General Aviation Aircraft and Component Manufacturing
Based on general aviation aircraft manufacturing sales and employment data from GAMA, IMPLAN can estimate its indirect and induced impacts. The indirect impact falls on aircraft engines, parts, avionics, and non-component suppliers. We then estimated the indirect and induced impacts of the first-tier component manufacturers based on general aviation component manufacturing data from GAMA. Finally, we combined the two sets of estimates. So the final estimate of the total impact of general aviation aircraft and component manufacturing consists of
(1) Direct impact from general aviation aircraft manufacturing; (2) Indirect and induced impacts from non-component suppliers to general aviation aircraft
manufacturing; and (3) Direct, indirect, and induced impacts from first-tier general aviation component
manufacturing.
General Aviation Operations and Maintenance
For general aviation flight operations and maintenance, based on the cost profiles identified in Table B-1, we used the IMPLAN model to estimate the indirect impact attributable to flight crews and fixed-base operators or FBOs. The indirect impact estimate is calibrated to reflect the spending on first-tier suppliers (such as fuel costs and flight training). Income earned by flight crews and employees of FBOs and their supply chain was used in the IMPLAN model to estimate the induced impact attributable to general aviation flight operations and maintenance.
For this study, PwC customized IMPLAN input-output models for the national economy and each state to calculate general aviation’s indirect and induced economic impact in each study area in terms of employment, labor income, output, and GDP. The industry’s direct impacts on labor income and GDP are also estimated using the IMPLAN, based on the average labor income and GDP for the closest sectors in the model that encompass the general aviation industry.
Contribution of General Aviation to the US Economy in 2013
47
The state-level IMPLAN models do not capture indirect and induced effects that spill over state borders (“cross-state spillover effects”). Using the national-level IMPLAN model, we estimated the cross-state spillover effects and allocated them proportionally to each state.
III. General Aviation-Enabled Destination Visitor Expenditures
Travelers on general aviation flights provide additional economic benefits for the locations they visit in the form of spending on local goods and services. For example, a business traveler on a business aircraft may incur expenses for a hotel room, local meals, and miscellaneous expenditures. These traveler expenditures undergo a multiplier process similar to the manufacturing and operational impacts discussed above.
To estimate the economic impact resulting from general aviation traveler expenditures, PwC collected data on the general aviation operations at airports around the country.31 For each airport with general aviation traffic, we obtained data on the airport’s location (including city and state) and local and itinerant operations (defined as the sum of take-offs and landings). Local expenditures by visitors arriving on general aviation flights were estimated using a two-step process.
First, itinerant operations were divided by two to get the number of general aviation trips arriving at each airport. A June 2014 FAA study estimated that, in 2012, 40 percent of all itinerant general aviation flights carry overnight passengers and that the average number of passengers on such flights was approximately 2.84.32
Second, we obtained average government per diems for 2013 in each city or county with a general aviation airport in the US from the General Services Administration (GSA) and the Department of Defense.33 Separate per diems were obtained for meals and lodging. PwC used these per diems to estimate the total expenditure on meals and lodging in each locality assuming that travelers on general aviation flights stay an average of two nights.
Based on these assumptions, we estimate that nationwide general aviation visitor expenditures totaled nearly $5.5 billion in 2013. This estimate is likely to be conservative for a number of reasons. First, some business travelers have expenditures in excess of the maximum per diems allowed for federal employees. Second, travelers may make expenditures in addition to meals and lodging. Third, this approach only estimates visitor spending for overnight passengers, although travelers who arrive and depart on the same day also may incur expenses for meals and other items.
Estimates of general aviation destination visitor expenditures and state-level IMPLAN models were used to calculate the indirect and induced impacts associated with these expenditures.
31 Data on general aviation operations (defined to be the sum of take-offs and landings) was obtained from the FAA’s Terminal Area Forecast. 32 Unpublished methodology paper for FAA, “The Economic Impact of Civil Aviation on the U.S. Economy.” June 2014. 33 The US General Services Administration publishes per diems for federal government travelers within the continental United States. The per diems can be found at http://www.gsa.gov/portal/content/103168. Additionally, the Department of Defense publishes per diems for military and federal travelers in Alaska, Hawaii, US territories, and US possessions. Those per diems can be found at http://www.defensetravel.dod.mil/site/perdiemCalc.cfm.

Contribution of General Aviation to the US Economy in 2013
This document has been prepared pursuant to an engagement between PricewaterhouseCoopers LLP and its Client. As to all other parties, it is for general information purposes only, and should not be used as a substitute for consultation with professional advisors. © 2014 PricewaterhouseCoopers LLP. All rights reserved. PwC refers to the United States member firm, and may sometimes refer to the PwC network. Each member firm is a separate legal entity. Please see www.pwc.com/structure for further details.