CONTRA REPORT - ntrs.nasa.gov · For sale by the National Technical Information Service, ......
62
NASA F Q= *o N e U I CONTRA REPORT LOAN COPY: RETURN TO AWL TECHNICAL' LIBRAR' KI'RTLAND AFB, N. M. INVESTIGATION OF THERMAL FATIGUE I N FIBER COMPOSITE MATERIALS Abdel A. Fdvny and Thomas G. Czmningham Prepared by NORTH CAROLINA STATE UNIVSRSITY Raleigh, N.C. for LahgZey ResearchCenter NATIONAL AERONAUTICS AND SPACE ADMINISTRATION WASHINGTON, D. C. JULY 1976 https://ntrs.nasa.gov/search.jsp?R=19760020280 2019-03-18T20:24:05+00:00Z
Transcript of CONTRA REPORT - ntrs.nasa.gov · For sale by the National Technical Information Service, ......

N A S A
F
Q= *o N
e U
I
C O N T R A
R E P O R T
LOAN COPY: RETURN TO A W L TECHNICAL' LIBRAR'
KI'RTLAND AFB, N. M.
INVESTIGATION OF THERMAL FATIGUE I N FIBER COMPOSITE MATERIALS
Abdel A. Fdvny and Thomas G. Czmningham
Prepared by NORTH CAROLINA STATE UNIVSRSITY Raleigh, N.C. for LahgZey Research Center
N A T I O N A L A E R O N A U T I C S A N D S P A C E A D M I N I S T R A T I O N W A S H I N G T O N , D. C. JULY 1976
https://ntrs.nasa.gov/search.jsp?R=19760020280 2019-03-18T20:24:05+00:00Z

1. Report No. 3. Recipient's Catalog No. 2. Government Accession No.
NASA CR-2641 4. Title and Subtitle 5. Report Date
INVESTIGATION OF THERMAL FATIGUE I N FIBER COXPOSITE MATERIALS July 1976 6. Performing Organization Code
7. Author(s1 8. Performing Organization Report No.
Abdel A. Fahmy and Thomas G. Cunningham , 10. Work Unit No.
9. Performing Organization Name and Address
North Caro l ina S ta te Univers i ty Department of Materials Engineering Raleigh, North Carolina
~
2. Sponsoring Agency Name and Address ~ ~~~~ ~~~
National Aeronautics and Space Administration Islashington, D.C. 20546
I 505-02-31-01 11. Contract or Grant No.
NGR 34-002-180 - 13. Type of Report and Period Covered
Contractor Report 14. Sponsoring Agency Code
5. Supplementary Notes
Abstract by NASA Grant Honitor, L. A. Imig
Final Report 6. Abstract
Graphite-epoxy laminates were thermal ly cyc led to de te rmine the e f fec ts o f thermal
cyc le s on t ens i l e p rope r t i e s and t he rma l expans ion coe f f i c i en t s o f t he l amina te s . Three
12-p ly l amina te conf igura t ions , (un id i rec t iona l , [[&453]2]T, and [0/30/60/90/-60/-30]s)
were sub jec t ed t o up t o 5000 thermal cycles. The cumula t ive e f fec t o f the thermal cyc les
vas determined by destruct ive inspect ion (e lectron micrographs and tensi le tests) of
s amples a f t e r p rog res s ive ly l a rge r numbers of cycles.
Af t e r t he rma l cyc l ing , t he materials' t e n s i l e s t r e n g t h s , m o d u l i , and thermal expansion
c o e f f i c i e n t s were s ign i f i can t ly l ower t han fo r t he materials as f a b r i c a t e d . Most of the
deg rada t ion o f p rope r t i e s occu r red a f t e r on ly a f e w cycles .
The property degradat ion was a t t r ibu ted p r imar i ly to the p rogress ive deve lopment o f
matrix cracks whose l o c a t i o n s depended upon the l ayup o r i en ta t ion o f t he l amina te .
17. Key Words (Suggested by Author(s)) 18. Distribution Statement composi te mater ia ls graphite-epo-xy
mechanical propert ies thermal cycl ing
Unclassif ied, Unl imited
Subject Category 24 19. Security Classif. (of this report) 22. Price' 21. No. of Pages 20. Security Classif. (of this page)
Unclassif ied $4.25 60 Unclassif ied
For sale by the National Technical Information Service, Springfield, Virginia 221 61


TABLE OF CONTENTS
Page
LISTOFTABLES . . . . . . . . . . . . . . . . . . . . . . . . . . iv
LIST OF FIGURES . . . . . . . . . . . . . . . . . . . . . . . . . . . v
INTRODUCTION . . . . . . . . . . . . . . . . . . . . . . . . . . . 1
LITERATURE SURVEY . . . . . . . . . . . . . . . . . . . . . . . . . 2
Mechanical Properties . . . . . . . . . . . . . . . . . . . . . . 2 . Thermal Properties . . . . . . . . . . . . . . . . . . . . . . 3
THEORETICAL CONSIDERATIONS . . . . . . . . . . . . . . . . . . . . 7
Modulus o f E las t ic i ty . . . . . . . . . . . . . . . . . . . . . 7 Thermal Expansion . . . . . . . . . . . . . . . . . . . . . . . 13 Thermal Stresses . . . . . . . . . . . . . . . . . . . . . . . 15
EXPERIMENTAL PROCEDURE . . . . . . . . . . . . . . . . . . . . . . 17
Fabri cation . . . . . . . . . . . . . . . . . . . . . . . . . . 17 titi croscopi c Examination . . . . . . . . . . . . . . . . . . . . 19 Modulus of Elast i c i ty . . . . . . . . . . . . . . . . . . . . . 19 Determination o f Thermal Expansion . . . . . . . . . . . . . . 20 Ultimate Tensile Strength . . . . . . . . . . . . . . . . . . . 21 Scanning Electron Microscope . . . . . . . . . . . . . . . . . 21 Thermal Cycling . . . . . . . . . . . . . . . . . . . . . . . . 23
RESULTS AND DISCUSSION . . . . . . . . . . . . . . . . . . . . . . . 31
I\li croscopi c Examination . . . . . . . . . . . . . . . . . . . . 31 Modul us of Elast i c i ty . . . . . . . . . . . . . . . . . . . . . 43
Thermal Stresses . . . . . . . . . . . . . . . . . . . . . . . 49 Ultimate Tensile Strength . . . . . . . . . . . . . . . . . . . 49
Thermal Expansion . . . . . . . . . . . . . . . . . . . . . . . 46
Electron Microscope . . . . . . . . . . . . . . . . . . . . . . 50
CONCLUSIONS . . . . . . . . . . . . . . . . . . . . . . . . . . . . 55
REFERENCES
iii
57
" .... . . . " . ~ ""_ . . .........

- . . . - . . . . ... " . .- . . . . . . . . . .
LIST OF TABLES
Page
Table I. Modul us of Elasti ci ty of Graphi te-Epoxy Composite Materi a1 . . . . . . . . . . . . . . . . . . 45
Graphi te-Epoxy Composite Materi a1 . . . . . . . . . . 48
Composite Materi a1 . . . . . . . . . . . . . . . . . . 48
Table 11. Thermal Expansion Coefficients of
Table 111. U1 timate Tensile Strength of Graphite-Epoxy

LIST OF FIGURES
Page
1 .
2 . 3 . 4 . 5 . 6 . 7 . 8 . 9 .
10 . 1 1 .
12 .
13 . 14 . 15 .
16 . 17 .
"--.
18 .
Thermal Expansion o f Constrained and Non-Constrained Composite Materials . . . . . . . . . . . . . . . . . . . . 6
Hot Press . . . . . . . . . . . . . . . . . . . . . . . . . . . 18
Dilatometer . . . . . . . . . . . . . . . . . . . . . . . . . . 22 .
Hot End o f Cycling Device . . . . . . . . . . . . . . . . . . . 24 Cold End of Cycling Device . . . . . . . . . . . . . . . . . . 26 SampleHolder . . . . . . . . . . . . . . . . . . . . . . . . . 27
Thermal Cycling Device . . . . . . . . . . . . . . . . . . . . 29
Uncycled Unidirectional Sample . . . . . . . . . . . . . . . . 32 Uncycl ed [[+ 453]2]T Sample . . . . . . . . . . . . . . . . . . 33 Uncycled [O/30/60/90/-60/-30]s . . . . . . . . . . . . . . . . 34 Cycled [[&453]2]T Sample. Photomicrographs Taken
Cycled [[: 453]2]T Sample . Photomicrographs Taken A1 ong Along 0 Axis . . . . . . . . . . . . . . . . . . . . . . . 35
-FiberAxis . . . . . . . . . . . . . . . . . . . . . . . . . . 36
Cycled [0/30/60/90/-60/-30]s Sample . . . . . . . . . . . . . . 37 Cycled Unidirectional Sample . . . . . . . . . . . . . . . . . 38 Thermal Expansion vs Angle from Fiber Direction
in Unidirectional Sample . . . . . . . . . . . . . . . . . . 47 Fracture Surface of Unidirectional Sample. . . . . . . . . . . 51 Fracture Surface of [0/30/60/90/-60/-30]s Sample . . . . . . . 52 Fracture Surface of [[+ 453121~ Sample . . . . . . . . . . . . 54
V

INTRODUCTION
Only recently have graphite fibers been used to reinforce
plastics for ablative and structural composite applications. The
potential o f graphite as a high strength, high modulus reinforcing
material became evident when graphite whiskers were produced with a
tensile strength of 20 x 10 W m and Young’s modulus values higher
than 70 x 10” N/m2 (1 ).
9 2
Graphite fiber-reinforced composites have been widely used
since 1959 in ablative applications. It was not until six years
i later, in 1965, with the introduct
graphite fiber that graphi te-fi ber
for structural application. Since
evaluation of these composites hav
rapid rate (1 ) .
on of high modulus, high strength
composites were seriously considered
that time, development and
e progressed at an increasingly
This investigation was initiated to further evaluate the
graphite-epoxy composite material under conditions o f thermal fat
and to make possible the production of better fiber composites
through a better understanding of the influence of fiber orientat
and lamination sequence on their thermal fatigue performance.
igue
ion

LITERATURE SURVEY
Mechanical Propert ies
To e v a l u a t e t h e e f f e c t o f t h e r m a l c y c l i n g on t h e e l a s t i c and
s t r e n g t h p r o p e r t i e s o f a l am ina ted compos i te , t he e las t i c p roper t i es
and the thermal expans ion p roper t ies o f a un id i rec t iona l compos i te
o f t h e same m a t e r i a l and propor t ions must be known. I n a d d i t i o n ,
t h e c o n f i g u r a t i o n s o f t h e l a m i n a t e and s t r u c t u r a l d e f e c t s must be
known a
I n o r d e r t o s t u d y a laminated composite, i t i s necessary to
cons ider a u n i d i r e c t i o n a l m a t e r i a l composed o f a p a r a l l e l s e t o f
c y l i n d r i c a l f i b e r s embedded i n a homogeneous m a t r i x m a t e r i a l . The
e l a s t i c c o n s t a n t s o f t h i s m a t e r i a l a r e e v a l u a t e d as a f u n c t i o n o f t h e
average stress and s t r a i n imposed on t h e m a t e r i a l . I n t h e most
general case, t h i s m a t e r i a l may be or tho t rop ic hav ing n ine independent
e l a s t i c c o n s t a n t s . If a mater ia l such as con t inuous g raph i te f i be r
i s used, t h e i n d i v i d u a l l a y e r s have a m u l t i p l i c i t y o f f i l a m e n t s
through the th ickness. A c r o s s s e c t i o n p p e r p e n d i c u l a r t o t h e f i b e r ,
o f t h e m a t e r i a l w o u l d show a random d i s t r i b u t i o n o f f i b e r c r o s s - s e c t i o n s .
Th is wou ld i nd i ca te t ha t t he t ransve rse p lane wou ld be a p l a n e o f
i s o t r o p y and tha t the compos i te wou ld be t r e a t e d as a t ransve rse l y
i so t rop i c compos i te w i th on l y f i ve i ndependen t e las t i c cons tan ts .
For an ex i s t i ng ma te r ia l , t he f i ve i ndependen t cons tan ts can be
eva lua ted by d i rec t expe r imen ta l methods. Hill ( 2 ) developed
s t r u c t u r a l r e l a t i o n s t h a t s i m p l i f i e d t h e p r o b l e m s a s s o c i a t e d w i t h
determining these modul i . He was a b l e t o show t h e i n t e r r e l a t i o n o f
t h e a x i a l Young's modulus, Poisson's r a t i o , and t h e p l a n e s t r a i n
2

- . .
b u l k modulus. By knowing these three, the other two effective composite
properties can be determined.
The experimental d a t a generated for fiber composites are
usually directed toward their ultimate use in the form o f shells or
laminated plate. In this case only four of the five independent
elastic constants are generally considered. These are the a x i a l and
transverse Young's modulus, Poisson's r a t i o , and the axial shear
modul us
Once the effective elastic constants of the unidirectional fiber
composite are known, the material may be viewed as a homogeneous
orthotropic materi a1 a Then for laminates formed from layers of
unidirectional composites, i t i s reasonable t o t rea t each layer as an
orthotropic continuum, and t o study the laminate using layered plate
theory. This theor) i s in widespread use for a1 1 types of composites,
and has been shown t o be a suitable start ing p o i n t fo r structural
analysis ( 3 ) . The constants i n this relationship are evaluated by
using the stress-strain relationship for i n d i v i d u a l plys or layers
and the Kirchoff Hypothesis for t h i n plates ( 4 ) .
Thermal Properties
Evaluation o f the response o f composite materials t o temperature
changes i s important no t only for applicat.ions i n v o l v i n g such
temperature changes i n service, b u t also for fabrication consideration
such as the choice of the cure temperature for fiber reinforced
plastics. Even though much work has been done on e la s t i c behavior
of unidirectional and 1 aminated composites (5 ) , l i t t l e has been
3

repo r ted on the i r thermal behav io r . Th is behav io r may i n f l u e n c e
d imens iona l s tab i l i t y , s t reng th , and mechan ica l compa t ib i l i t y i n
s t ructura l assembl ies.
The the rma l expans ion coe f f i c i en t o f an un id i rec t iona l compos i te
i n t h e l o n g i t u d i n a l d i r e c t i o n can be p red ic ted f rom the f o l l ow ing
formul a which i s based on equi 1 i br ium and compati b i !i t y considerat ions (4)..
t + ’ d E ) f f
where C( and af a r e t h e e x p a n s i o n c o e f f i c i e n t s o f t h e m a t r i x and
f i b e r , r e s p e c t i v e l y , Em and Ef a r e t h e i r Young’s moduli , and vm and
v f a r e t h e i r volume f rac t ions . Th is shows t h a t t h e l o n g i t u d i n a l
c o e f f i c i e n t i s a weighted average o f t h e volume f r a c t i o n and t e n s i l e
modulus o f t h e f i b e r and ma t r i x . Th i s wou ld i nd i ca te t ha t t he
l ong i tud ina l coe f f i c i en t o f t he compos i te wou ld be almost the same
as t h a t o f t h e g r a p h i t e i n a graphi te-epoxy system s ince the tensi le
modulus o f t h e f i b e r i s two to t h ree o rde rs o f magn i tude g rea te r t han
t h a t -of t h e m a t r i x , I n t h e ‘ t r a n s v e r s e d i r e c t i o n , t h e c o n s t i w e n t s
p l a y more p ropor t i ona te ro les . However, i t s c a l c u l a t i o n i n v o l v e s
the t ransve rse p roper t i es o f t he f i be rs , wh ich a t t he p resen t t ime
a re no t known w i t h c e r t a i n t y (6).
m
Even though i t i s p o s s i b l e t o c a l c u l a t e t h e t h e r m a l c o e f f i c i e n t s
o f an u n i d i r e c t i o n a l f i b e r c o m p o s i t e assuming p u r e l y e l a s t i c b e h a v i o r ,
t h e t r a n s v e r s e c o e f f i c i e n t i s so s e n s i t i v e t o t h e a c t u a l shape an.d
d i s t r i b u t i o n o f t h e f i b e r s t h a t t h e c a l c u l a t e d v a l u e s a r e n o t v e r y
re1 i ab1 e. Thus, i n ca l cu la t i ng t he i n -p lane t he rma l expans ion
c o e f f i c i e n t i n any d i r e c t i o n o f a laminated panel , i t i s a d v i s a b l e t o
ob ta in aL and aT exper imenta l l y .
4

A s imp le ru le o f m ix tu res shou ld g ive the thermal expans ion
c o e f f i c i e n t s o f a composi te mater ia l prov ided that there i s no plane
i n t e r a c t i o n ; However, d i f f e r e n c e s i n t h e r m a l e x p a n s i v i t i e s o f
i n d i v i d u a l phases g i v e r i s e t o a s t a t e o f m i c rost resses between
phases (6). Fahmy e t a1 (6) demonstrated the existence of these
thermal ly induced s t resses in g lass-meta l composi tes by the use o f
x-rays.
In laminated compos i te mater ia ls , s t ress s ta tes a re genera l l y
s e t up i n each l a y e r when the temperature changes s ince t he l aye r
i s n o t f r e e t o expand by an amount aL i n t h e l o n g i t u d i n a l and at
i n t h e t r a n s v e r s e d i r e c t i o n s . The 1 ayers expand by al and a2 o f
the composite i n t h e d i r e c t i o n o f t h e 1 and 2 a x i s as i 11 us t ra ted
i n F i g u r e 1 .
I
Doner and Novak ( 7 ) showed tha t t rans lamina c racks found in
graphite-epoxy laminates were the resu l t o f t he rma l s t resses i nduced
as the composite cooled from a re la t i ve l y s t ra in - f ree cu r ing t empera tu re
t o room temperature Further work by Spain (8 ) i n d i c a t e s t h a t t h e
s e v e r i t y o f c r a c k i n g i s d i r e c t l y r e l a t e d t o t h e amount o f res in
shr inkage dur ing cur ing. Spain (8) a lso found tha t even if the
composites were fabricated i n a s t ress f ree s ta te , tha t subsequent
thermal cycl ing usual ly produced microcracks.
5

I11111 1.1.111111.1111.1111.1111 II I I
No Expansion
11 ~~ -~
Free Expansion
Constrained Expansion
Figure 1. Thermal Expansion of Constrained and Non-Constrained Composite Materi a1 s
6

THEORETICAL CONSIDERATION
Modul us o f E l as ti c i t y
For a s i n g l e p l y f i b e r c o m p o s i t e , t h e modulus o f e l a s t i c i t y ,
E , when t h e u n i a x i a l t e n s i l e a x i s i s a l o n g t h e f i b e r d i r e c t i o n i s g i v e n
by the eqy'ation:
where:. E = L
Ef -
V f =
( b V f ) =
-
Em =
1 ong i t ud i na l modul us
f i b e r modul us
m a t r i x modulus
vo l ume f r a c t i o n f i b e r
volume f r a c t i o n m a t r i x
Th is i s ob ta ined f rom the s t ress equa t ions
acAc = amA, + CfA f
ac = amVm + O f V f
where A represents area, V represents volume f r a c t i o n , and uc, a,, af
represent s t ress in the compos i te , mat r i x and f i be r . S ince no s l ippage
i s a l l o w e d a t t h e i n t e r f a c e , t h e s t r a i n e x p e r i e n c e d b y t h e c o m p o s i t e
i s e q u a l t o t h e f i b e r s t r a i n and a l so t he ma t r i x s t ra in .
where i s t h e composi te s t ra in , E i s t h e m a t r i x s t r a i n , and q
i s t h e f i b e r s t r a i n . m
7

Rewr i t ing equat ion 3:
E = EfVf + E,(l-Vf) L
When t h e u n i d i r e c t i o n a l t e n s i l e a x i s i s normal t o t h e f i b e r d i r e c t i o n ,
E i s g i v e n b y :
This equat ion i s based on s i m p l i f y i n g c o n s i d e r a t i o n s . The ac tua l
equa t ion i s ob ta ined by t he s imp le case where:
U E = Lm vm - Tm.
E = 'Tf uL f v f -
U
Lm " Em Em
Ef E f T f "
€ L f - - OLf - - v f r - Ef f
'Tf
where :
E = t r a n s v e r s e s t r a i n i n t h e m a t r i x Tm
'Lm - - l o n g i t u d i n a l s t r a i n i n t h e m a t r i x
F = t r a n s v e r s e s t r a i n i n t h e f i b e r T f
ELf = l o n g i t u d i n a l s t r a i n i n f i b e r
(9 1
8

w = P o i s s o n ' s r a t i o ( m a t r i x )
u = P o i s s o n ' s r a t i o ( f i b e r )
m
f
w h i c h a r e f i b e r and m a t r i x s t r a i n s i n t h e l o n g i t u d i n a l ( L ) and
t ransverse ( T ) d i rec t i ons . Compa t ib i l i t y cond i t i ons requ i re :
'Lrn - € L f -
and equi 1 i b r i urn c o n d i t i o n s d i c t a t e t h a t :
- 'Tm - 9f = " r
'LmAm + ULfAf = 0
I f t h e r e s u l t a n t s t r a i n i n t h e T d i r e c t i o n i s 7,
TA = €TmArn + 'T;fAf
So l v ing for uLm
U - -
Lm
so 1 v i ng f o r ETA
(13)
(14)
(16)
9
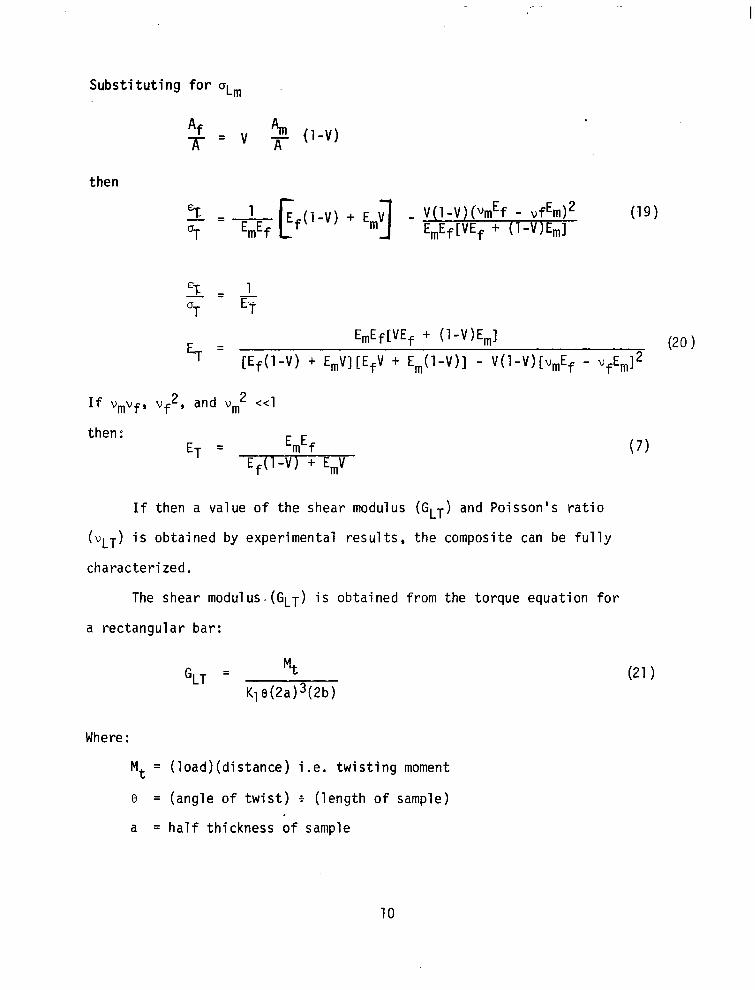
S u b s t i t u t i n g f o r C J L ~
Af - Am ,( 1-v) A
then
then: ET = EmEf
E f ( l -V ) + E,V
I f then a value o f t he shear modulus (GLT) and P o i s s o n ' s r a t i o
(vLT) i s obtained by exper imental resul ts, the composi te can be f u l l y
charac ter ized .
The shear modulus. (GLT) i s obta ined f rom the torque equat ion for
a rec tangu lar bar :
Where :
Mt = ( l o a d ) ( d i s t a n c e ) i . e . t w i s t i n g moment
0 = ( a n g l e o f t w i s t ) f ( l eng th o f samp le )
a = h a l f t h i c k n e s s o f sample
10

b = ha1 f w i d t h o f sample
K1 = constant obta ined f rom b/a
P o i s s o n ' s r a t i o can be ca l cu la ted f rom the resu l t s ob ta ined when
s t r a i n , E , i s measured i n bo th t he l ong i tud ina l and t ransve rse d i rec t i ons
fo r the un iax ia l compos i te . Thus:
It also ho lds t ha t :
'TL = ET 'LT EL
I n d e r i v i n g s t r e s s - s t r a i n r e l a t i o n s h i p s f o r a s i n g l e l a y e r o f a
laminated composite, i t i s assumed tha t t he s t ress no rma l t o t he 1 ayer
i s n e g l i g i b l e . Thus i t r e s u l t s i n a p lane s t ress s ta te ,
The s t r e s s - s t r a i n r e l a t i o n s h i p f o r a lamina i n t h e m a t r i x f o r m i s :
Where t h e components o f t h e s t i f f n e s s m a t r i x m a t r i x , Q, are:
Qll - - EL
-'LT'TL
Q22
Q12
- - ET
= VLTEL -'LT'TL
1 -VLTVTL
11

When t h e s t r e s s e s a r e i n an arb i t ra ry coord ina te sys tem (x , y, z ) ,
t h e f o l l o w i n g m a t r i x i s o b t a i n e d :
Where t h e components o f t h e s t i f f n e s s m a t r i x , 0, which are now r e f e r r e d
t o an a r b i t r a r y s e t o f axes, are given by: - Qll - Qllcos4e + Z(Q12 + 2Q66)s in 2 8cos28 + Q22sin 4 8
Q,, = Qllsin 4 8 + Z(Q12 + 2Q66)Siil 2 2 8 C O S 8 + Q ~ ~ C O S 4 8 -
- Q~~ = ( Q ~ , t Q,~ - 4Q66)sin 2 ecos2e -+ Q12(s in 4 e + COS 4 e )
Q~~ = ( Q ~ ~ + Q,, - ZQ,, - ~ ~ ~ ~ ) s i n 2 e c o s z e t Q66(s in 4 e t cos4e) I
From these equat ions i t i s p o s s i b l e t o c a l c u l a t e qij f o r each l a y e r o f
the composite. -
The laminate cons t i tu t i ve equat ions a re then used to de termine
t h e e l a s t i c modulus o f a mu1 t i l a y e r composite. Thus,
Where : n=N
h = th ickness o f one l a y e r P
72

N = t o t a l number o f l a y e r s
F = f o r c e
The modulus o f e l a s t i c i t y can be obtained f rom the equat ion:
where :
h = t o t a l t h i c k n e s s o f composite
The rrnal Expansi on
It is poss ib le t o ca l cu la te t he i n -p lane t he rma l expans ion
c o e f f i c i e n t i n any d i r e c t i o n f o r any laminated pane l o f p roper
laminat ion sequence ( i .e . such that no coupl ing ex is ts through the
th ickness o f the laminate . For each 1 ayer above the mid-pl ane , the re
i s an i d e n t i c a l l a y e r i n p r o p e r t i e s and o r i e n t a t i o n l o c a t e d a t t h e
same distance below the mid-plane.) once t h e e l a s t i c p r o p e r t i e s and
the l ong i tud ina l (aL) and t ransverse ( a T ) thermal expansion coeff ic ients
are known.
Acco rd ing t o re fe rence 4
Where :
R1 = J l h + J2H1
RE = Jlh - JZH,
1 3
I

*11
*22
= U lh + U2H1 + U3H2
= U,h - U2H1 + U3H2
A12 = U4h - U3H2
J1 = (Ul + U4)W1 + 2U2W2
J 2 = (U2W1 + 2W2)(U1 f 2U3 - U4)
w1 = 1 / 2 ( c ( ~ + c(T)
W2 = 1/4(aL - "T)
H1 - -f n= l hnC0S2On N
n= l H2 = hncos4en
where h i s t h e 1 aminate thickness, N i s t h e number o f 1 dyers 8, i s
the angle between the 1 a x i s ( d i r e c t i o n i n .which expansion coeff ic ient
i s ca l cu la ted ) and t h e f i b e r s i n t h e n t h 1 ayer and hn i s the th ickness
o f t h e n t h l a y e r .
I al - a2 - - -
u1 + u4
14

Thermal Stresses
Assuming a temperature change o f one degree centigrade, the thermal
expansion o f " f r e e " s t r a i n o f t h e i n d i v i d u a l 1 ayer w i 11 be E~ = ai- and
= a,. i n t h e l o n g i t u d i n a l and t r a n s v e r s e d i r e c t i o n s o f t h a t l a y e r . ET The t h e r m a l e x p a n s i o n s t r a i n o f t h e l a y e r o r p l y i n t h e 1 and 2 d i r e c t i o n s
i s g i v e n b y :
€zp = €,-sin 8 + E ~ C O S e 2 2
€1 2p = (EL - E T )s in2e
s ince t he l aye rs expand l i k e t h e r e s t o f the composite by an amount
€1 c = al and = a2 i n t h e 1 and 2 d i r e c t i ons. The di f ference between
the " f ree" and cons t ra ined expans ion i s a s t r a i n t h a t i s a s s o c i a t e d w i t h
a s t ress . The s t r e s s a s s o c i a t e d w i t h t h e s e s t r a i n s i s :
where: - Q,, = U1 + U2cos28 + U3cos4e - Q,, = U4 - U3cos4e
What i s a c t u a l l y needed i s t o o b t a i n t h e s t r e s s e s i n t h e i n d i v i d u a l l a y e r s
r e f e r r e d t o t h e l o n g i t u d i n a l and transverseaxes o f t h e l a y e r r a t h e r t h a n
t h e 1 , 2 axes.
15

Thus the t rans format ion equat ions : 2 2 = o cos e + o s i n e + u s in20
a,. = u cos 2 8 + a2s in 2 e - ul2sin2o
aL 1 2 12
‘LT = 1/2(u2 - o,)sin2e + a,2cos2e
1
16

EXPtRIMENTAL PROCEDURE
Fabrication
Samples were made from epoxy pre-impregnated PAN-based graphite
sheets obtained from Monsanto. These sheets consisted of Monsanto resin
type 4617/mPDA w i t h a 55 w/o f iber . The sheets , or iginal ly 0.61111 x 1.22m,
were cut into 15.2cm squares. T h e squares were cut so that the f iber axis
was a t 0' or 90' w i t h the edge of the square for the unidirectional and
the [ [+ 453]2]T samples and a t Oo, 30°, and 60' for the [O/30/60/90/-60/-30]s
sampl e.
Twelve-layer samples were made fo r each of the following
orientation sequences:
Layer Number 1 2 3 4 5 6 7 8 9 10 11 12 m QJ
2 1 0 0 0 0 0 0 0 0 0 0 0 0 .r- o?
7 4 1 +45 -45 +45 -45 t45 -45 t45 -45 t45 -45 +45 -45
4'111 0 30 60 90 -60 -30 -30 -60 90 60 30 0 CJl
The f i r s t layup w i I1 be referred to as unidirectional , the second as
[[+ 453]2]T and the third as [0/30/60/90/-60/-30]s. The layers were then
placed in 'a mold f i t t e d with a die and punch. The mold was then placed
between the platens o f the hot press where a pressure of 345 kN/m and a
temperature of 353 K were applied (Figure 2 ) . A t the end of two hours the
pressure was increased to 690 kN/m and the temperature was increased t o
2
2
423 K. The samples were then cured an additional two hours. After the
samples were properly cured the hot press was turned off and the samples were
cooled t o room temperature by water flowing throuah the platens.
Once the samples were removed from the mold, they were checked f o r
any visible flaws and the thickness was measured. The f inal sample measured
15.2cm x 15.2cm x 0.20cm.
17

4
Figure 2. Hot Press
18

Microscopic Examination
To prevent time being wasted by tes t ing poor samples, each sample
was examined microscopically. Two cross sections of each sample, cut
at right angles t o one another, were examined under the microscope. The
purpose of the examination was to ascertain the fiber orientation i n each
layer, t o check thickness, and parallelism of the individual layers as
we1 1 as the uniformity of fiber distribution and general integri ty of
the composite.
Once the samples were cycled, they were again examined under the
microscope t o determine w h a t changes i f any occurred during the thermal
cycl i ng .
Modul us of E l as t i c i t y
The proposed work in mechanical properties consisted of measuring
the e las t ic modulus in the O o direction of the three different composite
configurations
of the material
the longi tudi na
Later i t was decided t h a t a complete characterization
was needed. This characterization required measuring
modulus ( G L T ) , and Po
From these values E L ,
with any construction
results.
1 modulus ( E L ) , the transverse modulus ( E T
isson's ratiD ( w L T ) o f the unidirect
the e las t ic modulus of
can be calculated and compared with E ~ , G ~ ~ y 'LT
) , the shear
ional sample.
any compos i te
experimantal
Specimens , approximately 1.27cm x 7.6cm x O.ZOcm, were cut from the
samples. To insure t h a t an even load was applied to the specimens and
that the specimens were not damaged by the jaws of the testing machine,
a1 uminum strips were glued to each si de of the sample w i t h epoxy a t b o t h
ends.
19

All samples were loaded i n tension w i t h the load and s t ra in be ing
recorded. The accumulated s t ra ins were recorded by the use o f SR-4
st rain gages and a s t ra in gage recorder, b o t h produced by BLH Electronics.
The s t ra in gages were attached t o the unidirectional specimens so t h a t
each gage was a t Oo w i t h the fiber ax is t o measure E ~ , and a t 90' t o
measure E ~ . Two measurements were taken on the [[+ 45312]~ sample, one
with the strain gage oriented i n ei ther the +45', or -45 direction and
the other along the 0' axis. The applied load was read directly from the
Tinus-Olsen Testing Machine.
0
Due t o the small loads required t o break the unidirectional 90'
specimens, the modulus of e las t ic i ty was obtained from a four point
f lexure test . The s t ra in was obtained from strain gages a n d the applied
load from loads placed on the testing apparatus.
Poisson's r a t i o was calculated using a dual s t ra in gage t h a t
was attached t o the unidirectional specimens. The shear modul us was
measurGd using the method of torque applied t o a rectangular ba r .
Determination of Thermal Expansion
The coefficient of thermal expansion was determined for each panel
with different construction. One specimen was cut from the LC+ - 453]2]T
and the [0/30/60/90/-60/-30]s panel since the thermal expansion should
be the same in all directions in these two panels ( 6 ) . The specimens
from the unidirectional samples were taken such t h a t the following
angles were made with the unidirectional axis:
Angle i n Degrees 0, 15 30, 45 , 60, 75, and 90
20

The ends of the specimens were ground f la t , para l le l and
perpendicular t o the specimen axis:
Each specimen was slowly heated i n a dilatometer, Figure 3 ,
from room temperature t o 453K a t the approximate rate of 1" Vminute.
The specimens were then cooled t o room temperature by cutting off the
heating current. While the f i rs t heat ing and cooling curves showed
hysteresis, further heating followed very closely the cooling curve
and the bchavior became essenti a1 l y reversible. The thermal expansion
coefficient was determined from the cooling cycle and was measured
between 323K and 423K.
Once the samples were cycled, each was aga in measured for thermal
expansion and compared t o the uncycled values.
U 1 timate Tensi le Strength
Samples used to calculate e l as t ic modulus were loaded until
fracture to obtain the ultimate tensile strength.
Scanni ng Electron Microscope
The fracture surfaces o f the ultimate tensile test samples were
observed using the electron microscope. The samples were mounted i n
an a1 uminum spl i t-ring holder. Even t h o u g h the samples had an epoxy
surface, there was enough exposed graphite touching the holder t o a l l ow
electr ical conduction, therefo're eliminating the need t o carbon coat
the sample.
The entire surface of the fracture was observed and photo-
micrographs were taken of areas-of speci a1 interest .
21

Figure 3. D i latometer
22

Thermal Cycl i ng
Since i't was proposed t h d t t s s t samples be cycled i n the range
223K t o 423K for as many as 10,000 cycles and without thermal shock,
an automatic cycling device had t o be devel oped.
The f i r s t s t e p i n developing the cycling device was t o determine
how t o obtain the desired temperature. After some experimentation i t
was determined t h a t resistance heating and liquid nitrogen flowing
t h r o u g h a copper coil would give the desired temperature.
Since moisture condensation would be a problem if the samples
were cycled i n a i r , i t was decided t h a t the samples would ei ther be cycled
i n a vacuum or i n a dry atmosphere.
The requirement t h a t the sample be cycled in a control 1 ed
atmosphere or vacuum along with the selected type of heating and cooling
methods dictated t h a t the cycling chamber be a closed system with an
external method of moving the sample from the ho t t o cold environment.
A 5-cm diameter by 1.22-m long piece of boro-silicate glass
tubing was selected as the cycling chamber. The h o t end was made by
wrapping chrome1 wire around the tube and topping i t with Saverisn Cement
and asbestos tape. By connecting the wire t o a variable transformer,
the temperature a t the h o t end could be varied from room temperature
t o 523K (Figure 4 ) .
The cold end of the chamber was made by coiling 9m of 9.64-cm OU
copper t u b i n g so t h a t i t j u s t f i t t e d around the glass tube. A t a n k
23

1 F igure 4. Ho t End of Cycl ing Device
24

of liquid nitrogen was connected t o the t u b i n g and the valve was adjusted
so t h a t only nitrogen gas would flow (Figure 5 ) .
The distance between the hot end and cold end was approximately
0.61 m . This distance allowed the middle of the chamber t o remain a t .
room temperature and reduced the chance o f thermal shock i n the sample.
The ends of the tube were f i t t e d w i t h two-hole rubber stoppers. One
hole on each end was used for a thermocouple and the other for an
out le t pipe t h a t was connected t o a vacuum pump. The tube was then
tested and i t was found t h a t the desired temperatures (223K t o 423K)
could be maintained.
Since the chamber was a closed system, a method o f cycling the
samples without disturbing the vacuum h a d t o be developed. I t was
determined t h a t if the sample holder were made of s t e e l , t h a t a magnet
outside the tube could move the sample holder from one end t o the other.
I t was found t h a t a solid steel holder was t o o heavy t o be moved easily
by the magnet and i t was easy t o accidentally break the glass tube w i t h
such a holder. The next sample holder was madr of Teflon with grooves
cut i n t o i t t o car ry eight 1.27cm x 7.6cm x 0.20cm samples. A piece o f
steel was inserted into the bottom of the holder. Too much d r a g was
developed by the Teflon being dragged against the glass tube causing
the sample holder t o move in jerks or even become stuck. The final
design consisted o f placing the Teflon holder i n a piece of 4.76-cm
diameter glass tubing t h a t had been longitudinally cut i n half . This
holder allowed sliding contract between two glass surfaces (Figure 6 ) .
To reduce f r ic t ion , 200-micron glass beads were used a s a lubricant.
25

b
Figure 5. Cold End o f Cycling Device
26

T I
Top View
L""""""""""~
".""""""""""""_ -
Side View
End View
Figure 6 . Sample Holder
27

~
The f i n a l s t e p i n c o n s t r u c t i n g t h e t h e r m a l c y c l i n g a p p a r a t u s was
t o develop a method o f moving the magnet under the glass tube back and
f o r t h so t h a t i t w o u l d p u l l t h e sample ho lder f rom one end t o t h e o t h e r .
It was decided t o modi fy a zone r e f i n i n g machine t o produce the desi red
apparatus. The zone r e f i n i n g machine already had a revers ing motor ,
a ca r r i age system, and a r o d t h a t c o u l d be used t o t r i p microswitches.
The f i r s t s t e p i n c o n v e r t i n g t h e zone r e f i n e r was t o b u i l d a c o n t r o l l e r
f o r t he reve rs ing mo to r t ha t wou ld a l l ow the samples t o remain a t each
end u n t i 1 they had reached the required temperature. This was
accomplished by the use o f a capac i to r bu i l dup system. As t he ca r r i age
t r a v e l e d t o one end, i t would t r i p a microswi tch. Th is a l lowed a
c a p a c i t o r t o s t a r t c h a r g i n g and when the charge was complete, the
ca r r i age was released. The c a r r i a g e t r a v e l e d t o t h e o t h e r end where i t
h i t another microswitch and the en t i re p rocess s ta r ted aga in . The
c o n t r o l l e r had a v a r i a b l e r e s i s t o r t h a t a l l o w e d t h e t i m e p e r i o d f o r
c a p a c i t o r b u i l d u p t o be var ied. Th is a l lowed the sample t o remain a t
e i t h e r end f o r a p redetermined per iod o f t ime.
Once the cyc l ing appara tus was completed, a thermocouple placed
i n s i d e a sample was cyc led t o determine how much time would be requ i red
a t each end to hea t and cool the sample. The f i r s t sample requ i red
a t o t a l c y c l e t i m e o f 25 minutes. The heat ing took s ix m inu tes and the
coo l i ng 19 minutes. Since t h i s was an u n r e a l i s t i c a l l y l o n g t i m e , t h e
tube was redesigned so tha t t he was ted n i t rogen gas cou ld be f ed i n to
the tube (F igure 7 ) . By having the gas blow over the samples, i t n o t
on ly coo led the sample qu icke r , bu t p rov ided a dry atmosphere i n which
28

Figure 7. Thermal Cycling Device
29

t he sample cou ld be cyc led. The des ign a l lowed the gas t o escape from
t h e c o l d end w i t h o u t f l o w i n g t o t h e h o t end. The n i t rogen .a lso acted
as a heat conductor thus a l lowing the samples t o be heated qu icker .
The thermocouple was then cyc led again and i t was f o u n d t h a t t h e t o t a l
cyc l ing t ime cou ld be c u t t o 5 minutes.
Two o the r mod i f i ca t i ons were 1 a t e r made. One was t o p l a c e a
p i e c e o f b r o n z e i n t h e c o l d end t o be used as a hea t s ink and the
o t h e r was t o purge the chamber w i t h h e l i urn be fo re t he n i t rogen was
in t roduced. The f i r s t s t e p reduced the amount o f 1 i q u i d n i t r o g e n used
and the second step kept moisture f rom condensing inside the tube.
30

RESULTS AND DISCUSSION
Microscopic Examination
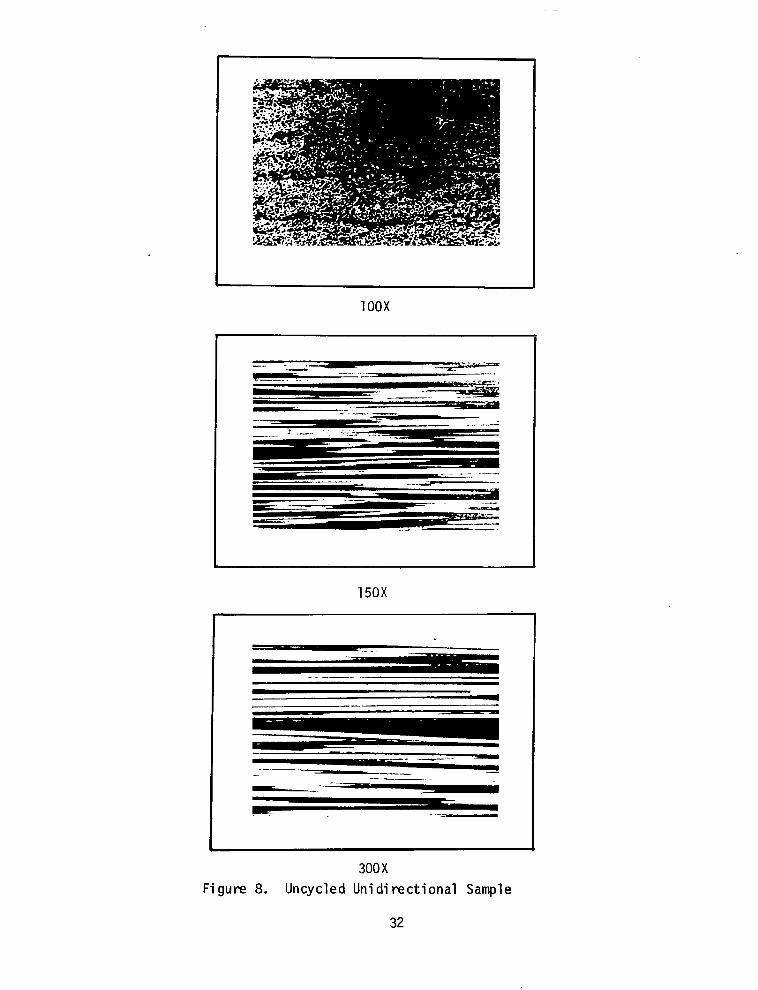
Figures 8, 9 , and 10 show the photomicrographs of the uncycled
fiber composi tes.
Figure 8 i s the unidirectional sample. The top micrograph shows
the fibers i n cross-section. Four fiber layers are distinguishable
even t h o u g h there i s good b o n d i n g between and good f iber distribution
in the layers. The second two micrographs were taken para1 le1 t o
the fibers.
Figure 9 i s a micrograph of the rr+ . .- I 453]2]T sample. There i s good
bonding between layers and l i t t l e or no transverse cracking.
Figure 10 i s O f the [o/30/60/90/-60/-30]s sample. The t o p micrograph
shows seven layers starting with the 0' direction and ending w i t h two
30' directions. The s ix layers on t o p represent one-ha1 f of the
thi ckness (the mid plane i s marked on the photomicrograph by a dark
l ine. The construction of the bot tom h a l f is identical t o t h a t o f the
upper ha l f ) . The other two micrographs taken a t higher magnification
show the fiber cross sections i n different layers. Good bonding with
practical ly no cracking was observed for this configuration.
Figures 11 through 14 show the composite material after cycling.
The t o p micrograph i n each figure was taken after ten cycles wi t h the
following m i crographs taken af te r 100, 1000, and 5000 cycles i n th i s
order.
31
J
1 oox
150X
I 1 300 X
Figure 8. Uncycled Unidirect ional Sample
32

8
Figure 9 . Uncycled [[+453]2]T Sample, 300X
33

1 oox
I
I
150X
350X
Figure 10. Uncycled [0/30/60/90/-60/-30], Sample
34

10 Cycles 40X
100 Cycles 40X
1000 Cycles 40X
I ~~
I
5000 Cycles 40X Figure 1 1 . Cycled [[+45,],] Sample, Photomicrographs Taken Along 0' Axis
35

10 Cycles 40X
100 Cycles 40X ~~
1000 Cycles 40X
5000 Cycles 40X
Figure 12. Cycled [[+45,],IT Sample,Photomicrographs Taken Along Fiber Axis
36

I ~~~
I 10 Cycles 40X
~
100 Cycles 40X
1000 Cycles 40X
Sample
37

10 Cycles 40X
I
100 Cycles 40X
I
1000 Cycles 40X ~~
I
5000 Cycles 40X
a
Figure 14. Cycled Unidirectional Sample
38

Figures ITzind 1 2 a r e . b e o f t h e [[t 453],]T sample. Figure 11 was
taken along the 0' axis while Figure 12 was taken along the fiber axis .
The micrographs indicate that transverse cracking starts w i t h as few as
ten cycles while delamination does not appear until 100 cycles. As the
number o f cycles increased, the severity and number of transverse
cracks as well as the severity of delamination increased.
Figure 13 is the [0/30/60/90/-60/-30]s sample. The cracking
a f t e r 10 or 100 cycles does not appear t o be nearly as severe as i t was i n
the [[t 453121~ sample. The type of cracking i n the sample i s very different
from tha t found i n the [[+ 453121, sample. Instead of the crack being
stopped a t t h e boundary between two plys, the crack is able to cross
the boundary and continue into the next layer. This could be due to
the sl ight angle between layers as compared t o the [[+ 453]2]T sample.
The crack extends to the boundary, proceeds along a partial delamination
between layers, and then continues into the next layer. T h i s pattern
can be clear ly seen i n the 1000 cycle photomicrograph, b u t i s not very
distinguishable i n the 5000 cycle micrograph due to the severe cracking.
Figure 14 i s t h e photomicrograph of the unidirectional sample.
The f i r s t 100 cycles had l i t t l e e f f e c t on the sample, b u t fur ther
cycling caused deterioration through delamination.
As can be seen from the photomicrographs, the unidirectional
composites a re normally f ree from cracks as prepared. The fiber-matrix
interaction stresses which resu l t from the dispar i ty o f thermal expansion
and from the curing shrinkage of the matrix are apparently not h i g h enough
39

t o i nduce c rack ing , espec ia l l y when a t t h e c u r i n g t e m p e r a t u r e t h e m a t r i x can
eas i l y f low to re l ieve the cur ing shr inkage s t resses . Laminate compos i tes
on the o ther hand usua l ly con ta in t ransverse c racks . These cracks are due
to the thermal expansion mismatch stresses between layers. In a sense
these are macrost resses encompassing the ent i re layer , whi le the f iber-matr ix
s t resses are microst resses. Some workers be l ieve tha t cur ing shr inkage
may a l so con t r i bu te t o such t ransve rse c rack ing (7 ) . However, i n t h e
samples p r e p a r e d f o r t h i s work the re were no cracks i n t h e u n i d i r e c t i o n a 1
composites and very few t ransverse cracks in the laminated composi tes.
Some were p r a c t i c a l l y f r e e o f any c r a c k i n g . T h i s i s a t t r i b u t e d t o t h e
care wi th which the samples were prepared and p a r t i c u l a r l y t o t h e v e r y
s low coo l i ng f o l l ow ing t he cu re . Th i s t ends t o i nd i ca te t ha t i t i s t h e
the rma l m ismatch ra the r t han t he cu r ing sh r inkage tha t i s p r imar i l y
respons ib le f o r t he o f ten obse rved t ransve rse c racks i n t he l am ina ted
composites. Any c rack ing t ha t occu r red 1 a t e r upon thermal cyc l ing can
c lea r l y be a t t r i bu ted t o t he rma l s t resses .
.
- The s t r u c t u r a l damage tha t occur red in the compos i tes as a r e s u l t
of thermal cyc l ing may be summarized as fo l l ows :
(1 ) I n t h e u n i d i r e c t i o n a l sample, which contained no
c r a c k s o r d e f e c t s a t t h e s t a r t o f c y c l i n g , c r a c k s
g radua l l y deve loped pa ra1 l e1 t o t he f i be rs . The
number o f cracks was m a l 1, bu t i nc reased w i th t he
number o f cyc les . It i s b e l i e v e d t h a t t h e y a r e a t
the sur faces separat ing the pre impregnated sheets
from which the composite was const ructed. The
cracking (which i n t h i s case amounts to de lamina t ion )
40

may be due t o thermal s t ress resul t ing from two sources:
(a) a very slight misorientation of the f ibers i n
adjacent sheets (or even within the sheets) which
from a practical standpoint cannot be completely
avoided and (b) a slight difference i n volume
fraction of f i be r s a t the junction of the pre-
impregnated sheets. This minor defect is also
practically impossible t o avoid especi a1 ly i f the
misorientation described i n ( a ) i s present.
I n the [It 4 5 3 1 2 1 ~ composite, i . e . , in the composite w i t h the
maximum change of orientation between layers, the
damage resulting from thermal cycling can be described
as fol 1 ows :
a. Development o f transverse cracks:
The crack surfaces are parallel t o the
fibers in the indi vi dual layer and hence
their direction in one layer makes a
r i g h t angle w i t h their direction in the
next. The cracks i n one layer seem t o be
unrelated t o those i n the next.
b. Delamination of the composite:
T h i s consisted o f a separation between
layers and again seems t o be unrelated
t o the transverse cracks in the same
tha t they do n o t extend between individual
cracks.
41

I n t h e [0 /30~60/90/ -60/ -301~ sampfe i .e., i n the composi te
w i t h t h e l e a s t d r a s t i c change i n o r i e n t a t i o n , the
damage cons is ted of cracks which propagated across
l a y e r i n t e r f a c e s w i t h v e r y l i t t l e , i f any delamination.
I n cases where delamination was detected, i t was
c l e a r l y a s s o c i a t e d w i t h t h e c r a c k s and a c t u a l l y
c o n s t i t u t e d a p a r t o f t h e c r a c k as i t propagated
from one l a y e r t o a n o t h e r .
42

Modul us of Elasticity
The strain and load data taken during the testing was plotted
and a best fit line was drawn. From this the modulus, E, was calculated
using:
1 oad - E = area strain
This was done on all specimens except the transverse unidirectional
specimen where four point bending was used. The modulus in this case
is given by the formula:
Where :
E = elastic modulus
P = applied load
b = width o f specimen
h = thickness of specimen
E = strain
and the distance between knife edges in the four point bending test was 5.08cm.
Using formulas 1 and 7 contained in the theoretical section, the
modulus for the unidirectional was calculated. EL was 191 x l o 9 N/m2 and
ET was 7.6 x 10 N/m . These values compare very favorably with the EL
of 182 X I O 9 N/m and ET of 6.8 x 10’ N/m2 obtained experimentally.
9 2
2
The experimental values obtained for EL, ET, GLT, and vLT were used
to calculate the theoretical values for the [[L 453]2]T, and the
[0/30/60/90/-60/-30]s composites. The values were:
43

For the [[t 4 5 3 1 ~ 1 ~ samples:
Alcrng the f iber axis (either +45O, -45') E = 9.48 x 10" N/m2
Along the 0' ax i s E = 1.37 x lo lo N/m2
For the [0/30/60/90/-60/-30]s sample: E = 6.23 x - "
The [[A 453]2]T sample had an experimental
Of 7.81 x l o l o N / m 2 when tested in either the +45"
lo lo N/m2
1 i determined modulus
or -45" direction and
1.47 x lolo N/m2 when measured a t 0'. These values compared f a i r l y
well with the 9.48 x lo lo N / m 2 and the 1.37 x 10" N/m moduli calculated. 2
The [0/30/60/90/-60/-30], specimen should have the same modulus
in a1 1 directions. The modulus measured was 5 .72 x lo lo N / m as compared
t o the calculated value of 6.23 x lo lo N/m .
2
2
The calculate va
in most cases. This cou
tested exactly along the
lues were higher t h a n the experimental values
I d be due i n p a r t to . the specimen not being
designated axis. I t i s easy t o see the
dramatic reduction i n modulus i n the [[+ - 453]2]T specimen when the
tens i le ax is i s moved away from the f iber axis. -
Table I is a tabulation of a1 1 the experimental elastic moduli
d a t a . I t can be seen t h a t the most dramatic change in tensi le modulus
fo r a l l samples occurs d u r i n g t h e f i r s t ten cycles. After the f i r s t
ten cycles, further cycling seems t o cause l i t t l e or no more damage.
44

Sample Type T e s t Direction
Number o f
Cyc 1 es
0
10 100
1000
5000
Unidirectional
O0
18.2 x 10 10
14.3 x IO 10
15.1 x lolo 13.2 x 10 10
14.5 x 10"
t
O0 00
5.7 x 1o1O 1.4 x 10 10
5.0 x lolo 1.3 x 10 10
5.0 x 10" 1.4 x lolo
4.2 x lo1' 1.2 x 1o1O
4.6 x lo1')
450
7.8 x 10
7.0 x 10 7.2 x 10
7.2 x 10
7.1 x 10
10
10 10
10
10
I
Table I. Modulus o f Elasticity o f Graphite-Epoxy Composite Material.
Values given in N/m . 2
45
Thermal Expansion
. The thermal expansion coefficient a of the quasi-isotropic samples
(i .e. [[+ 453]2]T and the [O/30/60/90/-60/-30]s were very c lose. The value
of this coefficient a for the [[t 453]2], sample was 1.6 x 10 / K as
compared to 2.2 x 10 -6 / o K for the [0/30/60/90/-60/-30]s sample. Considering
the values are subject to an experimental error as much as + 0.5 x IO / K,
the values could be considered to be the same. It can be seen that these
values o f the coefficients are very small when one considers that a
unidirectioned composite o f the same material and proportions yields a
transverse coefficient of 69.7 x IO / K.
-6 o
-6 o
-6 o
The unidirectional sample showed a clear trend for the expansion
coefficient to increase as the angle between the fiber axis and specimen
axis increased from 0' to 90'. This is shown in Figure 15. The simple
formula for a homogeneous orthotropic material is ac = aoocos 8 + agO0sinB
and the experimental results show a good correlation with this formula.
2
It was found that once the composite material was cycled, that the
amount of thermal expansion was lower in all cases. The a for the
[[t 453121, sample was 0.5 .x 10 / K as compared to 1.6 x 10 / K measured before
cycling. The a for the [0/30/60/90/-60/-30]s sample had an average value of
0.65 x 10 / K as compared to the uncycled Val ue of 2.2 x 10 / K. The
unidirectional sample was tested only in the transverse direction. It
was found that the CY, for this sample remained about the same as the
uncycled samples until approximately 1000 cycles. The value o t a then
dropped slightly t o a value o f 67.4 x 10 / K. The above results are
summarized in Table 11.
-6 o -6 o
-6 o -6 o
-6 o
46

Coefficient
of Thermal
Expansion
x10-6/' K
Angle in Degrees
Figure 15. Thermal Expansion vs Angle from Fiber Di rect ion i n Unidi rect ional Sample
47

1 I
Test Direction I O0 I goo I O6 I 0”
Uncyc I ed 1 -0.3 X 10 / K I 69./ x 10 / K 1 2.20 x 10 / K -6 o -6 o -6 o I 1.60 x 10 -6 / o K
I 67.4 x IO / K 1 -6 o 0.65 x 10 / K -6 o I 0.50 X 0 / K -6 o
I I I I
Table 11. Thermal Expansion Coefficients of Graphite-Epoxy Composite Material
Sample Type 1 Unidirectional I 1
~~
Test direction: O0
Number
of
Cyc 1 es
0
10
100
1 oou 5000
234.4 x lo6 120.3 x IO6
150.8 ‘x IO6
175.6 x lo6 162.2 x lo6
59.5 x
72.3 x
b3.5 x 111 61 .O 6
I O6 80.7
I o6 115.
[0/30/60/90/-60/-30]s
O0
16/.5 x 10
86.2 x ‘IO6
6
79.3 x lob
49.3 x lo6 127.6 x lo6
Table 111. Ultimate Tensile Strength 05 Graphite-Epoxy Composite Material. Values are given in N/m .
~"~ Thermal Stresses
In the unidirectional sample, thermal stresses between layers are
not present. Although the composite i s constructed o f many preimpregnated
sheets, i t may be considered a single layer.
A s t a t e of s t ress was noted in the [[+ 453]2]Ty and [0/30/60/90/
-60/-30], samples. Calculations showed the s t ress t o be +0.45 x 10 and
-0.45 x 10 N/m / K in the longitudinal and transverse directions of the
layers with all layers being identical. O f course the strain i s much lower
in the longitudinal direction, b u t the modulus i s much higher t h a n in the
transverse direction. As the temperature rises, a t ens i le s t ress i s developed
in the longitudinal direction while a compressive s t r e s s i s developed in the
transverse direction. As the temperature drops, just the opposite is true.
6
6 2
A drop in temperature from the high end of the temperature range
(423K) t o the low end (Z23K) of the range used in th i s study would cause
a tensi le s t ress buildup of 90 x 10 N / m 2 i n the transverse d
a n equal compressive stress longitudinally. This stress leve
6
cause cracking i n the transverse direction. sufficient t o
The u
sample before
samples
ten cyc
cycl i ng
151 x
N / m . 2
Y
1
I
- Ultimate Tensile Strength
irection and
1 i s
ltimate tensile strength of the unidirectional longitud
cycling was 234 x IO N/m . A s was the case i n a l l o f 6 2 inal
the
a large drop i n the ultimate tensi le strength was noted a f t e r
es. In t h i s case the value dropped t o 120 x 10 N / m . Further
caused l i t t l e more damage with the value a f t e r 100 cycles being
O6 N / m 2 , 1000 cycles 176 x 10 N/m and 5000 cycles 162 x 10 6 2 6
6 2
Table I11 gives ultimate tensile strengths o f the various
configurations. 49

Electron Microscope
Figures 16 through 18 show the fracture surfaces o f the unidirectional,
[0/30/60/90/-60/-30]s, a n d the [[+ 453]z]T samples.
Figure 16 i s t he micrograph of the unidirectional sample. I t
can be seen t h a t the f ibers were broken and pulled from the matrix.
This is the typical fracture expected i n an unidirectional sample.
The area shown i s one where no delamination appeared.
The second micrograph, Figure 1 7 , i s of the [0/30/60/90/-60/-30]s
sample. The f i r s t microaraph indicates that there i s l i t t l e delamination
even a f t e r repeated cycling. The second micrograph is of the boundary
area between two layers shown a t a magnification o f 250X. This is typical
boundary area and indicates t h a t there was very good bond ing between layers.
Figure 18 i s of the I[+ 453],]~ sample. I t i s obvious t h a t there i s
extensive delamination in this sample. The delamination f i r s t started
t o appear a t 100 cycles and became progressively worse as the number of
cycles increased. The second photomicrograph shows the complete
delamination between two layers after lOOu cycles.
50

Figure 16. Fracture Surface of Unidirectional Sample 100 Cycles lOOOX
51

~~
100 Cycles 250X
~ ~~ ~
1000 Cycles 250X
Figure 17. Fracture Surface o f [0/30/60/90/-60/-30], Sample
52

I
100 Cycles 60X
I
1000 Cycles 60X
F igu re 18. Fracture Surface of [[T 4 5 3 1 2 1 ~ Sample
53

CONCLUSIONS
Graphite-epoxy laminates were thermally cycled to determine the
effects of thermal cycles on tensile and thermal properties of the
laminates. Three 12-ply laminate configurations (unidirectional,
[[+ 453]2]T9 and [0/30/60/90/-60/-30]s were subjected to up to 5000
thermal cycles. The cumulative effect of the thermal cycles was
determined by destructive inspections (electron microscopy and tests
of properties) of samples after progressively larger numbers of cycles.
The inspections and tests support the following conclusions:
1.
2.
3.
4.
5.
6.
It is possible with careful lamination and curing to obtain
graphite-fiber reinforced composites practically free of cracks.
Thermal cycling induces cracks through the thickness in the matrix
parallel to the fibers in the unidirectional composite.
Thermal cycling induces transverse cracking and extensive
delamination in the [[+ - 453]2]T laminated composite.
Thermal cycling in the [O/30/60/90/-60/-30]s sample induces
transverse cracks which are continuous across layer interfaces,
with occasional localized delamination forming the portions
of the crack in adjacent layers.
Thermal cycling causes considerable deterioration in the
elastic and strength properties of the composites.
Thermal cycling causes the thermal expansion coefficient of the
cross-plied composites to decrease to approximately one-third of
its value. The absolute value of the change, however, is very small.
54

7. While the structural damage continues t o increase as the number
of cycles increases, the largest port ion of the deterioration
of mechanical properties takes place during the f i r s t few cycles
with subsequent cycles causing only a l i t t l e fur ther de te r iora t ion .
8. In-plane thermal s t ress i n b o t h cross-plied laminates was estimated
t o be 0.45 x lo6 N/m2/K in the fiber direction and -0.45 x lo6 N / m 2 / K
transverse t o the f ibers for this graphite-epoxy system.
9. Bo th cross-plied laminated compostes deteriorated t o about the
same degree during thermal cycling. The improved strengths expected
from the gradual change in orientation i n the [O/30/60/90/-60/-30]s
composite was apparently countered by the relative ease of crack
p ropaga t ion .
55

REFERENCES
1.
2.
3.
4.
5.
6.
7.
8.
Handbook of Fiberglass and Advanced Plastic Composites. Edited by George Lubin VanNostrand. Reinhold Company, 1969.
Hill, R. (1964). Theory of Mechanical Properties of Fiber Strengthened Materials. Elastic Behavior. Journal of Mechanics and Physics of Solids. Volume 12.
Rosen, B. W. (1973). Composite Materials and the Designer Article 3 . Stiffness of Fiber Composite Materials. Composites,
Ashton, J. E . , J. C. Halpin and P. H. Petit (1969). Primer on Composite Material: Analysis. Technomic Publications, Stanford, Connecticut.
Spencer, A. J. M. Deformation of Fiber Reinforced Composites. Holden-Day, New York, New York 1963.
Fahmy, A. A. and A. N. Ragai (1970). Thermal Expansion of Graphite- Epoxy Composites. Journal of Applied Physics, Volume 41, 5112.
Doner, D. R. and R. C. Novak ( 1 969). Structural Behavior o f Laminated Graphite Filament Composites. 24th Annual Technical Conference. The Society of the Plastics Industry, Inc.
Spain, R. G. (1971). Thermal Microcracking of Carbon/Resin Composites. Composites.
56 NASA-Langley, 1976 CR-2641
I