Rolled Aluminum Rod Bar Continuous Cast Structural Shapes P33552 M
Upload
nguyenliemCategory
view
214download
0
UNIVERSIDAD POLITECNICA DE MADRID
ESCUELA TECNICA SUPERIOR DE
INGENIEROS INFORMATICOS
Continuum models of the mechanical behavior of
rolled and die-cast magnesium alloys
TESIS DOCTORAL
ANA MARIA FERNANDEZ BLANCO
Ingeniero Tecnico Aeronautico
Master en Materiales Estructurales para las Nuevas Tecnologıas
2014


Doctorado en Computacion Avanzada
para Ciencias e Ingenierıas
Escuela Tecnica Superior de Ingenieros Informaticos
Universidad Politecnica de Madrid
PhD. Thesis
International Mention
Continuum models of the mechanical behavior of
rolled and die-cast magnesium alloys
Author
Ana Marıa Fernandez Blanco
BEng. in Aeronautical Technical Engineering
MEng. in Structural Materials for New Technologies
Supervised by
Dr. M. Teresa Perez-Prado
PhD. in Physics
Prof. Antoine Jerusalem
PhD. in Computational Mechanics of Materials
IMDEA Materials Institute, Madrid, Spain
June 2014


Tribunal nombrado por el Excmo. y Magfco. Sr. Rector de la U.P.M., el dıa .....
Presidente:
Secretario:
Vocal:
Vocal:
Vocal:
Suplente:
Suplente:
Realizado el acto de defensa y lectura de la Tesis el dıa ..... de ........ del 2014 en la
E.T.S. de Ingenieros Informaticos de la U.P.M.
Calificacion: ...............
Firmado por el Tribunal Calificador:
Presidente
Secretario
Vocales


Dedicated to my family

iv

Acknowledgements
This thesis has been carried out at the IMDEA Materials Institute in Madrid and has
been defended at the Technical University of Madrid, Spain. It is a pleasure to have the
opportunity to thank all those who supported me during this work.
I am delighted to express my gratitude to my advisors Dr. M. Teresa Perez-Prado at
IMDEA Materials Institute and Prof. Antoine Jerusalem now at the University of Oxford.
I still remember our first meeting at IMDEA Materials Institute and the words they said
to me. Since that day, my life took a turn and I started enjoying the research field. Thanks
to their support, encouragement, excellent guidance and confidence in me have made it
possible to carry out this thesis. It has been an honor and a privilege to have had the
chance to work with them and learn from them. My appreciation is immense.
I gratefully acknowledge to Prof. Javier Llorca and Prof. Jose Manuel Torralba for
giving me the opportunity to complete my thesis at IMDEA Materials Institute, for their
support and for giving me sincere advices and valuable opportunities.
My most sincere thanks go to Dr. Federico Sket for sharing his knowledge in the field
of tomography which has been of great importance for this work. Thanks to him and
to Dr. Jon Molina-Aldareguia for their collaboration and for their inspiring, constructive
and critical discussions.
I would like to thank to Prof. Dr.-Ing. Dierk Raabe for giving me the opportunity to
perform my stay at Max-Planck-Institut fur Eisenforschung GmbH (MPIE) in Dusseldorf,
Germany. I am deeply grateful to Dr. Ivan Gutierrez-Urrutia for his help and fruitful
discussions during the stay at MPIE. Thanks are also due to Dr. Stefan Zaefferer, Dr.
Anahita Khorashadizadeh and Monika Nellessen for the technical support on the three-
dimensional electron backscatter diffraction measurements at MPIE.
I am sincerely grateful to Prof. Lallit Anand at the Massachusetts Institute of
Technology for supplying the original VUMAT for rate-independent crystal plasticity for
hexagonal close-packed materials written by Staroselsky and Anand. I would also like
to extend grateful thanks to Prof. Yujie Wei at State Key Lab of Nonlinear Mechanics
(Institute of Mechanics in Beijing), Prof. Ron W. Armstrong at the University of Maryland

vi
and Prof. Andy Godfrey at the Tsinghua University, for very useful, interesting and
productive discussions.
The technicians of the CAI X-ray diffraction of the Complutense University and the
National Center for Metals Research in Madrid are sincerely thanked for their kind
assistance. Thanks must also go to Hiperbaric S.A. for the help with the hydrostatic
pressure treatments. I would also like to acknowledge the use of the University of Oxford
Advanced Research Computing (ARC) facility in carrying out this work.
I thank to the vehicle interior manufacturer, Grupo Antolin Ingenierıa S.A., within
the framework of the project MAGNO2008-1028-CENIT Project funded by the Spanish
Ministry. Financial support from the PRI-PIBUS-2011-0917 project (MAGMAN) from
the Spanish Ministry of Economy and Competitiveness (MINECO) is also gratefully
acknowledged.
My thanks to all the members, past and present, at IMDEA Materials Institute for
the pleasant and warm atmosphere which exist in the institute. They are extraordinary
people. Despite the lack of space, I would like to mention some of them for their friendly
support: Carmen, Elena, Eva, Fede, Guillermo, Irene, Juan Pedro, Katia, Laura, Marcos,
Mariana, Paloma, Paqui, Rafa, Raul M., Raul S., Roberto, Rocıo S., Saeid, Sergio, Vanesa.
Special thanks to Nathamar for her invaluable help at the beginning of this thesis, to Rocıo
M. for her friendship and to Julian for his help and encouragement when I was feeling low.
I would like to thank my friends and my family. Many thanks to my parents and
brothers for all their love. They have taught me to be always persistent, optimistic and to
look forward to achieving even higher goals. And finally, to Jose, for all his patience and
love. He gave me his endless support and helped me to go through all the difficulties I
came across during this time. He provided me the required motivation to make this thesis
a reality.
To all of you, thanks!
Ana Fernandez

Contents
List of Abbreviations xi
Resumen xiii
Abstract xv
1 Introduction 1
1.1 Length scales . . . . . . . . . . . . . . . . . . . . . . . . . . . . . . . . . . . 1
1.2 Magnesium alloys . . . . . . . . . . . . . . . . . . . . . . . . . . . . . . . . . 1
1.3 Texture . . . . . . . . . . . . . . . . . . . . . . . . . . . . . . . . . . . . . . 4
1.4 Motivation . . . . . . . . . . . . . . . . . . . . . . . . . . . . . . . . . . . . 9
2 State of the Art 11
2.1 Rolled Mg alloys: the influence of texture on the mechanical behavior . . . 11
2.2 Fundamentals of twinning . . . . . . . . . . . . . . . . . . . . . . . . . . . . 12
2.3 Die-cast Mg alloys: the influence of porosity on the mechanical behavior . . 14
2.4 Continuum models for HCP materials . . . . . . . . . . . . . . . . . . . . . 15
2.4.1 Crystal plasticity modeling . . . . . . . . . . . . . . . . . . . . . . . 15
2.4.2 Mechanical twinning in CPFE models . . . . . . . . . . . . . . . . . 16
2.4.3 Continuum models for porosity evolution . . . . . . . . . . . . . . . 17
2.5 Objectives . . . . . . . . . . . . . . . . . . . . . . . . . . . . . . . . . . . . . 18
3 Experimental Campaign 19
3.1 Material . . . . . . . . . . . . . . . . . . . . . . . . . . . . . . . . . . . . . . 19
3.2 Microstructural characterization . . . . . . . . . . . . . . . . . . . . . . . . 19
3.2.1 Measurement of macrotexture by X-ray diffraction . . . . . . . . . . 20
3.2.2 Measurement of microtexture by electron backscatter diffraction . . 20
3.2.2.1 2D EBSD technique . . . . . . . . . . . . . . . . . . . . . . 20
3.2.2.2 3D EBSD technique . . . . . . . . . . . . . . . . . . . . . . 22
vii

viii
3.2.3 X-ray computed tomography fundamentals . . . . . . . . . . . . . . 24
3.3 Mechanical testing . . . . . . . . . . . . . . . . . . . . . . . . . . . . . . . . 26
4 Continuum modeling of the mechanical response of a Mg AZ31 alloy
during uniaxial deformation 27
4.1 Experimental procedure . . . . . . . . . . . . . . . . . . . . . . . . . . . . . 27
4.2 Numerical set-up . . . . . . . . . . . . . . . . . . . . . . . . . . . . . . . . . 28
4.2.1 Constitutive framework . . . . . . . . . . . . . . . . . . . . . . . . . 28
4.2.1.1 Crystal plasticity continuum formulation . . . . . . . . . . 28
4.2.1.2 Crystal rotation . . . . . . . . . . . . . . . . . . . . . . . . 31
4.2.2 Finite element model . . . . . . . . . . . . . . . . . . . . . . . . . . . 32
4.2.2.1 Finite element discretization . . . . . . . . . . . . . . . . . 32
4.2.2.2 Model calibration . . . . . . . . . . . . . . . . . . . . . . . 33
4.3 Results and discussion . . . . . . . . . . . . . . . . . . . . . . . . . . . . . . 37
4.3.1 Texture evolution and slip/twin activities . . . . . . . . . . . . . . . 38
4.3.2 Fracture mechanisms . . . . . . . . . . . . . . . . . . . . . . . . . . . 43
4.3.3 Validation . . . . . . . . . . . . . . . . . . . . . . . . . . . . . . . . . 44
4.3.3.1 Texture evolution and slip/twin activities . . . . . . . . . . 45
4.3.3.2 Fracture mechanisms . . . . . . . . . . . . . . . . . . . . . 47
4.4 Conclusion . . . . . . . . . . . . . . . . . . . . . . . . . . . . . . . . . . . . 47
5 3D investigation of grain boundary-twin interactions in a Mg AZ31 alloy
by electron backscatter diffraction and continuum modeling 49
5.1 Experimental procedure . . . . . . . . . . . . . . . . . . . . . . . . . . . . . 49
5.2 Numerical set-up and validation . . . . . . . . . . . . . . . . . . . . . . . . . 50
5.3 Results and discussion . . . . . . . . . . . . . . . . . . . . . . . . . . . . . . 54
5.3.1 3D variant analysis . . . . . . . . . . . . . . . . . . . . . . . . . . . . 54
5.3.2 Effect of GB misorientation on twin transfer . . . . . . . . . . . . . . 59
5.3.2.1 Low misorientation angle boundary (θP1−P2= 15.7°) . . . 60
5.3.2.2 Intermediate misorientation angle boundary (θP1−P3=
22.3°) . . . . . . . . . . . . . . . . . . . . . . . . . . . . . . 60
5.3.2.3 High misorientation angle boundary (θP1−P4= 64.3°) . . . 61
5.3.3 Previous model vs. extended model . . . . . . . . . . . . . . . . . . 65
5.3.4 Modeling of twin transfer and twin nucleation as a function of GB
misorientation angle . . . . . . . . . . . . . . . . . . . . . . . . . . . 65
5.4 Conclusions . . . . . . . . . . . . . . . . . . . . . . . . . . . . . . . . . . . . 68
6 Effect of hydrostatic pressure on the 3D porosity distribution and on
the mechanical behavior of a high pressure die-cast Mg AZ91 alloy 71
6.1 Experimental procedure . . . . . . . . . . . . . . . . . . . . . . . . . . . . . 71
6.1.1 Material and process . . . . . . . . . . . . . . . . . . . . . . . . . . . 71
6.1.2 X-ray computed tomography inspection . . . . . . . . . . . . . . . . 73

Contents ix
6.1.3 Image processing and void tracking . . . . . . . . . . . . . . . . . . . 73
6.1.4 Mechanical testing . . . . . . . . . . . . . . . . . . . . . . . . . . . . 75
6.1.5 Finite element analysis . . . . . . . . . . . . . . . . . . . . . . . . . . 75
6.2 Results . . . . . . . . . . . . . . . . . . . . . . . . . . . . . . . . . . . . . . . 76
6.2.1 Experimental results . . . . . . . . . . . . . . . . . . . . . . . . . . . 76
6.2.1.1 Qualitative analysis . . . . . . . . . . . . . . . . . . . . . . 76
6.2.1.2 Quantitative analysis of pore volume and shape change . . 79
6.2.2 Simulations results . . . . . . . . . . . . . . . . . . . . . . . . . . . . 80
6.2.3 Mechanical tests . . . . . . . . . . . . . . . . . . . . . . . . . . . . . 86
6.3 Discussion . . . . . . . . . . . . . . . . . . . . . . . . . . . . . . . . . . . . . 86
6.3.1 Ligament ratio analysis . . . . . . . . . . . . . . . . . . . . . . . . . 88
6.3.2 Effect of the anisotropy on the variation of the volume and the
complexity factor of the pores . . . . . . . . . . . . . . . . . . . . . . 90
6.4 Conclusions . . . . . . . . . . . . . . . . . . . . . . . . . . . . . . . . . . . . 92
7 Conclusions and future work 95
7.1 Main conclusions . . . . . . . . . . . . . . . . . . . . . . . . . . . . . . . . . 95
7.2 Future work . . . . . . . . . . . . . . . . . . . . . . . . . . . . . . . . . . . . 96
A Fractography analysis of a Mg AZ31 alloy 97
B Minimum deviation angle method 99
Bibliography 101
List of Figures 123
List of Tables 129
List of Publications 131

x

List of Abbreviations
Al Aluminum
AOI Area of interest
ATPs Adjoining twin pairs
AZ31 Mg-3wt.%Al-1wt.%Zn
AZ91 Mg-9wt.%Al-1wt.%Zn
BCC Body centered cubic structure
CF Complexity factor
CPFEM Crystal plasticity finite element method
CRSS Critical resolved shear stress
DTT Double tensile twinning
EBSD Electron backscatter diffraction
FBP Filtered back projection algorithm
FCC Face center cubic structure
FEM Finite element method
FIB Focused ion beam
GB Grain boundary
GNDs Geometrically necessary dislocations
HCP Hexagonal close-packed structure
xi

xii
HPDC High pressure die-casting
Mg Magnesium
ND Normal direction
ODF Orientation distribution function
OM Optical microscopy
PTR Predominant twin reorientation method
RD Rolling direction
RVE Representative volume element
SEM Scanning electron microscope
SF Schmid factor
STL StereoLithography format
2D Two-dimensional
3D Three-dimensional
3D EBSD Three-dimensional electron backscatter diffraction
TD Transverse direction
VPSC Visco-plastic self-consistent model
XCT X-ray computed tomography
XRD X-ray diffraction
Zn Zinc

Resumen
En los ultimos anos ha habido una fuerte tendencia a disminuir las emisiones de CO2 y
su negativo impacto medioambiental. En la industria del transporte, reducir el peso de
los vehıculos aparece como la mejor opcion para alcanzar este objetivo. Las aleaciones
de Mg constituyen un material con gran potencial para el ahorro de peso. Durante la
ultima decada se han realizado muchos esfuerzos encaminados a entender los mecanismos
de deformacion que gobiernan la plasticidad de estos materiales y ası, las aleaciones de Mg
de colada inyectadas a alta presion y forjadas son todavıa objeto de intensas campanas
de investigacion. Es ahora necesario desarrollar modelos que contemplen la complejidad
inherente de los procesos de deformacion de estos. Esta tesis doctoral constituye un intento
de entender mejor la relacion entre la microestructura y el comportamiento mecanico de
aleaciones de Mg, y dara como resultado modelos de policristales capaces de predecir
propiedades macro- y microscopicas.
La deformacion plastica de las aleaciones de Mg esta gobernada por una combinacion
de mecanismos de deformacion caracterısticos de la estructura cristalina hexagonal, que
incluye el deslizamiento cristalografico en planos basales, prismaticos y piramidales, ası
como el maclado. Las aleaciones de Mg de forja presentan texturas fuertes y por
tanto los mecanismos de deformacion activos dependen de la orientacion de la carga
aplicada. En este trabajo se ha desarrollado un modelo de plasticidad cristalina por
elementos finitos con el objetivo de entender el comportamiento macro- y micromecanico
de la aleacion de Mg laminada AZ31 (Mg-3wt.%Al-1wt.%Zn). Este modelo, que
incorpora el maclado y tiene en cuenta el endurecimiento por deformacion debido
a las interacciones dislocacion-dislocacion, dislocacion-macla y macla-macla, predice
exitosamente las actividades de los distintos mecanismos de deformacion y la evolucion
de la textura con la deformacion. Ademas, se ha llevado a cabo un estudio que
combina difraccion de electrones retrodispersados en tres dimensiones y modelizacion para
investigar el efecto de los lımites de grano en la propagacion del maclado en el mismo
material. Ambos, experimentos y simulaciones, confirman que el angulo de desorientacion
tiene una influencia decisiva en la propagacion del maclado. Se ha observado que los efectos
xiii

xiv
no-Schmid, esto es, eventos de deformacion plastica que no cumplen la ley de Schmid
con respecto a la carga aplicada, no tienen lugar en la vecindad de los lımites de baja
desorientacion y se hacen mas frecuentes a medida que la desorientacion aumenta. Esta
investigacion tambien prueba que la morfologıa de las maclas esta altamente influenciada
por su factor de Schmid.
Es conocido que los procesos de colada suelen dar lugar a la formacion de microestruc-
turas con una microporosidad elevada, lo cual afecta negativamente a sus propiedades
mecanicas. La aplicacion de presion hidrostatica despues de la colada puede reducir la
porosidad y mejorar las propiedades aunque es poco conocido su efecto en el tamano y
morfologıa de los poros. En este trabajo se ha utilizado un enfoque mixto experimental-
computacional, basado en tomografıa de rayos X, analisis de imagen y analisis por elemen-
tos finitos, para la determinacion de la distribucion tridimensional (3D) de la porosidad
y de la evolucion de esta con la presion hidrostatica en la aleacion de Mg AZ91 (Mg-
9wt.%Al-1wt.%Zn) colada por inyeccion a alta presion. La distribucion real de los poros
en 3D obtenida por tomografıa se utilizo como input para las simulaciones por elementos
finitos. Los resultados revelan que la aplicacion de presion tiene una influencia significa-
tiva tanto en el cambio de volumen como en el cambio de forma de los poros que han sido
cuantificados con precision. Se ha observado que la reduccion del tamano de estos esta
ıntimamente ligada con su volumen inicial.
En conclusion, el modelo de plasticidad cristalina propuesto en este trabajo describe
con exito los mecanismos intrınsecos de la deformacion de las aleaciones de Mg a escalas
meso- y microscopica. Mas especificamente, es capaz de capturar las activadades del
deslizamiento cristalografico y maclado, sus interacciones, ası como los efectos en la
porosidad derivados de los procesos de colada.

Abstract
The last few years have seen a growing effort to reduce CO2 emissions and their negative
environmental impact. In the transport industry more specifically, vehicle weight reduction
appears as the most straightforward option to achieve this objective. To this end, Mg alloys
constitute a significant weight saving material alternative. Many efforts have been devoted
over the last decade to understand the main mechanisms governing the plasticity of these
materials and, despite being already widely used, high pressure die-casting and wrought
Mg alloys are still the subject of intense research campaigns. Developing models that
can contemplate the complexity inherent to the deformation of Mg alloys is now timely.
This PhD thesis constitutes an attempt to better understand the relationship between the
microstructure and the mechanical behavior of Mg alloys, as it will result in the design of
polycrystalline models that successfully predict macro- and microscopic properties.
Plastic deformation of Mg alloys is driven by a combination of deformation mechanisms
specific to their hexagonal crystal structure, namely, basal, prismatic and pyramidal
dislocation slip as well as twinning. Wrought Mg alloys present strong textures and thus
specific deformation mechanisms are preferentially activated depending on the orientation
of the applied load. In this work a crystal plasticity finite element model has been
developed in order to understand the macro- and micromechanical behavior of a rolled
Mg AZ31 alloy (Mg-3wt.%Al-1wt.%Zn). The model includes twinning and accounts for
slip-slip, slip-twin and twin-twin hardening interactions. Upon calibration and validation
against experiments, the model successfully predicts the activity of the various deformation
mechanisms and the evolution of the texture at different deformation stages. Furthermore,
a combined three-dimensional electron backscatter diffraction and modeling approach has
been adopted to investigate the effect of grain boundaries on twin propagation in the same
material. Both experiments and simulations confirm that the misorientation angle has a
critical influence on twin propagation. Non-Schmid effects, i.e. plastic deformation events
that do not comply with the Schmid law with respect to the applied stress, are absent in
the vicinity of low misorientation boundaries and become more abundant as misorientation
xv

xvi
angle increases. This research also proves that twin morphology is highly influenced by
the Schmid factor.
Finally, casting processes usually lead to the formation of significant amounts of gas and
shrinkage microporosity, which adversely affect the mechanical properties. The application
of hydrostatic pressure after casting can reduce the porosity and improve the properties
but little is known about the effects on the casting’s pores size and morphology. In this
work, an experimental-computational approach based on X-ray computed tomography,
image analysis and finite element analysis is utilized for the determination of the 3D
porosity distribution and its evolution with hydrostatic pressure in a high pressure die-
cast Mg AZ91 alloy (Mg-9wt.%Al-1wt.%Zn). The real 3D pore distribution obtained by
tomography is used as input for the finite element simulations using an isotropic hardening
law. The model is calibrated and validated against experimental stress-strain curves. The
results reveal that the pressure treatment has a significant influence both on the volume
and shape changes of individuals pores, which have been precisely quantified, and which
are found to be related to the initial pore volume.
In conclusion, the crystal plasticity model proposed in this work successfully describes
the intrinsic deformation mechanisms of Mg alloys both at the mesoscale and the
microscale. More specifically, it can capture slip and twin activities, their interactions,
as well as the potential porosity effects arising from casting processes.
CHAPTER 1
Introduction
1.1 Length scales
When a polycrystalline metal is subjected to an external stress, it triggers a heterogeneous
deformation process that is transmitted to each grain. This phenomenon, which involves
changes at all length scales, results in the overall deformation of the material [1]. The
microstructure accommodates plastic deformation through the activation of different
deformation mechanisms: from dislocation movement and interaction causing hardening,
to changes in grain orientation and shape and phase transformations. Numerical
simulations help to better understand the fundamental basis of these deformation
processes. Indeed, computational modeling of materials at the microstructural level
provides a numerical tool able to accelerate the development of modern materials.
Considerable efforts have been made in the development of computational methods to
study the material behavior from continuum length scales (i.e. to predict properties such
as yield stress, elastic modulus, and to understand the evolution of the crystallographic
texture, the particle volume fraction, etc.) to atomic scales (i.e. to predict the atomic
scale processes in a small volume of material for short periods of time, defect energies,
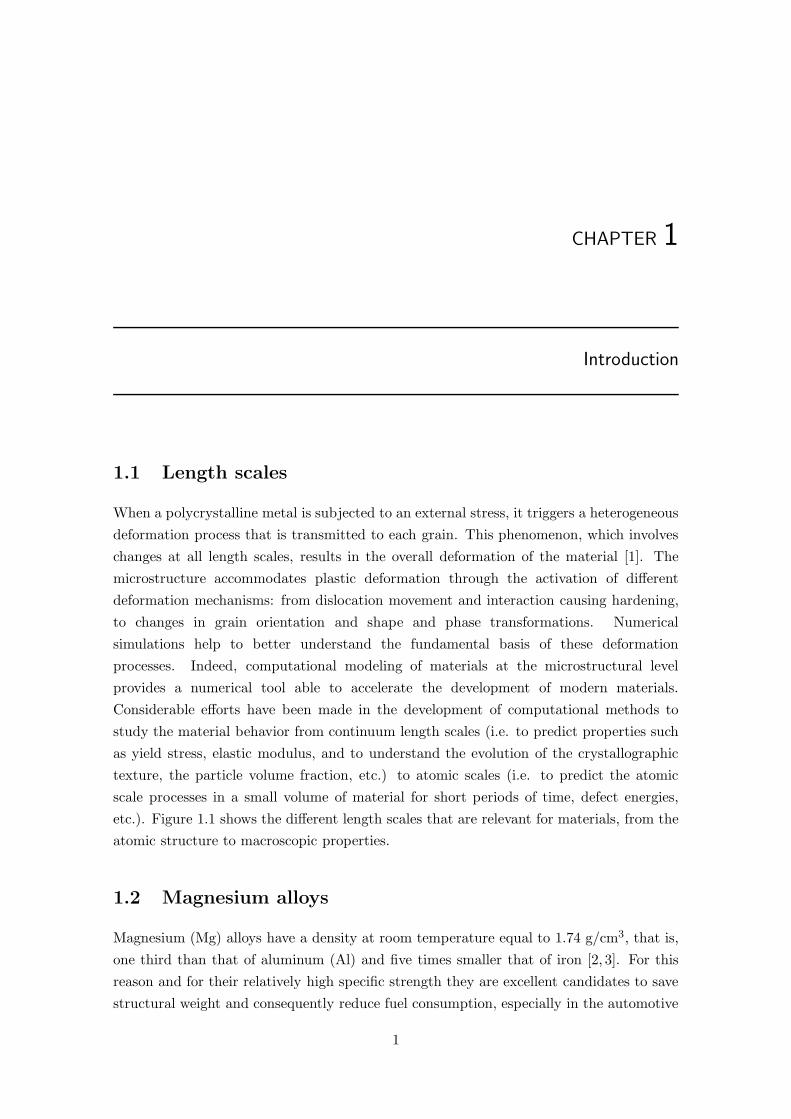
etc.). Figure 1.1 shows the different length scales that are relevant for materials, from the
atomic structure to macroscopic properties.
1.2 Magnesium alloys
Magnesium (Mg) alloys have a density at room temperature equal to 1.74 g/cm3, that is,
one third than that of aluminum (Al) and five times smaller that of iron [2, 3]. For this
reason and for their relatively high specific strength they are excellent candidates to save
structural weight and consequently reduce fuel consumption, especially in the automotive
1

2
Figure 1.1: Multiscale modeling framework of materials across the different length scales.
industry [2–7]. There is also a tendency to promote these materials for aeronautical
applications [8]. These materials have also other useful properties such as shielding against
electromagnetic waves, vibration damping, dent resistance, machinability, and low toxicity
in humans [6]. However, Mg has shortcomings such as insufficient strength, especially at
high temperature, limited elongation and heat resistance, as well as low resistance to
fire and corrosion [6]. Mg alloys are thus still subject to intense research campaigns. In
particular, the micromechanics of deformation are still not fully understood and neither
simulations nor experiments alone can possibly unravel the remaining unknowns.
Mg is an alkaline earth metal which belongs to Group 3 of the periodic table. It
thus has a similar electronic structure to Be, Ca, Sr, Ba and Ra. Indeed, it is the
eighth most abundant element in the earth’s crust and the third most plentiful element
dissolved in the seawater [9]. Mg presents a hexagonal close-packed (HCP) structure. The
lattice parameters for pure Mg estimated at room temperature are a = 0.32092 nm and
c = 0.52105 nm with axes a1 = a2 = a3 = a 6= c and angles α = β = 90°, γ = 120° [9]
(Figure 1.2). The c/a ratio is 1.6236 which is close to the ideal value of 1.633. Therefore,
Mg may be considered almost as perfectly closed packed. The c/a ratio influences the
activation of the different deformation mechanisms in Mg alloys and, in general, in HCP
materials [10].
Various authors have provided overviews on the deformation mechanisms in HCP
metals [11–18]. In any polycrystalline material, five independent systems must be active to
able to undergo a general homogeneous deformation without producing cracks [19]. HCP
metals have a lower number of independent slip systems for each deformation mode than
metals with crystalline lattice body centered cubic structure (BCC) or face center cubic

1.2. Magnesium alloys 3
Figure 1.2: The HCP structure of Mg.
Deformation mode Plane Direction
Basal 〈a〉 {0001} 〈1120〉
Prismatic 〈a〉 {1010} 〈1120〉
Pyramidal 〈a〉 {1011} 〈1120〉
Pyramidal 〈c+ a〉 {1122} 〈1123〉
Tensile twin {1012} 〈1011〉
Compression twin {1011}, {1013} 〈1012〉
Table 1.1: Planes and directions of main deformation mechanisms in Mg and Mg alloys.
structure (FCC). The deformation mechanisms of Mg and its alloys that are operative
at low strain rates have been extensively investigated over the past years [13–18, 20–47].
Plastic deformation is accommodated by slip along the 〈1120〉 direction (〈a〉 direction) in
basal ({0001}), prismatic ({1010}) and pyramidal ({1011}) planes. Moreover, slip along
the 〈1123〉 direction (〈c + a〉 direction) in pyramidal {1122} planes has been observed [36].
Deformation is also accommodated by the activation of twinning, mainly in {1012},
{1011}, and {1013} planes. Twinning is a mechanism which allows plasticity in the
〈1011〉 direction (〈c〉 direction). This deformation mode is a polar mechanism [26], that is,
{1012} twinning is activated by a tensile stress parallel to the c-axis (“tension or tensile
twin”) [40] while {1011} and {1013} twinning occur under compression parallel to the
c-axis (“compression twins”) [41]. At low temperatures and at low strain rates, tensile
twinning is one of the most important deformation mechanisms [15, 30, 33, 36, 43, 48].
Table 1.1 summarizes all slip/twin modes for Mg and Mg alloys (Figure 1.3). The diversity
of possible deformation mechanisms substantially complicates the deformation behavior
of HCP metals in general.
The critical resolved shear stress (CRSS) is the minimum stress required to activate
dislocation movement along a specific slip plane and slip direction. The resolved shear
stress along a specific slip direction on a particular slip plane (σs) must reach the
CRSS for plasticity to occur. This may be expressed as follows for a unidirectional
stress: σs = σncosφ cos λ ≥ CRSS, where σn is the applied stress, and φ and λ are

4
Figure 1.3: Main deformation mechanisms in Mg crystals.
the angle between the stress axis and the slip or twin plane normal and the slip or
twinning direction, respectively. The product cosφ cos λ is termed Schmid factor (SF)
[49]. Although widely spread values have been reported for the CRSS in different slip
and twinning systems for Mg alloys [15, 27, 30, 33, 36, 43], it is generally accepted that
CRSSbasal < CRSStwinning < CRSSprismatic ≤ CRSSpyramidal. Figure 1.4 [50] shows
the variation in the calculated CRSSs for basal and non-basal slip (prismatic slip and
pyramidal slip), as well as for twinning for the Mg AZ31 alloy (Mg-3wt.%Al-1wt.%Zn) at
quasi-static and high strain rates as a function of temperature T . The CRSS for basal slip
and {1012} twinning are believed to be temperature and strain rate independent. However,
the CRSS for prismatic and pyramidal systems decreases with increasing temperatures,
reaching smaller values than the CRSS of {1012} twinning at T > 277 � [9,28,34,50–53].
Twinning takes place profusely at a high strain rate even at temperature as high as
400 � [33, 50,52,53].
The activation of the different deformation modes in Mg and its alloys is also strongly
influenced by the crystallographic texture [10,14,16,22,32,35,37,42,44,50,54–63]. In the
following, the basic understanding of texture is reviewed.
1.3 Texture
Texture is the distribution of crystallographic orientations in a polycrystalline material.
Many materials properties are dependent on texture: Young’s modulus, Poisson’s ratio,
strength, ductility, toughness, magnetic permeability, electrical conductivity and thermal

1.3. Texture 5
Figure 1.4: CRSS variations for the different slip/twin systems as a function of temperatureand strain rate for a Mg AZ31 alloy [50].
expansion [64]. The effect of texture on properties is exploited in materials technology in
order to produce materials with specific characteristics, e.g. in deep drawing processes [65].
The texture has to rely on a quantitative description of orientation characteristics
given by “components” or preferred orientations, and “intensity” which is the volume
fraction of material associated to each component. A weak or random texture is
formed by many components and with very low intensity; a strong texture is formed
by a few components with a very high intensity. In the particular case of metals,
thermomechanical processing leads to the development of specific textures. Fabrication
methods like die-casting processes result in random textures [27, 66], while extrusion,
forging and rolling, promote strong textures and, as a consequence, lead to high anisotropy
[10,44,45,57,58,60,62,66–69].
The most common representation of texture is the so-called direct pole figures,
which are stereographic projections of the orientations of the crystallites. Stereographic
projections allow to transform three-dimensional (3D) information of a crystal into two-
dimensional (2D) representations [64,70]. In order to specify an orientation, it is necessary
to define two coordinate systems, one associated to the specimen and the other to the
crystal. In general, the specimen coordinate system is related to its geometry. For
rolled materials, the axes are: the rolling direction (RD), the direction perpendicular
to the rolling plane (ND) and the transverse direction (TD). Figure 1.5 illustrates how the
(0001) direct pole figure corresponding to a rolled Mg sheet is built. Figure 1.5(a) shows
the dominant orientations of the crystallites. In Figure 1.5(b) one of those crystallites is
placed at the center of a semi-sphere and the (0001) direction is projected on that semi-
sphere. Next, a straight line joining the intersection point and the south pole is drawn.
The intersection between such line and the equatorial plane is termed a (0001) pole. A top-
down view of the equatorial plane and the mentioned (0001) pole is schematically drawn in
Figure 1.5(c). A complete representation of the (0001) direct pole figure requires carrying
out the same procedure for all the crystallites contained in the polycrystal. Representations

6
Figure 1.5: Representation of the direct pole figures of a rolled Mg sheet.
of other (prismatic, pyramidal) direct pole figures involve projecting the corresponding
directions. Figure 1.5(d) illustrates the (0001), (1010) and (1011) poles of a rolled Mg
AZ31 sheet. Alternatively, the orientation of a specific direction in the specimen (i.e. the
extrusion axis in an extruded bar) can be projected onto the crystal coordinate system.
This representation is called an inverse pole figure.
The orientation of any given crystal in space can be obtained from the specimen
coordinate system by performing three rotations given by the so-called Euler angles
(ϕ1,Φ, ϕ2). Although, there are several other conventions for expressing the Euler angles
(Kocks, Roe, Canova) [70], Bunge’s convention is the most commonly used [71, 72]. The
Euler angles are illustrated in Figure 1.6, where XYZ corresponds to the reference specimen
coordinate system and X’Y’Z’ corresponds to the crystallite system. Initially, both systems
are coincident. In a first step, the crystallite system is rotated by an angle ϕ1 around the
Z’-axis (or Z-axis). Then, the crystallite is again rotated by an angle Φ around the X’-axis

1.3. Texture 7
Figure 1.6: Euler angles. The specimen coordinate XYZ is shown in black, the crystallitesystem X’Y’Z’ is shown in red [64].
(in its new position) and, finally, by an angle ϕ2 around the Z’-axis (in its new position). In
general, for a triclinic crystalline structure, the Euler angles are comprised in the following
intervals: 0° ≤ ϕ1 ≤ 360°, 0° ≤ Φ ≤ 180°, and 0° ≤ ϕ2 ≤ 360° [64]. Any given crystal
orientation has an associated orientation matrix g whose elements are functions of the
Euler angles.
g =
(
cosϕ1 cosϕ2 − sinϕ1 sinϕ2 cosΦ sinϕ1 cosϕ2 + cosϕ1 sinϕ2 cosΦ sinϕ2 sinΦ
− cosϕ1 sinϕ2 − sinϕ1 cosϕ2 cosΦ − sinϕ1 sinϕ2 + cosϕ1 cosϕ2 cosΦ cosϕ2 sinΦ
sinϕ1 sinΦ − cosϕ1 sinΦ cosΦ
)
(1.1)
There are two main approaches to measure the crystalline orientation. One involves
averaging a large volume of a polycrystalline aggregate (macrotexture) and the other
focuses on measuring the orientations of individual crystals (microtexture). The
macrotexure is commonly measured experimentally by X-ray diffraction (XRD) or by
neutron diffraction techniques. The direct output from these measurements are incomplete
pole figures in which the information associated to the outer ring is missing due to the
impossibility to obtain sufficient diffracted intensity under low incidence. From these,
the orientation distribution function (ODF), which indicates the probability of finding a
volume element within the material with a specific crystalline orientation, may be obtained.
For the case of HCP metals, five measured pole figures are required to calculate the
ODF. Finally, complete pole figures can be calculated by projecting the 3D information of
the ODF into different planes. Microtexture is measured mainly by electron backscatter
diffraction (EBSD), a technique in which an electron beam is used to scan an area of the
sample surface. At each scanning step the orientation information is stored in the form
of Kikuchi patterns. By comparison of two neighboring orientations, the misorientations
between them may be analyzed. Thus, this method, although lacking the statistical rigor
of macrotexture approaches, provides not only a spatial distribution of orientations but
also a description of the grain boundary (GB) nature (mesotexture).
A GB in a polycrystalline material is a region separating two crystals of the same
phase and different orientation. GBs might be described by means of the corresponding

8
angle/axis pair (θ/r), where θ is the angle (misorientation angle) that one crystal lattice
must be rotated around axis r in order to bring it into coincidence with its neighbor [64].
The misorientation matrix might be calculated from the orientation matrices of two
neighboring grains, g1 for crystal 1 and g2 for crystal 2, by:
M12 = g−11 · g2 (1.2)
From the misorientation matrix M12, the θ/r pair can be calculated as followed:
r1 = m23 −m32
r2 = m31 −m13
r3 = m12 −m21
cos θ = (m11+m22+m33)−12
(1.3)
where mij |i,j=1,...,3 corresponds to the components of the misorientation matrix M12 and,
r1, r2 and r3 are the components of rotation axis r.
For HCP metals, there are 12 crystallographically-related M′
12 matrices which are
generated by premultiplying the misorientation matrix M12 by the symmetry operator
Si |i=1,...,12: M′
12=Si ·M12. Therefore, there are 12 different rotations that could restore
the crystal 2 into coincidence with crystal 1. Each M′
12 is associated to different θ/r pair.
By convention the smallest θ is selected. The GBs can be classified depending on θ [73]:
� Low angle boundary: θ < 5°
� Intermediate angle boundary: 5° ≤ θ < 15°
� High angle boundary: θ > 15°
Rolled sheets and extruded bars of conventional Mg alloys usually have strong textures.
The former consist of a basal fiber with a common 〈0001〉 direction parallel to the normal
direction and the latter of a prismatic fiber with a common 〈1010〉 direction parallel
to the extrusion direction. In Del Valle et al. [67] the distribution of misorientation
angles for a Mg AZ31 alloy with a basal fiber texture, a prismatic fiber texture, and
a random texture were calculated (Figure 1.7). The basal texture is characterized by a
uniform probability between 0° and 30° (the rotation axis coincides with the c-axis). The
prismatic texture is characterized by a uniform distribution in the misorientation angles
between 0° and 90°. Figure 1.7(b) shows the distribution corresponding to a random
aggregate of HCP crystals which has a maximum at 90°, as well as the distribution of
misorientation angles corresponding to a basal fiber with a spread lower than 30° which
presents a maximum at 30°. Therefore a change in texture systematically involves a change
in the GB distribution. The mechanical behavior of Mg alloys is highly dependent on the
character of the misorientation distribution. In fact, the type of GB influences directly
the flow stresses and specific phenomena such as twin propagation [74–76].

1.4. Motivation 9
Figure 1.7: (a) Probability distribution vs. θ corresponding to an aggregate of HCPcrystals with basal and prismatic fiber textures. (b) Probability distribution vs. θ of arandom aggregate and of a basal fiber with a spread lower than 30° (adapted from [67]).
1.4 Motivation
Structural alloys and many emerging multifunctional material systems derive their
desirable combinations of properties largely from the heterogeneity of their structure at
various length scales. The basic deformation mechanisms of a material inherently depend
on the crystal structure, the alloy composition and the processing conditions, which can
cause drastic texture and microstructure changes.
Mg alloys can be classified for structural applications into two important groups
attending to the manufacturing method: wrought Mg alloys (i.e. rolled Mg alloys) and
die-cast Mg alloys. Rolled Mg alloys generally present a strong texture which renders their
deformation strongly anisotropic. This added complexity will lead to the activation of one
deformation mechanism rather than another depending on the direction and orientation
of the applied load. As such, a thorough and comprehensive crystal plasticity model
including both twin and slip systems as well as, more importantly, their interactions
through hardening mechanisms should constitute a powerful numerical tool to relate the
activity of different deformation mechanisms to the mechanical behavior and the texture
evolution. High pressure die-casting (HPDC) is the most common manufacturing process
for Mg alloy components used for automotive as well as for numerous other applications.
Unfortunately, casting processes usually lead to the formation of significant amounts of gas
and shrinkage microporosity, which adversely affect the mechanical properties (ductility,
toughness and fatigue resistance). Consequently, the determination of the 3D micropore
distribution and its incorporation into an adequately calibrated continuum model is of
considerable practical relevance. Systematic research efforts to understand the mechanical

10
behavior of Mg alloys have only been carried out for the last decade, and thus significant
work must still be done before these materials can be widely commercialized [77].

CHAPTER 2
State of the Art
2.1 Rolled Mg alloys: the influence of texture on the
mechanical behavior
Wrought Mg products, such as extruded profiles, rolled sheets and forgings, present high
strength and ductility. However, these alloys also have several limitations. For instance,
the Mg AZ31 alloy which is one of the most common Mg sheet alloys, develops a strong
basal texture and a non-homogeneous recrystallized grain size or partial recrystallization
during the rolling process leading to limited room temperature formability and very high
anisotropy in the mechanical behavior, particularly at room temperature [78].
As mentioned briefly in the previous chapter, slip in HCP metals takes place along the
〈1120〉 (〈a〉) direction on basal and non-basal ({1010}-prismatic, {1011}-pyramidal) planes.
Additionally, second order pyramidal 〈c+ a〉 slip has been observed on {1122} planes [36].
Deformation can be also accommodated by twinning (mainly extension twinning on {1012}
planes). The room temperature CRSS associated with tensile twinning in polycrystalline
Mg alloys, such as AZ31, is moderately higher than the basal slip CRSS, but significantly
lower than that of any non-basal slip CRSS [15, 27, 30, 33, 36, 43]. In agreement with this
trend, earlier studies reported that slip on basal planes and {1012} twinning are the main
deformation mechanisms during uniaxial deformation at low temperatures and low strain
rates in randomly oriented Mg polycrystals of conventional grain sizes (∼ 10 − 50 µm)
[13–15,17,20,22]. Non-basal slip systems are also active, albeit to a lesser extent [32,36,38].
The activity of different deformation modes is highly dependent on temperature and initial
texture [35,44].
Rolled Mg sheets usually present a strong basal texture, i.e. the c-axes of most grains
are parallel to the ND. In this case, when compression is carried out along ND, both
basal slip and {1012} twinning are not favored and thus non-basal slip [36] and {1011}
11

12
twinning [38] are activated at the early states of deformation. Non-basal slip systems are
also activated when tension tests are carried out along RD or TD [36,38]. On the contrary,
when a Mg sheet is compressed at room temperature along RD, i.e. the compression axis
is perpendicular to the c-axes in most grains, {1012} twinning predominates at the early
stages of deformation, causing grains to rotate ∼ 86.3° [26] and thus the c-axes to become
closely aligned to the ND. Significant strain hardening ensues due to slip-slip, slip-twin
and twin-twin interactions. The activation of different deformation mechanisms due to
the different angles between the loading direction and the c-axis causes an asymmetry in
the yield stress [25,34,43].
Non-basal dislocations, including 〈c+ a〉, have often been reported as a necessary
accommodation for deformation in regimes of high stress concentration [32, 79, 80].
However, the net contribution of second-order pyramidal 〈c+ a〉 slip to the macroscopic
strain in Mg alloys has been controversial for decades. This mechanism, if active, would
provide six independent deformation modes, thus increasing significantly the ductility
and the isotropy of Mg alloys. The activity of 〈c+ a〉 slip during room temperature
deformation is still a subject of debate. Due to its high CRSS, this deformation mode
may only be activated when the compression axis is parallel to the 〈0001〉 axis, as neither
the basal, the prismatic nor the tensile twinning systems are favored. This occurs, for
example, in the following two cases. The first case is a rolled and annealed Mg sheet
with strong 〈0001〉 texture subjected to compression along ND. Some authors have indeed
reported the occurrence of 〈c+ a〉 slip under such conditions [16, 27], although others
have found evidence of the accommodation of such deformation by a double twinning
mechanism [55, 81]. The second case is when, during compression of the same strongly
texture sheet along RD, twinning orients most grains with the c-axes parallel to the
compression axis during the first stages of deformation (i.e. extension twinning results
in an 86.3° reorientation of the basal pole approximately [26]). The operation of 〈c+ a〉
slip during the last stages of deformation has been reported under such conditions by
[59]. Other investigations report that strain is, instead, accommodated by the activation
of other mechanisms, such as a combination of basal and pyramidal 〈a〉 slips [3], the
increasing activity of basal slip [43] or the simultaneous operation of basal slip and double
twinning [81].
Such controversy is by definition difficult to solve by experimental means, requiring
in situ simultaneous tracking of slip/twin system activities and texture evolution. In this
example as in many others, it is thus convenient to approach the problem with the help
of crystal plasticity numerical simulations (Section 2.4).
2.2 Fundamentals of twinning
Twinning is a key deformation mechanism in HCP metals [26] and, in particular, in Mg
alloys [78]. The propensity for twinning has a tremendous impact on the mechanical
behavior of these materials, as it dramatically affects their yielding behavior [60], work

2.2. Fundamentals of twinning 13
hardening and ductility [51, 63, 82], as well as the activation of the different dynamic
recrystallization mechanisms [44, 83–86]. The twinning activity in Mg alloys is highly
dependent on the testing conditions and is, in general, enhanced with increasing strain
rate and low temperatures [52,87].
Mg alloys twin mainly on {1012}, {1011} and {1013} planes [26,78]. The {1012}〈1011〉
system, consisting of six equivalent variants, gives rise to a shear (γ = 0.1289) that results
in an extension of the c-axis [40]. The room temperature CRSS associated with tensile
twinning in pure polycrystalline Mg and in conventional alloys such as Mg AZ31 alloy is
moderately higher than the basal slip CRSS, but significantly lower than any non-basal slip
CRSS. Thus, profuse tensile twin nucleation, propagation and growth are observed at this
temperature. Twinning on {1011} and {1013} planes is associated with a compression
along c-axis [41]. These compression twins are much less abundant, because the room
temperature CRSS corresponding to this deformation mode is relatively high, of the order
of the non-basal slip CRSS [87], and they involve larger shuffles than tensile twinning [26].
Thus, the latter has been more profusely studied. In this work, the term twinning will
hereafter refer to tensile twinning. The influence of microstructure on twin nucleation,
propagation and growth phenomena is complex and still not well understood [34,61,88,89].
Grain orientation has been found to strongly influence the likelihood of twin nucleation
and, to a greater extent, of twin growth. Accordingly, grains favorably oriented for
twinning have a larger probability of forming at least one twin, and variants with the
highest SF tend to grow to a greater length [34, 61, 88–90]. However, twinning has been
observed in grains with a wide range of SF [89–94]. Variant selection has been linked to the
accommodation work needed in neighboring grains [93,94] in such a way that twins with
low SF may be preferred if the associated accommodation strains result in a better overall
energy balance. In general, the formation of secondary and tertiary twin variants has been
related to the presence of local stresses that may differ significantly from the externally
applied stress [48,92]. The effect of grain size on twinning has been intensively investigated.
It has been commonly reported that twinning is enhanced with increasing average grain
size [30, 34]. However, recent statistical studies [48, 89] have revealed that, while the
number of twins per grain is strongly related to grain size, the probability of twinning is
independent of the grain diameter, at least when the latter is larger than a few microns,
thus questioning the validity of a Hall-Petch dependence on twin nucleation [34,58,95,96].
The influence of the nature of GB on twinning has been significantly less studied.
GB are favorable sites for twin nucleation, as this process requires large stresses and
large defect sources [48, 74]. Quantifying the influence of GB misorientation on twinning
is a challenging task. Common post-mortem characterization techniques such as EBSD
do not allow one to distinguish whether, for example, two twins that meet at a GB,
termed adjoining twin pairs (ATPs), are a result of nucleation of the twin pair or of
twin transfer across the boundary. Recently, Beyerlein et al. [48, 89] and El-Kadiri
et al. [75, 76] have shown clear evidence that ATPs occur most frequently at low to
moderate misorientation GB (θ < 15°), suggesting that these GBs constitute preferred

14
sites for twin nucleation. These studies further ascribe the non-Schmid behavior of
twinning to local stress fluctuations at GB. Similar effects have been also considered
in FCC metals [97, 98]. However, the influence of GB on twinning is still not well
known. In particular, further studies are required to explain the influence of specific
GB misorientation angles on plasticity in the vicinity of the boundaries as well as how the
latter influences macroplasticity of Mg alloys.
2.3 Die-cast Mg alloys: the influence of porosity on the
mechanical behavior
The vast majority of all Mg components are produced by die-casting. They have several
advantages such as lightness, high specific strength, good machinability, good castability,
low melting temperature and melting energy [3, 7]. In particular, HPDC is the leading
processing technology for Mg components in the automotive industry as it allows forming
parts with complex geometries in one single operation with a limited cost.
In HPDC the molten metal is injected into the die at a high speed until the cavity is
completely filled. In order to reduce the volume fraction of pores and casting defects, a
pressure of approximately 400-500 bar is subsequently applied and withdrawn only when
the solidification process is complete. The heat released by the part is mostly eliminated
through the casting-die interface [99]. Finally, the part is rapidly removed from the die.
The most common die-cast Mg alloys belong to the Mg-Al series (AM60, Mg-6wt.%Al-
0.5wt.%Mn and AZ91, Mg-9wt.%Al-1wt.%Zn).
Even though HPDC was invented more than a hundred years ago, relatively few studies
relating the casting parameters to the resulting microstructures exist to date [100–103].
This is motivated by the large cost of setting-up and maintaining HPDC facilities in a
research laboratory. A large number of studies have tried to relate HPDC microstructures
to their mechanical behavior [104–116]. In general, it is agreed that porosity is the
microstructural feature that has the most deleterious effect on the mechanical properties.
In particular, the presence of pores gives rise to fracture at smaller strains than in
their wrought counterparts. Furthermore, the current impossibility to reproduce 3D
pore distributions in different HPDC cycles leads to a large variability in the tensile
ductility of different components, thus constituting a serious limiting factor for the wide
commercialization of HPDC Mg parts. Fracture has been reported to initiate at the largest
microvoids [113] and at porosity segregation zones [111]. It has been proposed that tensile
ductility is not related to the bulk volume fraction of pores, but to the area fraction of
the pores at the fracture surface [107–110,114,115].
It is known that porosity and its negative effects on ductility might be reduced by
applying a hydrostatic pressure [117, 118]. Biner et al. [117] evaluated the effects of
hydrostatic pressures up to 1,104 MPa on the densification of iron compacts with porosity
levels ranging from 0.3% to 11.1%. The decrease in porosity resulting from pressurization

2.4. Continuum models for HCP materials 15
was more pronounced in samples with higher initial volume fraction of pores. The variation
of the porosity level with the applied hydrostatic pressure was found to agree well with
a modified Gurson’s model including internal pressure in gas pores [119, 120]. Uniaxial
deformation under pressure has also been found to result in higher tensile ductilities due to
the progressive suppression of macrovoid formation within necked regions [118, 121, 122].
At sufficiently high pressures, the fracture mode was observed to change into a shear
dominated mechanism.
Quantification of the 3D porosity distribution in die-cast alloys is a very complex task.
However, this would significantly help to improve casting processes in order to design
cast components with improved properties. Moreover, inclusion in materials models of
a realistic description of the porosity distribution would undoubtedly constitute a major
step forward towards the design of advanced die-cast Mg alloys.
2.4 Continuum models for HCP materials
The mechanical behavior of polycrystalline materials, such as Mg alloys, can be
investigated by using different experimental techniques, which allow to characterize
and analyze several microstructural features and provide fundamental information and
understanding. However, experimental approaches usually require the use of sophisticated
equipment, careful material manufacturing and preparation and complicated post-
processing. They are also generally expensive and time consuming. Computational
mechanics thus appears as a valuable tool to complement experimental campaigns.
Two modeling approaches aimed at tackling the difficulties characteristic of rolled (i.e.
strong anisotropy) and die-cast (i.e. porosity evolution) Mg alloys discussed previously,
are presented in this section.
2.4.1 Crystal plasticity modeling
Despite the availability of other simulation techniques, such as dislocation dynamics
[123–127] or atomistic simulations [125, 128, 129], the finite element method (FEM)
remains by far one of the few techniques able to accurately describe polycrystalline plastic
deformation while avoiding the drastic length and time scale limitations plaguing the
two other techniques. Note that there has been some attempts to bridge scales between
techniques [130,131], but without fully alleviating these restrictions. The crystal plasticity
finite element method (CPFEM) has increasingly gained momentum in the field of metals
modeling and particularly in multiscale mechanical and micromechanical modeling. In
these approaches one typically assumes the stress response at each macroscopic continuum
material point is given by one crystal or by a volume averaged response of a set of
grains. The latter method naturally involves local homogenization [132]. Homogenization
techniques [27, 133–143] allow by definition for homogenized calculations of an overall

16
polycrystal with a decreased computational effort, but are consequently not as flexible as
FEM for microstructural evolution studies (e.g. Zhao et al. [144]).
If FCC and BCC crystal plasticity continuum models have already been extensively
studied [132, 138, 145–157], similar efforts have been much scarcer for HCP metals
[62, 158–165]. Despite the relatively ancient interests in HCP metals, the intrinsic
mechanisms of HCP crystalline deformation, such as twinning (generally more present than
in FCC and BCC metals), twin-slip interaction, or twin polarization among others, are
still, as of now, not fully understood [128,129,150,166]. Among these efforts, Staroselsky
and Anand [158,159] developed a non-hardening rate-independent model of Mg AZ31 alloy
aimed at reproducing the experimental behavior of tension and compression tests. Graff
et al. [160] presented a crystallographic model of Mg but without taking into account the
reorientation of the twinned volume. Mayeur and McDowell [161] developed an HCP model
for Ti-6Al-4V alloy, in which twinning is less likely to occur. Tang et al. [162] proposed a
crystal plasticity model aimed at simulating cup drawing of Mg AZ31 alloy and Mayama
et al. [62] studied the effect of twinning deformation and rotation in a crystal plasticity
model on pure Mg deformation. Prakash et al. [167] modeled the evolution of texture of Mg
AZ31 alloy but without differentiating between the different cross-hardening mechanisms.
Choi and coworkers [163, 164] proposed a similar model focusing their analysis on stress
concentration and texture evolution of Mg AZ31 alloy at high temperature, in which case
the sequence of mechanisms of deformation is intrinsically different. Levesque et al. [165]
developed a model for Mg AM30 alloy (Mg-3wt.%Al-0.5wt.%Mn) at high temperature
but without taking into account slip-twin interaction. Finally, Izadbakhsh et al. [168]
proposed a complex model a priori involving primary, secondary and tertiary slip systems
with primary and secondary contraction/extension twin systems. Because of the significant
amount of accounted mechanisms, this approach however involves a daunting number of
parameters difficulty identifiable experimentally, and leading to the non-uniqueness of the
solutions.
2.4.2 Mechanical twinning in CPFE models
Early material models consider slip as the major plastic deformation mechanisms (Taylor
[19], Peirce et al. [169,170] and Asaro and Needleman [171]). It is well known that plastic
deformation due to crystallographic slip induces a gradual texture evolution as a function of
imposed strain. However, tensile twinning in Mg alloys results in an abrupt 86.3° rotation
in the crystal lattice of a grain [26]. Therefore, special considerations are needed for the
twinning mechanisms and hence, their incorporation into suitable continuum models.
Incorporating twinning into models of plasticity in Mg alloys has proved challenging.
Two main approaches have been proposed [132]: one typically assumes the stress response
at each macroscopic continuum material point to be potentially given by one crystal, and
the other considers a volume averaged response of a set of grains comprising the respective
material. The latter is named homogenization schemes such as visco-plastic self-consistent

2.4. Continuum models for HCP materials 17
(VPSC) models [27, 133, 136, 139–141, 172]. Both approaches can successfully predict
strain hardening and texture evolution during plastic deformation [27, 159]. However,
in the attempt to capture twinning phenomena, some differences arise. Van Houtte [173]
proposed a model where the swift crystallographic rotation due to twinning is driven by a
statistical criterion based on the volume fraction of the twinned regions in the grain and
entire polycrystal aggregate. This assumption is called predominant twin reorientation
(PTR) method and twinning is considered to be a pseudo-slip mechanism [83], and a grain
is allowed to reorient if an accumulated value reaches a specified threshold. The PTR
scheme has been successfully implemented in VPSC models [172, 174, 175], as well as in
CPFEM [158, 159]. The effect of deformation twinning promotes a heterogeneous stress
concentration inside the grains as well as in the GBs. Some efforts have been carried out
to study the twin-parent (original grain) grain interaction: one investigates the stress state
inside the twin at twin inception [176] and another load sharing or interaction between
child (new twinned domain) and parent [175]. These efforts are based on self-consistent
models which typically assume a uniform strain state within a grain and as a consequence,
several effects like misorientation between two neighboring grains and grain diameter or
volume on nucleation of twins or twin variant selection, as well as, stress concentration due
to GB geometry are ignored. Recently, Beyerlein et al. [48, 74] have proposed to include
a probabilistic approach that takes into account fluctuating stresses at GB. Alternatively,
models based on CPFEM can potentially successfully predict the heterogeneous stress
concentration at the grain level during deformation as well as the activation of more than
one twin variant in the parent grain. Despite some efforts in this direction [177–179], the
existing CPFE models to date are largely insufficient to explain how deformation twinning
affects the stress concentration at GBs or twin boundaries in Mg AZ31 alloys during plastic
deformation.
2.4.3 Continuum models for porosity evolution
Die-cast Mg alloys present in general a certain volume fraction of microporosity which
adversely affects the mechanical behavior. Additionally, the microstructure is composed
by dendrites and irregularly shapes of crystals which are affected by the inherent anisotropy
of HCP structures. As a consequence, modeling the mechanical response of these alloys
remains a major challenge.
Two main approaches can be considered: dilatational plasticity and polycrystal
plasticity. Early models of dilatational plasticity based on limit analysis of an isotropic
hollow sphere were proposed by Rice and Tracey [180] and developed later by Gurson [120].
A study based on the combination of dilatational plasticity and single crystal plasticity
was carried out to study void growth in single crystals [181]. This study showed a strong
effect of the intrinsic crystal plastic anisotropy on void growth. Moreover, homogenization
formulations based on classic self-consistent models have been proposed to capture some
effects related to the polycrystalline character of the matrix in the voided aggregate [182].

18
A recent study based on the fast Fourier transform [183] has been proposed along
those lines [184]. This sophisticated method allows to compute void growth in porous
polycrystalline materials, deforming in a dilatational viscoplastic regime. However, this
formulation requires periodic microstructures and regular computational grids, making
them less general than classical CPFE models.
In the particular case of casting materials, several studies have aimed, modeling
the correlation between ductility and porosity [104–106, 116]. Some have attempted to
include 3D characteristics of the porosity distribution into models of cast alloys [185–187].
The 3D geometry of the pores was measured using X-ray computed tomography (XCT)
techniques or by serial sectioning combined with metallographic observations. In Ref. [185]
a significant fraction of pores is measured and the methodology to include this fraction in
a FE mesh is described. In Ref. [186] a single pore is taken into account. Vanderesse et
al. [187] utilize a relatively large microstructural volume of a cast Al alloy as an input for
FE calculations. Further work is clearly needed in this area if realistic models of HPDC
Mg alloys with good predictive capability are to be developed.
2.5 Objectives
This PhD thesis constitutes an attempt to improve toward the design of advanced Mg
alloys and it will result in the definition of polycrystalline models integrating both the
texture and the porosity distribution, which will allow for the prediction of the mechanical
behavior of these materials under a wide range of conditions.
The project is divided into several specific objectives:
1. Development of a CPFE model for HCP materials deforming by slip and twinning
(and where both can interact) and application of this model to a rolled Mg AZ31 alloy
sheet. In this initial stage, a simplified cubic grain topology will be used.
2. This CPFE model will then be used to represent more realistic polycrystalline
features accounting for the topology of the grains. In the extended model, a 3D polycrystal
will be represented as a 3D Voronoı tessellation with multiple elements per grain, thus
allowing for the study of the local intragranular mechanical fields. The validation will be
carried out with a rolled Mg AZ31 alloy sheet.
3. Analysis of twin-GB interactions in a rolled Mg AZ31 alloy sheet by three-
dimensional electron backscatter diffraction (3D EBSD) and using the extended CPFE
model previously developed.
4. Study of the effect of hydrostatic pressure on the porosity distribution in a die-cast
Mg AZ91 alloy by XCT. Development of a FE model making use of an isotropic hardening
law as a first approximation. The model will represent a real 3D pore distribution of a
die-cast Mg AZ91 alloy obtained from XCT. Study of the effect of anisotropy of the HCP
lattice of Mg alloys on the evolution of the porosity with the hydrostatic pressure.

CHAPTER 3
Experimental Campaign
3.1 Material
The materials investigated are commercial Mg alloys with additions of Al and Zn (AZ
series). Al is the most commonly used Mg alloying element as it is one of the few metals
that dissolves easily in Mg, improving both strength and hardness. Zn is the second
most commonly used alloying element and contributes to improve the strength at room
temperature as well as the corrosion resistance. Moreover, AZ-based Mg alloys contain
manganese, which provides high ductility and fracture toughness as well as better corrosion
resistance [3,4]. In particular, two Mg alloys are used in this thesis: AZ31 and AZ91 alloys.
3.2 Microstructural characterization
The microstructure of the investigated materials has been analyzed by optical microscopy
(OM). The details of the apparatus utilized are included in the corresponding following
chapters. The macro- and microtextures have been examined by XRD and EBSD.
Furthermore, this thesis constitutes an attempt to generate 3D representations of
the microstructure by the use of novel techniques such as 3D EBSD and XCT.
3D characterization of a sample is critical in order to have a correct understanding
of the role microstructure plays in a particular material property. Moreover, 3D
observations are of considerable practical relevance for computational modeling where
realistic microstructural information is of vital importance to render accurate simulations.
Detailed information about these techniques is provided below.
19

20
3.2.1 Measurement of macrotexture by X-ray diffraction
Macrotextures were measured by the “Schulz reflection method” [64, 188]. Figure 3.1(a)
shows a picture of the X-ray diffractometer utilized. This equipment is furnished with
a texture goniometer which is depicted schematically in Figure 3.1(b). A sample with
a flat surface is placed in a special holder located at the inner surface of the Euler ring
(goniometer) in such a way that the irradiated surface always contains a tangent to the
focus circle intersecting the X-ray source and the detector. The ring rotates around its
vertical diameter (angle ω) until the X-ray incidence angle corresponds to the desired
Bragg reflection (h=(h,k,l)) [64, 188]. Then, the sample holder is rotated at steps of
3° around a direction perpendicular to the ring (angle χ) in order to allow the (h,k,l)
planes of the different crystallites to reach the corresponding exact Bragg position. At
each χ step, the sample rotates 360° around an axis perpendicular to the sample surface
(angle ϕ). At each sample position, the diffracted intensity is collected by the detector.
χ varies from 0° to 75°, as higher angles give rise to a very small diffracted intensity.
The information collected using this method is later utilized to calculate the ODF from
which, subsequently, the calculated pole figures are derived, as explained in Section 1.3.
The specific characteristics of the diffractometer and the radiation utilized, as well as the
sample preparation procedure, are described in the corresponding following chapters.
(a) (b)
Figure 3.1: (a) X-ray diffractometer used in this work. (b) Schematic illustrating thetexture goniometer and the corresponding rotation angles.
3.2.2 Measurement of microtexture by electron backscatter diffraction
3.2.2.1 2D EBSD technique
Microtextures were measured by EBSD. Figure 3.2 shows a schematic of the EBSD system.
It consists basically of a scanning electron microscope (SEM), a CCD camera and a
computer with the software to analyze the orientation data. The samples are placed
into the SEM in a special holder with a high inclination (usually 70°) to the horizontal.
This reduces the penetration of the beam and therefore, the absorption, and ensures that

3.2. Microstructural characterization 21
Figure 3.2: Schematic drawing of the EBSD system.
the diffracted signal is more intense. The inclination of the holder has been optimized,
moreover, to guide the diffracted signal towards the CCD the camera.
The electron beam hits an individual crystallite and is diffusely scattered in all
directions. There must always be some electrons arriving at the Bragg angle (θB) at
every set of lattice planes, and these electrons can then undergo elastic scattering to give
a strong, reinforced beam. Since diffraction of the electrons through θB is occurring in all
directions, the diffracted radiation emerges along the surface of a cone (Kossel cone) [64].
These Kossel cones will intersect the phosphor screen, forming the so-called Kikuchi lines,
which are shown in Figure 3.3(a). Each pair of parallel lines represents a lattice plane and
the width between lines is an angular distance of 2θB which in turn is proportional to the
interplanar spacing. The set of Kikuchi lines corresponding to an individual crystallite
forms a Kikuchi pattern (Figure 3.3(b)).
(a) (b)
Figure 3.3: (a) Origin of Kikuchi lines [64]. (b) Kikuchi pattern.

22
The image of Kikuchi patterns on the phosphor screen is captured by the camera. After
being integrated and filtered, the signal is digitized and sent to a work station provided
with a program that helps to determine the orientation and save the data analyzed in a file.
As the beam sweeps the sample along a predefined path, orientation data from adjacent
positions will be acquired and recorded. When comparing two consecutive orientations it is
possible to obtain information about the misorientation or the nature of the grain boundary
that separates them. Then the software is employed to produce orientation image mapping,
pole figures representing the texture, disorientation distribution histograms, etc.
3.2.2.2 3D EBSD technique
Fully automated 3D orientation microscopy systems combining SEM, focused ion beam
(FIB) and EBSD have been developed in the last few years [64,189–191]. FIB uses a finely
focused beam of gallium ions (usually 30 kV Ga+) to mill slices of the target material.
After each slice has been removed, the EBSD technique is used to obtain a 2D orientation
map from the fresh surface (Figure 3.4). This cycle is repeated several times. Finally,
all the 2D maps are reassembled and the volume of interest is reconstructed. This serial
sectioning method is extremely laborious. The main challenge is controlling the sectioning
depth, obtaining flat and parallel surfaces, and correctly redetecting and aligning the 2D
maps corresponding to each section.
Figure 3.4: Schematic representation of the grazing-incidence edge-milling method [192].
The 3D EBSD technique used in this work was developed by the Max-Planck Institute
for Iron Research in Dusseldorf, Germany (MPIE) in collaboration with EDAX/TSL and
Zeiss, Figure 3.5(a). The FIB column is positioned opposite to the EBSD camera [192]
(Figure 3.5(b)), which allows a precise and quick change of the sample from the FIB
position (stage tilt of 34°) to the EBSD position (stage tilt of 0° and sample tilt of 70°). The
set-up for 3D EBSD measurements corresponds to that followed by A. Khorashadizadeh
[193]. The sample is fixed on a holder and it is inserted into the microscope. First, the
sample is aligned for EBSD analysis and then the stage is tilted into the FIB position (34°).
After identifying the SEM and FIB beam cross-over point, the FIB position is saved. In

3.2. Microstructural characterization 23
(a)
(b)
Figure 3.5: (a) (FIB)-FEG-SEM dual beam instrument; (b) Schematic representation ofthe tilt geometry [192].
order to find the precise position after every new cycle, a cross marker is performed by
milling on the sample surface close to the current measurement area. This cross is detected
afterwards at the beginning of each new milling process. In order to prevent shadowing
from the side walls of the analyzed area during the process, these side walls are milled with
a current of 2 nA, and thus, the investigated area is bounded by 55° of side walls. The fine
milling is performed using a beam current of 500 pA. The volume of material that can be
analyzed depends on several circumstantial factors: amount of instrument time available,
the fidelity of the data required, the nature of the studied problem and the amount of
effort required. However, the principal limiting factor is given by the edges of the pattern
which can become shadowed when a given width is reached.

24
The milling method used in this work is named grazing-incidence edge-milling
[190, 192]. For this method, the sample is required to have a sharp rectangular edge,
which can be obtained by thorough mechanical grinding and polishing. Therefore, milling
is performed at grazing-incidence to one surface of this sample edge. Tremendous efforts
have to be done in order to obtain an area of the interest of the microstructure close to
the sample edge. The schematic strategy is represented in Figure 3.4.
Reassembly of all the 2D EBSD maps to reconstruct a 3D orientation volume is carried
out using the Qube software developed by MPIE [194]. Initial preparation of the individual
slice images is performed using the batch processing function of the EDAX-TSL OIM
Analysis software package. This function allows cleaning-up all the 2D images, map
construction and image storage. Subsequently, all 2D EBSD maps will be ready to be
imported into the 3D software.
3D EBSD has proven to be a powerful technique for 3D microstructure characterization
on several issues such as recrystallization [85,195], microstructure and texture investigation
of nanostructured materials [196], plastic zones below nanoindents in single crystals
[197–199], and fatigue cracking [192]. In this work 3D EBSD will be utilized to obtain a
better understanding of the twinning mechanism in Mg alloys.
3.2.3 X-ray computed tomography fundamentals
XCT is a non-destructive technique for the characterization of material microstructure in
3D at micron level spatial resolution [200–202]. It shows all the microstructural features
such as phases, inclusions, cracks, pores, etc., provided the spatial resolution is high
enough. These features are obtained through the modification of the attenuation (in the
case of absorption tomography) or of the optical phase (phase contrast tomography) along
the path of X-rays. The 3D information provided by XCT can be extracted and quantified
by applying image analysis procedures to the reconstructed volumes. These characteristics
make XCT a powerful technique that has been used over the past twenty years in material
science research for microstructural and defects characterization damage assessment,
dimensional inspection, non-destructive testing, to name few [203, 204]. Additionally a
major advantage is that no careful specimen preparation is needed.
XCT is based on X-ray radiography, which represents a “projection” of the X-
ray absorption coefficient along the X-ray path through the investigated material. A
tomography scan or tomogram consists in recording X-ray radiographies at many different
angles, i.e. by rotating the object about a single axis. Therefore, the tomogram is
mathematically reconstructed to produce a 3D map of X-ray absorption in the volume.
The 3D digital volume is typically presented as a series of 2D slices images where each
voxel (i.e. a volumetric pixel) represents the X-ray absorption at that point. A typical
tomographic set-up is observed in Figure 3.6, in which the object is located between the
X-ray source and the detector. The X-rays, emitted from the source, pass through different
parts of the specimen placed on a rotation stage and the signal is attenuated by scattering

3.2. Microstructural characterization 25
and absorption. There are three dominant physical processes responsible for attenuation
of an X-ray signal: photoelectric absorption, Compton scattering and coherent scattering.
The photoelectric effect is the dominant attenuation mechanism at low X-ray energies, up
to approximately 60-100 keV. Compton scatter becomes important at higher energies up
to 5-10 MeV. Thus, for X-ray absorption tomography the energy range considered varies
between 6 to 100 keV.
Figure 3.6: Schematic of a XCT acquisition configuration for cone beam geometry [205].
The X-ray intensity I(x, y) is acquired by a photo detector which records the
radiographies. Mathematically, a radiographic projection can be described according to
Lambert-Beer’s law [206, 207]. It relates the ratio of the transmitted (I) to the incident
(I0) intensity to the integral of the linear absorption coefficient of the material (µ), which
depends on the material and on the X-ray energy, along a straight path s(x, y). For a
monocromatic and parallel X-ray beam it can be written as:
p(t) |θ = − lnI
I0=
∫
Γµ(x, y)ds (3.1)
In the (x,y) plane (normal to the axis of rotation) the object can be represented by a
spatial function of X-ray absorption, f(x, y). Therefore, an absorption profile p(t, θ) on an
axis t is created by the projection of any set of parallel X-rays passing through the object.
The intensity profile is acquired for each θ increment (Figure 3.7).
Once the projections are recorded, the next step is to obtain the tomographic
reconstruction itself which is based on Radon transform [206, 207]. This states that
the reconstruction of the object f(x, y) with unknown density is possible from the X-
ray attenuation projections acquired at infinite rotation angles, p(t, θ). Then, the Radon
transform represents the scattering data obtained as the output of a tomographic scan.
The theory governing the tomographic reconstructions is given by the Fourier slice theorem

26
Figure 3.7: Schematic of the X-ray absorption model used for tomographic reconstruction[201].
(or projections theorem) which gives a connection between the Radon and the Fourier
transform. In the case of parallel beam geometry, the slices of the sample corresponding
to different heights can be treated independently and it is also sufficient to record the
projections for half turn due to mirror symmetry, i.e. p(t, θ + π)=p(−t, θ). The Fourier
transform provides a direct solution to the reconstruction problem, but its implementation
is hard and unstable. In practice, the filtered back projection (FBP) algorithm is one of
the most common methods for tomographic reconstruction [206,207]. FBP states that the
back projection is obtained by assigning to each point of the object the average intensity of
all the projections that pass through that point. The back projected image is, however, a
blurred version of the original object. Therefore, the reconstructed object is filtered using
a high pass filter in combination with a window to decrease noise at high frequencies.
The XCT technique has been used in this work to analyzed the 3D porosity distribution
of an HPDC Mg AZ91 alloy. In particular, the morphology of cavities, the cavity spatial
orientation, and the minimum distance between cavities were characterized. Measurements
were carried out in Nanotom 160NF tomograph (Phoenix, Inc.). The specific working
conditions are described in detail in Chapter 6.
3.3 Mechanical testing
Uniaxial and plane strain tests have been carried out at room temperature and quasi-static
strain rates in order to investigate the mechanical behavior of the materials under study.
Tests were performed in both an electromechanical Servosis ME 405/10 testing machine
and an Instron 3384 system. The specific testing conditions as well as the geometry of the
coupons are described in detail in the corresponding following chapters.

CHAPTER 4
Continuum modeling of the mechanical response of a Mg AZ31 alloy
during uniaxial deformation
In this chapter a CPFE model is developed to predict the mechanical behavior of rolled Mg
alloys. This model complements the model of Staroselsky and Anand [158,159] by adding
differentiated self- and cross-hardening between slip and twin systems and focusing on the
individual calibration of each one of the interaction parameters. The model is calibrated
and validated against uniaxial compression tests of Mg AZ31 alloy along both RD and
ND. The evolution of the texture, the slip/twin activity, and the stress-strain response are
analyzed and compared against experimental results for both cases. Finally, the model is
used to cast light on the controversy on the role of pyramidal slip and a failure criterion
based on slip activity is proposed.
4.1 Experimental procedure
The starting material is a sheet of the Mg AZ31 alloy, with a thickness of 3 mm and a
grain size of ∼ 13 µm. The composition of this material is summarized in Table 4.1.
Uniaxial compression tests were carried out at room temperature and at 10−4 s−1 along
RD in an electromechanical Servosis ME 405/10 testing machine. The specimens were
3 mm×3 mm×4.5 mm prisms. With the aim of analyzing the evolution of texture during
compression, tests were interrupted at several intermediate strains: 2%, 4%, 6%, 11%, and
Al Zn Mn Ca Si
2.5-3.5 0.7-1.3 0.20 min 0.04 max 0.30 max
Cu Ni Fe Others Mg
0.05 max 0.005 max 0.005 max 0.030 max remaining
Table 4.1: Composition of the Mg AZ31 alloy under study (in wt. %).
27

28
14%. Additional compression tests of 3 mm×3 mm×3 mm specimens were carried out
along ND under the same conditions of temperature and strain rate. A note should be
made that compression along RD is equivalent to a compression perpendicular to the c-
axis while compression along ND is equivalent to a compression parallel to the c-axis. For
both compression cases (RD and ND), three tests were carried out exhibiting a reasonable
reproducibility, and the two experimental stress-strain curves used for calibration (Figure
4.4) correspond in both conditions to the average of the three associated tests. The textures
of both the as-received and deformed Mg AZ31 alloy samples were measured by the Schulz
reflection method in a Philips X’Pert-Pro Panalytical X-ray diffractometer furnished with
a PW3050/60 goniometer. The radiation used was β-filtered Cu Kα. The surface area
examined was about 2 mm2. The polar angle ranged from 0° to 75° in steps of 3°. The
irradiation time at each step was 2 s. The measured incomplete (1010), (0002), (1011),
(1012), (1120) and (1013) pole figures were corrected for background and defocusing using
the Philips X’Pert software. The MTEX Matlab open source software [208] was then
utilized to calculate the ODF from the corrected pole figures and, from the ODF, the final
complete pole figures. Sample preparation for texture measurement included grinding
with increasingly finer SiC papers, whose grit size ranged from 320 to 2,000.
4.2 Numerical set-up
In this section, the constitutive framework chosen in this work is introduced, followed by
a description of the FEM set-up and calibration.
4.2.1 Constitutive framework
The constitutive framework proposed in this work is based on a single-crystal plasticity
framework modified to account for twinning reorientation. It closely follows the work
of Staroselsky and Anand [158, 159]. For completeness, a summary of its formulation is
provided. The novelties of this new model are subsequently highlighted.
4.2.1.1 Crystal plasticity continuum formulation
The total deformation of a crystal is the result of three main mechanisms: dislocation
motion within the active slip systems, twinning motion within the active twin systems
and lattice distortion. Following Lee [209], the deformation gradient tensor F can be
uniquely decomposed following:
F = Fe · Fp (4.1)
where Fp and Fe are respectively the deformation gradient tensor accounting for the
cumulative effect of dislocation motion and shear due to twinning, and the elastic distortion
of the crystal lattice, with det(Fe) > 0 and det(Fp) = 1 (Figure 4.1). This distortion gives
rise to the Cauchy stress σ.

4.2. Numerical set-up 29
Figure 4.1: Multiplicative decomposition of the deformation gradient F.
The deformation power per unit reference volume is thus defined by:
P = P : F = Se : Ee + (Ce · Se) : Lp (4.2)
where
P = det(F)σ · F−T (4.3)
Se = det(Fe)Fe−1 · σ · Fe−T (4.4)
Ce = FeT · Fe (4.5)
Ee =1
2(Ce − I) (4.6)
Lp = Fp · Fp−1 (4.7)
are respectively the first Piola-Kirchhoff stress tensor, the second Piola-Kirchhoff stress
tensor relative to the relaxed configuration, the right Cauchy-Green elastic deformation
tensor, the Green-Lagrange elastic strain and the plastic velocity gradient tensor.
Assuming a linear elastic relation, as it is usually done in metallic single crystals, the
constitutive equation is given by [159]:
Se = C : Ee (4.8)
where C is a fourth-order anisotropic elasticity tensor.
By projecting Se on the slip system i and twin system α, the resolved shear stress in
systems i and α are then given by:
{
τ i = (Ce · Se) : Si0
τα = (Ce · Se) : Sα0
(4.9)
where{
Si0 = mi
0 ⊗ ni0
Sα0 = mα
0 ⊗ nα0
(4.10)

30
are the Schmid tensors for slip system i and twin system α in the reference configuration.
In this equation, slip (resp. twin) system i (resp. α) is characterized by a unit normal ni0
(resp. nα0 ) to the slip (resp. twin) plane, and a unit vector mi
0 (resp. mα0 ) denoting the
slip (resp. twin) direction in the reference configuration.
Extending Taylor [19] and Rice [210] approaches to include the twinning components,
the kinematics of dislocation of motion and twin shear can be described by:
Lp =∑
i
sign(τ i)γiSi0 +
∑
α
sign(τα)γαSα0 (4.11)
where γi (resp. γα) is the shear rate on slip (resp. twin) system i (resp. α). Subsequently
for simplification, superscripts i and j will refer to a slip system, and α and β to a twin
system.
Introducing si/α as the CRSS in system i/α, the conditions for slip and twinning, as
well as the associated flow rule, are written as:
φi = |τ i| − si ≤ 0
φα = τα − sα ≤ 0
γi/α ≥ 0, and γi/αφi/α = 0
(4.12)
Note that the unidirectionality of tensile twinning {1012}〈1011〉 is accounted for by
relaxing the absolute value condition on the resolved shear stress τα.
In Staroselsky and Anand [159], the flow rule was modified to include grain boundary
deformation mechanisms within a “grain boundary layer” surrounding each grain. This
feature was accounted for by adding an isotropic plasticity flow rule component to
Equation (4.7) weighted by a given grain boundary proportion. However, for the grain size
observed in the experimental samples (∼ 13 µm), it has been shown that grain boundary
deformation mechanisms are not significant at room temperature [69]. As a consequence,
this term was not included in the model presented here.
Finally, the evolution equations for slip and twin CRSS are given by a generalized
linear hardening relation between the CRSS and the shear rates of all systems:
si =∑
j
hij γj +∑
β
hiβ γβ
sα =∑
β
hαβ γβ +∑
j
hαj γj(4.13)
In this expression, hij , hiβ , hαβ and hαj are the hardening moduli accounting
respectively for the slip-slip, twin-slip, twin-twin and slip-twin interactions. In Staroselsky
and Anand [159], the moduli were taken equal to zero under the assumption that the
hardening mechanisms were exclusively due to grain boundary mechanisms. Here, the

4.2. Numerical set-up 31
moduli are chosen to follow power law type relations:
hij = qijhj, with
qij = (qsl + (1 − qsl)δij)
hj = h0;sl
(
1− sj
ssl
)asl
hαβ = qαβhβ , with
qαβ = (qtw + (1− qtw)δαβ)
hβ = h0;tw
(
1− sβ
stw
)atw
hiβ = h0;tw−sl
(
1− sβ
stw−sl
)atw−sl
hαj = h0;sl−tw
(
1− sj
ssl−tw
)asl−tw
(4.14)
where δij is the Kronecker symbol, where quadruplets (h0;sl, h0;tw, h0;tw−sl, h0;sl−tw),
(ssl, stw, stw−sl, ssl−tw) and (asl, atw, atw−sl, asl−tw) are respectively the reference self-
hardening parameters, the saturation stresses and the hardening exponents for (slip-slip,
twin-twin, slip-twin, twin-slip) interactions, and where (qsl, qtw) are the ratios of reference
cross-hardening parameter to reference self-hardening parameter for (slip, twin). Simple
power-law relations such as the ones proposed here in Equation (4.14) are commonly used
in crystal plasticity continuum models [132, 146, 147, 151, 155, 158, 163, 164]. Note that
other formulations using Voce-type law or more generally hyperbolic functions could also
be used; but all generally present the same drawback of being exclusively dependent on
the CRSS, occulting any dependence on the lattice defect population for example [132].
However, in the interest of limiting the number of parameters introduced in the current
model, the choice was made to use a simple power-law, while acknowledging the fact that
other models more physically grounded could potentially be used [211]. Future studies will
aim at studying the effect of the choice of the hardening model on the crystal deformation.
In the following, the CRSS will be defined by s0;sl and s0;tw for the slip sl and twin tw
system respectively, where sl ∈ {basal, pyr〈c+ a〉, pyr〈a〉, prism} for the basal, pyramidal
〈c+ a〉, pyramidal 〈a〉 and prismatic slips, respectively.
4.2.1.2 Crystal rotation
A total Lagrangian scheme is used for texture updating, see [158] for more details. Note
that such scheme can predict accurately the final texture but that intermediate textures
might not be predicted with the same precision.
By definition, shear by twinning is accompanied by a local rotation of the crystal. This
transformation is defined for HCP metals by the rotation matrix [158]:
Rα = 2nα ⊗ nα − I (4.15)
where nα is the current twin plane normal of the twin system α. This transformation
rotates the crystal such that the final orientation mirrors the inital one with respect to
the twin plane. Such change is of significant importance as a given crystal, once rotated
by nearly 90° as a consequence of twinning, might have an unfavorable orientation for

32
further twinning, thus switching the main crystal deformation mechanisms from twin to
slip driven mechanisms.
It is followed here the model proposed by Van Houtte [173]. The twin volume fraction
fα evolution in twin system α is characterized by:
{
fα =∫ t0 f
αdt
fα = γα
γ0
(4.16)
where γ0 is the twinning shear. A random number ζ ∈ [ζmin, ζmax], where ζmin and
ζmax represent the lower and higher bound for twinning event, is picked at a given time
t, and, within the chosen representative volume element (RVE) of an individual crystal,
fmax = maxα(fα) is compared to ζ. If fmax > ζ, the RVE is assumed fully rotated, the
crystal lattice (i.e. all current slip and twin systems normals and directions is rotated the
twin system α for which fα=fmax following Equation (4.15), and the volume fractions are
reinitialized to zero).
4.2.2 Finite element model
The constitutive model was used in the FE program ABAQUS/Explicit [212] by
implementing the previous constitutive law in a “user material” subroutine. In this sub-
section, the FE discretization of the polycrystal model is presented first, followed by the
model calibration.
4.2.2.1 Finite element discretization
Following the example of Staroselsky and Anand [159], the polycrystalline sample is
idealized as a stacked structure of 12×12×18=2,592 linear cubic elements with reduced
integration and hourglass control. Each element can represent a full crystal and is assigned
its own crystal lattice orientation. Such approach can present serious limitations when used
for studying microstructural evolution within a grain (Chapter 5), where multiple elements
are needed. However its flexibility constitutes a significant computational advantage for
simulation models aimed at studying the overall behavior of full polycrystalline samples,
such as in this work. The mesh is shown in Figure 4.2.
The experimental uniaxial compression tests (Section 4.1) were simulated by imposing
Dirichlet boundary conditions on the top and bottom surfaces of the model. Both
were constrained laterally to account for the absence of gliding during contact in the
experimental set-up, the top surface was displaced at a given velocity along the vertical
direction while the bottom one was fully constrained. The model being rate-independent
and the problem quasi-static, the actual compression velocity and the density could be
chosen arbitrarily so as to minimize inertial effects and computational calculation time.
The resulting simulation is thus fully quasi-static, which is a good approximation of the
very low rate of the experimental compression (10−4 s−1).

4.2. Numerical set-up 33
Figure 4.2: Uniaxial compression numerical tests along ND and RD. The resulting vonMises stress field is plotted for both cases.
Note finally that for all the simulations presented in this work, both spatial and
temporal convergences were verified.
4.2.2.2 Model calibration
Compression/double twinning The significance of compression and double twinning
in accommodating c-axis compression in Mg alloys is still not clear. Some studies have
recently reported the occurrence of compression and double twinning in polycrystalline
Mg alloys during c-axis compression [38,44,60,213,214]. However, traces of these types of
twins are only observed in very small regions, often very close to the fracture surfaces. It
has nevertheless been recently reported that, despite the low volume fraction of such twins,
their effect in the hardening of the Mg AZ31 alloy might be important [215]. On the other
hand, it is also widely accepted that pyramidal slip accommodates most of the compression
strain along the c-axis [30, 215]. In view of the controversial role of compression/double
twinning, we have chosen not to include this deformation mechanism in the continuum
model, as a first approximation.
Texture The model was calibrated against the stress-strain curves of Figure 4.4. In
the first case, the c-axis of the overall texture is on average aligned with the compression
direction, whereas, in the second case, it is perpendicular to it. Accordingly, the texture of
the mesh for the compression along RD is rotated by 90° in the mesh for the compression
along ND (Figure 4.2). The initial texture of the numerical model was finally tuned by
adding a gaussian noise (Figure 4.3) to the three Euler angles around each configuration
until an adequate match with the experimental poles figures was reached.
Note that both experimental pole figures seem to be more “diffuse” than the numerical
ones. However, the numerically modeled texture used in this work is chosen to be

34
(a) along ND (b) along RD
Figure 4.3: Comparison between the experimental (top) and the numerical (bottom) initialtexture for the two cases: (a) along ND; (b) along RD.
A B C D E F
0% 2% 4% 6% 11% 14%
Table 4.2: Strain at transition states.
representative of all samples in general. This explains the observed differences between
the pole figure for one given experimental sample and the one for the numerical model,
representative of all samples. Finally, the observed “splitting” in Figure 4.3, typical of
rolling textures in Mg alloys, has been previously attributed to the operation of pyramidal
slip during plane strain deformation [27] and was replicated in the models.
Material parameters The material parameters were chosen according to the following
scheme. Initial parameters were taken out of the literature [50, 51, 158, 159, 164, 216].
The ones that differed within these references were chosen so as to achieve the closest
fit with the experimental stress-strain curves. Finally, the other parameters (namely the
slip-twin/twin-slip hardening and twinning rotation parameters) were calibrated so as to
achieve the best fit while keeping the previous parameters fixed. The final set of parameters
is given in Table 4.3 and the resulting stress-strain curves corresponding to the uniaxial
compressions along ND and RD are shown in Figure 4.4.
For the purpose of analysis, the stress-strain curve for the compression along RD has
been divided into six regions. The deformation states at which one region transitions to
another are marked by A, B, C, D, E and F (Figure 4.4(b) and Table 4.2).

4.2. Numerical set-up 35
0 0.01 0.02 0.03 0.04 0.05 0.06 0.070
50
100
150
200
250
300
True strain
Tru
e s
tre
ss
(M
Pa
)
experiment
simulation
(a) along ND
0 0.02 0.04 0.06 0.08 0.1 0.12 0.14 0.160
100
200
300
400
True strain
Tru
e s
tress (
MP
a)
experiment
simulation
E FDCBA
(b) along RD
Figure 4.4: Experimental and simulated stress-strain curves (true) corresponding touniaxial compression of the Mg AZ31 alloy: (a) along ND; (b) along RD.

36
s0;basal s0;pyr〈c+a〉 s0;pyr〈a〉 s0;prism9 MPa 115 MPa 115 MPa 80 MPa
h0;sl h0;tw h0;sl−tw h0;tw−sl
600 MPa 80 MPa 0 MPa 1200 MPa
sbasal spyr〈c+a〉 spyr〈a〉 sprism15 MPa 190 MPa 190 MPa 150 MPa
s0;tw stw ssl−tw stw−sl
17.5 MPa 100 MPa n/a 100 MPa
asl atw asl−tw atw−sl
0.6 2 n/a 2
qsl qtw ζmin ζmax
4 1 0.75 0.8
γ0 C11 C12 C13
0.129 58 GPa 25 GPa 20.8 GPa
C33 C55
61.2 GPa 16.6 GPa
Table 4.3: Material parameters after calibration.
Note that the hardening related to the effect of slip on tensile twinning was suppressed
based on the relatively scarce (and sometime contradicting) information in the literature
on this interaction, and the observation that the region between the states of deformation
A and C (Figure 4.4(b))1 was found to be only weakly dependent on this parameter even
for large values of h0;sl−tw. Additionally, increasing this parameter would only steepen the
numerical curve away from the experimental one. The (ζmin,ζmax) parameters played an
important role in the C-to-D portion of the curve and the twin-slip hardening parameters
in the C-to-E portion. The final shape of both simulated samples after deformation with
the corresponding von Mises stress fields are shown in Figure 4.2.
Material parameters sensibility A unique set of slip systems will be activated [146].
However, it is not clear whether a calibration based on both considered stress-strain curves
should be enough to guarantee the uniqueness of the set of parameters. For example,
one would want to know whether a set of pyramidal hardening parameters along with
a set of twin hardening parameters could not be exchanged by two other sets without
noticeable differences in the stress-strain curves. To this end, an extensive parameter
sensibility study was done in which each individual parameter is varied by ±20%, ±50% or
±100% depending on the sensibility of the parameter. The strain at which the first major
noticeable influence of these variations on one of the portions of the RD/ND compression
stress-strain curves was then marked down and was reported in Table 4.4. Note that a
non-marked cell does not mean that there is no influence of the parameter but that a much
more important variability has been observed at a different strain (or on the other curve).
1This region should actually a priori be the one most directly influenced by these parameters (influenceof already existing basal slip on nascent twinning)

4.3. Results and discussion 37
Parameters RDA RDB RDC RDD RDE RDF ND
Twin
s0;tw × ×stw ×h0;tw ×atw × ×qtw × ×
Twin Rotationζmin × ×ζmax × ×
Twin-Slipstw−sl × ×h0;tw−sl × ×atw−sl × ×
Slip
s0;pyr × × ×spyr × ×
s0;prism ×sprism ×s0;basal ×sbasal × ×h0;sl ×asl ×qsl ×
Table 4.4: Material parameters sensibility.
Table 4.4 shows that the twinning, twin-slip interaction and pyramidal slip parameters
are successive quasi-independent mechanisms in the compression along RD. Basal and
prismatic slip influences are on the other hand overlapping independently some of the
zones of influence of the other mechanisms, but basal slip parameters do also influence
majoritatively the ND compression. Overall, a proper fit of the stress-strain curves at
states A, B, C, D, E and F as well as for the ND compression curve can be done
with a quasi-independent calibration of twinning, pyramidal and prismatic parameters
majoratively for the RD compression case, and pyramidal and basal for the ND case (with
cross-calibration for pyramidal), in this order. Additionally, the three main mechanisms
(twinning, basal and pyramidal slips) are shown to influence in a complementary manner
the stress-strain curves.
4.3 Results and discussion
In the previous section, the model was calibrated against two uniaxial compression
tests with one unique set of material parameters, validating the ability of the model to
describe the Mg AZ31 alloy deformation mechanisms under both slip- and twin-dominated
deformations. These deformation mechanisms are identified in the following by studying
texture evolution, slip/twin activities and the related controversy on pyramidal 〈c+ a〉
splitting. Finally, a failure criterion based on slip activity is proposed.

38
Figure 4.5: Comparison between {0001} experimental and numerical textures at deforma-tion state A, B, C, D, E and F for the compression along RD.
4.3.1 Texture evolution and slip/twin activities
The {0001} pole figures at the experimental and simulated deformations states A, B, C, D,
E and F for the compression along RD are illustrated in Figure 4.5. Figure 4.6 shows the
normalized overall slip/twin activity vs. the overall strain for both uniaxial compression
cases.
The first observation is that in both cases, basal slip is the overall most important
mechanism. After the initial yielding, the A-to-B region is mostly driven by twinning
despite some basal slip activity. This basal activity is due to the systems that are slightly
tilted and thanks to the very low basal CRSS. The initial presence of twinning is confirmed
by the clear appearance of twin driven lattice rotation, as can be seen in the experimental
{0001} pole figure at state B (Figure 4.5), followed by the sudden drop of its activity
(Figure 4.6(b)).
At state C, the experimental pole figure shows that all the crystals have rotated. It
appears that the simulated results are delayed in this rotation, rotating slowly until slightly
after state D. This delay in the pole figures can be explained by two factors:
� Firstly, it has been experimentally observed that the boundaries of tensile twins
migrate very rapidly [215]. However, the model, because of its one-to-one association
between grain and element, precludes a “gradual rotation” by twin growth within
the grains, making it a sudden switch from one crystalline orientation to another
one (Sub-section 4.2.1.2). This is actually confirmed by comparing the twinning
rotation evolution for the simulation and the experiments (Figure 4.7). In this figure,
the experimental volume fractions of twinned regions in the samples compressed

4.3. Results and discussion 39
0 0.01 0.02 0.03 0.04 0.05 0.06 0.070
0.2
0.4
0.6
0.8
1
True strain
No
rma
lize
d s
lip
/tw
in a
cti
vit
y
Basal
Pyramidal <c+a>
Pyramidal <a>
Prismatic
Twin
(a) along ND
0 0.02 0.04 0.06 0.08 0.1 0.12 0.14 0.160
0.2
0.4
0.6
0.8
1
True strain
No
rmali
zed
sli
p/t
win
acti
vit
y
Basal
Pyramidal <c+a>
Pyramidal <a>
Prismatic
Twin
E FCBA D
(b) along RD
Figure 4.6: Normalized slip/twin activity for both cases: (a) compression along ND; (b)compression along RD.

40
0 0.02 0.04 0.06 0.08 0.1 0.12 0.140
20
40
60
80
True Strain
Ro
tate
d G
rain
s %
experiment
experiment
simulation
simulation
~ 4.5%
Figure 4.7: Experimental and numerical twinning rotation fraction evolution.
uniaxially along RD were calculated at various strain levels from the X-ray ODF
data using the software MTEX. A misorientation of ±30° was used (this value was
identified by means of the orientation spread in the ODF)2. As can be seen, the
inflections of the curves are very similar, but there is a delay of roughly 4.5%.
One more time, this delay is explained by the binary-type rotation of the model,
as opposed to gradual. In other words, the simulation curve on Figure 4.7 is
representative of the averaged fraction of fully rotated grains, and not of the averaged
fraction of rotated lattice within each grain. This restriction of the model will be
solved in future works by considering multiple elements per grain and will be further
discussed in the next chapter.
� Secondly, whereas the experimental pole figures are taken by considering a thin slice
of materials within the bulk, the simulated ones include the whole polycrystal, and,
as can be seen on Figure 4.8, the non-sliding boundary conditions are responsible
for a twin rotation gradient close to the top and bottom surfaces. This restriction
thus leads to an observed delay in the twin rotation when averaged over the whole
sample. For example, at 4% deformation, 13% of all the grains are rotated, but
the outer and center element layers respectively have 1% and up to 27% of rotated
grains (Figure 4.9).
During the rotation from C to D, basal slip activity is slightly increasing before
regaining its previous level after full rotation. Prismatic and pyramidal 〈a〉 activities
are also increasing during this change of crystal orientation, but overall remain relatively
small.
Finally, the D-to-E region (followed by the E-to-F region, where all the main defor-
mation mechanisms saturate) exhibits a transition to pyramidal 〈c+ a〉 slip dominated
2Note that the twinned volume fraction was alternatively calculated in the sample deformed up to4% by EBSD, showing similar results, however the technique described above being more flexible andtime-efficient for post-processing, it was ultimately chosen for this study

4.3. Results and discussion 41
(a) (b) (c) (d) (e) (f)
Figure 4.8: Twinning rotation state in a longitudinal cut of the sample (blue: non-rotated,red: rotated) for the states of deformation A, B, C, D, E and F.
0 2 4 6 8 10 12 14 16 180
5
10
15
20
25
30
Element layer
Ro
tate
d G
rain
s %
Figure 4.9: Twinning rotation fraction as a function of the vertical element layer in thesample at 4% deformation.

42
deformation (Figure 4.6(b)). Such change is explained by the polarity of twinning, pro-
hibiting its activity during compression when the c-axis is aligned with the compression
direction. As a consequence, the next most favorable deformation mechanism is pyramidal
〈c+ a〉 slip (with basal slip present during the whole deformation). This is confirmed in
Figure 4.6(a) where the crystals have the c-axis aligned with the compression axis from the
beginning. In this case, basal slip is dominant at the beginning of the deformation, and
when blocked by the misorientation of the neighboring grains, is transitioned to pyramidal
〈c+ a〉 slip driven deformation. Note finally that all systems did not rotate at stages E
and F as it did experimentally. This delay can be explained by the same factors that
delayed the onset of rotation.
The analysis above shows that, despite its high room temperature CRSS, pyramidal
〈c+ a〉 slip operates in conjunction with basal slip during room temperature compression
of the rolled Mg AZ31 alloy sheet along RD and ND (Figure 4.5). The activation of
these two slip systems explains the texture development as well as the corresponding
stress-strain curves (Figure 4.4). This is consistent with the findings of Yi et al. [59] who
determined the relative slip/twin activities during tension of a Mg AZ31 alloy extruded
bar perpendicularly to the extrusion axis by VPSC modeling, and found that pyramidal
〈c+ a〉 slip does play an important role under such conditions. In their case, however,
the contribution of pyramidal 〈c+ a〉 slip is smaller with respect to the one of basal slip
due to the wider spread of basal planes around the compression axis in their extruded bar
than in the rolled sheet investigated here. Wang et al. [217] also recently calculated the
slip/twin activity during uniaxial deformation of a rolled Mg AZ31 alloy sheet using several
VPSC models. More specifically, they fitted different models to experimental tension and
compression tests along RD and used the same parameters to predict compression along
ND. They concluded that the affine VPSCmodel gives the best overall performance. When
compressing along ND, in both the affine VPSC model and the one presented here, only
basal and pyramidal slips operate. However, the cumulative activity of pyramidal slip
predicted by the affine VPSC model is significantly smaller than the one obtained in the
present work. When compressing along RD, both models predict the activation of tensile
twinning and basal slip in the first stages of deformation, but the relative contribution
of twinning is much smaller when using the affine model than in the observed prediction.
In the last stages of deformation both models predict the activation of both basal and
pyramidal slip. Again, the affine VPSC model predicts a larger contribution of basal
slip. In summary, similar deformation modes are predicted to operate using both the
affine VPSC model and the current CPFE model. However, in all cases, the VPSC
model estimates a higher relative contribution of basal slip. This might be due to the
more diffuse basal texture but such differences certainly highlight the necessity for further
comparisons between different numerical models, where a priori acceptable simplifications
might possibly lead to erroneous description of the deformation mechanisms. Finally, the
activity of pyramidal 〈c+ a〉 slip during the last stages of deformation of a rolled Mg AZ31
alloy sheet compressed along RD at 200 � has also been predicted by Choi et al. [164]

4.3. Results and discussion 43
using a similar model to the one presented in this work. This finding is, however, not very
surprising, as it is well known that the CRSS for pyramidal slip decreases rapidly with
temperature and therefore its activity increases significantly at temperatures higher than
approximately 180 �.
4.3.2 Fracture mechanisms
An analysis of the sample fracture surface suggested that the material failure is stemming
from intragrain semiductile failure (Appendix A). This could a priori indicate the
formation of a shear zone eventually leading to an intragrain failure. In order to confirm
or infirm this hypothesis, a criterion based on the cumulated average slip activity for slip
system i at time t was defined:
Γi =
∫ t
t0
< γi > dt (4.17)
where < γi > is the average slip rate at time t over the full sample, and t0 the time
reference. Note that such criterion is purposefully macroscopically averaged at the sample
level. Defining a criterion at the grain level (thus defining a failure initiation criterion,
see for example Jerusalem et al. [150]) in a model such as here, where grains are modeled
by only one element, would actually miss the purpose of the proposed criterion (defining
overall sample failure).
It has been shown that a dislocation interacting with a twin boundary during twin
growth is not transferred through the twin boundary, but instead is decomposed into
interfacial defects [218]. An intragrain failure criterion based on slip accumulation thus
requires that only the slip activity since the time of the last twin lattice rotation (if any)
should be taken into account. Note that such consideration does not concern the hardening
model, based on the assumption that previous dislocations, even possibly dismantled into
other stacking faults, still participate to the lattice hardening. However the bulk of the
crystal itself does not a priori contain full residual dislocations after the passing of the
twin boundary [218], and its relation to intragrain failure should be reinitialized. The
time at which the stress-strain curve (Figure 4.4(b)) regains a quasi-elastic behavior after
the rotation of the crystals (ǫ(t0) = 6%) was chosen as the “reinitialization time” t0 (in
the ND case, as very little twinning occurs, t0 = 0). Figure 4.10 shows the evolution
of Γi vs. time for all slip systems for both cases (including the reinitialization after twin
rotation when needed) up till experimental fracture. As could be expected from Figure 4.6,
prismatic and pyramidal 〈a〉 slip activity seem highly uncorrelated with a potential slip
related failure mechanism. On the other hand, the cumulated average basal and pyramidal
〈c+ a〉 activity reach the same value of ∼ 0.04 and ∼ 0.015 respectively.
These results alone cannot permit to conclude that basal cleavage or pyramidal 〈c+ a〉
cleavage, is responsible for the material failure. However, Mg alloys fracture mode under
the conditions of temperature (0.33 Tm) and normalized stress (σ/E ∼ 6×10⁻³) examined
in the present paper is of the mixed mode type “cleavage 3/ductile” or “semibrittle

44
0 0.02 0.04 0.06 0.08 0.1 0.12 0.14 0.160
0.01
0.02
0.03
0.04
0.05
True strain
Co
rre
cte
d c
um
ula
ted
av
era
ge
sli
p/t
win
ac
tiv
ity
Basal RD
Basal ND
Pyramidal<c+a> RD
Pyramidal <c+a> ND
Pyramidal <a> RD
Pyramidal <a> ND
Prismatic RD
Prismatic ND
Twin RD
Twin ND
Figure 4.10: Corrected cumulated average slip/twin activity for both cases of compression:along RD and along ND.
intergranular fracture” [219], as substantial plastic strain precedes cleavage. The cleavage
planes vary for different HCP metals. Yoo calculated the ratio between the critical fracture
stresses in basal and prismatic planes for a number of HCP metals [17]. He found out
that basal planes are clearly the most preferred cleavage planes in Zn [17, 220], whereas
prismatic planes are favored in titanium and zirconium. Basal and prismatic planes are,
respectively, those with the smallest CRSS in those metals. Mg is presented by Yoo [17]
as an intermediate case. However, since basal slip is the most active deformation mode,
it seems logical that cleavage is favored in basal planes. In fact, it has been reported
earlier [20] that rolled Mg sheet at room temperature fail along bands formed by grains
in which the basal planes are parallel to the band plane. The easiness of cleavage along
basal planes has also been verified in an Mg AZ31 alloy by Somekawa et al. [58]. It thus
can conclude that basal cleavage is reponsible for the material failure.
As a conclusion, these results suggest: a) that sample failure is directly related
to an excess of basal activity in agreement with experimental observations, probably
primarily due to the formation of a shear zone along the 〈0001〉 direction leading eventually
to material failure: b) that when the compression axis is preferably oriented along
ND, pyramidal 〈c+ a〉 and basal slip activities follow a very similar pattern, working
collaboratively in the same proportion; c) and finally, that the final failure is in any case
independent of the other slip system activity (pyramidal 〈a〉 and prismatic) and more
importantly of the twin activity.
4.3.3 Validation
In the following, the previous study is complemented by using the model on a third
configuration: plane strain compression along RD, constraining along TD. To this end,
a specific die made of hardened stainless steel was designed for such purpose. In order

4.3. Results and discussion 45
to minimize friction effects, the sample surfaces were lubricated using Teflon tape. The
deformation rate was identical to the previous tests (10−4 s−1).
The experiments showed a relatively important variability and a total of four (instead
of three) tests was used for the final averaged stress-strain curve. The experimental stress-
strain curve (with its errorbars) and the numerical one are given in Figure 4.11. The four
stages used in this figure are given in Table 4.5.
0 0.02 0.04 0.06 0.08 0.1 0.120
100
200
300
400
True Strain
Tru
e S
tre
ss
(M
Pa
)
Errorbar Experiment
Experiment
Simulation
A B C D E
Figure 4.11: Experimental and numerical stress-strain curves for the plane straincompression along RD, constrained along TD.
A B C D E
0% 2.5% 4.5% 6.5% 10.3%
Table 4.5: Transition strain between regions for the plane strain compression case.
The two stress-strain curves both present an earlier point of inflection, higher hardening
rates and higher stress values when compared to their respective uniaxial RD compression
counterpart (Figure 4.4). Additionally, the two curves seem to deviate between stages C
and E, incidentally corresponding to the portion of the experimental curve with the most
important variability. In view of this, the simulation captures the experimental behavior
relatively well.
4.3.3.1 Texture evolution and slip/twin activities
The comparison of the {0001} texture between experiment and simulation for these
different stages, and the overall slip/twin activity are given in Figures 4.12 and 4.13,
respectively.
The pole figure evolution is relatively well caught by the simulation, with the same
delay in the crystal rotation as was previously observed (Figure 4.5 and Sub-section 4.3.1).
Furthermore, even accounting for the different strain-to-failure, a comparison between
Figures 4.6(b) and 4.13 exhibits a very similar evolution of twin and basal slip activity
(as well as pyramidal 〈a〉 which remains almost inexistent), but weaker contribution of

46
Figure 4.12: Comparison between {0001} experimental and numerical textures atdeformation state A, B, C, D and E for the plane strain compression along RD, constrainedalong TD.
0 0.02 0.04 0.06 0.08 0.1 0.120
0.2
0.4
0.6
0.8
1
True strain
No
rmalized
sli
p/t
win
acti
vit
y
Basal
Pyramidal <c+a>
Pyramidal <a>
Prismatic
Twin
A B C D E
Figure 4.13: Normalized slip/twin activity for the plane strain compression along RD,constrained along TD.

4.4. Conclusion 47
0.04 0.05 0.06 0.07 0.08 0.09 0.1 0.11 0.12 0.130
0.01
0.02
0.03
0.04
0.05
True strain
Co
rre
cte
d c
um
ula
ted
a
ve
rag
e s
lip
/tw
in a
cti
vit
y
Basal
Pyramidal<c+a>
Pyramidal <a>
Prismatic
Twin
Figure 4.14: Corrected cumulated average slip/twin activity for the plane straincompression along RD, constrained along TD; the dash line corresponds to the acceptablerange of values for the strain-to-failure.
pyramidal 〈c+ a〉 and earlier contribution of prismatic, implying that prismatic slip is
taking over part of the pyramidal 〈c+ a〉 contribution under plane strain conditions, when
compared to uniaxial.
4.3.3.2 Fracture mechanisms
Finally, the fracture criterion proposed in Sub-section 4.3.2 is tested here for the
new configuration. The corrected cumulated average slip/twin activity based on the
methodology described earlier is shown in Figure 4.14.
Note that the experimental curves were averaged up to the smallest strain-to-failure
(10.4%). However, because of the important variability of the experimentally observed
strains-to-failure, which here were spanning a total of 2.6% (10.4%, 10.9%, 11.2%, 11.6%
and 13%), the simulation could possibly be extended up to 13%. As a consequence, the
results in Figure 4.14 were run up to 13%.
As hinted by Figure 4.13, Figure 4.14 exhibits a lower pyramidal 〈c+ a〉 cumulated
average activity than in Figure 4.10, but a higher prismatic activity. The basal activity,
on the contrary, is very similar. More importantly, the failure cumulated average basal
activity threshold of ∼ 0.04, as defined in Sub-section 4.3.2, is reached within the strain-
to-failure range of 10.4%-13%. On the contrary, the pyramidal 〈c+ a〉 threshold of 0.015 is
not reached. Based on the previous discussion, this further validates the fracture threshold
based on basal activity defined and discussed earlier.
4.4 Conclusion
A CPFE model aimed at fully describing the intrinsic deformation mechanisms between
slip and twin systems has been developed. An experimental campaign consisting of a set

48
of uniaxial and plane strain compression tests at room temperature and quasi-static strain
rate, as well as an exhaustive analysis and examination of the crystallographic texture
at different stages of deformation of the Mg AZ31 alloy have been carried out. The
model was then calibrated and validated against these tests. The flexibility of the overall
model was demonstrated by casting light on an experimental controversy on the role of
the pyramidal 〈c+ a〉 slip vs. compression twinning in the late stage of polycrystalline
deformation. Finally, a macroscopic failure criterion based on basal activity was shown to
accurately describe the failure of materials in what would thus be a shear zone along the
〈0001〉 direction eventually leading to material failure. This criterion seems furthermore to
be independent of the twin activity but tightly linked to pyramidal 〈c+ a〉 and prismatic
activities.

CHAPTER 5
3D investigation of grain boundary-twin interactions in a Mg AZ31 alloy
by electron backscatter diffraction and continuum modeling
This chapter presents a combined 3D experimental and modeling approach to gain a better
understanding on twin propagation and growth mechanisms in a Mg AZ31 alloy. The 3D
microstructure characterization was performed by the 3D EBSD technique. The role of
GB misorientation on twin transfer is investigated by analysis of the local plastic 3D state
at the GB interface. Twin growth is evaluated by characterization the 3D twin morphology
and the corresponding crystallographic dependence of the Schmid law. The CPFE model
developed in the previous chapter is extended to include the topological information of
individual grains.
5.1 Experimental procedure
The material studied is a 3 mm-thick sheet of a Mg AZ31 alloy, rolled and annealed, with
an average grain size of ∼ 25 µm and a typical basal texture. As seen earlier, during
compression along RD, twin nucleation and growth proceed readily to the extent that, at
strains of 5%, the tensile twin volume fraction is larger than 50% [88], and many twins have
consumed the entire volume of the original grains. With the aim of investigating the role
of GB on twin transfer, 3 mm×3 mm×4.5 mm prisms (long axis along RD) were machined
and tested in compression along RD at room temperature and at strain rate of 10−4 s−1
in an electromechanical Servosis ME 405/10 machine up to strains of 1.6% and 2.6%.
These small strain levels were chosen with the aim of characterizing the microstructure at
a deformation stage where twin growth is still limited, thus allowing for the evaluation of
twin nucleation and growth events.
The microstructure of the tested samples was investigated along three perpendicular
planes, using 2D EBSD on a FEG-SEM JEOL 6500F equipped with an EDAX/TSL
49

50
system. These measurements allowed for the estimation of twin volume fraction variations
with strain along the three planes of observation, i.e. RD, ND and TD, and the
evaluation of the influence of GB misorientation on the frequency of ATPs. Sample
preparation for EBSD included grinding with SiC papers of grit size ranging from 1,200
to 4,000, mechanical polishing with diamond slurries of 6 µm, 3 µm and 1 µm, and
final electrochemical polishing for 45 s at 20 V, using the AC2 commercial electrolyte.
The microstructure of the sample strained to 2.6% was further analyzed by 3D EBSD-
based orientation microscopy, using serial sectioning with a (FIB)-FEG-SEM dual beam
instrument (Zeiss Crossbeam 1530) [192]. One volume consisting of 50 sections of
dimensions 23 µm×25 µm×100 nm was milled using a 30 kV Ga+ ion beam. Qube was used
for volume reconstruction [194]. Significant efforts were made to select an ideal volume
containing several boundaries with different misorientation angles. The determination of
the active twin variants was carried out by the method of the minimum deviation angle
(θdev) [92]. This method consists of the following (Appendix B): first, the orientation
matrix of each original grain gPiis calculated from the corresponding Euler angles; next,
the six possible twin rotations are applied to each gPito obtain the orientation matrices
corresponding to the six variants gTij; finally, the θdev values between the six calculated
gTijand the orientation matrix of the twins observed experimentally are estimated, and
the smallest θdev is identified as corresponding to the active twin variant.
5.2 Numerical set-up and validation
This work is an extension of the CPFE model previously developed for the Mg AZ31 alloy
in Chapter 4. This extension aims at capturing more realistic polycrystal features by
considering the topological information for the grains. In this model, the polycrystalline
aggregate is represented as a 3D Voronoı tessellation with a large number of elements per
grain, thus allowing for the high resolution study of the local intragranular mechanical
fields. The extended 3D polycrystalline model, whose volume is 1 mm3, consists of 2,592
grains, each one with its own crystallographic orientation, with an overall texture matching
the experimental one. The new mesh, generated using the Neper open-source software
package [221], consists of a total of 475,947 linear tetrahedral elements (Figure 5.1). The
constitutive framework as well as the set of material parameters were taken from the
previous chapter (Table 4.3).
The robustness of the new model presented here was first validated against experiments
and against the previous predictions of the original model described in Chapter 4. The ex-
perimental campaign carried out for model validation consisted of several compression tests
along RD and ND, performed at 10−4 s−1 and room temperature up to different strains
ranging from 2% to 14%. Compression specimens were 3 mm×3 mm×4.5 mm prisms and
3 mm×3 mm×3 mm cubes for the RD and ND tests, respectively. Figures 5.2(a) and (b)
reveal the good agreement reached between two simulated and experimentally measured
true stress-strain curves and the normalized slip/twin activities of both numerical models

5.2. Numerical set-up and validation 51
Figure 5.1: Polycrystalline aggregate mesh of the proposed extended model.
(at the specimen center). Figure 5.3(a) illustrates the evolution of the cumulative twin
volume fraction with strain, measured experimentally by integration of the appropriate
texture components of the X-ray ODF and simulated using both models. Experiments re-
veal an increase in the twin fraction at the early stages of deformation (ǫ < 4%). Although
both models are unable to fully capture the progressive rotations associated with twinning,
the extended model proposed here agrees better with the experimental data. Moreover,
the predictions of the extended model seem to be in good agreement with experiments
reported recently in the same alloy with a different microstructure [222]. Figure 5.3(b)
illustrates the simulated twin volume fraction measured along three planes perpendicular
to RD, ND and TD in the center of the sample. Only a slight difference is observed be-
tween the three curves, in agreement with Ref. [223], which revealed that relevant twin
statistics obtained from 2D EBSD maps at a given specimen location are independent of
the viewing direction. These small discrepancies can be attributed to the geometry of
the twins, depicted in Figures 5.4(a) and (b). These figures illustrate two experimental
volumes reconstructed using several 2D EBSD maps obtained along planes perpendicular
to the RD, ND and TD in the Mg AZ31 alloy sample compressed along RD up to strains
of 1.6% and 2.6%, respectively. The maps were obtained ∼ 1 mm deep below the surface
in each case, implying that they correspond to different locations in the specimen. It can
be seen that a smaller twin fraction (< 10%) is observed in planes perpendicular to the
test direction (RD). These findings are fully captured by the simulations (Figure 5.4(c)),
where the model boundary conditions seem to lower drastically the activity of twinning in
the same locations (Movie 01 in the Supplementary Material on CD-ROM). The present
results are, furthermore, consistent with previous experiments and modeling of twinning
in pure zirconium [223].
Overall, the mesoscopic behavior of the extended model proposed here matches the
averaged mesoscopic behavior of the initial model (Figure 5.1). As the latter was carefully
calibrated against the experimental results in Chapter 4, the new model can thus be

52
0 0.02 0.04 0.06 0.08 0.1 0.12 0.140
50
100
150
200
250
300
350
True strain
Tru
e s
tre
ss
(M
Pa
)
(ND) experiment
(ND) initial model
(ND) extended model (Voronoï)
(RD) experiment
(RD) initial model
(RD) extended model (Voronoï)
(a)
0 0.02 0.04 0.06 0.08 0.1 0.12 0.140
0.2
0.4
0.6
0.8
True strain
No
rmali
zed
sli
p/t
win
acti
vit
y
Basal
Pyramidal <c+a>
Pyramidal <a>
Prismatic
Twin
(b)
Figure 5.2: (a) Comparison of experimental and simulated true stress-true strain curvescorresponding to uniaxial compression along RD and ND; (b) normalized slip/twinactivities for both numerical models (dashed line corresponds to initial model describedin Chapter 4).

5.2. Numerical set-up and validation 53
0 0.02 0.04 0.06 0.08 0.1 0.12 0.140
20
40
60
80
100
True Strain
Tw
inn
ed
vo
lum
e f
rac
tio
n (
%)
experiment
initial model
extended model (Voronoï)
(a)
0 0.02 0.04 0.06 0.08 0.1 0.12 0.140
20
40
60
80
100
True Strain
Tw
inn
ed
are
a f
racti
on
(%
)
Plane perpendicular to ND
Plane perpendicular to RD
Plane perpendicular to TD
(b)
Figure 5.3: (a) Comparison of the cumulative twin volume fraction measured experimen-tally and predicted by the initial model described in Chapter 4 and by the extended model;(b) twin volume fraction predicted by the extended model along three planes perpendicularto RD, ND and TD in the center of the polycrystalline aggregate.

54
Figure 5.4: Qualitative estimation of the twin volume fraction along three orthogonalplanes in the Mg AZ31 alloy tested in uniaxial compression along RD: (a) volumereconstructed from three 2D EBSD maps measured in the sample deformed up to 1.6%;(b) volume reconstructed from three 2D EBSD maps measured in the sample deformed upto 2.6%; (c) twinned regions (dark) predicted by the extended model in a sample deformedup to 5%.
considered equally calibrated. The similarities and differences between both models are
discussed later. Finally, both spatial and temporal convergences were checked for all
simulations.
5.3 Results and discussion
5.3.1 3D variant analysis
Figure 5.5 illustrates the 3D reconstruction of the inverse pole figure maps along RD
obtained by the 3D EBSD technique. The volume dimensions are 5 µm in TD (height,
blue axis), 25 µm in RD (length, green axis) and 23 µm in ND (width, red axis). P1,
P2, P3, P4 refer to the four original grains, and Tij to variant j of grain i. Tables 5.1(a-
d) list the SF corresponding to the six tensile twin variants for each of the four grains
analyzed. The Euler angles (ϕ1,Φ, ϕ2) of all grains and twins analyzed are summarized in
Table 5.1. The minimum θdev approach [92] was used to identify the active twin variants.
This method provides conclusive evidence on the nature of the variant pair activated, i.e.
it allows differentiation between primary, secondary and tertiary variants. The θdev values
corresponding to each of the Tij twins are listed in Tables 5.1(a-d). The minimum θdev
values associated with the active variants are highlighted in bold letters. It can be noted in
Table 5.1 that, within a specific variant pair, the active variants do not always correspond
to those with the highest SF. This can be due to either some ambiguity inherent to the
deviation angle method, which does not take into account the small rotations that might

5.3. Results and discussion 55
Figure 5.5: Sample compressed along RD up to 2.6%. 3D reconstruction of inverse polefigure maps on the RD obtained by the 3D EBSD method. P1, P2, P3, P4 refer to the fouroriginal grains, and Tij to variant j of grain i.
occur due to the simultaneous activation of crystallographic slip, or the fact that the
effective stress state at the grain core may deviate slightly from the macroscopic applied
stress.
In the following, the twin variants present in the four grains of the reconstructed 3D
volume are analyzed. Grain P1 is favorably oriented for twinning and contains three twin
variants: T11 is a primary variant (SF = 0.4759), T12 a secondary variant (SF = 0.1257),
and T13 a tertiary variant (SF = 0.0981). Grain P2 is also favorably oriented for twinning
and, at least within the volume analyzed, contains only one primary variant with a very
high SF (T21, SF = 0.4854). Grain P3 has an orientation that is less favorable for tensile
twinning. In this grain, two variants are active, both with moderate to very low SF: one
primary variant (T31, SF = 0.2074) and one secondary variant (T32 = 0.0486). Grain
P4, unfavorably oriented for tensile twinning, contains one primary variant (T41) with a
moderately low SF (SF = 0.1759).
The morphology of tensile twins, examined using mostly 2D microscopy techniques
such as OM and 2D EBSD, has been commonly described as plate, disk or needle-like [78].
Consistently, it has been reported that the shape of a twin boundary is generally expected
to be either a doubly convex or a planar-convex lens [26]. Thus, models usually consider
twins as lamella of constant thickness or ellipsoidal inclusions [48, 174, 224]. The present
study suggests that twin variant morphology may be related to the corresponding SF.
Figure 5.6 illustrates the 3D geometry of several twin variants. In particular, variant T11
is depicted in Figure 5.6(a). As inferred from 2D observations, the morphology of this
twin, which has a very high SF, resembles that of a plate, with approximately constant
thickness. It spans the entire volume of the scanned grain. Figure 5.7(a) illustrates the

56
(a)
P1: (87.6, 85.8, 277);
T11: (179.4, 83.3, 205.8); T12: (0.2, 36.8, 329.9); T13: (193.9, 24.3, 193.2)
Twin variants SF θdev(T11) θdev(T12) θdev(T13)
(1012) [1011] -0.4759 2.41 60.14 59.72(1012) [1011] -0.4914 4.99 60.65 60.02(1102) [1101] -0.1257 59.85 1.35 60.61(1102) [1101] -0.1339 60.01 8.62 60.29(0112) [0111] -0.0981 60.24 60.47 0.98(0112) [0111] -0.1055 60.37 59.89 6.47
(b)
P2: (81.3, 76.2, 266.4); T21: (354.7, 85.8, 343.6)
Twin variants SF θdev(T21)
(1012) [1011] -0.4854 0.69(1012) [1011] -0.4777 7.99(1102) [1101] -0.2023 60.33(1102) [1101] -0.1973 60.80(0112) [0111] -0.0601 59.68(0112) [0111] -0.0574 60.16
(c)
P3: (268.5, 89.2, 120.9);
T31: (4.2, 58.1, 24.5); T32: (181.7, 61.7, 149.5)
Twin variants SF θdev(T31) θdev(T32)
(1012) [1011] -0.2641 8.38 59.57(1012) [1011] -0.2074 2.34 59.18(1102) [1101] 0.0194 61.70 6.94(1102) [1101] 0.0486 61.34 1(0112) [0111] 0.0316 59.34 60.82(0112) [0111] 0.0591 58.72 61.15
(d)
P4: (316.9, 50.8, 41); T41: (193.1, 50.6, 137.6)
Twin variants SF θdev(T41)
(1012) [1011] -0.1160 7.96(1012) [1011] -0.1759 2.46(1102) [1101] 0.1454 59.54(1102) [1101] 0.1255 58.95(0112) [0111] 0.0500 61.40(0112) [0111] 0.0101 61.12
Table 5.1: SF and θdev corresponding to all the twins contained in the volume of Figure 5.5;the values of the Euler angles (ϕ1,Φ, ϕ2 – in degrees) corresponding to the original grains(Pi) and the twins (Tij) are included. The minimum θdev values are highlighted in boldletters.

5.3. Results and discussion 57
(a)
(b)
(c)
Figure 5.6: 3D morphology of different twin variants: (a) T11 (volume size: 5 µm in TD(blue axis)×10 µm in RD (green axis)×15.8 µm in ND (red axis)); (b) T12 (orange) andT13 (yellow) (volume size: 5 µm in TD×16.2 µm in RD×11 µm in ND); (c) T41 (volumesize: 5 µm in TD×8.8 µm in RD×8.2 µm in ND).

58
0 1 2 3 4 51
1.5
2
2.5
3
3.5
4
Depth (µm)
Ma
xim
um
tw
in t
hic
kn
es
s (
µm
)
T111
T112
T113
T114
(a)
0 1 2 3 4 50
1
2
3
4
5
6
Depth (µm)
Maxim
um
tw
in t
hic
kn
ess
(µ
m)
T12
T13
(b)
Figure 5.7: Maximum twin thickness measured at different heights in grain P1: (a) foreach T11 lamella (the four lamella are named T111, T112, T113 and T114); (b) for secondary(T12) and tertiary (T13) twins.
variation in the maximum thickness of T11 lamella throughout the grain interior. This
plot confirms that the maximum twin thickness is almost constant throughout the grain.
Variants T21, which also have very high SF, are observed to have a morphology similar
to that of T11. Figures 5.6(b) and (c) illustrate the 3D geometry of variants T12, T13
and T41. Two rotated images of each twin variant are presented in order to facilitate the
observation of the 3D structure. These variants, which have small SF (ranging from 0.0981
to 0.1759), are irregularly shaped. In order to assess the validity of 2D estimations of the
twin thickness, the maximum thickness of the T12 and T13 variants at each 2D section
of the analyzed 3D volume is represented in Figure 5.7(b). Large variations are clearly
visible. This figure indicates that twin thickness estimations from 2D characterization
tools may lead to significant deviations from the 3D twin thickness.
The above observations may be rationalized as follows. It has been widely reported
that, during tension or compression loading of single crystals and polycrystals, the first

5.3. Results and discussion 59
twins to form are primary variants, which have the highest SF [26, 174]. At such early
stages of deformation, the stress state at the core of the grains that are favorably oriented
for twinning can be assumed to be relatively homogeneous. Accordingly, one can expect
that primary variants, which have a large tendency to grow [89], adopt a regular (plate-
like) shape, related to the orientation of the uniaxial macroscopic stress. The strain
accommodation by primary variants is, however, limited, and local perturbations due
to the presence of the original GB and of the newly created twin boundaries lead to
intragranular effective stresses that may differ significantly from the macroscopic applied
stress state [224]. Non-Schmid effects, such as the activation of secondary and tertiary twin
variants, have been attributed to the presence of such stress fluctuations [48, 75, 76, 92].
It is therefore suggested that the irregular morphology of secondary and tertiary variants
observed here is related to the heterogeneous nature of the local effective stress field.
Furthermore, it is known that stress fields develop in the vicinity of twin boundaries [224]
and, thus, the presence of the irregularly shaped boundaries of non-primary variants can
be expected to further increase the heterogeneity of the intragranular local mechanical
fields. These findings indicate that twin variant morphology characteristics should be
addressed in models aimed at providing a full description of the mechanical behavior of
Mg alloys and other HCP metals.
5.3.2 Effect of GB misorientation on twin transfer
It has been reported recently that twin nucleation in Mg alloys occurs preferentially at low
angle GB [89]. In particular, the frequency of ATPs has been found to peak at 15%-20%
when the θ is smaller than 15° and to decrease steeply as θ increases, in such a way that,
when θ > 60°, the “crossing frequency” is smaller than 2%. Figure 5.8 illustrates the
variation in the crossing frequency with θ for the Mg AZ31 alloy sample compressed along
RD to a strain of 1.6%. Measurements were performed from 2D EBSD maps obtained
at the center of the specimen along the plane perpendicular to TD. In agreement with
Ref. [89], the crossing frequency peaks at boundaries with θ < 15° and becomes negligible
when θ > 50°.
It can be observed in Figure 5.5 that grain P1 is separated from neighboring grains P2,
P3 and P4 by three boundaries whose misorientation angle/axis pairs (θ/r) are: θP1−P2
= 15.7° [9, -14, 5, -13], θP1−P3 = 22.3° [2, -7, 5, -27], θP1−P4 = 64.3° [8, -22, 14, 7].
The three misorientation angles are pointed out in Figure 5.8 using black arrows. θP1−P2
(15.7°) is relatively small and belongs to the range where ATP form readily. θP1−P3
(22.3°) has an intermediate value included in the range where the formation of ATP starts
to become scarcer, and θP1−P4 (64.3°) is a high angle boundary that severely hinders
twin propagation [75, 76, 89]. In the following, the influence of the θ of the surrounding
boundaries on twin propagation is discussed. A note must be made here that, while
boundary misorientation also has a significant effect on slip activity, the latter will not be
studied here.

60
0 10 20 30 40 50 60 70 80 900
5
10
15
Misorientation angle (degrees)
Cro
ss
ing
fre
qu
en
cy
(%
)
Figure 5.8: Variation in the crossing frequency with respect to the GB misorientationangle measured in the sample compressed along RD up to a strain of 1.6%; the arrowspoint to the θ between P1 and P2, P1 and P3, and, P1 andP4.
5.3.2.1 Low misorientation angle boundary (θP1−P2= 15.7°)
The GB between grains P1 and P2 has a small misorientation, θP1−P2 = 15.7°. Moreover,
grain P2 is equally well oriented for tensile twinning. In fact, the active primary variant
T21 has a SF that is very similar to the one corresponding to the T11 variant. Thus, for
this particular case, this post-mortem study does not allow differentiation between the
following multiple scenarios for twin nucleation: twinning can take place first in grain P1,
in grain P2 or simultaneously in both grains. Figure 5.9 shows two 2D sections of the
volume of Figure 5.5 obtained at different heights in the vicinity of the P1 − P2 GB. It
reveals that T11 and T21 variants meet at the GB forming ATP at most of the heights
examined. These findings suggest that the low misorientation of the GB, together with
the fact that it separates two grains that are very well oriented for tensile twinning,
prevents the development of local stresses that may trigger non-Schmid plastic events.
The plasticity in the vicinity of this GB seems to fully comply with Schmid law and is,
thus, originated in response to the macroscopic applied stress.
5.3.2.2 Intermediate misorientation angle boundary (θP1−P3= 22.3°)
Grain P3 is less favorably oriented for tensile twinning than grain P1, and it is therefore
reasonable to assume that twinning first took place in the latter and that twin propagation
into grain P3 ensued. Figure 5.10 shows a sequence of 2D EBSD maps obtained from the
volume of Figure 5.5 at different heights in the vicinity of the P1 − P3 GB. It can be
seen that one of the T11 variants, labeled T111 in the figure, impinges at the boundary at
all the heights analyzed, triggering the nucleation of variant T32. At a height of 1.6 µm
(Figure 5.10(a)), variant T111 intersects GB P1−P3 at the triple point P1−P3−P4. Then
the intersection moves along the P1 − P3 boundary (Figures 5.10(b-o)), away from this
triple point. The SF of T32 is very low (SF = 0.0486) and, thus does not have a high

5.3. Results and discussion 61
Figure 5.9: 2D EBSD maps in the RD of the GB between grains P1 and P2; map (a)corresponds to a height of 3.4 µm and map (b) to a height of 4.4 µm.
tendency to grow. Its thickness at the P1 − P3 GB is similar to that of the corresponding
T111 variant, but it thins down with the distance away from the GB, ending up in a pointed
tip. These findings illustrate how, as the boundary misorientation angle increases from
15.7° to 22.3°, the formation rate of twin variants deviating from Schmid law with respect
to the macroscopic stress state increases.
Furthermore, these data reveal that the 3D grain morphology and the boundary plane
may also contribute to alter the local stress state, and therefore play an important role in
variant selection. A second T11 variant, which is designated T112 in Figure 5.10, intersects
the triple point P1 − P3 − P4 and remains at that position for a relatively wide range of
heights (Figures 5.10(g-o)), leading to the nucleation of the primary variant T31 (SF =
0.2074). The selection of this variant type, and not of a T32 twin, as in the previous case,
appears to be deeply influenced by the relative orientation of the P3 − P4 GB and the
boundary of the twin generated. As shown in Figure 5.10(a), at the height at which the
T111 variant intersects the triple point, the P3 − P4 GB makes a ∼ 50° angle with the T32
variant generated. However, Figure 5.10(g) reveals that, at the height at which the T112
variant intersects the triple point, the P3−P4 boundary is parallel to the boundary of the
T31 transferred twin.
5.3.2.3 High misorientation angle boundary (θP1−P4= 64.3°)
The GB between grains P1 and P4 is highly misoriented, θP1−P4 = 64.3°. Figure 5.11 is a
sequence of 2D EBSD maps obtained from the volume of Figure 5.5 at different heights

62
Figure 5.10: Sequence of 2D EBSD maps of the GB between grains P1 and P3 in heightsteps of 200 nm; the first slice shown (a) corresponds to a height of 1.6 µm and the finalslice (o) to a height of 4.4 µm.

5.3. Results and discussion 63
Figure 5.11: Sequence of 2D EBSD maps in the RD at height steps of 200 nm, whichillustrate the GB between grains P1 and P4; the first slice shown (a) corresponds to aheight of 1 µm and the final slice (h) to a height of 2.4 µm.
in the vicinity of the P1 −P4 boundary. It can be clearly seen how propagation of the T11
variants is severely hindered by the presence of the GB. This leads to the formation of high
local back-stresses, which trigger a series of non-Schmid effects in the original grain. In
particular, variant T12 is activated, and variant T112 undergoes “double” tensile twinning
(DTT) (pointed out in Figure 5.11 with a black arrow). Tensile twinning of a variant
T112 is forbidden under the sole effect of the applied stress (parallel to RD) and would
require the presence of an effective local stress that lies in a plane perpendicular to RD.
Figure 5.12 illustrates how DTT (shown by black arrows) as well as secondary and tertiary
variants also appear in the interior of the P1 grain. This effect is probably associated with
the build-up of high local stresses due to the presence of the boundaries of the primary
twins T11 [224].
In summary, the influence of the five parameters that characterize GB [225] on twinning
is still not well known, and this investigation analyzes the effect of one of them (θ). For
the first time, 3D aspects of twin transfer across GB have been investigated. The present
results confirm that the GB misorientation has a critical influence on twinning in the
Mg AZ31 alloy, as suggested recently [89]. More specifically, it was observed that low
misorientation GB between grains that are favorably oriented for twinning are regions
where plasticity can be explained by the Schmid law with respect to the macroscopic
applied stress. However, as the θ becomes larger, the probability of non-Schmid events,
such as the nucleation of low SF variants, increases. Finally, highly misoriented GBs
constitute strong obstacles to twin propagation and give rise to high back-stresses, which
trigger local non-Schmid plasticity in the original grain. This study reveals that 3D

64
Figure 5.12: 2D EBSD section of the volume illustrated in Figure 5.5, located at a heightof 4.8 µm.
microstructure characterization by the 3D EBSD technique is critical to relate individual
twinning events with microstructural parameters such as boundary misorientation. The
trends reported here were obtained from the observation of a single volume and, thus,
further work should be carried out to confirm the statistic validity of the conclusions drawn
here. However, these results are consistent with recent reports on the subject [48,75,76,89].
Rolled sheets and extruded bars of conventional Mg alloys usually have strong textures
and, when compressed along RD and the extrusion axis, respectively, many grains are
favorably oriented for tensile twinning [10]. However, depending on the processing
conditions, such as temperature, strain rate, die geometry or reduction ratio, such textures
will consist of single components with a high fraction of low misorientation GB or of fiber
textures with a large fraction of highly misoriented GB [57,78]. The present observations
support the suggestion by El-Kadiri et al. [75] that, in a polycrystal, the twinning stress
is sensitive to the distribution of GB misorientations (sometimes called GB texture).
Furthermore, this study illustrates that, for similar grain sizes, in materials with fiber
textures a high fraction of secondary and tertiary variants, as well as of DTT twins will
be activated, and, thus, a higher strain hardening is expected. The present findings
underline the complexity of twin-GB interactions and emphasize the need to incorporate
heterogeneities in the intragranular stress fields into numerical models [137,139,179,195].

5.3. Results and discussion 65
5.3.3 Previous model vs. extended model
Figures 5.2 and 5.3 confirm that both the initial model described in Chapter 4 (where
each grain was represented by one unique element) and the extended one proposed in the
present work (where each grain is discretized by many elements) exhibit quasi-identical
averaged mesoscopic behavior. As stated in Section 5.2, this implies that the new model is
a priori equally calibrated to the experimental results of previous chapter. However, the
new model allows for the high resolution observation of complex intragrain mechanisms
not accessible to the initial model (and often experiments), and thus allows for the study
of complex phenomena such as the ones discussed in the next sub-section.
Another very important conclusion can be drawn from the observation of the quasi-
identical averaged mesoscopic behavior of both models. The study of HCP polycrystalline
aggregates at the mesoscale (i.e. where a thorough understanding of the intragrain
mechanics is not required) is adequately captured by a simple approach by modeling each
grain with one unique element. In other words, the stress-strain curve, texture evolution
and average slip and twin activities are accurately modeled by such a model. As the initial
model consists of only 2,592 elements vs. the 475,947 elements for the new model, the
choice of the former model can thus lead to significant savings in computing resources for
modeling studies focused mainly on mesoscopic mechanics.
5.3.4 Modeling of twin transfer and twin nucleation as a function of GB
misorientation angle
Twin transfers across the P1 − P2, P1 − P3 and P1 − P4 GBs were simulated using
the extended CPFE model described and validated in Section 5.2. To this end, a
polycrystalline model, consisting of a 25-grain Voronoı tessellation (a total of 2,113,409
tetrahedral elements) was used (Figure 5.13(a)). For each simulation, two grains in the
interior of the model, also shown in Figure 5.13(a), were assigned the orientations of the
corresponding P1−Pi |i=2,3,4 pair of grains, while the overall texture of the polycrystalline
aggregate was kept the same as in the experimental case. Figures 5.13(b-d) illustrate twin
propagation along the P1 − P2, P1 − P3 and P1 − P4 GBs, respectively (Movies 02-04
in Supplementary Material on CD-ROM). The active variants upon uniaxial compression
along RD are shown using different colors. For the P1 − P2 case (Figure 5.13(b)), the
primary variants, (1012)[1011] and (1012)[1011] are activated, as expected. Figure 5.13(c)
reveals that the primary twin variant (1012)[1011] is transferred across the P1 − P3 GB
to the secondary twin variant (1102)[1101] in grain P3. Finally, Figure 5.13(d) illustrates
the P1 − P4 case, where twin propagation is not occurring. Furthermore, simulations
also predict that twin propagation is easier across GB of small misorientation: in the
low angle GB (P1 − P2), it starts at a strain of 2.8%; in the moderately misoriented
GB (P1 − P3), it begins at a strain of 5%; in the high angle GB (P1 − P4), twinning is
not transferred (Movies 02-04 in Supplementary Material on CD-ROM). The predicted
cumulative slip/twin activity in the vicinity of the three GBs at these two strains has been

66
Figure 5.13: (a) Polycrystalline model (a quarter of the model is hidden to ease thevisualization of the two grains of interest) consisting of a 25-grains Voronoı tessellation(2,113,409 tetrahedral elements); the two grains of interest are assigned the orientationsof the corresponding P1 − Pi |i=2,3,4 pairs and cut transversally for visualization purposesof: (b) twin transfer across the P1−P2 boundary (3.9% of strain); (c) twin transfer acrossthe P1−P3 boundary (6% of strain); (d) twin transfer across the P1−P4 boundary (6% ofstrain); the red line shows the paths from grain P1 to the neighboring grains along whichslip activity was evaluated in Figure 5.14.
studied along the path colored in red in Figures 5.13(b-d) and is shown in Figure 5.14. At
the lowest strain level, little slip activity takes place in grains P1, P2 and P3. However, basal
slip is seen to be substantially active in grain P4, which is poorly oriented for twinning. At
the highest strain level, basal slip activity is seen to increase in the vicinity of the P1 −P2
GB, and both basal and non-basal slip are found to be active near the P1 − P3 GB and,
even more so, in the area close to the P1 − P4 GB.
The model is finally used for the prediction of twin nucleation in the low (P1−P2) and
high (P1−P4) misorientation GBs. Figure 5.15(a) shows the high resolution polycrystalline
model of grains P1 and P2 at a strain of 2.1% in which the “twin nucleation point” is seen to
occur at their GB (and more specifically, at a triple point). Figure 5.15(b), which depicts
the variation in the von Mises stress at the same strain along the path drawn in red in
Figure 5.15(a), indicates that a stress peak takes place at the GB, suggesting that twin
nucleation is triggered by the build-up of high local stresses. Additionally, Figure 5.15(c),
which corresponds to a strain of 2.5%, indicates that twin growth occurs simultaneously on
both sides of the GB and that basal slip activity peaks at the GB (Figure 5.15(d)). It must

5.3. Results and discussion 67
Figure 5.14: Normalized slip/twin activities in the vicinity of the three GBs P1−P2, P1−P3
and P1−P4 at 2.8% and 5%, respectively, along the path drawn in red in Figures 5.13(b-d);the black dashed line indicates the GB.

68
be emphasized that the “nucleation point” indicates the rotation of the first element due
to twinning on the primary variant, but not the onset of twin activity. Homogeneous twin
activity on both sides of the GB very similar to that in Figure 5.15(d) was observed at
all lower strains (not shown here), thus indicating that the overall macroscopic stress
is also responsible for the generalized twinning observed in both favorably oriented
grains. In summary, the stress concentration at the low misorientation GB appears to
be the triggering mechanism early on in the deformation process and is quasi-immediately
accommodated by a Schmid-related homogenization of the twin activity on both sides
of the GB. This is consistent with earlier work by Proust et al. [141], which reported
that the CRSS for twin nucleation is higher than that corresponding to twin growth.
Figures 5.16(a) and (b) show the von Mises stress field and twin activity, respectively, of a
polycrystalline model of grains P1 and P4 (high misorientation) compressed up to a strain
of 0.7%. The activity of the primary variant in grain P1 peaks at a region in the grain
interior that is away from the P1 − P4 GB. This indicates, first, that twin nucleation is
not directly favored by such a highly misoriented GB and, second, that twinning activity
responds mostly to the macroscopic applied stress, and not to the local concentration of
von Mises stress (such as in the previous case).
These predictions are in full agreement with recent reports in Mg alloys and
titanium [48, 74, 75, 226–228], which highlight the preferred nucleation of twins in GB
with misorientations smaller than 30°. Furthermore, these results and in particular
Figure 5.15(b) are also consistent with recent atomistic simulations, which demonstrate
nucleation of tensile twins at GB via a pure-shuffle mechanism originated by a high
local stress concentration. Finally, as mentioned earlier, experimental 2D or 3D EBSD
observations do not allow one to differentiate whether ATP at low angle boundaries
formed by simultaneous nucleation of both twins forming the pair, or whether, on the
contrary, nucleation took place first in one grain and twin transfer ensued. As such, the
extended modeling approach provides a new numerical tool able to complement 3D EBSD
in determining twin dynamics at the microscale.
5.4 Conclusions
In this chapter, a combined 3D EBSD and modeling approach was adopted to investigate
the effect of GB misorientation on tensile twin propagation in a rolled Mg AZ31 alloy. For
the first time, 3D aspects of twin transfer across GBs have been investigated. The material
was compressed along RD to small strains in order to nucleate a large number of twins,
but prevent significant twin growth. 3D EBSD was then carried out in a selected volume
in which a central grain, very well oriented for tensile twinning, is surrounded by three
GBs with a wide range of θ. Twin transfer across these boundaries was also simulated
using an extended CPFE model able to account for the topological information of the
grains. The following conclusions may be drawn from the present study:

5.4. Conclusions 69
Figure 5.15: (a) Polycrystalline model cut transversally for visualization purposes showingthe twin nucleation point at the low angle P1 −P2 GB and (b) variation of the von Misesstress along the path drawn in red in (a) at a strain of 2.1%; (c) polycrystalline model and(d) normalized slip/twin activity along the path drawn in red in (c) at a strain of 2.5%).
Figure 5.16: Polycrystalline model cut transversally for visualization purposes at a strainof 0.7% showing grains P1 and P4 with the fields of (a) the von Mises stress and (b)the activity of the primary variant in grain P1 (the black arrow indicates the point ofnucleation).

70
1. The 3D morphology of twin variants appears to be related to their SF. Primary
variants with high SF tend to have plate-like morphologies, with approximately constant
thickness, and encompass the entire parent grain. However, secondary and tertiary
variants, with SFs smaller than ∼ 0.2, have a more irregular geometry, which is related to
the heterogeneous nature of the local effective stress field.
2. The GB misorientation angle has a critical influence on twin propagation. GBs
with θ < 15° facilitate the formation of ATP, and plasticity in the vicinity of these GBs
is driven by the macroscopic applied stress. When the θ becomes larger, the probability
of non-Schmid events, such as the nucleation in neighboring grains of low SF variants,
increases. Finally, highly misoriented GB constitute strong obstacles to twin propagation
and give rise to high back-stresses, which trigger local non-Schmid plasticity in the original
grain.
3. Variant selection in the transferred twins appears also to be critically influenced by
the 3D grain morphology, which, in turn, contributes to alter the local stress state.
4. The proposed extended CPFE model successfully predicts that twin transfer is easier
in GB with low θ and that it is severely hindered in highly misoriented GB. Moreover, the
model is able to capture the active variants in both the original and neighboring grains.
The predictions of the model are, thus, in full agreement with the experimental results
described above.
5. The model corroborates the build-up of increasingly high local stresses at twin-
GB interfaces with increasing θ and, furthermore, it predicts that the presence of such
stresses gives rise to increasingly higher activity levels of non-basal slip in the vicinity of
the corresponding boundaries.
6. The model predicts that twin nucleation is favored at GBs with low misorientation
as a consequence of the high local stress concentrations, but that propagation is
accommodated by the overall macroscopic stress. However, highly misoriented boundaries
are not preferential sites for twin nucleation, despite having a high level of von Mises
stress.
7. The model failed to predict the non-Schmid effects (DTT, secondary and tertiary
twin variants) observed when the GB presents a high misorientation angle. According to
some studies [75,128,229–231], non-Schmid effects are due to a special case of back-stresses
which are not arising from geometrically necessary dislocations (GNDs) but from the GB-
twin interactions [95]. Nevertheless, GNDs have been shown to play a role in the evolution
of back-stress at GBs [232, 233]. Both observations might be reconciled by hypothesizing
that GNDs do not trigger the nucleation of the non-Schmid effects but participate in
their development. Therefore, further studies are required to develop crystal plasticity
models that can contemplate the complexity of the mechanisms derived from local stress
fluctuations in the vicinity of the GB and in the interior of the grains.

CHAPTER 6
Effect of hydrostatic pressure on the 3D porosity distribution and on the
mechanical behavior of a high pressure die-cast Mg AZ91 alloy
An approach to reduce the detrimental effect of porosity in a HPDC Mg AZ91 alloy
consisting on applying a hydrostatic pressure after HPDC processing is investigated. The
effect of the pressure treatment on the 3D porosity distribution and on the mechanical
behavior of the samples is studied using an experimental-computational methodology. The
3D distribution of pores before and after the pressure treatment is analyzed by XCT. A
relatively large fraction of pores reconstructed from XCT experimental measurements is
used as an input for a FE model. This model is ultimately utilized to simulate and analyze
the effect of pressure on the 3D pore distribution as well as on the mechanical response of
the material.
6.1 Experimental procedure
6.1.1 Material and process
A Mg AZ91 alloy was HPDC processed into a dog-bone-shaped die. The geometry and
dimensions of the castings are shown in Figure 6.1. Since, as it will be seen later, the
porosity distribution is highly dependent on the location in the cast specimen, four
representative regions were identified and labeled in Figure 6.1 as “Grip 1”, “Grip 2”,
“GL1” (the region of the gage length closer to Grip 1) and “GL2” (the region of the
gage length closer to Grip 2). Multiple specimens were prepared using the following
processing conditions. The molten material was injected at a liquid alloy temperature
of 630-670 � and a gate velocity of 8-9 m/s, using a servo-hydraulic HPDC computer-
controlled machine. The injection pressure was 400-500 bar and the mold temperature
was set in the range of 190-230 �.
71

72
Figure 6.1: Sample geometry of the Mg AZ91 alloy dog-bone shaped casting fabricated byHPDC.
Figure 6.2: Microstructure of the as-HPDC Mg AZ91 alloy at different magnifications; themicrographs were taken in Grip 1.
The microstructure of the as-received material was analyzed by OM in an Olympus
BX51 optical microscope. The microstructure is consistent with previous observations of
HPDC Mg AZ91 alloys [234]. It is formed by α-Mg “islands” (light gray) surrounded by
β-phase, Mg17Al12 particles (dark gray). Figure 6.2 includes several optical micrographs
illustrating the microstructure at different magnifications. Figures 6.2(a-b) reveal that
the β-phase is homogeneously distributed throughout the microstructure. Both gas and
shrinkage pores are present (selected examples are labeled in Figure 6.2). The former have
a large size variation ranging from a few micrometers up to 200 µm in diameter. Shrinkage
pores were found isolated as well as emanating from the gas pores. In Figure 6.2(c), some
grains are visible in the vicinity of a pore. The average size of such grains is ∼ 10 µm. It
can be seen that grains are in general smaller than the dendrite width.
A pressure treatment of 600 MPa at room temperature during 10 min was first
applied to a 1.8 mm diameter and 6 mm long cylinder extracted from Grip 1, using a
Hiperbaric 420 machine from Hiperbaric S.A. A disk of 1.8 mm in diameter and 820 µm
in thickness corresponding to the central part of this cylinder was examined by XCT (as

6.1. Experimental procedure 73
described in more detail in the next sub-section) before and after pressurization in order
to evaluate the effect of pressure on the evolution of the porosity distribution. The same
pressure treatment was then applied to several HPDC dog-bone-shaped castings with the
aim of investigating the effect of pressure on the mechanical behavior before and after
pressurization.
6.1.2 X-ray computed tomography inspection
Quantitative information of the 3D porosity distribution was obtained by means of XCT
using a Nanotom 160NF tomograph from Phoenix. All the tomographic measurements
were performed utilizing a tungsten target. Five as-HPDC dog-bone-shaped specimens
were first inspected at low resolution to identify qualitatively the different porosity levels
throughout the samples. The conditions for the collected low resolution tomograms were
130 kV, 90 µA, 1,000 projections and 500 ms exposure time. The pixel size was set to
21.7 µm. A second measurement at a higher resolution of 4.9 µm pixel size, 90 kV, 120 µA,
2,000 projections and 500 ms exposure time was performed on different parts of the samples
to better identify porosity. Finally, in order to obtain the highest possible resolution, the
cylinder of 1.8 mm in diameter and 6 mm in length, described in the previous sub-section,
was machined out of the high porosity region (Grip 1) and the central part of this cylinder
(a disk of 1.8 mm in diameter and 820 µm in length) was measured with a pixel size of
1 µm, 90 KV, 100 µA, 2,000 projections and 750 ms exposure time. This cylinder was
then subjected to a hydrostatic pressure of 600 MPa at room temperature during 10 min
and the same disk was measured again under the same conditions by XCT in order to
evaluate the influence of the applied pressure on each single pore. All the tomograms were
reconstructed using an algorithm based on the FBP procedure for Feldkamp cone beam
geometry [235].
6.1.3 Image processing and void tracking
Identification of the cavities was carried out by selection of the voxels as belonging either to
a void or to the bulk matrix material based on their gray level. Prior to the segmentation
of cavities, all the slices forming the volume were equalized to have a homogeneous gray
level of the matrix along the volume. The cavity segmentation procedure used was
based on the local variance method from Niblack applied to each slice by adapting the
threshold according to the mean and standard deviation of the peak belonging to the
matrix material [236]. For the two reconstructed samples (before and after the hydrostatic
pressure treatment) only cavities having a volume larger than 200 voxels (equivalent radius
of ∼ 3.6 µm) were selected after segmentation for analysis. This lower limit was chosen
according to Ref. [237], which showed that an ellipsoid can be well approximated by
structure larger than 5×5×5=125 voxels. The complexity factor (CF) parameter [238]
was used to characterize the cavity shape. As it is shown in Figure 6.3(a), the CF is

74
related to the exclusion volume resulting from the intersection of the real cavity with its
equivalent ellipsoid (same volume and moment of inertia). The CF can be calculated as:
CF =V1 + V3
VC(6.1)
where VC = V1 + V2 is the volume of the cavity, composed of the volume of the cavity
outside the equivalent ellipsoid (V1) and the volume of the cavity inside the ellipsoid (V2),
and V3 is the volume of the ellipsoid which is not occupied by the cavity (Figure 6.3(b)).
(a) (b)
Figure 6.3: (a) Schematic representation of CF parameter: a cavity (in blue) isapproximated by its equivalent ellipsoid (in red) and a, b and c are the axes of theequivalent ellipsoid; (b) CF parameter definition [201].
The effect of pressure on the volume and shape of the pores was analyzed by tracking
each individual pore in the disk before and after pressurization. Prior to void tracking, the
two volumes of the disk, measured with the highest resolution, were translated and rotated
using the Image Fusion module of MedINRIA [239] for image registration. The registration
was performed using manual landmarks and rigid body options to perform translation and
rotation, but not scaling. The cavities found in the initial volume were tracked in the
pressure, i.e. treated volume using an in-house image-registration algorithm developed in
Matlab and based on the phase-correlation method centered on each cavity [240,241]. For
that purpose, an area of interest (AOI) centered on the maximum area of the selected
cavity was chosen. The AOI size was sufficiently large to contain a few extra features
(neighbor cavities or highly absorbing particles) to improve the correlation coefficient in
the local area. By using a proximity criterion, based on a minimum distance from the
center of gravity of the initial cavity to any pixel of the pressure-treated cavity, the cavities
were considered as found or lost.
After the pressure treatment, gas pores linked by a crack or a shrinkage pore may in
some cases lose such link as a result of closure of the linking crack or shrinkage pore. In
this case a single cavity in the initial state splits into two or more cavities in the final
state. This effect was considered by detecting the number of such final state cavities,

6.1. Experimental procedure 75
called “predecessor” cavities [240], and was taken into account in the evaluation of cavity
evolution by removing them from the analysis.
6.1.4 Mechanical testing
In order to study the effect of the applied pressure on the mechanical behavior of the
HPDC Mg AZ91 alloy, twelve cylindrical specimens of about 3 mm in diameter by 4.5 mm
in length were extracted from a high porosity region (Grip 1) of the HPDC dog-bone
specimens (six from non-treated samples and six from pressurized specimens) and were
tested under uniaxial compression at room temperature in an electromechanical universal
testing machine (Instron 3384) at constant strain rate of 10−4 s−1. The load was monitored
with a 10 kN cell.
6.1.5 Finite element analysis
The influence of the applied pressure on the 3D porosity distribution and on the mechanical
behavior of the HPDC Mg AZ91 alloy was analyzed by FE. The FE mesh was built from
a 300×300×300 µm3 (1 pixel=1 µm2) tomographic sub-volume extracted from the high
resolution XCT measurement of the 1.8 mm diameter and 820 µm-thick disk (Figure 6.4).
This sub-volume contained ∼ 200 complete pores (i.e. not in contact with the sub-volume
faces). The FE mesh was built as follows. A surface mesh was created in StereoLithography
(STL) format from the tomographic binarised data using VGStudio Max software [242],
(a similar methodology was used in Ref. [243] for cellular materials). The number of
surface elements was set to achieve an optimal resolution in order to capture the shape of
the pores as accurately as possible. The STL surface-meshed volume was then imported
into Hypermesh [244] and meshed with 792,681 hybrid quadratic tetrahedral elements
(1,129,194 nodes). In order to reduce the number of elements the finest mesh in the
neighborhood of the pores was gradually coarsened towards pore-free regions. The meshed
volume was finally exported to the FE program ABAQUS/Standard [245] in order to carry
out the simulations. The behavior of the bulk material was described using standard J2
plasticity with linear isotropic hardening. Note that this implies that the crystallographic
microstructure (grain size, texture, etc.) is not accounted for (discussion in Section 6.3).
Accordingly, the von Mises yield stress σy is defined as:
σy(ǫpl) = σ0 +Hǫpl (6.2)
where σ0 is the initial yield strength, ǫpl is the equivalent plastic strain and H is hardening
modulus. A Young’s modulus of 44.8 GPa and a Poisson’s ratio of 0.35 were used as
the elastic properties of the Mg AZ91 alloy [246]. The initial yield stress σ0 and the
hardening parameterH were obtained from uniaxial compression tests of cylinders of 4 mm
in diameter and 6 mm in length machined out from a very low porosity region (GL2). The
average porosity in GL2 was smaller than 1%. Previous studies [247] have shown that
these parameters are insensitive to porosity below such levels, thus suggesting that the

76
Figure 6.4: FE mesh of the selected tomographic sub-volume geometry: a sector of thepore-free mesh was removed for visualization purposes.
proposed approximation is reasonable. The tests were done with an electromechanical
universal testing machine (Instron 3384) at constant strain rate of 10−4 s−1 and the load
was monitored with a 10 kN load cell. Figure 6.5 shows the experimental and simulation
results for σ0=160 MPa and H=2.2 GPa.
The final model, i.e. using the mesh shown in Figure 6.4 and the constitutive model
calibrated in Figure 6.5, was subjected statically to a hydrostatic pressure of 600 MPa,
followed by relaxation. The effect of pressure on the 200 complete pores was tracked. The
mechanical response of the sub-volume before and after the simulated pressure treatment
was ultimately analyzed by simulating a uniaxial compression test. In both cases the two
compressed faces were not laterally constrained.
6.2 Results
6.2.1 Experimental results
6.2.1.1 Qualitative analysis
Figure 6.6 illustrates the low resolution tomographic reconstruction of the complete dog-
bone initial sample, the high resolution reconstruction of the disk from the cylinder
subjected to the high pressure treatment (extracted from Grip 1) before the application
of the pressure, and the sub-volume of 300×300×300 µm3 used in the FE model. The low
resolution reconstruction exhibits different void sizes and concentrations along the sample
axis. In particular, larger voids and a higher void density can be found in the grips.
Grip 2 contains mostly globular pores while in Grip 1 a large concentration of cracks and
shrinkage pores can be observed. The gauge length also presents a heterogeneous spatial
distribution of pores. In particular, the pore density is higher in the region close to Grip
1 (Figure 6.6). The void volume fraction varies in different regions of the sample from

6.2. Results 77
0.00 0.03 0.06 0.09 0.12 0.15 0.180
50
100
150
200
250
300
350
400
450
True
str
ess
(MPa
)
True strain
experiment GL2 simulation - model calibration
Figure 6.5: Uniaxial compression true stress-true strain curves: experimental data andmodel calibration.
an average value of about 9% (range: 5% to 15%) in the grips to 0.7% (range: 0.5% to
1.0%) in the gauge length. Even in the smaller disk volume measured by high resolution
tomography the void volume fraction varies in the untreated specimen from 5% to 13.4%.
Preliminary 2D inspection of the reconstructed tomographic slices before and after the
application of the pressure exhibits a reduction in the number of pores, in the pore size, as
well as in the occurrence of changes in the pore geometries. As an example, Figures 6.7(a-
b) show two reconstructed slices, before and after the pressure treatment, respectively, of
the same cross-section of the HPDC specimen after a correlation procedure. Two areas
within these cross-sections have been enlarged and are shown in Figures 6.7(c-d). Most of
the pores shown in Figure 6.6(d) are smaller than their counterparts prior to treatment
Figure 6.7(c) and their shapes have also been altered. Finally, it can be noted that the
thin wall separating the central large pore from its neighbor (indicated by the arrows)
undergoes significant plastic strain and is wider after the pressure treatment. This effect
was frequently observed in the inspected volume.
The 3D effect of the pressure treatment on the pores can be better appreciated in
Figures 6.8(a-c). The sub-volume extracted for the FE model was selected as a RVE of
the overall disk. The size of this RVE was chosen as a balance between representativeness
and visualization, since the large amount of pores contained in the disk would hinder the
3D visualization. The porosity distribution before and after pressure treatment can be seen
in Figures 6.8(a-b), respectively. The reduction in pore volume is visually noticeable in the
majority of the pores by superposition of both volumes in Figure 6.8(c). A closer inspection
of Figures 6.7 and 6.8 shows that the hydrostatic pressure affects more strongly the cracks
or shrinkage pores arising from the surface of the globular gas pores, by closing them

78
Figure 6.6: Low resolution tomographic reconstruction of the complete dog-bone casting,high resolution reconstruction (initial state) of the cylindrical volume subjected to thepressure treatment and of the sub-volume of 300×300×300 µm3 used in the FE analysis.
Figure 6.7: Reconstructed cross-sectional views of the same slice before (a) and after (b)the pressure treatment; magnified region at the largest area of the central pore before (c)and after (d) the pressure treatment.

6.2. Results 79
Figure 6.8: 3D reconstruction of the sub-volume extracted for simulation purposes before(a) and after (b) the pressure treatment; (c) superposition of volumes from (a) and (b)with initial pores (before treatment) set to semitransparent.
completely, within the limits of the resolution used in the XCT studies (some are indicated
by arrows in Figure 6.8). This is expected as high stresses normally concentrate at the
acute angles formed by the cracks around the pores, causing a larger volume reduction
and shape alteration.
6.2.1.2 Quantitative analysis of pore volume and shape change
The combination of XCT with powerful image analysis techniques allows for a statistical
evaluation of the evolution of a large number of cavities subjected to the pressure
treatment, using the procedure explained in Sub-section 6.1.3. Only cavities composed
of more than 200 voxels were considered in the analysis. A total of 17,649 cavities larger
than 8 voxels were found in the initial volume, while 13,549 cavities remained after the
treatment. From the latter set, it was possible to track 9,689 cavities larger than 200 voxels
which fulfilled the proximity criterion and only had one predecessor. The volume change
of the initial cavities which split in more than one predecessor cavity can be obtained by
comparing the sum of volumes of the predecessor’s cavities to the initial one. Only 2,164
cavities had split in more than one predecessor cavity, and were not considered in this
analysis for simplicity.

80
Figure 6.9(a) shows the histogram of the relative volume change ∆V/V0 for the 9,689
tracked pores, where ∆V is the difference between the initial volume V0 and the final
volume V. The distribution is bimodal showing a first peak at around 6%, and a second one
at 37%, the latter being fairly symmetric and relatively wide. The first peak is composed
of 1,742 cavities, while 7,947 cavities belong to the second one, i.e. 78% of the cavities have
experienced an average volume change of 37%. This arguably counterintuitive bimodal
distribution is thought to be a reasonable indication that some pores (belonging to the
first peak) contain pressurized gas arising from the HPDC process, thus preventing them
from further shrinking. The average volume change of the whole cavity population is 33%.
In an attempt to better understand the effect of pressure on the pore volume change, the
pore volume after the pressure treatment vs. the relative volume change is plotted in
Figure 6.9(b). It can be seen that volume changes below 15% are associated to a wide
range of pore sizes, suggesting that pores with internal pressure have a large variety of
sizes. Volume changes larger than 45% correspond mainly to pores whose volume is less
than ∼ 3,500 µm3. Additionally, the pores with volumes larger than 5,000 µm3 (belonging
to the second peak) undergo an average change of 33% (Figure 6.9(b)) while smaller pores
undergo changes within the whole range.
The ellipsoid fitting procedure for pores allows for the evaluation of pore shape. This
study is focused on the CF [238] described above. Figure 6.10(a) is a histogram of the
relative CF change ∆CF/CF0, where ∆CF is the difference between the initial CF0
and the final CF. The maximum of the relative CF change is centered at ∼ 0% but
the ∆CF/CF0 distribution is slightly asymmetric towards negative values. A negative
change in ∆CF/CF0 indicates that the pores become more irregular after the pressure
treatment. The variation of ∆CF/CF0 with ∆V/V0 is shown in Figure 6.10(b). It
can be observed that the pores that belong to the first peak of relative volume change
(∆V/V0 ∼ 6%) tend to have positive values of ∆CF/CF0, i.e. they tend to become more
regular after pressurization. The internal pressure of these pores seems to influence their
plastic deformation during pressurization, making them more regular. ∆CF/CF0 tends
to subsequently decrease from positive values to negative ones (more irregular pores after
the pressure treatment) as ∆V/V0 increases. For pores for which ∆V/V0 is close to 27%,
the average ∆CF/CF0 is close to 0%. As ∆V/V0 becomes larger than 40% (with pores
whose volume is less than ∼ 3,500 µm3, Figure 6.9(b)), the average ∆CF/CF0 adopts
increasingly more negative values.
6.2.2 Simulations results
FE simulations were performed on the numerically extracted sub-volume from Grip
1 (Figures 6.4 and 6.6) following the procedure explained in Sub-section 6.1.5. The
experimental results show a bimodal distribution of the volume change consistent with
internal pressure on some of the pores formed during casting process. The pores with a
volume change smaller than 15% were assumed to have internal pressure and 7 pores

6.2. Results 81
0 10 20 30 40 50 60 700
50
100
150
200
250
300
Cou
nts
V/V0 (%)(a)
0 10 20 30 40 50 60 70102
103
104
105
106
Pore
vol
ume
afte
r tre
atm
ent (
m3 )
V/V0 (%)
(b)
Figure 6.9: (a) Histogram of the relative volume change (∆V/V0) of the 9,689 trackedcavities. (b) Pore volume after pressure treatment vs. relative volume change.

82
-60 -40 -20 0 20 400
255075
100125150175200225250
Cou
nts
CF/CF0 (%)
(a)
0 10 20 30 40 50 60 70-100
-75
-50
-25
0
25
50
75
100
CF/CF 0 (%
)
V/V0 (%)(b)
Figure 6.10: (a) Histogram of the relative CF change (∆CF/CF0) of the 9,689 trackedcavities; (b) relative CF change (∆CF/CF0) vs. relative volume change (∆V/V0) (positivevalues of ∆CF/CF0 indicate transition to more regular pores, while negative valuesindicate transition to more irregular pores).

6.2. Results 83
fulfilling this condition (out of ∼ 200) were identified in the simulation sub-volume
counterpart. Two simulations were then carried out, with and without internal pressure
in the 7 selected pores. The internal pressure in the pores was mimicked by defining a
quasi-incompressible behavior of the pores (but with a negligible shear modulus), with
a bulk modulus calibrated so as to capture the first peak of the relative volume change
distribution at ∼ 6%.
Figure 6.11 compares the experimental relative volume change data corresponding to
the pores included in the sub-volume used for simulations with the predictions of the
model with and without internal pressure in the selected pores. The average experimental
relative volume change is ∼ 37% which is consistent with the average relative volume
change experienced by the larger disk-shaped sub-volume that was previously analyzed
(Figure 6.9). The peak observed at small ∆V/V0 (< 15%) in Figure 6.9 is also apparent
in Figure 6.11, albeit with a significantly smaller height, since it only includes 7 pores
and is lacking statistical significance, (this is equivalent to ∼ 3.5% of the total number
of pores in the simulation sub-volume while up to 22% of the pores belong to this group
in the larger experimentally analyzed volume). The distribution of the simulated ∆V/V0
without considering the internal pore pressure consists of a single peak and the average
∆V/V0 is ∼ 23%. Taking into account the pores with internal pressure gives rise to a
bimodal distribution in which the peak at low ∆V/V0 includes the same 7 pores mentioned
earlier (Figure 6.11). The average ∆V/V0 is 23.5% for the simulation with internal pore
pressure which is still below the 37% measured experimentally in the same sub-volume.
Comparison between the pore volume after pressure treatment vs. the relative volume
change in Figure 6.11(b) confirms that the simulations succeed in better capturing the
behavior of pores larger than 5,000 µm3, that undergo a volume change of around 33%,
while it fails at capturing the tail of pores that undergo larger volume changes, that
correspond to pores whose volume is less than ∼ 3,500 µm3. The possible reasons for this
discrepancy will be discussed below.
Figure 6.12 compares the distributions of the relative change in the CF (∆CF/CF0)
corresponding to the pores included in the simulation sub-volume, for the experiment
and the simulation with and without internal pressure. The average value of ∆CF/CF0
obtained experimentally is -8%, while both simulations render a value of about -13%
(Figure 6.12(a)). As opposed to the previous study, simulations capture adequately the
average value of CF. Both experiments and simulations show that the ∆CF/CF0 decreases
as ∆V/V0 increases, in agreement with the trend illustrated in Figure 6.10(b). The pores
for which ∆V/V0 < 15% become slightly more regular after pressurization. This effect
is also captured by the simulations performed with internal pressure in the selected pores
yielding a value close to zero. The pores undergoing a larger volume change tend to
adopt a more irregular geometry after the pressure treatment. Again and as it will be
discussed later, the tail of the ∆CF/CF0 vs. ∆V/V0 distribution (Figure 6.11(b)), formed
by the pores which undergo a relative volume change larger than 40%, i.e. those for which
∆CF/CF0 decreases more, is not captured by the model.

84
0 10 20 30 40 50 60 70 800.0
0.2
0.4
0.6
0.8
1.0
Nor
mal
ized
num
ber o
f por
es
V/V0 (%)
Sub-volume for simulation Experiment Simulation without
internal pressure Simulation with
internal pressure
(a)
0 10 20 30 40 50 60 70 80102
103
104
Sub-volume for simulation Experiment Simulation without
internal pressure Simulation with
internal pressure
Pore
vol
ume
afte
r tre
atm
ent (
m3 )
V/V0 (%)
(b)
Figure 6.11: Comparison between experimental and simulations results with and withoutinternal pressure for the same sub-volume; (a) normalized number of pores vs. the relativevolume change (∆V/V0); (b) pore volume after pressure treatment vs. relative volumechange (∆V/V0).

6.2. Results 85
-60 -30 0 30 600.0
0.2
0.4
0.6
0.8
1.0N
orm
aliz
ed n
umbe
r of p
ores
CF/CF0 (%)
Sub-volume for simulation Experiment Simulation without
internal pressure Simulation with
internal pressure
(a)
0 10 20 30 40 50 60 70 80-100
-75
-50
-25
0
25
50
75
100 Sub-volume for simulation Experiment Simulation without internal pressure Simulation with internal pressure
CF/CF 0 (%
)
V/V0 (%)
(b)
Figure 6.12: Comparison of experimental results and simulations with and without internalpressure for the same sub-volume; (a) normalized number of pores vs. the relative CFchange (∆CF/CF0); (b) relative CF change (∆CF/CF0) vs. relative volume change(∆V/V0)

86
6.2.3 Mechanical tests
Uniaxial compression tests were performed on both the as-received material and the
pressure treated material. The corresponding true stress-true strain curves are shown
in Figure 6.13(a). The pressure treatment results in an increase of the stress over the
whole plastic region, with an increment of 31.5 MPa. Similar strain hardening behaviors
are observed before and after pressurization.
The influence of the pressure treatment on the mechanical behavior was also
investigated with the FE model. The results of the simulation, shown in Figure 6.13(b),
also reveal that the pressure treatment induces an improvement of 26.4 MPa of the
flow stress over the plastic region, in close agreement with the experimental results.
However, the simulations predict higher absolute flow stress values than the experimental
measurements. This is undoubtedly a result of the particular pore volume fraction
contained in the simulated sub-volume (Figure 6.6). While in the simulated sub-volume
the volume fraction of pores was about 5%, the real pore volume fraction reached local
values of up to 13.4% in the experimentally compressed cylinders. Additionally, pores
smaller than 200 pixels were not simulated. This naturally leads to higher simulated flow
stresses but, despite these differences, the model was able to capture the beneficial effect
of the pressure treatment quantitatively.
6.3 Discussion
The evolution of the porosity distribution of an HPDC Mg AZ91 alloy upon pressurization
has been analyzed by XCT and simulated in a sub-volume of the material by FE analysis,
using the experimentally determined distribution of pores in this particular sub-volume
and J2 plasticity with linear isotropic hardening for the pore-free matrix. In general,
a good agreement is found between experiments and simulations regarding the change
in volume and in geometry of a large number of individual pores. The study reveals
that a large fraction of pores (around 22%) is relatively insensitive to the pressurization
treatment, presumably due the presence of internal pressure as a result of the HDPC
process. The study also reveals a good agreement between experiments and simulations for
pores larger than 5,000 µm3, that undergo a relative volume reduction of ∼ 33%. However,
XCT reveals that a significant number of pores with volumes after pressurization smaller
than 3,500 µm3 undergo relative volume changes between 45% and 65% and these are not
captured by the simulations. These same pores experience large reductions in their relative
CFs (Figure 6.12(b)), i.e. they adopt more irregular shapes after the pressure treatment.
An aspect that might play an important role in this discrepancy is the plastic anisotropy
inherent to the HCP Mg lattice [78], which is not taken into account in the model. Pores
with final volumes between 200 µm3 and 3,500 µm3 undergoing relative volume changes
between 45% and 65% have initial volumes comprised between approximately 350 µm3
and 6,400 µm3, i.e. with equivalent radii between 4.4 µm and 11.4 µm. A close inspection

6.3. Discussion 87
0.00 0.02 0.04 0.06 0.080
50
100
150
200
250
300
True
str
ess
(MPa
)
True strain
Before pressure treatment - experimental After pressure treatment - experimental
(a)
0.00 0.02 0.04 0.06 0.080
50
100
150
200
250
300
True
str
ess
(MPa
)
True strain
Before pressure treatment - simulation After pressure treatment - simulation
(b)
Figure 6.13: Uniaxial compression response of (a) cylinders extracted from Grip 1 beforeand after the pressure treatment as measured experimentally and (b) the simulated sub-volume.

88
of Figure 6.2(c) reveals that the grain size ranges from approximately 5 µm to 10 µm.
Thus, the size of the pores that show the discrepancy is of the same order of magnitude as
the grain size and are, therefore, surrounded by a limited number of grains, not exceeding
about 10. These grains, depending on their orientation, will undergo different amounts of
plastic strain due to the inherently anisotropy of plastic deformation and the high local
shear stresses built-up around the pores. This can lead to larger pore volume reductions
and to more irregular pore geometries for pores with sizes in the range of the grain size.
This effect is expected to be strong in Mg alloys because the CRSSs of the different
slip and twin systems in Mg alloys at room temperature might span up to 2 orders of
magnitude [33].
This thorough study also brings the opportunity to analyze the effect of neighboring
pores on the evolution of the porosity during the pressure treatment. Figure 6.14 shows
the equivalent plastic strain field in four different cross-sections of the simulated sub-
volume after the hydrostatic pressure was released. As expected, the material at the pore
surfaces undergo large plastic strains and, interestingly, the strain fields of neighboring
pores interact with each other, provided that they are close enough. Figure 6.14 also
reveals that the extent of the plastic strain field around a given pore increases with its
size. According to the literature on void growth under hydrostatic stresses [248], pore
interactions are no longer negligible when the surface to surface distance is smaller than
the pore diameter, which is consistent with the simulations. Moreover, the experimental
evidence presented in Figures 6.7(c-d) reveals that, in the vicinity of large pores, significant
plastic strain occurs in the thin ligaments that separate these pores from their neighbors,
suggesting that those pores that have large neighboring pores should undergo larger pore
size alteration under pressure.
6.3.1 Ligament ratio analysis
In order to test whether these experimental observations have any statistical significance,
the extensive pore population studied here, with pore sizes ranging from 200 µm3 to
3,000,000 µm3 was analyzed using an approach based on nearest neighbor distance.
In order to account for the size of the neighboring pore, the ligament ratio, Rw =
w/(w + rNN ), was computed for each pore, where w is the surface to surface (ligament)
distance and rNN is the radius of the corresponding neighboring pore. This parameter
varies between 0 for a very small wall distance or a very large neighbor pore and 1 for a
large ligament distance or a very small pore. The smaller this parameter is for a given pore,
the higher the effect the neighboring pores should have on its size reduction. For instance,
a small neighboring pore with a very short ligament distance is expected to affect the pore
less than a large neighboring pore whose ligament distance is slightly larger, and this is
reflected in a lower value of the Rw for the latter case. Only the first 6 neighbor pores
with the minimum Rw were considered, assuming that they have a high probability of
being first order nearest neighbors and that they are spatially homogeneously distributed.

6.3. Discussion 89
Figure 6.14: Examples of the equivalent plastic strain field located around the pores afterreleasing the hydrostatic pressure.
Figure 6.15 shows the result of plotting ∆V/V0 as a function of Rw. The different curves
correspond to different initial volume classes (ranges of pore volumes in logarithmic scale).
For values of the Rw between 0.1 and 0.25 (i.e. when neighboring pores are large compared
to the ligament width) all the volume classes experience a large pore size reduction ∆V/V0
of about 44%, indicating a strong interaction between the strain field of the pore under
analysis with the ones of its neighbors. For values of the Rw higher than 0.25, i.e. as the
ligament width increases with respect to the size of the neighboring pore, two different
trends are observed as a function of initial pore size. For pores with volumes larger
than 1,030 µm3, the pore size reduction ∆V/V0 decreases as Rw increases, pointing to a
smaller effect of neighboring pores. For pores with volumes up to 1,030 µm3, the pore size
reduction, ∆V/V0, remains high and decreases with Rw only slightly. This is consistent
with the fact that these pores correspond to pores with sizes in the range of the grain size,
and therefore the local microstructure has an important effect on the pore size reduction
of these small pores. As such, for Rw values of about 0.8 the ∆V/V0 of small pores reaches
values close to twice the ∆V/V0 for large pores, in agreement with Figure 6.9(b).
As a consequence, this analysis reveals that the presence of neighboring pores influences
significantly the pore size reduction upon pressurization. The results are in consistent
with FE analysis performed by Tvergaard [249] on the interaction of pores of different
sizes under high stress triaxialities, showing that smaller voids grow more rapidly than
larger voids if the void volume fraction is sufficiently high (above ∼ 0.5%). It must

90
0.1 0.2 0.3 0.4 0.5 0.6 0.7 0.8 0.920
25
30
35
40
45
50
V/V 0
(%)
Rw = w/(w+rNN )
Volume classes ( m3) 200-454 455-1,030 1,031-2,338 2,339-5,307 5,308-12,046 12,047-27,339
Figure 6.15: Relative volume pore change (∆V/V0) vs. Rw = w/(w + rNN ) for severalinitial pore volume classes.
aslo be emphasized that the method presented in this work could also be used to study
experimentally the effect of different void volume fractions on the relative volume change
of voids of various sizes, specially below a radius of 3 µm, provided that a higher spatial
resolution was achieved, e.g. by synchrotron XCT. It has been recently stated that strain
gradients could affect the rate of growth of voids with radii smaller than the characteristic
length of the material [250] due to non-local plasticity effects. Approximate values of
characteristic lengths have been suggested to be in the range of 0.25-1 µm [1, 250], and
therefore void growth should be noticeably slowed down for void radii of 2 µm and smaller.
The smallest void volume considered in this study (∼ 200 µm3) corresponds to a radius of
3.6 µmwhich is still above the value where non-local plasticity effects are expected to occur.
This is also consistent with the fact that the majority of the pores with ∆V/V0 < 15%
(Figure 6.9(b)) have volumes well above 200 µm3, thus confirming that only internal gas
pressure can explain their small ∆V/V0.
6.3.2 Effect of the anisotropy on the variation of the volume and the
complexity factor of the pores
In the following, the effect of the anisotropy of the HCP lattice of Mg alloys on the
volume and CF changes is investigated. To this end, the isotropic model described in this
chapter (standard J2 plasticity with linear isotropic hardening model) and the CPFE
model presented in Chapter 4 are used to simulate the behavior of a polycrystalline
aggregate containing 1 and 2 pores.
Because the CPFE model was calibrated for a Mg AZ31 alloy with a fiber texture,
the same material parameters were chosen in the following simulations, but with an

6.3. Discussion 91
initial random texture. The compression stress-strain curve simulated for a fully-dense
polycrystal with 2,592 Voronoı grains (Figure 5.1) is illustrated in Figure 6.16. The
isotropic model was calibrated against this curve using the same mesh. Figure 6.16 shows
the corresponding calibrated stress-strain curve, in which, σ0 equal to 100 MPa and H
equal to 1.4 GPa. Young’s modulus and Poisson’s ratio values of 44.5 GPa and 0.35,
respectively, were used as in the previous model.
0 0.02 0.04 0.06 0.08 0.1 0.12 0.14 0.160
100
200
300
400
True strain
Tru
e s
tre
ss
(M
Pa
)
CPFE model
Isotropic model
Figure 6.16: Uniaxial compression true stress-true strain curves: CPFE model andstandard J2 plasticity with linear isotropic hardening model.
(a) (b)
Figure 6.17: FE mesh including: (a) 1 internal pore (equivalent to 3 Voronoı grains, Pore1) and (b) 2 internal pores (one equivalent to 3 Voronoı grains, Pore 1, and the secondequivalent to 1 Voronoı grain, Pore 2).
FE simulations were performed using ABAQUS/Explicit [251]. The behavior of the
pores was modeled as that of an ideal gas (air) at room temperature and ambient
pressure (density ρ=1.2041 kg/m3 and gas constant R=287.058 J/kgK). Both models
were subjected to a quasi-static hydrostatic pressure of 600 MPa, followed by relaxation.
Next, the FE mesh was modified to include: a) 1 internal pore equivalent to 3 Voronoı
grains (Pore 1), and b) 2 internal pores, one equivalent to 3 Voronoı grains (Pore 1)

92
and the second equivalent to 1 Voronoı grain (Pore 2). The FE meshes are shown in
Figures 6.17(a-b).
Tables 6.1 and 6.2 show the predicted changes in ∆V/V0 and ∆CF/CF0 for 1 and 2
pores, respectively. Table 6.1 shows that the predicted ∆V/V0 for 1 pore is similar for
both models. However, the ∆CF/CF0 values are slightly different, which indicates this
ratio seems to be affected by the anisotropy of plastic deformation in the neighboring
crystallographic orientations. This effect is, however, not very pronounced, due to the
rather large number of neighbors surrounding such a large pore.
Pore 1∆V/V0 ∆CF/CF0
Isotropic model 17.76% -17.15%
CPFE model 18.04% -19.65%
Table 6.1: ∆V/V0 and ∆CF/CF0 for the isotropic and the CPFE models with 1 internalpore.
Table 6.2 shows that the predictions corresponding to Pore 1 in the mesh with two
pores are very similar to those described above. However, Pore 2 is shown to be much
more affected by the anisotropy, as the differences between the ∆V/V0 and ∆CF/CF0
ratios predicted by both models are larger than for Pore 1.
Pore 1 Pore 2∆V/V0 ∆CF/CF0 ∆V/V0 ∆CF/CF0
Isotropic model 17.69% -17.63% 11.33% -9.46%
CPFE model 18.21% -19.98% 14.15% -13.28%
Table 6.2: ∆V/V0 and ∆CF/CF0 for the isotropic and CPFE models with 2 internalpores.
Note that these simulation results cannot quantitatively compare against the previous
results of this chapter (Figures 6.11 and 6.12) as the materials are different. However,
it can be concluded that a pore sees its volume change further increased and CF change
decreased by taking into account the local anisotropy of the polycrystal. This seems
to indicate that the population of pores not captured in the earlier simulations will be
captured by accounting for the crystal anisotropy of the polycrystal.
6.4 Conclusions
This study constitutes an experimental and modeling approach to investigate the evolution
of the porosity distribution and the mechanical behavior of an HPDC Mg AZ91 alloy
subjected to a hydrostatic pressure treatment. A total of 9,689 pores where tracked before
and after pressurization by image analysis based on XCT measurements. Conjointly, a
sub-volume of the material containing 200 cavities was simulated by FE analysis, using

6.4. Conclusions 93
the experimentally determined distribution of pores and an isotropic hardening for the
pore-free matrix. The main conclusions drawn from this investigation are listed below.
1. Pressurization results in a decrease of the volume of the pores. The distribution of
the relative volume change (∆V/V0) is bimodal and exhibits a first peak at small values of
approximately 6%, attributed to pores with an internal pressure arising from gas trapped
during processing, and a second one at 37%. ∆V/V0 values as high as 65% (for pores after
treatment with a volume of 200 µm3) are observed to take place in a large portion of some
belong to the first peak the pores with the smallest initial volumes considered (571 µm3).
2. The application of pressure also influences the pore geometry. Pores that belong
to the first peak of relative volume change (∆V/V0 ∼ 6%) tend to have positive values of
∆CF/CF0, i.e. they tend to become more regular after pressurization. ∆CF/CF0 tends
to subsequently decrease from positive values to negative ones (more irregular pores after
the pressure treatment) as ∆V/V0 increases. For pores for which ∆V/V0 is close to 27%
the average ∆CF/CF0 is close to 0%. As ∆V/V0 becomes larger than 40% the average
∆CF/CF0 adopts increasingly more negative values. To sum up, pores with small relative
volume changes tend to become more regular, and pores with large relative volume changes
tend to become more irregular.
3. The yield stress of the HPDC cast samples increases by about 31.5 MPa on
hydrostatic pressure treatment. Work hardening rates are, however, not seen to be affected
significantly.
4. FE simulations successfully capture the bimodal distribution of the relative volume
change after pressurization, albeit the average value of the second ∆V/V0 peak is lower
than the one measured experimentally. A good agreement between the distribution of
∆CF/CF0 is found between the XCT measurements and the simulations. Only the pores
undergoing pore size reductions higher than 45% (with final pore volumes smaller than
3,500 µm3), for which the ∆CF/CF0 adopts the largest negative values, are not captured
by the model. It is proposed that the source of this discrepancy resides in the inherent
plastic anisotropy of HCP Mg, that manifests itself especially when the pore size is of the
same order of magnitude than the grain size. The simple J2 plasticity model used here
cannot capture this phenomenon and a CPFE model with adequate grain orientation
is needed. Despite this drawback, the model successfully predicts quantitatively the
beneficial effect of the high pressure treatment on the yield stress of the HPDC casting.
5. Neighboring pores are observed to have a very strong effect on the evolution of
the porosity during the pressure treatment, so that the pores having close neighbors of
relatively larger size suffer a larger size reduction than isolated pores and/or pores whose
closest neighbors are relatively smaller. This is particularly true for the pore population
with the largest volumes, while they remained relatively insensitive for the smallest pores,
more influenced by the local crystal anisotropy.

94

CHAPTER 7
Conclusions and future work
7.1 Main conclusions
A CPFE model aimed at fully describing slip and twinning as well as their interactions
through hardening mechanisms was developed and implemented for Mg AZ31 alloy. The
proposed model was calibrated and validated against a set of quasi-static compression
tests at room temperature along RD and ND. The model was exploited by investigating
stress and strain fields, texture evolution, and slip and twin activities during deformation.
The flexibility of the overall model was ultimately demonstrated by casting light on an
experimental controversy on the role of the pyramidal 〈c+ a〉 slip vs. compression twinning
in the late stages of polycrystalline deformation, and a failure criterion related to basal
slip activity was proposed.
The developed CPFE model was expanded to represent a more realistic polycrystal
by use of 3D Voronoı tessellations with a large number of elements, allowing for the
high resolution study of the local intragranular mechanical fields. The robustness of the
extended model was validated against experimental data and compared to the previous
model. The new model exhibited quasi-identical averaged mesoscopic behavior as the
initial one. This implies that the previous simplified model is actually sufficient for
macro-/mesostructural properties (stress-strain curves, averaged twin/slip activity, etc.).
However, the new model was shown to be required for intragranular field studies. To this
end, a combined 3D EBSD and modeling approach was adopted to investigate the effect
of GB misorientation on tensile twin propagation in a rolled Mg AZ31 alloy sheet. For the
first time, 3D aspects of twin transfer across GBs were investigated. Both experiments and
simulations confirm that twin propagation is largely influenced by the GB misorientation
angle θ. GBs with low θ facilitate twin transfer. However, when θ increases, high local
stresses develop at the GBs to the extent that transferred twins are variants which do not
95

96
necessarily have the highest SFs with respect to the externally applied stress. Moreover,
twin morphology was found to depend on the SF: highest SF variants exhibit the well-
established plate morphology while low SF variants adopt irregular shapes.
A systematic characterization of the effect of pressure on the volume and the geometry
of individual pores was finally carried out for a HPDC Mg AZ91 alloy. Close to 10,000
pores were tracked before and after pressurization by XCT. The distribution of the relative
volume and CF changes was related to the initial pore volumes and to the presence or
absence of gas trapped as a consequence of the casting process. Additionally, it is shown
that a FE model using J2 plasticity with linear isotropic hardening for the pore-free matrix
successfully captures the observed changes in the distribution of the pore volume and CF
changes for a large majority of the pores. The small discrepancies between simulations and
experiments were shown to be related to the smallest pores, whose sizes are of the order of
the grain size and which are found to undergo the largest volume and CF changes. These
discrepancies were rationalized taking into account the anisotropy of the HCP lattice and
the influence of neighboring pores.
7.2 Future work
The following tasks are proposed as future work:
� Extension of the proposed CPFE model such that it takes into account both the
crystallographic texture and the real porosity distribution, which will allow for a
better prediction of the global mechanical behavior of Mg alloys.
� Incorporation of strain rate dependency and temperature effects into the developed
CPFE model.
� Incorporation of microstructural parameters, such as grain size and second phase
particle distributions into the developed CPFE model.
� Incorporation of the hardening effect of GNDs into the CPFE model.
� Extension of the proposed CPFE model to other HCP materials such as titanium or
zirconium, along with their respective phases.
� Extension of the combined 3D EBSD and modeling approach to investigate the
influence of alloying elements and testing conditions (strain rate, temperature) on
twin propagation in HCP metals.

APPENDIX A
Fractography analysis of a Mg AZ31 alloy
The fractured Mg AZ31 alloy sample compressed along RD at room temperature and at
10−4 s−1 is shown in Figure A.1 [252]. The angle between the compression axis and the
normal to the crack plane is close to 45°. Figure A.2 illustrates the SEM micrographs
of the fracture surfaces. It can be seen that the fracture mode is semibrittle or brittle
fracture and is characterized by transgranular cleavage and small scale microvoids.
Figure A.1: Fractured Mg AZ31 alloy specimen after uniaxial compression along RD [252].
97

98
(a)
(b)
Figure A.2: SEM micrographs illustrating the fracture surface of the Mg AZ31 alloy afteruniaxial compression along RD: (a) x500; (b) x1000.

APPENDIX B
Minimum deviation angle method
The {1012}〈1011〉 twinning system consists of six equivalent variants Tj |j=1...6. These are
summarized in Table B.1:
Tj (Plane) and [Direction]
T1 (1012) [1011]
T2 (1012) [1011]
T3 (1102) [1101]
T4 (1102) [1101]
T5 (0112) [0111]
T6 (0112) [0111]
Table B.1: Six {1012}〈1011〉 twin variants.
The determination of the active twin variant observed in a deformed grain Pi is carried
out by the method of the minimum θdev [92]. This method consists of the following three
steps.
First, the orientation matrix of each original grain, gPi, is calculated from the
corresponding Euler angles (ϕ1,Φ, ϕ2):
gPi=
(
cosϕ1 cosϕ2 − sinϕ1 sinϕ2 cos Φ sinϕ1 cosϕ2 + cosϕ1 sinϕ2 cos Φ sinϕ2 sinΦ
− cosϕ1 sinϕ2 − sinϕ1 cosϕ2 cosΦ − sinϕ1 sinϕ2 + cosϕ1 cosϕ2 cosΦ cosϕ2 sinΦ
sinϕ1 sinΦ − cosϕ1 sinΦ cos Φ
)
(B.1)
Secondly, the six possible twin rotations are applied to each gPito obtain the
orientation matrices corresponding to the six variants, gTij(Tij corresponds to variant
j of grain i).
gTij= Rj · gPi
(B.2)
99

100
Rj =
(
r21j(1 − cos θ) + cos θ r1jr2j(1− cos θ)− r3j sin θ r1jr3j(1− cos θ) + r2j sin θ
r2jr1j(1 − cos θ) + r3j sin θ r22j(1− cos θ) + cos θ r2jr3j(1− cos θ)− r1j sin θ
r3jr1j(1 − cos θ)− r2j sin θ r3jr2j(1− cos θ) + r1j sin θ r23j(1− cos θ) + cos θ
)
(B.3)
where r1j , r2j and r3j are the components of the twin direction corresponding to variant j
(rTj[xyz]) expressed in an orthonormal system and where θ=180° [64]. The calculation of
rTj[xyz]is carried out in the following way. The twin direction is commonly written using
the four Bravais-Miller index notation (rTj[uvtw]= ua1+va2+ta3+wc). A transformation
to a rhombohedral system (rTj[UVW]= Ua1 + V a2 +Wc) must first be performed, using
the relations:
U = u− t
V = v − t
W = w
(B.4)
Next, the transformation from the rhombohedral to the orthonormal coordinate system
in which subsequent calculations are carried out by Equation (B.4) is done by means of a
transformation matrix A:
A =
1 −12 0
0√32 0
0 0 ca
(B.5)
where c and a are the lattice parameters of the hexagonal lattice. Note that the matrix
A changes depending on how the hexagonal system is defined. In this case, the x-axis is
parallel to the a1-axis of a HCP crystalline structure. Therefore, the twin direction rTj[xyz]
in orthonormal coordinate system is given by:
rTj[xyz]= A · rTj[UVW]
(B.6)
Finally, the θdev values between the six calculated gTijand the orientation matrix of
the twins observed experimentally gTki|k=1...kobserved are estimated. The misorientation
matrix Mkj for each twin variant is calculated by:
Mkj = g−1Tik
· gTij(B.7)
θdevkj is obtained from:
cos θdevkj =(m11kj +m22kj +m33kj )− 1
2(B.8)
where m11kj , m22kj and m33kj correspond to the diagonal principal components of the
Mkj. The minimum θdevkj from all calculated twin variants, corresponds to the active
twin variant.

Bibliography
[1] J. W. Hutchinson. Plasticity at the micron scale. International Journal of Solids
and Structures, 37:225 – 238, 2000.
[2] M. Easton, A. Beer, M. Barnett, C. Davies, G. Dunlop, Y. Durandet, S. Blacket,
T. Hilditch and P. Beggs. Magnesium alloy applications in automotive structures.
JOM Journal of the Minerals, Metals and Materials Society, 60(11):57 – 62, 2008.
[3] B. L. Mordike and T. Ebert. Magnesium: Properties - applications - potential.
Materials Science and Engineering A, 302(1):37 – 45, 2001.
[4] H. Friedrich and S. Schumann. Research for a ”new age of magnesium” in the
automotive industry. Journal of Materials Processing Technology, 117:276 – 281,
2001.
[5] E. Aghion, B. Bronfin and D. Eliezer. The role of the magnesium industry in
protecting the environment. Journal of Materials Processing Technology, 117:381
– 385, 2001.
[6] H. Watarai. Trend of research and development for magnesium alloys - reducing the
weight of structural materials in motor vehicles. Journal of Materials Processing
Technology, 7:84 – 97, 2006.
[7] J. Hirsch and T. Al-Samman. Superior light metals by texture engineering:
optimized aluminum and magnesium alloys for automotive applications. Acta
Materialia, 61:818 – 843, 2013.
[8] I. Ostrovsky and Y. Henn. Present state and future of magensium application in
aerospace industry. International Conference ”New Challenges In Aeronautics”,
ASTEC’07, pages 1 – 5, 2007.
[9] M. M. Avedesian and H. Baker. Magnesium and Magnesium Alloys. ASM Specialty
Handbook, 1999.
101

102
[10] Y. N. Wang and J. C. Huang. Texture analysis in hexagonal materials. Materials
Chemistry and Physics, 81:11 – 26, 2003.
[11] H. Yoshinaga and R. Horiuchi. Deformation mechanisms in magnesium single
crystals compressed in the direction parallel to hexagonal axis. Transactions of
the Japan Institute of Metals, 4:1 – 8, 1963.
[12] P. G. Partridge. The crystallography and deformation modes of hexagonal close-
packed metals. Metallurgical Reviews, 12:169 – 194, 1967.
[13] U. F. Kocks and D. G. Westlake. The importance of twinning for the ductility of
CPH polycrystals. Transactions of the metallurgical society of AIME, 239:1107 –
1109, 1967.
[14] E. W. Kelley and W. F. Hosford. The deformation characteristics of textured
magnesium. Transactions of the metallurgical society of AIME, 242:654 – 661, 1968.
[15] G. Y. Chin and W. L. Mammel. Competition among basal, prism, and pyramidal
slip modes in hcp metals. Metallurgical Transactions, 1:357 – 361, 1970.
[16] T. Obara, H. Yoshinga and S. Morozumi. {1122} < 1123 > slip system in
magnesium. Acta Metallurgica, 21:845 – 853, 1973.
[17] M. H. Yoo. Slip, twinning, and fracture in hexagonal close-packed metals.
Metallurgical Transactions, 12A:409 – 418, 1981.
[18] N. Munroe and X. Tan. Orientation dependence of slip and twinning in HCP metals.
Scripta Materialia, 36(12):1383 – 1386, 1997.
[19] G. I. Taylor. Plastic strain in metals. Journal of the Institute of Metals, 62:307 –
324, 1938.
[20] S. L. Couling, J. F. Pashak and L. Sturkey. Unique deformation and aging
characteristics of certain magnesium-based alloys. Transactions of the American
Society of Metals, 51:94 – 107, 1959.
[21] S. S. Vagaralia and T. G. Langdon. Deformation mechanisms in h.c.p. metals
at elevated temperatures - I. creep behavior of magnesium. Acta Metallurgica,
29(12):1969 – 1982, 1981.
[22] A. Couret and D. Caillard. An in situ study of prismatic glide in magnesium-I. The
rate controlling mechanism. Acta Metallurgica, 33(8):1447 – 1454, 1985.
[23] M. H. Yoo and J. K. Lee. Deformation twinning in h.c.p. metals and alloys.
Philosophical Magazine A, 63:987 – 1000, 1991.

Bibliography 103
[24] M. G. Zelin, H. S. Yang, R. Z. Valiev and A. K. Mukherjee. Interaction of high-
temperature deformation mechanisms in a magnesium alloy with mixed fine and
coarse grains. Metallurgical and Materials Transactions A, 23(11):3135 – 3140, 1992.
[25] E. A. Ball and P. B. Prangnell. Tensile-compressive yield asymmetries in high
strength wrought magnesium alloys. Scripta Metallurgica et Materialia, 31(2):111 –
116, 1994.
[26] J. W. Christian and S. Mahajan. Deformation twinning. Progress in Materials
Science, 39(1-2):1 – 157, 1995.
[27] S. R. Agnew, M. H. Yoo, and C. N. Tome. Application of texture simulation to
understanding mechanical behavior of Mg and solid solution alloys containing Li or
Y. Acta Materialia, 49(20):4277 – 4289, 2001.
[28] H. Watanabe, H. Tsutsui, T. Mukai, M. Kohzu, S. Tanabe and K. Higashi. De-
formation mechanism in a coarse-grained Mg-Al-Zn alloy at elevated temperatures.
International Journal of Plasticity, 17(3):387 – 397, 2001.
[29] M. R. Barnett. Influence of deformation conditions and texture on the high
temperature flow stress of magnesium AZ31. Journal of Light Metals, 1(3):167 –
177, 2001.
[30] S. R. Agnew, C. N. Tome, D. W. Brown, T. M. Holden and S. C. Vogel. Study of
slip mechanisms in a magnesium alloy by neutron diffraction and modeling. Scripta
Materialia, 48(8):1003 – 1008, 2003.
[31] A. Galiyev, O. Sitdikov and R. Kaibyshev. Deformation behavior and controlling
mechanisms for plastic flow of magnesium and magnesium alloy. Materials
Transactions, 4:426 – 435, 2003.
[32] J. Koike, T. Kobayashi, T. Mukai, H. Watanabe, M. Suzuki, K. Maruyama and
K. Higashi. The activity of non-basal slip systems and dynamic recovery at room
temperature in fine-grained AZ31B magnesium alloys. Acta Materialia, 51(7):2055
– 2065, 2003.
[33] M. R. Barnett. A taylor model based description of the proof stress of magnesium
AZ31 during hot working. Metallurgical and Materials Transactions A, 34(9):1799
– 1806, 2003.
[34] M. R. Barnett, Z. Keshavarz, A. G. Beer and D. Atwell. Influence of grain size on
the compressive deformation of wrought Mg-3Al-1Zn. Acta Materialia, 52(17):5093
– 5103, 2004.
[35] R. Gehrmann, M. M. Frommert and G. Gottstein. Texture effects on plastic
deformation of magnesium. Materials Science and Engineering A, 395(1-2):338 –
349, 2005.

104
[36] S. R. Agnew and O. Duygulu. Plastic anisotropy and the role of non-basal slip
in magnesium alloy AZ31B. International Journal of Plasticity, 21(6):1161 – 1193,
2005.
[37] J. A. del Valle, M. T. Perez-Prado and O. A. Ruano. Deformation mechanisms
responsible for the high ductility in a Mg AZ31 alloy analyzed by electron
backscattered diffraction. Metallurgical and Materials Transactions A, 36(6):1427 –
1438, 2005.
[38] Z. Keshavarz and M. R. Barnett. EBSD analysis of deformation modes in Mg-3Al-
1Zn. Scripta Materialia, 55(10):915 – 918, 2006.
[39] E. Meza-Garcıa, P. Dobron, J. Bohlen, D. Letzig, F. Chmelık, P. Lukac and K. U.
Kainer. Deformation mechanisms in an AZ31 cast magnesium alloy as investigated
by the acoustic emission technique. Materials Science and Engineering A, 462(1-
2):297 – 301, 2007.
[40] M. R. Barnett. Twinning and the ductility of magnesium alloys Part I: ”Tension”
twins. Materials Science and Engineering A, 464(1-2):1 – 7, 2007.
[41] M. R. Barnett. Twinning and the ductility of magnesium alloys Part II: ”Contrac-
tion” twins. Materials Science and Engineering, 464:8 – 16, 2007.
[42] J. A. del Valle and O. A. Ruano. Separate contributions of texture and grain size on
the creep mechanisms in a fine-grained magnesium alloy. Acta Materialia, 55(2):455
– 466, 2007.
[43] X. Y. Lou, M. Li, R. K. Boger, S. R. Agnew, R. H. Wagoner. Hardening evolution
of AZ31B Mg sheet. International Journal of Plasticity, 23(1):44 – 86, 2007.
[44] T. Al-Samman and G. Gottstein. Room temperature formability of a magnesium
AZ31 alloy: Examining the role of texture on the deformation mechanisms. Materials
Science and Engineering A, 488(1-2):406 – 414, 2008.
[45] Y. Chino, K. Kimura and M. Mabuchi. Twinning behavior and deformation
mechanisms of extruded AZ31 Mg alloy. Materials Science and Engineering A,
486(1-2):481 – 488, 2008.
[46] A. Jain, O. Duygulu, D. W. Brown, C. N. Tome and S. R. Agnew. Grain size effects
on the tensile properties and deformation mechanisms of a magnesium alloy, AZ31B,
sheet. Materials Science and Engineering A, 486(1-2):545 – 555, 2008.
[47] B. Hutchinson, M. R. Barnett, A. Ghaderi, P. Cizek and I. Sabirov. Deformation
modes and anisotropy in magnesium alloy AZ31. International Journal of Materials
Research, pages 556 – 563, 2009.

Bibliography 105
[48] I. J. Beyerlein, R. J. McCabe and C. N. Tome. Effect of microstructure on the
nucleation of deformation twins in polycrystalline high-purity magnesium: A multi-
scale modeling study. Journal of Mechanics and Physics of Solids, 59:988 – 1003,
2011.
[49] E. Schmid and W. Boas. Plasticity of Crystals. F. A. Hughes Co. Limited, 1935.
[50] H. Watanabe and K. Ishikawa. Effect of texture on high temperature deformation
behavior at high strain rates in a Mg-3Al-1Zn alloy. Materials Science and
Engineering A, 523:304 – 311, 2009.
[51] A. Jain and S. R. Agnew. Modeling the temperature dependent effect of twinning on
the behavior of magnesium alloy AZ31B sheet. Materials Science and Engineering
A, 462:29 – 36, 2007.
[52] I. Ulacia, N. V. Dudamell, F. Galvez, S. Yi, M. T. Perez Prado and I. Hurtado.
Mechanical behavior and microstructural evolution of a Mg AZ31 sheet at dynamic
strain rates. Acta Materialia, 58:2988 – 2998, 2010.
[53] N. V. Dudamell. High strain-rate behavior of Magnesium alloys. PhD thesis,
Universidad Complutense de Madrid, 2012.
[54] F. E. Hauser, C. D. Starr, L. Tietz and J. E. Dorn. Deformation mechanisms in
polycrystalline aggregates of magnesium. Transactions of the American Society of
Metals, 47:102 – 134, 1955.
[55] B. C. Wonsiewicz and W. A. Backofen. Plasticity of magnesium crystals. Transac-
tions of the metallurgical society of AIME, 239:1422 – 1431, 1967.
[56] S. Myagchilov and P. R. Dawson. Evolution of texture in aggregates of crystals
exhibiting both slip and twinning. Modelling and Simulation in Materials Science
and Engineering, 7:975, 1999.
[57] J. A. del Valle, M. T. Perez-Prado and O. A. Ruano. Texture evolution during
large-strain hot rolling of the Mg AZ61 alloy. Materials Science and Engineeting A,
355:68 – 78, 2003.
[58] H. Somekawa and T. Mukai. Effect of texture on fracture toughness in extruded
AZ31 alloy. Scripta Materialia, 53:541 – 545, 2005.
[59] S. B. Yi, C. H. J. Davies, H. G. Brokmeier, R. E. Bolmaro, K. U. Kainer and
J. Homeyer. Deformation and texture evolution in AZ31 magnesium alloy during
uniaxial loading. Acta Materialia, 54(3):549 – 562, 2006.
[60] S. H. Safi-Naqvi, W. B. Hutchinson and M. R. Barnett. Texture and mechanical
anisotropy in three extruded magnesium alloys. Materials Science and Technology,
24:1283 – 1292, 2008.

106
[61] T. Al-Samman, X. Li and S. Ghosh Chowdury. Orientation dependent slip and
twinning during compression and tension of strongly textures magnesium AZ31 alloy.
Materials Science and Engineering A, 527:3450 – 3463, 2010.
[62] T. Mayama, K. Aizawa, Y. Tadano and M. Kuroda. Influence of twinning
deformation and lattice rotation on strength differential effect in polycrystalline
pure magnesium with rolling texture. Computational Materials Science, 47:448 –
455, 2009.
[63] M. Knezevic, A. Levinson, R. Harris, R. K. Mishra, R. D. Doherty and S. R.
Kalidindi. Deformation twinning in AZ31: Influence on strain hardening and texture
evolution. Acta Materialia, 58:6230 – 6242, 2010.
[64] Valerie Randle and Olaf Engler. Introduction to Texture Analysis: Macrotexture,
Microtexture and Orientation Mapping. Gordon and Breach Science Publishers,
2000.
[65] A. J. Beaudoin, P. R. Dawson, K. K. Mathur, U. F. Kocks and D. A. Korzekwa.
Application of polycrystal plasticity to sheet forming. Computer Methods in Applied
Mechanics and Engineering, 117:49 – 70, 1994.
[66] M. T. Perez-Prado, J. A. del Valle, J. M. Contreras and O. A. Ruano. Microstruc-
tural evolution during large strain hot rolling of an AM60 Mg alloy. Scripta Mate-
rialia, 50:661 – 665, 2004.
[67] J. A. del Valle, M. T. Perez-Prado and O. A. Ruano. The distribution of
disorientation angles in a rolled AZ31 Mg alloy. Revista de Metalurgia de Madrid,
38:353 – 357, 2002.
[68] J. A. del Valle and O. A. Ruano. Effect of annealing treatments on the anisotropy
of a magnesium alloy sheet processed by severe rolling. Material Letters, 63:1551 –
1554, 2009.
[69] J. A. Del Valle and O. A. Ruano. Effect of annealing treatments on the anisotropy of
a magnesium alloy sheet processed by severe rolling. Materials Letters, 63(17):1551
– 1554, 2009.
[70] C. N. Tome U. F. Kocks and H. R. Wenk. Texture and Anisotropy: Preferred
Orientations in Polycrystals and their Effect on Materials Properties. Cambridge
University Press, 2005.
[71] H. J. Bunge. Texture analysis in materials science. Butterworths, 1982.
[72] H. J. Bunge. Fifty years textures in research and practice. Textures and
Microstructures, 8:55 – 75, 1988.

Bibliography 107
[73] M. L. Kronberg and F. H. Wilson. Secondary recrystallization in copper. Transac-
tions of the Metallurgical Society of AIME, 185:501 – 514, 1947.
[74] J. Wang, I. J. Beyerlein and C. N. Tome. An atomic and probabilistic perspective
on twin nucleation in Mg. Scripta Materialia, 63:741 – 746, 2010.
[75] H. El-Kadiri, J. Kapil, A. L. Oppedal, M. Cherkaoui and S. C. Vogel. Flow
asymmetry and nucleation stresses of (1012) twinning and non-basal slip in
magnesium. International Journal of Plasticity, 44:111 – 120, 2013.
[76] H. El-Kadiri, J. Kapil, A. L. Oppedal, L. G. Hector Jr., S. R. Agnew, M. Cherkaoui
and S. C. Vogel. The effect of twin-twin interactions on the nucleation and
propagation of {1012} twinning in magnesium. Acta Materialia, 61:3549 – 3563,
2013.
[77] M. Bamberger and G. Dehm. Trends in the development of new Mg alloys. Annual
Review of Materials Research, 38:505 – 533, 2008.
[78] M. R. Barnett C. Bettles. Advances in wrought magnesium alloys. Cambridge:
Woodhead Publishing, 2012.
[79] S. E. Ion, F. J. Humphreys and S. H. White. Dynamic recrystallization and
the development of microstructure during the high temperature deformation of
magnesium. Acta Metallurgica, 30(10):1909 – 1919, 1982.
[80] R. W. Armstrong and S. M. Walley. High strain rate properties of metals and alloys.
International Materials Reviews, 53(3):105 – 128, 2008.
[81] E. W. Kelley and W. F. Hosford. Plane strain compression of magnesium and
magnesium alloy crystals. Transactions of the metallurgical society of AIME, 242:5
– 13, 1968.
[82] C. H. Caceres, P. Lukac and A. Blake. Strain hardening due to {1012} twinning in
pure magnesium. Philosophical Magazine, 88:991 – 1003, 2008.
[83] S. R. Kalidindi. Incorporation of deformation twinning in crystal plasticity models.
Journal of the Mechanics and Physics of Solids, 46:267 – 271, 1998.
[84] M. Knezevic, A. Levinson, R. Harris, R. K. Mishra, R. D. Doherty and S. R.
Kalidindi. Twinning, dynamic recovery and recrystallization in hot worked Mg-
Al-Zn alloy. Materials Science and Engineering, 337:121 – 133, 2002.
[85] S. B. Yi, I. Schestakow and S. Zaefferer. Twinning-related microstructural evolution
during hot rolling and subsequent annealing of pure magnesium. Materials Science
and Engineering, 516:58 – 64, 2009.

108
[86] A. Galiyev, R. Kaibyshev and G. Gottstein. Correlation of plastic deformation and
dynamic recrystallization in magnesium alloy ZK60. Acta Materialia, 49:1199 –
1207, 2001.
[87] A. Chapuis and J. H. Driver. Temperature dependency of slip and twinning in plane
strain compressed magnesium single crystals. Acta Materialia, 59:1986 – 1994, 2011.
[88] N. V. Dudamell, I. Ulacia, F. Galvez, S. Yi, J. Bohlen, D. Letzig, I. Hurtado and M.
T. Perez-Prado. Twinning and grain subdivision during dynamic deformation of a
Mg AZ31 sheet alloy at room temperature. Acta Materialia, 59:6949 – 6969, 2011.
[89] I. J. Beyerlein, L. Capolungo, P. E. Marshall, R. J. McCabe and C. N. Tome.
Statistical analyses of deformation twinning in magnesium. Philosophical Magazine,
90:2161 – 2190, 2010.
[90] S. H. Park, S. G. Hong and C. S. Lee. Activation mode dependent {1012} twinning
characteristics. Scripta Materialia, 62:202 – 205, 2010.
[91] S. Godet, L. Liang, A. A. Luo and J. J. Jonas. Use of schmid factors to select
extension twin variants in extruded magnesium alloy tubes. Scripta Materialia,
55:1055 – 1058, 2006.
[92] J. Jiang, A. Godfrey, W. Liu and Q. Liu. Identification and analysis of twinning
variants during compression of a Mg-Al-Zn alloy. Scripta Materialia, 58:122 – 125,
2008.
[93] J. J. Jonas, S. Mu, T. Al-Samman, G. Gottstein, L. Jiang and E. Martin. The role of
strain accommodation during the variant selection of primary twins in magnesium.
Acta Materialia, 59:2046 – 2056, 2010.
[94] S. Mu, J. J. Jonas and G. Gottstein. Variant selection on primary, secondary and
tertiary twins in a deformed Mg alloy. Acta Materialia, 60:2043 – 2053, 2012.
[95] R. W. Armstrong. The influence of polycrystal grain size on several mechanical
properties of materials. Metallurgical and Materials Transactions, 1:1169 – 1176,
1970.
[96] M. A. Meyers, O. Vohringer and V. A. Lubarda. The onset of twinning in metals:
a constitutive description. Acta Materialia, 49:4025 – 4039, 2001.
[97] I. Gutierrez-Urrutia, S. Zaefferer and D. Raabe. The effect of grain size and grain
orientation on deformation twinning in a Fe-22 wt.% Mn-0.6 wt.% C TWIP steel.
Materials Science and Engineering, 527:3552 – 3560, 2010.
[98] I. Gutierrez-Urrutia and D. Raabe. Dislocation and twin substructure evolution
during strain hardening of an Fe-22 wt.% Mn-0.6 wt.% C TWIP steel observed by
electron channeling contrast imaging. Acta Materialia, 59:6449 – 6462, 2011.

Bibliography 109
[99] A. Hamasaiid, G. Dour, T. Loulou and M. D. Dargusch. A predictive model for the
evolution of the thermal conductance at the casting-die interfaces in high pressure
die-casting. International Journal of Thermal Sciences, 49:365 – 372, 2010.
[100] N. A. El-Mahallawy, M. A. Taha, E. Pokora and F. Klein. On the influence of
process variables on the thermal conditions and properties of high pressure die-cast
magnesium alloys. Journal of Materials Processing Technology, 73:125 – 138, 1998.
[101] E. M. Gutman, Ya. Unigovski, M. Levkovich, Z. Koren, E. Aghion and M. Dangur.
Influence of technological parameters of permanent mold casting and die-casting on
creep and strenght of Mg alloy AZ91D. Materials Science and Engineering A, 234 -
236:880 – 883, 1997.
[102] S. G. Lee, A. M. Gokhale, G. R. Patel and M. Evans. Effect of process parameters on
porosity distributions in high-pressure die-cast AM50 Mg-alloy. Materials Science
and Engineering A, 427:99 – 111, 2006.
[103] J. P. Weiler, J. T. Wood, R. J. Klassen, R. Berkmortel and G. Wang. Variability
of skin thickness in an AM60B magnesium alloy die-casting. Materials Science and
Engineering A, 419:297 – 305, 2006.
[104] J. P. Weiler and J. T. Wood. Modeling the tensile failure of cast magnesium alloys.
Journal of Alloys and Compounds, 537:133 – 140, 2012.
[105] J. P. Weiler and J. T. Wood. Modeling fracture properties in a die-cast AM60B
magnesium alloy I - analytical failure model. Materials Science and Engineering A,
527:25 – 31, 2009.
[106] J. P. Weiler and J. T. Wood. Modeling fracture properties in a die-cast AM60B
magnesium alloy II - the effects of the size and location of porosity determined using
finite element simulations. Materials Science and Engineering A, 527:32 – 37, 2009.
[107] J. P. Weiler, J. T. Wood, R. J. Klassen, E. Maire, R. Berkmortel and G. Wang.
Relationship between internal porosity and fracture strength of die-cast magnesium
AM60B alloy. Materials Science and Engineering A, 395:315 – 322, 2005.
[108] M. F. Horstemeyer, N. Yang, Ken Gall, D. L. McDowell, J. Fan and P. M. Gullett.
High cycle fatigue of a die-cast AZ91E-T4 magnesium alloy. Acta Materialia, 52:1327
– 1336, 2004.
[109] S. G. Lee, G. R. Patel, A. M. Gokhale, A. Sreeranganathan and M. F. Horstemeyer.
Quantitative fractographic analysis of variability in the tensile ductility of high-
pressure die-cast AE44 Mg-alloy. Materials Science and Engineering, 427:255 – 262,
2006.

110
[110] S. G. Lee, G. R. Patel, A. M. Gokhale, A. Sreeranganathan and M. F. Horstemeyer.
Variability in the tensile ductility of high-pressure die-cast AM50 Mg-alloy. Scripta
Materialia, 53:851 – 856, 2005.
[111] G. Chadha, J. E. Allison and J. W. Jones. The role of microstructure on
ductility of die-cast AM50 and AM60 magnesium alloys. Metallurgical and Materials
Transactions A, 38:286 – 297, 2007.
[112] C. D. Lee. Tensile properties of high-pressure die-cast AM60 and AZ91 magnesium
alloys on microporosity variation. Journal of Materials Science, 42:10032 – 10039,
2007.
[113] J. Song, S. M. Xiong, M. Li and J. Allison. The correlation between microstructure
and mechanical properties of high-pressure die-cast AM50 alloy. Journal of Alloys
and Compounds, 477:863 – 869, 2009.
[114] C. H. Caceres and B. I. Selling. Casting defects and the tensile properties of an
Al-Si-Mg alloy. Materials Science and Engineering A, 220:109 – 116, 1996.
[115] C. H. Caceres. On the effect of macroporosity on the tensile properties of the Al-7%
Si-0.4% Mg casting alloy. Scripta Metallurgica et Materialia, 32:1851 – 1856, 1995.
[116] B. Chen, Q. Yuan, J. Luo and J. H. Fan. Constitutive description for casting
magnesium alloy involving void evolution. Transactions of Nonferrous Metals Society
of China, 20:s467 – s470, 2010.
[117] S. B. Biner and W. A. Spitzig. Densification of iron compacts with various initial
porosities under hydrostatic pressure. Acta Metallurgical et Materialia, 38:603 – 610,
1990.
[118] A. K. Vasudevan and O. Richmond. The influence of hydrostatic pressure on the
ductility of Al-SiC composites. Materials Science and Engineering A, 107:63 – 69,
1989.
[119] A. L. Gurson. Plastic Flow and Fracture Behavior of Ductile Materials Incorporating
Void Nucleation, Growth and Interaction. PhD thesis, Brown University, Providence,
RI, 1975.
[120] A. L. Gurson. Continuum theory of ductile rupture by void nucleation and growth:
Part I - yield criteria and flow rules for porous ductile media. Journal of Engineering
Materials and Technology, 99:2 – 15, 1977.
[121] I. E French and P. F. Weinrich. The effect of hydrostatic pressure on the tensile
fracture of α-brass. Acta Metallurgica, 21:1533 – 1537, 1973.

Bibliography 111
[122] W. A. Spitzig. Effect of hydrostatic pressure on deformation, damage evolution,
and fracture of iron with various initial porosities. Acta Metallurgica et Materialia,
38:1445 – 1453, 1990.
[123] H. N. Zbib, M. Rhee and J. P. Hirth. On plastic deformation and the dynamics of
3D dislocations. International Journal of Mechanical Sciences, 40(2-3):113 – 127,
1998.
[124] J. Segurado, J. LLorca and I. Romero. Computational issues in the simulation of two-
dimensional discrete dislocation mechanics. Modelling and Simulation in Materials
Science and Engineering, 15(4):S361 – S376, 2007.
[125] S. Groh, E. B. Marin, M. F. Horstemeyer and H. M. Zbib. Multiscale modeling
of the plasticity in an aluminum single crystal. International Journal of Plasticity,
25:1456 – 1473, 2009.
[126] Z. Q. Wang, I. J. Beyerlein and R. LeSar. Plastic anisotropy in fcc single crystals in
high rate deformation. International Journal of Plasticity, 25:26 – 48, 2009.
[127] K. Danas, V. S. Deshpande and N. A. Fleck. Compliant interfaces: A mechanism for
relaxation of dislocation pile-ups in a sheared single crystal. International Journal
of Plasticity, 16(12):1792 – 1805, 2010.
[128] J. Wang, J. P. Hirth and C. N. Tome. (1012) twinning nucleation mechanisms in
hexagonal-close-packed crystals. Acta Materialia, 57(18):5521 – 5530, 2009.
[129] L. Yue, H. Zhang and D. Y. Li. A closer look at the local responses of twin and
grain boundaries in Cu to stress at the nanoscale with possible transition from the
P-H to the inverse P-H relation. Acta Materialia, 58(7):2677 – 2684, 2010.
[130] R. E. Miller and E. B. Tadmor. The quasicontinuum method: Overview, applications
and current directions. Journal of Computer-Aided Materials Design, 9(3):103 – 239,
2002.
[131] Y. Gao, Z. L. Liu, X. C. You and Z. Zhuang. A hybrid multiscale computational
framework of crystal plasticity at submicron scales. Computational Materials
Science, 49(3):672 – 681, 2010.
[132] F. Roters, P. Eisenlohr, L. Hantcherli, D. D. Tjahjanto, T. R. Bieler and D. Raabe.
Overview of constitutive laws, kinematics, homogenization and multiscale methods
in crystal plasticity finite-element modeling: Theory, experiments, applications. Acta
Materialia, 58(4):1152 – 1211, 2010.
[133] C. Miehe, J. Schroder and J. Schotte. Computational homogenization analysis
in finite plasticity simulation of texture development in polycrystalline materials.
Computer Methods in Applied Mechanics and Engineering, 171(3-4):387 – 418, 1999.

112
[134] P. Gilormini, M. V. Nebozhyn and P. P. Castaneda. Accurate estimates for the creep
behavior of hexagonal polycrystals. Acta Materialia, 49:329 – 337, 2001.
[135] M. Bornert, R. Masson, P. P. Castaneda and A. Zaoui. Second-order estimates
for the effective behaviour of viscoplastic polycrystalline materials. Journal of the
Mechanics and Physics of Solids, 49:2737 – 2764, 2001.
[136] Y. Liu, P. Gilormini, P. P. Castaneda. Variational self-consistent estimates for
texture evolution in viscoplastic polycrystals. Acta Materialia, 51:5425 – 5437, 2003.
[137] R. A. Lebensohn, Y. Liu, P. P. Castaneda. On the accuracy of the self-consistent
approximation for polycrystals: comparison with full-field numerical simulations.
Acta Materialia, 52:5347 – 5361, 2004.
[138] P. Van Houtte, A. K. Kanjarla, A. Van Bael, M. Seefeldt, L. Delannay. Multiscale
modelling of the plastic anisotropy and deformation texture of polycrystalline
materials. European Journal of Mechanics A/Solids, 25:634 – 648, 2006.
[139] R. A. Lebensohn, C. N. Tome and P. P. Castaneda. Self-consistent modelling of the
mechanical behaviour of viscoplastic polycrystals incorporating intragranular field
fluctuations. Philosophical Magazine, 87(28):4287 – 4322, 2007.
[140] M. Knezevic, S. R. Kalidindi and R. K. Mishra. Delineation of first-order closures
for plastic properties requiring explicit consideration of strain hardening and
crystallographic texture evolution. International Journal of Plasticity, 24:327 – 342,
2008.
[141] G. Proust, C. N. Tome, A. Jain and S. R. Agnew. Modeling the effect of twinning
and detwinning during strain-path changes of magnesium alloy AZ31. International
Journal of Plasticity, 25:861 – 880, 2009.
[142] C. J. Neil and S. R. Agnew. Crystal plasticity-based forming limit prediction for non-
cubic metals: Application to Mg alloy AZ31B. International Journal of Plasticity,
25:379 – 398, 2009.
[143] J. B. Shaffer, M. Knezevic and S. R. Kalidindi. Building texture evolution networks
for deformation processing of polycrystalline fcc metals using spectral approaches:
Applications to process design for targeted performance. International Journal of
Plasticity, 26:1183 – 1194, 2010.
[144] Z. Zhao, M. Ramesh, D. Raabe, A. M. Cuitino and R. Radovitzky. Investigation of
three-dimensional aspects of grain-scale plastic surface deformation of an aluminum
oligocrystal. International Journal of Plasticity, 24(12):2278 – 2297, 2008.
[145] A. M. Cuitino and M. Ortiz. Computational modelling of single crystals. Modelling
and Simulation in Materials Science and Engineering, 1(3):225 – 263, 1993.

Bibliography 113
[146] L. Anand and M. Kothari. A computational procedure for rate-independent crystal
plasticity. Journal of the Mechanics and Physics of Solids, 44(4):525 – 558, 1996.
[147] L. Anand. Single-crystal elasto-viscoplasticity: application to texture evolution in
polycrystalline metals at large strains. Computer Methods in Applied Mechanics and
Engineering, 193:5359 – 5383, 2004.
[148] Z. Zhao, S. Kuchnicki, R. Radovitzky and A. M. Cuitino. Influence of in-grain mesh
resolution on the prediction of deformation textures in fcc polycrystals by crystal
plasticity FEM. Acta Materialia, 55:2361 – 2373, 2007.
[149] S. N. Kuchnicki, R. A. Radovitzky and A. M. Cuitino. An explicit formulation for
multiscale modeling of bcc metals. International Journal of Plasticity, 24(12):2173
– 2191, 2008.
[150] A. Jerusalem, M. Dao, S. Suresh, R. Radovitzky. Three-dimensional model of
strength and ductility of polycrystalline copper containing nanoscale twins. Acta
Materialia, 56:4647 – 4657, 2008.
[151] M. G. Lee, H. Lim, B. L. Adams, J. P. Hirth and R. H. Wagoner. A dislocation
density-based single crystal constitutive equation. International Journal of Plastic-
ity, 26:925 – 938, 2010.
[152] Z. L. Liu, Z. Zhuang, X. M. Liu, X. C. Zhao and Z. H. Zhang. A dislocation
dynamics based higher-order crystal plasticity model and applications on confined
thin-film plasticity. International Journal of Plasticity, 27(2):201 – 216, 2011.
[153] P. Thamburaja. A finite-deformation-based phenomenological theory for shape-
memory alloys. International Journal of Plasticity, 26:1195 – 1219, 2010.
[154] J. Rossiter, A. Brahme, M. H. Simha, K. Inal and R. Mishra. A new crystal
plasticity scheme for explicit time integration codes to simulate deformation in 3D
microstructures: Effects of strain path, strain rate and thermal softening on localized
deformation in the aluminum alloy 5754 during simple shear. International Journal
of Plasticity, 26(12):1702 – 1725, 2010.
[155] A. R. Zamiri and F. Pourboghrat. A novel yield function for single crystals based
on combined constraints optimization. International Journal of Plasticity, 26:731 –
746, 2010.
[156] I. Watanabe, D. Setoyama, N. Iwata and K. Nakanishi. Characterization of
yielding behavior of polycrystalline metals with single crystal plasticity based on
representative characteristic length. International Journal of Plasticity, 26:570 –
585, 2010.

114
[157] J. H. Sung, J. H. Kim and R. H. Wagoner. A plastic constitutive equation
incorporating strain, strain-rate, and temperature. International Journal of
Plasticity, 26(12):1746 – 1771, 2010.
[158] A. V. Staroselsky. Crystal Plasticity Due to Slip and Twinning. PhD thesis,
Massachusetts Institute of Technology, 1998.
[159] A. Staroselsky and L. Anand. A constitutive model for hcp materials deforming by
slip and twinning: application to magnesium alloy AZ31B. International Journal of
Plasticity, 19(10):1843 – 1864, 2003.
[160] S. Graff, W. Brocks and D. Steglich. Yielding of magnesium: From single crystal to
polycrystalline aggregates. International Journal of Plasticity, 23:1957 – 1978, 2007.
[161] J. R. Mayeur and D. L. McDowell. A three-dimensional crystal plasticity model for
duplex Ti-6Al-4V. International Journal of Plasticity, 23:1457 – 1485, 2007.
[162] W. Tang, S. Zhang, Y. Peng and D. Li. Simulation of magnesium alloy AZ31 sheet
during cylindrical cup drawing with rate independent crystal plasticity finite element
method. Computational Materials Science, 46(2):393 – 399, 2009.
[163] S. -H. Choi, D. H. Kim, S. S. Park, B. S. You. Simulation of stress concentration in
Mg alloys using the crystal plasticity finite element method. Acta Materialia, 58:320
– 329, 2010.
[164] S. -H. Choi, D. H. Kim, H. W. Lee and E. J. Shin. Simulation of texture evolution
and macroscopic properties in Mg alloys using the crystal plasticity finite element
method. Materials Science and Engineering A, 527(4-5):1151 – 1159, 2010.
[165] J. Levesque, K. Inal, K. W. Neale and R. K. Mishra. Numerical modeling of
formability of extruded magnesium alloy tubes. International Journal of Plasticity,
26:65 – 83, 2010.
[166] F. Shen, J. Zhou, Y. Liu, R. Zhu, S. Zhang and Y. Wang. Deformation twinning
mechanism and its effects on the mechanical behaviors of ultrafine grained and
nanocrystalline copper. Computational Materials Science, 49(2):226 – 235, 2010.
[167] A. Prakasha, S. M. Weygand and H. Riedel. Modeling the evolution of texture and
grain shape in Mg alloy AZ31 using the crystal plasticity finite element method.
Computational Materials Science, 45:744 – 750, 2009.
[168] A. Izadbakhsh, K. Inal, R. Mishra and M. Niewczas. New crystal plasticity
constitutive model for large strain deformation in single crystals of magnesium.
Computational Materials Science, 50:2185 – 2202, 2011.
[169] D. Peirce, R. J. Asaro and A. Needleman. An analysis of nonuniform and localized
deformation in ductile single crystals. Acta Metallurgica, 30:1087 – 1119, 1982.

Bibliography 115
[170] D. Peirce, R. J. Asaro and A. Needleman. Material rate dependence and localized
deformation in crystalline solids. Acta Metallurgica, 31:1951 – 1976, 1983.
[171] R. J. Asaro and A. Needleman. Texture development and strain hardening in rate
dependent polycrystals. Acta Metallurgica, 33:923 – 953, 1985.
[172] J. Segurado, R. A. Lebensohn, J. Llorca and C. N. Tome. Multiscale modeling of
plasticity based on embedding the viscoplastic self-consistent formulation in implicit
finite elements. International Journal of Plasticity, 28:124 – 140, 2012.
[173] P. Van Houtte. Simulation of the rolling and shear texture of brass by the taylor
theory adapted for mechanical twinning. Acta Metallurgica, 26(4):591 – 604, 1978.
[174] R. A. Lebensohn and C. N. Tome. A self-consistent anisotropic approach for
the simulation of plastic deformation and texture development of polycrystals:
application to zirconium alloys. Acta Metallurgica et Materialia, 41:2611 – 2624,
1993.
[175] G. Proust, C. N. Tome and G. C. Kaschner. Modeling texture, twinning and
hardening evolution during deformation of hexagonal materials. Acta Materialia,
55:2137 – 2148, 2007.
[176] B. Clausen, C. N. Tome, D. W. Brown and S. R. Agnew. Reorientation and stress
relaxation due to twinning: Modeling and experimental characterization for Mg.
Acta Materialia, 56:2456 – 2468, 2008.
[177] S. -H. Choi, D. W. Kim, B. S. Seong and A. D. Rollett. 3-d simulation of spatial stress
distribution in an AZ31 Mg alloy sheet under in-plane compression. International
Journal of Plasticity, 27:1702 – 1720, 2011.
[178] H. Abdolvand and M. R. Daymond. Multi-scale modeling and experimental study
of twin inception and propagation in hexagonal close-packed materials using a
crystal plasticity finite element approach - Part I: Average behavior. Journal of
the Mechanics and Physics of Solids, 61:783 – 802, 2013.
[179] H. Abdolvand and M. R. Daymond. Multi-scale modeling and experimental study of
twin inception and propagation in hexagonal close-packed materials using a crystal
plasticity finite element approach - Part II: Local behavior. Journal of the Mechanics
and Physics of Solids, 61:803 – 818, 2013.
[180] J. R. Rice and D. M. Tracey. On the ductile enlargement of voids in triaxial stress
fields. Journal of the Mechanics and Physics of Solids, 17:201 – 2017, 1969.
[181] G. P. Potirniche, M. F. Horstemeyer, G. J. Wagner and P. M. Gullett. A molecular
dynamics study of void growth and coalescence in single crystal nickel. International
Journal of Plasticity, 22:257 – 278, 2006.

116
[182] R. A. Lebensohn, M. I. Idiart, P. P. Castaneda and P. -G. Vincent. Dilatational
viscoplasticity of polycrystalline solids with intergranular cavities. Philosophical
Magazine, 91:3038 – 3067, 2011.
[183] H. Moulinec and P. Suquet. A numerical method for computing the overall response
of nonlinear composites with complex microstructure. Computer Methods in Applied
Mechanics and Engineering, 157:69 – 94, 1998.
[184] R. A. Lebensohn, J. P. Escobedo, E. K. Cerreta, D. Dennis-Koller, C. A. Bronkhorst
and J. F. Bingert. Modeling void growth in polycrystalline materials. Acta
Materialia, 61:6918 – 6932, 2013.
[185] S. G. Lee, A. M. Gokhale and A. Sreeranganathan. Reconstruction and visualization
of complex 3D pore morphologies in a high-pressure die-cast magnesium alloy.
Materials Science and Engineering A, 427:92 – 98, 2006.
[186] G. Nicoletto, G. Anzelotti and R. Konecena. X-ray computed tomography vs.
metallography for pore sizing and fatigue of cast Al-alloys. Procedia Engineering,
2:547 – 554, 2010.
[187] N. Vanderesse, E. Maire, A. Chabod and J. Y. Buffiere. Microtomographic study
and finite element analysis of the porosity harmfulness in a cast aluminium alloy.
International Journal of Fatigue, 33:1514 – 1525, 2011.
[188] B. D. Cullity and S. R. Stock. Elements of X-Ray Diffraction. Prentice Hall, 1956.
[189] F. J. Humphreys. Characterisation of fine-scale microstructures by electron
backscatter diffraction (EBSD). Scripta Materialia, 51:771 – 776, 2004.
[190] B. L. Adams A. J. Schwartz, M. Kumar and D. P. Field. Electron Backscatter
Diffraction in Materials Science. Springer, 2009.
[191] A. J. Wilkinson and T. Ben. Britton. Strains, planes, and EBSD in materials science.
Materials Today, 15:366 – 376, 2012.
[192] S. Zaefferer, S. I. Wright and D. Raabe. Three-dimensional orientation microscopy in
a focused ion beamscanning electron microscope: A new dimension of microstructure
characterization. Metallurgical and Materials Transactions, 39:374 – 389, 2008.
[193] A. Khorashadizadeh. Microstructure characterization of ultra-fine grained Cu-0.17
wt.% Zr. PhD thesis, RWTH Aachen University / Max-Planck Institute for Iron
Research, Dusseldorf, Germany, 2011.
[194] P. J. Konijnenberg, S. Zaefferer, S. -B. Lee, A. D. Rollett, G. S. Rohrer and D. Raabe.
Advanced methods and tools for reconstruction and analysis of grain boundaries from
3D EBSD data sets. Materials Science Forum, 702:475 – 478, 2012.

Bibliography 117
[195] J. Konrad, S. Zaefferer and D. Raabe. Investigation of orientation gradients around
a hard Laves particle in a warm-rolled Fe3Al-based alloy using a 3D EBSD-FIB
technique. Acta Materialia, 54:1369 – 1380, 2006.
[196] A. Bastos, S. Zaefferer, D. Raabe and C. Schuh. Characterization of the
microstructure and texture of nanostructured electrodeposited NiCo using electron
backscatter diffraction (EBSD). Acta Materialia, 54:2451 – 2492, 2006.
[197] N. Zaafarani, D. Raabe, R. N. Singh, F. Roters and S. Zaefferer. Three-dimensional
investigation of the texture and microstructure below a nanoindent in a Cu single
crystal using 3D EBSD and crystal plasticity finite element simulations. Acta
Materialia, 54:1863 – 1876, 2006.
[198] N. Zaafarani, D. Raabe, F. Roters and S. Zaefferer. On the origin of deformation-
induced rotation patterns below nanoindents. Acta Materialia, 56:31 – 42, 2008.
[199] E. Demir, D. Raabe, N. Zaafarani and S. Zaefferer. Investigation of the indentation
size effect through the measurement of the geometrically necessary dislocations
beneath small indents of different depths using EBSD tomography. Acta Materialia,
57:559 – 569, 2009.
[200] E. Maire P. Merle J. Baruchel, J. Y. Buffiere and G. Peix. X-Ray Tomography in
Materials Science. HERMES Science Publications, 2000.
[201] F. Sket. Tomographic Investigation of Creep and Creep Damage under Inhomoge-
neous Loading Conditions. PhD thesis, Bochum University / Max-Planck Institute
for Iron Research, Dusseldorf, Germany, 2010.
[202] E. N. Landis and D. T. Keane. X-ray microtomography. Materials Characterization,
61:1305 – 1316, 2010.
[203] F. Sket, K. Dzieciol, A. Borbely, A. R. Kaysser-Pyzalla and K. Maile, R. Scheck.
Microtomographic investigation of damage in E911 steel after long term creep.
Material Science and Engineering A, 528:103 – 111, 2010.
[204] F. Sket, R. Seltzer, J. M. Molina-Aldareguia, C. Gonzalez and J. Llorca. Deter-
mination of damage micromechanisms and fracture resistance of glass fiber/epoxy
cross-ply laminate by means of x-ray computed microtomography. Composites Sci-
ence and Technology, 72:350 – 359, 2012.
[205] Phoenix X-ray. http://www.phoenix-xray.com/, 2014.
[206] G. T. Herman. Image Reconstruction from Projections: The Fundamentals of
Computerized Tomography. Academic, New York, 1980.
[207] A. C. Kak and M. Slaney. Principles of computerized tomographic imaging. IEEE
Press, 1987.

118
[208] MTex–MATLAB Toolbox for Quantitative Texture Analysis.
https://code.google.com/p/mtex/, 2010.
[209] E. H. Lee. Elastic plastic deformation at finite strain. Journal of Applied Mechanics,
36:1 – 6, 1969.
[210] J. R. Rice. Inelastic constitutive relations for solids: An internal-variable theory and
its application to metal plasticity. Journal of the Mechanics and Physics of Solids,
19(6):433 – 455, 1971.
[211] H. El-Kadiri and A. L. Oppedal. A crystal plasticity theory for latent hardening by
glide twinning through dislocation transmutation and twin accommodation effects.
Journal of the Mechanics and Physics of Solids, 58:613 – 624, 2010.
[212] Dassault Systemes. Abaqus/Explicit - http://www.simulia.com/, 2010.
[213] M. D. Nave and M. R. Barnett. Microstructures and textures of pure magnesium
deformed in plane-strain compression. Scripta Materialia, 51:881 – 885, 2004.
[214] M. R. Barnett, M. D. Navea and C. J. Bettles. Deformation microstructures and
textures of some cold rolled mg alloys. Materials Science and Engineering A, 386:205
– 211, 2004.
[215] M. Knezevic, A. Levinson, R. Harris, R. K. Mishra, R. D. Doherty and S. R.
Kalidindi. Deformation twinning in az31: Influence on strain hardening and texture
evolution. Acta Materialia, 58:6230 – 6242, 2010.
[216] S. Graff. Micromechanical modeling of the deformation of HCP Metals. PhD thesis,
Technischen Universitat Berlin / GKSS Forschungszentrum, 2007.
[217] H. Wang, B. Raeisinia, P. D. Wu, S. R. Agnew and C. N. Tome. Evaluation
of self-consistent polycrystal plasticity models for magnesium alloy AZ31B sheet.
International Journal of Solids and Structures, 47:2905 – 2917, 2010.
[218] A. Serra and D. J. Bacon. A new model for {1012} twin growth in hcp metals.
Philosophical Magazine A, 73(2):333 – 343, 1996.
[219] C. Gandhi and M. F. Ashby. Fracture mechanism maps for materials which cleave:
f.c.c., b.c.c., and h.c.p. metals and ceramics. Acta Metallurgica, 27:1565 – 1602,
1979.
[220] G. M. Hughes, G. E. Smith, P. E. J. Flewitt and A. G. Crocker. The brittle fracture
of polycrystalline Zinc. Proceedings of the Royal Society A, 463:2129 – 2151, 2007.
[221] R. Quey, P. R. Dawson and F. Barbe. Large-scale 3-d random polycrystals for the
finite element method: Generation, meshing and remeshing. Computer Methods in
Applied Mechanics and Engineering, 200:1729 – 1745, 2011.

Bibliography 119
[222] S. H. Hong, S. H. Park and C. S. Lee. Strain path dependence of (1012) twinning
activity in a polycrystalline magnesium alloy. Scripta Materialia, 64:145 – 148, 2011.
[223] B. M. Morrow, R. J. McCabe, E. K. Cerreta and C. N. Tome. Variability in EBSD
statistics for textured zirconium. Materials Science and Engineering A, 574:157 –
162, 2013.
[224] R. Y. Zhang, M. R. Daymond and R. A. Holt. A finite element model of deformation
twinning in zirconium. Materials Science and Engineering A, 473:139 – 146, 2008.
[225] D. M. Saylor, B. S. El-Dasher, B. L. Adams and G. S. Rohrer. Measuring the
five-parameter grain-boundary distribution from observations of planar sections.
Metallurgical and Materials Transactions A, 35:1981 – 1989, 2004.
[226] P. Molnar, A. Jager and P. Lejcek. Twin nucleation at grain boundaries in Mg-
3 wt.% Al-1 wt.% Zn alloy processed by equal channel angular pressing. Scripta
Materialia, 67:467 – 470, 2012.
[227] L. Wang, P. Eisenlohr, Y. Yang, T. R. Bieler and M. A. Crimp. Nucleation of paired
twins at grain boundaries in titanium. Scripta Materialia, 63:827 – 830, 2010.
[228] J. Wang, S. K. Yadav, J. P. Hith, C. N. Tome and I. J. Beyerlein. Pure-
shuffle nucleation of deformation twins in hexagonal-close-packed metals. Materials
Research Letters, 1:126 – 132, 2013.
[229] L. Capolungo, P. E. Marshall, R. J. McCabe, I. J. Beyerlein, C. N. Tome. Nucleation
and growth of twins in Zr: A statistical study. Acta Materialia, 57:6047 – 6056, 2009.
[230] E. Martin, L. Capolungo, L. Jiang and J. J. Jonas. Variant selection during
secondary twinning in Mg-3%Al. Acta Materialia, 58:3970 – 3983, 2010.
[231] I, J. Beyerlein and C. N. Tome. A probabilistic twin nucleation model for hcp
polycrystalline metals. Proceedings of the Royal Society A, 466:2517 – 2544, 2010.
[232] L. P. Evers, D. M. Parks, W. A. M. Brekelmans and M. G. D. Geers. Non-local
crystal plasticity model with intrinsic ssd and gnd effects. Journal of the Mechanics
and Physics of Solids, 50:2403 – 2424, 2002.
[233] L. P. Evers, W. A. M. Brekelmans and M. G. D. Geers. Non-local crystal plasticity
model with intrinsic ssd and gnd effects. Journal of the Mechanics and Physics of
Solids, 52:2379 – 2401, 2004.
[234] S. Biswas, F. Sket, M. Chiumenti, I. Gurierrez-Urrutia, J. M. Molina-Aldareguia
and M. T. Perez-Prado. Relationship between the 3D porosity and -phase
distributions and the mechanical properties of a high pressure die-cast AZ91 Mg
alloy. Metallurgical and Materials Transactions A, 44:4391 – 4403, 2013.

120
[235] L. A. Feldkamp, L. C. Davis and J. W. Kress. Practical cone-beam algorithm.
Journal of the Optical Society of America A, 1:612 – 619, 1984.
[236] W. Niblack. An Introduction to Digital Image Processing. Prentice Hall, 1986.
[237] E. J. Garboczi. Three-dimensional mathematical analysis of particle shape using X-
ray romography and spherical harmonics: Application to aggregates used in concrete.
Cement and Concrete Research, 32:1621 – 1638, 2002.
[238] A. Isaac, F. Sket, W. Reimers, B. Camin, G. Santhoff and A. R. Pyzalla. In situ
3D quantification of the evolution of creep cavity size, shape, and spatial orientation
using synchrotron X-ray tomography. Materials Science and Engineering A, 478:108
– 118, 2008.
[239] MedINRIA. http://med.inria.fr/, 2012.
[240] K. Dzieciol, A. Borbely, F. Sket, A. Isaac, M. Di Michiel, P. Cloetens, Th. Buslaps
and A. R. Pyzalla. Void growth in copper during high-temperature power-law creep.
Acta Materialia, 59:671 – 677, 2011.
[241] K. Dzieciol, A. Isaac, F. Sket, A. Borbely and A. R. Pyzalla. Application
of correlation techniques to creep damage studies. Collected Proceedings TMS
Conference, pages 15 – 19, 2009.
[242] Volume Graphics Solutions about Voxels. http://www.volumegraphics.com/, 2013.
[243] S. Youssef, E. Maire and R. Gaertner. Finite element modelling of the actual
structure of cellular materials determined by X-ray tomography. Acta Materialia,
53:719 – 730, 2005.
[244] Altair HyperWorks. Hypermesh - http://www.altairhyperworks.com/, 2012.
[245] Dassault Systemes. Abaqus/Standard - http://www.simulia.com/, 2011.
[246] MatWeb Material Property Data. http://www.matweb.com/, 2013.
[247] C. D. Lee. Dependence of tensile properties of AM60 magnesium alloy on
microporosity and grain size. Materials Science and Engineering, 454 - 455:575
– 580, 2007.
[248] R. W. Rice. Limitations of pore-stress concentrations on the mechanical properties
of porous materials. Journal of Materials Science, 32:4731 – 4736, 1997.
[249] V. Tvergaard. Effect of void size difference on growth and cavitation instabilities.
Journal of the Mechanics and Physics of Solids, 8:1237 – 1253, 1996.
[250] V. Tvergaard and C. Niordson. Nonlocal plasticity effects on interaction of different
size voids. International Journal of Plasticity, 20:107 – 120, 2004.

Bibliography 121
[251] Dassault Systemes. Abaqus/Explicit - http://www.simulia.com/, 2011.
[252] A. Fernandez. Simulacion numerica del comportamiento mecanico de la aleacion
de magnesio AZ31B, Undergraduate thesis, Technical University of Madrid, Spain,
2009.

122

List of Figures
1.1 Multiscale modeling framework of materials across the different length scales. 2
1.2 The HCP structure of Mg. . . . . . . . . . . . . . . . . . . . . . . . . . . . . 3
1.3 Main deformation mechanisms in Mg crystals. . . . . . . . . . . . . . . . . . 4
1.4 CRSS variations for the different slip/twin systems as a function of
temperature and strain rate for a Mg AZ31 alloy [50]. . . . . . . . . . . . . 5
1.5 Representation of the direct pole figures of a rolled Mg sheet. . . . . . . . . 6
1.6 Euler angles. The specimen coordinate XYZ is shown in black, the
crystallite system X’Y’Z’ is shown in red [64]. . . . . . . . . . . . . . . . . . 7
1.7 (a) Probability distribution vs. θ corresponding to an aggregate of HCP
crystals with basal and prismatic fiber textures. (b) Probability distribution
vs. θ of a random aggregate and of a basal fiber with a spread lower than
30° (adapted from [67]). . . . . . . . . . . . . . . . . . . . . . . . . . . . . . 9
3.1 (a) X-ray diffractometer used in this work. (b) Schematic illustrating the
texture goniometer and the corresponding rotation angles. . . . . . . . . . . 20
3.2 Schematic drawing of the EBSD system. . . . . . . . . . . . . . . . . . . . . 21
3.3 (a) Origin of Kikuchi lines [64]. (b) Kikuchi pattern. . . . . . . . . . . . . . 21
3.4 Schematic representation of the grazing-incidence edge-milling method [192]. 22
3.5 (a) (FIB)-FEG-SEM dual beam instrument; (b) Schematic representation
of the tilt geometry [192]. . . . . . . . . . . . . . . . . . . . . . . . . . . . . 23
3.6 Schematic of a XCT acquisition configuration for cone beam geometry [205]. 25
3.7 Schematic of the X-ray absorption model used for tomographic reconstruc-
tion [201]. . . . . . . . . . . . . . . . . . . . . . . . . . . . . . . . . . . . . . 26
4.1 Multiplicative decomposition of the deformation gradient F. . . . . . . . . . 29
4.2 Uniaxial compression numerical tests along ND and RD. The resulting von
Mises stress field is plotted for both cases. . . . . . . . . . . . . . . . . . . . 33
123

124
4.3 Comparison between the experimental (top) and the numerical (bottom)
initial texture for the two cases: (a) along ND; (b) along RD. . . . . . . . . 34
4.4 Experimental and simulated stress-strain curves (true) corresponding to
uniaxial compression of the Mg AZ31 alloy: (a) along ND; (b) along RD. . 35
4.5 Comparison between {0001} experimental and numerical textures at defor-
mation state A, B, C, D, E and F for the compression along RD. . . . . . . 38
4.6 Normalized slip/twin activity for both cases: (a) compression along ND;
(b) compression along RD. . . . . . . . . . . . . . . . . . . . . . . . . . . . . 39
4.7 Experimental and numerical twinning rotation fraction evolution. . . . . . . 40
4.8 Twinning rotation state in a longitudinal cut of the sample (blue: non-
rotated, red: rotated) for the states of deformation A, B, C, D, E and
F. . . . . . . . . . . . . . . . . . . . . . . . . . . . . . . . . . . . . . . . . . 41
4.9 Twinning rotation fraction as a function of the vertical element layer in the
sample at 4% deformation. . . . . . . . . . . . . . . . . . . . . . . . . . . . 41
4.10 Corrected cumulated average slip/twin activity for both cases of compres-
sion: along RD and along ND. . . . . . . . . . . . . . . . . . . . . . . . . . 44
4.11 Experimental and numerical stress-strain curves for the plane strain
compression along RD, constrained along TD. . . . . . . . . . . . . . . . . . 45
4.12 Comparison between {0001} experimental and numerical textures at defor-
mation state A, B, C, D and E for the plane strain compression along RD,
constrained along TD. . . . . . . . . . . . . . . . . . . . . . . . . . . . . . . 46
4.13 Normalized slip/twin activity for the plane strain compression along RD,
constrained along TD. . . . . . . . . . . . . . . . . . . . . . . . . . . . . . . 46
4.14 Corrected cumulated average slip/twin activity for the plane strain com-
pression along RD, constrained along TD; the dash line corresponds to the
acceptable range of values for the strain-to-failure. . . . . . . . . . . . . . . 47
5.1 Polycrystalline aggregate mesh of the proposed extended model. . . . . . . 51
5.2 (a) Comparison of experimental and simulated true stress-true strain curves
corresponding to uniaxial compression along RD and ND; (b) normalized
slip/twin activities for both numerical models (dashed line corresponds to
initial model described in Chapter 4). . . . . . . . . . . . . . . . . . . . . . 52
5.3 (a) Comparison of the cumulative twin volume fraction measured experi-
mentally and predicted by the initial model described in Chapter 4 and by
the extended model; (b) twin volume fraction predicted by the extended
model along three planes perpendicular to RD, ND and TD in the center
of the polycrystalline aggregate. . . . . . . . . . . . . . . . . . . . . . . . . . 53

List of Figures 125
5.4 Qualitative estimation of the twin volume fraction along three orthogonal
planes in the Mg AZ31 alloy tested in uniaxial compression along RD: (a)
volume reconstructed from three 2D EBSD maps measured in the sample
deformed up to 1.6%; (b) volume reconstructed from three 2D EBSD maps
measured in the sample deformed up to 2.6%; (c) twinned regions (dark)
predicted by the extended model in a sample deformed up to 5%. . . . . . . 54
5.5 Sample compressed along RD up to 2.6%. 3D reconstruction of inverse pole
figure maps on the RD obtained by the 3D EBSD method. P1, P2, P3, P4
refer to the four original grains, and Tij to variant j of grain i. . . . . . . . . 55
5.6 3D morphology of different twin variants: (a) T11 (volume size: 5 µm in TD
(blue axis)×10 µm in RD (green axis)×15.8 µm in ND (red axis)); (b) T12
(orange) and T13 (yellow) (volume size: 5 µm in TD×16.2 µm in RD×11 µm
in ND); (c) T41 (volume size: 5 µm in TD×8.8 µm in RD×8.2 µm in ND). . 57
5.7 Maximum twin thickness measured at different heights in grain P1: (a) for
each T11 lamella (the four lamella are named T111, T112, T113 and T114); (b)
for secondary (T12) and tertiary (T13) twins. . . . . . . . . . . . . . . . . . . 58
5.8 Variation in the crossing frequency with respect to the GB misorientation
angle measured in the sample compressed along RD up to a strain of 1.6%;
the arrows point to the θ between P1 and P2, P1 and P3, and, P1 andP4. . . 60
5.9 2D EBSD maps in the RD of the GB between grains P1 and P2; map (a)
corresponds to a height of 3.4 µm and map (b) to a height of 4.4 µm. . . . . 61
5.10 Sequence of 2D EBSD maps of the GB between grains P1 and P3 in height
steps of 200 nm; the first slice shown (a) corresponds to a height of 1.6 µm
and the final slice (o) to a height of 4.4 µm. . . . . . . . . . . . . . . . . . . 62
5.11 Sequence of 2D EBSD maps in the RD at height steps of 200 nm, which
illustrate the GB between grains P1 and P4; the first slice shown (a)
corresponds to a height of 1 µm and the final slice (h) to a height of 2.4 µm. 63
5.12 2D EBSD section of the volume illustrated in Figure 5.5, located at a height
of 4.8 µm. . . . . . . . . . . . . . . . . . . . . . . . . . . . . . . . . . . . . . 64
5.13 (a) Polycrystalline model (a quarter of the model is hidden to ease the
visualization of the two grains of interest) consisting of a 25-grains Voronoı
tessellation (2,113,409 tetrahedral elements); the two grains of interest are
assigned the orientations of the corresponding P1 − Pi |i=2,3,4 pairs and
cut transversally for visualization purposes of: (b) twin transfer across the
P1 − P2 boundary (3.9% of strain); (c) twin transfer across the P1 − P3
boundary (6% of strain); (d) twin transfer across the P1−P4 boundary (6%
of strain); the red line shows the paths from grain P1 to the neighboring
grains along which slip activity was evaluated in Figure 5.14. . . . . . . . . 66
5.14 Normalized slip/twin activities in the vicinity of the three GBs P1 − P2,
P1 −P3 and P1 −P4 at 2.8% and 5%, respectively, along the path drawn in
red in Figures 5.13(b-d); the black dashed line indicates the GB. . . . . . . 67

126
5.15 (a) Polycrystalline model cut transversally for visualization purposes
showing the twin nucleation point at the low angle P1 − P2 GB and (b)
variation of the von Mises stress along the path drawn in red in (a) at
a strain of 2.1%; (c) polycrystalline model and (d) normalized slip/twin
activity along the path drawn in red in (c) at a strain of 2.5%). . . . . . . 69
5.16 Polycrystalline model cut transversally for visualization purposes at a strain
of 0.7% showing grains P1 and P4 with the fields of (a) the von Mises stress
and (b) the activity of the primary variant in grain P1 (the black arrow
indicates the point of nucleation). . . . . . . . . . . . . . . . . . . . . . . . 69
6.1 Sample geometry of the Mg AZ91 alloy dog-bone shaped casting fabricated
by HPDC. . . . . . . . . . . . . . . . . . . . . . . . . . . . . . . . . . . . . . 72
6.2 Microstructure of the as-HPDC Mg AZ91 alloy at different magnifications;
the micrographs were taken in Grip 1. . . . . . . . . . . . . . . . . . . . . . 72
6.3 (a) Schematic representation of CF parameter: a cavity (in blue) is
approximated by its equivalent ellipsoid (in red) and a, b and c are the
axes of the equivalent ellipsoid; (b) CF parameter definition [201]. . . . . . 74
6.4 FE mesh of the selected tomographic sub-volume geometry: a sector of the
pore-free mesh was removed for visualization purposes. . . . . . . . . . . . . 76
6.5 Uniaxial compression true stress-true strain curves: experimental data and
model calibration. . . . . . . . . . . . . . . . . . . . . . . . . . . . . . . . . 77
6.6 Low resolution tomographic reconstruction of the complete dog-bone
casting, high resolution reconstruction (initial state) of the cylindrical
volume subjected to the pressure treatment and of the sub-volume of
300×300×300 µm3 used in the FE analysis. . . . . . . . . . . . . . . . . . . 78
6.7 Reconstructed cross-sectional views of the same slice before (a) and after (b)
the pressure treatment; magnified region at the largest area of the central
pore before (c) and after (d) the pressure treatment. . . . . . . . . . . . . . 78
6.8 3D reconstruction of the sub-volume extracted for simulation purposes
before (a) and after (b) the pressure treatment; (c) superposition of volumes
from (a) and (b) with initial pores (before treatment) set to semitransparent. 79
6.9 (a) Histogram of the relative volume change (∆V/V0) of the 9,689 tracked
cavities. (b) Pore volume after pressure treatment vs. relative volume change. 81
6.10 (a) Histogram of the relative CF change (∆CF/CF0) of the 9,689 tracked
cavities; (b) relative CF change (∆CF/CF0) vs. relative volume change
(∆V/V0) (positive values of ∆CF/CF0 indicate transition to more regular
pores, while negative values indicate transition to more irregular pores). . . 82
6.11 Comparison between experimental and simulations results with and without
internal pressure for the same sub-volume; (a) normalized number of pores
vs. the relative volume change (∆V/V0); (b) pore volume after pressure
treatment vs. relative volume change (∆V/V0). . . . . . . . . . . . . . . . . 84

List of Figures 127
6.12 Comparison of experimental results and simulations with and without
internal pressure for the same sub-volume; (a) normalized number of
pores vs. the relative CF change (∆CF/CF0); (b) relative CF change
(∆CF/CF0) vs. relative volume change (∆V/V0) . . . . . . . . . . . . . . . 85
6.13 Uniaxial compression response of (a) cylinders extracted from Grip 1 before
and after the pressure treatment as measured experimentally and (b) the
simulated sub-volume. . . . . . . . . . . . . . . . . . . . . . . . . . . . . . . 87
6.14 Examples of the equivalent plastic strain field located around the pores after
releasing the hydrostatic pressure. . . . . . . . . . . . . . . . . . . . . . . . 89
6.15 Relative volume pore change (∆V/V0) vs. Rw = w/(w + rNN ) for several
initial pore volume classes. . . . . . . . . . . . . . . . . . . . . . . . . . . . . 90
6.16 Uniaxial compression true stress-true strain curves: CPFE model and
standard J2 plasticity with linear isotropic hardening model. . . . . . . . . 91
6.17 FE mesh including: (a) 1 internal pore (equivalent to 3 Voronoı grains, Pore
1) and (b) 2 internal pores (one equivalent to 3 Voronoı grains, Pore 1, and
the second equivalent to 1 Voronoı grain, Pore 2). . . . . . . . . . . . . . . . 91
A.1 Fractured Mg AZ31 alloy specimen after uniaxial compression along RD [252]. 97
A.2 SEM micrographs illustrating the fracture surface of the Mg AZ31 alloy
after uniaxial compression along RD: (a) x500; (b) x1000. . . . . . . . . . . 98

128

List of Tables
1.1 Planes and directions of main deformation mechanisms in Mg and Mg alloys. 3
4.1 Composition of the Mg AZ31 alloy under study (in wt. %). . . . . . . . . . 27
4.2 Strain at transition states. . . . . . . . . . . . . . . . . . . . . . . . . . . . . 34
4.3 Material parameters after calibration. . . . . . . . . . . . . . . . . . . . . . 36
4.4 Material parameters sensibility. . . . . . . . . . . . . . . . . . . . . . . . . . 37
4.5 Transition strain between regions for the plane strain compression case. . . 45
5.1 SF and θdev corresponding to all the twins contained in the volume
of Figure 5.5; the values of the Euler angles (ϕ1,Φ, ϕ2 – in degrees)
corresponding to the original grains (Pi) and the twins (Tij) are included.
The minimum θdev values are highlighted in bold letters. . . . . . . . . . . . 56
6.1 ∆V/V0 and ∆CF/CF0 for the isotropic and the CPFE models with 1
internal pore. . . . . . . . . . . . . . . . . . . . . . . . . . . . . . . . . . . . 92
6.2 ∆V/V0 and ∆CF/CF0 for the isotropic and CPFE models with 2 internal
pores. . . . . . . . . . . . . . . . . . . . . . . . . . . . . . . . . . . . . . . . 92
B.1 Six {1012}〈1011〉 twin variants. . . . . . . . . . . . . . . . . . . . . . . . . . 99
129

130

List of Publications
Journal Publications
� F. Sket, A. Fernandez, A. Jerusalem, J. Molina-Aldareguia and M.T. Perez-
Prado. Effect of hydrostatic pressure on the 3D porosity distribution and mechanical
behavior of a high pressure die-cast Mg AZ91 alloy. Journal of the Mechanics
and Physics of Solids, Under review.
� A. Fernandez, A. Jerusalem, I. Gutierrez-Urrutia, M.T. Perez-Prado. Three-
dimensional investigation of the grain boundary-twin interactions in a Mg AZ31 alloy
by electron backscatter diffraction and continuum modeling. Acta Materialia,
61:7679-7692, 2013.
� A. Jerusalem, A. Fernandez, A. Kunz and J.R. Greer. Continuum modeling
of dislocation starvation and subsequent nucleation in nano-pillar compression.
Scripta Materialia, 66 (2):93-96, 2012.
� A. Fernandez, M.T. Perez-Prado, Y. Wei, A. Jerusalem. Continuum modeling
of the response of a Mg alloy AZ31 rolled sheet during uniaxial deformation.
International Journal of Plasticity, 27:1739-1757, 2011.
� A. Jerusalem, A. Fernandez, M.T. Perez-Prado. Continuum modeling of {1012}
twinning in a Mg-3wt.%Al-1wt.%Zn rolled sheet. Revista de Metalurgia de
Madrid, Invited paper, 7:133-137, 2010.
Conferences
� Magnesium Workshop Madrid 2013, Madrid, Spain (2013). A. Fernandez,
I. Gutierrez-Urrutia, A. Jerusalem and M.T. Perez-Prado. 3D polycrystalline
continuum model of deformation mechanisms in a rolled magnesium AZ31 alloy.
(Oral presentation)
131

132
� TMS 2013 142nd Annual Meeting Exhibition, San Antonio, TX, USA (2013). A.
Fernandez, F. Sket, J. Molina-Aldareguia, M.T. Perez-Prado and A. Jerusalem.
Influence of hydrostatic pressure on porosity of die-cast Mg alloys: experimental
and numerical studies. (Poster)
� 8th European Solid Mechanics Conference ESMC2012, Graz, Austria (2012). A.
Fernandez, F. Sket, J. Molina-Aldareguia, M.T. Perez-Prado and A. Jerusalem.
Influence of hydrostatic pressure on porosity of die-cast Mg alloys: experimental
and numerical studies. (Oral presentation)
� 8th European Solid Mechanics Conference ESMC2012, Graz, Austria (2012). A.
Jerusalem, A. Fernandez, A. Kunz and J.R. Greer. Continuum modeling of
dislocation starvation and subsequent nucleation in nano-pillar compressions. (Oral
presentation)
� International Conference on Computational Plasticity COMPLAS XI, Barcelona,
Spain (2011). A. Fernandez, M.T. Perez-Prado, Y. Wei and A. Jerusalem. Con-
tinuum modeling of Mg alloy AZ31 under uniaxial deformation. (Oral presentation)