Continuous Conservation Reserve Program - U.S. Fish and Wildlife
21
Fish and Wildlife Benefits of Farm Bill Programs: 2000–2005 Update 93 Continuous Conservation Reserve Program: Faors Influencing the Value of Agricultural Buffers to Wildlife Conservation William R. Clark Ecology, Evolution and Organismal Biology Iowa State University 353 Bessey Hall Ames, IA 50011, USA [email protected] Kathleen F. Reeder Ecology, Evolution and Organismal Biology Iowa State University 353 Bessey Hall Ames, IA 50011, USA [email protected] Abstract e Continuous Conservation Reserve Program (CCRP) principally consists of linear buffer conservation practices designed to remove highly erodible land from production and to improve water quality. e extent of projects differentiates CCRP from the general signup CRP, which focuses on whole-field enrollments. Small sizes and high edge to area ratios have the potential to limit the usefulness of these practices for wildlife. Careful planning and management are keys to gaining the desired wildlife benefits from these plantings, particularly with regard to the role of buffers in the landscape. Evidence that the practices enrolled in the CCRP are used by wildlife is mounting, although studies are still most heavily focused on the avian community. Further study on reproductive success and survival is needed on all species of wildlife using these plantings to determine how the CCRP can best serve wildlife habitat functions. Introduction e Continuous Conservation Reserve Program (CCRP), authorized by the 1996 Farm Bill, made certain high-priority agricultural conservation practices eligible for enrollment in the Conservation Reserve Program (CRP) on a continuous basis, rather than through the general CRP signup process. Practices eligible under this program include riparian
Transcript of Continuous Conservation Reserve Program - U.S. Fish and Wildlife
Fish and Wildlife Benefi ts of Farm Bill Programs: 2000–2005 Update 93
Continuous Conservation Reserve Program: Fact ors Infl uencing the Value of Agricultural Buff ers to Wildlife ConservationWilliam R. ClarkEcology, Evolution and Organismal Biology Iowa State University353 Bessey HallAmes, IA 50011, [email protected]
Kathleen F. ReederEcology, Evolution and Organismal Biology Iowa State University353 Bessey HallAmes, IA 50011, [email protected]
AbstractTh e Continuous Conservation Reserve Program (CCRP) principally consists of linear buff er conservation practices designed to remove highly erodible land from production and to improve water quality. Th e extent of projects diff erentiates CCRP from the general signup CRP, which focuses on whole-fi eld enrollments. Small sizes and high edge to area ratios have the potential to limit the usefulness of these practices for wildlife. Careful planning and management are keys to gaining the desired wildlife benefi ts from these plantings, particularly with regard to the role of buff ers in the landscape. Evidence that the practices enrolled in the CCRP are used by wildlife is mounting, although studies are still most heavily focused on the avian community. Further study on reproductive success and survival is needed on all species of wildlife using these plantings to determine how the CCRP can best serve wildlife habitat functions.
IntroductionTh e Continuous Conservation Reserve Program (CCRP), authorized by the 1996 Farm Bill, made certain high-priority agricultural conservation practices eligible for enrollment in the Conservation Reserve Program (CRP) on a continuous basis, rather than through the general CRP signup process. Practices eligible under this program include riparian

94 Continuous Enrollment CRP: Factors Infl uencing the Value of Agricultural Buff ers for Wildlife • Clark and Reeder
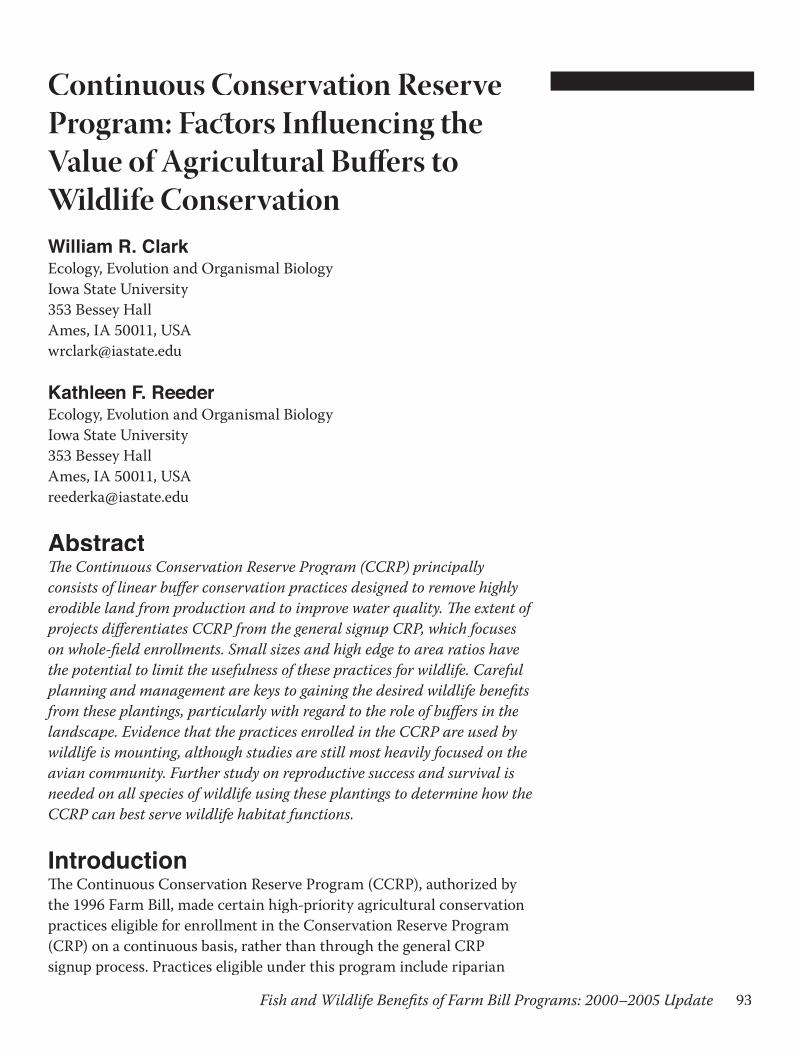
buff ers, wildlife habitat buff ers, wetland buff ers, herbaceous fi lter strips, wetland restoration, grassed waterways, shelterbelts, living snow fences, contour grass strips, salt-tolerant vegetation, and shallow-water areas for wildlife (FSA 2003). Riparian buff ers, herbaceous fi lter strips, and grassed waterways account for 61% of the acres currently enrolled in the CCRP (FSA 2004). CCRP plantings are generally small in area (often <5.0 ha [12.5 acres]), concentrated along waterways on highly erodible lands or other high-priority areas, and are generally linear because they are associated with fi eld edges. Contracts in this program are 10–15 years in duration (FSA 2003). In this paper, we use the term “buff er” in reference to these collective CCRP practices, because the majority of them are designed to either buff er natural features such as wetlands or streams from adjacent agricultural areas or to provide a wind barrier. Th e objectives of the program are to improve water quality and control soil erosion, improve air quality, enhance aesthetics, and create wildlife habitat (FSA 2003)
Th e 2002 Farm Bill resulted in no major modifi cations of the CCRP, which remains available to producers. CCRP currently enrolls 1,143,892 ha (2,826,608 acres) in conservation practices (Tables 1 and 2) (including Conservation Reserve Enhancement Program acres authorized under continuous signup) (FSA 2004). Th e 2002 Bill also authorized implementation of the Conservation Security Program (CSP) (see Henry, this volume), which was designed to work in conjunction with pre-existing programs such as the CRP and CCRP, but not to replace them (CCC & NRCS 2004). Enrollment of acres in CCRP can earn producers points toward qualifi cation for Tiers II and III CSP, providing additional incentive for conservation.
Th is paper updates and expands the previous review that summarized CCRP based on similar strip-cover practices (Best 2000). Th at review focused on avian responses. Since that time, interest in documented use of strip-cover by invertebrates, amphibians and reptiles (herpetofauna), and small mammals has emerged. Furthermore, in the intervening years there has been opportunity to study birds and other taxa directly on areas enrolled in CCRP rather than infer CCRP eff ects from research on similar strip-cover habitats such as roadsides or fi eld borders. We have incorporated those newer fi ndings as well as repeated some of the important fi ndings of research focused on areas functionally similar to CCRP. We fi rst review the evidence that addresses how CCRP diff ers as potential habitat from the annual crops that it is designed to replace. Th en we review the available information that documents benefi ts of CCRP to wildlife, including how buff ers function as edges and corridors and how predators respond to buff ers. We address the state of our understanding
Example of a sod waterway. NRCS, Lynn Betts

Fish and Wildlife Benefi ts of Farm Bill Programs: 2000–2005 Update 95
of the importance of landscape context on the conservation value of buff ers. Finally, we conclude with an assessment of information gaps that should be addressed in future monitoring or research programs. We have organized the review according to the functional aspects of CCRP practices for wildlife rather than following a taxonomic chapter organization. We focused on CCRP as applied in agricultural/grassland regions of the Midwest and Great Plains rather than the wooded riparian systems of the East and Southeast, largely because the available research has primarily addressed grassland systems. We did not address any information on CCRP benefi ts to fi sh, although our review of information on CCRP benefi ts revealed a paucity of information on this subject.
Wildlife Abundance and Species Composition in CCRP BuffersIn the Midwest and Great Plains, the major benefi t of CCRP, like that of CRP and other farm conservation programs, is that they replace annual row crops with perennial vegetation cover, thus providing substantial improvement for wildlife (Best 2000, Johnson 2000, Reynolds 2000, Ryan 2000). Even though some bird species such as vesper sparrows (Pooecetes gramineus), dickcissels (Spiza americana), and red-winged blackbirds (Agelaius phoeniceus(Agelaius phoeniceus( ) are known to nest in row-crop fi elds, abundances in vegetation buff ers are an order of magnitude greater than in row crops (Best 2000). All recent studies confi rmed that generalist species comprise the largest part of the abundance of birds using buff ers. For example, red-winged blackbirds accounted for 54% of total bird abundance sampled in Iowa fi lter strips (Henningsen 2003) and 50% of the total bird abundance in Iowa grassed waterways (Knoot 2004).
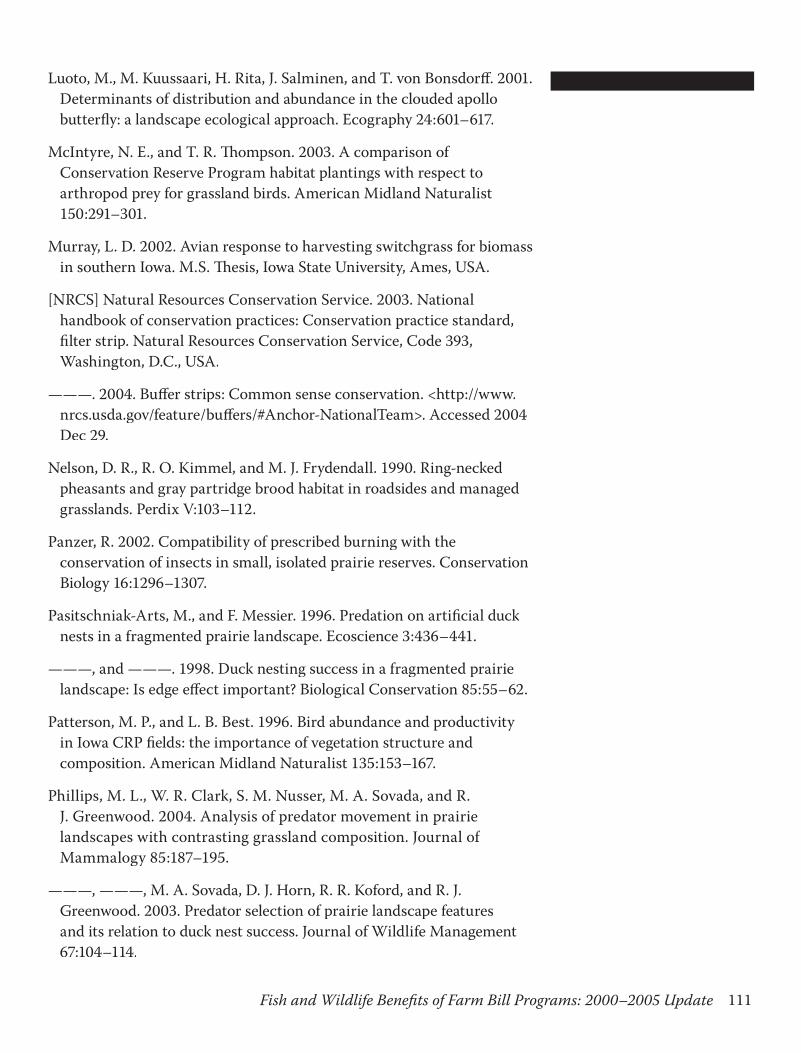
Game birds such as ring-necked pheasants (Phasianus colchicus), gray partridge (Perdix perdix), and mallards (Anas platyrhynchos), and mallards (Anas platyrhynchos), and mallards ( ) have been documented using strip cover (Best 2000). Ring-necked pheasants and, more rarely, mallards have nested in CCRP plantings (Henningsen 2003, Kammin 2003, Knoot 2004), although these species exhibit a preference for large blocks of cover (Clark et al. 1999, Reynolds 2000). CCRP may provide winter cover for resident game birds, but unfortunately little data have been collected on winter use of CCRP by wildlife. Kammin (2003) documented 11 species of birds, including ring-necked pheasants, present in fi lter strips in winter in Illinois, but abundance was low for all species. When snow is deep, buff ers often act as drift fences that catch snow, thereby reducing their value as winter habitat. Presence of shrubs and trees provides additional structure and may ameliorate this eff ect somewhat. Some resource managers recommend seeding plans for buff ers based upon winter cover considerations, choosing switchgrass (Panicum

96 Continuous Enrollment CRP: Factors Infl uencing the Value of Agricultural Buff ers for Wildlife • Clark and Reeder
Table 1. Conservation practices on continuous signup CRP acres as of December 2004 (excludes general signup acres). Adapted from NRCS (2004).
Continuous (CREP) Continuous (non-CREP) Total
Code Practice Acres % Acres % Acres %
CP1 New introduced grasses and legumes 100,065 16 72,303 3 172,368 6
CP2 New native grasses 60,392 10 19,361 1 79,753 3
CP3 New softwood trees (not longleaf) 375 0 320 0 695 0
CP3A New hardwood trees 8,092 1 877 0 8,969 0
CP4 Permanent wildlife habitat 38,314 6 3,053 0 41,367 1
CP5 Field windbreaks 2,633 0 68,750 3 71,383 2
CP7 Erosion control structures 1 0 0 0 1 0
CP8 Grass waterways 559 0 105,025 5 105,584 4
CP9 Shallow water areas for wildlife 2,282 0 45,732 2 48,014 2
CP10 Existing grasses and legumes 11,033 2 37,385 2 48,418 2
CP11 Existing trees 357 0 0 0 357 0
CP12 Wildlife food plots 1,662 0 0 0 1,662 0
CP15 Contour grass strips 111 0 76,620 3 76,731 3
CP16 Shelterbelts 385 0 28,147 1 28,532 1
CP17 Living snow fences 0 0 3,968 0 3,968 0
CP18 Salinity reducing vegetation 9 0 292,964 13 292,973 10
CP21 Filter strips (grass) 126,244 20 835,773 37 962,017 34
CP22 Riparian buffers 142,204 23 552,562 25 694,766 24
CP23 Wetland restoration 91,216 15 0 0 91,216 3
CP23 Wetland restoration (fl oodplain) 0 0 62,630 3 62,630 2
CP23A Wetland restoration (non-fl oodplain) 0 0 1,670 0 1,670 0
CP24 Cross wind trap strips 38 0 643 0 681 0
CP25 Rare and declining habitat 38,165 6 0 0 38,165 1
CP26 Sediment retention 6 0 0 0 6 0
CP29 Wildlife habitat buffer (marginal pasture) 1,520 0 13,694 1 15,214 1
CP30 Wetland buffer (marginal pasture) 188 0 9,939 0 10,127 0
CP31 Bottomland hardwood 55 0 7,198 0 7,253 0
CP33 Upland bird habitat buffers 0 0 3,697 0 3,697 0
Unknown 410 0 904 0 1,314 0
Total 626,315 100 2,243,217 100 2,869,532 100

Fish and Wildlife Benefi ts of Farm Bill Programs: 2000–2005 Update 97
Table 2. Continuous CRP enrollment as of December 2004, not including CREP. Adapted from NRCS (2004).
State Acres Annual Rental (Annual Rental (× $1000) $1000) Payments ($/acre)Payments ($/acre)Alabama 29,059 1,460 50.25Alaska 482 28 57.12Arkansas 43,759 2,842 64.95California 5,973 405 67.78Colorado 8,073 326 40.62Connecticut 83 7 82.32Delaware 858 68 78.95Florida 68 3 39.88Georgia 1,983 99 50.12Idaho 9,024 488 54.05Illinois 251,599 33,354 132.57Indiana 78,897 9,941 126.00Iowa 409,688 58,054 141.70Kansas 52,672 3,335 63.31Kentucky 47,646 4,681 98.24Louisiana 20,607 1,247 60.52Maine 368 24 65.09Maryland 3,157 268 84.83Massachusetts 27 3 105.06Michigan 20,384 2,006 98.41Minnesota 229,925 18,923 82.30Mississippi 139,820 8,403 60.10Missouri 75,389 6,690 88.75Montana 152,578 5,732 37.56Nebraska 58,392 4,593 78.66New Hampshire 185 10 52.75New Jersey 182 14 75.50New Mexico 6,662 292 43.77New York 8,423 447 53.08North Carolina 12,579 914 72.67North Dakota 138,600 5,635 40.65Ohio 42,900 4,692 109.37Oklahoma 12,973 567 43.71Oregon 12,191 724 59.42Pennsylvania 1,075 55 50.77Puerto Rico 436 28 65.00South Carolina 34,392 1,837 53.42South Dakota 148,342 9,162 61.76Tennessee 15,630 1,536 87.88Texas 39,599 10 38.78Utah 216 19 46.39Vermont 358 78 53.96Virginia 1,603 6,555 48.68Washington 93,024 12 70.46West Virginia 266 2,663 46.43Wisconsin 27,865 232 95.56Wyoming 5,199 1,536 44.71Total U.S. 2,243,217 199,837 89.08

98 Continuous Enrollment CRP: Factors Infl uencing the Value of Agricultural Buff ers for Wildlife • Clark and Reeder
virgatum) because it maintains more vertical structure than the most commonly planted species, smooth brome (Bromus inermis). However, we could fi nd no research on what types of factors infl uence wildlife use of CCRP in winter.
Grassland specialist bird species use buff er strips in comparatively small numbers. Knoot (2004) observed grasshopper sparrows (Ammodramus numbers. Knoot (2004) observed grasshopper sparrows (Ammodramus numbers. Knoot (2004) observed grasshopper sparrows (savannarum), Savannah sparrows (Passerculus sandwichensis), Savannah sparrows (Passerculus sandwichensis), Savannah sparrows ( ), and vesper sparrows in fewer than 5 of 33 grassed waterways surveyed. Kammin (2003) reported that grassland species such as grasshopper sparrows, Henslow’s sparrows (Ammodramus henslowiisparrows (Ammodramus henslowiisparrows ( ), and vesper sparrows were absent from fi lter strips surveyed in Illinois. Buff ers with shrubs and small trees have greater species richness than herbaceous buff ers due to the increased heterogeneity of vegetation structure, but such plantings also chiefl y host generalist species such as red-winged blackbirds, song sparrows (Melospiza generalist species such as red-winged blackbirds, song sparrows (Melospiza generalist species such as red-winged blackbirds, song sparrows (melodia), and brown-headed cowbirds (Molothrus ater), and brown-headed cowbirds (Molothrus ater), and brown-headed cowbirds ( ) (Kammin 2003). Molothrus ater) (Kammin 2003). Molothrus ater
Small mammals, including mice (Peromyscus spp.), voles (Microtus), voles (Microtus), voles ( spp.), shrews (Sorex spp. and Blarina spp.), and ground squirrels (Spermophilusspp.) are common residents in perennial vegetation that comprises buff ers (Snyder and Best 1988, Wiewel 2003). Voles are restricted to areas with substantial vegetation and litter cover (Getz 1961, Birney et al. 1976) and would be rare in row-crop fi elds. In contrast, deer mice densities of 15–50/ha (Clark and Young 1986, Wiewel 2003) have been observed in both perennial vegetation and row-crop fi elds. Specialist mammals like meadow jumping mice (Zapus hudsonius) and least weasels (Mustela ) and least weasels (Mustela ) and least weasels (nivalis) would be uncommon in buff ers.
Buff ers with their perennial vegetation provide habitat for invertebrates to aggregate. In soybean fi elds in Ohio, researchers found that above-ground arthropod predator numbers were higher in grassy corridors than in adjacent soybean fi elds; the corridors may have even drawn in predators from the planted fi elds (Kemp and Barrett 1989). Uncultivated land adjacent to crop fi elds harbors natural enemies that annually colonize fi elds to exploit pests (Price 1976). Th e practice of strip intercropping was developed as a method of managing insect crop pests because uncut strips in alfalfa fi elds attract pest populations into small areas and provide refuge for parasites and predators of insect pests (Weiser et al. 2003).
Th e presence of invertebrate, bird, and small mammal prey within the perennial vegetation in buff ers has been shown to attract larger predators. In a radiotelemetry study of striped skunks (Mephitis mephitisIn a radiotelemetry study of striped skunks (Mephitis mephitisIn a radiotelemetry study of striped skunks ( ) and red foxes (Vulpes vulpes) in North Dakota, Phillips et al. (2003) found that skunks selected perennial cover along wetland edges over other habitat
RIng-necked pheasants. NRCS, Roger Hill

Fish and Wildlife Benefi ts of Farm Bill Programs: 2000–2005 Update 99
types, probably because of abundant food resources (Greenwood et al. 1999). Red foxes selected planted perennial cover over cropland, especially where perennial vegetation was <20% of the landscape. Such selection of agricultural–wetland edges indicates the potential for enhanced predator–prey interactions within buff ers (see sections below).
Vegetation StructureIn general, diverse vegetation structure and composition benefi ts a greater variety of wildlife, but for CCRP there is not a nationwide planting mixture that is required. Th e CCRP fi lter strip practice standard says “species selected shall have stiff stems and a high stem density near the ground surface…[and] be such that the stem spacing does not exceed 1 inch.” Th e standard further states that if the goal is to create wildlife habitat, then “plant species selected for this purpose shall be for permanent vegetation adapted to the wildlife or benefi cial insect population(s) targeted” (NRCS 2003). Brome and brome-alfalfa (Medicago population(s) targeted” (NRCS 2003). Brome and brome-alfalfa (Medicago population(s) targeted” (NRCS 2003). Brome and brome-alfalfa (sativa) is still commonly planted in CCRP buff ers, although individual resource managers may recommend mixtures of native species as are eff ectively required for general enrollment CRP.
Diverse buff ers may provide habitat for benefi cial (and detrimental) arthropods that have importance to agriculture, are prey for wildlife, and have intrinsic esthetic value. Integrated pest managers and ecologists have suggested that integration of uncultivated corridors in agricultural fi elds could have positive economic impacts with regards to pest management (Kemp and Barrett 1989). In a study of fi lter strips in Minnesota, butterfl y abundance and diversity were associated with the quantity of broad-leaved forbs within the strips that provide nectar sources and host plants for larvae (Reeder 2004).
McIntyre and Th ompson (2003) studied prey items of breeding grassland birds and reported that arthropod abundance and diversity were highest at sites with highest vegetative diversity. Benson (2003) found similar patterns in his study of riparian fl oodplain restoration in Iowa. Pheasant chicks depend on adequate populations of arthropods for normal growth and development (Woodward et al. 1977, Nelson et al. 1990) and landscapes dominated by row crops have insuffi cient arthropod biomass to support pheasant broods (Whitmore 1982). In fact in Europe, conservation headlands with diverse plantings of wildfl owers are often incorporated into small grain production specifi cally to the benefi t of game birds (Potts 1986).
Plant species diversity and associated structural heterogeneity provides a variety of perching and nesting sites for birds, and leads to a greater
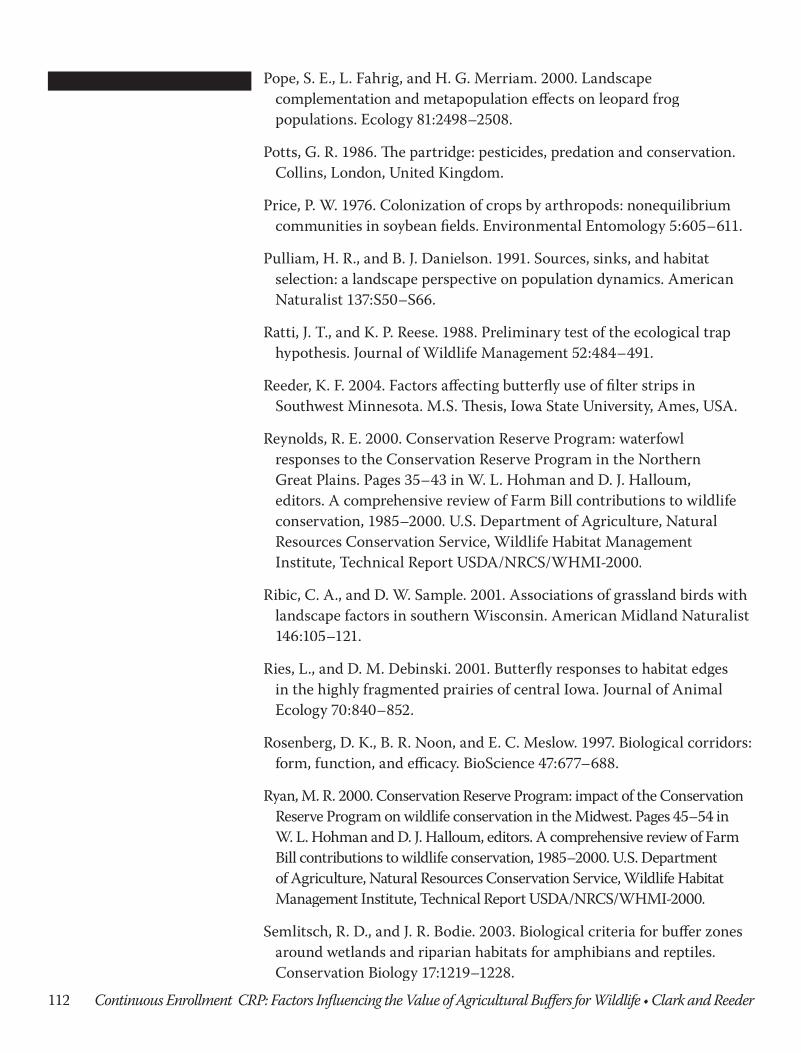
CCRP buffers. NRCS, Lynn Betts

100 Continuous Enrollment CRP: Factors Infl uencing the Value of Agricultural Buff ers for Wildlife • Clark and Reeder
variety of microhabitats for invertebrates and small mammals. Grassland birds are infl uenced by structural diversity of native and restored plant communities (Johnson and Schwartz 1993). Within grassed waterways in Iowa, vegetation vertical density was positively associated with the presence of dickcissels, common yellowthroats (Geothlypis trichas), and red-winged blackbirds (Knoot 2004). Population density of small mammals varied greatly with habitat characteristics, but was generally greater in denser vegetation (Birney et al. 1976). Most explanations of the eff ects of plant cover on wildlife emphasize food availability and protection from predation (Birney et al. 1976, Grant et al. 1977). Prairie voles (Microtus ochrogaster(Birney et al. 1976, Grant et al. 1977). Prairie voles (Microtus ochrogaster(Birney et al. 1976, Grant et al. 1977). Prairie voles ( ) Microtus ochrogaster) Microtus ochrogasteractually have lower density in habitat with the greatest cover such as tallgrass prairie but which have less diverse availability of high-quality forbs for food (Cole and Batzli 1979), whereas meadow voles (Microtus forbs for food (Cole and Batzli 1979), whereas meadow voles (Microtus forbs for food (Cole and Batzli 1979), whereas meadow voles (pennsylvanicus) are abundant in areas with dense grass and litter.
Th ere is very little information on responses of herpetofauna to vegetation structure within CCRP buff ers, but like other taxa the individual species’ habitat requirements would dictate the expected response. For example, Knoot (2004) found that occurrences of smooth green snakes (Lioclonorophis vernalis) in grassed waterways in Iowa were positively associated with litter cover, but eastern garter snake (Th amnophis sirtalis) occurrence was negatively correlated with litter.
Wildlife Reproduction in Buffers Best (2000) provided a very comprehensive review of the factors contributing to low nest success in strip buff ers in agricultural landscapes. Recent studies of nesting birds in CCRP confi rm that success is far lower than in block habitat, but comparable to success in other types of strip-cover. Nest success reported in 3 recent studies in fi lter strips in Iowa, in fi lter strips in Illinois, and in grassed waterways in Iowa was 27%, 13%, and 27%, respectively (Henningsen 2003, Kammin 2003, Knoot 2004). Th e dominant cause of nest failure was predation. Best et al. (1997) reported nest success in CRP fi elds to be 40%, and Patterson and Best (1996) reported a 38% nest success rate in CRP. Similarly, duck nests have exhibited higher survival in large blocks than in strip-cover (Pasitschniak-Arts and Messier 1996). Pheasant nest success is highest in areas consisting of several grassland blocks of at least 16 ha (40 acres) (Clark et al. 1999). Data on mammals and herpetofauna have not been organized in such a way that we can draw any conclusions about reproductive performance in buff ers.
Patch AreaMost CCRP projects would be only minimally suffi cient in size for some area-sensitive bird species and are insuffi cient for others. For example,

Fish and Wildlife Benefi ts of Farm Bill Programs: 2000–2005 Update 101
consider a buff er 0.8 km (0.5 mile) long and 61 m (200 feet) wide, which would be 4.9 ha (12 acres) in area—a representative CCRP planting. Such a patch would be adequate for species with a small home range like that of many small mammals (Gaines et al. 1992), invertebrates, and many snakes, but for more mobile taxa such as birds, such small patches are often insuffi cient. Several species of grassland birds have minimum area requirements (Herkert 1994, Vickery et al. 1994, Walk and Warner 1999, Winter and Faaborg 1999). Th ese requirements are manifested on a distributional level (reduced density or absence in smaller patches) and on a demographic level (reduced reproductive success in smaller patches) (Winter and Faaborg 1999). Herkert (1994) found minimal area requirements for 5 grassland bird species ranging from 5 to 55 ha (12.4–136 acres), and Walk and Warner (1999) reported similar area requirements ranging from 12 to 75 ha (29.7–185.3 acres).
Patterns of area sensitivity can diff er depending on the surrounding landscape (Donovan et al. 1997), suggesting that the eff ectiveness of small CCRP patches might vary regionally. However, Johnson and Igl (2001) studied density and occurrence of grassland bird species in relation to patch size across the northern Great Plains and found fairly consistent area sensitivity across this geographical region, including bird species ranging from northern harriers (Circus cyaneus) to sedge wrens (Cistothorus platensis).
Buffer WidthTh e linear characteristic of buff ers potentially makes width more relevant to wildlife habitat value than patch area per se, but researchers are just beginning to collect data on the eff ects of width. With regard to birds, the results of recent studies are quite mixed. For example, Knoot (2004) found a predictive relationship of grassed waterway width in Iowa for only 2 of 7 species of songbirds, and the direction of the relationship contrasted. In fi lter strips, Kammin (2003) found no relationship, and Henningsen (2003) found that only the abundance of the eastern meadowlark (Sturnella magna) was associated with width. Henningsen (2003) found nest success of only 1 species, the red-winged blackbird, was positively associated with width of the fi lter strip. Perhaps these results refl ect the fact that the strips studied in these cases ranged only between 8 and 40 m (26–131 feet), making it diffi cult to detect an eff ect on vagile species like birds.
Studies conducted in wider strips and with less vagile species than birds provide more consistent support for the positive eff ects of width. Knoot (2004) also reported that presence of plains garter (Th amnophis radix), eastern garter, and brown (Storeria dekayi) snakes was positively correlated with width of grassed waterways. Reeder (2004) found that the diversity

102 Continuous Enrollment CRP: Factors Infl uencing the Value of Agricultural Buff ers for Wildlife • Clark and Reeder
of butterfl ies, and also the abundance of certain larger or habitat-sensitive butterfl ies was positively correlated with widths ranging between 18 and 167 m (59–548 feet) in Minnesota buff ers. Semlitsch and Brodie (2003) integrated biological criteria of both amphibians and reptiles when they considered guidelines for buff ers around wetlands and riparian habitats.
DisturbanceA large part of the value of CCRP and other set-aside programs is that the habitat created is undisturbed relative to the surrounding agricultural lands. Although vegetation management is required periodically for maintenance of healthy plantings, substantial or frequent disturbance often negatively aff ects wildlife communities. Diff erent CCRP practices have diff erent management scenarios; fi lter strips are supposed to be mowed or sprayed for noxious weed control as needed, whereas grassed waterways are supposed to be mowed yearly to facilitate water fl ow. Grassed waterways embedded in crop fi elds are routinely driven across with tractors. For example, farm equipment caused 9% of nest failures in grassed waterways in Iowa (Knoot 2004), and Kammin (2003) reported that 3.6% of nest failures in fi lter strips in Illinois were caused by human disturbance. But the anthropogenically caused nest failure rates above are small in comparison to the 80% and 88% of failures caused by predation in those studies, respectively (Kammin 2003, Knoot 2004).
Th e change in vegetation structure after mowing or burning is refl ected in the wildlife community. Mowing or burning that is done before the nesting cycle of birds has been completed caused nest failure and adult mortality (Bryan and Best 1991, Delisle and Savidge 1997, Johnson 2000, Horn and Koford 2000, Murray 2002). Mowing and burning can also impact less mobile species or immature, sedentary life stages of species such as fl ying insects (Swengel 1996). However, these negative eff ects are usually short-lived (Panzer 2002, Benson 2003). Th e habitat improvement gained through prudent use of mowing and burning confers long-term benefi ts to most species (Panzer 2002).
Th e CCRP does not generally allow grazing except under certain situations such as drought, although there has been discussion of liberalizing the regulations. Th e eff ect of grazing on wildlife has received considerable attention in the literature, refl ecting primarily negative eff ects among ground-nesting birds, especially waterfowl (Kirsch 1969, Hertel and Barker 1987, Kruse and Bowen 1996). Th is is particularly true when grazing is focused on small patches, as opposed to extensive rangelands. In buff er habitats the results are highly variable and some studies suggest that intermediate disturbance may be benefi cial. For example, Walk and Warner (2000) found that light grazing favored

Fish and Wildlife Benefi ts of Farm Bill Programs: 2000–2005 Update 103
abundances of 5 grassland bird species. Chapman and Ribic (2002) compared the small mammal community in buff er strips to that found in intensively managed rotationally grazed plots and continuously grazed plots. Th ey found 6–7 times more species and 3–5 times more individual small mammals in the buff er sites than in the pastures, and speculated that this was likely due to the fact that the buff er sites receive relatively little disturbance from haying, grazing, or herbicide application.
Linear Habitats as Movement CorridorsTh e potential for linear landscape features to connect otherwise isolated habitat fragments is often cited as a possible conservation strategy (Bunce and Hallam 1993, Rosenberg et al. 1997, Beier and Noss 1998, Haddad et al. 2000, Tewksbury et al. 2002). If CCRP projects served this function, they could mitigate some of the negative consequences of habitat fragmentation by increasing the eff ective population sizes of plants and wildlife occupying isolated fragments of grassland.
Experimental evidence confi rming the benefi ts of corridors like those of a typical CCRP project is lacking, although some studies provide guidance with regard to important issues like width, structure, and landscape context (Rosenberg et al. 1997, Haddad et al. 2000). Corridors can potentially serve 3 benefi cial roles: they can simply provide additional habitat; they can connect otherwise isolated habitat patches; and they can act as drift fences, intercepting animals moving across the landscape and directing them into the patches that they connect (Rosenberg et al. 1997). Corridors may have population and ecosystem function eff ects because they enhance movement of organisms in the landscape (Tewksbury et al. 2002). Although it is tempting to view CCRP as wildlife corridors, buff ers do not necessarily connect larger patches of habitat, and there is very little information on whether CCRP plantings increase movement of organisms between patches.
Edge EffectsAnother important factor related to CCRP practices is that they are essentially all edge habitats, so that the potential for edge eff ects must be considered. Edges have both positive and negative eff ects on wildlife depending on the species (Lidicker and Koenig 1996). With regard to more vagile species like birds, the small extent of CCRP projects makes it likely that area is probably more relevant than edge eff ect per se. Nonetheless, bird ecologists have frequently studied edge eff ects in buff ers, particularly in forested systems, but also to determine eff ects on grassland songbirds. Fletcher and Koford (2003) reported that bobolink (Dolichonyx oryzivorusFletcher and Koford (2003) reported that bobolink (Dolichonyx oryzivorusFletcher and Koford (2003) reported that bobolink ( ; a declining, area-sensitive grassland songbird) territory densities in grassland

104 Continuous Enrollment CRP: Factors Infl uencing the Value of Agricultural Buff ers for Wildlife • Clark and Reeder
habitat were lower near edges of all types (forest, road, and agriculture). Winter et al. (2000) studied the eff ect of forested, shrubby, road, and agricultural fi eld edges on artifi cial nests, and on real nests of dickcissels and Henslow’s sparrows. Th e forested edges were associated with the most pronounced eff ects on artifi cial nests, artifi cial nest survival was depressed within 30 m (98 feet) of woodland edges, and real nests suff ered greater predation within 50 m (164 feet) of shrubby edges.
Th e eff ects of proximity to multiple edges are particularly relevant to CCRP because they are specifi cally designed as buff ers along edges of other vegetation types and they are often in a dendritic pattern. Henningsen (2003) noted that some birds, including common yellowthroats and song sparrows, showed an aversion to placing nests near both the wooded edges and the crop fi eld edges. Fletcher (2003) showed that nesting grassland passerines avoided corners of fi elds where there were 2 edges until they were at least 100 m from either edge. Edge avoidance and nesting success data for game birds including ducks and pheasants have come primarily from studies conducted in large blocks of cover. It is diffi cult to generalize from the literature because an edge eff ect on nest success has been found in some studies (Horn et al., in press) but not in others (Pasitschniak-Arts et al. 1998). It is also hard to establish that there is edge-averse nest-placement behavior that is related to avoidance of predation because relatively few studies quantify use of edges by nest predators. Kuehl and Clark (2002) showed that raccoon (Procyon lotor), skunk, and red fox preferred vegetation edges near large blocks lotor), skunk, and red fox preferred vegetation edges near large blocks lotorof grassland cover and that these predators more frequently entered patches at corners than along sides. Edges along streams and wetlands are particularly preferred by these generalist predators (Phillips et al. 2003).
CCRP buff ers are described by wildlife ecologists as “hard” edges, in contrast to more natural edges that are gradual or “feathered” to which wildlife species are better adapted (Ratti and Reese 1988). Studies of butterfl ies illustrate how many animals respond to these hard edges. Ries and Debinski (2001) found that 2 species of butterfl ies, a habitat specialist (Speyeria idalia) and a habitat generalist (Danaus plexippus) both avoided or turned back from tree-line boundaries of prairie patches. Th e specialist butterfl y exhibited the same behavior with regard to edges with roads and crop fi elds. Such behavior might serve to hold butterfl ies in CCRP plantings once they have entered them, when a particular project provides diverse, quality habitat for butterfl ies.
Landscape ContextLandscape context infl uences local distribution patterns, and, on a larger scale, the long-term population dynamics of wildlife. Landscape variables,
Agricultural fi eld borders, a CCRP practice. NRCS, Lynn Betts

Fish and Wildlife Benefi ts of Farm Bill Programs: 2000–2005 Update 105
such as the amount of cover in the landscape or the proximity of a habitat patch to other landscape features, aff ect avian abundance and reproductive success (Clark et al. 1999, Bergin et al. 2000, Ribic and Sample 2001), carabid beetle assemblages (Jeanneret et al. 2003), butterfl y diversity and abundance (Jeanneret et al. 2003, Luoto et al. 2001), and anuran abundance and richness (Knutson et al. 1999, Pope et al. 2000). Knoot (2004) observed that the characteristics of the surrounding landscape explained variation in occurrence of 6 of 8 bird species and 3 out of 5 snake species studied in grassed waterways in Iowa. In the case of aquatic species, the cumulative eff ects of watershed-level conservation eff orts and disturbance patterns often have more infl uence on habitat suitability than amount of buff ers in the immediate area (Willson and Dorcas 2003).
Th ese eff ects can be visualized easily when the perspective is at a township extent rather than the level of an individual buff er project. Understanding the value of buff ers created by CCRP depends importantly on distinguishing the eff ects on local distribution (i.e., much of the wildlife count data cited above) from the infl uence that buff ers might have on long-term, large-scale changes in population dynamics. Observing large numbers of individuals in buff ers may be misleading because such observations reveal little about the reproduction and survival in these strip covers (Pulliam and Danielson 1991). Given the eff ects of small patch size, linear shape, and large edge ratio, buff ers often could be ecological traps (Gates and Gysel 1978, Anderson and Danielson 1997).
Th ere is evidence that sometimes success of ground-nesting birds is actually as high in small, isolated strips of habitat as it is in large blocks (Clark et al. 1999, Horn et al. in press). In fact, Horn et al. (in press) observed that nest success of waterfowl was lowest in intermediate-sized patches of CRP. Evidence from studies of pheasants suggests that success is especially low where intermediate-sized patches are clustered so that there is a relatively large amount of edge per unit of landscape area (Clark et al. 1999). Th e mechanism infl uencing these patterns is that generalist predators like skunks, raccoons, and foxes spend a disproportionately large part of their activity in intermediate-sized patches and along edges (Kuehl and Clark 2002, Phillips et al. 2003, Phillips et al. 2004).
To a very large degree the landscape composition, that is the amount of perennial habitat in the landscape, has a much larger eff ect on the persistence of populations than the confi guration and fragmentation of that habitats (Fahrig 1997). Nonetheless Clark et al. (2001) demonstrated that predicted response of pheasant abundance in typical Iowa townships could diff er between conditions where CRP was allocated in general

106 Continuous Enrollment CRP: Factors Infl uencing the Value of Agricultural Buff ers for Wildlife • Clark and Reeder
enrollment of fi elds in blocks versus buff ers (Figure 1). Th ey estimated that if 10–15% of the landscape was confi gured in grassland conservation buff ers, pheasant populations would be predicted to be only about one-third of the density predicted when the same area of grassland is confi gured in blocks. Under either scenario, pheasant abundance would be expected to increase most rapidly over the range of 10–20% increase in perennial grassland and would not be expected to reach peak abundance until nearly 50% of the landscape was in perennial grassland.
Conclusions and Directions for Future ResearchIn the Midwest and Great Plains, the major benefi t of buff ers, like that of CCRP and other farm conservation programs, is that they replace annual row crops with perennial wildlife habitat. Most of the major limitations of buff ers are related to the small area of individual projects and the associated edge and width eff ects. Many of the assessments of wildlife using buff ers are based only on counts of animals, and information on the functional eff ects of these buff ers on reproduction and survival is lacking for a broad array of taxa. Further study is needed on the arrangement of buff ers and their potential to act as drift fences and migratory corridors. It would be particularly useful to better understand the landscape-level infl uence of buff ers on wildlife population dynamics. Modeling outcomes
Figure. 1. A township in Poweshiek County, Iowa, with hypothetical CCRP projects, assuming that 25% of all landowners participated and were able to enroll all eligible areas into 100-foot riparian fi lter strips planted to grasses. William Clark

Fish and Wildlife Benefi ts of Farm Bill Programs: 2000–2005 Update 107
under an array of landscape confi guration scenarios could help managers to understand the tradeoff s between an allocation of CRP into blocks or into buff ers, or to suggest goals for establishing buff ers that could be translated into farm policy. Long-term research on a large (multi-state) level is necessary to provide an assessment of how CCRP is aff ecting regional wildlife populations. Furthermore, a comparative approach across watersheds would identify what factors drive large-scale patterns of wildlife use of CCRP.
Literature CitedAnderson, G. S., and B. J. Danielson. 1997. Th e eff ects of landscape
composition and physiognomy on metapopulation size: the role of corridors. Landscape Ecology 12:261–271.
Beier, P., and R. F. Noss. 1998. Do habitat corridors provide connectivity? Conservation Biology 12:1241–1252.
Benson, T. J. 2003. Breeding bird, plant, and arthropod responses to restoration and management of riparian conservation easements in the Iowa River Corridor, east-central Iowa. M.S. Th esis, Iowa State University, Ames, USA.
Bergin, T. M., L. B. Best, K. E. Freemark, and K. J. Koehler. 2000. Eff ects of landscape structure on nest predation in roadsides of a midwestern agroecosystem: a multiscale analysis. Landscape Ecology 15:141–143.
Best, L. B. 2000. Continuous Enrollment Conservation Reserve Program: the value of buff er habitats for birds in agricultural landscapes. Pages 75–94 in W. L. Hohman and D. J. Halloum, editors. A comprehensive review of Farm Bill contributions to wildlife conservation, 1985–2000. U.S. Department of Agriculture, Natural Resources Conservation Service, Wildlife Habitat Management Institute, Technical Report USDA/NRCS/WHMI-2000.
———, H. Campa, III, K. E. Kemp, R. J. Robel, M. R. Ryan, J. A. Savidge, H. P. Weeks, and S. R. Winterstein. 1997. Bird abundance and nesting in CRP fi elds and cropland in the Midwest: a regional approach. Wildlife Society Bulletin 25:864–877.
Birney, E. C., W. E. Grant, and D. D. Baird. 1976. Importance of vegetative cover to cycles of Microtus populations. Ecology 57:1043–1051.
Bryan, G. G., and L. B. Best. 1991. Bird abundance and species richness in grassed waterways in Iowa rowcrop fi elds. American Midland Naturalist 126:90–102.
Bunce, R. G. H., and C. J. Hallam. 1993. Th e ecological signifi cance of linear features in agricultural landscapes in Britain. Pages 11–19 in R. G.

108 Continuous Enrollment CRP: Factors Infl uencing the Value of Agricultural Buff ers for Wildlife • Clark and Reeder
H. Bunce, L. Ryszkowski, and M. G. Paoletti, editors. Landscape ecology and agroecosystems. Lewis Publishers, Boca Raton, Florida, USA.
Chapman, E. W., and C. A. Ribic. 2002. Th e impact of buff er strips and stream-side grazing on small mammals in southwestern Wisconsin. Agriculture, Ecosystems and Environment 88:49–59.
Clark, W. R., B. L. Falk, R. A. Schmitz, and B. A. Babcock. 2001. Projecting the wildlife and economic impacts of United States agricultural policy using landscape-level analyses. Pages 139–143 in R. Field, R. J. Warren, H. Okarma, and P. R. Sievert, editors. Wildlife, land and people: priorities for the 21st century. Proceedings of the Second International Wildlife Management Congress. Th e Wildlife Society, Bethesda, Maryland, USA.
———, R. A. Schmitz, and T. R. Bogenshutz. 1999. Site selection and nest success of ring-necked pheasants as a function of location in Iowa landscapes. Journal of Wildlife Management 63:976–989.
———, and R. E. Young. 1986. Crop damage by small mammals in no-till cornfi elds. Journal of Soil and Water Conservation 41:338–341.
Cole, F. R., and G. O. Batzli. 1979. Nutrition and population dynamics of the prairie vole Microtus ochrogaster. Journal of Animal Ecology 48:455–470.
[CCC & NRCS] Commodity Credit Corporation and Natural Resources Conservation Service. 2004. Conservation Security Program: interim fi nal rule and notice. Federal Register 69 (21 Jun 2004):34501–34532.
Delisle, J. M., and J. A. Savidge. 1997. Avian use and vegetation characteristics of Conservation Reserve Program fi elds. Journal of Wildlife Management 61:318–325.
Donovan, T. M., P. W. Jones, E. M. Annand, and F. R. Th ompson, III. 1997. Variation in local-scale edge eff ects: mechanisms and landscape context. Ecology 78:2064–2075.
Fahrig, L. 1997. Relative eff ects of habitat loss and fragmentation on population extinction. Journal of Wildlife Management 61:603–610.
[FSA] Farm Service Agency. 2003. Fact sheet: Continuous Reserve Program—continuous signup for high priority conservation practices. U.S. Department of Agriculture, Farm Service Agency, Washington D.C., USA.
———. 2004. Conservation Reserve Program monthly summary—December 2004. U.S. Department of Agriculture, Farm Service Agency, Washington D.C., USA.
Fletcher, R. J., Jr. 2003. Spatial and temporal scales of distribution

Fish and Wildlife Benefi ts of Farm Bill Programs: 2000–2005 Update 109
and demography in breeding songbirds: implications of habitat fragmentation and restoration. Ph.D. Dissertation, Iowa State University, Ames, USA.
———, and R. R. Koford. 2003. Spatial responses of bobolinks (Dolichonyx oryzivorus) near diff erent types of edges in northern Iowa. Auk 120:799–810.
Gaines, M. S., G. R. Robinson, J. E. Diff endorfer, R. D. Holt, and M. L. Johnson. 1992. Th e eff ects of habitat fragmentation on small mammal populations. Pages 875–885 in D. R. McCullough and R. H. Barrett, editors. Wildlife 2001: populations. Elsevier Science Publishers, London, United Kingdom.
Gates, J. E., and L. W. Gysel. 1978. Avian nest dispersion and fl edging success in fi eld–forest ecotones. Ecology 59:871–883.
Getz, L. L. 1961. Factors infl uencing the local distribution of Microtus and Synaptomys in southern Michigan. Ecology 42:110–119.
Grant, W. E., N. R. French, and D. M. Swift. 1977. Response of a small mammal community to water and nitrogen treatments in a shortgrass prairie ecosystem. Journal of Mammalogy 58:637–652.
Greenwood, R. J., A. B. Sargeant, J. L. Piehl, D. A. Buhl, and B. A. Hanson. 1999. Foods and foraging of prairie striped skunks during the avian nesting season. Wildlife Society Bulletin 27:823–832.
Haddad, N. M., D. K. Rosenberg, and B. R. Noon. 2000. On experimentation and the study of corridors. Conservation Biology 14:1543–1545.
Henningsen, J. C. 2003. Grassland bird use of riparian fi lter strips in Southeast Iowa. M.S. Th esis, Iowa State University, Ames, USA.
Herkert, J. R. 1994. Th e eff ects of habitat fragmentation on midwestern grassland bird communities. Ecological Applications 4:461–471.
Hertel, D., and W. T. Barker. 1987. Th e infl uence of grazing systems on waterfowl production. Proceedings of the North Dakota Academy of Science 41:6.
Horn, D. J., and R. R. Koford. 2000. Relation of grassland bird abundance to mowing of Conservation Reserve Program fi elds in North Dakota. Wildlife Society Bulletin 28:653–659.
———, M. L. Phillips, R. R. Koford, W. R. Clark, M. A. Sovada, and R. J. Greenwood. 2005. Landscape composition, patch size, and distance to edges: Interactions aff ecting nest success. Ecological Applications (in press).

110 Continuous Enrollment CRP: Factors Infl uencing the Value of Agricultural Buff ers for Wildlife • Clark and Reeder
Jeanneret, P., B. Schüpbach, and H. Luka. 2003. Quantifying the impact of landscape and habitat features on biodiversity in cultivated landscapes. Agriculture, Ecosystems and Environment 98:311–320.
Johnson, D. H. 2000. Conservation Reserve Program: grassland bird use of Conservation Reserve Program fi elds in the Great Plains. Pages 19–33 in W. L. Hohman and D. J. Halloum, editors. A comprehensive review of Farm Bill contributions to wildlife conservation, 1985–2000. U.S. Department of Agriculture, Natural Resources Conservation Service, Wildlife Habitat Management Institute, Technical Report USDA/NRCS/WHMI-2000.
———, and L. D. Igl. 2001. Area requirements of grassland birds: a regional perspective. Auk 118:24–34.
———, and M. D. Schwartz. 1993. Th e Conservation Reserve Program and grassland birds. Conservation Biology 7:934–937.
Johnson, R. G., and S. A. Temple. 1990. Nest predation and brood parasitism of tallgrass prairie birds. Journal of Wildlife Management 54:106–111.
Kammin, L. 2003. Conservation buff er fi lter strips as habitat for grassland birds in Illinois. M.S. Th esis, University of Illinois, Urbana-Champaign, USA.
Kemp, J. C., and G. W. Barrett. 1989. Spatial patterning: impact of uncultivated corridors on arthropod populations within soybean agroecosystems. Ecology 70:114–127.
Kirsch, L. M. 1969. Waterfowl production in relation to grazing. Journal of Wildlife Management 33:821–828.
Knoot, T. G. 2004. Th e infl uence of local and landscape factors on wildlife use of grassed waterways in Southeast Iowa. M.S. Th esis, Iowa State University, Ames, USA.
Knutson, M. G., J. R. Sauer, D. A. Olsen, M. J. Mossman, L. M. Hemesath, and M. J. Lannoo. 1999. Eff ects of landscape composition and wetland fragmentation on frog and toad abundance and species richness in Iowa and Wisconsin, U.S.A. Conservation Biology 13:1437–1446.
Kruse, A. D., and B. S. Bowen. 1996. Eff ects of grazing and burning on densities and habitats of breeding ducks in North Dakota. Journal of Wildlife Management 60:233–246.
Kuehl, A. K., and W. R. Clark. 2002. Predator activity related to landscape features in northern Iowa. Journal of Wildlife Management 66:1224–1234.
Lidicker, W. Z., Jr., and W. D. Koenig. 1996. Responses of small mammals to habitat edges. Pages 85–109 in D. R. McCullough, editor. Metapopulations and wildlife conservation. Island Press, Washington, D.C., USA.
Fish and Wildlife Benefi ts of Farm Bill Programs: 2000–2005 Update 111
Luoto, M., M. Kuussaari, H. Rita, J. Salminen, and T. von Bonsdorff . 2001. Determinants of distribution and abundance in the clouded apollo butterfl y: a landscape ecological approach. Ecography 24:601–617.
McIntyre, N. E., and T. R. Th ompson. 2003. A comparison of Conservation Reserve Program habitat plantings with respect to arthropod prey for grassland birds. American Midland Naturalist 150:291–301.
Murray, L. D. 2002. Avian response to harvesting switchgrass for biomass in southern Iowa. M.S. Th esis, Iowa State University, Ames, USA.
[NRCS] Natural Resources Conservation Service. 2003. National handbook of conservation practices: Conservation practice standard, fi lter strip. Natural Resources Conservation Service, Code 393, Washington, D.C., USA.
———. 2004. Buff er strips: Common sense conservation. <http://www.nrcs.usda.gov/feature/buff ers/#Anchor-NationalTeam>. Accessed 2004 Dec 29.
Nelson, D. R., R. O. Kimmel, and M. J. Frydendall. 1990. Ring-necked pheasants and gray partridge brood habitat in roadsides and managed grasslands. Perdix V:103–112.
Panzer, R. 2002. Compatibility of prescribed burning with the conservation of insects in small, isolated prairie reserves. Conservation Biology 16:1296–1307.
Pasitschniak-Arts, M., and F. Messier. 1996. Predation on artifi cial duck nests in a fragmented prairie landscape. Ecoscience 3:436–441.
———, and ———. 1998. Duck nesting success in a fragmented prairie landscape: Is edge eff ect important? Biological Conservation 85:55–62.
Patterson, M. P., and L. B. Best. 1996. Bird abundance and productivity in Iowa CRP fi elds: the importance of vegetation structure and composition. American Midland Naturalist 135:153–167.
Phillips, M. L., W. R. Clark, S. M. Nusser, M. A. Sovada, and R. J. Greenwood. 2004. Analysis of predator movement in prairie landscapes with contrasting grassland composition. Journal of Mammalogy 85:187–195.
———, ———, M. A. Sovada, D. J. Horn, R. R. Koford, and R. J. Greenwood. 2003. Predator selection of prairie landscape features and its relation to duck nest success. Journal of Wildlife Management 67:104–114.
112 Continuous Enrollment CRP: Factors Infl uencing the Value of Agricultural Buff ers for Wildlife • Clark and Reeder
Pope, S. E., L. Fahrig, and H. G. Merriam. 2000. Landscape complementation and metapopulation eff ects on leopard frog populations. Ecology 81:2498–2508.
Potts, G. R. 1986. Th e partridge: pesticides, predation and conservation. Collins, London, United Kingdom.
Price, P. W. 1976. Colonization of crops by arthropods: nonequilibrium communities in soybean fi elds. Environmental Entomology 5:605–611.
Pulliam, H. R., and B. J. Danielson. 1991. Sources, sinks, and habitat selection: a landscape perspective on population dynamics. American Naturalist 137:S50–S66.
Ratti, J. T., and K. P. Reese. 1988. Preliminary test of the ecological trap hypothesis. Journal of Wildlife Management 52:484–491.
Reeder, K. F. 2004. Factors aff ecting butterfl y use of fi lter strips in Southwest Minnesota. M.S. Th esis, Iowa State University, Ames, USA.
Reynolds, R. E. 2000. Conservation Reserve Program: waterfowl responses to the Conservation Reserve Program in the Northern Great Plains. Pages 35–43 in W. L. Hohman and D. J. Halloum, editors. A comprehensive review of Farm Bill contributions to wildlife conservation, 1985–2000. U.S. Department of Agriculture, Natural Resources Conservation Service, Wildlife Habitat Management Institute, Technical Report USDA/NRCS/WHMI-2000.
Ribic, C. A., and D. W. Sample. 2001. Associations of grassland birds with landscape factors in southern Wisconsin. American Midland Naturalist 146:105–121.
Ries, L., and D. M. Debinski. 2001. Butterfl y responses to habitat edges in the highly fragmented prairies of central Iowa. Journal of Animal Ecology 70:840–852.
Rosenberg, D. K., B. R. Noon, and E. C. Meslow. 1997. Biological corridors: form, function, and effi cacy. BioScience 47:677–688.
Ryan, M. R. 2000. Conservation Reserve Program: impact of the Conservation Reserve Program on wildlife conservation in the Midwest. Pages 45–54 in W. L. Hohman and D. J. Halloum, editors. A comprehensive review of Farm Bill contributions to wildlife conservation, 1985–2000. U.S. Department of Agriculture, Natural Resources Conservation Service, Wildlife Habitat Management Institute, Technical Report USDA/NRCS/WHMI-2000.
Semlitsch, R. D., and J. R. Bodie. 2003. Biological criteria for buff er zones around wetlands and riparian habitats for amphibians and reptiles. Conservation Biology 17:1219–1228.

Fish and Wildlife Benefi ts of Farm Bill Programs: 2000–2005 Update 113
Snyder, E. J., and L. B. Best. 1988. Dynamics of habitat use by small mammals in prairie communities. American Midland Naturalist 119:128–136.
Swengel, A. B. 1996. Eff ects of fi re and hay management on abundance of prairie butterfl ies. Biological Conservation 76:73–85.
Tewksbury, J. J., D. J. Levey, N. M. Haddad, S. Sargent, J. L. Orrock, A. Weldon, B. J. Danielson, J. Brinkerhoff , E. I. Damschen, and P. Townsend. 2002. Corridors aff ect plants, animals, and their interactions in fragmented landscapes. Proceedings of the National Academy of Sciences USA 99:12923–12926.
Vickery, P. D., M. L. Hunter, and S. M. Melvin. 1994. Eff ects of habitat-area on the distribution of grassland birds in Maine. Conservation Biology 8:1087–1097.
Walk, J. W., and R. E. Warner. 1999. Eff ects of habitat area on the occurrence of grassland birds in Illinois. American Midland Naturalist 141:339–344.
———, and ———. 2000. Grassland management for the conservation of songbirds in the midwestern USA. Biological Conservation 94:165–172.
Weiser, L. A., J. J. Obrycki, and K. L. Giles. 2003. Within-fi eld manipulation of potato leafhopper (Homoptera: Cicadellidae) and insect predator populations using an uncut alfalfa strip. Journal of Economic Entomology 96:1184–1192.
Whitmore, R. 1982. Insect biomass in agronomic crops as food for ring-necked pheasant chicks (Phasianus colchicus). Dissertation, University of Nebraska, Lincoln, USA.
Wiewel, A. S. 2003. Assessing small mammal abundance and diversity in North Dakota grasslands. M.S. Th esis, Iowa State University, Ames, USA.
Willson, J. D., and M. E. Dorcas. 2003. Eff ects of habitat disturbance on stream salamanders: implications for buff er zones and watershed management. Conservation Biology 17:763–771.
Winter, M., and J. Faaborg. 1999. Patterns of area sensitivity in grassland-nesting birds. Conservation Biology 13:1424–1436.
———, D. H. Johnson, and J. Faaborg. 2000. Evidence for edge eff ects on multiple levels in tallgrass prairie. Condor 102:256–266.
Woodward, A. E., P. Vohra, and R. L. Snyder. 1977. Eff ects of protein levels in the diet on the growth of pheasants. Poultry Science 56:1492–1500.

Fish and Wildlife Benefi ts of Farm Bill Programs: 2000–2005 Update 115
Th e Conservation Reserve Enhancement Program Arthur W. AllenU.S. Geological SurveyBiological Resources DivisionFort Collins Science Center2150 Centre Avenue, Building CFort Collins, CO 80526, [email protected]
AbstractTh e Conservation Reserve Enhancement Program (CREP) refl ects advancement in U.S. Department of Agriculture agricultural policy by addressing agriculturally related conservation on a multi-farm, landscape scale and establishing funding support and partnerships with state and non-governmental organizations. Underway in 25 states, with more being planned, the CREP addresses environmental issues on the farmed landscape with implications for environmental quality potentially reaching thousands of miles away from where program conservation practices are established. Most CREPs have been initiated only within the last 4 years. Monitoring programs to evaluate CREP performance have been established, but because of time needed to establish vegetative covers, growing participation in the programs over time, and the complexities of landscape-level analysis, quantifi able results are limited. Environmental data related to CREP eff ects on water quality and wildlife habitats are being collected for future assessments and refi nement of the program. By addressing state-identifi ed priorities, landowner needs, and social issues, the CREP off ers substantial promise to fully integrate economically viable agricultural production and eff ective conservation.
IntroductionTh e Conservation Reserve Enhancement Program (CREP) is a refi nement of the Conservation Reserve Program (CRP) intended to address environmental issues on landscape scales. Th e CREP encourages eligible producers to adopt specifi c conservation practices through shared fi nancial responsibilities and partnerships established among the U.S. Department of Agriculture (USDA), tribal, state, municipal governments, and private non-governmental organizations. Th e primary goals are improvements of drinking and surface water quality as well as wildlife habitats, but the CREP focus diff ers based largely on state-identifi ed

116 Th e Conservation Reserve Enhancement Program • Allen
priorities. Administered by the Farm Service Agency (FSA), the CREP refl ects a vitally needed approach to conservation with a deliberate evolution toward addressing environmental issues on a multi-farm, landscape scale. Table 1. Summary of Conservation Reserve Enhancement Program enrollment by state as of December 2004. Adapted from data provided at <http://www.fsa.usda.gov/dafp/cepd/crpinfo.htm>.
State Year initiateda
Number of contracts
Number of farms Acres
Annual rental
(× $1,000)
Paymentsb
($/acre)
Arkansas 2001 223 142 6,447 647 100.41California 2001 43 40 4,051 497 122.75Delaware 1999 428 248 4,934 576 116.76Floridac 2002Illinois 1998 5,403 3,955 109,764 17,508 159.51Iowa 2001 17 13 314 67 213.72Kentucky 2001 343 201 7,818 933 119.39Maryland 1997 4,986 3,005 69,035 9,103 131.87Michigan 2000 4,096 2,177 47,897 5,878 122.71Minnesota 1998 2,618 2,107 83,649 9,314 111.35Missouri 2000 249 188 13,564 1,173 86.50Montana 2002 92 33 7,962 751 94.31Nebraska 2004 1,914 1,374 20,223 1,945 96.18
New York1998, 2004, 2004
265 207 3,489 505 144.86
North Carolina 1999 1,871 1,187 26,538 2,861 107.81North Dakota 2001 75 56 1,500 53 35.53
Ohio2000, 2002, 2004
4,233 2,901 21,777 3,316 152.28
Oregon 1998 556 402 14,663 1,330 90.71
Pennsylvania 2000, 2004 6,164 3,809 118,240 11,946 101.04
Vermont 2001 101 81 1,072 96 89.14Virginia 2000 2,376 1,908 20,159 1,575 78.12Washington 1998 567 451 9,408 1,545 164.24West Virginia 2002 126 103 1,519 115 75.44Wisconsin 2001 3,013 1,980 32,292 3,656 113.22National 39,759 26,568 626,315 75,393 120.37
a Multiple years of initiation represent individual CREPs started within the state.b Payments scheduled to be made October 2005. Payments include annual incentives and maintenance allowance payments, but do not include one-time signing incentive payments, practice incentive payments, or payment reductions, such as for lands enrolled for less than 1 year and payment reductions as a consequence of lands hayed or grazed under emergency conditions.
c CREP enrollment has not been initiated at the time of this writing.

Fish and Wildlife Benefi ts of Farm Bill Programs: 2000–2005 Update 117
As of January 2005, the CREP is underway in 25 states with commitment to sign up 1.7 million acres in the program (USDA 2004). A summary of current CREP enrollment is furnished in Table 1. Appendix 1 provides a state-by-state summary of CREP funding, geographic applicability, and objectives. Expansions and establishment of CREPs in additional states are in progress.
CREP Offers a Landscape Approach to Conservation Trying to solve large-scale environmental problems one fi eld or farm at a time without consideration of adjacent land use off ers limited ability for fi nding long-term solutions. Resolution of ecological problems associated with agriculture will be found only when addressed across larger and contiguous landscapes (Rabalais et al. 2002, Pimentel et al. 2004). Similarly, multiple initiatives and programs individually focused on solving specifi c environmental problems (e.g., erosion vs. wildlife habitat) will have limited success in maintaining public, political, and fi nancial support over the long term (Kleiman et al. 2000, Keeney and Kemp 2003).
Th e CREP is designed to simultaneously address multiple resource issues by involving various government agencies, private groups, and landowners across an assortment of legal and physical dimensions. Th e program represents a deliberate eff ort on the part of the USDA to address various environmental issues by establishing conservation practices best believed to meet environmental problems stemming from agricultural production on individual, as well as multi-farm and ownership scales. Although the amount of habitat physically created by establishment of conservation practices can be comparatively small when viewed from the prospect of the entire landscape, benefi ts to wildlife can be substantial (Nusser et al. 2004).
Enrollment CriteriaTh e CRP has operated under 2 approaches to enrollment. Participation in the General Signup CRP is determined during periodic signup periods using the Environmental Benefi ts Index (EBI). Scores from the EBI refl ect a balance of environmental and economic priorities used to determine the potential benefi ts of each parcel of land off ered for enrollment (Feather et al. 1999). Signup periods are typically held no more than once a year and are of limited duration. Under the Continuous CRP, participants enroll environmentally desirable land to establish high-priority conservation practices (e.g., riparian buff ers, wetland restorations) and may off er land for inclusion in the program at any time. If the land and producer meet certain eligibility criteria, typically the land is accepted into the program. As with continuous enrollment, CREP participation is accepted on an uninterrupted basis with eligible participants able to enroll land satisfying
Grassed waterways carry runoff from crop fi elds, preventing erosion. (L. Betts, USDA-NRCS)

118 Th e Conservation Reserve Enhancement Program • Allen
their state’s CREP criteria. Smith (2000) described land enrolled in CREPs prior to 2000 as being smaller than lands enrolled through the General CRP signup. Th e average CREP contract size was slightly greater than those in the Continuous CRP but smaller than those in the General CRP. Contracts established under the CREP are on average of longer duration than the usual 10-year CRP contract, with 15 years often desired by participating states. States also may acquire additional agreements with landowners to assure the CRP cover remains in place long after the CREP agreement expires. Lands enrolled in CREP generally are of higher economic value than those enrolled in the General CRP, justifying higher rental rates. Within each state, CREP enrollment usually is limited to 100,000 acres.
Funding Th e Commodity Credit Corporation provides funding for the CREP with partnerships established through state, tribal, local government, and non-government organizations. Non-governmental contributions to CREPs may be substantial. Ducks Unlimited and the Chesapeake Bay Foundation, for example, furnished 40% of non-federal contributions to the Maryland CREP (C. Chadwell, USDA, Conservation and Environmental Programs Division, personal communication). Owners of land enrolled in the CREP receive annual rental payments and usually are off ered additional monetary incentives for establishing approved conservation practices. Cost-share for establishing conservation practices and technical support are also furnished.
Special Incentives for Enrollment Solutions to natural resource issues often rely on human motivations and responses. Some farm operators hesitate to make long-term commitments to conservation programs because of concerns about lost income, uncertainty about market changes, and unease about future environmental regulations (Lant et al. 1995). Based on analysis of prospective participants in the Oregon CREP, Kingsbury and Boggess (1999) suggested some concerns could be diminished by clearly defi ning how regulations may aff ect use of enrolled lands at the end of the contract period. Raising or adjusting rental rates to account for infl ation and property taxes, increasing fl exibility in contract periods and terms, and making enrollment procedures simpler have all been identifi ed as options to decrease producer hesitation about participating in conservation programs (Lant et al. 1995).
Adoption of conservation policies and practices by producers can be expected as long as their agricultural enterprise remains profi table (Santelmann et al. 2004) and program requirements do not confl ict with effi cient management of their operations (Lamont 2005). Th e CREP has been successful in addressing economic issues by minimizing or eliminating costs to participants. In addition to annual rental payments

Fish and Wildlife Benefi ts of Farm Bill Programs: 2000–2005 Update 119
and cost-sharing for establishing conservation covers or practices, supplementary fi nancial incentives are off ered for CREP enrollments. One time, up-front signing incentive payments (SIP) and practice incentive payments (PIP) are often used to encourage adoption of high-priority conservation practices and increase enrollment. Th e availability of SIP and PIP incentives substantially increased participation in the New York City Watershed CREP (Lamont 2005). Incentive payment rates vary between CREPs and may be complemented by additional incentives furnished by states and non-governmental organizations.
Economic incentives may be uniquely focused on regional priorities. For example, the CoverLock aspect of the North Dakota CREP off ers additional funds for 20-year easements to establish a combination of tree, shrub, and grass cover for long-term wildlife habitat. Th e Oregon CREP, which targets establishment of buff ers along designated stream reaches, had an inventive approach to increasing enrollment by off ering a substantial one-time payment if more than 50% of landowners along a 5-mile stream reach were enrolled within a specifi c time period.
Evaluation of CREP PerformanceOf 30 active CREPs, 27% were established prior to 2000. Th e Maryland CREP is the oldest, having been started in 1997. Th ere has not been suffi cient time to quantify long-term benefi ts of these programs as to how they aff ect environmental conditions. Monitoring and evaluation of CREP performance is in progress and required as part of more recent CREP agreements. Establishment of monitoring programs is only in the initial stages of staffi ng, coordination between agencies, defi nition of sampling protocols, and collection of data (e.g., Commonwealth of Kentucky 2003, West Virginia Conservation Agency 2003, State of North Carolina 2004b). Consequently, long-term data describing environmental eff ects of the CREP are not available.
In some instances, advantage is being taken of infrastructure and baseline data already in place. For example, the Ohio Upper Big Walnut Creek CREP where the City of Columbus Water Quality Lab will provide water-quality monitoring services (Ohio Department of Natural Resources 2003). Th e majority of CREPs do not have such an advantageous position. Diff ering priorities for agencies potentially involved in CREP monitoring (Commonwealth of Kentucky 2003), insuffi cient funds specifi cally dedicated to long-term monitoring (Wisconsin Department of Agriculture, Trade and Consumer Protection 2004), and inadequate time for planted covers to become established (Wentworth and Brittingham 2003) have, in some cases, constrained evaluation of the program.

120 Th e Conservation Reserve Enhancement Program • Allen
Annual CREP reports to date have focused predominantly on numbers of contracts established, acres enrolled in specifi c conservation practices, and application of Natural Resource Conservation Service best management practices (e.g., Illinois Department of Natural Resources 2003, Ronaldson 2003, State of New York 2004). Consequently, little documentation of CREP eff ects exists in published literature. Much of the following information has been gathered from annual CREP reports; therefore, conclusions drawn are preliminary. Quantifi able results will be available as studies progress.
Wildlife and Conservation Practices Th e nearly 20-year existence of the CRP has allowed moderate assessment of its eff ects on vegetation response, wildlife, environmental quality, and rural economies (Dunn et al. 1993, Bangsund et al. 2002, Allen and Vandever 2003, Adam et al. 2004, Fleming 2004, Sullivan et al. 2004). Conservation practices used in CREPs across all states are those employed in the standard CRP. Establishment of introduced and native grasses, grassed fi lter strips, and forested riparian buff ers are leading conservation practices used in CREPs (Table 2). It seems rational to assume environmental and wildlife eff ects described for individual conservation practices such as riparian buff ers (Whitworth and Martin 1990, Peak et. al 2004) establishment of vegetative covers (Moulton et al. 1991, Best et al. 1997, Carmichael 1997, Reynolds et al. 2001) and long-term management of vegetation (Renner et al. 1995, Nuttle and Burger 1996, Allen et al. 2001) have comparable benefi ts and consequences when enveloped in a CREP. Arguments might be made that the landscape approach used by CREP enhances the per unit eff ectiveness of conservation practices established under the program. Spatial relations between conservation practices and their combined eff ects on wildlife need further investigation.
Roadside bird surveys completed in 2001 and 2002 associated with the Wisconsin CREP indicate grassland avian species of management concern tended to be more abundant on management (i.e., CREP) routes than on control routes (Wisconsin Department of Agriculture, Trade and Consumer Protection 2004). Rather than an accurate documentation of CREP eff ects on avian populations this information is viewed as baseline data upon which future assessments of program eff ects can be made. In an analysis of the Pennsylvania CREP, Wentworth and Brittingham (2003) reported greater numbers of avian species in fi elds planted to tame and native grasses than recorded in nearby non-program hayfi elds. Larger (≥40 acres) CREP fi elds were more likely to contain obligate grassland birds than smaller fi elds. Th ere was no signifi cant diff erence, however, in bird density, nest density, or nest success by fi eld size, even for obligate grassland species.
Grassed fi lter strip on a farm in Iowa. (L. Betts, USDA-NRCS)

Fish and Wildlife Benefi ts of Farm Bill Programs: 2000–2005 Update 121
Table 2. Conservation covers and practices on Conservation Reserve Enhancement Program (CREP) acreage by state as of December 2004. Source: USDA, Farm Service Agency.
State
Introduced
Native
Existing grass
Wildlife
habitat 1
Rare and declining habitat
Wildlife food
plots
Grass fi lter-strips
Riparian buffers
New and
existing trees
Wetland
practice2
Wind buffers
3
Other 4
CP1 CP2 CP10 CP4 CP25 CP12 CP21 CP22 CP3&11
Arkansas 0 0 0 0 0 0 0 6,447 0 0 0 0
California 2,821 677 372 8 0 15 0 6 0 0 0 152
Delaware 0 0 0 652 0 0 957 142 2,889 293 0 1
Illinois 2 2,588 0 30,519 1,605 559 16,348 19,727 3,683 34,038 21 673
Iowa 0 0 0 0 0 0 0 0 0 314 0 0
Kentucky 215 3,294 0 0 0 0 1 4,262 46 0 0 10
Maryland 9,334 1,485 154 368 0 0 37,660 16,662 635 2,151 0 584
Michigan 4,061 4,185 0 0 0 0 25,909 1,826 0 10,205 949 762
Minnesota 0 0 0 0 31,507 0 8,690 5,900 0 37,527 3 22
Missouri 12,533 805 0 50 0 3 85 60 7 0 0 20
Montana 0 6,439 0 1,088 367 0 0 4 0 0 0 64
Nebraska 1,404 15,235 0 2,220 0 0 971 109 0 261 17 8
New York 201 11 160 0 0 0 50 2,124 0 74 0 869
North Carolina 0 0 0 0 0 0 2,004 22,521 473 1,530 0 10
North Dakota 0 0 0 1,115 0 0 0 0 0 0 385 0
Ohio 1 0 0 106 0 0 16,270 1,599 150 1,976 1,643 31
Oregon 0 0 0 0 0 0 80 14,144 0 270 0 169
Pennsylvania 67,633 25,071 7,886 2,187 0 1,084 1,646 10,469 932 586 0 745
Vermont 0 0 0 0 0 0 132 940 0 0 0 0
Virginia 0 0 0 0 0 0 3,644 16,174 0 296 38 7
Washington 0 0 0 0 0 0 0 9,408 0 0 0 0
West Virginia 0 0 0 0 0 0 36 1,475 8 0 0 0
Wisconsin 1,861 612 2,461 0 4,686 0 11,760 8,204 0 1,939 0 768
Total 100,065 60,392 11,033 38,314 38,165 1,662 126,244 142,204 8,823 91,459 3,056 4,897
1Plantings that generally meet multiple seasonal (e.g., nesting cover, winter cover) requirements for wildlife of local or regional concern.2Includes CP23, CP30, and CP31.3Includes CP5, CP16, and CP24.4Includes CP8, CP9, CP15, CP18, CP26, and CP29.

122 Th e Conservation Reserve Enhancement Program • Allen
A fl oristic quality index (FQI) is being used in Illinois as a habitat-based approach to indirectly measure wildlife habitat potential of CREP sites (Illinois Department of Natural Resources 2003). Th e FQI ratings for all CREP sites evaluated were described as lower than expected as a consequence of weeds dominating sites for the fi rst 1 to 2 years after establishment of conservation practices. Desirable seeded and native plants, however, began to increase during the second and third years of monitoring, contributing to higher FQI values. Th e Illinois CREP is believed to have created critical habitat for many wildlife species, but surveys were not completed to measure vertebrate species usage or numbers. Physical attributes of changes in aquatic habitats, fi sh community structure, and benthic macroinvertebrates, in response to the Illinois CREP, have been collected on the sub-watershed and watershed scale. Results of these assessments were not described in the 2003 Illinois Annual Report. Conservation practices established under the Illinois CREP are being included in the Illinois Conservation Practices Tracking System used to document spatial relations between conservation practices and land use in the Illinois River basin. Availability of spatial data and characteristics of conservation practices will be essential for describing extent and cumulative eff ects of various conservation programs on wildlife and water-quality response (Das et al. 2004, Nusser et al. 2004).
Water Quality While conservation practice eff ects on wildlife populations are not always immediately evident or easily quantifi ed (Brady and Flather 2001), documentation of eff ects on water quality are even more problematic. Soil and sediment characteristics, variability in hydrologic and weather events, as well as vegetative characteristics, spatial distribution, and quality of conservation practices infl uence both short- and long-term eff ectiveness (Davie and Lant 1994, Lee et al. 1999, Mersie et al. 2003). Land use by producers using less eff ective approaches to conservation may dampen benefi ts seen from successful conservation practices on adjacent lands. Annual variability in agrochemical use and ensuing nutrient loading in sediments and runoff can result in variation in monitoring results and estimates of CREP eff ectiveness in the short term. Consequently, the time lag between establishment of conservation practices and detection of measurable changes in water quality can be long and require intensive collection of data (Rabalais et al. 2002, Richards and Grabow 2003). Th e Ohio Department of Natural Resources (2003) projected that at least 10 years, perhaps 20 years, may be required before CREP success in improvements of water quality can be reliably measured over the long term.
Within the Minnesota River Watershed estimates are that CREP has reduced sediments by 9.6 tons/acre/year, soil loss has been diminished by

Fish and Wildlife Benefi ts of Farm Bill Programs: 2000–2005 Update 123
4.2 tons/acre/year, and phosphorous input to aquatic systems has been reduced by 5.3 lbs/year for every acre enrolled in a conservation easement (Lines 2003). Approximations of environmental benefi ts of the North Carolina CREP include sediment reduction of 26,510 tons/year (State of North Carolina 2004a). As of October 1, 2004 about 30% of the land eligible for inclusion in the Wisconsin CREP had been enrolled (Wisconsin Department of Agriculture, Trade and Consumer Protection 2005). As a consequence of establishing 1,015 miles of buff ers on Wisconsin streams and shorelines, annual phosphorus input into surface waters are estimated to have declined by more than 106,000 lbs, nitrogen input has been reduced by over 55,000 lbs, and sediments in runoff have been reduced by more than 49,000 tons. Application of conservation practices focused on distribution of pastured dairy cattle in the New York City CREP is estimated to have decreased phosphorus loading into city reservoirs by nearly one-third since the program was initiated (Lamont 2005). Based on characteristics of lands currently enrolled, simulation analysis of eff ects of the Illinois CREP in the Lower Sangamon watershed suggest sediment loading resulting from a 5-year storm event has been reduced by 12% (from 38,642 tons to 33,966 tons) (Wanhong et al. 2005). Th e authors conclude performance and cost-eff ectiveness of the Illinois CREP in this watershed could be improved if more attention was given to enrollment of lands with greatest potential to reduce sediment input within the area of eligibility. Among their suggestions were greater emphases on enrollment of highly sloping lands, lands closer to water, inclusion of acres receiving higher upland sediment fl ow, and increased inclusion of lands with lower rental costs.
ConclusionsTh e CREP advances agricultural conservation policy by employing a multi-farm approach to solving environmental, economic, and social consequences of agricultural production. To succeed, conservation practices cannot present an economic burden on producers. Based on shared economic responsibilities between federal, state, and private interests, the CREP minimizes costs to producers while addressing regional, state, and local environmental issues of greatest priority.
With much of the land under production for generations, the environmental eff ects of agriculture have been cumulative and reach far beyond farm boundaries (Trenbath et al. 1990, Krapu et al. 2004). Th e diminished diversity of crops produced, less frequent and varied rotations between crops, an enduring dependence on agrochemicals, and physical concentration of livestock production have negatively aff ected surface and ground water quality within and beyond agriculturally dominated landscapes. Th e consequences have an eff ect on drinking water quality on farms, nearby towns, cities far downstream, and biological conditions

124 Th e Conservation Reserve Enhancement Program • Allen
in marine ecosystems thousands of miles away. Th e decline in amount and diversity of non-farmed vegetative covers across intensively farmed regions continues to infl uence availability and quality of terrestrial and aquatic habitats for obscure, as well as economically and socially important wildlife species. Solutions to these issues will not occur by addressing individual problems in isolation. Nor will reversal in the negative consequences of decades of land use occur quickly.
Design of acceptable evaluation programs under fi nancial and time constraints presents a fundamental obstacle to those who formulate and administer agricultural legislation (Büchs 2003). Years of research to furnish answers to specifi c environmental issues may be tolerable in an academic setting but is a liability rather than an asset in a political arena. Performance criteria must be clear and must support lucid communication of results and implications. Th is is a diffi cult, rarely attained goal, particularly for long-term programs like the CREP.
Assessments of CREP performance can be expected to take years from time of program authorization and initiation simply because enrollment appears take several years to pick up momentum. Additionally, many vegetative covers will take years to become suffi ciently mature to have an infl uence on resource conditions they were designed to address. Most CREPs have been active for only a small number of years with evaluation of performance just beginning. In many cases, data being gathered now on program eff ectiveness can only be used as baseline information because previously collected data specifi c to CREP applications do not exist.
Refi nements in the CREP and other USDA conservation programs cannot be made without quantifi able information. Acres enrolled in specifi c conservation practices off er only incomplete answers. Answers related to CREP eff ectiveness in improving water quality, wildlife response to enhancement of habitats, and the ability of economically viable agricultural production to thrive without undue environmental harm will require a long-term commitment to evaluation of program performance. An eff ectual long-term monitoring plan must extend beyond basic collection of data to account for recurrent training needed in response to changes in personnel, eff ective analysis, and reporting of results over years. Based upon information in annual reports, collection of environmentally related data is now providing a foundation upon which future assessments CREP performance can be made.

Fish and Wildlife Benefi ts of Farm Bill Programs: 2000–2005 Update 125
AcknowledgmentsAppreciation is extended to Mike Linsenbigler and Chad Chadwell, FSA, Conservation and Environmental Programs Division (CEPD) for their help and burying me in annual reports and other CREP data and information. I thank Skip Hyberg, FSA, Economic and Policy Analysis Staff (EPAS), and Sally Benjamin, CEPD, for their review and benefi cial comments on this document and Alex Barbarika, EPAS, for contributing Table 2.
Literature CitedAdam, B. D., S. J. Hong, and M. R. Dicks. 2004. Eff ects of the
Conservation Reserve Program on elevator merchandising margins in Oklahoma. Journal of Agricultural and Applied Economics 36:83–96.
Allen, A. W., B. S. Cade, and M. W. Vandever. 2001. Eff ects of emergency haying on vegetative characteristics within selected conservation reserve program fi elds in the northern Great Plains. Journal of Soil and Water Conservation 56:120–125.
———, and M. W. Vandever. 2003. A national survey of Conservation Reserve Program (CRP) participants on environmental eff ects, wildlife issues, and vegetation management on program lands. Biological Science Report USGS/BRD/BSR-2003-0001. U.S. Government Printing Offi ce, Denver, Colorado, USA.
Bangsund, D. A., F. L. Leistritz, and N. M. Hodur. 2002. Rural economic eff ects of the Conservation Reserve Program in North Dakota. Agribusiness and Applied Economics Report 497, Department of Agribusiness and Applied Economics, Agricultural Experiment Station, North Dakota State University, Fargo, USA.
Best, L. B., H. Campa, III, K. E. Kemp, R. J. Robel, M. R. Ryan, J. A. Savidge, H. P. Weeks, Jr., and S. R. Winterstein. 1997. Bird abundance and nesting in CRP fi elds and cropland in the Midwest: a regional approach. Wildlife Society Bulletin 25:864–877.
Brady, S. J., and C. H. Flather. 2001. Estimating wildlife habitat trends on agricultural ecosystems in the United States. Pages 156–167 in Agriculture and biodiversity: developing indicators for policy analysis. Proceedings from an Organization for Economic Co-operation and Development Expert meeting, Zurich, Switzerland, November 2001.
Büchs, W. 2003. Biotic indicators for biodiversity and sustainable agriculture—introduction and background. Agriculture, Ecosystems and Environment 98:1–16.

126 Th e Conservation Reserve Enhancement Program • Allen
Carmichael, D. B., Jr. 1997. Th e Conservation Reserve Program and wildlife habitat in the southeastern United States. Wildlife Society Bulletin 25:773–775.
Commonwealth of Kentucky. 2003. Kentucky Green River Conservation Reserve Enhancement Program (CREP) annual program accomplishment report (CEP-68R), federal fi scal year 2003.
Das, C., W. J. Capehart, H. V. Mott, P. R. Zimmerman, and T. E. Schumacher. 2004. Assessing regional impacts of Conservation Reserve Program-type grass buff er strips on sediment load reduction from cultivated lands. Journal of Soil and Water Conservation 59:134–141.
Davie, D. K., and C. L. Lant. 1994. Th e eff ect of CRP enrollment on sediment loads in two southern Illinois streams. Journal of Soil and Water Conservation 49:407–412.
Dunn, C. P., F. Stearns, G. R. Gutenspergen, and D. M. Sharpe. 1993. Ecological benefi ts of the Conservation Reserve Program. Conservation Biology 7:132–139.
Feather, P., D. Hellerstein, and L. Hansen. 1999. Economic valuation of environmental benefi ts and targeting of conservation programs: the case of the CRP. Agricultural Economic Report 778. U.S. Department of Agriculture, Economic Research Service, Washington, D.C., USA.
Fleming, R. A. 2004. An econometric analysis of the environmental benefi ts provided by the Conservation Reserve Program. Journal of Agricultural and Applied Economics 36:399–413.
Illinois Department of Natural Resources. 2003. Illinois Conservation Reserve Enhancement Program: a partnership between the USDA and the State of Illinois. 2003 Annual Report.
Keeney, D., and L. Kemp. 2003. A new agricultural policy for the United States. North Atlantic Treaty Organization Advanced Research Workshop on Biodiversity and Rural Sustainability, November 2002. Institute for Agriculture and Trade Policy, Minneapolis, Minnesota, USA.
Kingsbury, L., and W. Boggess. 1999. An economic analysis of riparian landowners’ willingness to participate in Oregon’s Conservation Reserve Enhancement Program. Paper presented at Annual Meeting of the American Agricultural Economics Association, Oregon State University, Corvallis, USA.
Kleiman, D. G., R. P. Reading, B. J. Miller, T. W. Clark, M. Scott, J. Robinson, R. L. Wallace, R. J. Cabin, and F. Felleman. 2000. Improving the evaluation of conservation programs. Conservation Biology 14:356–365.

Fish and Wildlife Benefi ts of Farm Bill Programs: 2000–2005 Update 127
Krapu, G. L., D. A. Brandt, and R. R. Cox, Jr. 2004. Less waste corn, more land in soybeans, and the switch to genetically modifi ed crops: trends with important implications for wildlife management. Wildlife Society Bulletin 32:127–136.
Lamont, g. L. 2005. Protecting New York City’s water supply with the Conservation Reserve Enhancement Program. In A. W. Allen and M. W. Vandever, editors. Th e Conservation Reserve Program: planting for the future. Proceedings of a national conference, 6–9 June 2004, Fort Collins, Colorado, USA. U.S. Geological Survey Biological Science Report USGS/BRD/BSR-xxxx. In Press
Lant, C. L., S. E. Kraft, and K. R. Gilman. 1995. Enrollment of fi lter strips and recharge areas in the CRP and USDA easement programs. Journal of Soil and Water Conservation 50:193–200.
Lee, K. H., T. M. Isenhart, R. C. Schultz, and S. K. Mickelson. 1999. Nutrient and sediment removal by switchgrass and cool-season grass fi lter strips in central Iowa, USA. Agroforestry Systems 44:121–132
Lines, K. J. 2003. Minnesota River Watershed Conservation Reserve Enhancement Program. Annual report October 1 to September 30, 2002, to the U.S. Department of Agriculture Farm Service Agency from the Minnesota Board of Water and Soil Resources, St. Paul, USA.
Mersie, W., C. A. Seybold, C. McNamee, and M. A. Lawson. 2003. Abating endosulfan from runoff using vegetative fi lter strips: the importance of plant species and fl ow rate. Agriculture, Ecosystems and Environment 97:215–223.
Moulton, R. J., B. Baldwin, and J. Snellgrove. 1991. Impacts of Conservation Reserve Program tree planting on biological diversity. Proceedings of the Southern Forest Economists Annual Meeting, 20–22 February 1991, Washington, D.C., USA.
Nusser, S. M., W. R. Clark, J. Wang, and T. R. Bogenschutz. 2004. Combining data from state and national monitoring surveys to assess large-scale impacts of agricultural policy. Journal of Agricultural, Biological, and Environmental Statistics 9:381–397.
Nuttle, T., and L. W. Burger, Jr. 1996. Response of breeding bird communities to restoration of hardwood bottomlands. Proceedings of the Annual Conference of the Southeastern Association of Fish and Wildlife Agencies 50:228–236.
Ohio Department of Natural Resources. 2003. Ohio Upper Big Walnut Creek CREP annual report, federal fi scal year 2002.

128 Th e Conservation Reserve Enhancement Program • Allen
Peak, R. G., F. R. Th ompson, III, and T. L. Shaff er. 2004. Factors aff ecting songbird nest survival in riparian forests in a midwestern agricultural landscape. Auk 121:726–737.
Pimentel, D., B. Berger, D. Filiberto, M. Newton, B. Wolfe, E. Karabinakis, S. Clark, E. Poon, E. Abbett, and S. Nandagopal. 2004. Water resources: agricultural and environmental issues. BioScience 54:909–918.
Rabalais, N. N., R. E. Turner, Q. Dortch, D. Justic, V. J. Bierman, Jr., and W. J. Wiseman, Jr. 2002. Nutrient-enhanced productivity in the northern Gulf of Mexico: past, present, and future. Hydrobiologia 475/476:39–63.
Renner, R. W., R. E. Reynolds, and B. D. J. Batt. 1995. Th e impact of haying Conservation Reserve Program lands on productivity of ducks nesting in the Prairie Pothole Region of North and South Dakota. Transactions of the North American Wildlife and Natural Resources Conference 60:221–229.
Reynolds, R. E., T. L. Shaff er, R. W. Renner, W. E. Newton, and B. D. Batt. 2001. Impact of the Conservation Reserve Program on duck recruitment in the U.S. Prairie Pothole Region. Journal of Wildlife Management 65:765–780.
Richards, R. P., and G. L. Grabow. 2003. Detecting reductions in sediment loads associated with Ohio’s Conservation Reserve Enhancement Program. Journal of the American Water Resources Association 39:1261–1268.
Ronaldson, J. 2003. North Dakota 2003 CREP annual report. North Dakota Fish and Game Department, Bismarck, USA.
Santelmann, M. V., D. White, K. Freemark, J. I. Nassauer, J. M. Eilers, K. B. Vache, B. J. Danielson, R. C. Corry, M. E. Clark, S. Polasky, R. M. Cruse, J. Sifneos, H. Rustigian, C. Coiner, J. Wu, and D. Debinski. 2004. Assessing alternative futures for agriculture in Iowa, U.S.A. Landscape Ecology 19:357–354.
Smith M. E. 2000. Conservation Reserve Enhancement Program: early results from a federal–state partnership. U.S. Department of Agriculture, Economic Research Service, Agricultural Outlook (December 2000):16–19.
State of New York. 2004. Conservation Reserve Enhancement Program for the New York City water supply watersheds. federal fi scal year 2004 annual report.
State of North Carolina. 2004a. North Carolina Conservation Reserve Enhancement Program annual report, FY2002–FY2003.

Fish and Wildlife Benefi ts of Farm Bill Programs: 2000–2005 Update 129
State of North Carolina. 2004b. North Carolina Conservation Reserve Enhancement Program annual report, FY2004.
Sullivan, P., D. Hellerstein, L. Hansen, R. Johansson, S. Koenig, R. Lubowski, W. McBride, D. McGranahan, M. Roberts, S. Vogel, and S. Bucholtz. 2004. Th e Conservation Reserve Program: Economic implications for rural America. Agricultural Economic Report 834. U.S. Department of Agriculture, Economic Research Service, Washington, D.C., USA.
Trenbath, B. R., G. R. Conway, and I. A. Craig. 1990. Th reats to sustainability in intensifi ed agricultural systems: Analysis and implications for management. Pages 337–365 in S. R. Gliessman, editor. Agroecology: researching the ecological basis for sustainable agriculture. Springer-Verlag, New York.
[USDA] U.S. Department of Agriculture. 2004. Th e Conservation Reserve Program: 29th signup statistics summary. U.S. Department of Agriculture, Farm Service Agency, Washington, D.C., USA.
Wanhong, Y., M. Khanna, R. Farnsworth, and H. Önal. 2005. Is geographical targeting cost-eff ective? Th e case of the Conservation Reserve Enhancement Program in Illinois. Review of Agricultural Economics 27:70–88.
Wentworth, K., and M. C. Brittingham. 2003. Eff ects of local and landscape features on avian use and productivity in Conservation Reserve Enhancement Program fi elds. Pennsylvania Game Commission CREP progress report (July 2001–May 2003). Cooperative agreement ME231002. Pennsylvania State University, University Park, USA.
West Virginia Conservation Agency. 2003. CREP performance report, fi scal year October 1, 2002–September 30, 2003.
Whitworth, M. R., and D. C. Martin. 1990. Instream benefi ts of CRP fi lter strips. Transactions of the North American Wildlife and Natural Resources Conference 55:40–45.
Wisconsin Department of Agriculture, Trade and Consumer Protection. 2004. 2003 annual report: Wisconsin’s Conservation Reserve Enhancement Program (CREP).
Wisconsin Department of Agriculture, Trade and Consumer Protection. 2005. 2004 annual report: Wisconsin’s Conservation Reserve Enhancement Program (CREP).

130 Th e Conservation Reserve Enhancement Program • Allen
Appendix 1. Overview of exist ing Conservation Reserve Enhancement Programs (CREP). A summary of key aspects of established Conservation Reserve Enhancement Programs (CREP) by state. Proposals for establishment of CREPs are underway for additional states. Additional information on individual CREPs can be obtained from USDA Farm Service Agency web sites http://www.fsa.usda.gov/dafp/cepd/state_updates.htm or http://www.fsa.usda.gov/dafp/cepd/epb/assessments.htm.
StateYear
initiated
Fundingfederal (F) and nonfederal (nf)
(millions)1
Acres committed
Primary area of applicability Key environmental objectives2 Primary conservation
practices3
Arkansas 2001 F 8.5nf 1.7 4,700 Bayou Metro
WatershedDrinking, surface water quality,
wildlife habitat Riparian buffers
California 2001 F 19.0nf 5.0 12,000 North Central
Valley
Surface and groundwater quality, soil erosion, air quality,
wildlife habitat
Introduced and native grasses, wetland restoration,
wildlife food plots, habitat improvement, riparian buffers
and fi lter strips
Delaware 1999 F 10.0nf 2.0 6,000
Chesapeake Bay, Delaware Bay
and Inland Bay watersheds
Lower surface water nutrient loading, water and aquatic
habitat quality, upland wildlife habitat
Hardwood trees, fi lter strips, riparian buffers, wetland
restoration
Florida 2002 F 96.0nf 57.0 30,000 Everglades
watershed
Increase water quality and storage capabilities, enhance
wildlife habitat and biodiversity
Filter strips and riparian buffers, wetland restoration,
hardwood trees
Illinois1998,
Expanded in 2001
F 60.0nf 12.0 232,000 Illinois River
watersheds
Reduce sediment and nutrient loading, enhance terrestrial and
aquatic wildlife habitatsRiparian buffers and fi lter strips
Iowa 2001 F 31.0nf 7.0 9,000 North-central Iowa Drinking and surface water
quality, wildlife habitatWetland restoration, riparian
buffers and fi lter strips
Kentucky 2001 F 88.0nf 17.0 100,000 Green River
watershed
Recreation, water quality, restoration of ecosystems in
Mammoth Cave National Park
Wetland restoration, riparian buffers and fi lter strips
hardwood trees
Maryland 1997 F 170.0nf 25.0 100,000 Chesapeake Bay
and tributariesWater quality and aquatic
habitat quality Riparian buffers and fi lter strips
Michigan 2000 F 142.0nf 35.0 80,000
Macatawa, Raisin rivers and
Saginaw Bay watersheds
Improvement in surface water and drinking water supplies and quality, improve wildlife
habitat
Riparian buffers and fi lter strips, wetland restoration,
windbreaks
Minnesota 1998 F 187.0nf 81.4 190,000 Minnesota river
and fl oodplainImprove water quality and
wildlife habitat
Wetland restoration, riparian easements, buffers and fi lter
strips

Fish and Wildlife Benefi ts of Farm Bill Programs: 2000–2005 Update 131
StateYear
initiated
Fundingfederal (F) and nonfederal (nf)
(millions)1
Acres committed
Primary area of applicability Key environmental objectives2 Primary conservation
practices3
Missouri 2000 F 70.0nf 15.0 50,000
83 reservoir watersheds across
36 counties
Improve drinking water quality, lower sediment input into water
supply reservoirs, elevate natural diversity
Contour grass strips, hardwood trees, fi lter and
riparian buffer strips
Montana 2002 F 41.0nf 16.0 26,000
Missouri and Madison River
systems
Improve water quality by reduction of nutrients and
sediments in runoff
Wetland restoration, fi lter strips and riparian buffers
Nebraska 2002F 143.0nf 66.0 100,000 Nebraska Central
Basin
Reduce sediment and nutrient loading in lakes and streams, improve wildlife habitat in 37
counties
Grassland establishment, wetland restoration, fi lter
strips, riparian buffers
New Jersey 2004 F 77.0
nf 23.0 30,000Watersheds draining into
Atlantic Ocean
Enhance biological and aquatic habitat quality in Atlantic
estuaries, increase open space
Grassed waterways, fi lter strips, and riparian buffers
New York 1998
2004
2004
F 7.3nf 3.2
F 0.65nf 0.25
F 52.0nf 10.4
40,000
1,000
40,000
Catskill/Delaware (New York City
watersheds)
Skaneateles Lake watershed
12 watersheds across state
Improve quality of New York City drinking water, improve wildlife and aquatic habitats
Improve drinking water quality for Syracuse
Reduce nutrient and pathogen content in sediments and runoff
Filter strips and riparian buffers, fencing, wetland restoration, tree planting
Tree planting, contour grass strips, diversions, fi lter strips,
riparian buffers
Tree planting, fi lter strips, riparian buffers, wetland
restoration
North Carolina 1999 F 221.0
nf 54.0 100,000 Albemarle-Pamlico Estuary
Improve estuarine fi sheries, enhance municipal drinking
waters
Hardwood tree planting, fi lter strips, riparian buffers
North Dakota 2001 F 20.0
nf 23.0 160,000
Six watersheds across
southwestern and southern regions
of the state
Critical winter habitats for wildlife, water quality,
recreation, enhancement of rural economies
Shelterbelts, permanent wildlife habitat, food plots
Ohio
2000
2002
2004
F 167.0nf 34.0
F 8.4nf 4.8
F 160.0nf 32.0
Protection of 5,000
linear miles of streams
3,500
70,000
Lake Erie and tributaries
Upper Big Walnut Creek Watershed
Scioto Watershed
Reduce sediment and nutrient loading, enhance wildlife
habitat
Improvement in drinking water quality
Improvement in drinking water quality, wildlife habitat
Wetland restoration, fi eld windbreaks, fi lter strips,
riparian buffers
Filter strips, riparian buffers, hardwood trees
Filter strips, riparian buffers, hardwood trees

132 Th e Conservation Reserve Enhancement Program • Allen
StateYear
initiated
Fundingfederal (F) and nonfederal (nf)
(millions)1
Acres committed
Primary area of applicability Key environmental objectives2 Primary conservation
practices3
Oregon 1998 F 200.0nf 50.0 100,000
4,000 miles of streams throughout
OregonOregon
Improvement in habitat quality for endangered salmon and trout
Filter strips and riparian buffers, wetland restoration
Pennsylvania
2000
2004
F 129.0nf 77.0
F 98.9nf 46.7
200,000
65,000
Susquehanna and Potomac River
watersheds
Ohio River watersheds
Improvement in water quality entering Chesapeake Bay
Improvement in water quality entering Gulf of Mexico
Filter strips, riparian buffers, wetland restoration, contour
grass strips
Filter strips, riparian buffers, wetland restoration, contour
grass strips
Vermont 2001 F 1.5nf 3.7 7,500 Statewide
Reduction of nutrient loading in Lake Champlain and Hudson-Saint
Lawrence waterwayFilter strips, grassed waterways,
wetland restoration
Virginia
2000 F 68.0nf 23.0
25,000
10,000
Chesapeake Bay watersheds
Southern VirginiaRivers (exclusive
of Chesapeake Bay watersheds)
Improvement in water quality entering Chesapeake Bay
Water quality, wildlife habitat
Filter strips, riparian buffers, wetland restoration
Filter strips, riparian buffers, wetland restoration
Washington 1998 F 200.0nf 50.0 100,000
All streams crossing agricultural lands providing salmon spawning habitat spawning habitat
Restoration of salmon habitats in 3,000 miles of streams Tree- dominated riparian buffers
West Virginia
2002 F 8.2nf 3.2
9,160
Potomac, New spawning habitat Potomac, New
spawning habitat
Greenbrier, and Little Kanawha river
watershedswatersheds
Enhancement of water quality and wildlife habitats
Riparian buffers and fi lter strips, hardwood tree planting
Wisconsin 2001 F 198.0nf 45.0 100,000 All or portions of 47
counties across stateEnhancement of water quality and
wildlife habitats
Grassed waterways, fi lter strips, riparian buffers, wetland
restorationrestoration
1 Base funding for CREPs includes allocation for annual rental payments, establishment of conservation practices, annual maintenance of covers established, technical assistance and support. Special Incentive Payments (SIP) and Practice Incentive Payments (PIP) may be available as well as additional fi nancial incentives from non-government partners. For the purposes of this paper contributions from state and non-federal organizations (nf) are combined. Costs are estimated over a 10-15 year period.
2 Each CREP has numerous environmental objectives identifi ed, not all are listed in this table. Control of soil erosion is an underlying objective of all CREPs
3 Only a generalization of key conservation practices is provided. Specifi c, eligible conservation practices are defi ned for each CREP and typically include more practices than listed. Virtually all CREPs permit establishment of tame or native grasses as partial or whole-fi eld enrollment.

Fish and Wildlife Benefi ts of Farm Bill Programs: 2000–2005 Update 133
Wildlife Benefi ts of the Wetlands Reserve Program Charles A. RewaUSDA/NRCS, Resource Inventory and Assessment Division5601 Sunnyside AvenueBeltsville, Maryland 20705-5410, USA [email protected]
AbstractSince its initial authorization in 1990, more than 1.6 million acres of primarily drained or degraded wetlands on agricultural lands have been enrolled in the U.S. Department of Agriculture’s (USDA) Wetlands Reserve Program (WRP). Th e Natural Resources Conservation Service (NRCS) and its partners are working with landowners to restore these lands to ecologically productive wetland and upland buff er habitats. Numerous studies have documented the value of restored and created wetlands to fi sh and wildlife resources. However, few objective studies have been completed that document fi sh and wildlife response to wetlands enrolled in and restored through WRP. Preliminary results of some studies underway indicate that wildlife use of WRP sites is comparable to or exceeds that of non-program restored wetland habitats. In addition, anecdotal reports on some WRP restored wetland complexes indicate that wildlife response has been greater than expected. Additional studies are needed to enable WRP program managers and participants to better understand how lands enrolled in the program aff ect local fi sh and wildlife use and the landscape factors that aff ect wildlife community dynamics and population trends infl uenced by the lands enrolled. Elements of USDA’s Conservation Eff ects Assessment Project are intended to begin addressing this need.
IntroductionTh e Conservation Title of the 1985 Food Security Act represented a major shift in U.S. Department of Agriculture (USDA) agricultural policy toward emphasis on conservation of soil, water, and wildlife resources in agricultural landscapes (Myers 1988, Heimlich et al. 1998). Th e 1990 Farm Bill’s amendments to the 1985 conservation provisions included establishment of the Wetlands Reserve Program (WRP), which provides incentives for restoration of wetlands previously impacted by agricultural development. A detailed description of the program is available on-line at <http://www.nrcs.usda.gov/programs/wrp/>.
Wetlands have long been recognized for their value as productive wildlife

134 Wildlife Benefi ts of the WRP • Rewa
habitats (Greeson et al. 1978). As part of a comprehensive review of Farm Bill contributions to wildlife conservation (Heard et al. 2000), Rewa (2000a) summarized the literature documenting wildlife response to wetland restoration and made inferences on the contribution of WRP to wildlife habitat potential. Th at report concluded that while actual wildlife use of WRP sites had not been well documented, the literature on wildlife use of other restored wetlands implies that many species are likely benefi ting from WRP wetland habitats. While the lack of program-specifi c wildlife response data prevented the quantifi cation of species population responses to the program at that time, the variety of wetland habitats established and the predicted wildlife response to these habitats based on studies in the literature implied that the program was providing tangible benefi ts to individuals and likely benefi ting at least some wildlife populations.
Th is paper provides an update on WRP accomplishments and, while still quite limited, summarizes the available literature documenting the benefi ts of wetland restoration and management specifi c to WRP sites. Since the 2000 report was completed, a number of additional studies have been published that document fi sh and wildlife response to wetland restoration not associated with WRP sites.
Program EnrollmentEnrollment in WRP has expanded substantially since the 2000 report was produced. Under the 2002 Farm Bill’s expanded enrollment cap of 2,275,000 acres, over 1,627,000 acres in 8,396 separate projects had been enrolled through September 2004. Th e majority of acres (80%) and projects (75%) in the program are enrolled under permanent easements, 14% of both acres and projects are enrolled under 30-year easements, and 10% of the projects encompassing 6% of the acres are enrolled under 10-year cost-share agreements. Th e average size of projects enrolled is approximately 194 acres. Landowners continue to show great interest in the program; 3,173 applications covering over 535,932 acres in fi scal year 2004 were not accepted due to funding limitations. Landowner interest in the program stems from a range of factors, including use of wetlands for hunting and their general interest in wildlife and natural beauty (Despain 1995, Blumenfeld 2003). Projects range in size from 2-acre prairie pothole sites to fl oodplain wetlands exceeding 10,000 acres. Assemblages of individual projects remain commonplace, especially in marginal fl ood-prone areas where clusters of projects have restored wetland complexes; 1 wetland complex in Arkansas exceeds 18,000 acres in area. Although projects are located in all 50 states and Puerto Rico, 8 states have enrollments of greater than 60,000 acres (Arkansas, California, Florida, Iowa, Louisiana, Mississippi, Missouri, Texas) and 16 states have more than 200 separate contracts (Arkansas, California, Illinois, Indiana, Iowa,
Mechanical excavation increases microtopographic complexity that benefi ts a diversity of wetland wildlife on WRP sites in the Arkansas River valley. (Kiah Gardner, Arkansas Game and Fish Commission)

Fish and Wildlife Benefi ts of Farm Bill Programs: 2000–2005 Update 135
Louisiana, Michigan, Minnesota, Mississippi, Missouri, Nebraska, New York, Ohio, Oklahoma, South Dakota, Wisconsin) (Figure 1).
As stated in the 2000 report, a wide variety of wetland types are being restored under the program, ranging from southeastern bottomland hardwood forests to herbaceous prairie marshes to expansive fl oodplain wetlands to coastal tidal salt marshes. Physical restoration of wetland characteristics remains a high priority of the program. In addition, greater emphasis is being placed on establishing a diversity of surface features through mechanical treatment to mimic natural micro- and macro-topography and encourage development of a diversity of fi sh and wildlife habitat conditions.
Actions taken to restore wetland conditions (e.g., plugging ditches, breaking tiles, installing water control structures, excavating meander swales, planting trees, etc.) are aimed at setting in place the natural processes that allow recovery of many wetland functions previously lost. While it may be many years or decades for most wetland functions to be restored, valuable habitat and other wetland functions can appear shortly after restoration actions are taken. Initial restored wetland condition may provide functions that are substantially diff erent from the planned condition (NRC 2001). In documenting wildlife benefi ts resulting from WRP, it may take many years for studies to document the responses of wildlife species typically associated with mature forests to WRP-initiated bottomland hardwood restoration (Kolka et al. 2000). However, it is possible to document in a relatively short timeframe such wildlife responses as habitat created in early stages of wetland succession following restoration actions. In the case of bottomland hardwood forest restoration, studies have shown that birds associated with grasslands and scrub–shrub communities readily use these sites as they transition from open fi eld to forested habitats (Twedt et al. 2002, Twedt and Best 2004). While there are still very few empirical studies that document wildlife response to WRP wetlands, this paper compiles existing data and identifi es gaps in our understanding in this area.
Through WRP, Hay Lake in Arizona was restored to functional wetlands that fi lled with water during heavy rains in February 2005.(Rick Miller, Arizona Game and Fish Department)
Figure 1. Distribution of total Wetlands Reserve Program contracts and acres enrolled through fi scal year (FY) 2004.

136 Wildlife Benefi ts of the WRP • Rewa
Documented Wildlife Response to WRP EnrollmentsStudies have shown how restoring wetlands results in recovery of wetland vegetation (Galatowitsch and van der Valk 1996, Sleggs 1997, Brown 1999); colonization by aquatic invertebrates (Reaves and Croteau-Hartman 1994, Dodson and Lillie 2001), fi sh (Langston and Kent 1997), and amphibians (Lehtinen and Galatowitsch 2001, Petranka et al. 2003); and use of restored habitats by wetland birds (Guggisberg 1996, Brown and Smith 1998, Brown 1999, Stevens et al. 2003, Brasher and Gates 2004) and other wildlife (see Rewa 2000a). While a number of investigations have been initiated to quantitatively document fi sh and wildlife use of WRP sites, few have been completed and published. Results from studies that are available indicate that wildlife response to WRP wetland sites is similar to wetlands restored through other programs.
Early unpublished reports also imply that in some instances, largely due to specifi c measures taken during the restoration process to maximize wildlife habitat values, wildlife response to wetlands restored through WRP has been greater than expected. Reports of signifi cant wildlife response in areas where large wetland complexes are enrolled and restored are of particular note. Following are a few examples of informal reports of wildlife response to WRP sites from NRCS WRP contacts (L. Deavers, NRCS, personal communication):
■ Restoration work on 1,500 acres of a 7,100-acre wetland complex enrolled in Indiana has attracted thousands of migrating sandhill cranes (Grus canadensis), large numbers of migrating ducks, and several species that are on Indiana’s threatened and endangered species lists including the crawfi sh frog (Rana areolata), king rail (Rallus elegans), bald eagle (Haliaeetus leucocephalus), and Wilson’s phalarope (Phalaropus tricolor). Phalaropus tricolor). Phalaropus tricolor
■ At a WRP site in northwestern Indiana, bird species have been sighted that have not been known to nest in Indiana for many years. Eighteen species that are on state threatened or endangered species lists have been sighted at this site.
■ In 1998, a 2,800-acre area in South Florida was enrolled in WRP; the row crops that occupied the site have since been replaced by marsh vegetation. Th e resulting mosaic of vegetation types provides high-quality habitat for a diversity of wetland-dependent species including many listed species. Th e deep marsh habitat is being used by migratory waterfowl, including northern pintails (Anas used by migratory waterfowl, including northern pintails (Anas used by migratory waterfowl, including northern pintails (acuta), mottled ducks (Anas fulvigula), mottled ducks (Anas fulvigula), mottled ducks ( ), ring-necked ducks (Aythya ), ring-necked ducks (Aythya ), ring-necked ducks (collaris), northern shovelers (Anas clypeata), northern shovelers (Anas clypeata), northern shovelers ( ), American wigeon

Fish and Wildlife Benefi ts of Farm Bill Programs: 2000–2005 Update 137
(Anas americana(Anas americana( ), and blue-winged teal (Anas discors), and blue-winged teal (Anas discors), and blue-winged teal ( ). Th ese deep marsh areas also provide feeding opportunities for the federally listed Everglades snail kite (Rostrhamus sociabilis) and bald eagle. Shallow marsh areas provide habitat for many wading bird species, including the wood stork (Mycteria americanathe wood stork (Mycteria americanathe wood stork ( ), a federally listed species, and the snowy egret (Egretta thula), little blue heron (Egretta caerulea), tricolored heron (Egretta tricolor), white ibis (Egretta tricolor), white ibis (Egretta tricolor Eudocimus albus), and limpkin (Aramus guaraunalimpkin (Aramus guaraunalimpkin ( ), all species of special concern in Florida.
■ A 4,000-acre WRP wetland complex in Minnesota recently restored through the involvement of 12 separate landowners has induced the return of a tremendous amount of migratory and resident wildlife species. Dozens of wetland wildlife and upland species have been noted, including sandhill crane, ducks and geese, greater prairie-chicken (Tympanuchus cupido), numerous songbirds, moose (Alces ), numerous songbirds, moose (Alces ), numerous songbirds, moose (alces), butterfl ies, and the federally threatened western fringed prairie orchid (Platanthera praeclara).
■ WRP easements at Raft Creek in Arkansas have been noted for substantial wildlife response. Th ese restored wetlands have been used by many ducks, shorebirds, and other birds that are indigenous to Arkansas as well as many species seldom seen in the state. As many as 50 brown pelicans (Pelecanus occidentalis) were observed to have spent part of the summer months at this site. Th is site has also been known to be host to an estimated 20% of all ducks that pass through Arkansas during some period of the migration season, and rare species have been sighted.
■ Th rough WRP, a group of landowners in southeastern Oklahoma have restored a nearly 7,500-acre wetland complex adjacent to the Red River known as Red Slough. Red Slough is now recognized within the state and region as a birdwatcher’s paradise. Within 2 years of restoration, 254 species of birds were recorded at the site. Birds only rarely seen in the state are becoming common during seasonal visits to Red Slough. Unusual or fi rst-time records of birds nesting in Oklahoma, such as wood storks, white ibis, willow fl ycatchers (Empidonax trailliias wood storks, white ibis, willow fl ycatchers (Empidonax trailliias wood storks, white ibis, willow fl ycatchers ( ), roseate spoonbills (Ajaia ajajaroseate spoonbills (Ajaia ajajaroseate spoonbills ( ), and black-necked stilts (Himantopus ), and black-necked stilts (Himantopus ), and black-necked stilts (mexicanus) have been documented. Migratory and wintering waterfowl numbers at Red Slough and nearby wetlands have exceeded 100,000 birds. Other examples of use of this wetland complex by rare species include the fi rst nesting record of common moorhens (Gallinula chloropus) in the county (Heck and Arbour 2001a), as many as 350 wood storks at the site at one time, the highest number ever recorded in Oklahoma (Heck and Arbour 2001b), and estimates of hundreds of yellow rails (Coturnicops noveboracensis) (P. Dickson, Louisiana Ornithological Society, personal communication).

138 Wildlife Benefi ts of the WRP • Rewa
Hicks (2003) studied wildlife use of early successional habitats provided by bottomland hardwood wetlands restored through WRP in the Cache River watershed in southern Illinois. Surveys conducted in 2002 and 2003 documented use of WRP wetlands by 18 species of waterfowl, 9 shorebird groups, 5 marsh bird species, and 8 wading bird species. Mean densities within each taxa were at least comparable between WRP and reference wetlands; mean waterfowl density on WRP sites in 2003 exceeded mean waterfowl density on reference sites. Species richness for shorebirds, wading birds, and marsh birds on WRP sites did not diff er from reference sites (Hicks 2003). Th ese data indicate that early successional wetland habitats provided by WRP enrollments following restoration are providing tangible benefi ts to local wildlife communities.
Documented waterfowl use of restored WRP wetland sites in the Oneida Lake Plain of central New York show similar results (M. R. Kaminski and G. A. Baldassarre, State University of New York, unpublished data). A 2-year fi eld study (2003–2004) examining waterfowl production in these wetlands showed that mallard (Anas platyrhynchoswetlands showed that mallard (Anas platyrhynchoswetlands showed that mallard ( ) productivity in WRP wetland and upland sites was greater than on comparable non-WRP nesting sites. Although sample sizes were small, hen success rate on WRP restored wetlands (3 of 3 nests succeeded) and grasslands (3 of 6 nests succeeded) appeared to exceed hen success rate on non-WRP wetlands (2 of 4 nests succeeded) and grasslands (2 of 8 nests succeeded).
Harris (2001) studied bird use of 21 semi-permanent and spring-seasonal restored wetlands in California’s Sacramento Valley, 5 of which were sites enrolled in WRP (P. A. Morrison, U.S. Fish and Wildlife Service, personal communication). Th is study found that these restored wetlands attracted diverse bird communities, with species richness greater on semi-permanent restored wetlands than on spring-seasonal sites. Wetland obligate bird species were associated with greater water depths and wetland size (Harris 2001).
Preliminary data from work investigating anuran amphibian use of WRP sites in Arkansas and Louisiana illustrate the potential value of these restored wetlands to amphibians. Sampling of 21 WRP sites in Avoylles Parish, Louisiana, in 2004 detected 11 of 12 species expected to occur in the region, with 12 of the sites each supporting at least 3 species. Likewise, anuran call surveys in 2004 in Mississippi detected amphibians using 15 of 20 WRP newly restored sites sampled, detecting 12 of 14 potential species for the region (S. L. King, U.S. Geological Survey Louisiana Cooperative Fish and Wildlife Research Unit, unpublished data).
Uyehara (2005) investigated use of WRP wetlands and other wetlands by
WRP has been a major tool for restoring wetlands for migratory birds in California’s Central Valley. A diversity of microtopographic conditions provides both open water and emergent vegetation.(Alan Forkey, NRCS)

Fish and Wildlife Benefi ts of Farm Bill Programs: 2000–2005 Update 139
the endangered Hawaiian duck (Anas wyvillianathe endangered Hawaiian duck (Anas wyvillianathe endangered Hawaiian duck ( ), or Koloa, in Hawaii. Among the 48 total wetlands examined, Koloa were observed more frequently at WRP wetlands than on non-WRP wetland sites (81% vs. 41%). Uyehara (2005) concluded that WRP wetlands served as functional habitat patches for Hawaiian ducks within a matrix of uplands and stream habitats. She also concluded that clustering WRP wetlands around existing wetlands used by Koloa provides additional habitat value.
While wetlands restored through WRP appear comparable to other wetlands in their use by a variety of wildlife, greater habitat value for some wildlife species or groups has been documented where active wetland habitat management is involved. For example, waterfowl densities were 2–4 times greater on managed than non-managed wetlands studied in New York (M. R. Kaminski and G. A. Baldassarre, State University of New York, unpublished data), implying the potential value of periodic draw-down to improve habitat quality for migrating and breeding waterbirds. Th is fi nding, as well as that of Hicks (2003), demonstrates the importance of proper management of restored wetlands to achieving maximum wildlife benefi ts.
Knowledge GapsMany studies have been conducted that document local fi sh and wildlife response to various restored and created wetlands, primarily through documentation of habitat use (Rewa 2000b). Few of these studies document the eff ects of wetland restoration on species populations or how local restoration actions aff ect overall landscape functions. At the same time, threats to remaining wetlands are expected to increase in the coming century, presenting greater challenges for waterbirds and other wetland-dependent wildlife (O’Connell 2000, Higgins et al. 2002).
Wetland-restoration programs such as WRP are being looked upon as a means to help restore previously lost habitats for fi sh (Hussey 1994), waterfowl (Baxter et al. 1996), Neotropical migratory birds (Twedt and Uihlein 2005), and even some endangered species, such as the Louisiana black bear (Ursus americanus luteolus) (Guglielmino 2000). More than 1.6 million acres are currently enrolled in WRP. While the literature engenders confi dence in the assumption that these acres are providing functional habitats, quantitative measures of how these enrollments are aff ecting fi sh and wildlife populations beyond local observations of habitat use are lacking.
Wetland restoration actions begin the time-dependent process of recovering previously lost wetland function (Mitsch and Wilson 1996). Most wetlands enrolled in WRP are relatively young in their development

140 Wildlife Benefi ts of the WRP • Rewa
of the full suite of wetland habitat values expected to be realized over time. Little is known on how the additional habitat being provided by new WRP enrollments and successional progression of existing enrollments off sets ongoing loss and degradation of remaining wetland and upland habitats in agricultural landscapes.
As noted above, WRP has the unique potential to establish large complexes of restored wetlands in agricultural landscapes, in some cases, changing the local habitat matrix from agricultural cropland to wetland habitat. Th is has great potential to positively aff ect amphibians, area-sensitive forest birds, and other species that are vulnerable to fragmentation of natural habitats (Lehtinen et al. 1999; Twedt et al., in press). Large wetland complexes located strategically along migratory pathways may also directly aff ect survival, distribution, and reproduction capability of waterbirds, waterfowl, and other migratory birds (Beyersbergen et al. 2004). Better measures of how WRP wetland complexes aff ect these species and groups are needed.
Th e need for eff ective monitoring to evaluate the eff ectiveness of ecological restoration has been the topic of interest in recent years (Block et al. 2001). Integration of eff ective ecological monitoring measures into WRP program implementation would facilitate compilation of fi sh and wildlife use data on a broader scale. Combining these data with landscape variables and wildlife population trend data from other sources may present an opportunity to more eff ectively quantify the eff ects of WRP enrollments on population dynamics for some species.
Efforts to Document Wildlife Benefi tsTh e USDA is currently engaged in an eff ort to quantify the environmental benefi ts of its conservation program practices (Mausbach and Dedrick 2004). Th is eff ort, known as the Conservation Eff ects Assessment Project (CEAP), relies on the use of existing physical eff ects process models applied to a sample of cropland and Conservation Reserve Program fi eld sites throughout the country to estimate soil- and water-related benefi ts nationwide. Work plans to address fi sh and wildlife benefi ts of conservation programs and practices and to address other land uses (e.g., wetlands and grazing lands) are also being developed to complement the national CEAP assessment.
Th e approach under development to quantify the environmental benefi ts of wetland practices has the potential to improve our understanding of the wildlife benefi ts derived from WRP in the future. Much of the WRP enrollment occurs in several geographic regions—the Mississippi Alluvial Valley, the upper Midwest, and California’s Central Valley
Ephemeral wetlands at the Lake Valley WRP site in New Mexico provide breeding habitat for amphibians and other wildlife during summer monsoons and habitat for waterfowl during the winter.(Matilde Holzworth)

Fish and Wildlife Benefi ts of Farm Bill Programs: 2000–2005 Update 141
(Figure 1). In recognition of the distribution of WRP and other wetland restoration eff orts, a series of regional data collection and modeling eff orts are planned to estimate the wildlife habitat and other benefi ts obtained through wetland restoration (S. D. Eckles, NRCS, personal communication). Th ese eff orts are expected to produce quantitative estimates of conservation eff ects including response of some wildlife groups (e.g., amphibians and waterbirds) resulting from wetland restoration in various regions around the country. Output from this CEAP wetlands component is expected to produce predictive models capable of quantifying the contribution of WRP enrollments to sustaining select wildlife species populations in agricultural landscapes.
ConclusionsIn some areas with signifi cant enrollments, WRP is contributing to shifts in land-use patterns toward functional wetland ecosystems that occurred prior to conversion to agricultural use in the 20th century. Wetlands enrolled in WRP have great potential to provide valuable habitats to wetland-dependent and other fi sh and wildlife species on agricultural landscapes and beyond. While studies underway and recently completed are beginning to reveal the magnitude of this potential, most of the fi sh and wildlife–related benefi ts being generated by the more than 1.6 million acres enrolled in the program have yet to be quantifi ed. Additional work is needed to better understand how wetlands restored through the program contribute to fi sh and wildlife habitat use patterns and population trends.
Literature CitedBaxter, C. K., J. Leach, and C. Lively. 1996. Th e role of private lands in
implementing the North American Waterfowl Management Plan. Pages 241–249 in J. T. Ratti, editor. Proceedings of the seventh international symposium on waterfowl management, Memphis, Tennessee, USA.
Beyersbergen, G. W., N. D. Niemuth, and M. R. Norton. 2004. Northern prairie and parkland waterbird conservation plan. A plan associated with the Waterbird Conservation for the Americas initiative. Prairie Pothole Joint Venture, Denver, Colorado, USA.
Block, W. M., A. B. Franklin, J. P. Ward, Jr., J. L. Ganey, and G. C. White. 2001. Design and implementation of monitoring studies to evaluate the success of ecological restoration on wildlife. Restoration Ecology 9:293–303.
Blumenfeld, C. A. 2003. Evaluating the Wetlands Reserve Program in New York State: a survey of landowner wetland attitudes and their reasons for enrollment and withdrawal. Th esis, State University of New York, Syracuse, USA.

142 Wildlife Benefi ts of the WRP • Rewa
Brasher, M. G., and R. J. Gates. 2004. Value of private, restored wetlands as mid-migration habitat for waterfowl in Ohio. Proceedings of Th e Wildlife Society 11th annual conference, Alberta, Canada.
Brown, S. C. 1999. Vegetation similarity and avifaunal food value of restored and natural marshes in northern New York. Restoration Ecology 7:56–68.
———, and C. R. Smith. 1998. Breeding season bird use of recently restored versus natural wetlands in New York. Journal of Wildlife Management 62:1480–1491.
Despain, W. 1995. A summary of the SWCS Wetlands Reserve Program survey. Journal of Soil and Water Conservation 50:632–633.
Dodson, S. I., and R. A. Lillie. 2001. Zooplankton communities of restored depressional wetlands in Wisconsin, USA. Wetlands 21:292–300.
Galatowitsch, S. M., and A. G. van der Valk. 1996. Characteristics of recently restored wetlands in the Prairie Pothole Region. Wetlands 16:75–83.
Greeson, P. E., J. R. Clark, and J. E. Clark, editors. 1978. Wetland functions and values: the state of our understanding. American Water Resources Association, Minneapolis, Minnesota, USA.
Guggisberg, A. C. 1996. Nongame bird use of restored wetlands in Manitowoc County, Wisconsin. Wisconsin Department of Natural Resources, Madison, USA.
Guglielmino, J. E. 2000. Saving Teddy’s bear—sharp decrease in the number of black bears in the southeastern states as natural habitat has been destroyed. American Forests 105:36–39.
Harris, P. D. 2001. Bird community patterns of spring-seasonal and semi-permanent wetlands in the Sacramento Valley, California. Th esis, Oregon State University, Corvallis, USA.
Heard, L. P., A. W. Allen, L. B. Best, S. J. Brady, W. Burger, A. J. Esser, E. Hackett, D. H. Johnson, R. L. Pederson, R. E. Reynolds, C. Rewa, M. R. Ryan, R. T. Molleur, and P. Buck. 2000. A comprehensive review of Farm Bill contributions to wildlife conservation, 1985–2000. W. L. Hohman and D. J. Halloum, editors. U.S. Department of Agriculture, Natural Resources Conservation Service, Wildlife Habitat Management Institute, Technical Report USDA/NRCS/WHMI-2000.
Heck, B. A., and D. W. Arbour. 2001a. First nesting record for the common moorhen in McCurtain County, Oklahoma. Oklahoma Ornithological Society Bulletin 34:27.

Fish and Wildlife Benefi ts of Farm Bill Programs: 2000–2005 Update 143
———, and ———. 2001b. Wood stork invasion in McCurtain County, Oklahoma. Oklahoma Ornithological Society Bulletin 34:25–27.
Heimlich, R. E., K. D. Weibe, R. Claassen, D. Gadsby, and R. M. House. 1998. Wetlands and agriculture: private interests and public benefi ts. U.S. Department of Agriculture, Economic Research Service, Agricultural Economics Report No. 765.
Hicks, B. M. 2003. Habitat contribution and waterbird use of Wetland Reserve Program sites in the Cache River watershed, Illinois. Th esis, Southern Illinois University, Carbondale, USA.
Higgins, K. F., D. E. Naugle, and K. J. Forman. 2002. A case study of changing land use practices in the northern Great Plains, USA: an uncertain future for waterbird conservation. Waterbirds 25, Special Publication 2:42–50.
Hussey, S. L. 1994. Wetlands Reserve Program. Fisheries 19:42–43.
Kolka, R. K., E. A. Nelson, and C. C. Trettin. 2000. Conceptual assessment framework for forested wetland restoration: the Pen Branch experience. Ecological Engineering 15:S17–S21.
Langston, M. A., and D. M. Kent. 1997. Fish recruitment to a constructed wetland. Journal of Freshwater Ecology 12:123–129.
Lehtinen, R. M., and S. M. Galatowitsch. 2001. Colonization of restored wetlands by amphibians in Minnesota. American Midland Naturalist 145:388–396.
———, ———, and J. R. Tester. 1999. Consequences of habitat loss and fragmentation for wetland amphibian assemblages. Wetlands 19:1–12.
Mausbach, M. J., and A. R. Dedrick. 2004. Th e length we go: measuring environmental benefi ts of conservation practices. Journal of Soil and Water Conservation 59:97A–103A.
Mitsch, W. J., and R. F. Wilson. 1996. Improving the success of wetland creation and restoration with know-how, time, and self-design. Ecological Applications 6:77–83.
Myers, P. C. 1988. Implementing conservation provisions of the 1985 Farm Bill. Transactions of the North American Wildlife and Natural Resources Conference 53:5–9.
[NRC] National Research Council. 2001. Compensating for wetland losses under the Clean Water Act. National Academy Press, Washington, D.C., USA.

144 Wildlife Benefi ts of the WRP • Rewa
O’Connell, M. 2000. Th reats to waterbirds and wetlands: Implications for conservation, inventory and research. Wildfowl 51:1–15.
Petranka, J. W., C. A. Kennedy, and S. S. Murray. 2003. Response of amphibians to restoration of a southern Appalachian wetland: a long-term analysis of community dynamics. Wetlands 23:1030–1042.
Reaves, R. P., and M. R. Croteau-Hartman. 1994. Biological aspects of restored and created wetlands. Proceedings of the Indiana Academy of Science 103:179–194.
Rewa, C. 2000a. Biological responses to wetland restoration: Implications for wildlife habitat development through the Wetlands Reserve Program. Pages 95–116 in W. L. Hohman and D. J. Halloum, editors. A comprehensive review of Farm Bill contributions to wildlife conservation, 1985–2000. U.S. Department of Agriculture, Natural Resources Conservation Service, Wildlife Habitat Management Institute, Technical Report USDA/NRCS/WHMI-2000.
———. 2000b. Wildlife response to wetland restoration and creation: An annotated bibliography. Pages 135–149 in W. L. Hohman and D. J. Halloum, editors. A comprehensive review of Farm Bill contributions to wildlife conservation, 1985–2000. U.S. Department of Agriculture, Natural Resources Conservation Service, Wildlife Habitat Management Institute, Technical Report USDA/NRCS/WHMI-2000.
Sleggs, S. E. 1997. Wildlife and vegetation response to wetland restoration in the Montezuma Marsh Complex of central New York. Th esis, State University of New York, Syracuse, USA.
Stevens, C. E., T. S. Gabor, and A. W. Diamond. 2003. Use of restored small wetlands by breeding waterfowl in Prince Edward Island, Canada. Restoration Ecology 11:3–12.
Twedt, D. J., and C. Best. 2004. Restoration of fl oodplain forests for the conservation of migratory birds. Ecological Restoration 22:194–203.
———, and W. B. Uihlein, III. 2005. Landscape level reforestation priorities for forest breeding landbirds in the Mississippi Alluvial Valley. Pages 321–340 in L. H. Fredrickson, S. L. King, and R. M. Kaminski, editors. Ecology and management of bottomland hardwood systems: the state of our understanding. Gaylord Memorial Laboratory Special Publication 10. University of Missouri-Columbia, Puxico, USA.
———, ———, and A. B. Elliot. In press. Habitat restoration for forest bird conservation: a spatially explicit decision support model. Conservation Biology.

Fish and Wildlife Benefi ts of Farm Bill Programs: 2000–2005 Update 145
———, R. R. Wilson, J. L. Henne-Kerr, and D. A. Grosshuesch. 2002. Avian response to bottomland hardwood reforestation: the fi rst 10 years. Restoration Ecology 10:645–655.
Uyehara, K. J. 2005. Wetland features that infl uence occupancy by endangered Hawaiian duck on the Island of Hawaii. Th esis, Bard College, Annandale-On-Hudson, New York, USA.

Fish and Wildlife Benefi ts of Farm Bill Programs: 2000–2005 Update 147
Th e Grassland Reserve Program: New Opportunities to Benefi t Grassland WildlifeFloyd WoodUSDA Natural Resources Conservation ServiceEasement Programs Division14th and Independence Avenue, SWRoom 5232-SWashington, D.C. 20250, [email protected]
Jim WilliamsUSDA Farm Service AgencyConservation and Environmental Programs Division14th and Independence Avenue, SWWashington, D.C. 20250-0016, [email protected]
AbstractTh e Grassland Reserve Program (GRP) was established by the 2002 Farm Bill to provide assistance to landowners in conserving and enhancing ecological value of grasslands while maintaining their suitability for grazing and other compatible uses. In response to long-term declines in grassland acreage and their associated benefi ts, approximately 524,000 acres have been enrolled since fi scal year 2003 in a variety of long-term rental agreements and easements. Th e program has proven popular with landowners. Whereas wildlife benefi ts have likely accrued by protection, enhancement, and restoration of grasslands enrolled, little eff ort has been made to quantify wildlife response during the fi rst 2 years of program operation. Additional studies are needed to document wildlife benefi ts achieved.
IntroductionHistorically, grasslands and shrublands occupied approximately 1 billion acres of the contiguous United States—about half the landmass. Roughly half of these lands have been converted to cropland, urban land, and other land uses. Non–federally owned grasslands in the U.S. (pastureland and rangeland) currently cover approximately 522 million acres (Natural Resources Conservation Service, 2002 National Resources Inventory). Grasslands provide both ecological and economic benefi ts to

148 GRP: New Opportunities to Benefi t Wildlife • Wood and Williams
local residents and society in general (Licht 1997). Grassland importance lies not only in the immense area covered, but also in the diversity of benefi ts they produce. Th ese lands provide water for urban and rural uses, livestock products, fl ood protection, wildlife habitat, and carbon sequestration services. Th ese lands also provide aesthetic value in the form of open space and are vital links in the enhancement of rural social stability and economic vigor, as well as being part of the nation’s history.
Grassland loss through conversion to other land uses such as cropland, parcels for home sites, invasion of woody or nonnative species, and urban and exurban development threatens grassland resources (Knight et al. 2002). Between 1982 and 2002, non-federal acreage devoted to grazing uses (rangeland, pastureland, and grazed forest land) declined from 611 million acres in 1982 to 578 million acres in 2002, a decrease of over 5%. Between 1992 and 2002, the net decline in grazing land acreage was about 3% (Natural Resources Conservation Service, 2002 National Resources Inventory). Today, grasslands are considered North America’s most endangered ecosystem (Noss et al. 1995, Samson and Knopf 1996).
Program DescriptionIn recognition of the importance of grasslands and the threats they face, the Grassland Reserve Program (GRP) was created by the Farm Security and Rural Investment Act of 2002 (i.e., 2002 Farm Bill). Th e GRP is a voluntary program that helps landowners and operators restore and protect grassland, including rangeland, pastureland, and certain other lands, while maintaining the lands’ suitability for grazing. Th e GRP is a voluntary program with the goal of conserving, enhancing, and restoring eligible land through easement purchases and rental agreements with landowners. As required by statute, emphasis is on supporting grazing operations, plant and animal biodiversity, and grassland and land containing shrubs or forbs under the greatest threat of conversion. Th e following privately owned or tribal lands are eligible for enrollment:
■ Grasslands (including lands on which the vegetation is dominated by grasses, grass-like plants, shrubs, and forbs, encompassing rangeland and pastureland).
■ Land located in an area historically dominated by grassland, forbs, or shrubland, with potential to serve as habitat for ecologically signifi cant animal or plant populations, if retained in its current use or restored to a natural condition.
■ Incidental land contributing to properly confi guring boundaries, allowing effi cient management of the area for easement purposes and otherwise promoting and enhancing GRP objectives. Parcels of less than 40 contiguous acres are generally ineligible, but may be accepted
Urban sprawl threatens shortgrass prairie in Colorado. (J. Vanuga, USDA-NRCS)

Fish and Wildlife Benefi ts of Farm Bill Programs: 2000–2005 Update 149
where program objectives are met and there are opportunities to protect sites with unique grassland attributes.
Participants have the opportunity to enroll acreage in rental agreements with durations of 10, 15, 20, or 30 years, or long-term or permanent easements. Under both easements and rental agreements, participants have the opportunity to utilize common grazing-management practices to maintain the viability of the grassland acreage. Landowners retain ownership and associated responsibilities, including property taxes, and are required to follow a conservation plan on all acres enrolled in the program.
Technical and fi nancial assistance is provided to restore the natural grassland functions and values. No acreage limit is placed on total enrollment, but a maximum of 2 million acres may be enrolled for the purpose of grassland restoration. Program payments are determined as follows:
■ For permanent easements, the fair market value of the land less the grazing value of the land encumbered by the easement.
■ For 30-year easements or easements for the maximum duration allowed under applicable state law, 30% of the fair market value of the land less the grazing value of the land.
■ For rental agreements, annual payments not to exceed 75% of the annual grazing value.
■ For previously cultivated land, cost-share payments of up to 75% of the cost of grassland restoration is provided. For land that has never been cultivated, restoration cost-share rate may be up to 90%.
Th e program is jointly administered by the Natural Resources Conservation Service (NRCS) and the Farm Service Agency (FSA). Th e NRCS has lead responsibility on technical issues and easement administration, and the FSA has lead responsibility for rental agreement administration and fi nancial activities. Th e program operates under a continuous signup process. Th e NRCS and FSA, working in consultation with state technical committees, use state-developed ranking criteria to ensure GRP funds are directed toward the most appropriate projects for the local area. Additional information on the specifi cs of program operation is provided at <http://www.nrcs.usda.gov/programs/GRP/>.
Program Funding and EnrollmentTh e 2002 Farm Bill authorized $254 million to be spent on GRP over fi scal years 2003–2007. Under this authorization, approximately $169 million of fi nancial assistance has been made available for GRP during fi scal year (FY) 2003, FY 2004, and FY 2005. Th ese funds have supported

150 GRP: New Opportunities to Benefi t Wildlife • Wood and Williams
enrollment of approximately 524,000 acres during the fi rst 2 years of program operation (Table 1). Th e program is operational in all 50 states. However, much of the acreage enrolled is encompassed by large contracts on central and western rangelands, whereas a large number of smaller contracts are scattered throughout the country (Figure 1). Contrasting FY 2004 enrollment activity in Georgia and Montana illustrates this point, where 8,966 acres in 57 contracts were enrolled in Georgia and 10,353 acres in just 3 contracts were enrolled in Montana.
Interest in the program has far outpaced the funding available—the number of applications received in FY 2004 was approximately 10 times the number accepted (Table 1). Th e vast number of applications received has enabled the agencies to select high-quality applications, resulting in nearly 75% of acres enrolled targeted toward benefi ting declining species (Table 1).
Wildlife Benefi tsBecause FY 2003 was the fi rst year of GRP implementation, eff orts to evaluate wildlife response to program enrollments since then have been minimal. We found no published wildlife studies specifi cally related to
Figure 1. Distribution of number of acres and contracts enrolled in the Grassland Reserve Program during fi scal year (FY) 2004.
Enrollment activity FY 2003 FY 2004 Total
Number of participants enrolled 794 1,055 1,849
Acres enrolled 240,965 283,338 524,303
Acres enrolled consisting of native grassland, rangeland, and shrubland permanently protected through GRP conservation easements
60,341 78,218 138,559
Acres protected to benefi t declining species 134,098 255,000 389,098
Number of unfunded applications 9,091
Acres associated with unfunded applications 6,241,587
Unmet funding need associated with unfunded applications $1,498 million
Table 1. Grassland Reserve Program (GRP) enrollment activity during fi scal year (FY) 2003–2004.

Fish and Wildlife Benefi ts of Farm Bill Programs: 2000–2005 Update 151
lands enrolled in the GRP. However, observations can be made regarding the potential for GRP to provide signifi cant benefi ts to some species and species groups being targeted by program implementation.
By prioritizing enrollment acceptance to lands with the greatest biodiversity and where the threat of conversion to other land uses is greatest, GRP is maximizing the benefi ts to wildlife species that depend on these lands for survival. Th e program is being implemented to target declining species and has made substantial progress in protecting existing native grassland communities. Th rough FY 2004, over 138,000 acres of natural grassland systems have been protected by permanent easements. With proper management, these lands are ensured of providing long-term wildlife habitat and other ecological benefi ts. Although GRP enrollments potentially benefi t a wide array of grassland-associated wildlife, several examples of species benefi ted are worth noting here.
Sage-grouseTh e greater sage-grouse (Centrocercus urophasianus) is a native upland game bird that is considered a sagebrush ecosystem–obligate species of the Intermountain West. Sage-grouse populations have declined steadily across much of its range since European settlement (Connelly et al. 2000). Habitat degradation through altered fi re regimes, fragmentation, land-use conversion, and introduction of exotic invasive species has contributed to this decline (Connelly et al. 2004). In FY 2004, USDA provided $2 million in additional GRP fi nancial assistance to 4 western states for greater sage-grouse conservation and recovery on lands identifi ed by state wildlife agencies as containing critical sage-grouse habitat. Th e funds are being used for enrollment of GRP easements on private lands in Colorado, Idaho, Utah, and Washington, with technical assistance and additional fi nancial assistance provided through state and local partnerships. Improving the habitat quality through manipulating vegetation to increase the amount of forbs available for brood habitat (Wirth and Pyke 2003) and reducing the amount of separation between summer and winter habitats are important elements of GRP activity to benefi t sage-grouse.
Grassland BirdsAs a group, North American grassland breeding bird populations have declined signifi cantly in recent decades (Sauer et al. 2004). Loss of grasslands on the breeding grounds and habitat fragmentation are considered among the causes most responsible for these declines (Burger et al. 1994, Vickery at al. 1999, Herkert et al. 2003). Eff orts to restore degraded grassland habitats and reestablish previously converted grasslands have been shown to benefi t grassland birds and may have

152 GRP: New Opportunities to Benefi t Wildlife • Wood and Williams
the potential to help stem population declines. For example, Fletcher and Koford (2002) found bird communities in restored grasslands in Iowa to be similar to those in natural grassland habitats. Grassland Reserve Program enrollments have the potential to benefi t grassland birds by restoring local habitat quality and reducing the eff ects of habitat fragmentation on prairie landscapes. Species benefi ted include Neotropical migratory song birds as well and non-migrating birds such as prairie-chickens (Tympanuchus spp.) and northern bobwhites (Colinus virginianus).
Big Game CorridorsLands enrolled in GRP are also preventing fragmentation of critical migration habitat corridors for elk (Cervus elaphus), mule deer (Odocoileus hemionus), and pronghorn antelope (Antilocapra americana).
Knowledge GapsNative grasslands vary widely in their quality and characteristics. Grasslands can range from virgin prairie to heavily grazed native rangeland to pasture lands dominated by introduced forage species. Identifying and selecting ecologically signifi cant and unique grasslands would maximize the GRP’s ability to secure many of the environmental benefi ts grasslands provide. At this point, the vegetation composition and wildlife populations of GRP lands have not been adequately studied to characterize wildlife benefi ts realized.
Additional questions remain regarding how GRP enrollments infl uence overall land use at landscape scales. Specifi cally, we do not know whether the benefi ts obtained by GRP enrollments are off set by conversion of other grasslands to other uses.
ConclusionsTh e GRP off ers the opportunity to protect and restore up to 2 million acres of grasslands, many of which will be on existing native grasslands. While quantitative data that describe wildlife response are lacking, GRP has the potential to provide substantial benefi ts to declining species associated with grassland ecosystems in the United States. Additional studies are needed to enable program managers and participants to understand and maximize wildlife benefi ts derived from GRP enrollments.
Literature CitedBurger, L. D., L. W. Burger, Jr., and J. Faaborg. 1994. Eff ects of prairie
fragmentation on predation of artifi cial nests. Journal of Wildlife Management 58:249–254.
Pronghorn antelope in shortgrass prairie. (G. Kramer, USDA-NRCS)

Fish and Wildlife Benefi ts of Farm Bill Programs: 2000–2005 Update 153
Connelly, J. W., S. T. Knick, M. A. Schroeder, and S. J. Stiver. 2004. Conservation assessment of greater sage-grouse and sagebrush habitats. Unpublished report. Western Association of Fish and Wildlife Agencies, Cheyenne, Wyoming, USA.
———, M. A. Schroeder, A. R. Sands, and C. E. Braun. 2000. Guidelines to manage sage grouse populations and their habitats. Wildlife Society Bulletin 28:967–985.
Fletcher, R. J., Jr., and R. R. Koford. 2002. Habitat and landscape associations of breeding birds in native and restored grasslands. Journal of Wildlife Management 66:1011–1022.
Knight, R. L., W. C. Gilgert, and E. Marston, editors. 2002. Ranching west of the 100th Meridian: culture, ecology and economics. Island Press, Chicago, Illinois, USA.
Licht, D. S. 1997. Ecology and economics of the Great Plains. University of Nebraska Press, Lincoln, USA.
Herkert, J. R., D. L. Reinking, D. A. Wiedenfeld, M. Winter, J. L. Zimmerman, W. E. Jensen, E. J. Finck, R. R. Koford, D. H. Wolfe, S. K. Sherrod, M. A. Jenkins, J. Faaborg, and S. K. Robinson. 2003. Eff ects of prairie fragmentation on nest success of breeding birds in the midcontinental United States. Conservation Biology 17:587–594.
Noss, R., E. T. LaRoe, and J. M. Scott. 1995. Endangered ecosystems of the United States: a preliminary assessment of loss and degradation. Report 0611-R-01. U.S. Department of Interior, National Biological Service, Washington, D.C., USA.
Samson, F. B., and F. L. Knopf, editors. 1996. Prairie conservation: preserving North America’s most endangered ecosystem. Island Press, Washington, D.C., USA.
Sauer, J. R., J. E. Hines, and J. Fallon. 2004. The North American Breeding Bird Survey, results and analysis 1966–2003. Version 2004.1. U.S. Geological Survey Patuxent Wildlife Research Center, Laurel, Maryland, USA.
Vickery, P. D., P. L. Tubaro, J. M. C. daSilva, B. G. Peterjohn, J. R. Herkert, and R. B. Cavalcanti. 1999. Conservation of grassland birds in the Western Hemisphere. Studies in Avian Biology 19:2–26.
Wirth, T. A., and D. A. Pyke. 2003. Restoring forbs for sage grouse habitat: fi re, microsites, and establishment methods. Restoration Ecology 11:370–377.