Continued improvement in customer metrics driving … Group Limited ABN 88 000 014 675 1 23 February...
25
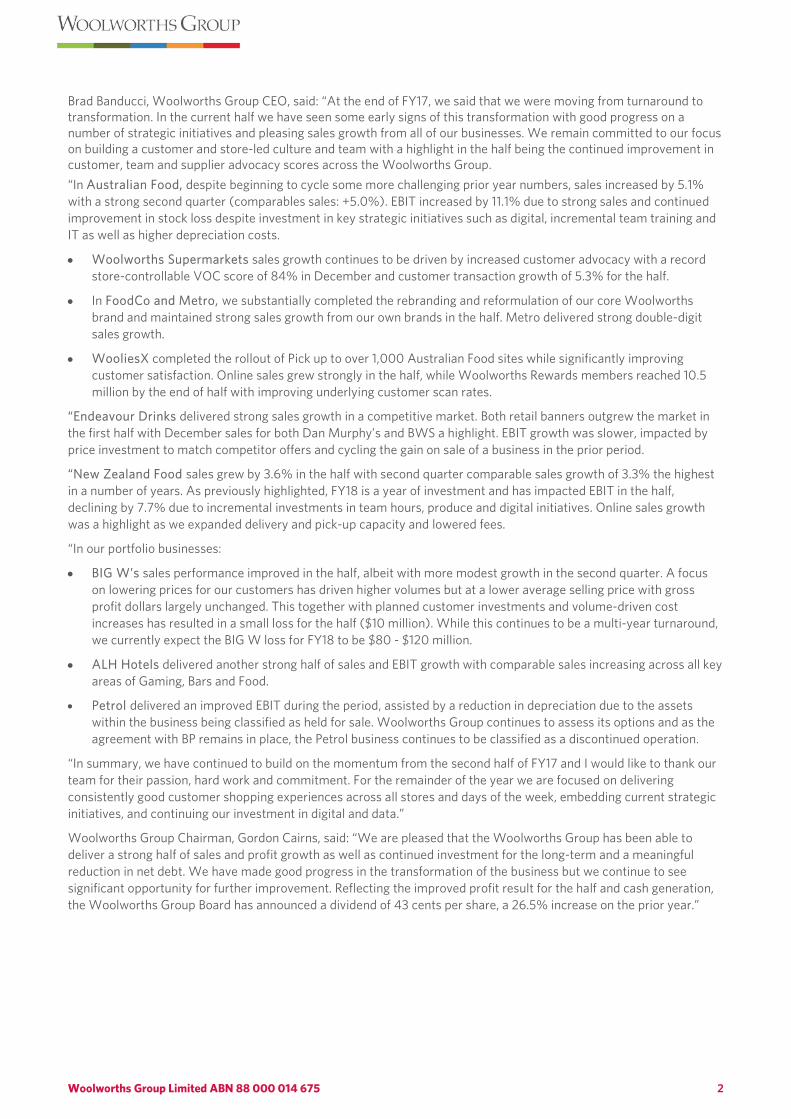
Woolworths Group Limited ABN 88 000 014 675 1 23 February 2018 HALF-YEAR PROFIT AND DIVIDEND ANNOUNCEMENT FOR THE 27 WEEKS ENDED 31 DECEMBER 2017 Continued improvement in customer metrics driving EBIT and NPAT growth Solid sales improvement across the Group with Australian Food comparable sales up 4.9% in the half EBIT from continuing operations of $1,430 million, up 9.9%, Australian Food EBIT up 11.1% NPAT from continuing operations of $902 million, up 14.7% Group NPAT of $969 million, up 37.6% Dividend per share of 43c, up 26.5% Solid progress on key priorities: • Voice of Customer (VOC) scores continue to improve across the Group with December store-controllable VOC of 84% in Woolworths Supermarkets, up from 80% in the prior year • New format renewal store launched in Marrickville Metro with a number of exciting innovations. 37 Renewals and 35 Upgrades completed during the half • Strong sales growth from Dan Murphy’s and BWS in a competitive market and another strong half from ALH Hotels • BIG W performing in line with turnaround plan, but still a long way to go • Digital investments starting to land, with Pick up rolled out to over 1,000 Australian Food sites in the half and improvements in the online shopping and delivery experience More to do: • Delivering consistently good shopping experiences for all customers every time they shop in-store and online • Completing the rollout of 1Store and other technology upgrade programs to enable process and efficiency improvement in FY19 and beyond • Building on first half improvements in BIG W and improving stock flow disciplines • Accelerating investment in digital and data to better meet customers’ needs for convenient, connected and effortless shopping experiences • Reassessing options for Petrol while minimising disruption to customers and team HY18 KEY FINANCIAL HIGHLIGHTS $ MILLION HY18 (27 WEEKS) HY17 (27 WEEKS) CHANGE Continuing operations Sales 29,807 28,727 3.8% Earnings before interest and tax (EBIT) 1,430 1,301 9.9% NPAT attributable to equity holders of the parent entity 902 786 14.7% Basic earnings per share (EPS) – cents 69.7 61.3 13.7% Group NPAT attributable to equity holders of the parent entity 969 704 37.6% Dividend per share – cents 43 34 26.5% Certain comparatives have been reclassified to conform to the current period’s presentation to better reflect the nature of financial position and performance of the Group. Refer to Appendix Two for further information. Note: This announcement contains certain non-IFRS measures that Woolworths believes are relevant and appropriate to understanding its business. Refer to Appendix One for further information. Note: Ratios and percentage changes referenced throughout this document are calculated on unrounded figures.
Transcript of Continued improvement in customer metrics driving … Group Limited ABN 88 000 014 675 1 23 February...
Woolworths Group Limited ABN 88 000 014 675 1
23 February 2018
HALF-YEAR PROFIT AND DIVIDEND ANNOUNCEMENT FOR THE 27 WEEKS ENDED 31 DECEMBER 2017
Continued improvement in customer metrics driving EBIT and NPAT growth
Solid sales improvement across the Group with Australian Food comparable sales up 4.9% in the half
EBIT from continuing operations of $1,430 million, up 9.9%, Australian Food EBIT up 11.1%
NPAT from continuing operations of $902 million, up 14.7%
Group NPAT of $969 million, up 37.6%
Dividend per share of 43c, up 26.5%
Solid progress on key priorities: • Voice of Customer (VOC) scores continue to improve across the Group with December store-controllable
VOC of 84% in Woolworths Supermarkets, up from 80% in the prior year • New format renewal store launched in Marrickville Metro with a number of exciting innovations. 37 Renewals
and 35 Upgrades completed during the half • Strong sales growth from Dan Murphy’s and BWS in a competitive market and another strong half from ALH Hotels • BIG W performing in line with turnaround plan, but still a long way to go • Digital investments starting to land, with Pick up rolled out to over 1,000 Australian Food sites in the half and
improvements in the online shopping and delivery experience
More to do: • Delivering consistently good shopping experiences for all customers every time they shop in-store and online • Completing the rollout of 1Store and other technology upgrade programs to enable process and efficiency
improvement in FY19 and beyond • Building on first half improvements in BIG W and improving stock flow disciplines • Accelerating investment in digital and data to better meet customers’ needs for convenient, connected and
effortless shopping experiences • Reassessing options for Petrol while minimising disruption to customers and team
HY18 KEY FINANCIAL HIGHLIGHTS
$ MILLION HY18
(27 WEEKS) HY17
(27 WEEKS) CHANGE
Continuing operations Sales 29,807 28,727 3.8% Earnings before interest and tax (EBIT) 1,430 1,301 9.9% NPAT attributable to equity holders of the parent entity 902 786 14.7% Basic earnings per share (EPS) – cents 69.7 61.3 13.7% Group NPAT attributable to equity holders of the parent entity 969 704 37.6% Dividend per share – cents 43 34 26.5% Certain comparatives have been reclassified to conform to the current period’s presentation to better reflect the nature of financial position and performance of the Group. Refer to Appendix Two for further information.
Note: This announcement contains certain non-IFRS measures that Woolworths believes are relevant and appropriate to understanding its business. Refer to Appendix One for further information.
Note: Ratios and percentage changes referenced throughout this document are calculated on unrounded figures.
Woolworths Group Limited ABN 88 000 014 675 2
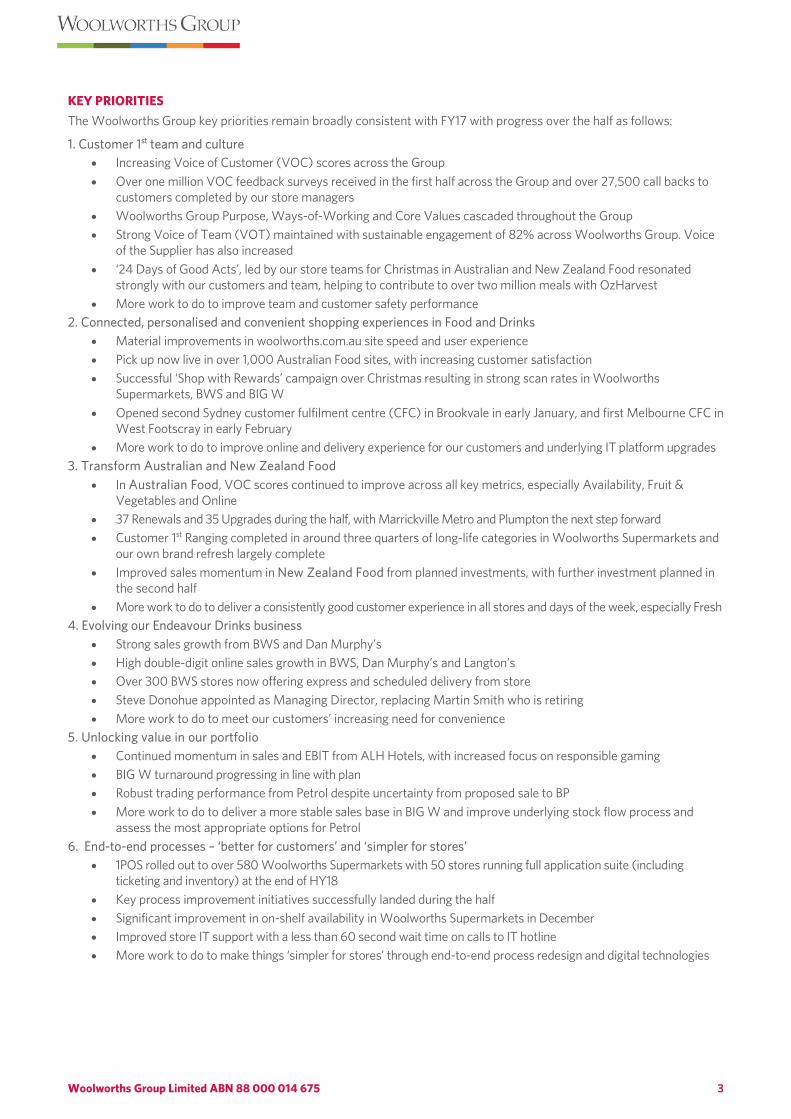
Brad Banducci, Woolworths Group CEO, said: “At the end of FY17, we said that we were moving from turnaround to transformation. In the current half we have seen some early signs of this transformation with good progress on a number of strategic initiatives and pleasing sales growth from all of our businesses. We remain committed to our focus on building a customer and store-led culture and team with a highlight in the half being the continued improvement in customer, team and supplier advocacy scores across the Woolworths Group. “In Australian Food, despite beginning to cycle some more challenging prior year numbers, sales increased by 5.1% with a strong second quarter (comparables sales: +5.0%). EBIT increased by 11.1% due to strong sales and continued improvement in stock loss despite investment in key strategic initiatives such as digital, incremental team training and IT as well as higher depreciation costs.
• Woolworths Supermarkets sales growth continues to be driven by increased customer advocacy with a record store-controllable VOC score of 84% in December and customer transaction growth of 5.3% for the half.
• In FoodCo and Metro, we substantially completed the rebranding and reformulation of our core Woolworths brand and maintained strong sales growth from our own brands in the half. Metro delivered strong double-digit sales growth.
• WooliesX completed the rollout of Pick up to over 1,000 Australian Food sites while significantly improving customer satisfaction. Online sales grew strongly in the half, while Woolworths Rewards members reached 10.5 million by the end of half with improving underlying customer scan rates.
“Endeavour Drinks delivered strong sales growth in a competitive market. Both retail banners outgrew the market in the first half with December sales for both Dan Murphy’s and BWS a highlight. EBIT growth was slower, impacted by price investment to match competitor offers and cycling the gain on sale of a business in the prior period.
“New Zealand Food sales grew by 3.6% in the half with second quarter comparable sales growth of 3.3% the highest in a number of years. As previously highlighted, FY18 is a year of investment and has impacted EBIT in the half, declining by 7.7% due to incremental investments in team hours, produce and digital initiatives. Online sales growth was a highlight as we expanded delivery and pick-up capacity and lowered fees.
“In our portfolio businesses:
• BIG W’s sales performance improved in the half, albeit with more modest growth in the second quarter. A focus on lowering prices for our customers has driven higher volumes but at a lower average selling price with gross profit dollars largely unchanged. This together with planned customer investments and volume-driven cost increases has resulted in a small loss for the half ($10 million). While this continues to be a multi-year turnaround, we currently expect the BIG W loss for FY18 to be $80 - $120 million.
• ALH Hotels delivered another strong half of sales and EBIT growth with comparable sales increasing across all key areas of Gaming, Bars and Food.
• Petrol delivered an improved EBIT during the period, assisted by a reduction in depreciation due to the assets within the business being classified as held for sale. Woolworths Group continues to assess its options and as the agreement with BP remains in place, the Petrol business continues to be classified as a discontinued operation.
“In summary, we have continued to build on the momentum from the second half of FY17 and I would like to thank our team for their passion, hard work and commitment. For the remainder of the year we are focused on delivering consistently good customer shopping experiences across all stores and days of the week, embedding current strategic initiatives, and continuing our investment in digital and data.”
Woolworths Group Chairman, Gordon Cairns, said: “We are pleased that the Woolworths Group has been able to deliver a strong half of sales and profit growth as well as continued investment for the long-term and a meaningful reduction in net debt. We have made good progress in the transformation of the business but we continue to see significant opportunity for further improvement. Reflecting the improved profit result for the half and cash generation, the Woolworths Group Board has announced a dividend of 43 cents per share, a 26.5% increase on the prior year.”
Woolworths Group Limited ABN 88 000 014 675 3
KEY PRIORITIES The Woolworths Group key priorities remain broadly consistent with FY17 with progress over the half as follows:
1. Customer 1st team and culture • Increasing Voice of Customer (VOC) scores across the Group • Over one million VOC feedback surveys received in the first half across the Group and over 27,500 call backs to
customers completed by our store managers • Woolworths Group Purpose, Ways-of-Working and Core Values cascaded throughout the Group • Strong Voice of Team (VOT) maintained with sustainable engagement of 82% across Woolworths Group. Voice
of the Supplier has also increased • ‘24 Days of Good Acts’, led by our store teams for Christmas in Australian and New Zealand Food resonated
strongly with our customers and team, helping to contribute to over two million meals with OzHarvest • More work to do to improve team and customer safety performance
2. Connected, personalised and convenient shopping experiences in Food and Drinks • Material improvements in woolworths.com.au site speed and user experience • Pick up now live in over 1,000 Australian Food sites, with increasing customer satisfaction • Successful ‘Shop with Rewards’ campaign over Christmas resulting in strong scan rates in Woolworths
Supermarkets, BWS and BIG W • Opened second Sydney customer fulfilment centre (CFC) in Brookvale in early January, and first Melbourne CFC in
West Footscray in early February • More work to do to improve online and delivery experience for our customers and underlying IT platform upgrades
3. Transform Australian and New Zealand Food • In Australian Food, VOC scores continued to improve across all key metrics, especially Availability, Fruit &
Vegetables and Online • 37 Renewals and 35 Upgrades during the half, with Marrickville Metro and Plumpton the next step forward • Customer 1st Ranging completed in around three quarters of long-life categories in Woolworths Supermarkets and
our own brand refresh largely complete • Improved sales momentum in New Zealand Food from planned investments, with further investment planned in
the second half • More work to do to deliver a consistently good customer experience in all stores and days of the week, especially Fresh
4. Evolving our Endeavour Drinks business • Strong sales growth from BWS and Dan Murphy’s • High double-digit online sales growth in BWS, Dan Murphy’s and Langton’s • Over 300 BWS stores now offering express and scheduled delivery from store • Steve Donohue appointed as Managing Director, replacing Martin Smith who is retiring • More work to do to meet our customers’ increasing need for convenience
5. Unlocking value in our portfolio • Continued momentum in sales and EBIT from ALH Hotels, with increased focus on responsible gaming • BIG W turnaround progressing in line with plan • Robust trading performance from Petrol despite uncertainty from proposed sale to BP • More work to do to deliver a more stable sales base in BIG W and improve underlying stock flow process and
assess the most appropriate options for Petrol 6. End-to-end processes – ‘better for customers’ and ‘simpler for stores’
• 1POS rolled out to over 580 Woolworths Supermarkets with 50 stores running full application suite (including ticketing and inventory) at the end of HY18
• Key process improvement initiatives successfully landed during the half • Significant improvement in on-shelf availability in Woolworths Supermarkets in December • Improved store IT support with a less than 60 second wait time on calls to IT hotline • More work to do to make things ‘simpler for stores’ through end-to-end process redesign and digital technologies
Woolworths Group Limited ABN 88 000 014 675 4
GROUP PROFIT OR LOSS FOR THE 27 WEEKS ENDED 31 DECEMBER 2017
$ MILLION HY18
(27 WEEKS) HY17
(27 WEEKS) CHANGE
Continuing operations
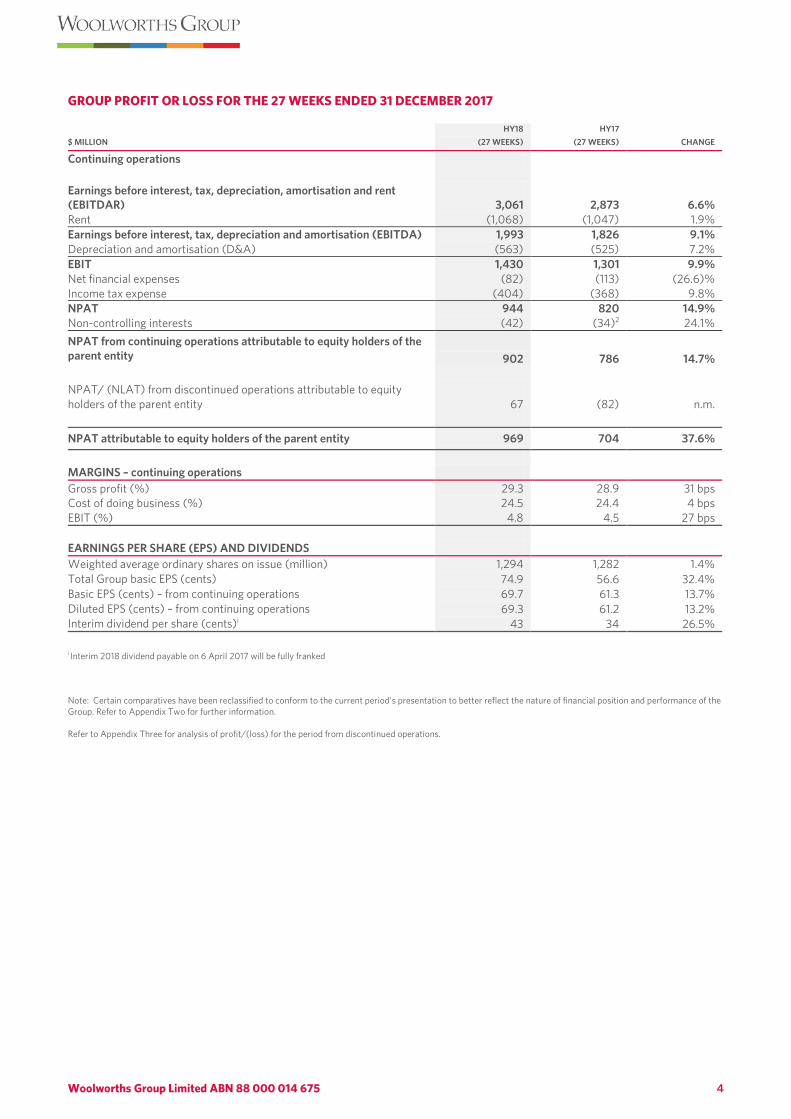
Earnings before interest, tax, depreciation, amortisation and rent (EBITDAR) 3,061 2,873 6.6% Rent (1,068) (1,047) 1.9% Earnings before interest, tax, depreciation and amortisation (EBITDA) 1,993 1,826 9.1% Depreciation and amortisation (D&A) (563) (525) 7.2% EBIT 1,430 1,301 9.9% Net financial expenses (82) (113) (26.6)% Income tax expense (404) (368) 9.8% NPAT 944 820 14.9% Non-controlling interests (42) (34)2 24.1% NPAT from continuing operations attributable to equity holders of the parent entity 902 786 14.7%
NPAT/ (NLAT) from discontinued operations attributable to equity holders of the parent entity 67 (82) n.m.
NPAT attributable to equity holders of the parent entity 969 704 37.6%
MARGINS – continuing operations Gross profit (%) 29.3 28.9 31 bps Cost of doing business (%) 24.5 24.4 4 bps EBIT (%) 4.8 4.5 27 bps EARNINGS PER SHARE (EPS) AND DIVIDENDS Weighted average ordinary shares on issue (million) 1,294 1,282 1.4% Total Group basic EPS (cents) 74.9 56.6 32.4% Basic EPS (cents) – from continuing operations 69.7 61.3 13.7% Diluted EPS (cents) – from continuing operations 69.3 61.2 13.2% Interim dividend per share (cents)i 43 34 26.5% i Interim 2018 dividend payable on 6 April 2017 will be fully franked
Note: Certain comparatives have been reclassified to conform to the current period’s presentation to better reflect the nature of financial position and performance of the Group. Refer to Appendix Two for further information. Refer to Appendix Three for analysis of profit/(loss) for the period from discontinued operations.
Woolworths Group Limited ABN 88 000 014 675 5
SALES SUMMARY – HY18
$ MILLION HY18
(27 WEEKS) HY17
(27 WEEKS) CHANGE
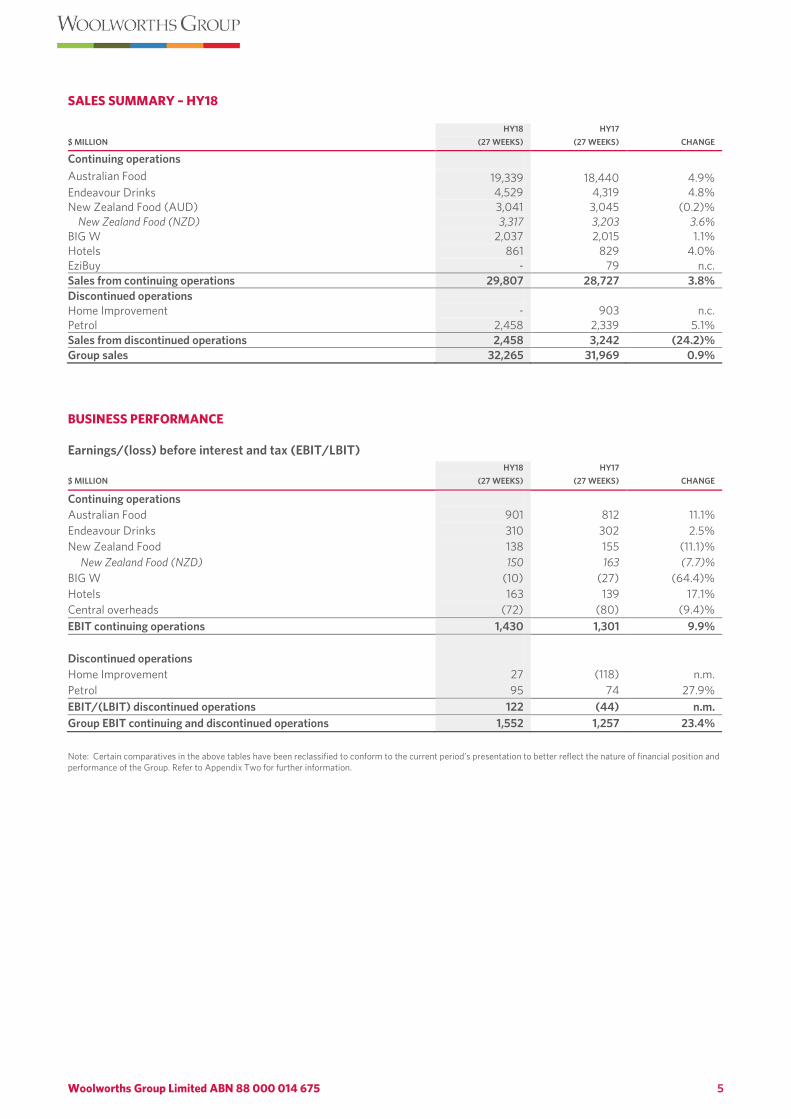
Continuing operations Australian Food 19,339 18,440 4.9% Endeavour Drinks 4,529 4,319 4.8% New Zealand Food (AUD) 3,041 3,045 (0.2)% New Zealand Food (NZD) 3,317 3,203 3.6% BIG W 2,037 2,015 1.1% Hotels 861 829 4.0% EziBuy - 79 n.c. Sales from continuing operations 29,807 28,727 3.8% Discontinued operations Home Improvement - 903 n.c. Petrol 2,458 2,339 5.1% Sales from discontinued operations 2,458 3,242 (24.2)% Group sales 32,265 31,969 0.9%
BUSINESS PERFORMANCE
Earnings/(loss) before interest and tax (EBIT/LBIT)
$ MILLION HY18
(27 WEEKS) HY17
(27 WEEKS) CHANGE
Continuing operations Australian Food 901 812 11.1% Endeavour Drinks 310 302 2.5% New Zealand Food 138 155 (11.1)% New Zealand Food (NZD) 150 163 (7.7)% BIG W (10) (27) (64.4)% Hotels 163 139 17.1% Central overheads (72) (80) (9.4)% EBIT continuing operations 1,430 1,301 9.9% Discontinued operations Home Improvement 27 (118) n.m. Petrol 95 74 27.9% EBIT/(LBIT) discontinued operations 122 (44) n.m. Group EBIT continuing and discontinued operations 1,552 1,257 23.4%
Note: Certain comparatives in the above tables have been reclassified to conform to the current period’s presentation to better reflect the nature of financial position and performance of the Group. Refer to Appendix Two for further information.
Woolworths Group Limited ABN 88 000 014 675 6
GROUP TRADING PERFORMANCE
Sales from continuing operations were $29,807 million, an increase of 3.8% in HY18. Growth of 4.9% and 4.8% respectively in Australian Food and Endeavour Drinks were the major drivers, however, all businesses reported positive sales growth during the half.
December sales benefitted from a shift in the retail calendar. The HY18 reporting period ended on 31 December as compared to HY17 that ended on 1 January. As a result, HY18 included a normal trading day as compared to HY17 that included the smaller New Year’s trading day. HY18 sales by quarter are provided in Appendix Four.
Gross profit from continuing operations as a percentage of sales increased 31 bps on the prior year to 29.3% driven primarily by change in business mix and the improvement in stock loss in Australian Food.
Cost of doing business from continuing operations (CODB) as a percentage of sales increased 4 bps on the prior year to 24.5% primarily due to increased investment in Australian Food, New Zealand Food and BIG W into customer experience and digital.
EBIT from continuing operations increased 9.9% on the prior year to $1,430 million.
Net financing costs decreased 26.6% on the prior year due to lower average debt.
NPAT attributable to equity holders of the parent entity from continuing operations increased by 14.7% on the prior year to $902 million, with corresponding EPS up 13.7% to 69.7 cents.
On a statutory basis, the NPAT attributable to equity holders of the parent entity was $969 million. The corresponding EPS was 74.9 cents compared to EPS of 56.6 cents in HY17, an increase of 32.4% on the prior year.
Woolworths Group Limited ABN 88 000 014 675 7
AUSTRALIAN FOOD
$ MILLION HY18
(27 WEEKS) HY17
(27 WEEKS) CHANGE
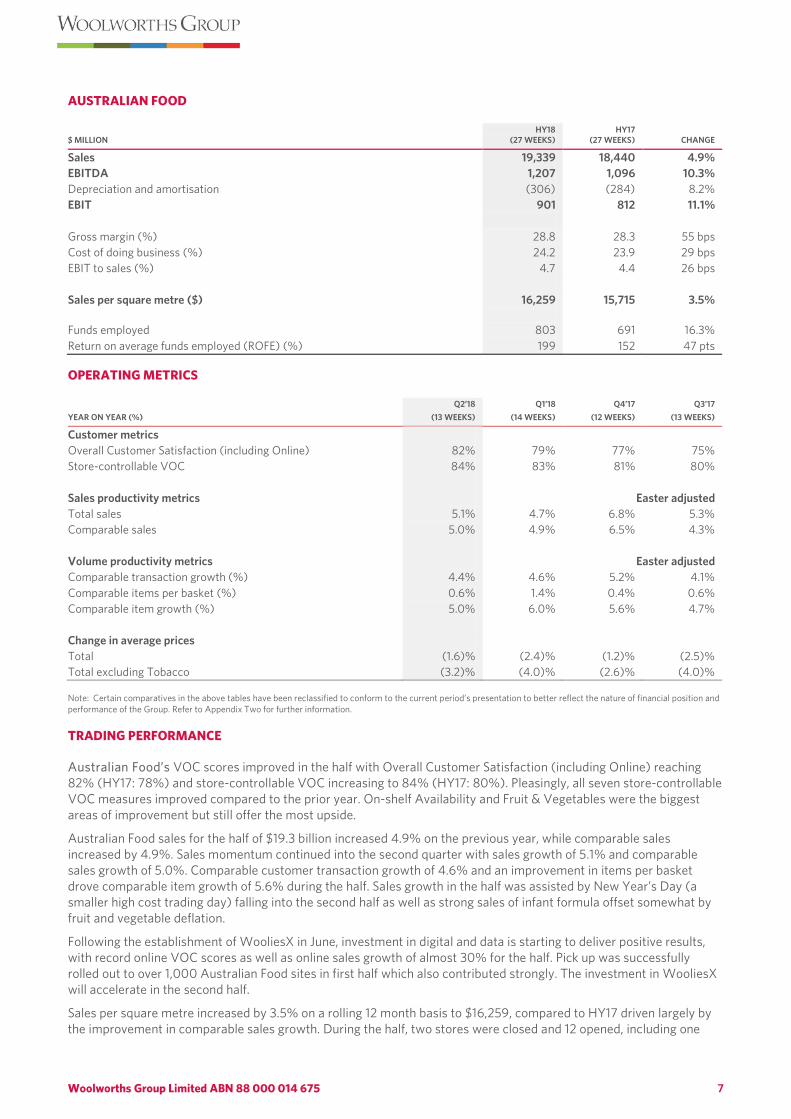
Sales 19,339 18,440 4.9% EBITDA 1,207 1,096 10.3% Depreciation and amortisation (306) (284) 8.2% EBIT 901 812 11.1% Gross margin (%) 28.8 28.3 55 bps Cost of doing business (%) 24.2 23.9 29 bps EBIT to sales (%) 4.7 4.4 26 bps Sales per square metre ($) 16,259 15,715 3.5% Funds employed
803 691
16.3%
Return on average funds employed (ROFE) (%) 199 152 47 pts
OPERATING METRICS
YEAR ON YEAR (%) Q2’18
(13 WEEKS) Q1’18
(14 WEEKS) Q4’17
(12 WEEKS) Q3’17
(13 WEEKS)
Customer metrics Overall Customer Satisfaction (including Online) 82% 79% 77% 75% Store-controllable VOC 84% 83% 81% 80% Sales productivity metrics Easter adjusted Total sales 5.1% 4.7% 6.8% 5.3% Comparable sales 5.0% 4.9% 6.5% 4.3% Volume productivity metrics Easter adjusted Comparable transaction growth (%) 4.4% 4.6% 5.2% 4.1% Comparable items per basket (%) 0.6% 1.4% 0.4% 0.6% Comparable item growth (%) 5.0% 6.0% 5.6% 4.7% Change in average prices Total (1.6)% (2.4)% (1.2)% (2.5)% Total excluding Tobacco (3.2)% (4.0)% (2.6)% (4.0)% Note: Certain comparatives in the above tables have been reclassified to conform to the current period’s presentation to better reflect the nature of financial position and performance of the Group. Refer to Appendix Two for further information. TRADING PERFORMANCE
Australian Food’s VOC scores improved in the half with Overall Customer Satisfaction (including Online) reaching 82% (HY17: 78%) and store-controllable VOC increasing to 84% (HY17: 80%). Pleasingly, all seven store-controllable VOC measures improved compared to the prior year. On-shelf Availability and Fruit & Vegetables were the biggest areas of improvement but still offer the most upside.
Australian Food sales for the half of $19.3 billion increased 4.9% on the previous year, while comparable sales increased by 4.9%. Sales momentum continued into the second quarter with sales growth of 5.1% and comparable sales growth of 5.0%. Comparable customer transaction growth of 4.6% and an improvement in items per basket drove comparable item growth of 5.6% during the half. Sales growth in the half was assisted by New Year’s Day (a smaller high cost trading day) falling into the second half as well as strong sales of infant formula offset somewhat by fruit and vegetable deflation.
Following the establishment of WooliesX in June, investment in digital and data is starting to deliver positive results, with record online VOC scores as well as online sales growth of almost 30% for the half. Pick up was successfully rolled out to over 1,000 Australian Food sites in first half which also contributed strongly. The investment in WooliesX will accelerate in the second half.
Sales per square metre increased by 3.5% on a rolling 12 month basis to $16,259, compared to HY17 driven largely by the improvement in comparable sales growth. During the half, two stores were closed and 12 opened, including one
Woolworths Group Limited ABN 88 000 014 675 8
Metro. Three Thomas Dux stores were converted to Metros, ending the half with 1,008 Woolworths Supermarkets and Metro stores. Despite the store closures, average space growth for the year was 1.9% compared to HY17 due to timing of store openings and closures.
Average prices declined by 2.0% in HY18 as we continued to lower prices for customers with an improvement in price perception in the half. Average price deflation eased in the second quarter to 1.6% with fruit and vegetable deflation moderating despite remaining a material driver of overall average price deflation. There has been a continued focus to improve customers’ price perception through lowering shelf prices, with over 4,200 products on the Low Price Always or Prices Dropped programs at the half, an increase of around 700 compared to the end of FY17. Promotional intensity continued to decline with an 11% reduction in promotions compared to HY17.
Gross margin increased by 55 bps to 28.8%, primarily due to ongoing improvements in stock loss and improved product mix and promotional effectiveness offset somewhat by net investment in price. CODB as a percentage of sales increased by 29 bps due to investment in building digital and data through WooliesX, team hours in stores, particularly in Fresh and on weekends, and the IT Foundations and store Renewal programs which contributed to higher depreciation.
EBIT increased 11.1% to $901 million, a 4.7% EBIT margin for the half.
Funds employed increased by 16.3% due to higher investment in renewals, digital and the new Melbourne distribution centre. ROFE increased by 47pts with EBIT growth of 12.0% on a rolling 12 month basis and a reduction in average funds employed over the period due to working capital improvements.
Woolworths Group Limited ABN 88 000 014 675 9
ENDEAVOUR DRINKS
$ MILLION HY18
(27 WEEKS) HY17
(27 WEEKS) CHANGE
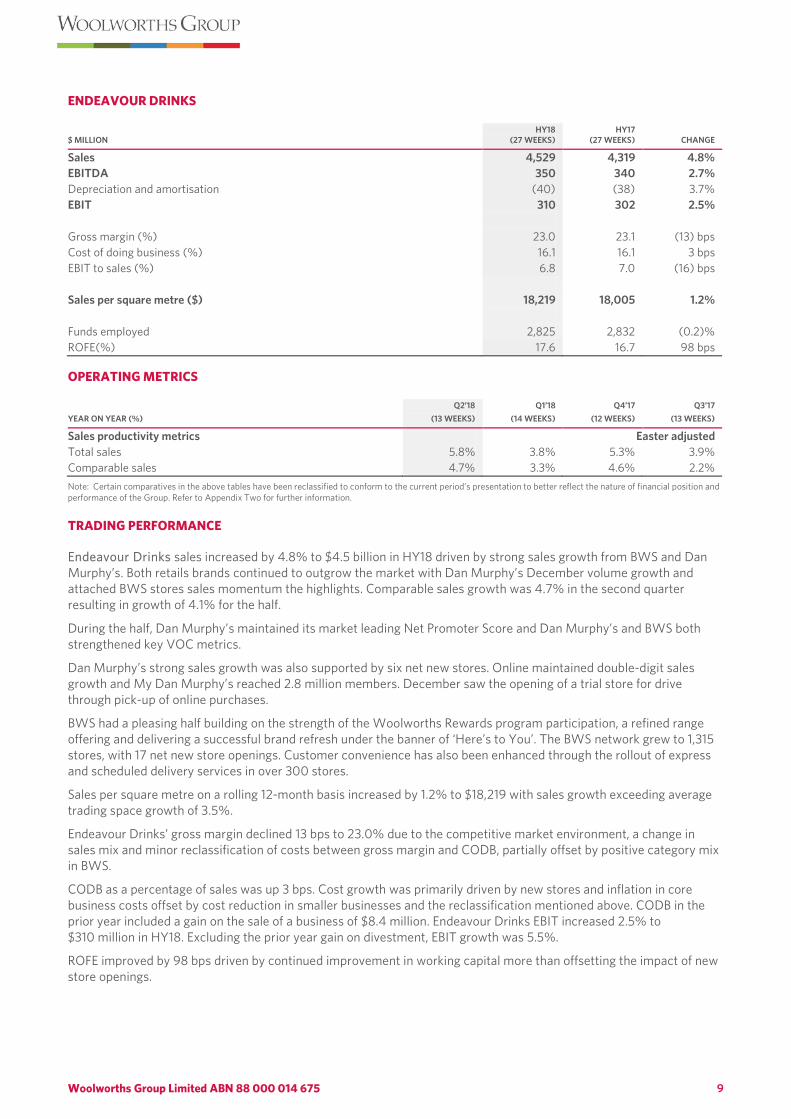
Sales 4,529 4,319 4.8% EBITDA 350 340 2.7% Depreciation and amortisation (40) (38) 3.7% EBIT 310 302 2.5% Gross margin (%) 23.0 23.1 (13) bps Cost of doing business (%) 16.1 16.1 3 bps EBIT to sales (%) 6.8 7.0 (16) bps Sales per square metre ($) 18,219 18,005 1.2% Funds employed 2,825 2,832 (0.2)% ROFE(%) 17.6 16.7 98 bps
OPERATING METRICS
YEAR ON YEAR (%) Q2’18
(13 WEEKS) Q1’18
(14 WEEKS) Q4’17
(12 WEEKS) Q3’17
(13 WEEKS)
Sales productivity metrics Easter adjusted Total sales 5.8% 3.8% 5.3% 3.9% Comparable sales 4.7% 3.3% 4.6% 2.2% Note: Certain comparatives in the above tables have been reclassified to conform to the current period’s presentation to better reflect the nature of financial position and performance of the Group. Refer to Appendix Two for further information. TRADING PERFORMANCE
Endeavour Drinks sales increased by 4.8% to $4.5 billion in HY18 driven by strong sales growth from BWS and Dan Murphy’s. Both retails brands continued to outgrow the market with Dan Murphy’s December volume growth and attached BWS stores sales momentum the highlights. Comparable sales growth was 4.7% in the second quarter resulting in growth of 4.1% for the half.
During the half, Dan Murphy’s maintained its market leading Net Promoter Score and Dan Murphy’s and BWS both strengthened key VOC metrics.
Dan Murphy’s strong sales growth was also supported by six net new stores. Online maintained double-digit sales growth and My Dan Murphy’s reached 2.8 million members. December saw the opening of a trial store for drive through pick-up of online purchases.
BWS had a pleasing half building on the strength of the Woolworths Rewards program participation, a refined range offering and delivering a successful brand refresh under the banner of ‘Here’s to You’. The BWS network grew to 1,315 stores, with 17 net new store openings. Customer convenience has also been enhanced through the rollout of express and scheduled delivery services in over 300 stores.
Sales per square metre on a rolling 12-month basis increased by 1.2% to $18,219 with sales growth exceeding average trading space growth of 3.5%.
Endeavour Drinks’ gross margin declined 13 bps to 23.0% due to the competitive market environment, a change in sales mix and minor reclassification of costs between gross margin and CODB, partially offset by positive category mix in BWS.
CODB as a percentage of sales was up 3 bps. Cost growth was primarily driven by new stores and inflation in core business costs offset by cost reduction in smaller businesses and the reclassification mentioned above. CODB in the prior year included a gain on the sale of a business of $8.4 million. Endeavour Drinks EBIT increased 2.5% to $310 million in HY18. Excluding the prior year gain on divestment, EBIT growth was 5.5%.
ROFE improved by 98 bps driven by continued improvement in working capital more than offsetting the impact of new store openings.
Woolworths Group Limited ABN 88 000 014 675 10
NEW ZEALAND FOOD1
NZ$ MILLION HY18
(27 WEEKS) HY17
(27 WEEKS) CHANGE
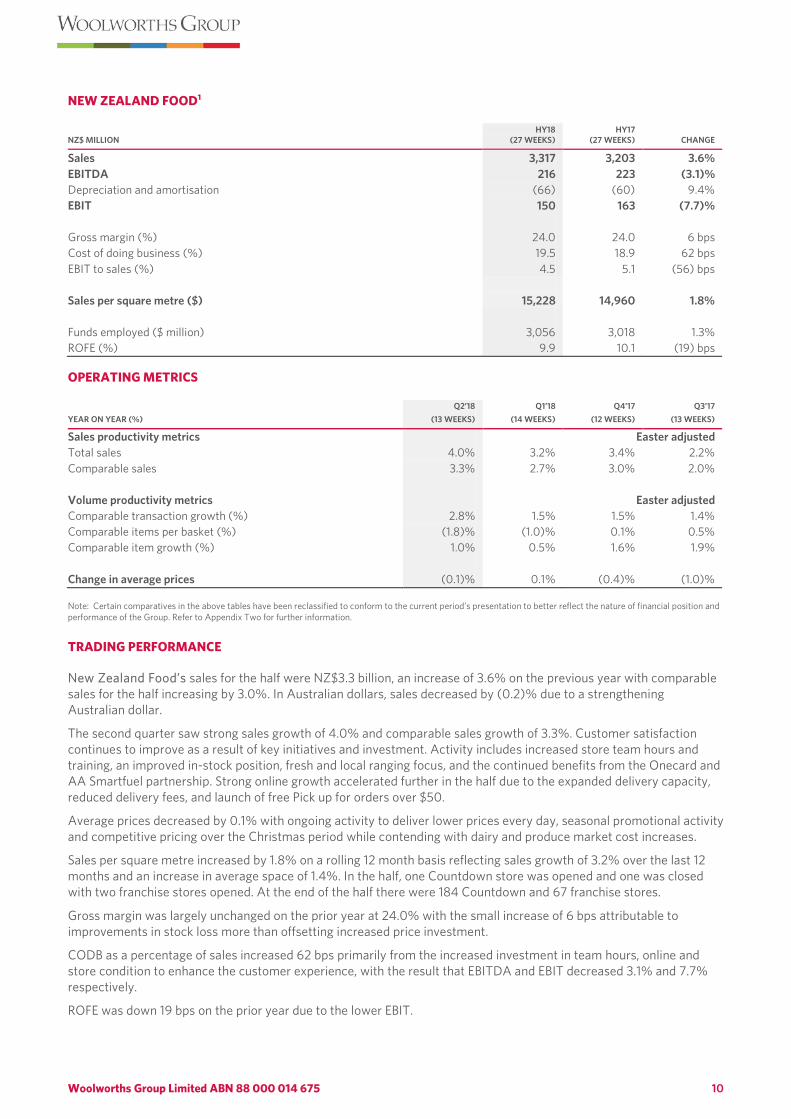
Sales 3,317 3,203 3.6% EBITDA 216 223 (3.1)% Depreciation and amortisation (66) (60) 9.4% EBIT 150 163 (7.7)% Gross margin (%) 24.0 24.0 6 bps Cost of doing business (%) 19.5 18.9 62 bps EBIT to sales (%) 4.5 5.1 (56) bps Sales per square metre ($) 15,228 14,960 1.8% Funds employed ($ million) 3,056 3,018 1.3% ROFE (%) 9.9 10.1 (19) bps
OPERATING METRICS
YEAR ON YEAR (%) Q2’18
(13 WEEKS) Q1’18
(14 WEEKS) Q4’17
(12 WEEKS) Q3’17
(13 WEEKS)
Sales productivity metrics Easter adjusted Total sales 4.0% 3.2% 3.4% 2.2% Comparable sales 3.3% 2.7% 3.0% 2.0% Volume productivity metrics Easter adjusted Comparable transaction growth (%) 2.8% 1.5% 1.5% 1.4% Comparable items per basket (%) (1.8)% (1.0)% 0.1% 0.5% Comparable item growth (%) 1.0% 0.5% 1.6% 1.9% Change in average prices (0.1)% 0.1% (0.4)% (1.0)% Note: Certain comparatives in the above tables have been reclassified to conform to the current period’s presentation to better reflect the nature of financial position and performance of the Group. Refer to Appendix Two for further information.
TRADING PERFORMANCE
New Zealand Food’s sales for the half were NZ$3.3 billion, an increase of 3.6% on the previous year with comparable sales for the half increasing by 3.0%. In Australian dollars, sales decreased by (0.2)% due to a strengthening Australian dollar.
The second quarter saw strong sales growth of 4.0% and comparable sales growth of 3.3%. Customer satisfaction continues to improve as a result of key initiatives and investment. Activity includes increased store team hours and training, an improved in-stock position, fresh and local ranging focus, and the continued benefits from the Onecard and AA Smartfuel partnership. Strong online growth accelerated further in the half due to the expanded delivery capacity, reduced delivery fees, and launch of free Pick up for orders over $50.
Average prices decreased by 0.1% with ongoing activity to deliver lower prices every day, seasonal promotional activity and competitive pricing over the Christmas period while contending with dairy and produce market cost increases.
Sales per square metre increased by 1.8% on a rolling 12 month basis reflecting sales growth of 3.2% over the last 12 months and an increase in average space of 1.4%. In the half, one Countdown store was opened and one was closed with two franchise stores opened. At the end of the half there were 184 Countdown and 67 franchise stores.
Gross margin was largely unchanged on the prior year at 24.0% with the small increase of 6 bps attributable to improvements in stock loss more than offsetting increased price investment.
CODB as a percentage of sales increased 62 bps primarily from the increased investment in team hours, online and store condition to enhance the customer experience, with the result that EBITDA and EBIT decreased 3.1% and 7.7% respectively.
ROFE was down 19 bps on the prior year due to the lower EBIT.
Woolworths Group Limited ABN 88 000 014 675 11
PORTFOLIO BUSINESSES – BIG W
$ MILLION HY18
(27 WEEKS) HY17
(27 WEEKS) CHANGE
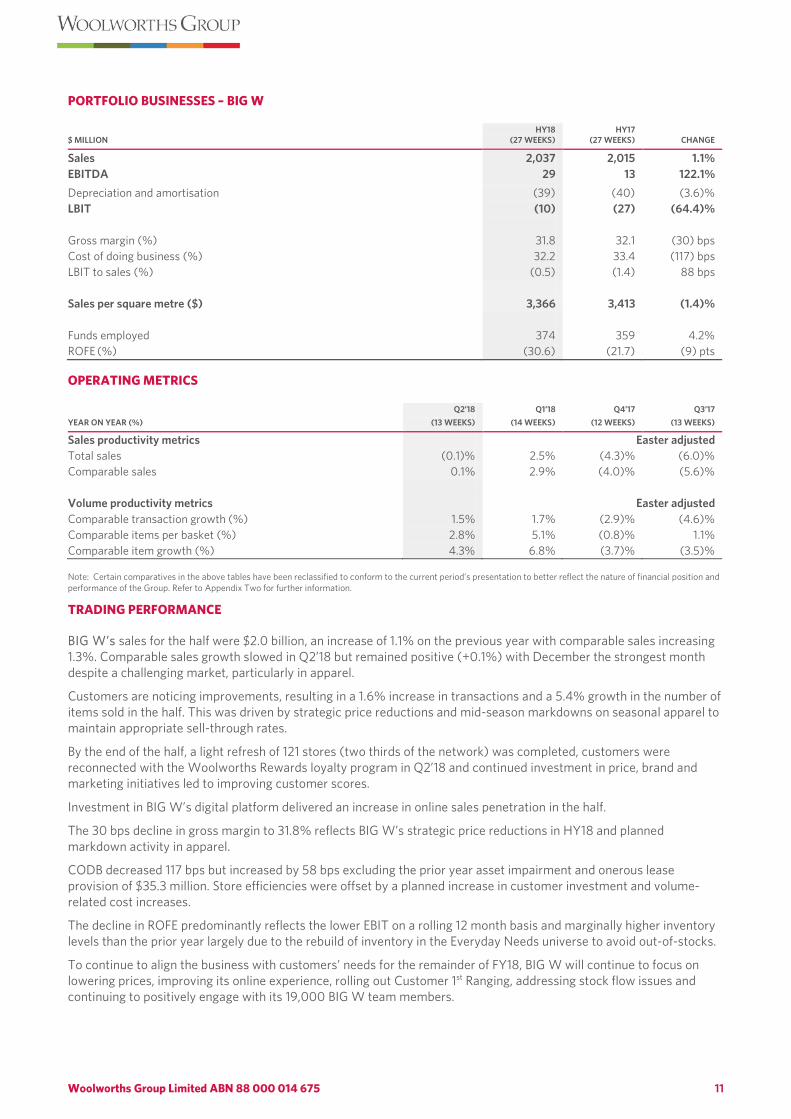
Sales 2,037 2,015 1.1% EBITDA 29 13 122.1% Depreciation and amortisation (39) (40) (3.6)% LBIT (10) (27) (64.4)% Gross margin (%) 31.8 32.1 (30) bps Cost of doing business (%) 32.2 33.4 (117) bps LBIT to sales (%) (0.5) (1.4) 88 bps Sales per square metre ($) 3,366 3,413 (1.4)% Funds employed 374 359 4.2% ROFE (%) (30.6) (21.7) (9) pts
OPERATING METRICS
YEAR ON YEAR (%) Q2’18
(13 WEEKS) Q1’18
(14 WEEKS) Q4’17
(12 WEEKS) Q3’17
(13 WEEKS)
Sales productivity metrics Easter adjusted Total sales (0.1)% 2.5% (4.3)% (6.0)% Comparable sales 0.1% 2.9% (4.0)% (5.6)% Volume productivity metrics Easter adjusted Comparable transaction growth (%) 1.5% 1.7% (2.9)% (4.6)% Comparable items per basket (%) 2.8% 5.1% (0.8)% 1.1% Comparable item growth (%) 4.3% 6.8% (3.7)% (3.5)% Note: Certain comparatives in the above tables have been reclassified to conform to the current period’s presentation to better reflect the nature of financial position and performance of the Group. Refer to Appendix Two for further information.
TRADING PERFORMANCE
BIG W’s sales for the half were $2.0 billion, an increase of 1.1% on the previous year with comparable sales increasing 1.3%. Comparable sales growth slowed in Q2’18 but remained positive (+0.1%) with December the strongest month despite a challenging market, particularly in apparel.
Customers are noticing improvements, resulting in a 1.6% increase in transactions and a 5.4% growth in the number of items sold in the half. This was driven by strategic price reductions and mid-season markdowns on seasonal apparel to maintain appropriate sell-through rates.
By the end of the half, a light refresh of 121 stores (two thirds of the network) was completed, customers were reconnected with the Woolworths Rewards loyalty program in Q2’18 and continued investment in price, brand and marketing initiatives led to improving customer scores.
Investment in BIG W’s digital platform delivered an increase in online sales penetration in the half.
The 30 bps decline in gross margin to 31.8% reflects BIG W’s strategic price reductions in HY18 and planned markdown activity in apparel.
CODB decreased 117 bps but increased by 58 bps excluding the prior year asset impairment and onerous lease provision of $35.3 million. Store efficiencies were offset by a planned increase in customer investment and volume-related cost increases.
The decline in ROFE predominantly reflects the lower EBIT on a rolling 12 month basis and marginally higher inventory levels than the prior year largely due to the rebuild of inventory in the Everyday Needs universe to avoid out-of-stocks.
To continue to align the business with customers’ needs for the remainder of FY18, BIG W will continue to focus on lowering prices, improving its online experience, rolling out Customer 1st Ranging, addressing stock flow issues and continuing to positively engage with its 19,000 BIG W team members.
Woolworths Group Limited ABN 88 000 014 675 12
PORTFOLIO BUSINESSES – HOTELS
$ MILLION HY18
(27 WEEKS) HY17
(27 WEEKS) CHANGE
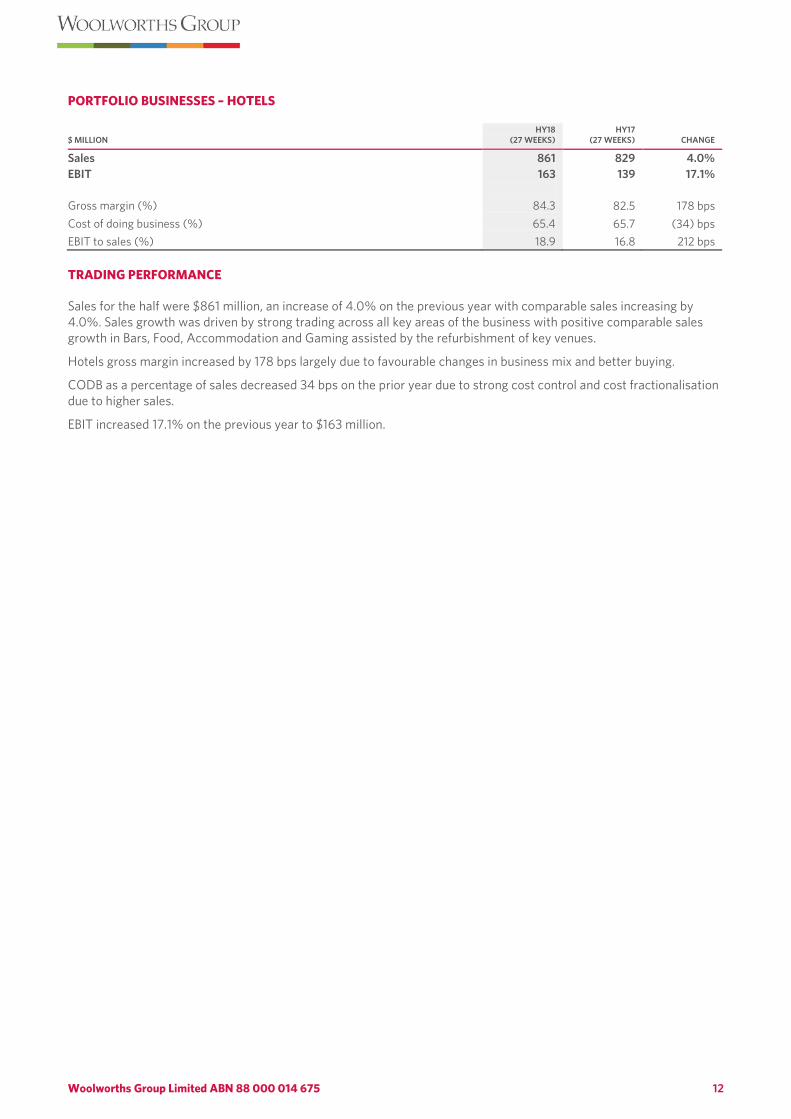
Sales 861 829 4.0% EBIT 163 139 17.1% Gross margin (%) 84.3 82.5 178 bps Cost of doing business (%) 65.4 65.7 (34) bps EBIT to sales (%) 18.9 16.8 212 bps TRADING PERFORMANCE
Sales for the half were $861 million, an increase of 4.0% on the previous year with comparable sales increasing by 4.0%. Sales growth was driven by strong trading across all key areas of the business with positive comparable sales growth in Bars, Food, Accommodation and Gaming assisted by the refurbishment of key venues.
Hotels gross margin increased by 178 bps largely due to favourable changes in business mix and better buying.
CODB as a percentage of sales decreased 34 bps on the prior year due to strong cost control and cost fractionalisation due to higher sales.
EBIT increased 17.1% on the previous year to $163 million.
Woolworths Group Limited ABN 88 000 014 675 13
DISCONTINUED OPERATIONS
$ MILLION HY18
(27 WEEKS) HY17
(27 WEEKS) CHANGE
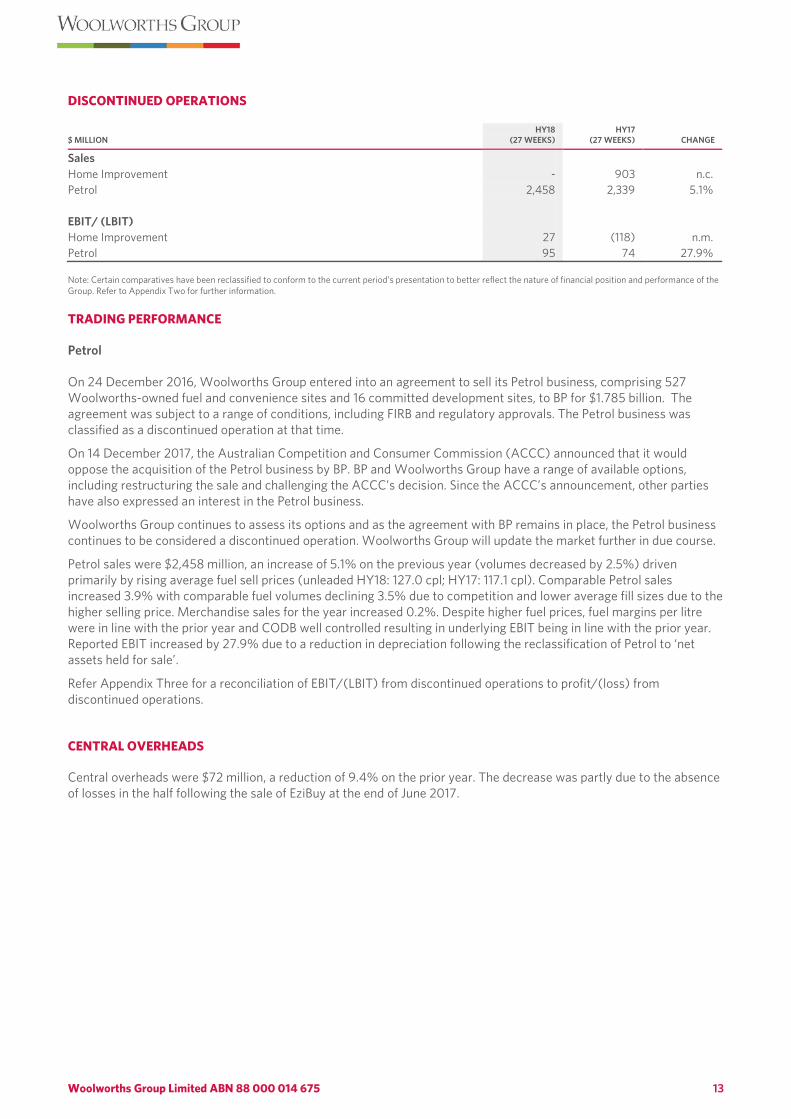
Sales Home Improvement - 903 n.c. Petrol 2,458 2,339 5.1% EBIT/ (LBIT) Home Improvement 27 (118) n.m. Petrol 95 74 27.9% Note: Certain comparatives have been reclassified to conform to the current period’s presentation to better reflect the nature of financial position and performance of the Group. Refer to Appendix Two for further information. TRADING PERFORMANCE
Petrol
On 24 December 2016, Woolworths Group entered into an agreement to sell its Petrol business, comprising 527 Woolworths-owned fuel and convenience sites and 16 committed development sites, to BP for $1.785 billion. The agreement was subject to a range of conditions, including FIRB and regulatory approvals. The Petrol business was classified as a discontinued operation at that time.
On 14 December 2017, the Australian Competition and Consumer Commission (ACCC) announced that it would oppose the acquisition of the Petrol business by BP. BP and Woolworths Group have a range of available options, including restructuring the sale and challenging the ACCC’s decision. Since the ACCC’s announcement, other parties have also expressed an interest in the Petrol business.
Woolworths Group continues to assess its options and as the agreement with BP remains in place, the Petrol business continues to be considered a discontinued operation. Woolworths Group will update the market further in due course.
Petrol sales were $2,458 million, an increase of 5.1% on the previous year (volumes decreased by 2.5%) driven primarily by rising average fuel sell prices (unleaded HY18: 127.0 cpl; HY17: 117.1 cpl). Comparable Petrol sales increased 3.9% with comparable fuel volumes declining 3.5% due to competition and lower average fill sizes due to the higher selling price. Merchandise sales for the year increased 0.2%. Despite higher fuel prices, fuel margins per litre were in line with the prior year and CODB well controlled resulting in underlying EBIT being in line with the prior year. Reported EBIT increased by 27.9% due to a reduction in depreciation following the reclassification of Petrol to ‘net assets held for sale’.
Refer Appendix Three for a reconciliation of EBIT/(LBIT) from discontinued operations to profit/(loss) from discontinued operations.
CENTRAL OVERHEADS
Central overheads were $72 million, a reduction of 9.4% on the prior year. The decrease was partly due to the absence of losses in the half following the sale of EziBuy at the end of June 2017.
Woolworths Group Limited ABN 88 000 014 675 14
GROUP BALANCE SHEET AS AT 31 DECEMBER 2017
$ MILLION HY18
31 DECEMBER 2017 HY17
1 JANUARY 2017 CHANGE FY17
25 JUNE 2017
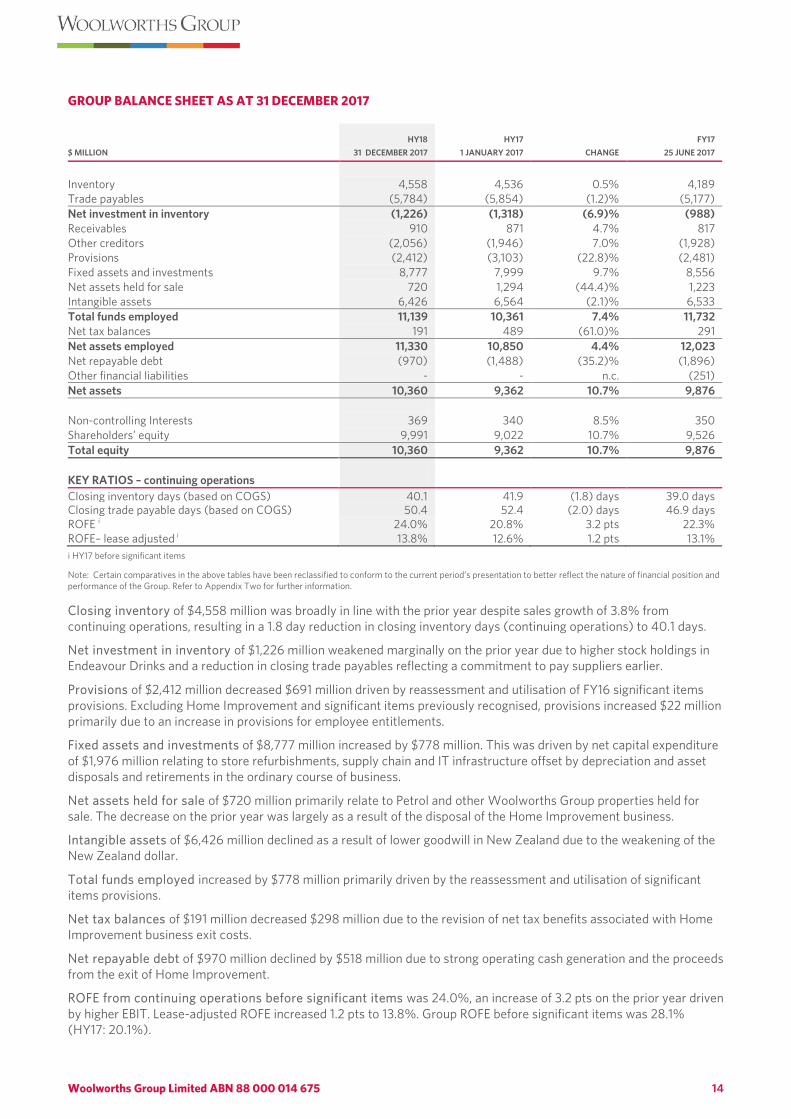
Inventory 4,558 4,536 0.5% 4,189 Trade payables (5,784) (5,854) (1.2)% (5,177) Net investment in inventory (1,226) (1,318) (6.9)% (988) Receivables 910 871 4.7% 817 Other creditors (2,056) (1,946) 7.0% (1,928) Provisions (2,412) (3,103) (22.8)% (2,481) Fixed assets and investments 8,777 7,999 9.7% 8,556 Net assets held for sale 720 1,294 (44.4)% 1,223 Intangible assets 6,426 6,564 (2.1)% 6,533 Total funds employed 11,139 10,361 7.4% 11,732 Net tax balances 191 489 (61.0)% 291 Net assets employed 11,330 10,850 4.4% 12,023 Net repayable debt (970) (1,488) (35.2)% (1,896) Other financial liabilities - - n.c. (251) Net assets 10,360 9,362 10.7% 9,876 Non-controlling Interests 369 340 8.5% 350 Shareholders’ equity 9,991 9,022 10.7% 9,526 Total equity 10,360 9,362 10.7% 9,876 KEY RATIOS – continuing operations Closing inventory days (based on COGS) 40.1 41.9 (1.8) days 39.0 days Closing trade payable days (based on COGS) 50.4 52.4 (2.0) days 46.9 days ROFE i 24.0% 20.8% 3.2 pts 22.3% ROFE– lease adjusted i 13.8% 12.6% 1.2 pts 13.1% i HY17 before significant items
Note: Certain comparatives in the above tables have been reclassified to conform to the current period’s presentation to better reflect the nature of financial position and performance of the Group. Refer to Appendix Two for further information. Closing inventory of $4,558 million was broadly in line with the prior year despite sales growth of 3.8% from continuing operations, resulting in a 1.8 day reduction in closing inventory days (continuing operations) to 40.1 days.
Net investment in inventory of $1,226 million weakened marginally on the prior year due to higher stock holdings in Endeavour Drinks and a reduction in closing trade payables reflecting a commitment to pay suppliers earlier.
Provisions of $2,412 million decreased $691 million driven by reassessment and utilisation of FY16 significant items provisions. Excluding Home Improvement and significant items previously recognised, provisions increased $22 million primarily due to an increase in provisions for employee entitlements.
Fixed assets and investments of $8,777 million increased by $778 million. This was driven by net capital expenditure of $1,976 million relating to store refurbishments, supply chain and IT infrastructure offset by depreciation and asset disposals and retirements in the ordinary course of business.
Net assets held for sale of $720 million primarily relate to Petrol and other Woolworths Group properties held for sale. The decrease on the prior year was largely as a result of the disposal of the Home Improvement business.
Intangible assets of $6,426 million declined as a result of lower goodwill in New Zealand due to the weakening of the New Zealand dollar.
Total funds employed increased by $778 million primarily driven by the reassessment and utilisation of significant items provisions.
Net tax balances of $191 million decreased $298 million due to the revision of net tax benefits associated with Home Improvement business exit costs.
Net repayable debt of $970 million declined by $518 million due to strong operating cash generation and the proceeds from the exit of Home Improvement.
ROFE from continuing operations before significant items was 24.0%, an increase of 3.2 pts on the prior year driven by higher EBIT. Lease-adjusted ROFE increased 1.2 pts to 13.8%. Group ROFE before significant items was 28.1% (HY17: 20.1%).
Woolworths Group Limited ABN 88 000 014 675 15
GROUP CASH FLOW FOR THE 27 WEEKS ENDED 31 DECEMBER 2017
$ MILLION HY18
(27 WEEKS) HY17
(27 WEEKS) CHANGE
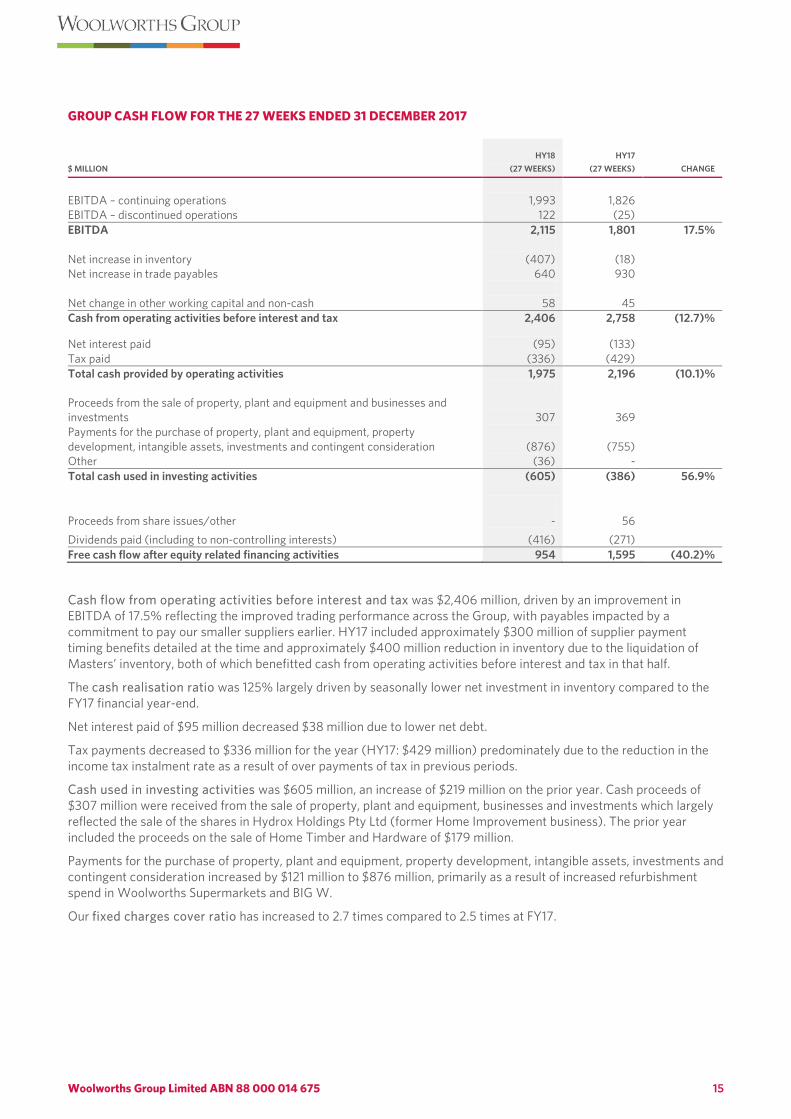
EBITDA – continuing operations 1,993 1,826 EBITDA – discontinued operations 122 (25) EBITDA 2,115 1,801 17.5% Net increase in inventory (407) (18) Net increase in trade payables 640 930 Net change in other working capital and non-cash 58 45 Cash from operating activities before interest and tax 2,406 2,758 (12.7)%
Net interest paid (95) (133) Tax paid (336) (429) Total cash provided by operating activities 1,975 2,196 (10.1)% Proceeds from the sale of property, plant and equipment and businesses and investments 307 369 Payments for the purchase of property, plant and equipment, property development, intangible assets, investments and contingent consideration (876) (755) Other (36) - Total cash used in investing activities (605) (386) 56.9%
Proceeds from share issues/other - 56 Dividends paid (including to non-controlling interests) (416) (271) Free cash flow after equity related financing activities 954 1,595 (40.2)%
Cash flow from operating activities before interest and tax was $2,406 million, driven by an improvement in EBITDA of 17.5% reflecting the improved trading performance across the Group, with payables impacted by a commitment to pay our smaller suppliers earlier. HY17 included approximately $300 million of supplier payment timing benefits detailed at the time and approximately $400 million reduction in inventory due to the liquidation of Masters’ inventory, both of which benefitted cash from operating activities before interest and tax in that half.
The cash realisation ratio was 125% largely driven by seasonally lower net investment in inventory compared to the FY17 financial year-end.
Net interest paid of $95 million decreased $38 million due to lower net debt.
Tax payments decreased to $336 million for the year (HY17: $429 million) predominately due to the reduction in the income tax instalment rate as a result of over payments of tax in previous periods.
Cash used in investing activities was $605 million, an increase of $219 million on the prior year. Cash proceeds of $307 million were received from the sale of property, plant and equipment, businesses and investments which largely reflected the sale of the shares in Hydrox Holdings Pty Ltd (former Home Improvement business). The prior year included the proceeds on the sale of Home Timber and Hardware of $179 million.
Payments for the purchase of property, plant and equipment, property development, intangible assets, investments and contingent consideration increased by $121 million to $876 million, primarily as a result of increased refurbishment spend in Woolworths Supermarkets and BIG W.
Our fixed charges cover ratio has increased to 2.7 times compared to 2.5 times at FY17.
Woolworths Group Limited ABN 88 000 014 675 16
CAPITAL MANAGEMENT
Woolworths Group manages its capital structure with the objective of enhancing long-term shareholder value through optimising its weighted average cost of capital while retaining financial flexibility to invest in its business in a manner consistent with its key priorities. The Group remains committed to a solid investment grade credit rating2 and, in conjunction with maintaining strong earnings, a number of actions can be undertaken to support the credit profile including the sale of non-core assets, further working capital initiatives, and adjusting growth capital expenditure and the property leasing profile.
In April 2016, the company introduced a 1.5% discount on the dividend reinvestment plan (“DRP”) and removed the participation limit. This continued during FY17 and the participation rate for the October 2017 final dividend was approximately 40%. The discount and uncapped participation will remain in place for the April 2018 interim dividend. The discount will not apply to the October 2018 final dividend and for the foreseeable future.
The company will seek to return capital to shareholders when that is consistent with its long-term capital structure objectives and where it will enhance shareholder value.
Financing transactions during FY18
Maturities In November 2017, a A$400 million bank guarantee facility matured. It was replaced with pre-financing obtained in May 2017 (upsized to A$500 million). This facility is for the purpose of Woolworths Group meeting its WorkCover obligations as a ‘self-insurer’ by issuing bank guarantees in favour of Australian WorkCover authorities and is underpinned by the international surety market. The new facility is for a three-year commitment to November 2020 and is currently fully drawn.
In November 2017, A$1.3 billion of undrawn syndicated bank facilities were voluntarily cancelled as they were surplus to business requirements. This will provide a borrowing cost saving to the Woolworths Group.
New transactions Woolworths Group had no new transactions during the first half of FY18.
Upcoming refinancing Woolworths Group has no upcoming refinancing during FY18.
Woolworths Group Limited ABN 88 000 014 675 17
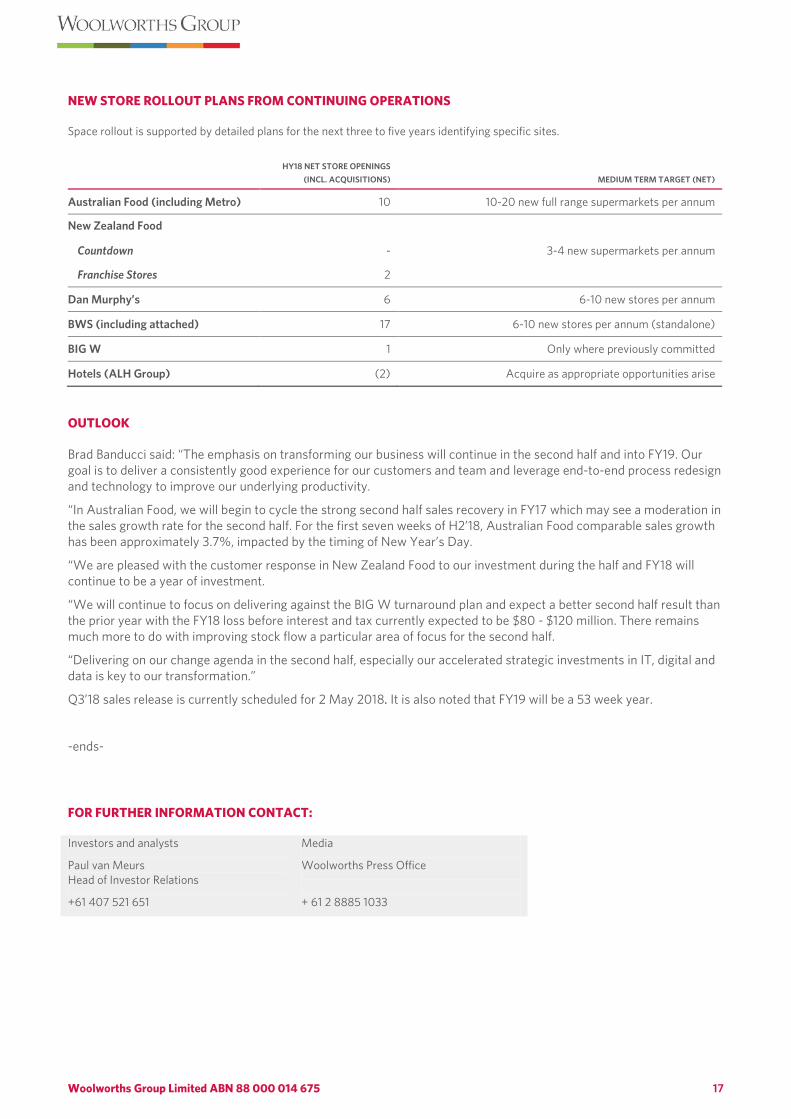
NEW STORE ROLLOUT PLANS FROM CONTINUING OPERATIONS
Space rollout is supported by detailed plans for the next three to five years identifying specific sites.
HY18 NET STORE OPENINGS
(INCL. ACQUISITIONS) MEDIUM TERM TARGET (NET)
Australian Food (including Metro) 10 10-20 new full range supermarkets per annum
New Zealand Food
Countdown - 3-4 new supermarkets per annum
Franchise Stores 2
Dan Murphy’s 6 6-10 new stores per annum
BWS (including attached) 17 6-10 new stores per annum (standalone)
BIG W 1 Only where previously committed
Hotels (ALH Group) (2) Acquire as appropriate opportunities arise
OUTLOOK
Brad Banducci said: “The emphasis on transforming our business will continue in the second half and into FY19. Our goal is to deliver a consistently good experience for our customers and team and leverage end-to-end process redesign and technology to improve our underlying productivity.
“In Australian Food, we will begin to cycle the strong second half sales recovery in FY17 which may see a moderation in the sales growth rate for the second half. For the first seven weeks of H2’18, Australian Food comparable sales growth has been approximately 3.7%, impacted by the timing of New Year’s Day.
“We are pleased with the customer response in New Zealand Food to our investment during the half and FY18 will continue to be a year of investment.
“We will continue to focus on delivering against the BIG W turnaround plan and expect a better second half result than the prior year with the FY18 loss before interest and tax currently expected to be $80 - $120 million. There remains much more to do with improving stock flow a particular area of focus for the second half.
“Delivering on our change agenda in the second half, especially our accelerated strategic investments in IT, digital and data is key to our transformation.”
Q3’18 sales release is currently scheduled for 2 May 2018. It is also noted that FY19 will be a 53 week year.
-ends-
FOR FURTHER INFORMATION CONTACT:
Investors and analysts
Paul van Meurs Head of Investor Relations
+61 407 521 651
Media
Woolworths Press Office
+ 61 2 8885 1033
Woolworths Group Limited ABN 88 000 014 675 18
APPENDIX ONE: ASIC REGULATORY GUIDE 230 DISCLOSING NON-IFRS FINANCIAL INFORMATION AND GLOSSARY
The 2018 Half-Year Report and this Half-Year profit and dividend announcement for the 27 weeks ended 31 December 2017 contain certain non-IFRS financial measures of historical financial performance, balance sheet or cash flows. Non-IFRS financial measures are financial measures other than those defined or specified under all relevant accounting standards and may not be directly comparable with other companies’ measures but are common practice in the industry in which Woolworths Group operates. Non-IFRS financial information should be considered in addition to, and is not intended to be a substitute for, or more important than, IFRS measures. The presentation of non-IFRS measures is in line with Regulatory Guide 230 issued by Australian Security and Investments Commission (ASIC) in December 2011 to promote full and clear disclosure for investors and other users of financial information and minimise the possibility of being misled by such information.
These measures are used by management and the directors as the primary measures of assessing the financial performance of the Group and individual segments. The directors also believe that these non-IFRS measures assist in providing additional meaningful information on the underlying drivers of the business, performance and trends, as well as position of the Woolworths Group. Non-IFRS financial measures are also used to enhance the comparability of information between reporting periods (such as comparable sales), by adjusting for non-recurring or uncontrollable factors which affect IFRS measures, to aid the user in understanding the Woolworths Group’s performance. Consequently, non-IFRS measures are used by the directors and management for performance analysis, planning, reporting and incentive setting purposes and have remained consistent with the prior year. Non-IFRS measures are not subject to audit or review.
Glossary
Cash realisation ratio Operating cash flow as a percentage of group net profit after tax before depreciation and amortisation
Comparable sales Measure of sales which excludes stores that have been opened or closed in the last 12 months and demonstrable impact on existing stores from store disruption as a result of store refurbishment or new store openings
Cost of doing business Expenses which relate to the operation of the business
Fixed charges cover ratio Group earnings before interest, tax, depreciation, amortisation and rent (EBITDAR) divided by rent and interest costs. Rent and interest costs include capitalised interest but exclude foreign exchange gains/losses and dividend income
Free cash flow Cash flow generated by the Woolworths Group after equity related financing activities including dividends
Funds employed Net assets employed excluding net tax balances
Net assets employed Net assets excluding net repayable debt and other financial liabilities
Net Promoter Score A loyalty measure based on a single question where a customer rates a business on a scale of 1-10. The score is the net result of the percentage of customers providing a score of 9 or 10 (promoters) less the percentage of customers providing a score of 0-6 (detractors)
Net repayable debt Borrowings less cash balances including debt hedging derivatives
Renewals A total store transformation focused on the overall store environment, team, range and process efficiency (including digital)
ROFE Return on Funds Employed (ROFE) is calculated as EBIT before significant items for the previous 12 months as a percentage of average funds employed. Lease adjusted ROFE adjusts funds employed for the present value of future lease obligations and EBIT for the implied interest on those obligations
Sales per square metre Total sales for the previous 12 months by business divided by average trading space
Stock loss The value of stock written-off, wasted, stolen, cleared, marked down or adjusted from all stores nationally (sometimes expressed as a percentage of sales)
Upgrades A lighter upgrade typically involving a front-of-store upgrade and Produce/Bakery enhancement
Woolworths Group Limited ABN 88 000 014 675 19
Voice of Customer Externally facilitated survey of a sample of Woolworths Group customers where customers rate Woolworths Group businesses on a number of criteria. Expressed as the percentage of customers providing a rating of six or seven on a seven point scale
Voice of Supplier Voice of Supplier (VOS) is a bimonthly survey (six times per year) of a broad spectrum of Australian Foods’ suppliers facilitated by an external provider. The survey is used to provide an ongoing measure of the effectiveness of business relationships with the supplier community. VOS is the average of the suppliers’ rating on a seven point scale across various attributes. The score is the percentage of suppliers that provided a rating of six or seven on a seven point scale
Voice of Team The Voice of Team (VOT) survey measures sustainable engagement of our team members as well as their advocacy of Woolworths as a place to work and shop. The survey consists of nine sustainable engagement questions, three key driver questions and two advocacy questions
Other non-IFRS measures used in describing the business performance include:
• Earnings before interest, tax, depreciation and amortisation (EBITDA)
• Earnings before interest, tax, depreciation, amortisation and rent (EBITDAR)
• Cash flow from operating activities before interest and tax
• Comparable sales
• Net assets and funds employed • Significant items
• Fixed assets and investments • Net investment in inventory
• Free cash flow after equity related financing activities
• Net assets held for sale
• Net tax balances • Other financial assets and liabilities
Woolworths Group Limited ABN 88 000 014 675 20
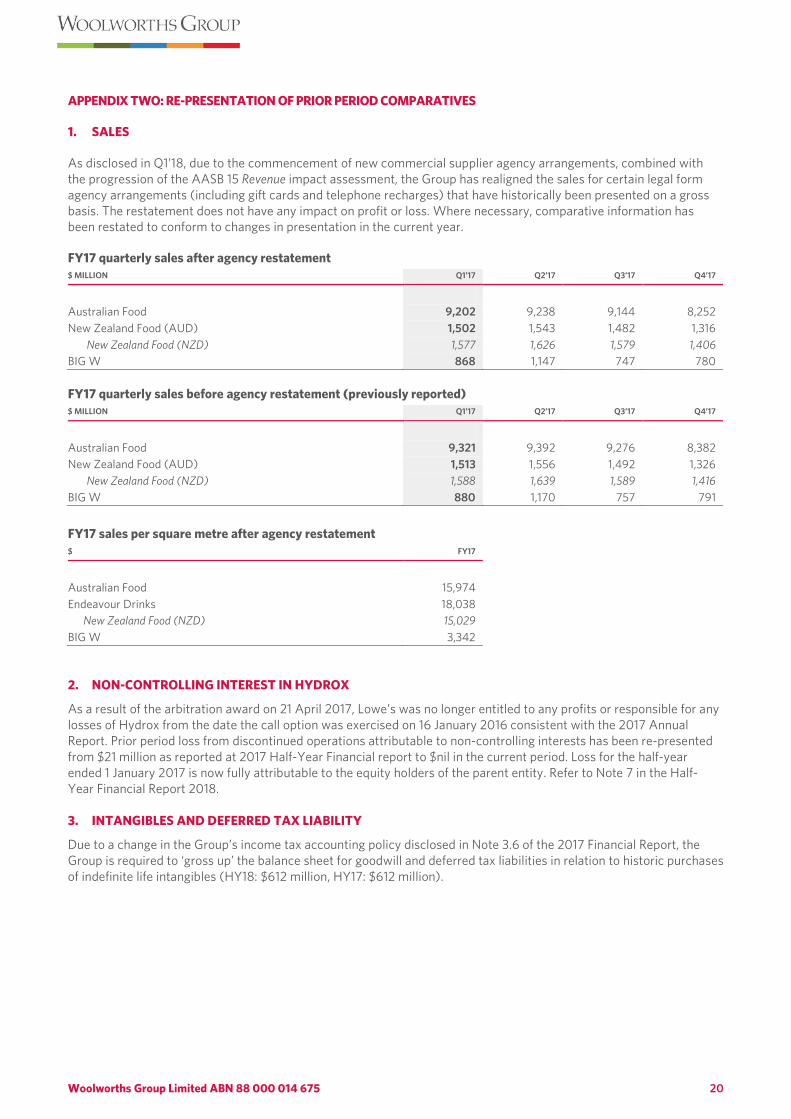
APPENDIX TWO: RE-PRESENTATION OF PRIOR PERIOD COMPARATIVES
1. SALES
As disclosed in Q1’18, due to the commencement of new commercial supplier agency arrangements, combined with the progression of the AASB 15 Revenue impact assessment, the Group has realigned the sales for certain legal form agency arrangements (including gift cards and telephone recharges) that have historically been presented on a gross basis. The restatement does not have any impact on profit or loss. Where necessary, comparative information has been restated to conform to changes in presentation in the current year.
FY17 quarterly sales after agency restatement $ MILLION Q1’17 Q2’17 Q3’17 Q4’17
Australian Food 9,202 9,238 9,144 8,252 New Zealand Food (AUD) 1,502 1,543 1,482 1,316
New Zealand Food (NZD) 1,577 1,626 1,579 1,406 BIG W 868 1,147 747 780
FY17 quarterly sales before agency restatement (previously reported) $ MILLION Q1’17 Q2’17 Q3’17 Q4’17
Australian Food 9,321 9,392 9,276 8,382 New Zealand Food (AUD) 1,513 1,556 1,492 1,326
New Zealand Food (NZD) 1,588 1,639 1,589 1,416 BIG W 880 1,170 757 791
FY17 sales per square metre after agency restatement $ FY17
Australian Food 15,974 Endeavour Drinks 18,038 New Zealand Food (NZD) 15,029 BIG W 3,342
2. NON-CONTROLLING INTEREST IN HYDROX
As a result of the arbitration award on 21 April 2017, Lowe’s was no longer entitled to any profits or responsible for any losses of Hydrox from the date the call option was exercised on 16 January 2016 consistent with the 2017 Annual Report. Prior period loss from discontinued operations attributable to non-controlling interests has been re-presented from $21 million as reported at 2017 Half-Year Financial report to $nil in the current period. Loss for the half-year ended 1 January 2017 is now fully attributable to the equity holders of the parent entity. Refer to Note 7 in the Half-Year Financial Report 2018.
3. INTANGIBLES AND DEFERRED TAX LIABILITY
Due to a change in the Group’s income tax accounting policy disclosed in Note 3.6 of the 2017 Financial Report, the Group is required to ‘gross up’ the balance sheet for goodwill and deferred tax liabilities in relation to historic purchases of indefinite life intangibles (HY18: $612 million, HY17: $612 million).
Woolworths Group Limited ABN 88 000 014 675 21
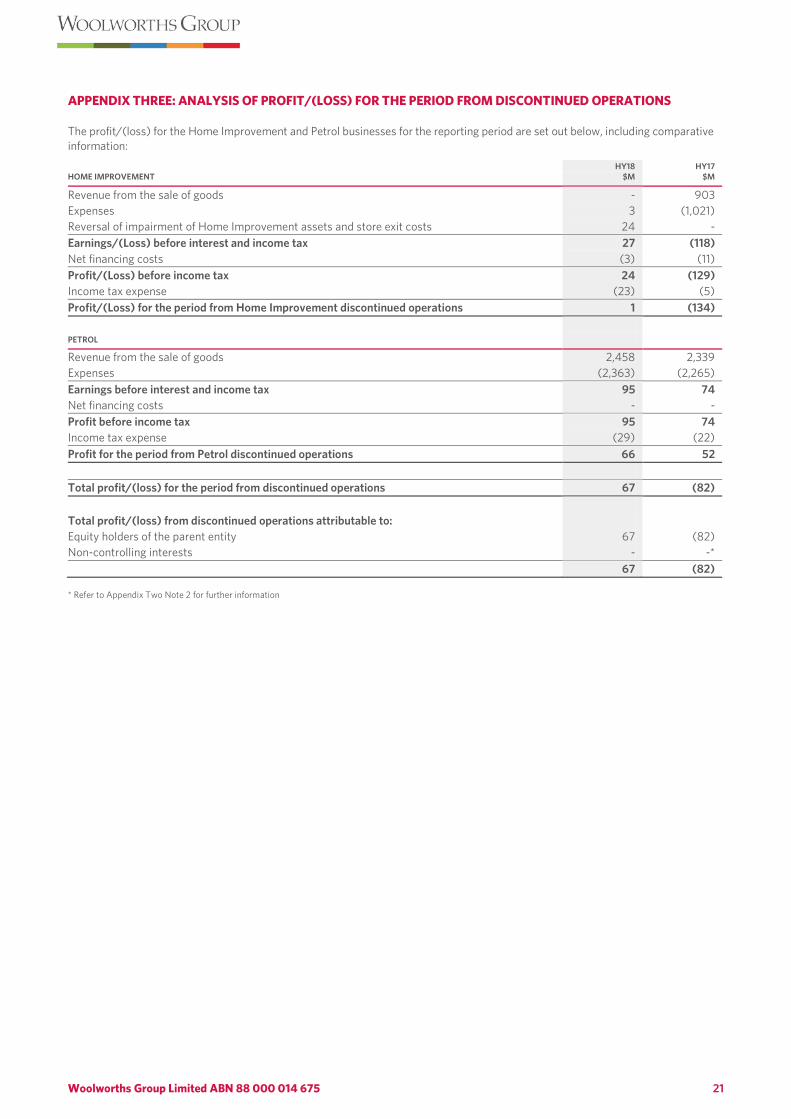
APPENDIX THREE: ANALYSIS OF PROFIT/(LOSS) FOR THE PERIOD FROM DISCONTINUED OPERATIONS
The profit/(loss) for the Home Improvement and Petrol businesses for the reporting period are set out below, including comparative information:
HOME IMPROVEMENT HY18
$M HY17
$M
Revenue from the sale of goods - 903 Expenses 3 (1,021) Reversal of impairment of Home Improvement assets and store exit costs 24 - Earnings/(Loss) before interest and income tax 27 (118) Net financing costs (3) (11) Profit/(Loss) before income tax 24 (129) Income tax expense (23) (5) Profit/(Loss) for the period from Home Improvement discontinued operations 1 (134) PETROL Revenue from the sale of goods 2,458 2,339 Expenses (2,363) (2,265) Earnings before interest and income tax 95 74 Net financing costs - - Profit before income tax 95 74 Income tax expense (29) (22) Profit for the period from Petrol discontinued operations 66 52 Total profit/(loss) for the period from discontinued operations 67 (82) Total profit/(loss) from discontinued operations attributable to: Equity holders of the parent entity 67 (82) Non-controlling interests - -* 67 (82) * Refer to Appendix Two Note 2 for further information
Woolworths Group Limited ABN 88 000 014 675 22
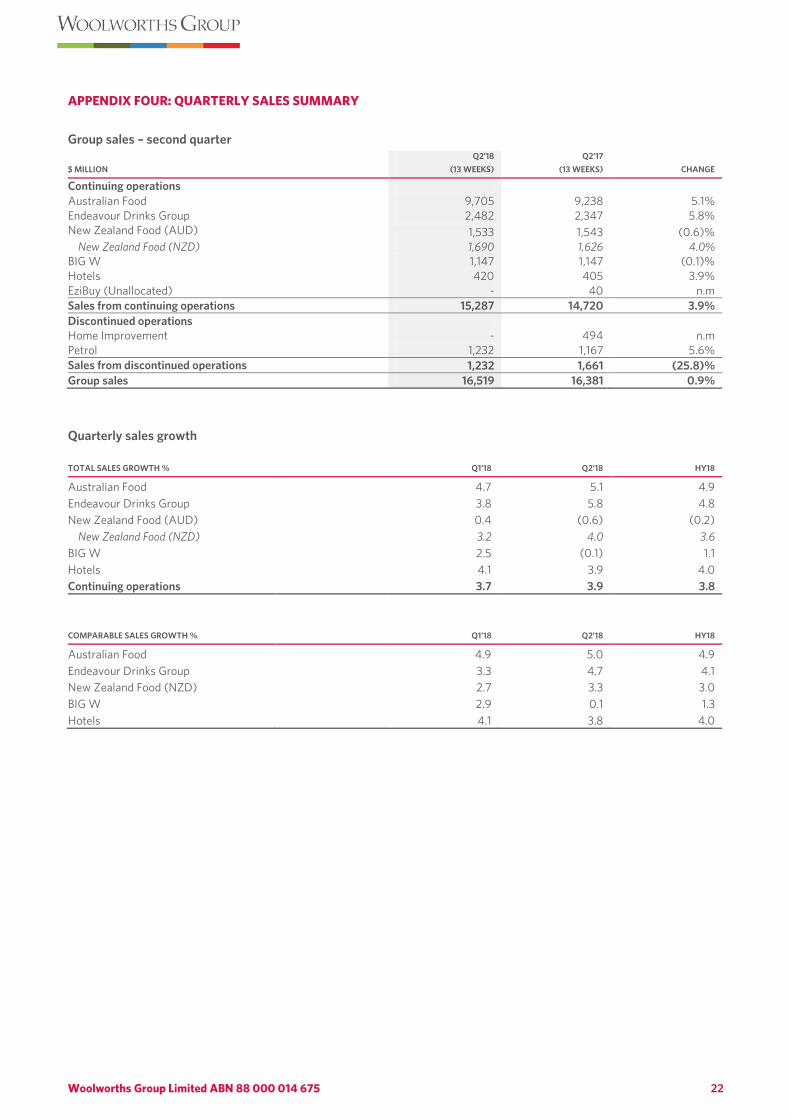
APPENDIX FOUR: QUARTERLY SALES SUMMARY
Group sales – second quarter $ MILLION
Q2’18 (13 WEEKS)
Q2’17 (13 WEEKS) CHANGE
Continuing operations Australian Food 9,705 9,238 5.1% Endeavour Drinks Group 2,482 2,347 5.8% New Zealand Food (AUD) 1,533 1,543 (0.6)% New Zealand Food (NZD) 1,690 1,626 4.0% BIG W 1,147 1,147 (0.1)% Hotels 420 405 3.9% EziBuy (Unallocated) - 40 n.m Sales from continuing operations 15,287 14,720 3.9% Discontinued operations Home Improvement - 494 n.m Petrol 1,232 1,167 5.6% Sales from discontinued operations 1,232 1,661 (25.8)% Group sales 16,519 16,381 0.9%
Quarterly sales growth
TOTAL SALES GROWTH %
Q1’18
Q2’18
HY18
Australian Food
4.7 5.1 4.9 Endeavour Drinks Group
3.8 5.8 4.8
New Zealand Food (AUD)
0.4 (0.6) (0.2) New Zealand Food (NZD)
3.2 4.0 3.6
BIG W
2.5 (0.1) 1.1 Hotels
4.1 3.9 4.0
Continuing operations
3.7 3.9 3.8
COMPARABLE SALES GROWTH %
Q1’18
Q2’18
HY18
Australian Food
4.9 5.0 4.9 Endeavour Drinks Group
3.3 4.7 4.1
New Zealand Food (NZD)
2.7 3.3 3.0 BIG W
2.9 0.1 1.3
Hotels
4.1 3.8 4.0
Woolworths Group Limited ABN 88 000 014 675 23
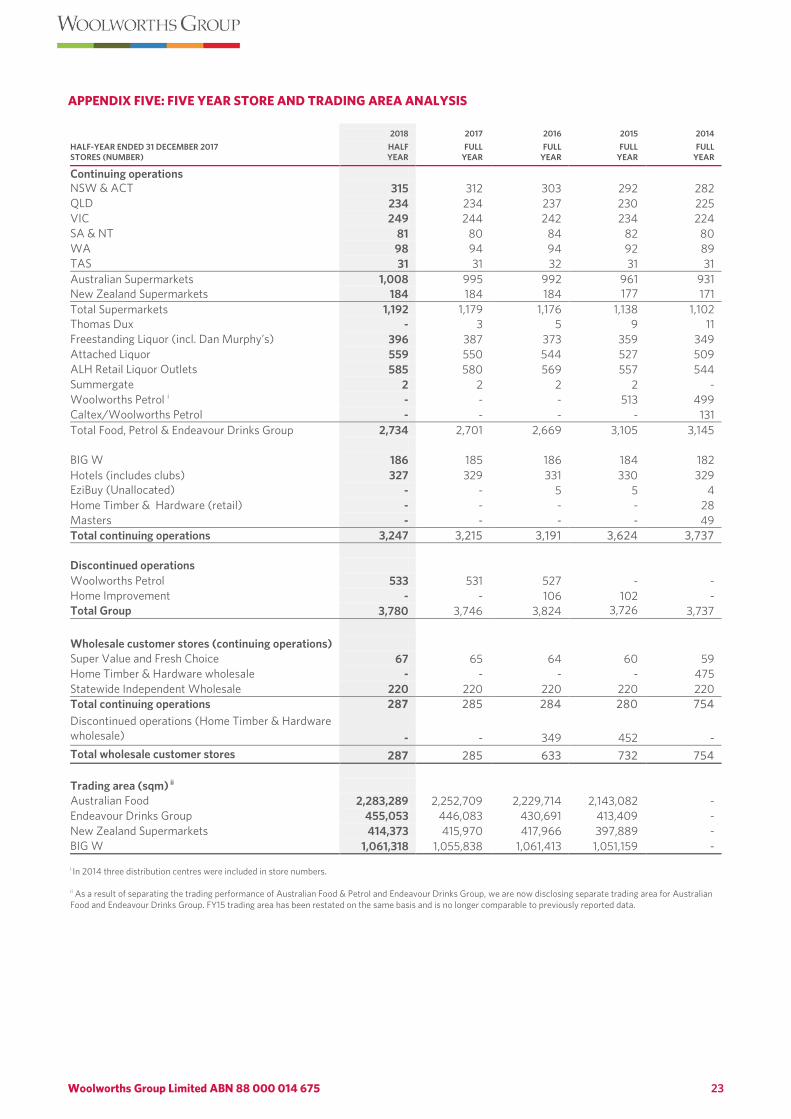
APPENDIX FIVE: FIVE YEAR STORE AND TRADING AREA ANALYSIS
HALF-YEAR ENDED 31 DECEMBER 2017 STORES (NUMBER)
2018 HALF YEAR
2017 FULL
YEAR
2016 FULL
YEAR
2015 FULL
YEAR
2014 FULL
YEAR
Continuing operations NSW & ACT 315 312 303 292 282 QLD 234 234 237 230 225 VIC 249 244 242 234 224 SA & NT 81 80 84 82 80 WA 98 94 94 92 89 TAS 31 31 32 31 31 Australian Supermarkets 1,008 995 992 961
931 New Zealand Supermarkets 184 184 184 177
171 Total Supermarkets 1,192 1,179 1,176 1,138
1,102 Thomas Dux - 3 5 9 11 Freestanding Liquor (incl. Dan Murphy’s) 396 387 373 359 349 Attached Liquor 559 550 544 527 509 ALH Retail Liquor Outlets 585 580 569 557 544 Summergate 2 2 2 2 - Woolworths Petrol i - - - 513 499 Caltex/Woolworths Petrol - - - - 131 Total Food, Petrol & Endeavour Drinks Group 2,734 2,701 2,669 3,105 3,145 BIG W 186 185 186 184 182 Hotels (includes clubs) 327 329 331 330 329 EziBuy (Unallocated)
- - 5 5 4 Home Timber & Hardware (retail) - - - - 28 Masters - - - - 49 Total continuing operations
3,247 3,215 3,191 3,624 3,737 Discontinued operations Woolworths Petrol 533 531 527 - - Home Improvement - - 106 102 - Total Group 3,780 3,746 3,824 3,726
3,737
Wholesale customer stores (continuing operations) Super Value and Fresh Choice 67 65 64 60 59 Home Timber & Hardware wholesale - - - - 475 Statewide Independent Wholesale 220 220 220 220 220 Total continuing operations 287 285 284 280 754 Discontinued operations (Home Timber & Hardware wholesale) - - 349 452 - Total wholesale customer stores 287 285 633 732 754 Trading area (sqm) ii Australian Food 2,283,289 2,252,709 2,229,714 2,143,082 - Endeavour Drinks Group 455,053 446,083 430,691 413,409 - New Zealand Supermarkets 414,373 415,970 417,966 397,889 - BIG W 1,061,318 1,055,838 1,061,413 1,051,159 -
i In 2014 three distribution centres were included in store numbers. ii As a result of separating the trading performance of Australian Food & Petrol and Endeavour Drinks Group, we are now disclosing separate trading area for Australian Food and Endeavour Drinks Group. FY15 trading area has been restated on the same basis and is no longer comparable to previously reported data.
Woolworths Group Limited ABN 88 000 014 675 24
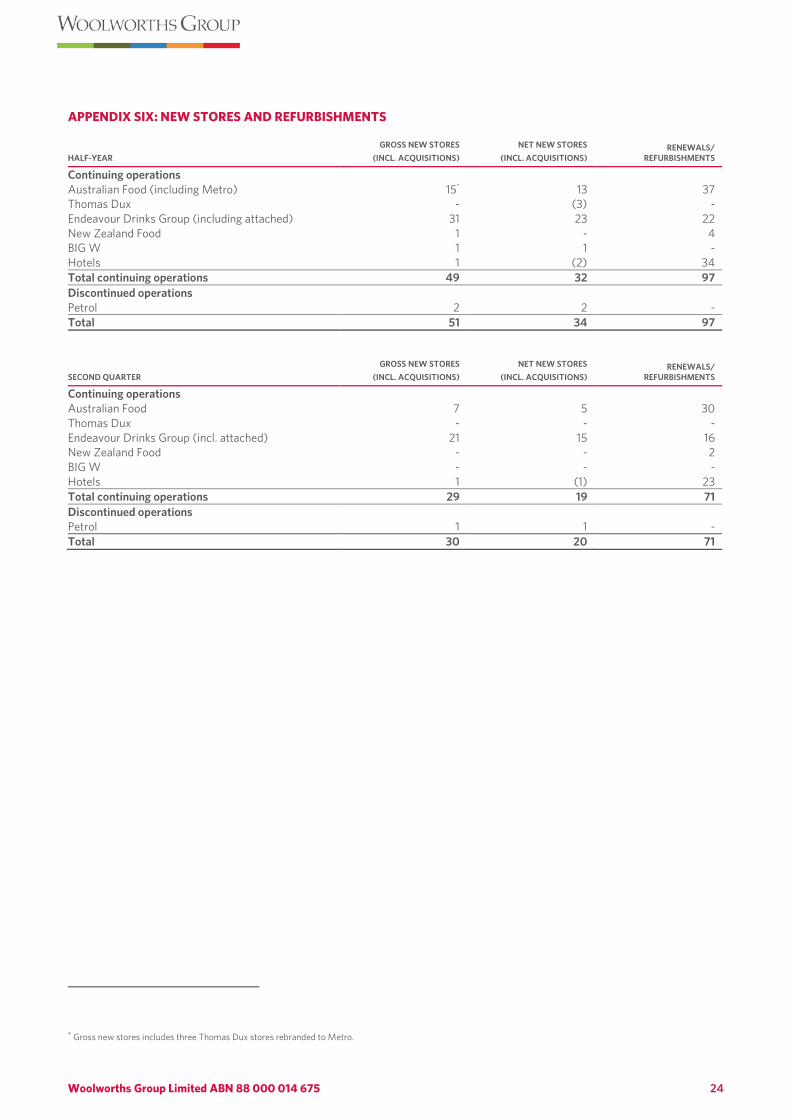
APPENDIX SIX: NEW STORES AND REFURBISHMENTS
HALF-YEAR GROSS NEW STORES
(INCL. ACQUISITIONS) NET NEW STORES
(INCL. ACQUISITIONS) RENEWALS/
REFURBISHMENTS
Continuing operations Australian Food (including Metro) 15* 13 37 Thomas Dux - (3) - Endeavour Drinks Group (including attached) 31 23 22 New Zealand Food 1 - 4 BIG W 1 1 - Hotels 1 (2) 34 Total continuing operations 49 32 97 Discontinued operations Petrol 2 2 - Total 51 34 97
SECOND QUARTER GROSS NEW STORES
(INCL. ACQUISITIONS) NET NEW STORES
(INCL. ACQUISITIONS) RENEWALS/
REFURBISHMENTS
Continuing operations Australian Food 7 5 30 Thomas Dux - - - Endeavour Drinks Group (incl. attached) 21 15 16 New Zealand Food - - 2 BIG W - - - Hotels 1 (1) 23 Total continuing operations 29 19 71 Discontinued operations Petrol 1 1 - Total 30 20 71
* Gross new stores includes three Thomas Dux stores rebranded to Metro.
Woolworths Group Limited ABN 88 000 014 675 25
ENDNOTES
n.c. Not comparable
n.m. Not meaningful 1 Growth for New Zealand Food is quoted in New Zealand dollars. 2 The credit ratings referred to in this document have been issued by a credit rating agency which holds an Australian Financial Services Licence with an authorisation to issue credit ratings to wholesale clients only. The credit ratings in this document are published for the benefit of Woolworths Group’s debt providers.
Click here to view the shareholder communication for these results.