Continued evolution 2016 Global Foreign … evolution 2016 Global Foreign ... 2016 Global Foreign...
22
Continued evolution 2016 Global Foreign Exchange survey
Transcript of Continued evolution 2016 Global Foreign … evolution 2016 Global Foreign ... 2016 Global Foreign...
Continued evolution2016 Global Foreign Exchange survey

To start a new section, hold down the apple+shift keys and click
to release this object and type the section title in the box below.
B
To start a new section, hold down the apple+shift keys and click
to release this object and type the section title in the box below.
2016 Global Foreign Exchange survey 1
Contents
Executive summary 2
Survey demographics 5
Treasurers face various challenges in managing FX risk 6
Lack of visibility driven by complexity and inadequate investment in automation 7
Board visibility of FX exposures 8 Opportunity to improve reporting to the board 9
Both centralized and decentralized models work 10
Hedging objectives focus on reducing income statement volatility 11
Primary hedging strategies vary by industry 12
Missed opportunities in natural hedges 13
The majority of derivatives hedge transaction exposures 14
Hedging transaction exposures 15
Use of technology to manage FX risks 16
Accounting treatment influencing hedging strategies 17
Contacts 18
To start a new section, hold down the apple+shift keys and click
to release this object and type the section title in the box below.
2
Executive summary
Deloitte Global Treasury Advisory is pleased to share its first Global Foreign Exchange surveyThe survey was crafted in response to the recent high profile and impact of Foreign Exchange (FX) on businesses. In 2015 alone, the surge in the US dollar wiped billions off earnings of US organizations; material currency shifts surprised financial markets (ranging from the Swiss Franc in one direction to emerging market currencies in the other); and the decision to include the Chinese Renminbi in the SDR bucket from October onwards also reflects further progression in the currency markets. Furthermore, FX rates impact corporate transactions with the strengthening of the US dollar having fueled increased cross-border M&A activity for the US corporate sector (Deloitte M&A Index, 2016: Opportunities amidst divergence).
Similar levels of uncertainties are anticipated in 2016, with different expectations around interest rate policies, quantitative easing removals, potential depegging of some currencies, and other actions by global economies all driving FX volatility. Increased currency risk can have a direct impact on reported profits and on cash through the taxation of unrealized FX, even on intra-group transactions. More generally, the forthcoming changes to global tax rules under the OECD’s Base Erosion and Profit Shifting (BEPS) initiative could impact the financial implications of centralized FX hedging activities.
The ability of corporations to manage currency risk effectively will therefore continue to be tested. Boards and CFOs need to be comfortable that currency-related value erosion is avoided and, where necessary, challenge their treasury teams to address some of the identified hurdles.
The survey provides insight into the challenges corporations encounter when managing currency risk and possible causes (and solutions) for these challenges, as well as FX risk management structures, strategies, and processes adopted by companies across the globe. Key findings are summarized below.
Treasury challengesLack of visibility into FX exposures and reliable forecasts and the manual nature of exposure quantification is a challenge for nearly 60 percent of respondents. This challenge is pervasive throughout the survey, from the many sources of FX exposures in organizations, to the existence of largely manual forecasts and exposure collation processes, and the under-utilization of treasury systems in the FX management processes.
Without accurate measurement, risks cannot be managed effectively. Hence, value erosion from negative currency rate movements cannot be minimized. Organizations should prioritize appropriate investment to improve and automate exposure capture and analysis processes.
The board agendaThe survey suggests that boards do not always receive sufficient information in relation to FX risk. Executive management could challenge its treasurers more in order to better understand the impact of FX risk hedging strategies on profit margins and EPS; why only 11 percent of respondents manage year-on-year performance and predictability; and why opportunities to minimize exposures through the use of netting and natural hedging techniques are only explored by around half of the respondents.
Treasury structuresFX risk is predominantly managed via a central structure with 93 percent of respondents using a centralized treasury or in-house bank model, sometimes complemented by regional treasury centers. Organizations with centralized models report a higher number of benefits and fewer challenges than those with a decentralized model, although the benefits and challenges reported are similar, suggesting both can work.
To start a new section, hold down the apple+shift keys and click
to release this object and type the section title in the box below.
2016 Global Foreign Exchange survey 3
Hedging strategiesHedging strategy objectives are mainly focused on protecting cash and minimizing volatility in income statements. As a result, hedging strategies are primarily centered around monetary balance sheet FX items and FX cash flows, and much less on P&L translation or net asset hedging.
Use of technologyTechnology is recognized as an important enabler to achieve efficient and effective processes, yet it appears to be a hindrance for many organizations that still deal with a multitude of source information systems with limited interconnectivity. More than 60 percent of respondents rely on manual forecasting processes.
A big thank youThank you to the companies around the world that responded to our survey online or by interview. Please contact your Deloitte Advisory contact for more information about how your company responded or compared to your peer group.
Deloitte’s Global Treasury Advisory Services team has emerged as the largest global professional services treasury practice. We offer services across all areas of treasury, covering FX hedging strategies, M&A, strategy, operating model and process transformation, treasury technology strategy, selection, and implementation. If this survey resonates with the issues that your company faces, please contact us. International contact information is provided on page 18.
Sincerely,
Melissa Cameron Principal | Deloitte AdvisoryGlobal Treasury LeaderGlobal Treasury Advisory ServicesDeloitte & Touche LLP
Karlien PorréUK Treasury PartnerGlobal Treasury Advisory ServicesDeloitte LLP

To start a new section, hold down the apple+shift keys and click
to release this object and type the section title in the box below.
4
Levels of uncertainties in 2016 are anticipated to be similar to what was seen in 2015, with different expectations around interest rate policies, quantitative easing removals, potential depegging of some currencies, and other actions by global economies all driving FX volatility.
To start a new section, hold down the apple+shift keys and click
to release this object and type the section title in the box below.
2016 Global Foreign Exchange survey 5
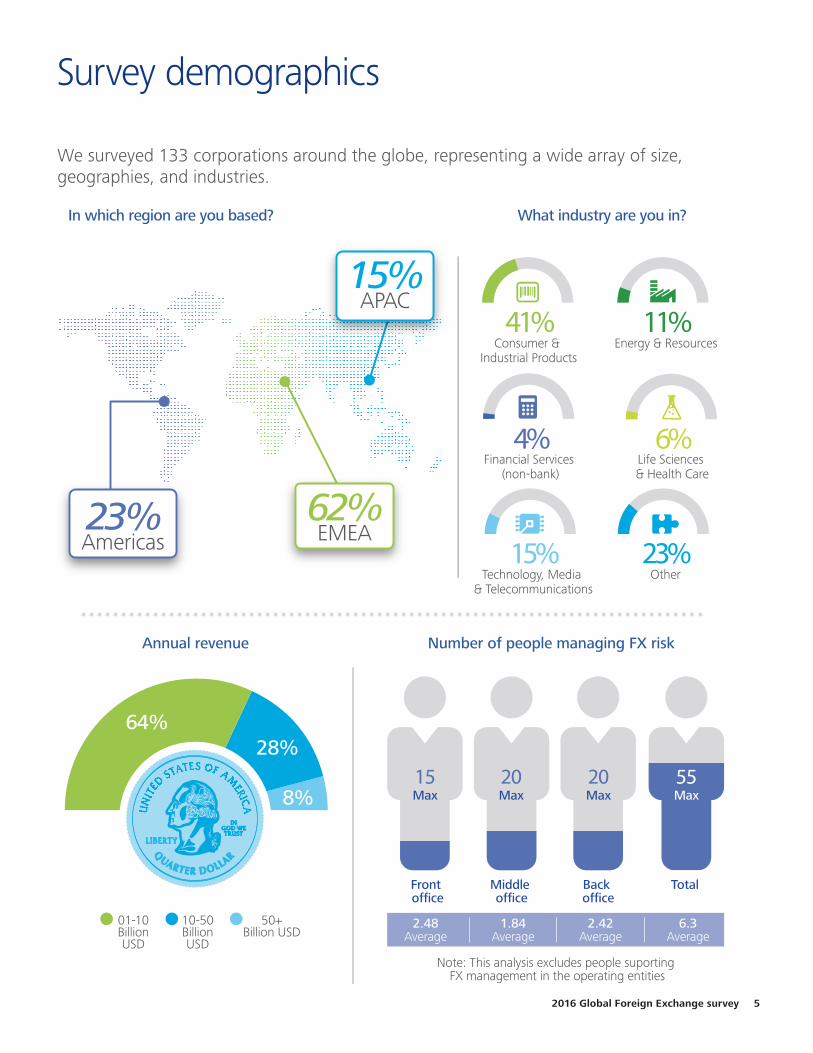
Survey demographics
Consumer & Industrial Products
41%
Financial Services (non-bank)
4%
Energy & Resources11%
Life Sciences & Health Care
6%
Other23%
Technology, Media & Telecommunications
15%
64%
8%
28%
In which region are you based?
Annual revenue Number of people managing FX risk
What industry are you in?
10-50 Billion USD
Note: This analysis excludes people suporting FX management in the operating entities
50+Billion USD
01-10 Billion USD
TotalBack office
Middle office
Front office
20Max
20Max
15Max
55Max
2.48Average
1.84Average
2.42Average
6.3Average
We surveyed 133 corporations around the globe, representing a wide array of size, geographies, and industries.
23%Americas
62%EMEA
15%APAC

To start a new section, hold down the apple+shift keys and click
to release this object and type the section title in the box below.
6
Lack of visibility related to FX exposures and reliable forecasts is a challenge for nearly 60 percent of respondents. Without accurate measurement, risks cannot be managed effectively and, arguably, value erosion from negative currency rate movements cannot be prevented. Hedging ineffectiveness disproportionately increases with inaccurate exposure information; hence, organizations with successful FX hedging strategies are those that have invested in the right exposure identification processes and technologies.
Treasurers face various challenges in managing FX risk
Challenges faced by corporations
Lack of visibility of FX exposures and reliability
of forecasts
Emerging market/restricted currency market volatility
Manual exposure identification and capture
processes
Business unit understanding
Inadequate treasury or financial risk management
systems
Informal or immature hedging practices
Ability to analyze exposures and measure
hedging results
Hedge accounting compliance
Lack of understanding by senior management
Non-standard FX management processes
Inadequate FX skills and knowledge
0 10 20 30 40 50 60
7%
9%
12%
15%
16%
19%
22%
33%
48%
49%
56%
To start a new section, hold down the apple+shift keys and click
to release this object and type the section title in the box below.
2016 Global Foreign Exchange survey 7
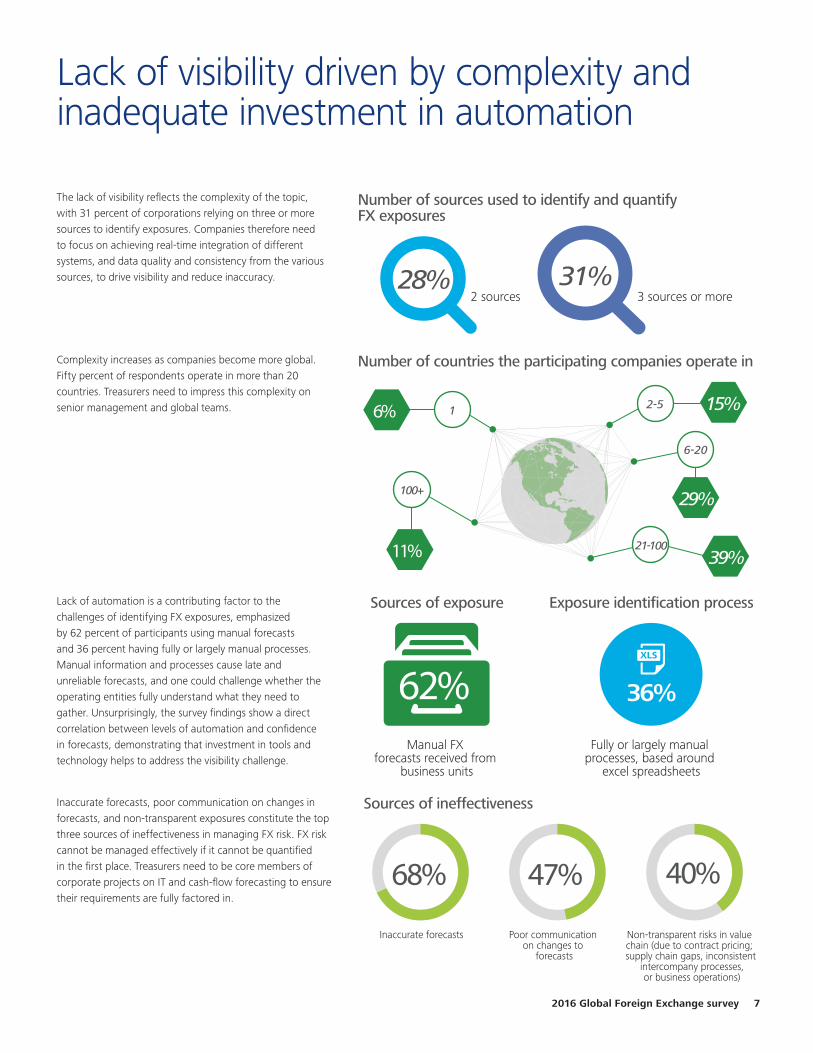
The lack of visibility reflects the complexity of the topic, with 31 percent of corporations relying on three or more sources to identify exposures. Companies therefore need to focus on achieving real-time integration of different systems, and data quality and consistency from the various sources, to drive visibility and reduce inaccuracy.
Complexity increases as companies become more global. Fifty percent of respondents operate in more than 20 countries. Treasurers need to impress this complexity on senior management and global teams.
Lack of automation is a contributing factor to the challenges of identifying FX exposures, emphasized by 62 percent of participants using manual forecasts and 36 percent having fully or largely manual processes. Manual information and processes cause late and unreliable forecasts, and one could challenge whether the operating entities fully understand what they need to gather. Unsurprisingly, the survey findings show a direct correlation between levels of automation and confidence in forecasts, demonstrating that investment in tools and technology helps to address the visibility challenge.
Inaccurate forecasts, poor communication on changes in forecasts, and non-transparent exposures constitute the top three sources of ineffectiveness in managing FX risk. FX risk cannot be managed effectively if it cannot be quantified in the first place. Treasurers need to be core members of corporate projects on IT and cash-flow forecasting to ensure their requirements are fully factored in.
Lack of visibility driven by complexity and inadequate investment in automation
Number of sources used to identify and quantify FX exposures
Number of countries the participating companies operate in
Sources of exposure Exposure identification process
Sources of ineffectiveness
Manual FX forecasts received from
business units
Fully or largely manual processes, based around
excel spreadsheets
2 sources 3 sources or more
68%
Inaccurate forecasts
47%
Poor communication on changes to
forecasts
40%
Non-transparent risks in value chain (due to contract pricing; supply chain gaps, inconsistent
intercompany processes, or business operations)
62% 36%
11%
6%
39%
29%
15%
21-100
6-20
2-5
100+
1
31%28%
To start a new section, hold down the apple+shift keys and click
to release this object and type the section title in the box below.
8
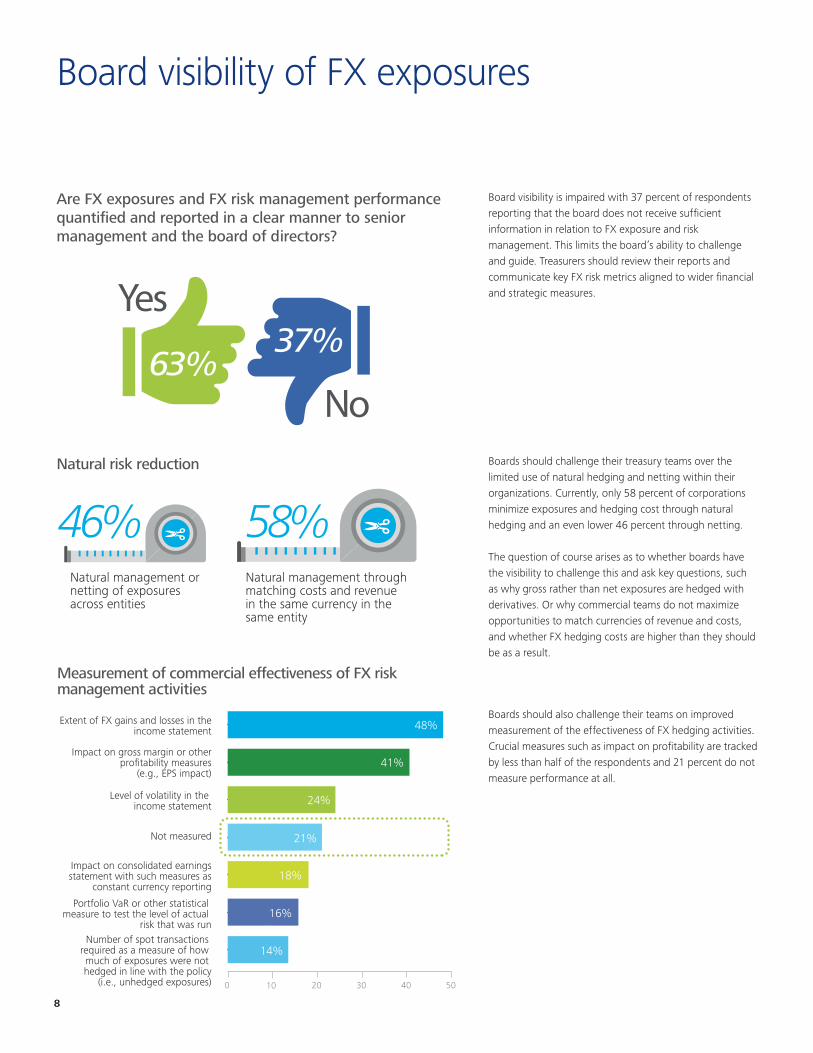
Board visibility is impaired with 37 percent of respondents reporting that the board does not receive sufficient information in relation to FX exposure and risk management. This limits the board’s ability to challenge and guide. Treasurers should review their reports and communicate key FX risk metrics aligned to wider financial and strategic measures.
Boards should challenge their treasury teams over the limited use of natural hedging and netting within their organizations. Currently, only 58 percent of corporations minimize exposures and hedging cost through natural hedging and an even lower 46 percent through netting. The question of course arises as to whether boards have the visibility to challenge this and ask key questions, such as why gross rather than net exposures are hedged with derivatives. Or why commercial teams do not maximize opportunities to match currencies of revenue and costs, and whether FX hedging costs are higher than they should be as a result.
Boards should also challenge their teams on improved measurement of the effectiveness of FX hedging activities. Crucial measures such as impact on profitability are tracked by less than half of the respondents and 21 percent do not measure performance at all.
Board visibility of FX exposures
Are FX exposures and FX risk management performance quantified and reported in a clear manner to senior management and the board of directors?
63%
Yes
No
37%
Natural risk reduction
Natural management through matching costs and revenue in the same currency in the same entity
58%Natural management or netting of exposures across entities
46%
0 10 20 30 40 50
Number of spot transactions required as a measure of how much of exposures were not hedged in line with the policy
(i.e., unhedged exposures)
Portfolio VaR or other statistical measure to test the level of actual
risk that was run
Impact on consolidated earningsstatement with such measures as
constant currency reporting
Not measured
Level of volatility in the income statement
Impact on gross margin or otherprofitability measures
(e.g., EPS impact)
Extent of FX gains and losses in theincome statement
Measurement of commercial effectiveness of FX risk management activities
48%
41%
24%
21%
18%
16%11%
14%

To start a new section, hold down the apple+shift keys and click
to release this object and type the section title in the box below.
2016 Global Foreign Exchange survey 9
Opportunity to improve reporting to the board
No dashboard reporting undertaken
Benchmarks and key performance indicators (i.e., impacts to EPS, gross margins, other income)
Stress test/scenario analysis
VaR or other "at risk" measures
FX activity summary (new trades, closed trades, settlements)
FX accounting analysis and results
Limit and compliance reports
Exposure forecast variances (actual to forecast comparison)
Hedged position and hedge coverage ratios
FX gains/losses
FX exposure summary
0 10 20 30 40 50 60 70 80
Key risk management dashboard reports used for the board of directors, risk committee,and/or senior management
72%
8%
14%
15%
17%
23%
24%
25%
26%
60%
61%
When reporting to senior management, more than 70 percent of respondents report only fairly basic metrics such as quantum of foreign exchange exposures, hedged positions, and foreign exchange gains/losses.
Less than 25 percent generate more sophisticated information such as performance against key benchmarks, variance analysis, VaR or other at-risk measures, stress tests, or scenario analysis.
Treasurers have an opportunity to improve the reporting provided to boards and senior management by incorporating the more complex underused analysis, as well as improved staple reporting.
To start a new section, hold down the apple+shift keys and click
to release this object and type the section title in the box below.
10
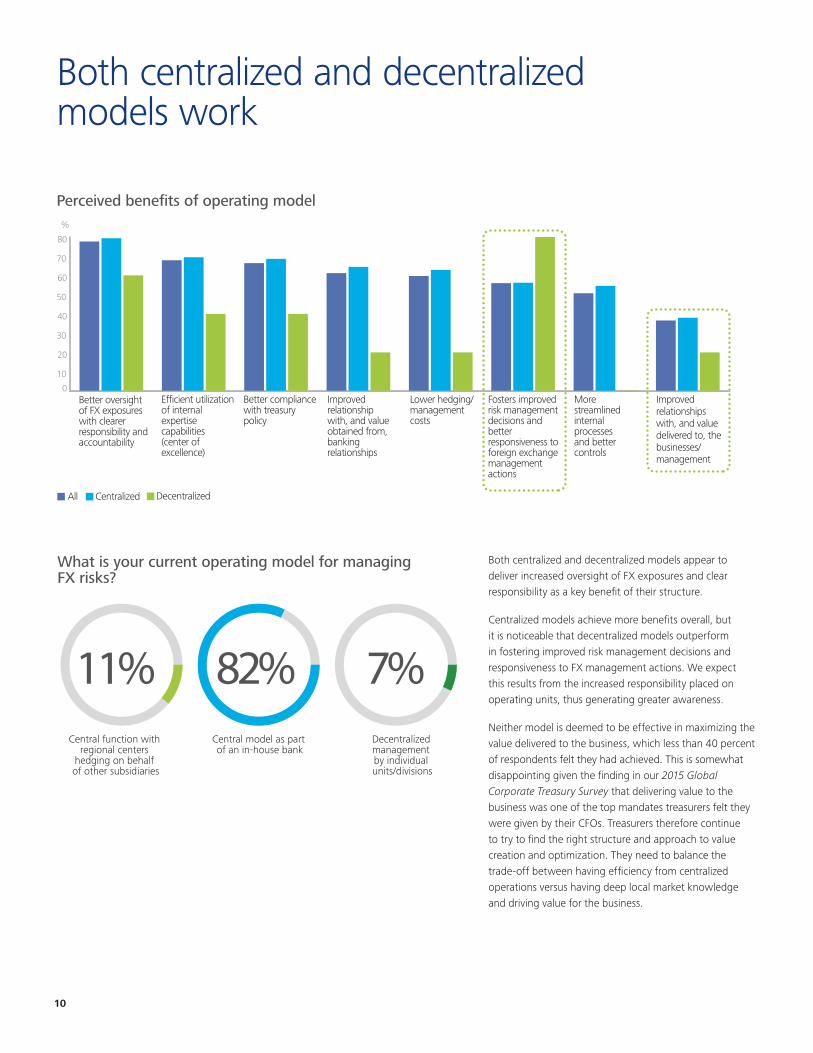
Both centralized and decentralized models work
What is your current operating model for managing FX risks?
Central function with regional centers
hedging on behalf of other subsidiaries
Central model as part of an in-house bank
Decentralized management by individual units/divisions
7%82%11%
Both centralized and decentralized models appear to deliver increased oversight of FX exposures and clear responsibility as a key benefit of their structure.
Centralized models achieve more benefits overall, but it is noticeable that decentralized models outperform in fostering improved risk management decisions and responsiveness to FX management actions. We expect this results from the increased responsibility placed on operating units, thus generating greater awareness.
Neither model is deemed to be effective in maximizing the value delivered to the business, which less than 40 percent of respondents felt they had achieved. This is somewhat disappointing given the finding in our 2015 Global Corporate Treasury Survey that delivering value to the business was one of the top mandates treasurers felt they were given by their CFOs. Treasurers therefore continue to try to find the right structure and approach to value creation and optimization. They need to balance the trade-off between having efficiency from centralized operations versus having deep local market knowledge and driving value for the business.
Improved relationshipswith, and value delivered to, the businesses/ management
More streamlined internal processes and better controls
Fosters improved risk management decisions and better responsiveness to foreign exchangemanagement actions
Better oversight of FX exposures with clearer responsibility and accountability
Efficient utilization of internal expertise capabilities (center of excellence)
Better compliance with treasury policy
Improved relationship with, and value obtained from, banking relationships
Lower hedging/ management costs
All Centralized Decentralized
%
0
10
20
30
40
50
60
70
80
Perceived benefits of operating model

To start a new section, hold down the apple+shift keys and click
to release this object and type the section title in the box below.
2016 Global Foreign Exchange survey 11
Hedging objectives focus on reducing income statement volatility
Primary hedging objectives
0 10 20 30 40 50
49%
47%
38%
35%
28%
26%
25%
16%
6%
11%
Mitigating subsidiary’s net equity or capitalbalance sheet translation impacts (net
investment) on parent’s financial statement
Manage year on year financial performance(e.g., to achieve smoothing)
Maintain marketplace competitive advantage
Protect/achieve annual budget FX rates
Protecting shareholder value
Protect subsidiary’s local currency cash flows
Minimize FX gains and losses due to theremeasurement of FX-denominated assets
and liabilities each period
Protect consolidated reported earnings in your Group reporting currency
Protect cash flows in Group reporting currency
Reduce income statement volatility andprotect subsidiary/local currency income
statement/earnings
Protecting the income statement (either in subsidiary local currency or Group reporting currency) and consolidated cash flows are key hedging objectives. Low on treasurers’ objectives list appears to be protecting balance sheet or net equity translation impacts. Most hedging objectives focus on protecting discrete periods. Only 11 percent manage year-on-year financial performance, which seems to contradict the fact that the majority of companies use rolling hedging programs. Hedging objectives should arguably focus not just on covering the nearest accounting period, but also on providing resilience to FX risk in the longer term and thus protecting business growth.
Less than a third of respondents claim to focus on protecting shareholder value and maintaining marketplace competitive advantage. However, we know that many organizations are aligning hedging with their commercial strategies. Hence, we expect that these low scores reflect the fact that while this is not a primary hedging objective, it nevertheless is one factor to consider when developing hedging strategies.
To start a new section, hold down the apple+shift keys and click
to release this object and type the section title in the box below.
12
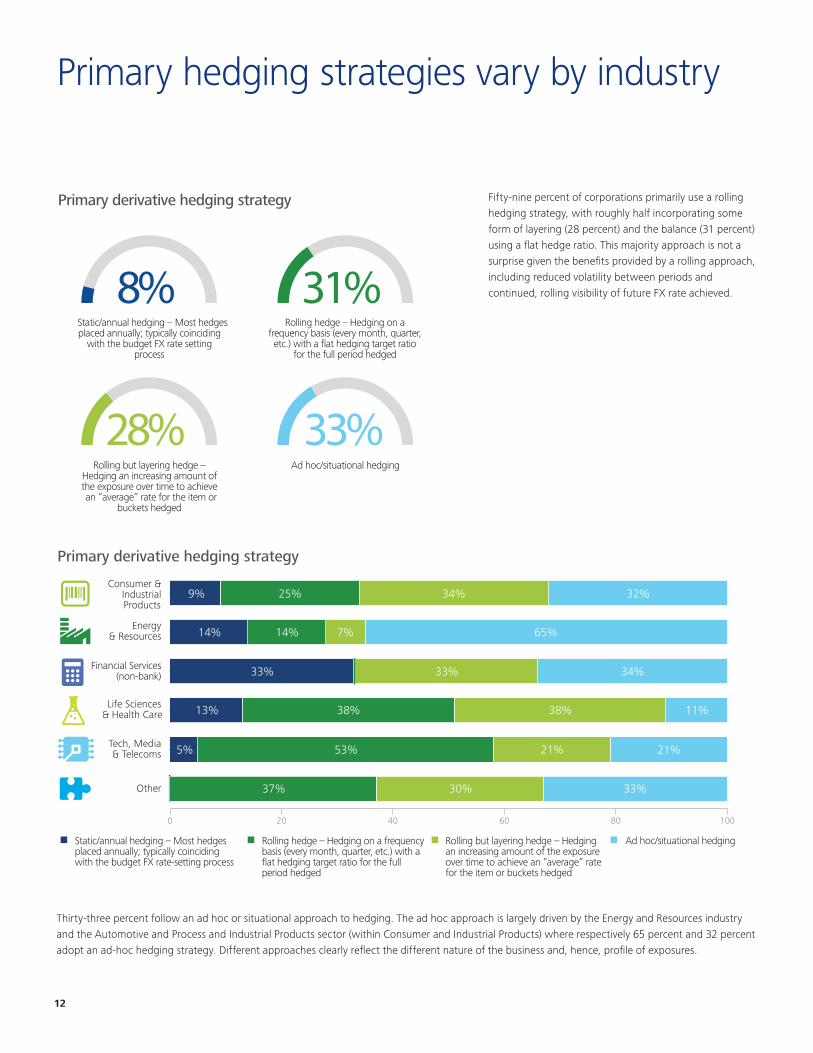
Primary hedging strategies vary by industry
Primary derivative hedging strategy
Static/annual hedging – Most hedges placed annually; typically coinciding
with the budget FX rate setting process
Rolling hedge – Hedging on a frequency basis (every month, quarter, etc.) with a flat hedging target ratio
for the full period hedged
Rolling but layering hedge – Hedging an increasing amount of the exposure over time to achieve an “average” rate for the item or
buckets hedged
Ad hoc/situational hedging
8% 31%
33%28%
Fifty-nine percent of corporations primarily use a rolling hedging strategy, with roughly half incorporating some form of layering (28 percent) and the balance (31 percent) using a flat hedge ratio. This majority approach is not a surprise given the benefits provided by a rolling approach, including reduced volatility between periods and continued, rolling visibility of future FX rate achieved.
Thirty-three percent follow an ad hoc or situational approach to hedging. The ad hoc approach is largely driven by the Energy and Resources industry and the Automotive and Process and Industrial Products sector (within Consumer and Industrial Products) where respectively 65 percent and 32 percent adopt an ad-hoc hedging strategy. Different approaches clearly reflect the different nature of the business and, hence, profile of exposures.
0 20 40 60 80 100
Other
Tech, Media& Telecoms
Life Sciences& Health Care
Financial Services(non-bank)
Energy& Resources
Consumer &IndustrialProducts
9% 25% 34% 32%
14%
33%
13%
5%
11%38%
53%
37% 30% 33%
38%
21% 21%
33% 34%
14% 7% 65%
Primary derivative hedging strategy
Ad hoc/situational hedgingStatic/annual hedging – Most hedges placed annually; typically coinciding with the budget FX rate-setting process
Rolling hedge – Hedging on a frequency basis (every month, quarter, etc.) with a flat hedging target ratio for the full period hedged
Rolling but layering hedge – Hedging an increasing amount of the exposure over time to achieve an “average” rate for the item or buckets hedged

To start a new section, hold down the apple+shift keys and click
to release this object and type the section title in the box below.
2016 Global Foreign Exchange survey 13
Missed opportunities in natural hedges
Surprisingly, only around half of respondents use natural risk management techniques such as cash-flow netting and exposure matching. As nearly 90 percent of respondents use derivatives, opportunities seem to exist to increase usage of natural hedging to reduce derivatives-related costs.
Of those using derivatives, the vast majority use FX forwards and FX swaps. Products such as options and collars are used by only a third of respondents. This is low, perhaps driven by the reluctance to pay premiums or due to the perceived lack of benefits and in-house skills to manage these instruments.
0 20 40 60 80 100
No FX risk management undertaken
Natural management viapass-through to suppliers
or customers
Natural management or netting of exposures across
entities
Natural management throughmatching costs and revenue in
the same currency in the same entity
Hedging using derivativeinstruments
Risk management approaches used
89%
58%
46%
28%
2%
FX forwards and non-deliverable forwards
FX swaps
Purchased FX options (and/or variations of forwards
with embedded options)
Cross-currency swaps
Issue foreign currency debt
FX collars
FX instruments used in hedging programs
92%
62%
30%
20%
18%
15%
To start a new section, hold down the apple+shift keys and click
to release this object and type the section title in the box below.
14
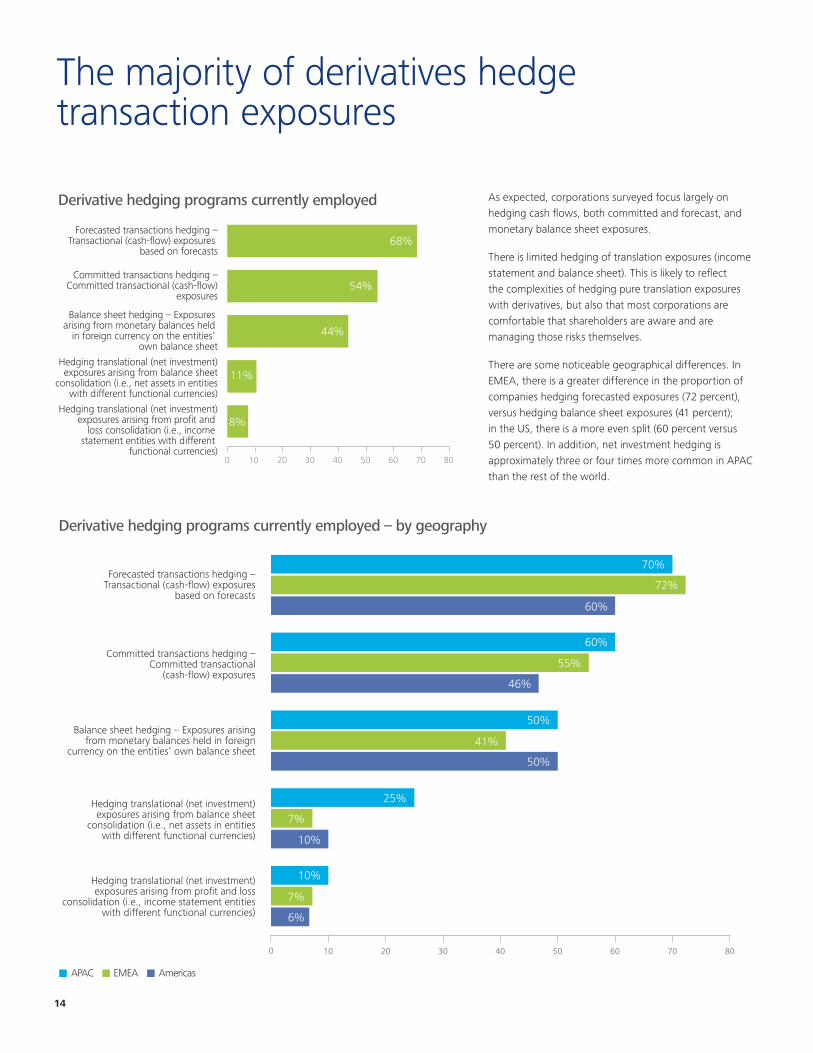
The majority of derivatives hedge transaction exposures
0 10 20 30 40 50 60 70 80
Hedging translational (net investment)exposures arising from profit and
loss consolidation (i.e., income statement entities with different
functional currencies)
Hedging translational (net investment)exposures arising from balance sheet
consolidation (i.e., net assets in entitieswith different functional currencies)
Balance sheet hedging – Exposures arising from monetary balances held
in foreign currency on the entities’ own balance sheet
Committed transactions hedging –Committed transactional (cash-flow)
exposures
Forecasted transactions hedging –Transactional (cash-flow) exposures
based on forecasts
Derivative hedging programs currently employed
68%
54%
44%
11%
8%
As expected, corporations surveyed focus largely on hedging cash flows, both committed and forecast, and monetary balance sheet exposures.
There is limited hedging of translation exposures (income statement and balance sheet). This is likely to reflect the complexities of hedging pure translation exposures with derivatives, but also that most corporations are comfortable that shareholders are aware and are managing those risks themselves.
There are some noticeable geographical differences. In EMEA, there is a greater difference in the proportion of companies hedging forecasted exposures (72 percent), versus hedging balance sheet exposures (41 percent); in the US, there is a more even split (60 percent versus 50 percent). In addition, net investment hedging is approximately three or four times more common in APAC than the rest of the world.
Derivative hedging programs currently employed – by geography 77%
APAC EMEA Americas
0 10 20 30 40 50 60 70 80
Forecasted transactions hedging – Transactional (cash-flow) exposures
based on forecasts
Committed transactions hedging – Committed transactional
(cash-flow) exposures
Balance sheet hedging – Exposures arising from monetary balances held in foreign
currency on the entities’ own balance sheet
Hedging translational (net investment) exposures arising from balance sheet
consolidation (i.e., net assets in entities with different functional currencies)
Hedging translational (net investment) exposures arising from profit and loss
consolidation (i.e., income statement entities with different functional currencies)
70%
72%
60%
55%
46%
50%
50%
41%
60%
25%
7%
7%
6%
10%
10%
To start a new section, hold down the apple+shift keys and click
to release this object and type the section title in the box below.
2016 Global Foreign Exchange survey 15
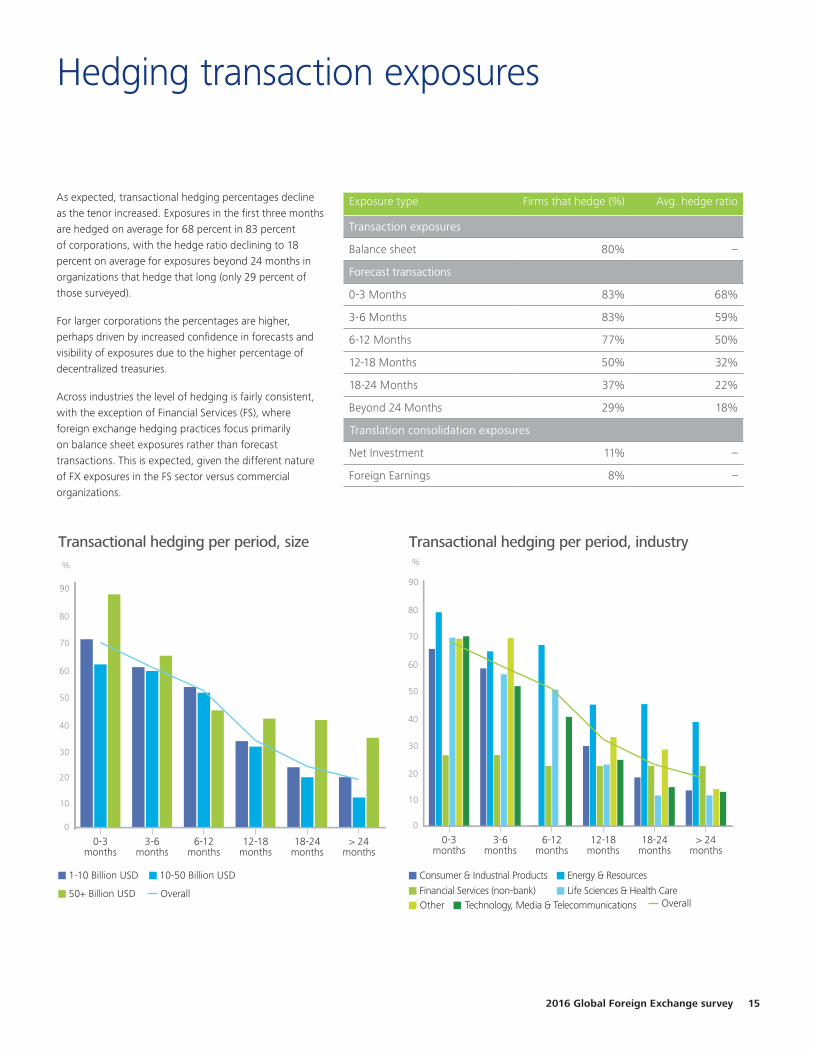
Hedging transaction exposures
As expected, transactional hedging percentages decline as the tenor increased. Exposures in the first three months are hedged on average for 68 percent in 83 percent of corporations, with the hedge ratio declining to 18 percent on average for exposures beyond 24 months in organizations that hedge that long (only 29 percent of those surveyed).
For larger corporations the percentages are higher, perhaps driven by increased confidence in forecasts and visibility of exposures due to the higher percentage of decentralized treasuries.
Across industries the level of hedging is fairly consistent, with the exception of Financial Services (FS), where foreign exchange hedging practices focus primarily on balance sheet exposures rather than forecast transactions. This is expected, given the different nature of FX exposures in the FS sector versus commercial organizations.
Exposure type Firms that hedge (%) Avg. hedge ratio
Transaction exposures
Balance sheet 80% –
Forecast transactions
0-3 Months 83% 68%
3-6 Months 83% 59%
6-12 Months 77% 50%
12-18 Months 50% 32%
18-24 Months 37% 22%
Beyond 24 Months 29% 18%
Net Investment 11% –
Foreign Earnings 8% –
1-10 Billion USD 10-50 Billion USD
50+ Billion USD Overall
0
10
20
30
40
50
60
70
80
90
> 24months
18-24months
12-18months
6-12months
3-6months
0-3months
Transactional hedging per period, size %
Translation consolidation exposures
Consumer & Industrial Products
%
Life Sciences & Health CareOther Technology, Media & Telecommunications
Energy & Resources
Financial Services (non-bank)
0
10
20
30
40
50
60
70
80
90
> 24months
18-24months
12-18months
6-12months
3-6months
0-3months
Overall
Transactional hedging per period, industry
To start a new section, hold down the apple+shift keys and click
to release this object and type the section title in the box below.
16
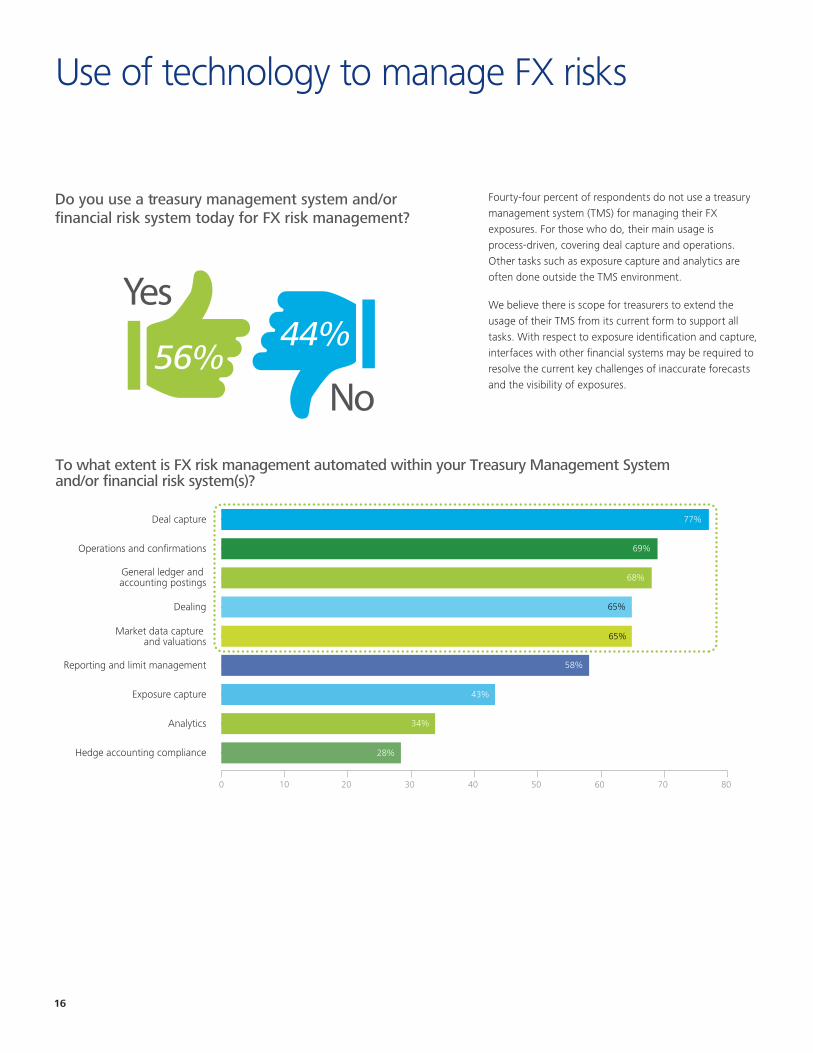
Use of technology to manage FX risks
0 10 20 30 40 50 60 70 80
Hedge accounting compliance
Analytics
Exposure capture
Reporting and limit management
Market data capture and valuations
Dealing
General ledger and accounting postings
Operations and confirmations
Deal capture
To what extent is FX risk management automated within your Treasury Management System and/or financial risk system(s)?
77%
69%
65%
68%
65%
58%
34%
43%
28%
Do you use a treasury management system and/or financial risk system today for FX risk management?
56%
Yes
No
44%
Fourty-four percent of respondents do not use a treasury management system (TMS) for managing their FX exposures. For those who do, their main usage is process-driven, covering deal capture and operations. Other tasks such as exposure capture and analytics are often done outside the TMS environment.
We believe there is scope for treasurers to extend the usage of their TMS from its current form to support all tasks. With respect to exposure identification and capture, interfaces with other financial systems may be required to resolve the current key challenges of inaccurate forecasts and the visibility of exposures.

To start a new section, hold down the apple+shift keys and click
to release this object and type the section title in the box below.
2016 Global Foreign Exchange survey 17
Accounting treatment influencing hedging strategies
The extent to which accounting treatments impact or drive hedging strategies
Not a driver but try to minimize undesired accounting implications
(where possible) but without changing the economically
preferred policy
Hedging strategy is influenced by the accounting treatment and
some adjustments are made where needed to achieve the desired
accounting treatment
Accounting treatment is a key driver (for example with a focus on minimizing accounting gains/losses)
No impact
35% 28%
17%20%
Accounting policies do not routinely drive hedging policies (only for 20 percent of organizations), but they are equally not routinely ignored (only 17 percent of respondents quoted that they have no impact). The more common impact of the accounting treatment is that it is one of the several influencers and/or policies that is tweaked, where possible, to avoid undesired accounting results.
This demonstrates the need for treasurers to balance the economically optimal hedging strategy with managing wider stakeholders’ expectations.
Adoption of hedge accounting treatment for FX derivatives
0 20 40 60 80 100
FX forwards and non-deliverable forwards
FX swaps
Purchased FX options (and/or variations of forwards with
embedded options)
Cross-currency swaps
Issue foreign currency debt
FX collars
19%
70% 30%
63%
70%
57%
51%
56%
37%
30%
43%
49%
44%
66%19% 13%
12%
Derivatives that do get hedge accounting treatment Derivatives that do not get hedge accounting treatment
To start a new section, hold down the apple+shift keys and click
to release this object and type the section title in the box below.
United KingdomDino [email protected]+44 20 7007 8545
United StatesNiklas [email protected]+1 203 905 2859
United StatesRichard [email protected]+1 312 486 4364
Australia Steven [email protected]+61 3967 1702
BelgiumKristine [email protected]+32 2 800 2651
CanadaPaul [email protected]+1 416 643 8037
ChinaFloyd Min [email protected]+86 21 2316 6585
IrelandPieter [email protected]+35 03 1417 2446
JapanKaoru [email protected]+81 804 597 4232
Middle EastIrshad [email protected] +971 4506 4928
South Africa Monique De [email protected]+27 11 304 5417
DenmarkMichael [email protected]+45 2030 4990
FranceCorrine [email protected]+33 14 088 8437
GermanyVolker [email protected]+49 211 8772 2399
India Muzammil [email protected]+91 22 6185 5490
South East AsiaBenny [email protected] +65 6800 2266
Spain Alejandro Gonzalez de [email protected]+34 91 443 2552
SwitzerlandDavina [email protected]+41 58 279 8090
The NetherlandsJeroen [email protected]+31 (0) 88 288 5928
US TaxJohn [email protected]+1.312.486.3141
UK TaxStephen [email protected]+44 20 7007 4568
Global & United StatesMelissa [email protected]+1 415 706 8227
United KingdomKarlien Porré[email protected]+44 20 7303 5153
18
Contacts
www.deloitte.com/us/globalfx

To start a new section, hold down the apple+shift keys and click
to release this object and type the section title in the box below.
2016 Global Foreign Exchange survey 19

Deloitte refers to one or more of Deloitte Touche Tohmatsu Limited (“DTTL”), a UK private company limited by guarantee, and its network of member firms, each of which is a legally separate and independent entity. Please see www.deloitte.co.uk/about for a detailed description of the legal structure of DTTL and its member firms.
Deloitte LLP is the United Kingdom member firm of DTTL.
This publication has been written in general terms and therefore cannot be relied on to cover specific situations; application of the principles set out will depend upon the particular circumstances involved and we recommend that you obtain professional advice before acting or refraining from acting on any of the contents of this publication. Deloitte LLP would be pleased to advise readers on how to apply the principles set out in this publication to their specific circumstances. Deloitte LLP accepts no duty of care or liability for any loss occasioned to any person acting or refraining from action as a result of any material in this publication.
© 2016 Deloitte LLP. All rights reserved.
Deloitte LLP is a limited liability partnership registered in England and Wales with registered number OC303675 and its registered office at 2 New Street Square, London EC4A 3BZ, United Kingdom. Tel: +44 (0) 20 7936 3000 Fax: +44 (0) 20 7583 1198.
Designed and produced by The Creative Studio at Deloitte, London. J3284