Continued Air Quality Forecast Support in Maryland using Ensemble Statistical Models Gregory Garner...
13
Continued Air Quality Forecast Support in Maryland using Ensemble Statistical Models Gregory Garner – Penn State Dr. Anne Thompson – Adviser Air Quality Applied Sciences Team 3 rd Meeting 13 June 2012
-
Upload
duane-jacobs -
Category
Documents
-
view
214 -
download
0
Transcript of Continued Air Quality Forecast Support in Maryland using Ensemble Statistical Models Gregory Garner...
Continued Air Quality Forecast Support in Maryland using Ensemble Statistical
ModelsGregory Garner – Penn StateDr. Anne Thompson – Adviser
Air Quality Applied Sciences Team3rd Meeting
13 June 2012

2
BackgroundMid-Atlantic Region
– 13th most ozone-polluted metropolitan area in US
– American Lung Association average ozone pollution grade: F
– 8.5+ million people
State of the Air, 2012; Mintz, 2009
3
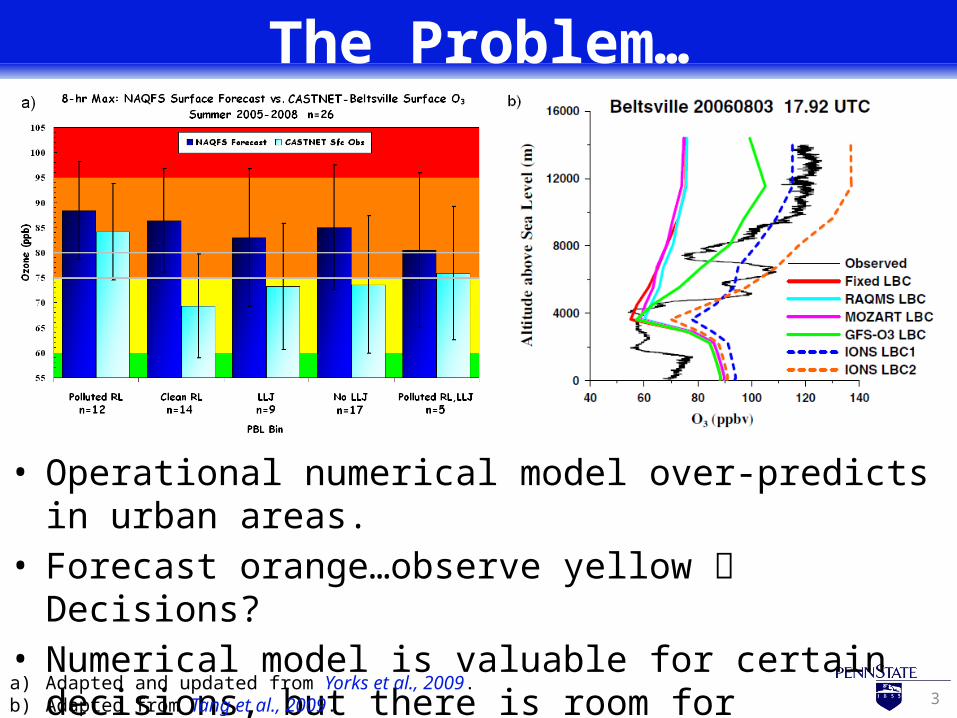
The Problem…
• Operational numerical model over-predicts in urban areas.• Forecast orange…observe yellow Decisions?• Numerical model is valuable for certain decisions, but there is
room for improvement (Garner and Thompson, 2012).
a) Adapted and updated from Yorks et al., 2009.b) Adapted from Tang et al., 2009.

4
The Problem…
• Deterministic forecasts do not convey uncertainty.• Responsibility to decision makers?• Weather model ensembles…AQ model ensembles?
Short Range Ensemble Forecast (SREF) – Total PrecipitationMadison / Dane Regional Airport (KMSN)

5
The Problem…• Standard statistical approaches
fall short in forecasting high-ozone events.
• Need method for dealing with non-normally distributed response.
6
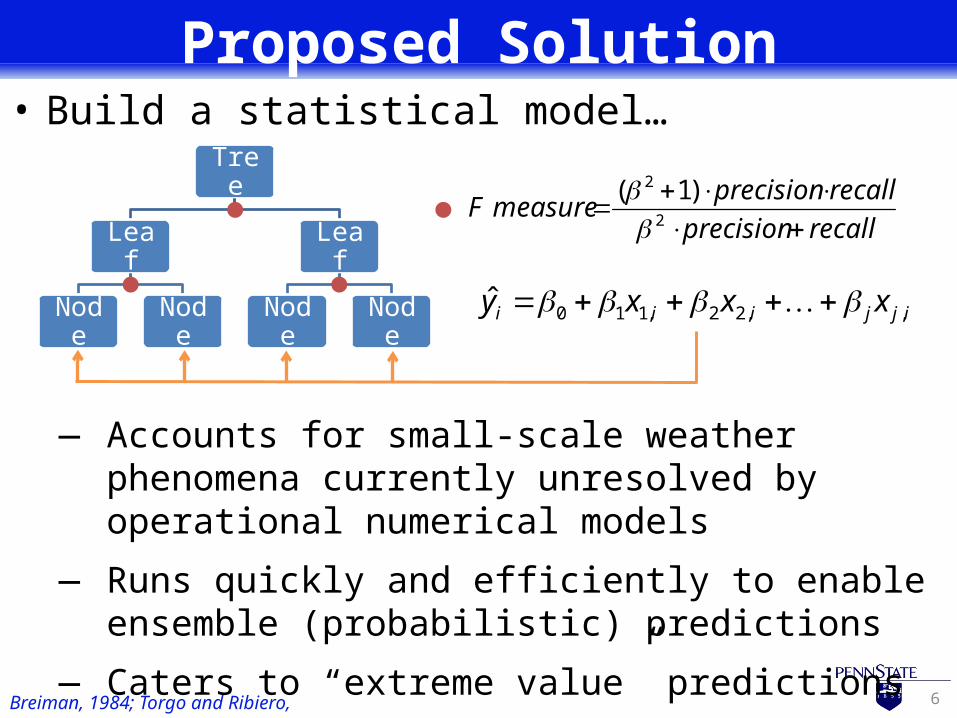
Proposed Solution• Build a statistical model…
Tree
Leaf
Node Node
Leaf
Node Node
Breiman, 1984; Torgo and Ribiero, 2003
recallprecision
recallprecisionmeasureF
2
2 )1(
ijjiii xxxy ,,22,110ˆ
― Accounts for small-scale weather phenomena currently unresolved by operational numerical models
― Runs quickly and efficiently to enable ensemble (probabilistic) predictions
― Caters to “extreme value” predictions

7
Data
Weather Datahttp://www.srh.noaa.gov/jetstream/
synoptic/wxmaps.htm
Ozone Datahttp://www.weather.gov/aq
Chronological Datahttp://lukas85.tumblr.com/post/18550727456/lousy-
smarch-weather
Tree
Leaf
Node Node
Leaf
Node Node
Tree
Leaf
Node Node
Leaf
Node Node
Tree
Leaf
Node Node
Leaf
Node Node
http://school.discoveryeducation.com/clipart/clip/cowboys2.html
8
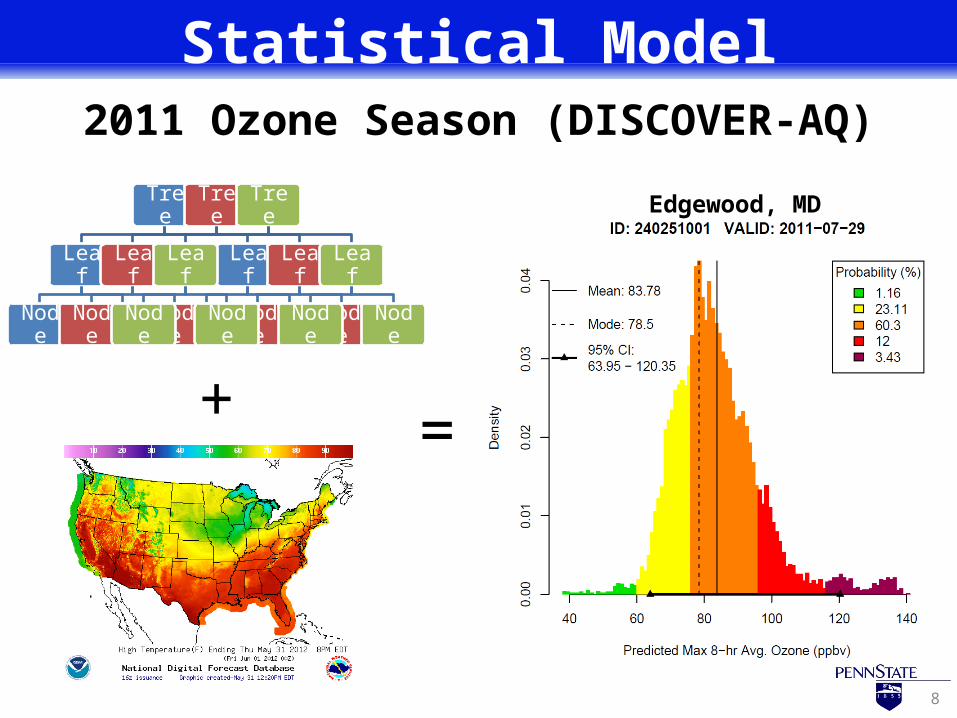
Statistical Model2011 Ozone Season (DISCOVER-AQ)
+ =
Edgewood, MDTree
Leaf
Node Node
Leaf
Node Node
Tree
Leaf
Node Node
Leaf
Node Node
Tree
Leaf
Node Node
Leaf
Node Node
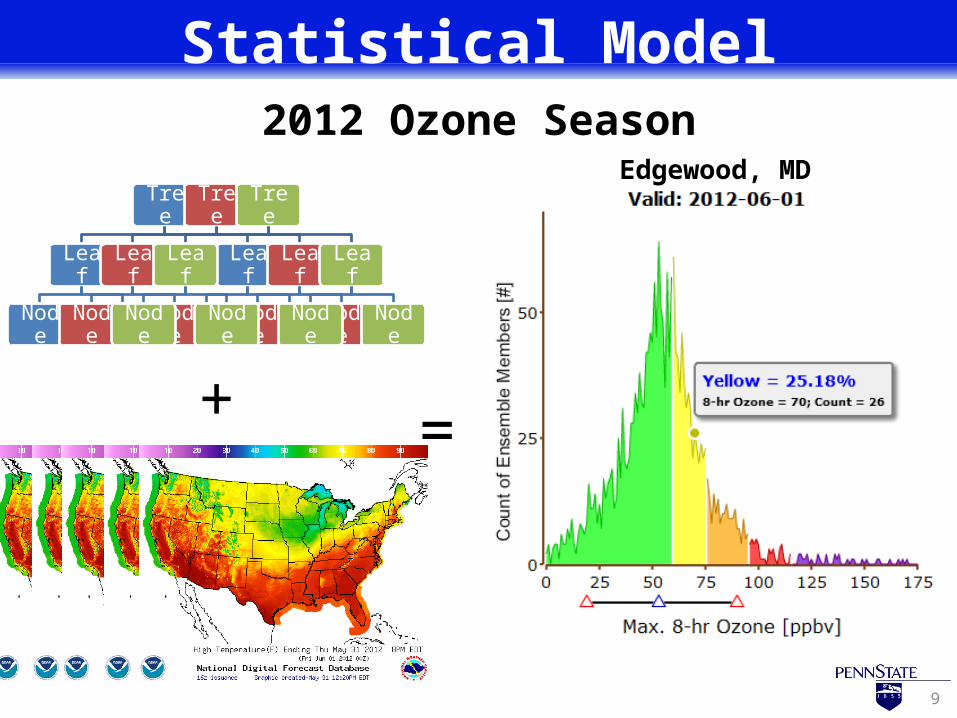
9
Statistical Model
+ =
Tree
Leaf
Node Node
Leaf
Node Node
Tree
Leaf
Node Node
Leaf
Node Node
Tree
Leaf
Node Node
Leaf
Node Node
Edgewood, MD
2012 Ozone Season
10
Web-Based Interface• Deliver product to regional air quality forecasters
http://www.meteo.psu.edu/~ggg121/aq

12
Summary• AQ Modeling efforts are difficult in the Mid-Atlantic– Urban centers and complex coastal environments– Susceptible to small-scale meteorological phenomena– Statistical distribution of ozone is not normal
• Statistical Model Development– Bootstrap-aggregation of regression trees– F-measure for splits and node evaluation– Operational forecasts with SREF
• Web-based Model Interface– www.meteo.psu.edu/~ggg121/aq

13
Acknowledgements & References
Breiman, L., 1984: Classification and regression trees. Wadsworth statistics/probability series, Wadsworth International Group.
Efron, B. and R. J. Tibshirani, 1993: An Introduction to the Bootstrap. Chapman and Hall, 436pp.
Garner, G. G., A. M. Thompson, 2012: The value of air quality forecasting in the mid-atlantic region. Wea. Climate Soc., 4, 69–79. doi: 10.1175/WCAS-D-10-05010.1 Johnson, D. L. et al., 1997: Meanings of environmental terms. J. Environ. Quality, 26, 581-89.
Mintz, D., 2009: Technical assistance document for the reporting of daily air quality: The Air Quality Index (AQI). Tech. Rep. EPA-454/B-09-001, Environmental Protection Agency, 31 pp.
State of the air 2012. Tech. rep., American Lung Association, http://www.stateoftheair.org/2012/city-rankings/most-polluted-cities.html
Torgo, L. and R. Ribeiro, 2003: Predicting outliers. Knowledge Discovery in Databases: PKDD 2003, N. Lavrac, D. Gamberger, L. Todorovski, and H. Blockeel, Eds., Springer Berlin / Heidelberg, Lecture Notes in Computer Science, Vol. 2838, 447-458.
Tang, Y. et al., 2009: The impact of chemical lateral boundary conditions on CMAQ predictions of tropospheric ozone over the continential United States. Environ. Fluid. Mech., 9, 43–58, doi: 10.1007/s10652-008-9092-5
Wilks, D. S., 2011: Statistical Methods in the Atmospheric Sciences. 3d ed., Elsevier, 676 pp.
• NASA AQAST (Daniel Jacob, Harvard Univ.), DISCOVER-AQ (Jim Crawford, NASA Langley; Ken Pickering, NASA GSFC)
• Laura Landry (MDE), Dan Salkovitz (VA-DEQ), Bill Ryan (PSU), Sunil Kumar (MWCOG)
• EPA – STAR Fellowship Program (FP–91729901–0)
• Gator Research Group (PSU – Meteo)

14
EPA Disclaimer
This presentation was developed with support from STAR Fellowship Assistance Agreement no. FP–91729901–0 awarded by
the U.S. Environmental Protection Agency (EPA). It has not been formally reviewed by EPA. The views expressed in this presentation are solely those of Gregory Garner, and the EPA does not endorse any products or commercial
services mentioned in this presentation.
The Simpsons Movie http://www.behindthevoiceactors.com/_img/chars/char_45470.jpg