Continental Airlines, Inc. 2004 Annual Report
52
excellence the world over Continental Airlines 2005 Annual Report
Transcript of Continental Airlines, Inc. 2004 Annual Report

excellencethe world overContinental Airlines 2005 Annual Report
2005 Accomplishments
Fly to Win
• Successfully launched service to more than a dozen new internationaldestinations – the largest internationalexpansion in Continental’s history
• Reduced distribution costs by focusingon direct bookings. In 2005, sales oncontinental.com grew 38 percent
• Implemented e-Ticketing with additional carriers
Fund the Future
• Achieved substantially all of the $500 million in annual wage and benefit reductions targeted in late 2004 as part of a $1.6 billion annual cost-cutting and revenue-generating initiative
• Ended 2005 with a record $1.96 billion in unrestricted cash
• Contributed $354 million to employee pension plans
• Successfully raised more than $1.1 billion in the capital markets
• Continued to add winglets to757-200 and 737-800 aircraft
Make Reliability a Reality
• No. 1 among network peers for fewest cancellations
• No. 1 among network peers for fewest mishandled bags
• No. 1 among network peers for fewest customer complaints
• No. 2 among network peers for best on-time performance
Working Together
• Offered jobs to substantially all furloughed employees and resumed hiring
• Held 15 CEO Exchanges – morethan double the number in previousyears – with more than 7,000 co-workers in attendance
• Named OAG Airline of the Year for the second year in a row
• Named Fortune magazine’s America’sMost Admired airline as well as theMost Admired global airline

1
Financial Highlights
(In millions, except per share data) 2005 2004 2003 2002 2001
Operating Revenue $ 1 1,208 $ 9,899 $ 9,001 $ 8,511 $ 9,049Operating Expenses 1 1,247 10,137 8,813 8,841 8,921Operating Income (Loss) (39) (238) 188 (330) 128Net Income (Loss) (68) (409) 28 (462) (105)Diluted Earnings (Loss) per Share (0.97) (6.25) 0.41 (7.19) (1.89)Cash and Short-Term Investments 2,198 1,669 1,600 1,342 1,132Total Assets 10,529 10,511 10,620 10,615 9,778Long-Term Debt and
Capital Lease Obligations 5,057 5,167 5,558 5,471 4,448
Operating Statistics
(Mainline jet operations only, excludingregional jets operated by ExpressJet) 2005 2004 2003 2002 2001
Passengers (thousands) (a) 44,939 42,743 40,613 41,777 45,064Revenue Passenger Miles (millions) (b) 71,26 1 65,734 59,165 59,349 61,140Available Seat Miles “ASM” (millions) (c) 89,647 84,672 78,385 80,122 84,485Passenger Load Factor (d) 79.5% 77.6% 75.5% 74.1% 72.4%Passenger Revenue per ASM 9.32¢ 8.82¢ 8.79¢ 8.67¢ 9.03¢Operating Cost per ASM 10.22¢ 9.84¢ 9.53¢ 9.63¢ 9.34¢Operating Cost per ASM,
excluding special items (e) 10. 1 5¢ 9.68¢ 9.64¢ 9.38¢ 9.70¢Average Price per Gallon of Fuel,
including fuel taxes 177.55¢ 119.01¢ 91.40¢ 74.01¢ 82.48¢Fuel Gallons Consumed (millions) 1,376 1,333 1,257 1,296 1,426Aircraft in Fleet at End of Period (f ) 356 349 355 366 352
(a) Revenue passengers measured by each flight segment flown.(b) The number of scheduled miles flown by revenue passengers.(c) The number of seats available for passengers multiplied by the number of scheduled miles those seats are flown.(d) Revenue passenger miles divided by available seat miles.(e) Excludes the mainline jet portion of special items that impact operating costs. See Note 7 of the Condensed
Consolidated Financial Statements for a description of items.(f ) Excludes aircraft that were removed from service.
C O N T I N E N T A L A I R L I N E S 2 0 0 5 A N N U A L R E P O R T
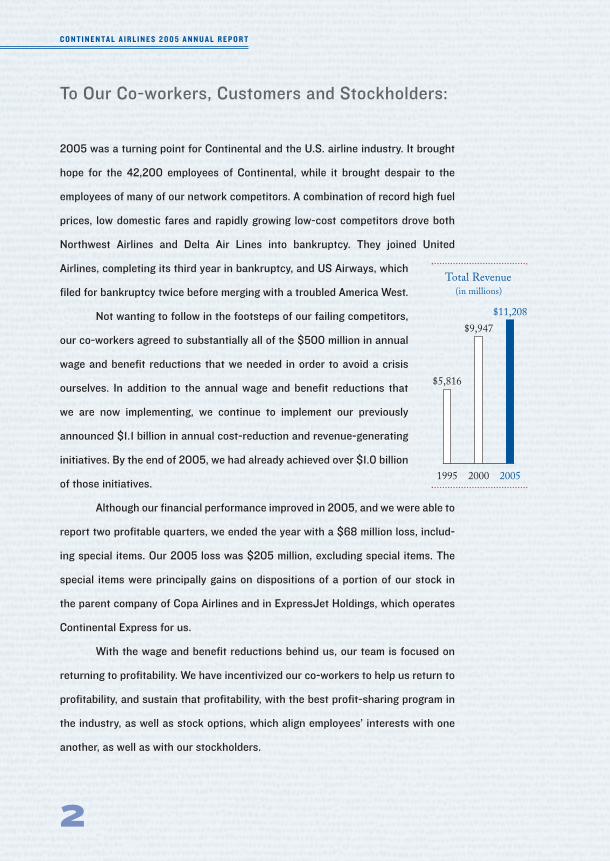
2005 was a turning point for Continental and the U.S. airline industry. It brought
hope for the 42,200 employees of Continental, while it brought despair to the
employees of many of our network competitors. A combination of record high fuel
prices, low domestic fares and rapidly growing low-cost competitors drove both
Northwest Airlines and Delta Air Lines into bankruptcy. They joined United
Airlines, completing its third year in bankruptcy, and US Airways, which
filed for bankruptcy twice before merging with a troubled America West.
Not wanting to follow in the footsteps of our failing competitors,
our co-workers agreed to substantially all of the $500 million in annual
wage and benefit reductions that we needed in order to avoid a crisis
ourselves. In addition to the annual wage and benefit reductions that
we are now implementing, we continue to implement our previously
announced $1.1 billion in annual cost-reduction and revenue-generating
initiatives. By the end of 2005, we had already achieved over $1.0 billion
of those initiatives.
Although our financial performance improved in 2005, and we were able to
report two profitable quarters, we ended the year with a $68 million loss, includ-
ing special items. Our 2005 loss was $205 million, excluding special items. The
special items were principally gains on dispositions of a portion of our stock in
the parent company of Copa Airlines and in ExpressJet Holdings, which operates
Continental Express for us.
With the wage and benefit reductions behind us, our team is focused on
returning to profitability. We have incentivized our co-workers to help us return to
profitability, and sustain that profitability, with the best profit-sharing program in
the industry, as well as stock options, which align employees’ interests with one
another, as well as with our stockholders.
2
C O N T I N E N T A L A I R L I N E S 2 0 0 5 A N N U A L R E P O R T
To Our Co-workers, Customers and Stockholders:
2000
Total Revenue(in millions)
$9,947
1995
$5,816
2005
$11,208

3
First Row Left >Right: Tony Verdisco – Technician, Mike Sandell –Technician, Paula McDonough – Operations Manager Second Row
Left >Right: Darren Henderson – 737 First Officer, Steve Holbert –737 Captain
New York, NY, USA

4
First Row Left >Right: Gaynail Husdon – Reservations Electronic ServiceSupport, Luzminda Villamor – Chelsea Cold Food Production AssociateSecond Row Left >Right: Joan Reid – Flight Attendant, Betty Jo Prior –Flight Attendant, Ron M. White – International Service Manager,Lee Tarbox – 767 First Officer, Paul Villery – 767 First Officer
Buenos Aires, Argentina
5
C O N T I N E N T A L A I R L I N E S 2 0 0 5 A N N U A L R E P O R T
Go Forward PlanOur Go Forward Plan continued to guide us in 2005, as it has in the past. It is a
straightforward business plan that all our co-workers understand, with clear and
measurable goals that we set and communicate every year. Our Go Forward Plan
has four cornerstones – Fly to Win (our marketing plan), Fund the Future (our
financial plan), Make Reliability a Reality (our product
plan) and Working Together (our people plan).
Let’s review what we accomplished in 2005, and
where we are headed in 2006:
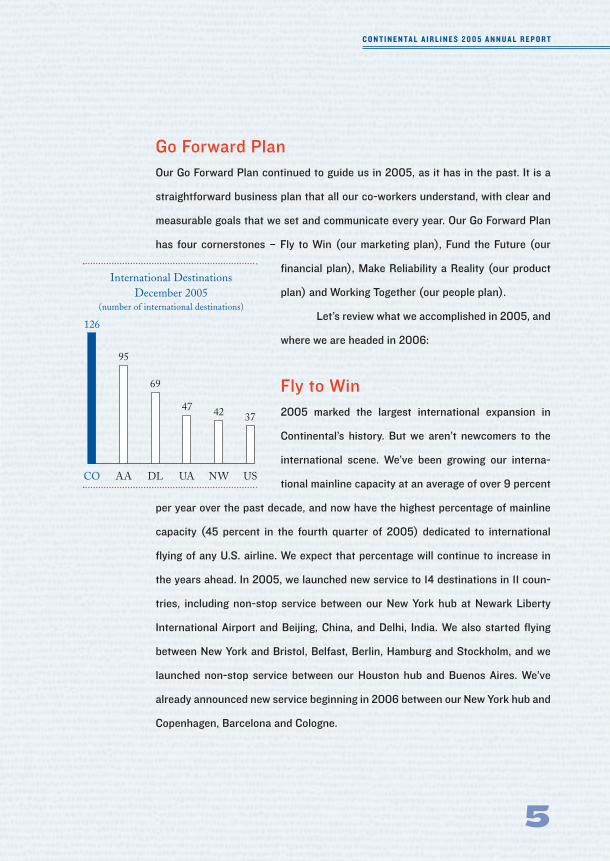
Fly to Win2005 marked the largest international expansion in
Continental’s history. But we aren’t newcomers to the
international scene. We’ve been growing our interna-
tional mainline capacity at an average of over 9 percent
per year over the past decade, and now have the highest percentage of mainline
capacity (45 percent in the fourth quarter of 2005) dedicated to international
flying of any U.S. airline. We expect that percentage will continue to increase in
the years ahead. In 2005, we launched new service to 14 destinations in 11 coun-
tries, including non-stop service between our New York hub at Newark Liberty
International Airport and Beijing, China, and Delhi, India. We also started flying
between New York and Bristol, Belfast, Berlin, Hamburg and Stockholm, and we
launched non-stop service between our Houston hub and Buenos Aires. We’ve
already announced new service beginning in 2006 between our New York hub and
Copenhagen, Barcelona and Cologne.
NW
International DestinationsDecember 2005
(number of international destinations)
42
UA
47
DL
69
AA
95
CO
126
US
37

We can grow internationally because we have the right people, the right
hub facilities and the right fleet and product mix. Our Global Gateway at Liberty,
our new international facility in Houston and the expanded federal inspection and
customs stations at both airports permit us to continue to grow our international
flying. Moreover, our international fleet of Boeing 757, 767 and 777 aircraft, all of
which are equipped to offer Continental’s award-winning
BusinessFirst product, permits us to match the aircraft with
the mission with great precision. By adding winglets to our
757-200 fleet to extend their range, we can serve relatively
small markets in Europe non-stop from New York. Our com-
petitors, on the other hand, are forced to use larger and
more expensive aircraft in order to make the mission from
inland hubs like Atlanta or Chicago. This, coupled with the
fact that we are the only network carrier with a full-service
hub in the huge New York market, gives us a natural advan-
tage to continue our international growth to Europe.
Additionally, we will maintain our domestic network to provide a broad
choice of destinations and flights for our customers, as well as to feed our inter-
national growth. While the industry’s domestic capacity is projected to shrink in
2006, we intend to grow our domestic mainline capacity more than 4 percent, and
we expect to grow our consolidated capacity (that is, both domestic and interna-
tional mainline, and Continental Express) by more than 8 percent. Beyond 2006,
we intend to continue to grow our consolidated capacity at a 5 percent to 7 percent
rate as we capitalize on our people, product and fleet advantages, as well as our
hub geography advantage, in a rapidly changing industry.
6
C O N T I N E N T A L A I R L I N E S 2 0 0 5 A N N U A L R E P O R T
2000
Consolidated Available Seat Miles (in millions)
90,835
1995
62,542
2005
101,620

7
First Row Left >Right: Yashir Cordero – Customer Service Agent,Kenya Ross-Elliott – Flight Attendant Second Row Left : Joe Orenczak –Customer Service Representative
Delhi, India

8
First Row Left >Right: Andris Abreu – Technician, Wendy Stewart –Flight Attendant Second Row: Darren Almazan – Customer Service Agent
Mexico City, Mexico

9
C O N T I N E N T A L A I R L I N E S 2 0 0 5 A N N U A L R E P O R T
We continue to focus on making our product easy to purchase through any
distribution channel our customers prefer, while reducing our distribution costs.
Increasingly, our customers are buying their tickets directly from us, with our sales
on continental.com growing 38 percent in 2005 to $2.1 billion, and our sales
through our internal reservations group growing to $1.1 billion in 2005. We expect
sales on continental.com alone to exceed $3 billion for 2006.
Fund the FutureWe ended 2005 with a record $1.96 billion in unrestricted
cash and short-term investments, and had total cash and
short term investments of $2.2 billion. Maintaining adequate
liquidity in a time of record high fuel prices (at one point in
October 2005, the price of jet fuel exceeded $130 per barrel)
and fierce domestic competition is more important than ever.
In 2005, we successfully executed a number of
financing transactions to assure we maintained adequate cash balances. In April,
we raised $75 million by pre-selling OnePass miles to Chase as part of our
co-branded credit card program with them. We borrowed $350 million in June,
secured by the assets of our subsidiary, Continental Micronesia. In October,
we sold 18 million shares of our common stock, raising $203 million. Finally, in
December, we sold 9 million of our 21 million shares of the parent company of Copa
Airlines for $172 million.
2000
Year End Unrestricted Cash and Short-Term Investments
(in millions)
$1,387
1995
$603
2005
$1,957

Unlike many of our competitors, we have lived up to the promise of retire-
ment security that we made to our co-workers. In 2005, we contributed $354 mil-
lion to our pension plans. We know how important a secure future is to our
co-workers, and we remain committed to fulfilling the promises we’ve made, even
in these hard times.
We also added to our fleet to accommodate
our growth and the changing market. In 2005, we
took delivery of seven Boeing 737-800 aircraft and
six Boeing 757-300 aircraft. We are using the high-
capacity, low-cost 757-300 on our high-demand,
low-fare domestic routes to compete more effec-
tively with low-cost carriers. Those aircraft free up
winglet-equipped longer-range Boeing 757-200 air-
craft for use in new European markets from our
New York hub. We are retrofitting the BusinessFirst
cabin of our 757-200 aircraft with the latest digital in-flight entertainment
systems and 110-volt power ports for computers and other personal electronic
devices. We expect to take delivery of six more Boeing 737-800s and two more
Boeing 757-300 aircraft in 2006.
We now have blended winglets on over half of our 132 Boeing 737-700
and -800 aircraft, and on 15 of our 41 Boeing 757-200 aircraft. Winglets increase
the fuel efficiency of those aircraft by up to 5 percent, providing additional range.
10
C O N T I N E N T A L A I R L I N E S 2 0 0 5 A N N U A L R E P O R T
2000
Young Fleet is Fuel Efficient (percent growth in ASMs per fuel gallon vs. 1994)
15.0
1995
3.9
2005
33.4

11
First Row Left >Right: Shige Komatsu – Customer Service Representative,Miguel Belecazar Rodriguez – Chelsea Transportation Agent
Tokyo, Japan

12
First Row Left >Right: Amanda Saenz – Flight Attendant, Julio Reyes –Flight Attendant Second Row: Michael Carrington – Lead Cargo Sales Agent
Paris, France
13
C O N T I N E N T A L A I R L I N E S 2 0 0 5 A N N U A L R E P O R T
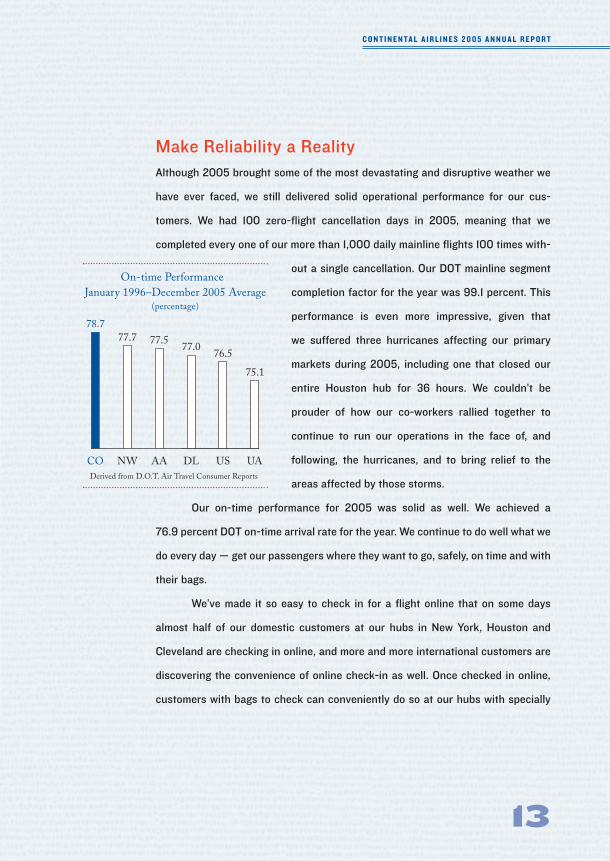
Make Reliability a RealityAlthough 2005 brought some of the most devastating and disruptive weather we
have ever faced, we still delivered solid operational performance for our cus-
tomers. We had 100 zero-flight cancellation days in 2005, meaning that we
completed every one of our more than 1,000 daily mainline flights 100 times with-
out a single cancellation. Our DOT mainline segment
completion factor for the year was 99.1 percent. This
performance is even more impressive, given that
we suffered three hurricanes affecting our primary
markets during 2005, including one that closed our
entire Houston hub for 36 hours. We couldn’t be
prouder of how our co-workers rallied together to
continue to run our operations in the face of, and
following, the hurricanes, and to bring relief to the
areas affected by those storms.
Our on-time performance for 2005 was solid as well. We achieved a
76.9 percent DOT on-time arrival rate for the year. We continue to do well what we
do every day — get our passengers where they want to go, safely, on time and with
their bags.
We’ve made it so easy to check in for a flight online that on some days
almost half of our domestic customers at our hubs in New York, Houston and
Cleveland are checking in online, and more and more international customers are
discovering the convenience of online check-in as well. Once checked in online,
customers with bags to check can conveniently do so at our hubs with specially
US
On-time Performance January 1996–December 2005 Average
(percentage)
76.5
DL
77.0
AA
77.5
NW
77.7
CO
78.7
UA
75.1
Derived from D.O.T. Air Travel Consumer Reports

designated eService bag drop kiosks and be quickly on their way. For customers
who prefer to check in at a kiosk at the airport, we now have over 1,000 kiosks,
located at almost every airport we serve. We are also implementing highly
advanced voice recognition software so that customers calling our reservations or
OnePass numbers can conduct their business faster and more accurately, and at
a lower cost to us.
We are also a leader in interline eTicketing,
which permits our customers to travel on multiple
airlines on the same itinerary, while checking their
luggage through to their final destination, all with the
convenience of an eTicket. We now have interline
eTicketing with 42 carriers, including all of our
SkyTeam partners, and will continue to increase that
number during 2006. We expect to completely elimi-
nate paper tickets well before the year-end 2007
mandate of the International Air Transport Association. The elimination of paper
tickets and the infrastructure necessary to support them will save us significant
costs, as well as bring greater convenience to our customers.
Working Together2005 demonstrated just how strong our culture of Working Together really is.
Faced with a choice of doing what was needed to avert a crisis, or following in the
footsteps of our failing competitors, our employees worked together and agreed to
the wage and benefit reductions and work rule changes we needed. Their actions,
14
C O N T I N E N T A L A I R L I N E S 2 0 0 5 A N N U A L R E P O R T
AA
Mishandled Baggage January 1996–December 2005 Average
(per 1,000 passengers)
4.95
NW
4.89
DL
4.67
US
4.57
CO
3.96
UA
5.67
Derived from D.O.T. Air Travel Consumer Reports

15
First Row Left >Right: Carlton Hicks – Hub Customer Service Supervisor,Darla Ramby – Customer Service Agent Second Row: Ivan Vargas –Chelsea Transportation Agent
London, England
16
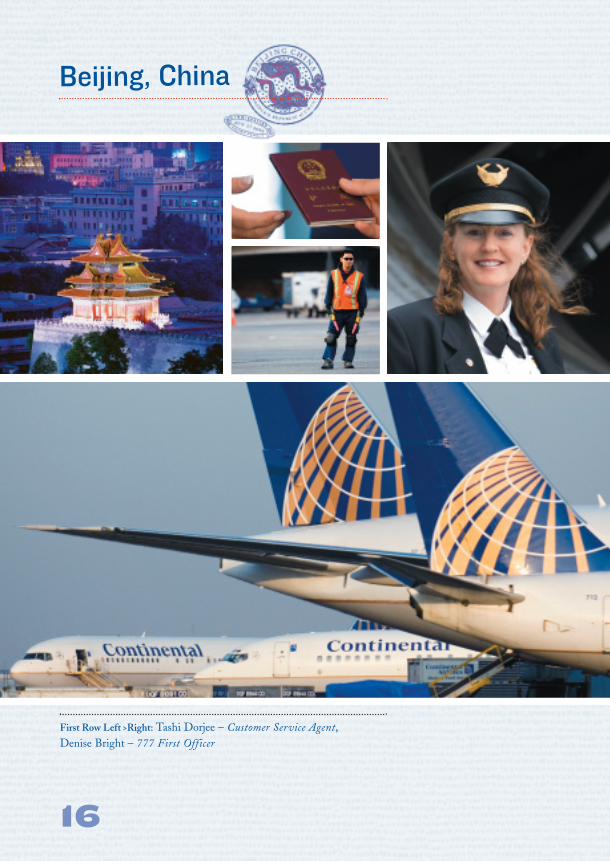
First Row Left >Right: Tashi Dorjee – Customer Service Agent,Denise Bright – 777 First Officer
Beijing, China

17
C O N T I N E N T A L A I R L I N E S 2 0 0 5 A N N U A L R E P O R T
and the faith that they showed in each other and in the company, permitted us to
survive, grow and move again toward profitability. We are now growing, while
most of our competitors are shrinking. We are now hiring, while many of our
competitors are furloughing. We are now growing our cash balance, while many
of our competitors are burning cash at alarming rates. We are now focused on
returning to profitability and expanding the opportunities for all of our
employees, while many of our competitors are focused on bankers,
lawyers and judges.
We achieved the needed pay and benefit reductions without the
rancor that is occurring at our competitors, and without any service
interruptions to our customers. In fact, our service continues to be ranked
as the best in the business. In 2005, Continental won “Airline of the Year”
and “Best Airline Based in North America” at the 2005 OAG Airline of the
Year Awards for the second consecutive year, and “Best Executive/
Business Class” for the third consecutive year. In its 2005 survey of
airline industry leaders and analysts, FORTUNE magazine named Continental the
No. 1 Most Admired Global Airline on its 2006 list of Most Admired Global
Companies for the third straight year.
And our co-workers will share in our future success. Not only did we issue
stock options to our co-workers who took pay and benefit cuts, but we also imple-
mented the best profit-sharing program in the airline industry. We firmly believe
that we all should win together or we will lose together — and we intend to win.
2000
Pension Assets(in millions)
$1,206
1995
$392
2005
$1,421

We also continued our on-time bonus program and our perfect attendance
program during 2005, because they work. Our business depends on having
employees who enjoy coming to work every day, who are proud of the job they do
and who trust each other and management. Our culture of open and honest com-
munication, treating each other with dignity and respect, and working together, is
the magic that has gotten us through these difficult times, and
will help us build a more secure future.
In SummaryWe remain a focused, disciplined and nimble company. We are
an aggressive competitor, with the best people and the best
product in the industry. We will never lose our focus on the
basics of our business, and the key to our success — deliver-
ing clean, safe and reliable air transportation, and offering the
product that people want and are willing to pay for, delivered by
employees who enjoy coming to work and working together.
2005 has proven to be the turning point we expected it to be when we
wrote you last year. We have substantially achieved a cost structure that we
believe will allow us to compete, and be successful, in the rapidly restructuring
industry environment. Our people, our product and our assets continue to deliver
a unit revenue premium compared to our competitors. Unlike our failing or failed
competitors, we are excited about 2006 and the future. So, we once again ask you
to stick with us as we stick with our plan.
18
C O N T I N E N T A L A I R L I N E S 2 0 0 5 A N N U A L R E P O R T
2000
Distribution Costs (percentage of passenger revenue)
10.5
1995
14.3
2005
5.7
Commissions, booking fees, credit card feesand other distribution costs divided by
Consolidated Passenger Revenue
19
“We fly all around the world. We alwayscome home to Houston.”
Houston, TX, USA
Larry KellnerChairman and Chief Executive Officer
Jeff SmisekPresident

Senior Officers
Continental’s senior management team has worked together for more than a decade throughthe airline’s turnaround; the aftermath of September 11, 2001; and today’s economic chal-lenges. Together they hold more than 232 years of Continental experience.
20
C O N T I N E N T A L A I R L I N E S 2 0 0 5 A N N U A L R E P O R T
Jim Compton*
Executive Vice President Marketing11 years
Jeff Misner*
Executive Vice President and Chief Financial Officer11 years
Mark Moran*
Executive Vice President Operations12 years
Mike BondsSenior Vice PresidentHuman Resourcesand Labor Relations11 years
Rebecca CoxSenior Vice President Government Affairs17 years
Mark ErwinSenior Vice PresidentAsia/Pacific and CorporateDevelopment30 years
David GrizzleSenior Vice PresidentCustomerExperience20 years
* Designated as an executive officer of Continental

21
Dave Hilfman Senior Vice President Sales19 years
Gerry LadermanSenior Vice President Finance andTreasurer17 years
Dante MarzettaSenior Vice President Technical Operations and Purchasing 12 years
Bill MeehanSenior Vice PresidentAirport Services22 years
Holden ShannonSenior Vice PresidentGlobal Real Estate and Security11 years
Jennifer Vogel*
Senior Vice President,General Counsel,Secretary andCorporateCompliance Officer11 years
Ned WalkerSenior Vice President WorldwideCorporateCommunications19 years
Chris KennyVice President and Controller9 years
Senior Officers
C O N T I N E N T A L A I R L I N E S 2 0 0 5 A N N U A L R E P O R T
* Designated as an executive officer of Continental

Board of Directors
Thomas J. Barrack, Jr. (b) (c)* (e)*
Chairman and Chief Executive Officer
Colony Capital, LLC
Kirbyjon H. Caldwell (b) (c)
Senior Pastor
The Windsor Village
United Methodist Church
Larry Kellner (d) (e)
Chairman and Chief Executive Officer
Continental Airlines, Inc.
Douglas H. McCorkindale (e)
Chairman
Gannett Co., Inc.
Henry L. Meyer III (a) (e)
Chairman, President and
Chief Executive Officer
KeyCorp
Oscar Munoz (a)
Executive Vice President and
Chief Financial Officer
CSX Corporation
(a) Audit Committee(b) Human Resources Committee(c) Corporate Governance Committee(d) Finance Committee(e) Executive Committee
(*) Committee Chair
George G. C. Parker (a)* (d)
Dean Witter Distinguished Professor
of Finance and Management,
Graduate School of Business,
Stanford University
Jeff Smisek (d)
President
Continental Airlines, Inc.
Karen Hastie Williams (d)*
Senior Counsel
Crowell & Moring LLP
Ronald B. Woodard (a) (b) (d)
Chairman
MagnaDrive Corporation
Charles A. Yamarone (b)* (c)
Executive Vice President
Libra Securities, LLC
22
C O N T I N E N T A L A I R L I N E S 2 0 0 5 A N N U A L R E P O R T

C O N T I N E N T A L A I R L I N E S 2 0 0 5 A N N U A L R E P O R T
Management's Discussion and Analysis
This discussion and analysis, as well as the financial statements and notes that follow,have been condensed from the full discussion and analysis and financial statements and notesincluded in our Form 10-K, as amended, for the year ended December 31, 2005 and our proxystatement for our 2006 annual stockholders’ meeting.
Continental Airlines, Inc. is a major United States air carrier engaged in the businessof transporting passengers, cargo and mail. We are the world’s sixth largest airline (as meas-ured by the number of scheduled miles flown by revenue passengers, known as revenue passenger miles, in 2005). Together with ExpressJet Airlines, Inc. (operating as ContinentalExpress and referred to as “ExpressJet”), a wholly-owned subsidiary of ExpressJet Holdings,Inc. (“Holdings”), from which we purchase seat capacity, and our wholly-owned subsidiary,Continental Micronesia, Inc. (“CMI”), we operate more than 2,500 daily departures. As ofDecember 31, 2005, we flew to 132 domestic and 126 international destinations and offeredadditional connecting service through alliances with domestic and foreign carriers. Wedirectly served 23 European cities, nine South American cities, Tel Aviv, Delhi, Hong Kong,Beijing and Tokyo as of December 31, 2005. In addition, we provide service to more desti-nations in Mexico and Central America than any other U.S. airline, serving 41 cities.Through our Guam hub, CMI provides extensive service in the western Pacific, includingservice to more Japanese cities than any other United States carrier.
General information about us, including our Corporate Governance Guidelines and the charters for the committees of our Board of Directors, can be found at http://www.continental.com/company/investor. Our Board of Directors has adopted a codeof ethics entitled “Principles of Conduct,” which applies to all of our employees, officers anddirectors. Our board has also adopted a separate “Directors’ Code of Ethics” for our direc-tors. Copies of these codes can be found at http://www.continental.com/company/investor.Copies of our charters and codes are available in print to any stockholder who requests them.Written requests for such copies may be directed to our Secretary at Continental Airlines,Inc., P.O. Box 4607, Houston, Texas 77210-4607. Our annual reports on Form 10-K, quar-terly reports on Form 10-Q and current reports on Form 8-K, as well as any amendmentsand exhibits to those reports, are available free of charge through our website as soon as reasonably practicable after we file them with, or furnish them to, the U.S. Securities andExchange Commission. Information on our website is not incorporated into our annualreport on Form 10-K or our other securities filings and is not a part of them.
This Annual Report contains forward-looking statements that are not limited to historical facts, but reflect our current beliefs, expectations or intentions regarding futureevents. All forward-looking statements involve risks and uncertainties that could cause actualresults to differ materially from those in the forward-looking statements. For examples ofthose risks and uncertainties, see the cautionary statements contained in our annual report on
23

24
C O N T I N E N T A L A I R L I N E S 2 0 0 5 A N N U A L R E P O R T
Form 10-K for the year ended December 31, 2005 and our other security filings, including,with respect to the Form 10-K, the risk factors set forth in Item 1A. “Risk Factors – RiskFactors Relating to the Company” and “Risk Factors – Risk Factors Relating to the AirlineIndustry.” Also, in our annual report on Form 10-K, see Item 1. “Business” and Item 7.“Management’s Discussion and Analysis of Financial Condition and Results of Operations –Overview – Summary of Principal Risk Factors” for a discussion of trends and factors affect-ing us and our industry. We undertake no obligation to publicly update or revise any forward-looking statements to reflect events or circumstances that may arise after the date of this report.
Results of Operations
We recorded a net loss of $68 million for the year ended December 31, 2005, as com-pared to a net loss of $409 million and a net income of $28 million for the years endedDecember 31, 2004 and 2003, respectively. Our results for each of the last three years havebeen affected by a number of special items which are not necessarily indicative of our coreoperations or our future prospects, and impact comparability between years. These specialitems are discussed below. We would have incurred significant losses in 2005 and 2003 with-out the special items.
Primarily due to record-high fuel prices and the continued competitive domestic fareenvironment, the current U.S. domestic network carrier financial environment continues tobe poor and could deteriorate further. During the third quarter of 2005, Hurricane Katrinaand Hurricane Rita caused widespread disruption to oil production, refinery operations andpipeline capacity along certain portions of the U.S. Gulf Coast. As a result of these disrup-tions, the price of jet fuel increased significantly and the availability of jet fuel supplies wasdiminished. Additionally, Hurricane Rita forced us to suspend service for 36 hours at ourlargest hub, Houston’s Bush Intercontinental Airport, costing us an estimated $25 million.
As of December 31, 2005, we had $2.2 billion in consolidated cash, cash equivalentsand short-term investments. At December 31, 2005, we had $241 million of restricted cash.We believe that under current conditions, absent adverse factors outside of our control, suchas additional terrorist attacks, hostilities involving the United States, or further significantincreases in jet fuel prices, our existing liquidity and projected 2006 cash flows will be suffi-cient to fund current operations and other financial obligations through 2006. Although we have significant financial obligations due in 2007, we also believe that under current conditions and absent adverse factors outside of our control, such as those described above,our projected 2007 cash flows from operations and access to capital markets will provide uswith sufficient liquidity to fund our operations and meet our other obligations through theend of 2007.

25
C O N T I N E N T A L A I R L I N E S 2 0 0 5 A N N U A L R E P O R T
Special Items. The comparability of our financial results between years is affected by anumber of special items. Our results for each of the last three years included the followingspecial items (in millions):
Pre TaxIncome (Expense)
2005Gain on sale of Copa Holdings, S.A. shares $ 106Gain on dispositions of ExpressJet stock 98Pension curtailment/settlement charges (83)Reserve reduction on grounded aircraft 16
$ 137
2004MD-80 aircraft retirement charges and other $ (87)Termination of United Micronesia Development Association Service Agreement (34)Frequent flyer reward redemption cost adjustment (18)
$ (139)
2003Security fee reimbursement $ 176Gain on dispositions of ExpressJet stock 173Gain on Hotwire and Orbitz investments 132MD-80 aircraft retirement and impairment charges (86)Revenue adjustment for change in expected redemption of frequent flyer
mileage credits sold 24Boeing 737 aircraft delivery deferral (14)
$ 405
Comparison of 2005 to 2004
Passenger revenue increased 13.2%, primarily due to higher traffic and capacity in allgeographic regions, higher fares on international flights and more regional flying. Consolidatedrevenue passenger miles for 2005 increased 9.6% year-over-year on a capacity increase of6.9%, which produced a consolidated load factor for 2005 of 78.9%, up 2.0 points over 2004.Consolidated yield increased 3.2% year-over-year. Consolidated revenue per available seatmile (“RASM”) for 2005 increased 5.9% over 2004 due to higher load factor and yield. Theimproved RASM reflects recent fuel-driven fare increases and our efforts to manage the revenue associated with the emerging trend of customers booking closer to flight dates, animproved mix of local versus flow traffic and our efforts to reduce discounting. Cargo, mailand other revenue increased 13.5% in 2005 compared to 2004 primarily due to increases in revenue associated with sales of mileage credits in our OnePass frequent flyer program,passenger change fees and increases in freight fuel surcharges.

26
C O N T I N E N T A L A I R L I N E S 2 0 0 5 A N N U A L R E P O R T
Wages, salaries and related costs decreased 6.0% primarily due to pay and benefitreductions and work rule changes, partially offset by a slight increase in the average number ofemployees. Aircraft fuel and related taxes increased 53.9% due to a significant rise in fuelprices, combined with an increase in flight activity. The average jet fuel price per gallon includ-ing related taxes increased 49.2% from $1.19 in 2004 to $1.78 in 2005. The impact of jet fuelprices in 2004 was partially offset by $74 million of gains from our fuel hedging activities. Wehad no fuel hedges in place during 2005. Payments made under our capacity purchase agree-ment are reported in ExpressJet capacity purchase, net. ExpressJet capacity purchase, netincludes all of ExpressJet’s fuel expense plus a margin on ExpressJet’s fuel expense up to a capprovided in the capacity purchase agreement and a related fuel purchase agreement (whichmargin applies only to the first 71.2 cents per gallon, including fuel taxes) and is net of ourrental income on aircraft we lease to ExpressJet.The net expense was higher in 2005 than 2004due to increased flight activity at ExpressJet, a larger fleet and increased fuel prices, offset inpart by lower rates effective January 1, 2005 under the capacity purchase agreement. Aircraftrentals increased due to new mainline and regional aircraft delivered in 2005. Landing fees andother rentals were higher primarily due to the completion of our new international TerminalE and related facilities at Bush Intercontinental. Distribution costs increased primarily due tohigher credit card fees and reservation costs related to the increase in revenue. Maintenance,materials and repairs increased primarily due to higher contractual repair rates associated witha maturing fleet. The lower depreciation and amortization in 2005 resulted from discontinueddepreciation related to the permanent grounding of MD-80 aircraft in 2003 and 2004. Otheroperating expenses increased primarily due to higher number of international flights whichresulted in increased air navigation, ground handling, security and related expenses. In 2005,we recorded special charges of $67 million which consisted primarily of a curtailment chargeof $43 million related to the freezing of the portion of our defined benefit pension plan attrib-utable to pilots, a $40 million settlement charge related to lump-sum distributions from thepilot pension plans, and a $16 million reversal of a portion of our reserve for exit costs relatedto permanently grounded aircraft. In 2004, we recorded special charges of $121 million.Included in these charges were $87 million associated with future obligations for rent andreturn conditions related to 16 leased MD-80 aircraft which were permanently grounded anda non-cash charge of $34 million related to the termination of a 1993 service agreement withUnited Micronesia Development Association. In the fourth quarter of 2004, we recorded achange in expected future costs for frequent flyer reward redemptions on alliance carriers,resulting in a one-time increase to other operating expenses of $18 million.
Nonoperating expense decreased $182 million in 2005 compared to 2004 primarilydue to gains of $98 million in 2005 related to the contribution of 12.1 million shares ofHoldings common stock to our primary defined benefit pension plan and a $106 million

27
C O N T I N E N T A L A I R L I N E S 2 0 0 5 A N N U A L R E P O R T
gain related to the sale of a portion of our investment in Copa Holdings, S.A. (“Copa”), theparent of Copa Airlines. Beginning in the first quarter of 2004, due to our continued losses,we concluded that we were required to provide a valuation allowance for deferred tax assetsbecause we had determined that it was more likely than not that such deferred tax assetswould ultimately not be realized. As a result, our 2005 losses and the majority of our 2004losses were not reduced by any tax benefit.
Comparison of 2004 to 2003
The deconsolidation of Holdings from our financial statements effective Novem-ber 12, 2003, more fully described in the notes to our condensed consolidated financial state-ments, impacts the comparability of our results to those of prior years.
Passenger revenue increased during 2004 as compared to 2003, due to higher traffic andcapacity in all geographic regions combined with the negative impact of the hostilities in Iraqand SARS on the prior year results. However, in spite of the increase in load factors, the con-tinuing erosion of fares in the domestic and Caribbean markets resulted in a decrease in yieldsfor 2004 compared to 2003. Wages, salaries and related costs decreased $237 million largelydue to the impact of deconsolidating Holdings, which was offset by an increase in the averagenumber of employees, primarily due to increased flight activity, and higher wage rates. Aircraftfuel and related taxes increased due to a significant rise in fuel prices, combined with anincrease in flight activity. The average jet fuel price per gallon including related taxes increased30.2% from 91.40 cents in 2003 to 119.01 cents in 2004. The impact of higher jet fuel pricesin 2004 was partially offset by $74 million of gains from our fuel hedging activities. Such gainswere immaterial in 2003. In 2004, obligations under our capacity purchase agreement arereported as ExpressJet capacity purchase, net. In addition to the obligations for the purchasedcapacity, ExpressJet capacity purchase, net also includes ExpressJet’s fuel expense in excess ofthe cap provided in the capacity purchase agreement and a related fuel purchase agreement(71.2 cents per gallon, including fuel taxes) and is net of our rental income on aircraft we leaseto ExpressJet. In 2003 (through November 12), intercompany transactions between us andHoldings or ExpressJet under the capacity purchase agreement were eliminated in the consol-idated financial statements.The actual obligations under the capacity purchase agreement werehigher in 2004 than in 2003 due to ExpressJet’s larger fleet and a 23.6% increase in regionalavailable seat miles. Our effective tax rates differ from the federal statutory rate of 35% prima-rily due to increases in the valuation allowance, certain expenses that are not deductible for federal income tax purposes, state income taxes and the accrual in 2003 of income tax expenseon our share of Holdings’ net income. Due to our continued losses, we were required to providea valuation allowance on the deferred tax assets recorded on losses beginning in the first quarterof 2004. As a result, the majority of our 2004 losses were not reduced by any tax benefit.
28
C O N T I N E N T A L A I R L I N E S 2 0 0 5 A N N U A L R E P O R T
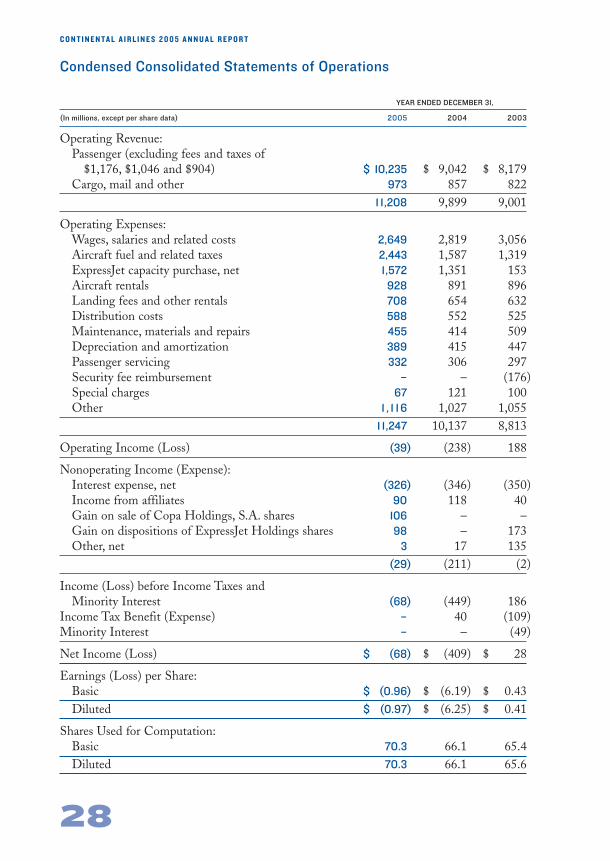
Condensed Consolidated Statements of Operations
YEAR ENDED DECEMBER 31,
(In millions, except per share data) 2005 2004 2003
Operating Revenue:Passenger (excluding fees and taxes of
$1,176, $1,046 and $904) $ 10,235 $ 9,042 $ 8,179Cargo, mail and other 973 857 822
1 1,208 9,899 9,001
Operating Expenses:Wages, salaries and related costs 2,649 2,819 3,056Aircraft fuel and related taxes 2,443 1,587 1,319ExpressJet capacity purchase, net 1,572 1,351 153Aircraft rentals 928 891 896Landing fees and other rentals 708 654 632Distribution costs 588 552 525Maintenance, materials and repairs 455 414 509Depreciation and amortization 389 415 447Passenger servicing 332 306 297Security fee reimbursement – – (176)Special charges 67 121 100Other 1 , 1 1 6 1,027 1,055
1 1,247 10,137 8,813
Operating Income (Loss) (39) (238) 188
Nonoperating Income (Expense):Interest expense, net (326) (346) (350)Income from affiliates 90 118 40Gain on sale of Copa Holdings, S.A. shares 106 – –Gain on dispositions of ExpressJet Holdings shares 98 – 173 Other, net 3 17 135
(29) (211) (2)
Income (Loss) before Income Taxes and Minority Interest (68) (449) 186
Income Tax Benefit (Expense) – 40 (109)Minority Interest – – (49)
Net Income (Loss) $ (68) $ (409) $ 28
Earnings (Loss) per Share:Basic $ (0.96) $ (6.19) $ 0.43Diluted $ (0.97) $ (6.25) $ 0.41
Shares Used for Computation:Basic 70.3 66.1 65.4 Diluted 70.3 66.1 65.6

Condensed Consolidated Balance Sheets
DECEMBER 31,
(In millions) 2005 2004
ASSETSCurrent Assets:
Unrestricted cash, cash equivalents and short-term investments $ 1,957 $ 1,458Restricted cash 241 211Accounts receivable, net of allowance for doubtful receivables
of $15 and $22 515 472Spare parts and supplies, net of allowance for obsolescence of
$95 and $93 201 214Prepayments and other 513 469
Total Current Assets 3,427 2,824
Property and Equipment, net 6,086 6,314
Routes and Airport Operating Rights, net 6 17 851Other assets, net 399 522
Total Assets $ 10,529 $ 10,511
LIABILITIES AND STOCKHOLDERS’ EQUITYCurrent Liabilities:
Current maturities of long-term debt and capital leases $ 546 $ 670Accounts payable 846 766Air traffic and frequent flyer liability 1,475 1,157Accrued payroll 234 281Accrued other liabilities 298 251
Total Current Liabilities 3,399 3,125
Long-Term Debt and Capital Leases 5,057 5,167
Deferred Income Taxes 154 378
Accrued Pension Liability 1,078 1,132
Other 615 554
Commitments and Contingencies
Stockholders’ Equity:Class B common stock 1 1Additional paid-in capital 1,635 1,408Retained earnings 406 474Accumulated other comprehensive loss (675) (587)Treasury stock, at cost (1 , 1 4 1) (1,141)
Total Stockholders’ Equity 226 155Total Liabilities and Stockholders’ Equity $ 10,529 $ 10,511
29
C O N T I N E N T A L A I R L I N E S 2 0 0 5 A N N U A L R E P O R T

30
C O N T I N E N T A L A I R L I N E S 2 0 0 5 A N N U A L R E P O R T
Condensed Consolidated Statements of Cash Flows
YEAR ENDED DECEMBER 31,
(In millions) 2005 2004 2003
Cash Flows from Operating Activities:Net income (loss) $ (68) $ (409) $ 28Adjustments to reconcile net income (loss) to net cash
provided by operating activities:Deferred income taxes – (40) 96Depreciation and amortization 389 415 447Special charges 67 121 100Gains on dispositions of investments (204) – (305)Undistributed equity in the income of affiliates (62) (66) (23)Other, net (18) (73) (36)Changes in operating assets and liabilities: 353 425 35Net cash provided by operating activities 457 373 342
Cash Flows from Investing Activities:Capital expenditures (185) (162) (205)Purchase deposits (paid) refunded in connection with
aircraft deliveries, net (3) 111 52Sale of short-term investments, net 46 34 35Proceeds from sale of Copa Holdings, S.A, net. 172 – –Proceeds from sales of ExpressJet Holdings, net – – 134Proceeds from sales of Internet-related investments – 98 76Proceeds from sales of property and equipment 53 16 16Increase in restricted cash, net (30) (41) (108)Other (2) (3) 53
Net cash provided by investing activities 51 53 53Cash Flows from Financing Activities:
Proceeds from issuance of long-term debt, net 436 67 559Payments on long-term debt and capital lease obligations (662) (447) (549)Proceeds from issuance of common stock, net 227 5 5Other 36 11 –
Net cash (used in) provided by financing activities 37 (364) 15Impact on cash of ExpressJet deconsolidation – – (225)Net Increase in Cash and Cash Equivalents 545 62 185Cash and Cash Equivalents – Beginning of Period 1,1 78 1,116 931Cash and Cash Equivalents – End of Period $ 1,723 $ 1,178 $ 1,116

Condensed Consolidated Statements of Cash Flows (continued)
YEAR ENDED DECEMBER 31,
(In millions) 2005 2004 2003
Supplemental Cash Flows Information:Interest paid $ 385 $ 372 $ 374Income taxes paid (refunded) $ 2 $ (4) $ 13Investing and Financing Activities Not Affecting Cash:
Property and equipment acquired through theissuance of debt $ – $ 226 $ 120
Capital lease obligations incurred $ 1 $ 1 $ 22Contribution of ExpressJet Holdings stock to
pension plan $ 130 $ – $ 100
31
C O N T I N E N T A L A I R L I N E S 2 0 0 5 A N N U A L R E P O R T

Notes to Condensed Consolidated Financial Statements
NOTE 1. BASIS OF PRESENTATION
The Company follows accounting principles generally accepted in the United States.Certain of the principles involve selections among alternatives and choices of methods, whichare described in the notes to the Company’s audited consolidated financial statements includedin the Proxy Statement for the 2006 Annual Meeting of Stockholders’ (Proxy Statement).
The accompanying condensed consolidated financial information and the notes beloware a summary of those contained in the Company’s audited consolidated financial state-ments included in the Proxy Statement.
NOTE 2. LONG-TERM DEBT
Long-term debt as of December 31 is summarized as follows (in millions):
2005 2004
SECUREDNotes payable, interest rates of 5.0% to 8.5%, payable through 2019 $ 2,832 $ 3,147Floating rate notes, interest rates of LIBOR plus 0.45% to 7.5%;
payable through 2016 1,684 1,435Other 79 17
UNSECUREDConvertible junior subordinated debentures, interest rate of 6.0%,
payable in 2030 248 248Convertible notes, interest rate of 4.5%, payable in 2007 200 200Senior notes payable, interest rate of 8.0%, payable in 2005 – 195Convertible notes, interest rate of 5.0%, callable beginning in 2010 175 175Other 1 1 2 120
5,330 5,537Less: current maturities 524 642Total $ 4,806 $ 4,895
Maturities of long-term debt due over the next five years are as follows (in millions):
Year ending December 31,
2006 $ 5242007 9372008 6322009 4602010 602
32
C O N T I N E N T A L A I R L I N E S 2 0 0 5 A N N U A L R E P O R T

Substantially all of our property and equipment, spare parts inventory, certain routes,and the outstanding common stock and substantially all of the other assets of our wholly-owned subsidiaries Air Micronesia, Inc. (“AMI”) and CMI are subject to agreements securingour indebtedness. We do not have any debt obligations that would be accelerated as a resultof a credit rating downgrade.
In June 2005, we and our two wholly-owned subsidiaries, AMI and CMI, closed ona $350 million secured loan facility. AMI and CMI have unconditionally guaranteed the loanmade to us, and we and AMI have unconditionally guaranteed the loan made to CMI. Thefacility consists of two loans, both of which have a term of six years and are non-amortizing,except for certain mandatory prepayments described below. The loans accrue interest at afloating rate determined by reference to the three-month London Interbank Offered Rate,known as LIBOR, plus 5.375% per annum. The loans and guarantees are secured by certainof our U.S.-Asia routes and related assets, all of the outstanding common stock of AMI andCMI and substantially all of the other assets of AMI and CMI, including route authoritiesand related assets. The loan documents require us to maintain a minimum balance of unre-stricted cash and short-term investments of $1.0 billion dollars at the end of each month.The loans may become due and payable immediately if we fail to maintain the monthly minimum cash balance and upon the occurrence of other customary events of default underthe loan documents. If we fail to maintain a minimum balance of unrestricted cash and short-term investments of $1.125 billion, we and CMI will be required to make a mandatoryaggregate $50 million prepayment of the loans. In addition, if the ratio of the outstandingloan balance to the value of the collateral securing the loans, as determined by periodicappraisals, is greater than 48%, we and CMI will be required to post additional collateral orprepay the loans to reestablish a loan-to-collateral value ratio of not greater than 48%. Weare currently in compliance with these covenants.
Convertible Debt Securities. In November 2000, Continental Airlines Finance TrustII, a Delaware statutory business trust (the “Trust”) of which we own all the common trustsecurities, completed a private placement of five million 6% Convertible Preferred Securities,Term Income Deferrable Equity Securities or “TIDES.” The TIDES have a liquidation valueof $50 per preferred security and are convertible at any time at the option of the holder intoshares of common stock at a conversion rate of $60 per share of common stock (equivalentto approximately 0.8333 share of common stock for each preferred security). Distributionson the preferred securities are payable by the Trust at an annual rate of 6% of the liquidation
33
C O N T I N E N T A L A I R L I N E S 2 0 0 5 A N N U A L R E P O R T

value of $50 per preferred security. The sole assets of the trust are 6% Convertible JuniorSubordinated Debentures (“Convertible Subordinated Debentures”) with an aggregate prin-cipal amount of $248 million as of December 31, 2005 issued by us and which mature onNovember 15, 2030.
The $200 million of 4.5% convertible notes due February 1, 2007 are convertible intoour common stock at an initial conversion price of $40 per share. The notes are redeemableat our option at specified redemption prices.
The $175 million of 5% Convertible Notes due 2023 are convertible into our commonstock at an initial conversion price of $20 per share, subject to certain conditions on conver-sion. The notes are redeemable for cash at our option on or after June 18, 2010 at par plusaccrued and unpaid interest, if any. Holders of the notes may require us to repurchase thenotes on June 15 of 2010, 2013 or 2018, or in the event of certain changes in control at parplus accrued and unpaid interest, if any.
NOTE 3. LEASES
We lease certain aircraft and other assets under long-term lease arrangements. Otherleased assets include real property, airport and terminal facilities, maintenance facilities,training centers and general offices. Most aircraft leases include both renewal options andpurchase options. The purchase options are generally effective at the end of the lease term atthe then-current fair market value. Our leases do not include residual value guarantees. AtDecember 31, 2005, the scheduled future minimum lease payments under capital leases andthe scheduled future minimum lease rental payments required under operating leases, thathave initial or remaining noncancelable lease terms in excess of one year, are as follows (in millions):
Operating Leases(Year ending December 31,) Capital Leases Aircraft Non-aircraft
2006 $ 39 $ 1,003 $ 4292007 40 966 4002008 46 955 3772009 16 910 3742010 16 924 364Later years 457 6,310 4,987
Total minimum lease payments 614 $ 11,068 $ 6,931
Less: amount representing interest 341Present value of capital leases 273Less: current maturities of capital leases 22Long-term capital leases $ 251
34
C O N T I N E N T A L A I R L I N E S 2 0 0 5 A N N U A L R E P O R T

At December 31, 2005, we had 482 aircraft under operating leases and three aircraftunder capital leases, including aircraft subleased to ExpressJet. These operating leases haveremaining lease terms ranging up to 19 years. Projected sublease income to be received fromExpressJet through 2022, not included in the above table, is approximately $3.0 billion.
NOTE 4. STOCK PLANS AND AWARDS
Stock Options. The table below summarizes stock option transactions pursuant to ourplans (share data in thousands):
2005 2004 2003
Weighted- Weighted- Weighted-Average Average AverageExercise Exercise Exercise
Options Price Options Price Options Price
Outstanding at beginningof year 6,1 75 $ 1 7.1 0 6,469 $ 17.86 6,871 $ 18.28
Granted 8,648 $ 1 1 .9 1 729 $ 11.99 296 $ 15.00Exercised (1, 1 78) $ 15.52 (181) $ 14.62 (306) $ 15.62Cancelled (935) $ 19. 1 2 (842) $ 19.10 (392) $ 24.82Outstanding at end of year 12,710 $ 13.57 6,175 $ 17.10 6,469 $ 17.86Options exercisable at end
of year 3,896 $ 1 7. 1 7 4,837 $ 17.91 5,018 $ 18.27
Employee Stock Purchase Plan. All of our employees (including CMI employees) areeligible to participate in the 2004 Employee Stock Purchase Plan. At the end of each fiscalquarter, participants may purchase shares of our common stock at a discount of 15% off thefair market value of the stock on either the first day or the last day of the quarter (whicheveris lower), subject to a minimum purchase price of $10 per share. This discount is reduced tozero as the fair market value approaches $10 per share. If the fair market value is below the$10 per share minimum price on the last day of a quarter, then the participants will not bepermitted to purchase common stock for such quarterly purchase period and we will refundto those participants the amount of their unused payroll deductions. In the aggregate,3,000,000 shares may be purchased under the plan. These shares may be originally issuedshares, treasury shares or a combination thereof. During 2005 and 2004, 573,848 shares and249,160 shares, respectively, of common stock were issued to participants at a weighted-average purchase price of $10.06 and $10.00 per share, respectively.
35
C O N T I N E N T A L A I R L I N E S 2 0 0 5 A N N U A L R E P O R T

NOTE 5. EMPLOYEE BENEFIT PLANS
We have defined benefit pension and defined contribution (including 401(k) savings)plans. Substantially all of our domestic employees are covered by one or more of these plans.The benefits under our defined benefit pension plans are based on years of service and an employee’s final average compensation. Our pension obligations are measured as ofDecember 31 of each year.
Defined Benefit Pension Plans. Under the new collective bargaining agreement withour pilots ratified on March 30, 2005, which we refer to as the “pilot agreement,” futuredefined benefit accruals for pilots ceased and retirement benefits accruing in the future areprovided through two new pilot-only defined contribution plans. As required by the pilotagreement, defined benefit pension assets and obligations related to pilots in our primarydefined benefit pension plan (covering substantially all U.S. employees other than ChelseaFood Services (“Chelsea”) and CMI employees) were spun out into a separate pilot-onlydefined benefit pension plan, which we refer to as the “pilot defined benefit pension plan.”Subsequently, on May 31, 2005, future benefit accruals for pilots ceased and the pilot definedbenefit pension plan was “frozen.” As of that freeze date, all existing accrued benefits forpilots (including the right to receive a lump sum payment upon retirement) were preservedin the pilot defined benefit pension plan. Accruals for non-pilot employees under our pri-mary defined benefit pension plan continue.
The following table sets forth the defined benefit pension plans’ change in projectedbenefit obligation at December 31 (in millions):
2005 2004
Accumulated benefit obligation $ 2,494 $ 2,412
Projected benefit obligation at beginning of year $ 2,863 $ 2,362Service cost 86 151Interest cost 1 5 1 152Plan amendments 7 (6)Actuarial losses 105 310Benefits paid (310) (113)Plan curtailment (272) –Other – 7Projected benefit obligation at end of year $ 2,630 $ 2,863
36
C O N T I N E N T A L A I R L I N E S 2 0 0 5 A N N U A L R E P O R T

The following table sets forth the defined benefit pension plans’ change in the fairvalue of plan assets at December 31 (in millions):
2005 2004
Fair value of plan assets at beginning of year $ 1,281 $ 1,280Actual gain on plan assets 69 113Employer contributions 381 1Benefits paid (310) (113)Fair value of plan assets at end of year $ 1,421 $ 1,281
The following actuarial assumptions were used to determine the actuarial presentvalue of our projected benefit obligation at December 31:
2005 2004
Weighted average assumed discount rate 5.68% 5.75%Weighted average rate of compensation increase 2.25% 3.0%
NOTE 6. INCOME TAXES
For financial reporting purposes, income tax benefits recorded on losses result indeferred tax assets for financial reporting purposes. We are required to provide a valuationallowance for deferred tax assets to the extent management determines that it is more likelythan not that such deferred tax assets will ultimately not be realized. Due to our continuedlosses, we were required to provide a valuation allowance on deferred tax assets beginning inthe first quarter of 2004. As a result, all of our 2005 losses and the majority of our 2004 losseswere not reduced by any tax benefit. Furthermore, we expect to be required to provideadditional valuation allowance in conjunction with deferred tax assets recorded on losses inthe future.
At December 31, 2005, we had estimated tax NOLs of $4.1 billion for federal incometax purposes that will expire beginning in 2006 through 2025.
During 2005, we entered into a final settlement agreement with the Internal RevenueService (“IRS”) resolving all matters raised by the IRS during its examination of our federalincome tax returns through the year ended December 31, 1999. As a result of the settlementwith the IRS and the associated deferred tax account reconciliation, deferred tax liabilitiesand long-term assets (primarily routes and airport operating rights, which values were estab-lished upon our emergence from bankruptcy in April 1993) were reduced by $215 million toreflect the ultimate resolution of tax uncertainties existing at the point we emerged from
37
C O N T I N E N T A L A I R L I N E S 2 0 0 5 A N N U A L R E P O R T

bankruptcy. The composition of the individual elements of deferred taxes recorded on thebalance sheet was also adjusted; however, the net effect of these changes was entirely offsetby an increase in the deferred tax valuation allowance due to our prior determination that it is more likely than not that our net deferred tax assets will ultimately not be realized. Thesettlement did not have a material impact on our results of operations, financial condition or liquidity.
NOTE 7. SPECIAL ITEMS
In 2005, we recorded special charges of $67 million. In the first quarter of 2005, werecorded a $43 million non-cash curtailment charge relating to the freezing of the portion ofour defined benefit pension plan attributable to pilots. In the third and fourth quarters of2005, we recorded non-cash settlement charges totaling $40 million related to lump sum dis-tributions from our pilot defined benefit pension plans to pilots who retired. Also in 2005,we reduced our allowance for future lease payments and return conditions related to perma-nently grounded aircraft by $16 million following negotiated settlements with the aircraftlessors in an improved aircraft market. In December 2005, we completed the sale of 9.1 mil-lion shares of common stock in the initial public offering (“IPO”) of Copa. The saledecreased our percentage ownership in Copa from 49% to 27%, resulting in a $17 milliondecrease in the associated goodwill balance. We received $172 million cash from the sale andrecognized a gain of $106 million. On January 6, 2005, we contributed 6.0 million shares of Holdings common stock to our defined benefit pension plan. We recognized a gain of $51 million in the first quarter of 2005 related to this transaction. On April 7, 2005, we con-tributed an additional 6.1 million shares of Holdings common stock to our defined benefitpension plan. We recognized a gain of $47 million in the second quarter of 2005 related tothis transaction.
In 2004, we recorded special charges of $87 million primarily associated with futureobligations for rent and return conditions related to 16 leased MD-80 aircraft that were per-manently grounded during the period. Our last two active MD-80 aircraft were permanentlygrounded in January 2005. We also recorded a non-cash charge of $34 million related to thetermination of a 1993 service agreement with United Micronesia Development Associationin the first quarter of 2004.
38
C O N T I N E N T A L A I R L I N E S 2 0 0 5 A N N U A L R E P O R T

In 2003, we recorded fleet impairment losses and other special charges of $100 mil-lion. In the first quarter of 2003, we recorded fleet impairment losses and the special chargesof $65 million. This charge includes a $44 million additional impairment of our fleet ofowned MD-80s, which was initially determined to be impaired and written down to thencurrent fair value in 2002. The remainder of the charge consisted primarily of the write-downto market value of spare parts inventory for permanently grounded fleets. The chargereflected the impact of the war in Iraq and the resulting deterioration of the already weak revenue environment for the U.S. airline industry. These write-downs were necessary becausethe fair market values of the MD-80 and spare parts inventory had declined as a result of thedifficult financial environment and further reductions in capacity by U.S. airlines. In the second quarter of 2003, we recorded a special charge of $14 million relating to the deferralof aircraft deliveries. In December 2003, we determined five previously grounded leasedMD-80 aircraft to be permanently grounded and recorded a charge of $21 million associatedwith future obligations for rent and return conditions, net of estimated sublease income, onthose aircraft.
In May 2003, we received and recognized in earnings $176 million in cash from the United States government pursuant to the Emergency Wartime SupplementalAppropriations Act enacted in April 2003. This amount is reimbursement for our propor-tional share of passenger security and air carrier security fees paid or collected by U.S. air carriers as of the date of enactment of the law, together with other items.
During the third quarter of 2003, we sold approximately 9.8 million shares of ourHoldings common stock to Holdings, reducing our ownership interest in Holdings from53.1% to 44.6%. In a subsequent transaction in the third quarter of 2003, we contributedapproximately 7.4 million shares of Holdings common stock to our defined benefit pensionplan, further reducing our ownership of Holdings to below 31%. We recognized gains total-ing $173 million in 2003 as a result of these transactions.
On December 19, 2003, we sold approximately 28% of our investment in Orbitz inconnection with its IPO, reducing our interest in Orbitz from approximately 13% to 9%, forproceeds of $34 million, net of underwriting discount. Subsequent to the IPO in 2003, weaccounted for our investment in Orbitz in accordance with SFAS No. 115, “Accounting forCertain Investments in Debt and Equity Securities.” We designated the remaining invest-ment as a “trading security,” based on our intention to dispose of the securities of Orbitz thatwe owned. Therefore, the remaining investment was carried at its fair value, with changes inthe fair value reported in our statement of operations. In November 2003, we sold all of ourinvestment in Hotwire, Inc. for $42 million in cash. The resulting gains from all these Orbitzand Hotwire transactions, net of related compensation expense was $132 million in 2003.
39
C O N T I N E N T A L A I R L I N E S 2 0 0 5 A N N U A L R E P O R T

NOTE 8. INVESTMENT IN EXPRESSJET AND REGIONAL CAPACITY
PURCHASE AGREEMENT
Investment in ExpressJet. As of December 31, 2005, we owned 4.7 million shares ofHoldings common stock which represented an 8.6% interest in Holdings. We do not currently intend to remain a stockholder of Holdings over the long term. Subject to marketconditions, we intend to sell or otherwise dispose of all of our shares of Holdings commonstock in the future.
We continue to consolidate Holdings because, under FIN 46, we were the primarybeneficiary until November 12, 2003, when, as a result of sales of Holdings shares to unre-lated parties by our defined benefit pension plan, the combined amount of Holdings common stock owned by us and our defined benefit pension plan fell below 41%, the pointat which we no longer were the primary beneficiary under FIN 46. Therefore, in accordancewith FIN 46, we deconsolidated Holdings as of November 12, 2003 and began to accountfor our interest in Holdings using the equity method of accounting. As a result, after decon-solidation, we continue to record the related passenger revenue and related expenses, withpayments under the capacity purchase agreement reflected as a separate operating expense.Prior to November 12, 2003, expenses under the capacity purchase agreement were elimi-nated in consolidation and the portion of Holdings’ net income attributable to the equityof Holdings that we did not own was reported as minority interest in our consolidatedstatement of operations. After deconsolidation, nonoperating income has increased due toour equity in Holdings’ earnings and earnings under our tax sharing agreement withHoldings. Additionally, after deconsolidation, we no longer record minority interest oneither our balance sheet or statement of operations.
Capacity Purchase Agreement with ExpressJet. Under our capacity purchase agree-ment (the “agreement”), ExpressJet currently flies all of its aircraft (which consist entirely ofregional jet aircraft) on our behalf, and we handle scheduling, ticket prices and seat invento-ries for these flights. In exchange for ExpressJet’s operation of the flights and performance ofother obligations under the agreement, we pay them for each scheduled block hour based onan agreed formula. Under the agreement, we recognize all passenger, cargo and other revenueassociated with each flight, and are responsible for all revenue-related expenses, includingcommissions, reservations, catering and passenger ticket processing expenses.
40
C O N T I N E N T A L A I R L I N E S 2 0 0 5 A N N U A L R E P O R T

Under the agreement, we pay ExpressJet a base fee for each scheduled block hourbased on a formula that was in place through December 31, 2005. The formula was designedto provide ExpressJet with an operating margin of approximately 10% before taking intoaccount variations in some costs and expenses that are generally controllable by them, themost significant of which is wages, salaries and benefits. In addition, ExpressJet’s prevailingmargin, which is the operating margin excluding certain revenues and costs as specified inthe agreement, will be capped at 10% before certain incentive payments. Pursuant to theterms of the agreement, the block hour rate portion of the compensation we pay toExpressJet is re-negotiated annually.
In December 2005, we gave notice to ExpressJet that we would withdraw 69 of the274 regional jet aircraft (including 2006 deliveries) from the capacity purchase agreementbecause we believe the rates charged by ExpressJet for regional capacity are above the currentmarket. While our discussions with ExpressJet continue, we have requested proposals fromnumerous regional jet operators to provide regional jet service to replace the withdrawncapacity. Any transition of service from ExpressJet to a new operator would begin in January2007 and be completed during the summer of 2007. Under our agreement with ExpressJet,once we have given notice of withdrawal of aircraft from the agreement, ExpressJet will havethe option to decide, within nine months of that notice, to (1) fly any of the withdrawn aircraft for another airline (subject to its ability to obtain facilities, such as gates, ticket coun-ters, hold rooms and other operations-related facilities, and subject to its arrangement withus that prohibits ExpressJet during the term of the agreement from flying under its oranother carrier’s code in or out of our hub airports), (2) fly any of the withdrawn aircraftunder ExpressJet’s own flight designator code, subject to its ability to obtain facilities andsubject to ExpressJet’s arrangement with us respecting our hubs, or (3) decline to fly any ofthe withdrawn aircraft, return the aircraft to us and cancel the related subleases with us. IfExpressJet elects to retain the aircraft, the implicit interest rate used to calculate the sched-uled lease payments under our aircraft subleases with ExpressJet will automatically increaseby 200 basis points to compensate us for our continued participation in ExpressJet’s leasefinancing arrangements. Should ExpressJet retain the withdrawn aircraft, we anticipate thatthe new operator will supply any aircraft needed for its operations for us. So long as we areExpressJet’s largest customer, if ExpressJet enters into an agreement with another major airline (as defined in the agreement) to provide regional airline services on a capacity purchaseor other similar economic basis for ten or more aircraft on terms and conditions that are inthe aggregate less favorable to ExpressJet than the terms and conditions of the capacity pur-chase agreement, we will be entitled to amend our capacity purchase agreement to conformthe economic terms and conditions of the capacity purchase agreement to the economicterms and conditions of the agreement with the other major airline.
41
C O N T I N E N T A L A I R L I N E S 2 0 0 5 A N N U A L R E P O R T

The agreement currently expires on December 31, 2010 but allows us to terminate theagreement at any time after December 31, 2006 upon 12 months’ notice, or at any time with-out notice for cause (as defined in the agreement). We may also terminate the agreement atany time upon a material breach by ExpressJet that does not constitute cause and continuesfor 90 days after notice of such breach, or without notice or opportunity to cure if we deter-mine that there is a material safety concern with ExpressJet’s flight operations. We have theoption to extend the term of the agreement with 24 months’ notice for up to four additionalfive-year terms through December 31, 2030.
NOTE 9. SEGMENT REPORTING
Information concerning operating revenue by principal geographic area for the yearended December 31 is as follows (in millions):
2005 2004 2003
Domestic (U.S.) $ 6,9 1 4 $ 6,570 $ 6,181Atlantic 1,993 1,489 1,203Latin America 1,427 1,139 1,050Pacific 874 701 567
$ 1 1,208 $ 9,899 $ 9,001
NOTE 10. COMMITMENTS AND CONTINGENCIES
Purchase Commitments. We have substantial commitments for capital expenditures,including the acquisition of new aircraft and related spare engines. As of December 31, 2005,we had firm commitments for 52 new aircraft from Boeing, with an estimated cost of $2.5 billion, and options to purchase 30 additional Boeing aircraft. We are scheduled to takedelivery of six new 737-800 aircraft in 2006, with delivery of the remaining 46 new Boeingaircraft occurring from 2007 through 2011. In addition, we are scheduled to take delivery oftwo used 757-300 aircraft in 2006 under operating leases.
We have backstop financing for six 737-800 aircraft to be delivered in 2006 and two777-200ER aircraft to be delivered in 2007. By virtue of these agreements, we have financ-ing available for all Boeing aircraft scheduled to be delivered through 2007. However, we donot have backstop financing or any other financing currently in place for the remainder ofthe aircraft. Further financing will be needed to satisfy our capital commitments for our firmaircraft and other related capital expenditures. We can provide no assurance that sufficientfinancing will be available for the aircraft on order or other related capital expenditures, orfor our capital expenditures in general.
42
C O N T I N E N T A L A I R L I N E S 2 0 0 5 A N N U A L R E P O R T

As of December 31, 2005, ExpressJet had firm commitments for the final eight regionaljets currently on order from Embraer with an estimated cost of approximately $0.2 billion.ExpressJet currently anticipates taking delivery of these regional jets in 2006. ExpressJet doesnot have an obligation to take any of these firm Embraer aircraft that are not financed by athird party and leased to either ExpressJet or us. Under the capacity purchase agreementbetween us and ExpressJet, we have agreed to lease as lessee and sublease to ExpressJet theregional jets that are subject to ExpressJet’s firm purchase commitments. In addition, underthe capacity purchase agreement with ExpressJet, we generally are obligated to purchase allof the capacity provided by these new aircraft as they are delivered to ExpressJet.
Financings and Guarantees. We are the guarantor of approximately $1.7 billionaggregate principal amount of tax-exempt special facilities revenue bonds and interestthereon. These bonds, issued by various municipalities and other governmental entities, arepayable solely from our rentals paid under long-term agreements with the respective govern-ing bodies. The leasing arrangements associated with approximately $1.5 billion of theseobligations are accounted for as operating leases, and the leasing arrangements associatedwith approximately $200 million of these obligations are accounted for as capital leases in ourfinancial statements.
Credit Card Processing Agreement. Our bank-issued credit card processing agreementcontains financial covenants which require, among other things, that we maintain a minimumEBITDAR (generally, earnings before interest, taxes, depreciation, amortization, aircraftrentals and income from affiliates, adjusted for special items) to fixed charges (interest andaircraft rentals) ratio of 0.9 to 1.0 through June 30, 2006 and 1.1 to 1.0 thereafter. The liquidity covenant requires us to maintain a minimum level of $1.0 billion of unrestrictedcash and short-term investments and a minimum ratio of unrestricted cash and short-terminvestments to current liabilities of .27 to 1.0 through June 30, 2006 and .29 to 1.0 thereafter.The agreement also requires that we must maintain a debt rating of at least Caa3 as rated byMoody’s or CCC- as rated by Standard & Poor’s. Although we are currently in compliancewith all of the covenants, failure to maintain compliance would result in our being required topost up to an additional $330 million of cash collateral, which would adversely affect our liq-uidity. Depending on our unrestricted cash and short-term investments balance at the time,the posting of a significant amount of cash collateral could cause our unrestricted cash andshort-term investments balance to fall below the $1.0 billion minimum balance requirementunder our $350 million secured loan facility, resulting in a default under such facility.
43
C O N T I N E N T A L A I R L I N E S 2 0 0 5 A N N U A L R E P O R T

Employees. As of December 31, 2005, we had approximately 42,200 employees,or 39,530 full-time equivalent employees, consisting of approximately 16,895 customer serv-ice agents, reservations agents, ramp and other airport personnel, 8,570 flight attendants,5,925 management and clerical employees, 4,420 pilots, 3,610 mechanics and 110 dispatch-ers. While there can be no assurance that our generally good labor relations and high laborproductivity will continue, we have established as a significant component of our businessstrategy the preservation of good relations with our employees, approximately 44% of whomare represented by unions.
Legal Proceedings. We and/or certain of our subsidiaries are defendants in variousother lawsuits, including suits relating to certain environmental claims, and proceedings arising in the normal course of business. Although the outcome of these lawsuits and pro-ceedings cannot be predicted with certainty and could have a material adverse effect on ourresults of operations, financial condition or liquidity, it is our opinion, after consulting withoutside counsel, that the ultimate disposition of such suits will not have a material adverseeffect on our results of operations, financial condition or liquidity.
44
C O N T I N E N T A L A I R L I N E S 2 0 0 5 A N N U A L R E P O R T

Report of Independent Registered Public Accounting Firm
We have audited, in accordance with the standards of the Public CompanyAccounting Oversight Board (United States), the consolidated balance sheets of ContinentalAirlines, Inc. as of December 31, 2005 and 2004, and the related consolidated statements of operations, common stockholders’ equity and cash flows for each of the three years in theperiod ended December 31, 2005 (not presented separately herein) and in our report datedFebruary 24, 2006, we expressed an unqualified opinion on those consolidated financialstatements. In our opinion, the information set forth in the accompanying condensed consolidated financial statements is fairly stated in all material respects in relation to the consolidated financial statements from which it has been derived.
We have also audited, in accordance with the standards of the Public CompanyAccounting Oversight Board (United States), the effectiveness of the Company’s internalcontrol over financial reporting as of December 31, 2005, based on criteria established inInternal Control – Integrated Framework issued by the Committee of SponsoringOrganizations of the Treadway Commission and our report dated February 24, 2006expressed an unqualified opinion thereon.
Houston, TexasFebruary 24, 2006
45
C O N T I N E N T A L A I R L I N E S 2 0 0 5 A N N U A L R E P O R T
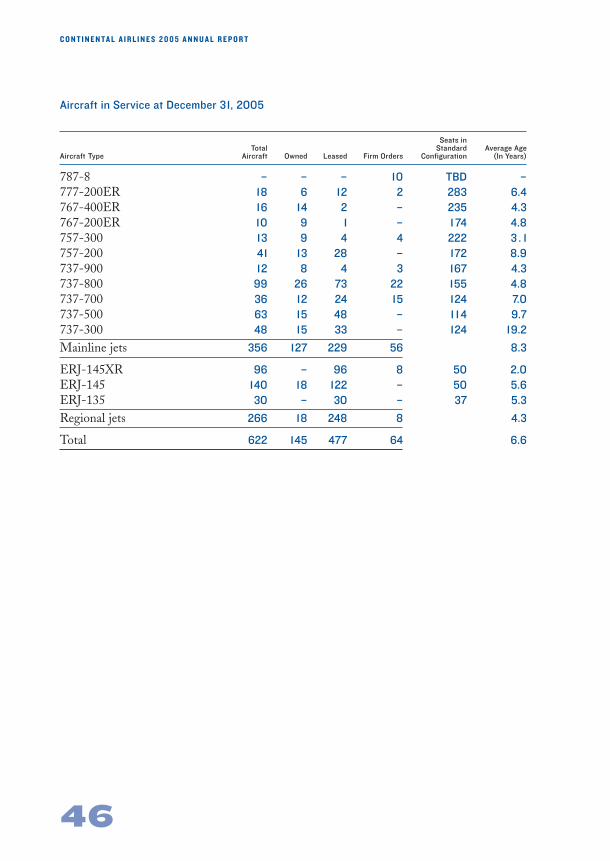
46
C O N T I N E N T A L A I R L I N E S 2 0 0 5 A N N U A L R E P O R T
Aircraft in Service at December 31, 2005
Seats inTotal Standard Average Age
Aircraft Type Aircraft Owned Leased Firm Orders Configuration (In Years)
787-8 – – – 10 TBD –777-200ER 18 6 12 2 283 6.4767-400ER 16 14 2 – 235 4.3767-200ER 10 9 1 – 1 74 4.8757-300 13 9 4 4 222 3 . 1757-200 41 13 28 – 172 8.9737-900 12 8 4 3 167 4.3737-800 99 26 73 22 155 4.8737-700 36 12 24 15 124 7.0737-500 63 15 48 – 1 1 4 9.7737-300 48 15 33 – 124 19.2
Mainline jets 356 127 229 56 8.3
ERJ-145XR 96 – 96 8 50 2.0ERJ-145 140 18 122 – 50 5.6ERJ-135 30 – 30 – 37 5.3
Regional jets 266 18 248 8 4.3
Total 622 145 477 64 6.6

Non-GAAP Financial Measures Reconciliation
For the non-GAAP financial measures included in this Annual Report, we haveincluded the following reconciliation to GAAP information.
Mainline Operations 2005 2004 2003 2002 2001
Operating Cost per Available Seat Mile (cents) 10.22 9.84 9.53 9.63 9.34
Adjustments (cents per available seat mile):Less: Fleet impairment and
other special charges (0.07) (0.16) (0.11) (0.25) (0.14)Add: Security fee reimbursement – – 0.22 – –Add: Stabilization Act grant – – – – 0.50
Operating Cost per Available Seat Mile,excluding special items (cents) (a) 10.1 5 9.68 9.64 9.38 9.70
2005
Net loss, as reported $ (68)Adjustments (net of income taxes):
Less: Gain on sale of Copa Holdings, S.A. shares 106Less: Gain on disposition of ExpressJet stock 98Add: Pension curtailment/settlement charges (83)Less: Reserve reduction on grounded aircraft 16
Net loss, excluding special items (a) $ (205)
(a) The financial measures provide management and investors the ability to measure and monitor Continental ’sperformance on a more consistent basis.
47
C O N T I N E N T A L A I R L I N E S 2 0 0 5 A N N U A L R E P O R T

48
C O N T I N E N T A L A I R L I N E S 2 0 0 5 A N N U A L R E P O R T
Stockholder Information
Headquarters
Continental Airlines, Inc.1600 Smith StreetHouston, TX 77002(713) 324-5000
Investor Information
To obtain a Form 10-K or other financialinformation, visit the company’s Web siteat: continental.com/company or write:Investor RelationsContinental Airlines, Inc.P.O. Box 4607Houston, TX 77210-4607
Transfer Agent and Registrar
Mellon Investor Services LLC480 Washington BoulevardJersey City, NJ 07310-1900Attn: Shareholder Servicesmelloninvestor.com/isd(888) 711-6201
Independent Auditors
Ernst & Young LLP5 Houston Center1401 McKinneyHouston, TX 77010
NYSE Corporate Governance Matters
Our Chief Executive Officer, asrequired under Section 303A.12(a) of theNew York Stock Exchange (NYSE) ListedCompany Manual, must certify to theNYSE each year whether or not he is awareof any violation by the company of NYSECorporate Governance listing standards asof the date of the certification. On July 12,2005, our Chief Executive Officer submit-ted such a certification to the NYSE whichstated that he was not aware of any violation by Continental of the NYSECorporate Governance listing standards.On February 28, 2006, Continental filed its2005 Form 10-K with the SEC, whichincluded as Exhibits 31.1 and 31.2 theChief Executive Officer and Chief FinancialOfficer certifications required under Section302 of the Sarbanes-Oxley Act of 2002.

Common Stock
Our common stock trades on theNew York Stock Exchange under the sym-bol CAL. The table below shows the highand low sales prices for our common stockas reported in the consolidated transactionreporting system during 2005 and 2004.
2005 HIGH LOW
4th Quarter $ 2 1.97 $ 9.623rd Quarter $ 16.60 $ 9.032nd Quarter $ 15.60 $ 1 1.081st Quarter $ 14.1 9 $ 8.50
2004 HIGH LOW
4th Quarter $ 14.01 $ 7.633rd Quarter $ 11.68 $ 7.802nd Quarter $ 13.93 $ 9.051st Quarter $ 18.70 $ 10.85
As of February 24, 2006, there wereapproximately 20,594 holders of record ofour common stock. We have paid no cashdividends on our common stock and have
Stockholder Information
no current intention of doing so. Under ouragreement with the union representing ourpilots, we have agreed that we will notdeclare a cash dividend or repurchase ouroutstanding common stock for cash untilwe have contributed at least $500 million tothe pilots’ defined benefit plan, measuredfrom March 30, 2005. Through Decem-ber 31, 2005, we had made $112 million ofsuch contributions to that plan.
Our certificate of incorporation provides that no shares of capital stock maybe voted by or at the direction of personswho are not United States citizens unlessthe shares are registered on a separate stockrecord. Our bylaws further provide that noshares will be registered on the separatestock record if the amount so registeredwould exceed United States foreign owner-ship restrictions. United States law currentlylimits the voting power in us (and otherU.S. airlines) of persons who are not citi-zens of the United States to 25%.

Work Hard. Fly Right.®