Context and Structure in Automated Full-Text Information...
143
Context and Structure in Automated Full-Text Information Access Marti A. Hearst Report No. UCB/CSD-94/836 April 29, 1994 Computer Science Division (EECS) University of California Berkeley, California 94720
Transcript of Context and Structure in Automated Full-Text Information...

Context and Structure in Automated Full-TextInformation Access
Marti A. Hearst
Report No. UCB/CSD-94/836
April 29, 1994
Computer Science Division (EECS)
University of California
Berkeley, California 94720


Context and Structurein Automated Full-Text Information Access
by
Marti A. Hearst
B.A. (University of California at Berkeley) 1985M.S. (University of California at Berkeley) 1989
A dissertation submitted in partial satisfaction of the
requirements for the degree of
Doctor of Philosophy
in
Computer Science
in the
GRADUATE DIVISION
of the
UNIVERSITY of CALIFORNIA at BERKELEY
Committee in charge:
Professor Robert Wilensky, ChairProfessor Ray LarsonProfessor Jerome Feldman
1994


Context and Structure
in Automated Full-Text Information Access
Copyright c 1994
by
Marti A. Hearst

In memory of my grandfather, Alan Joseph.

v
Abstract
Context and Structurein Automated Full-Text Information Access
by
Marti A. Hearst
Doctor of Philosophy in Computer Science
University of California at Berkeley
Robert WilenskyThesis Chair
This dissertation investigates the role of contextual information in the automated retrievaland display of full-text documents, using robust natural language processing algorithms toautomatically detect structure in and assign topic labels to texts. Many long texts arecomprised of complex topic and subtopic structure, a fact ignored by existing informationaccess methods. I present two algorithms which detect such structure, and two visual displayparadigms which use the results of these algorithms to show the interactions of multiplemain topics, multiple subtopics, and the relations between main topics and subtopics.
The first algorithm, called TextTiling, recognizes the subtopic structure of texts asdictated by their content. It uses domain-independent lexical frequency and distributioninformation to partition texts into multi-paragraph passages. The results are found tocorrespond well to reader judgments of major subtopic boundaries. The second algorithmassigns multiple main topic labels to each text, where the labels are chosen from pre-defined,intuitive category sets; the algorithm is trained on unlabeled text.
A new iconic representation, called TileBars uses TextTiles to simultaneously and com-pactly display query term frequency, query term distribution and relative document length.This representation provides an informative alternative to ranking long texts according to

vi
their overall similarity to a query. For example, a user can choose to view those documentsthat have an extended discussion of one set of terms and a brief but overlapping discussionof a second set of terms. This representation also allows for relevance feedback on patternsof term distribution.
TileBars display documents only in terms of words supplied in the user query. For agiven retrieved text, if the query words do not correspond to its main topics, the user cannotdiscern in what context the query terms were used. For example, a query on contaminantsmay retrieve documents whose main topics relate to nuclear power, food, or oil spills. Toaddress this issue, I describe a graphical interface, called Cougar, that displays retrieveddocuments in terms of interactions among their automatically-assigned main topics, thusallowing users to familiarize themselves with the topics and terminology of a text collection.

vii
Contents
1 Introduction 11.1 Full-Text Information Access 11.2 An Approach to Computational Linguistics 6
2 TextTiling 72.1 Introduction: Multi-paragraph Segmentation 72.2 What is Subtopic Structure? 82.3 Why Multi-Paragraph Units? 9
2.3.1 Corpus-based Computational Linguistics 92.3.2 Online Text Display and Hypertext 112.3.3 Text Summarization and Generation 11
2.4 Discourse Structure 132.4.1 Granularity of Discourse Structure 142.4.2 Topology of Discourse Structure 152.4.3 Grammars and Scripts 17
2.5 Detecting Discourse Structure 182.5.1 Distributional Patterns of Cohesion Cues 182.5.2 Lexical Cohesion Relations 19
2.6 The TextTiling Algorithm 232.6.1 Tokenization 252.6.2 Similarity Determination 252.6.3 Boundary Identification 262.6.4 Embellishments 27
2.7 Evaluation 292.7.1 Reader Judgments 292.7.2 Results 30
2.8 An Extended Example: The Tocqueville Chapter 332.9 Conclusions 36
3 Term Distribution in Full-Text Information Access 373.1 Introduction 373.2 Background: Standard Retrieval Techniques 38
CONTENTS viii
3.3 Long Texts and Their Properties 403.4 Distribution-Sensitive Information Access 44
3.4.1 The Problem with Ranking 443.4.2 Analogy to Problems with Query Specification 453.4.3 TileBars 483.4.4 Case Studies 52
3.5 Passage-based Information Access 573.5.1 An Analysis of two TREC Topic Descriptions 593.5.2 Similarity-based Passage Retrieval Experiments 653.5.3 Other Approaches 68
3.6 Conclusions 69
4 Main Topic Categories 714.1 Introduction 714.2 Preview: How to use Multiple Main Topic Categories 714.3 Automatic Assignment of Multiple Main Topics 73
4.3.1 Overview 734.3.2 Yarowsky’s Disambiguation Algorithm 744.3.3 Lexically-Based Categories 754.3.4 Determining Salient Terms 754.3.5 Related Work and Advantages of the Algorithm 77
4.4 Evaluation of the Categorization Algorithm 794.4.1 The Test Set 804.4.2 The Experiment 814.4.3 Analysis of Results 82
4.5 Creating Thesaural Categories 854.5.1 Creating Categories from WordNet 874.5.2 Assigning Topics using the Original Category Set 894.5.3 Combining Distant Categories 904.5.4 Revised Topic Assignments 91
4.6 Conclusions 92
5 Multiple Main Topics in Information Access 975.1 Introduction 975.2 Current Approaches 98
5.2.1 Overall Similarity Comparison 995.2.2 User-specified Attributes 101
5.3 Multiple Main Topic Display 1025.3.1 Displaying Frequent Terms 1035.3.2 Displaying Main Topic Categories 1045.3.3 A Browsing Interface 1045.3.4 Discussion 107

CONTENTS ix
5.4 Conclusions 109
6 Conclusions and Future Work 110
A Tocqueville, Chapter 1 113
Bibliography 116

x
Acknowledgments
Research is a surprisingly social activity. Graduate school has been an enormously positiveexperience, in large part because of the outstanding people around me.
I would like to thank my advisor, Robert Wilensky, for his supportive, unflagging enthusiasmfor this work, his helpful analytic insights, and his willingness to let me choose some of my ownpaths. His comments have greatly improved this thesis, and he was extraordinarily fast at readingand returning chapters to me, despite his pressing duties as Department Chair.
I would also like to thank the other members of my committee: Ray Larson, for contributinghis expertise in information retrieval, and Jerry Feldman. Dan Jurafsky read and critiqued thisentire thesis, and for this he has my profuse thanks. Narciso Jaramillo also provided many helpfulcomments at the final hour.
Mike Stonebraker encouraged me to enter graduate school in computer science, wrote the crucialletter, convinced me to come to Berkeley, gave me a research assistantship under which I earnedmy master’s degree, and even supported me for a time after I switched fields. In many ways Mikeis a visionary and his attitudes about the field and how to do research have strongly influenced me.
Peter Norvig, who knows about all NLP work ever done (and has implemented a large fractionif it) has helped me out at several critical strategic junctions, and tried hard not to look at me funnythe first time I mentioned “big text”.
I cannot begin to state the importance of my continued association with the Xerox Palo AltoResearch Center. I owe an enormous debt to Per-Kristian Halvorsen, a Montague-semantician wholiked my off-the-wall ideas about cognitive linguistics and invited me to spend my first summerat PARC. Jan Pedersen, as project leader for the information access group, and as a friend, hasbeen constantly supportive, and has answered innumerable questions about statistics. Over thepast five years, the Thursday Reading Group has provided a thought-provoking but lightheartedforum for discussion of computational linguistics and information access. In addition to Jan andPer-Kristian, this insightful group has included Francine Chen, Doug Cutting, Mary Dalrymple, KenFeuerman, David Hull, Ron Kaplan, Laurie Karttunen, Martin Kay, David Karger, Julian Kupiec,Chris Manning, John Maxwell, Hinrich Schutze, Penni Sibun, John Tukey, Lynn Wilcox, MegWithgott, and Annie Zaenen. Jeanette Figueroa is the most effective, efficient, and affectionateadministrative assistant that anyone could ever hope to work with. Mark Weiser is a model toemulate.
Daily life in graduate school sparkled in The Office of All Topics (no topic is taboo). I willmiss the analysis sessions and the laughter shared with Michael Braverman, nj Jaramillo, and MikeSchiff, not to mention their skills at paper critiquing, talk debugging, and question answering.
My other Berkeley colleagues in (computational) linguistics – Jane Edwards, Adele Goldberg,Dan Jurafsky, Steve Omohundru, Terry Regier, Andreas Stolcke, and Dekai Wu – are simultaneouslybrilliant and fun and have greatly enriched my understanding of the field.
I am the last of the four “mars” to graduate: Mary Gray Baker, Marie desJardins and MargoSeltzer have been invaluable friends and colleagues. Others on campus that have provided support,advice, and friendship include Nina Amenta, Elan Amir, Paul Aoki, Francesca Barrientos, MarshallBern, Eric Enderton, Mark Ferrari, John Hartman, Mor Harchol, Chris Hoadley, Kim Keeton,Adam Landsberg, Steve Lucco, Bruce Mah, Nikki Mirghafori, Sylvia Plevritis, Patti Schank, MarkSullivan, Seth Teller, Tara Weber, and Randi Weinstein.
xi
I have been privileged to learn about language and the mind from Chuck Fillmore, AlisonGopnik, Paul Kay, George Lakoff, John Searle, and Dan Slobin. Michael Ranney has beenespecially supportive and informative about Cognitive Science. Ray Larson and Bill Cooper ofthe Berkeley School for Library Studies have both generously shared their advice, knowledge, andbooks on information access, and Michael Buckland and Cliff Lynch have kept me informed of thecutting edge of the field. In the Computer Science department, Tom Anderson, Mike Clancy, JimDemmel, Randy Katz, John Ousterhout and Kathy Yelick have been helpful and approachable, andI greatly admire Dave Patterson’s confidence and optimism as both a leader and a researcher.
Ken Church helped pioneer the field of corpus-based computational linguistics, and I owe hima special thanks for inviting me to an instructive summertime visit at AT&T Bell Laboratories. Iwould also like to thank Paul Jacobs for organizing the 1990 AAAI Spring Symposium on Text-basedIntelligent Systems, which was a watershed event in the course of my research.
I have benefitted from interactions with my coauthors Anne Fontaine, Greg Grefenstette, DavidPalmer, Chris Plaunt, Philip Resnik, and Hinrich Schutze, and conference-colleagues Ido Dagan,Haym Hirsh and David Yarowsky. I am also grateful for the advice and opinions of Bill Gale,Graeme Hirst, and Gerry Salton.
John Ousterhout has done everyone a great service by inventing Tcl/Tk. I’m also grateful toEthan Munson for maintaining and customizing the latex thesis style files, and Dan Jurafsky forcreating the lsalike bibtex style.
Sheila Humphreys has been infallibly supportive, including finding financial support for meduring a tricky period. Kathryn Crabtree makes splendid the difference between attending Berkeleyas an undergraduate and as a graduate computer science major. Liza Gabato, Jean Root, TeddyDiaz, and Crystal Williams of the CS Department staff have been very helpful through the years.
Friends from the outside world who have stuck with me through this include Irene Fong, JaneChoi Greenthal, Annie and Bret Peterson, Kayako Shimada, Terry Tao, Greg Theisen and SusanWood.
John Batali taught me about philosophy, feminism, and dinosaurs.This research has been supported at various times by the following sources of funding(in order of appearance):The U.S. Air Force Office of Scientific Research, Grant 83-0254 and the Naval Electronics SystemsCommand Contract N39-82-C-0235.The Army Research Organization, Grant DAAL03-87-0083 and the Defense Advanced ResearchProjects Agency through NASA Grant NAG 2-530.A California Legislative Grant.Digital Equipment Corporation under Digital’s flagship research project Sequoia 2000: Large Ca-pacity Object Servers to Support Global Change Research.AT&T Bell Laboratories.The Advanced Research Projects Agency (ARPA) under Grant No. MDA972-92-J-1029 with theCorporation for National Research Initiatives (CNRI).
The Xerox Palo Alto Research Center has supported my work from 1989 to the present.
I’d like to thank my brother Ed (“roll with the punches”) and my sister Dor for being sympathetic,and Grandma Mar for encouraging us to do what makes us happy. Finally, I’d like to thank myparents for their undivided love and support and all those Sunday night dinners in Berkeley.

1
Chapter 1
Introduction
1.1 Full-Text Information AccessFull-length documents have only recently become available online in large quantities,
although bibliographic records and technical abstracts have been accessible for many years(Tenopir & Ro 1990). For this reason, information retrieval research has mainly focusedon retrieval from titles and abstracts. In this dissertation, I argue that the advent of full-length text should be met with new approaches to text analysis, particularly for the purposesof information access.1 I emphasize that, for the purposes of information access, fulltext requires context, that is, the mechanisms used for retrieval and display of full-textdocuments should take into account the context in which the query terms and documentterms are used. Each chapter of this thesis discusses some aspect of supplying or usingcontextual information in order to facilitate information access from full text documents.
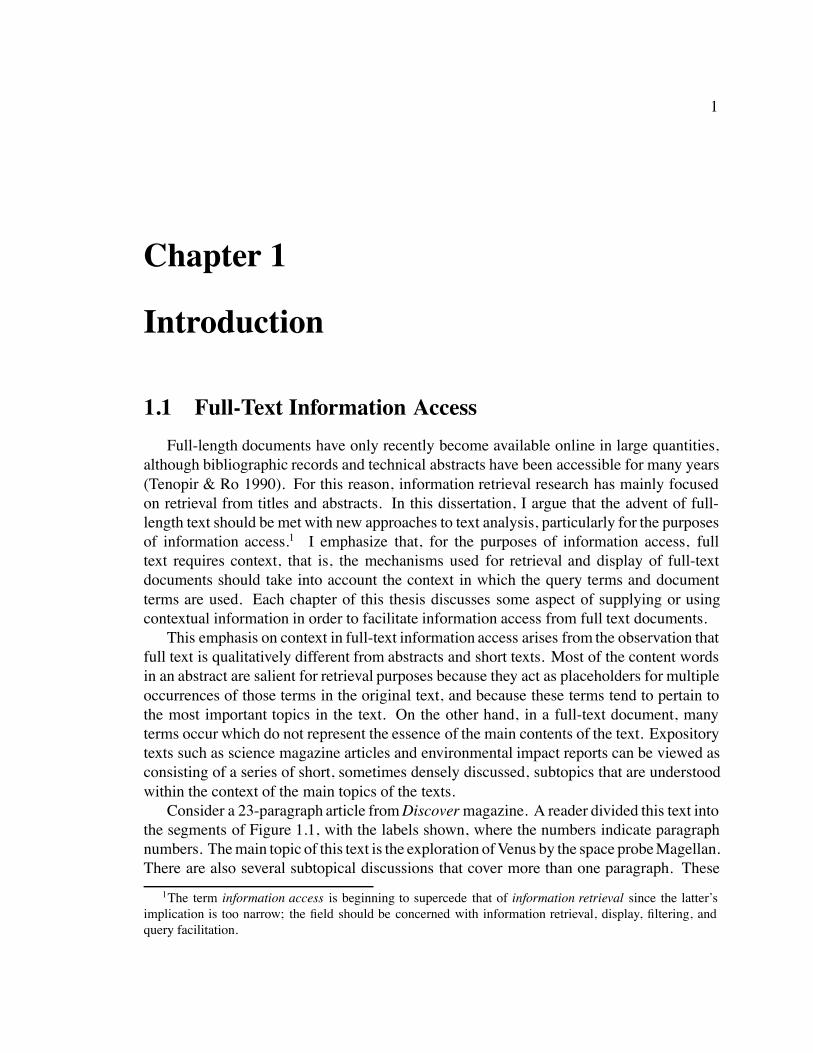
This emphasis on context in full-text information access arises from the observation thatfull text is qualitatively different from abstracts and short texts. Most of the content wordsin an abstract are salient for retrieval purposes because they act as placeholders for multipleoccurrences of those terms in the original text, and because these terms tend to pertain tothe most important topics in the text. On the other hand, in a full-text document, manyterms occur which do not represent the essence of the main contents of the text. Expositorytexts such as science magazine articles and environmental impact reports can be viewed asconsisting of a series of short, sometimes densely discussed, subtopics that are understoodwithin the context of the main topics of the texts.
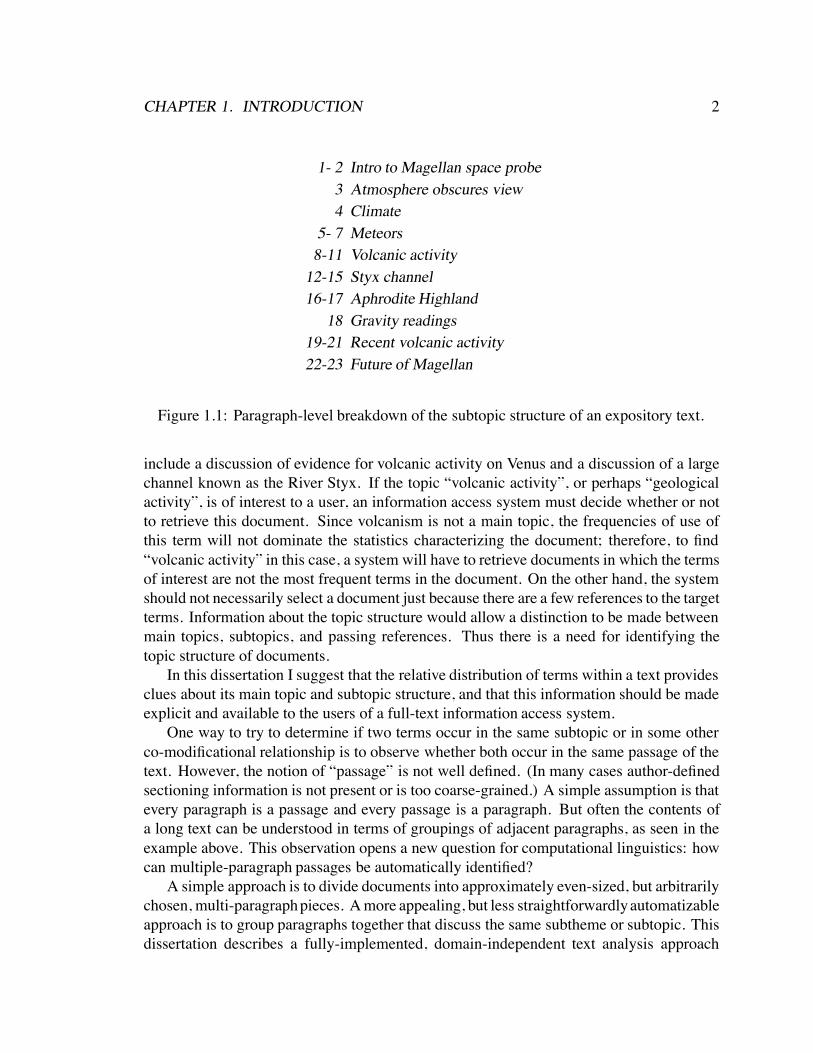
Consider a 23-paragraph article fromDiscovermagazine. A reader divided this text intothe segments of Figure 1.1, with the labels shown, where the numbers indicate paragraphnumbers. The main topic of this text is the exploration of Venus by the space probe Magellan.There are also several subtopical discussions that cover more than one paragraph. These
1The term information access is beginning to supercede that of information retrieval since the latter’simplication is too narrow; the field should be concerned with information retrieval, display, filtering, andquery facilitation.
CHAPTER 1. INTRODUCTION 2
1- 2 Intro to Magellan space probe3 Atmosphere obscures view4 Climate
5- 7 Meteors8-11 Volcanic activity
12-15 Styx channel16-17 Aphrodite Highland
18 Gravity readings19-21 Recent volcanic activity22-23 Future of Magellan
Figure 1.1: Paragraph-level breakdown of the subtopic structure of an expository text.
include a discussion of evidence for volcanic activity on Venus and a discussion of a largechannel known as the River Styx. If the topic “volcanic activity”, or perhaps “geologicalactivity”, is of interest to a user, an information access system must decide whether or notto retrieve this document. Since volcanism is not a main topic, the frequencies of use ofthis term will not dominate the statistics characterizing the document; therefore, to find“volcanic activity” in this case, a system will have to retrieve documents in which the termsof interest are not the most frequent terms in the document. On the other hand, the systemshould not necessarily select a document just because there are a few references to the targetterms. Information about the topic structure would allow a distinction to be made betweenmain topics, subtopics, and passing references. Thus there is a need for identifying thetopic structure of documents.
In this dissertation I suggest that the relative distribution of terms within a text providesclues about its main topic and subtopic structure, and that this information should be madeexplicit and available to the users of a full-text information access system.
One way to try to determine if two terms occur in the same subtopic or in some otherco-modificational relationship is to observe whether both occur in the same passage of thetext. However, the notion of “passage” is not well defined. (In many cases author-definedsectioning information is not present or is too coarse-grained.) A simple assumption is thatevery paragraph is a passage and every passage is a paragraph. But often the contents ofa long text can be understood in terms of groupings of adjacent paragraphs, as seen in theexample above. This observation opens a new question for computational linguistics: howcan multiple-paragraph passages be automatically identified?
A simple approach is to divide documents into approximately even-sized, but arbitrarilychosen, multi-paragraphpieces. A more appealing, but less straightforwardlyautomatizableapproach is to group paragraphs together that discuss the same subtheme or subtopic. Thisdissertation describes a fully-implemented, domain-independent text analysis approach

CHAPTER 1. INTRODUCTION 3
0
0.05
0.1
0.15
0.2
0.25
0.3
0.35
0.4
0.45
0 10 20 30 40 50 60 70 80 90
1 2 3 4 5 6 7 8 9 10 11 12 13 14 15 16 17 1819 20 21 2223
Figure 1.2: The output of the TextTiling algorithm when run on the Magellan Text. Internalnumbers indicate paragraph numbers. Vertical lines indicate boundaries chosen by thealgorithm; for example, the leftmost vertical line represents a boundary after paragraph 3.Note how these align with the outline of the Magellan text in Figure 1.1.
called TextTiling that attempts this task. The TextTiling algorithm makes use of lexicalcohesion relations to recognize where subtopic changes occur. For a given block size, thealgorithm compares the lexical similarity of every pair of adjacent blocks. The resultingsimilarity scores are plotted against sentence number, and after being graphed and smoothed,the plot is examined for peaks and valleys (see Figure 1.2). High similarity values, implyingthat the adjacent blocks cohere well, tend to form peaks, whereas low similarity values,indicating a potential boundary between TextTiles, create valleys. The algorithm’s resultsfit between upper and lower evaluation bounds, where the upper bound corresponds toreader judgments and the lower bound is a simple, reasonable approach to the problem thatcan be automated. TextTiling is discussed in Chapter 2.
By casting document content in terms of topical structure, I have developed new ideasabout the role of document structure in information access. An inherent problem withinformation retrieval ranking functions is they make a decision about the criteria uponwhich documents are ranked which is opaque to the user. This is especially problematicwhen performing a retrieval function other than full similarity comparison since queryterms can have many different term distribution patterns within a full-text document, anddifferent patterns may imply different semantics. In some cases a user might like to finddocuments that discuss one term as a main topic with perhaps just a short discussion ofanother term as a subtopic. Current information access paradigms provide no way toexpress this kind of preference. To help remedy this, I present a new representationalparadigm, called TileBars, which provides a compact and informative iconic representationof the documents’ contents with respect to the query terms (see Figure 1.3). TileBars allowusers to make informed decisions about not only which documents to view, but also whichpassages of those documents to select, based on the distribution of the query terms in thedocuments.

CHAPTER 1. INTRODUCTION 4
Figure 1.3: TileBars for a query in which the terms multimedia and video are contrasted.Rectangles correspond to documents, squares correspond to TextTiles, the darkness of asquare indicates the frequency of terms in the corresponding Term Set. The title and initialwords of a document appear next to its TileBar.
TileBars use TextTiles to break documents into coherent subparts. The query termdistribution is computed for each document and the resulting frequency is indicated foreach tile, in a bar-like image. The bars for each set of query terms are displayed in a stackedsequence, yielding a representation that simultaneously and compactly indicates relativedocument length, query term frequency, and query term distribution. The representationexploits the natural pattern-recognition capabilities of the human perceptual system; thepatterns in a column of TileBars can be quickly scanned and deciphered.
TileBars support a paradigm in which the system does not decide on a single rankingstrategy in advance, but instead provides information that allows the user to determine whatkind of distributional relationships are useful. Chapter 3 describes TileBars and their uses,as well as other issues relating to passage retrieval.
TileBars display documents only in terms of words supplied in the user query. Fora given retrieved text, if the query words do not correspond to its main topics, the usercannot discern the context in which the query terms were used. For example, a query oncontaminants may retrieve documents whose main topics relate to nuclear power, food, oroil spills. To help account for this, I suggest assigning to each text category labels thatcorrespond to its main topics, so that users can get a feeling for the domain in which queryterms are to be used. Thus if two documents discuss the same main topic themes butuse different terms to do so, one unified category can be used to represent their content.Similarly, if a document uses many different terms to build up the impression of a theme,then the category can capture this information in a compact form. If a document is bestdescribed by more than one category, it can be assigned multiple categories, and twodocuments that share one major theme but do not share others can be shown to be relatedonly along the one shared dimension.
Toward this end, Chapter 4 describes an algorithm that automatically assigns main topic

CHAPTER 1. INTRODUCTION 5
13
8 2644
2 1538
2 1538
Food
Government Legal
Environment
Politics
Commerce
Weapons WaterTechnology
Figure 1.4: A sketch of the Cougar interface; three topic labels have been selected.
category labels to texts, and Chapter 5 presents a new display mechanism for making thisinformation available to the user. The categorization algorithm uses a large text collectionto determine which terms are salient indicators for each category. The algorithm alsoallows for the existence of multiple simultaneous themes since each word in the text cancontribute to evidence for a category model, and each word can contribute evidence to morethan one model, if appropriate. One of the category sets used by the algorithm consists of106 general-interest categories; Chapter 4 describes an algorithm that automatically derivesthese categories from an existing hierarchical lexicon.
Once multiple main topic categories have been assigned to a text, they must be displayedeffectively. Chapter 5 describes an interface called Cougar in which fixed category sets areused for two purposes: to orient the user to the dataset under scrutiny, and to place the resultsof the query into context (see Figure 1.4). Cougar allows users to view retrieved documentsin terms of the interaction among their main topics, using the categorization algorithmfrom Chapter 4 to provide contextual information. The interface helps users becomefamiliar with the topics and terminology of an unfamiliar text collection. A consequenceof allowing multiple topics per document is that the display must handle multi-dimensionalinformation. The approach used here again allows user input to play a role: the userspecifies which categories are at the focus of attention at any given time. Cougar suppliesa simple mechanism of visual intersection to allow users to understand how the retrieveddocuments are related to one another with respect to their main topic categories.

CHAPTER 1. INTRODUCTION 6
1.2 An Approach to Computational LinguisticsOne goal of natural language processing is to design programs which interpret texts in
much the same way that a human reader would. Since this is such a difficult task and sinceit requires a large amount of domain knowledge, most of the work of this sort focuses onsmall collections of sentences. This approach is appropriate when automating detailed textinterpretation (e.g.,Schank & Abelson (1977), Wilks (1975), Wilensky (1983a), Charniak(1983), Norvig (1987)) or when supporting a theory about human inference and parsingmechanisms (e.g., Martin (1990), Jurafsky (1992)), but with some exceptions the state ofthe art is such that the use of this kind of analysis in information access is still a distantgoal.
In the past five years there has been an increasing tendency to take a data-intensive ap-proach to language analysis, focusing on broad but coarse-grained coverage of unrestrictedtext (Church & Mercer 1993). This approach is still uncommon in the area of discourse anal-ysis; the work here is an exception. The algorithms presented here are domain-independentbut approximate, scalable but error-prone, in the hopes that their application to the coarsergoals of information access will nevertheless be useful. Such approximate methods seemespecially appropriate for text segmentation, and information access more generally. Theseare intrinsically “fuzzy” tasks, in the sense that they generally have no objectively correctanswer, and many different results may be deemed reasonable (compared with, for example,grammaticality judgments). Readers often disagree about where to draw a boundary mark-ing a topic shift, or whether a given text is relevant to a query; therefore it seems implausibleto expect exact answers to such questions. This thesis demonstrates that despite the inherentplasticity of these tasks, automating these processes can still yield useful results.

7
Chapter 2
TextTiling
2.1 Introduction: Multi-paragraph SegmentationThe structure of expository texts can be characterized as a sequence of subtopical
discussions that occur in the context of a few main topic discussions. For example, apopular science text called Stargazers, whose main topic is the existence of life on earthand other planets, can be described as consisting of the following subdiscussions (numbersindicate paragraph numbers):
1-3 Intro – the search for life in space4-5 The moon’s chemical composition6-8 How the early proximity of the moon shaped it
9-12 How the moon helped life evolve on earth13 The improbability of the earth-moon system
14-16 Binary/trinary star systems make life unlikely17-18 The low probability of non-binary/trinary systems19-20 Properties of our sun that facilitate life
21 Summary
Subtopic structure is sometimes marked in technical texts by headings and subheadingswhich divide the text into coherent segments; Brown & Yule (1983:140) state that this kindof division is one of the most basic in discourse. However, many expository texts consistof long sequences of paragraphs with very little structural demarcation.
This chapter describes why such structure is useful and presents algorithms for au-tomatically detecting such structure.1 Because the model of discourse structure is one inwhich text is partitioned into contiguous, nonoverlapping blocks, I call the general approach
1I am grateful to Anne Fontaine for her interest and help in the early stages of this work.
CHAPTER 2. TEXTTILING 8
TextTiling. The ultimate goal is to not only identify the extents of the subtopical units, butto label their contents as well. This chapter will focus only on the discovery of subtopicstructure, leaving determination of subtopic content to future work. (Chapter 4 discussesautomatic assignment of main topic categories.)
2.2 What is Subtopic Structure?In order to describe the detection of subtopic structure, it is important to define the
phenomena of interest. The use of the term “subtopic” here is meant to signify pieces oftext ‘about’ something (and is not to be confused with the topic/comment (Grimes 1975)distinction found within individual sentences). The intended sense is that described inBrown & Yule (1983:69):
In order to divide up a lengthy recording of conversational data into chunkswhich can be investigated in detail, the analyst is often forced to depend onintuitive notions about where one part of a conversation ends and another begins.... Which point of speaker-change, among the many, could be treated as theend of one chunk of the conversation? This type of decision is usually madeby appealing to an intuitive notion of topic. The conversationalists stop talkingabout ‘money’ and move on to ‘sex’. A chunk of conversational discourse,then, can be treated as a unit of some kind because it is on a particular ‘topic’.The notion of ‘topic’ is clearly an intuitively satisfactory way of describing theunifying principle which makes one stretch of discourse ‘about’ something andthe next stretch ‘about’ something else, for it is appealed to very frequently inthe discourse analysis literature.Yet the basis for the identification of ‘topic’ is rarely made explicit.
Others who have stated the intended sense include Rotondo (1984), who writes “Amacro-unit can be roughly defined as any coherent subpart of a text which is assigned aglobal interpretation of its own” and Tannen (1984:38, cited in Youmans (1991)) who, whendiscussing spoken discourse, claims: “... the most useful unit of study turned out to be theepisode, bounded by changes of topic or activity, rather than, for example, the adjacencypair or the speech act.”
Hinds (1979:137) suggests that different discourse types have different organizing prin-ciples. TextTiling is geared towards expository text; that is, text that explicitly explains orteaches, as opposed to, say, literary texts. More specifically, TextTiling is meant to applyto expository text that is not heavily stylized or structured. A typical example is a five-page science magazine article or a twenty-page environmental impact report. It excludesdocuments composed of short “news bites” or any other disjointed, although lengthy, text.
A two-level structure is chosen for reasons of computational feasibility and to coincidewith the goals of the use of the algorithms’ results. This thesis employs only algorithms

CHAPTER 2. TEXTTILING 9
that can be implemented, that can be run on real texts, and that can run on a variety of textsindependent of their domain of discourse. Given the current state of the art, this can best bedone by methods that work in a coarse way on coarse units of information. The applicationsfor which the results are to be used do not necessarily require fine-grained distinctions. Thisis especially true of some kinds of information retrieval applications. A user might havedifficulty formulating a query in which multiple embedded levels of topic structure need bespecified, although this kind of information could be useful for browsing. Most existingapproaches to discourse processing are too ambitious to yield generally applicable results;it is hoped that by trying to make coarser distinctions the results will be more universallysuccessful.
2.3 Why Multi-Paragraph Units?In school we are didactically taught to write paragraphs in a certain form; therefore a
common assumption is that most paragraphs have a certain kind of well-formed structure,complete with topic sentence and summary sentence. In real-world text, these expectationsare often not met. But even if a paragraph is written in a self-contained,encapsulated manner,a particular subtopical discussion can span multiple paragraphs, with only different nuancesbeing discussed in the paragraphs that comprise the discussion.
Multi-paragraph segmentation has many potential applications, including:
Information AccessCorpus-based Computational LinguisticsText Display and HypertextText Summarization
Applications to information access are a major concern of this thesis and are discussed indetail in Chapter 3. There, I describe how tiles are used in an iconic graphical represen-tation that allows the user to understand the distributional relationships between terms ina query and terms in the retrieved documents. Another benefit of using multi-paragraphsegmentation is that since in most cases there are fewer tiles per document than paragraphs,tiles require less storage and comparison time for otherwise equivalent, paragraph-basedalgorithms.
However, multi-paragraph segmentation has broader applications. These are describedbelow.
2.3.1 Corpus-based Computational LinguisticsAn increasingly important algorithmic strategy in computational linguistics is to derive
information about the distributional patterns of language from large text collections, or

CHAPTER 2. TEXTTILING 10
corpora. Several such algorithms make use of information about lexical co-occurrence; thatis, they count how often terms occur near one another across many texts.
Some of these algorithms use only very local context. For example, working withlarge text collections, Brent (1991) and Manning (1993) make use of restricted syntacticinformation to recognize verb subcategorization frames, Smadja & McKeown (1990) createcollections of collocations by gathering statistics about words that co-occur within a fewwords of one another, and Church & Hanks (1990) use frequency of co-occurrence ofcontent words to create clusters of semantically similar words.
However, several algorithms gather co-occurrence statistics from large windows of text,usually of fixed length. For example, the disambiguation algorithms of Yarowsky (1992)and Gale et al. (1992b) train on large, fixed-sized windows of text. In these algorithms, allterms that reside within a window of text are grouped together to supply evidence aboutthe context in which a word sense occurs. For example, an instance of the tool sense ofthe word crane might be surrounding by terms associated with large mechanical tools, suchas lift and construction. Terms surrounding the bird sense would tend to be those moreassociated with birddom. A question arises about how much context surrounding the targetword should be included in the association. Gale et al. (1992b) have shown that, at least inone corpus, useful sense information can extend out for thousands of words from the targetterm. In practice Yarowsky (1992) uses a fixed window of 100 words.
Gale et al. (1992c) and Gale et al. (1992a) provide evidence that in most cases onlyone sense of a word is used in a given discourse. For example, if the word bill is used inits legislative sense in a discourse, then it is unlikely to be used in the sense of the bodypart of a duck in that same discourse. They performed experiments which indicate that thesame sense of a polysemous word occurred throughout encyclopedia articles and Canadianparliament proceedings. It is possible that in texts whose contents are less stereotyped,different senses of the same word will occur, but in different contexts within the sametext, that is, not particularly near one another. If this is the case, then motivated multi-paragraph segmentation could help determine the boundaries within which single senses ofpolysemous words are used.
Another example of an algorithm that derives lexical co-occurrence information is WordSpace (Schutze 1993b). In this algorithm, statistics are collected about the contexts in whichwords co-occur. The results are placed in a term-by-term co-occurrence matrix which isthen reduced using a variant of multidimensional scaling. The resulting matrix can be usedto make inferences about the closeness of words in a multidimensional semantic space.Currently the co-occurrence information is found by experimenting with different fixedwindow sizes and chosing one that works best for a test set.
A critical assumption underlying these algorithms is that the terms co-occurring withinthe text window do so because they are at least loosely semantically related. It seemsplausible that changes in discourse structure will correspond to changes in word usages,and so the quality of the statistics for these algorithms should benefit from the use of trainingtexts that have been partitioned on the basis of subtopic content.

CHAPTER 2. TEXTTILING 11
2.3.2 Online Text Display and HypertextResearch in hypertext and text display has produced hypotheses about how textual
information should be displayed to users. One study of an online documentation system(Girill 1991) compared display of fine-grained portions of text (i.e., sentences), full texts,and intermediate sized units. Girill found that divisions at the fine-grained level were lessefficient to manage and less effective in delivering useful answers than intermediate sizedunits of text. (Girill also found that using document boundaries is more useful than ignoringdocument boundaries, as is done in some hypertext systems.) The author does not make acommitment about exactly how large the desired text unit should be, instead talking about“passages” and describing passages in terms of the communicative goals they accomplish(e.g., a problem statement, an illustrative example, an enumerated list). The implicationis that the proper unit is the one that groups together the information that performs somecommunicative function; in most cases this unit will range from one to several paragraphs.(Girill implies that pre-marked sectional information, if available and not too long, is anappropriate unit.)
Tombaugh et al. (1987) explore issues relating to ease of readability of long texts onCRT screens. Their study explores the usefulness of multiple windows for organizingthe contents of long texts, hypothesizing that providing readers with spatial cues aboutthe location of portions of previously read texts will aid in their recall of the informationand their ability to quickly locate information that has already been read once. In theexperiment, the text is divided into pre-marked sectional information, one section placed ineach window. They conclude that segmenting the text by means of multiple windows canbe very helpful if readers are familiar with the mechanisms supplied for manipulating thedisplay.
Converting text to hypertext in what is called post-hoc authoring (Marchionini et al.1991) requires division of the original text into meaningful units (a task noted by these au-thors to be a challenging one) as well as meaningful interconnection of the units. Automatedmulti-paragraph segmentation should help with the first step of this process.
2.3.3 Text Summarization and GenerationNineteenth century histories and travelogues often prefaced chapters with a list of topical
discussions, providing a guide for the reader as to the contents to come. These descriptionsare not abstracted summaries, but rather are lists of the subdiscussions that take place duringthe course of the chapter. For example, Chapter 1 of Alexis de Tocqueville’s Democracy inAmerica, Volume 1 is entitled “Exterior Form of North America” and is prefaced with thefollowing text:
North America divided into two vast regions, one inclining towards the Pole,the other towards the Equator – Valley of the Mississippi – Traces found there ofthe revolutions of the globe – Shore of the Atlantic Ocean, on which the English

CHAPTER 2. TEXTTILING 12
01-06 North America divided into two vast regions, one in-clining towards the Pole, the other towards the Equator
07-09 Valley of the Mississippi10-11 Traces found there of the revolutions of the globe12-13 Shore of the Atlantic Ocean, on which the English
colonies were founded14-16 Different aspects of North and of South America at the
time of their discovery17-18 Forests of North America19-19 Prairies21-25 Wandering tribes of natives20-20 Their outward appearance, customs, and languages26-28 Traces of an unknown people.
Figure 2.1: Paragraph-level breakdown of the subtopic structure of Tocqueville Chapter 1,Volume 1.
colonies were founded – Different aspects of North and of South America atthe time of their discovery – Forests of North America – Prairies – Wanderingtribes of natives – Their outward appearance, customs, and languages – Tracesof an unknown people.
These descriptions can be construed to be subtopical discussions that take place in thecontext of a discussion of the exterior form of North America. The list closely reflectsthe order of discussion of the subtopics in the ensuing chapter, with a few exceptions oforder switchings and paragraphs whose content plays a bridging role and so does not meritmention in the subtopic list. Figure 2.1 below shows that the subtopic discussions in mostcases span more than one paragraph. Although the paragraphs in and of themselves aresomewhat encapsulated, this example demonstrates that the multi-paragraph unit size canindeed be a meaningful one.
A scan of the subtopic discussions makes it apparent that the title of the chapter doesnot adequately cover the contents of the text. A discussion of the early inhabitants of thecontinent is not something one tends to classify as central to its exterior form. The titlemight better be served as “Exterior Form and Early Inhabitants of North America”. Theassumption that a logical text unit must discuss only one topic might be at least partlyresponsible for the mistitle.
Multi-paragraph subtopic structure should act as a first step toward automatic deter-mination of text synopses. Algorithms that extract salient phrases from texts in order to

CHAPTER 2. TEXTTILING 13
create synopses (e.g., Chen & Withgott (1992), Pollock & Zamora (1975)) currently donot usually take this kind of information into account. Paice (1990) recognizes the needfor taking topical structure into account but does not have a method for determining suchstructure.
An interesting alternative approach appears in the work of Alterman & Bookman (1990).The authors apply knowledge-intensive techniques to interpret short texts and then plot thenumber of inferences that can be made against the clausal position in the text. They use theresulting plot to determine the “thickness” of the text at each point; breaks in thickness in-dicate an episode change. Summaries are produced by finding the main episode boundariesand extracting concepts from each episode that is deemed to be important (using anothermeasure). Although the technique is heavily knowledge-oriented and computationally ex-pensive, and the length of each episode is about two sentences on average, the general ideabears some resemblance to that discussed below.
Turning now to the related topic of text generation, Mooney et al. (1990) assert thatthe high level structure of extended explanations is determined by processes separate fromthose which organize text at lower levels. They present a scheme for text generationthat is centered around the notion of Basic Blocks: multi-paragraph units of text, eachof which consists of (1) an organizational focus such as a person or a location, and (2)a set of concepts related to that focus. Thus their scheme emphasizes the importance oforganizing the high level structure of a text according to its topical content, and afterwardsincorporating the necessary relatedness information, as reflected in discourse cues, in afiner-grained pass. This use of multi-paragraph units for coherent generation implies thatthis unit of segmentation should be useful in recognition tasks as well.
2.4 Discourse StructureWhen analyzing textual discourse structure, two important and related issues are: what
kind of structure is inherent in discourse, and what mechanisms and aspects of language areneeded to detect that structure. Although the second is strongly influenced by the first, it isnot unambiguously determined by the first; that is, one kind of structure can be recognizedvia lexical distribution patterns, isolated discourse cues, and other factors, with varyingdegrees of success.
Two important subissues arise with respect to the choice of assumptions about thestructure of discourse:
1. At what level of granularity are the units of the discourse? Is the salient unit theword, phrase, clause, sentence, paragraph, or something else? Is more than one levelof granularity appropriate?
2. What is the topology of the discourse structure? I.e., what form do the patterns ofinterrelations among the units of the discourse structure take?

CHAPTER 2. TEXTTILING 14
The nature of the analysis can be heavily dependent on whether or not the theory isgeared towards a computational versus an analytical framework. An additional influentialfactor is the perceived role or purpose of the discourse structure. If the goal of discourseanalysis is to allow the system to answer questions in an interactive session with a human,then issues such as the intentions of the speakers must be taken into account (e.g., Wilenskyet al. (1984), Moore & Pollack (1992)). Researchers working on tutoring and advicesystems that engage in dialogues with humans have tended to emphasize pragmatics, e.g.,reference resolution. This usually requires an understanding of issues relating to discoursefocus and centering. An important aspect of Winograd’s classic thesis work (Winograd1972) is his program’s ability to determine which object is the one most likely to be underdiscussion. He does this by incorporating a variety of factors, including the current contextand focus of the discourse as well as the semantics of the objects and relationships underdiscussion (cf. 8.2). In spoken-text discourse analysis, focus is usually studied at thesentential level, with links among foci typically spanning only a few sentences. Otherexamples are the computational work of Grosz (1986) and Sidner (1983), who examineissues relating to focus and anaphor resolution.
Other research emphasizes the syntactic aspects of anaphor resolution and ellipsis, forexample, Dalrymple et al. (1991) and Hardt (1992). Another approach is the applicationof plans, e.g., Wilensky (1981), Lambert & Carberry (1991) and knowledge, e.g., Hobbs(1978), Luperfoy (1992), Cardie (1992), to anaphor resolution and other interpretationtasks.
As is evident from the discussion above, a large part of the computational discourse workhas been done in the context of interactive systems. In general, the discourse characteristicsof spoken text are quite different from those of written, especially expository, text (Brown& Yule 1983) ( 1.2). The goals of analyzing texts for interactive systems are different fromthose of discourse segmentation of written texts into subtopical boundaries, and it followsthat the choice of discourse unit and topology differ for the different tasks.
2.4.1 Granularity of Discourse StructureThere is a tradition in linguistics of viewing discourse structure as the study of relations
at the interphrasal or interclausal level. The notion of the given/new (or topic/comment)distinction is an extensively studied one in linguistics. In English, topics, in this sense,are usually subjects and comments are the associated predicates. In some languages thedistinction is marked more overtly (Kuno 1972), (Grimes 1975). This is closely related tothe distinctions of theme/rheme and given/new at the sentential level.
Work on prosodic structure of spoken text usually takes place at the inter-sententiallevel, e.g., Wang & Hirschberg (1992), Bachenko et al. (1986). As mentioned above, workin anaphora resolution tends to focus on intra-sentential units, as does most text-generationwork.
The hierarchical theories of discourse such as the theory of attentional/intentional struc-ture (Grosz & Sidner 1986), and Rhetorical Structure Theory (Mann & Thompson 1987)

CHAPTER 2. TEXTTILING 15
tend to use phrasal or clausal units as building blocks from which analyses of length fromone to three paragraphs long are made (for example, in Morris (1988), intentional structureis found for texts of approximately 40 sentences in length).
Discourse work at the multi-paragraph level has been mainly in the theoretical realm,notably the work on macrostructures (van Dijk 1980) (van Dijk 1981) and the work onstory grammars (Lakoff 1972),(Rumelhart 1975). An exception is the work of Batali(1991) that makes use of discourse structure in the automated interpretation of (simplified)chapters of introductory physics texts, with the goal of learning rules for solving problemsin kinematics.
2.4.2 Topology of Discourse StructureHierarchical Models
Many theories of discourse structure, both computational and analytical, assume a hi-erarchical model of discourse. Two prominent examples in computational discourse theoryare the theory of attentional/intentional structure (Grosz & Sidner 1986), and RhetoricalStructure Theory (Mann & Thompson 1987).
Grosz & Sidner (1986) present the basic elements of a computational theory of discoursestructure. The two main questions the theory tries to answer are: What individuates adiscourse? What makes it coherent? They claim the answers are intimately connectedwith two non-linguistic notions, attention and intention. Attention is an essential factorin explicating the processing of utterances in discourse. Intentions play a primary rolein explaining discourse structure and defining discourse coherence. Grosz and Sidnerclaim that the intentions that underlie discourse are so diverse that approaches to discoursecoherence based on selecting discourse relationships from afixed set of alternative rhetoricalpatterns are unlikely to suffice. (See Hovy (1990) for a strong counterview.)
In this theory the linguistic structure consists of the discourse segments and an embed-ding relationship that can hold between them. The embedding relationships are a surfacereflection of relationships among elements of the intentional structure. Linguistic expres-sions are among the primary indicators of discourse segment boundaries. The explicit useof certain words and phrases and more subtle cues, such as intonation or changes in tenseand aspect, are included in the repertoire of linguistic devices that function to indicate theseboundaries.
The attentional state is modeled by a set of focus spaces; changes in attentional stateare modeled by a set of transition rules that specify the conditions for adding and deletingspaces. One focus space associated with each discourse segment. The focus space hierarchyis different/separate from the intentional (task) structure. Passonneau & Litman (1993),following Rotondo (1984), concede the difficulty of eliciting hierarchical intentional struc-ture with any degree of consistency from their human judges. Not surprisingly, no fullyimplemented version of this theory exists.
Rhetorical Structure Theory (RST) (Mann & Thompson 1987) is a functionally-based
CHAPTER 2. TEXTTILING 16
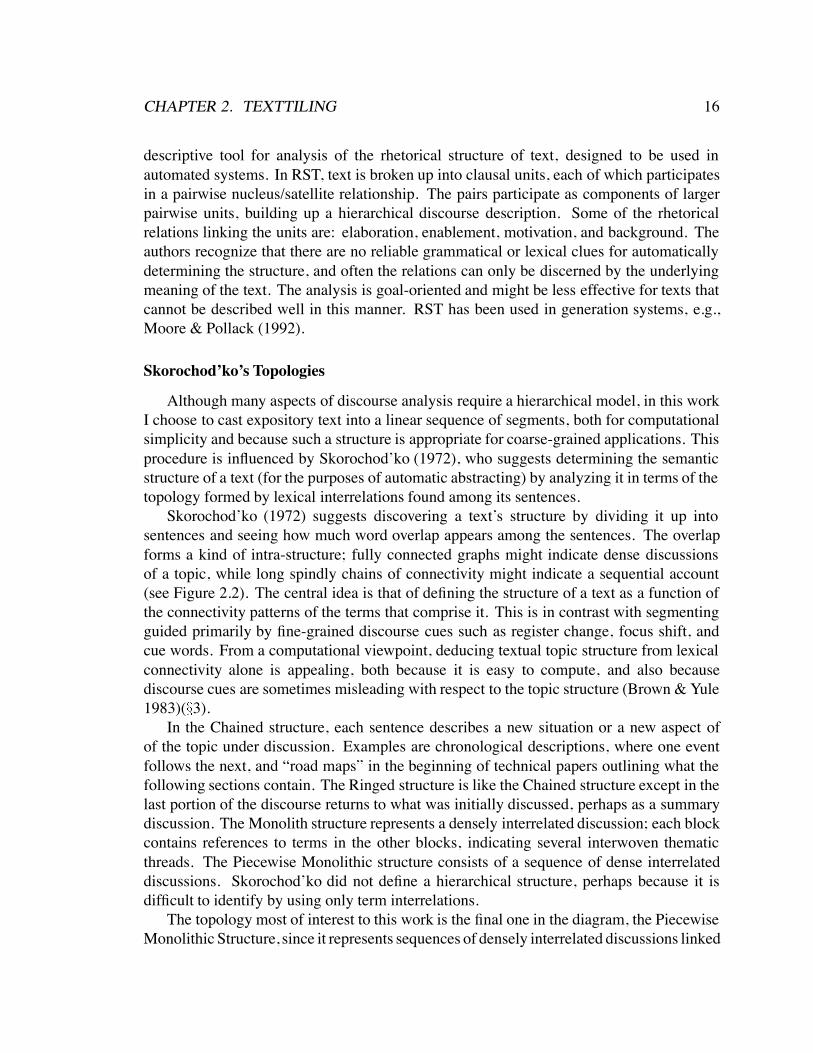
descriptive tool for analysis of the rhetorical structure of text, designed to be used inautomated systems. In RST, text is broken up into clausal units, each of which participatesin a pairwise nucleus/satellite relationship. The pairs participate as components of largerpairwise units, building up a hierarchical discourse description. Some of the rhetoricalrelations linking the units are: elaboration, enablement, motivation, and background. Theauthors recognize that there are no reliable grammatical or lexical clues for automaticallydetermining the structure, and often the relations can only be discerned by the underlyingmeaning of the text. The analysis is goal-oriented and might be less effective for texts thatcannot be described well in this manner. RST has been used in generation systems, e.g.,Moore & Pollack (1992).
Skorochod’ko’s Topologies
Although many aspects of discourse analysis require a hierarchical model, in this workI choose to cast expository text into a linear sequence of segments, both for computationalsimplicity and because such a structure is appropriate for coarse-grained applications. Thisprocedure is influenced by Skorochod’ko (1972), who suggests determining the semanticstructure of a text (for the purposes of automatic abstracting) by analyzing it in terms of thetopology formed by lexical interrelations found among its sentences.
Skorochod’ko (1972) suggests discovering a text’s structure by dividing it up intosentences and seeing how much word overlap appears among the sentences. The overlapforms a kind of intra-structure; fully connected graphs might indicate dense discussionsof a topic, while long spindly chains of connectivity might indicate a sequential account(see Figure 2.2). The central idea is that of defining the structure of a text as a function ofthe connectivity patterns of the terms that comprise it. This is in contrast with segmentingguided primarily by fine-grained discourse cues such as register change, focus shift, andcue words. From a computational viewpoint, deducing textual topic structure from lexicalconnectivity alone is appealing, both because it is easy to compute, and also becausediscourse cues are sometimes misleading with respect to the topic structure (Brown & Yule1983)( 3).
In the Chained structure, each sentence describes a new situation or a new aspect ofof the topic under discussion. Examples are chronological descriptions, where one eventfollows the next, and “road maps” in the beginning of technical papers outlining what thefollowing sections contain. The Ringed structure is like the Chained structure except in thelast portion of the discourse returns to what was initially discussed, perhaps as a summarydiscussion. The Monolith structure represents a densely interrelated discussion; each blockcontains references to terms in the other blocks, indicating several interwoven thematicthreads. The Piecewise Monolithic structure consists of a sequence of dense interrelateddiscussions. Skorochod’ko did not define a hierarchical structure, perhaps because it isdifficult to identify by using only term interrelations.
The topology most of interest to this work is the final one in the diagram, the PiecewiseMonolithic Structure, since it represents sequences of densely interrelated discussions linked

CHAPTER 2. TEXTTILING 17
Chained
Ringed
Monolith
Piecewise
Figure 2.2: Skorochod’ko’s text structure types. Nodes correspond to units of text such assentences, and edges between nodes indicate strong term overlap between the text units.Correspondence between position of a node and position in the text depends on the kind ofstructure; this is described in more detail in the text.
together, one after another. This topology maps nicely onto that of viewing documents asa sequence of densely interrelated subtopical discussions, one following another. Thisassumption, as will be seen, is not always valid, but is nevertheless quite useful.
2.4.3 Grammars and ScriptsAn alternative way of analyzing discourse structure is to propose a “grammatical”
discourse theory. Many researchers have seen this as a natural extension to the ideasof sentence grammar. Fillmore (1981:147) makes a distinction between what a sentencegrammarian does (looks for grammaticality and nongrammaticality) and what a discoursegrammarian does (looks for sequiturity and nonsequiturity). Wilensky (1983b) also disputesthe analogy between story grammars and sentence grammars, arguing that intuitions aboutstories are closer to our intuitions about the meanings of sentences than they are to ourintuitions about sentences themselves.
Another alternative is to interpret texts from an artificial intelligence stance and try to

CHAPTER 2. TEXTTILING 18
fit the discourse into a predefined frame or script, e.g., Schank & Abelson (1977), Hahn(1990), DeJong (1982), Mauldin (1989). These approaches are usually used to create asummary of some kind. A variation on the theme is found in case-based reasoning, e.g.,Kolodner (1983), Bareiss (1989), in which a discourse is adjusted to fit the expectations ofa set of pre-analyzed discourses. The problem with this kind of approach is that it requiresdetailed knowledge about every domain that the analyzed texts discuss, and requires avery large amount of processing time for the analysis of only a few sentences; impracticalrequirements for a full-scale information access system.
2.5 Detecting Discourse StructureMany different mechanisms have been proposed for the automated determination of
discourse structure. Explicit cue words, (e.g., now, well, so in English (Schiffrin 1987))are recognized as being meaningful cues, especially for spoken text. However, these cuesare not unambiguous in usage, and considerable effort is required to determine the role of aparticular instance of a cue (Hirschberg & Litman 1993). Other kinds of cues, such as tense(Webber 1987), (Hwang & Schubert 1992), are also informative but require a complexanalysis. The next two subsections discuss two other means of determining discoursestructure, making use of the patterns of cohesion indicators other than lexical cohesion, andlexical cohesion relations themselves.
2.5.1 Distributional Patterns of Cohesion CuesResearchers have experimented with the display of patterns of cohesion indicators in
discourse as an analytic device, for example, Grimes (1975)(Ch. 6) uses “span charts” toshow the interaction of various thematic devices such as identification, setting and tense.Stoddard (1991) creates “cohesion maps” by assigning to each word a location on a two-dimensional grid corresponding to the word’s position in the text (roughly, each sentencecorresponds to a row), and then drawing a line between the location of a cohesive elementand the location of its original referent. The resulting map looks somewhat like a columnof hanging pine-needle bunches; thus texts can be compared visually for properties suchas burstiness, density, and connection span. Each kind of cohesive element is assignedits own map, although for one example all three cohesion maps are superimposed. Herecohesion elements are pronominal referents, referents of definite articles, and verb agentdisplacements – lexical cohesion relations are not taken into account. Unfortunately, neitherStoddard nor Grimes analyze the resulting patterns or describe how to use them to segmentor interpret the texts.
CHAPTER 2. TEXTTILING 19
2.5.2 Lexical Cohesion RelationsThe seminal linguistic work on lexical cohesion relations is that of Halliday & Hasan
(1976). In a more abbreviated form, Raskin & Weiser (1987) point out that a distinctionmust be made between cohesion and coherence in a discourse. They state: “Coherencerefers to the consistency of purpose, voice, content, style, form, and so on of a discourseas intended by the writer, achieved in the text, and perceived by the reader. Cohesion, onthe other hand, is a textual quality which contributes to coherence through verbal cues”(p 48). One kind of cohesion cue is that of lexical cohesion, which “...results from theco-occurrence of semantically similar words that do not independently indicate cohesion”(p 204). Following Halliday & Hasan (1976), they describe two forms of lexical cohesion,reiteration and collocation, where the former refers to repetition of words or their synonyms,and the latter refers to terms that tend to co-locate in text, e.g., night and day, or schooland teacher. Other kinds of cohesion cues relate to specific words that indicate particularrelations, e.g., afterwards indicates a temporal relation between sentences, and and canindicate a conjunctive relationship. Relations such as anaphoric reference are consideredto be grammatical cohesion, as opposed to lexical cohesion.
Phillips (1985) suggests “an analysis of the distribution of the selected text elementsrelative to each other in some suitable text interval ... for whatever patterns of associationthey may contract with each other as a function of repeated co-occurrence” (p 59). Theresulting analysis leads to hypotheses of lexical meaning based on term co-occurrence, butthe text structure elicited reflects not much beyond the chapter structure of the text bookshe investigates. Two other important approaches are those of Morris & Hirst (1991) andYoumans (1991), described in the following sections.
Morris and Hirst
Morris and Hirst’s pioneering work on computing discourse structure from lexicalrelations (Morris & Hirst 1991; Morris 1988) is a precursor to the work reported on here.Morris, influenced by Halliday and Hasan’s theory of lexical coherence (Halliday & Hasan1976), developed an algorithm that finds chains of related terms via a comprehensivethesaurus (Roget’s Fourth Edition). For example, the words residential and apartment bothindex the same thesaural category and can thus be considered to be in a coherence relationwith one another. The chains are used to structure texts according to Grosz and Sidner’sattentional/intentional theory of discourse structure (Grosz & Sidner 1986), and the extentof the chains correspond to the extent of a segment. The algorithm also incorporates thenotion of “chain returns” – repetition of terms after a long hiatus – to close off an intentionthat spans over a digression.
Since the Morris and Hirst algorithm attempts to discover attentional/intentional struc-ture, their goals are different than those of TextTiling. Specifically, the discourse structurethey attempt to discover is hierarchical and more fine-grained than that discussed here.Morris (1988) provides five short example texts for which she has determined the inten-
CHAPTER 2. TEXTTILING 20
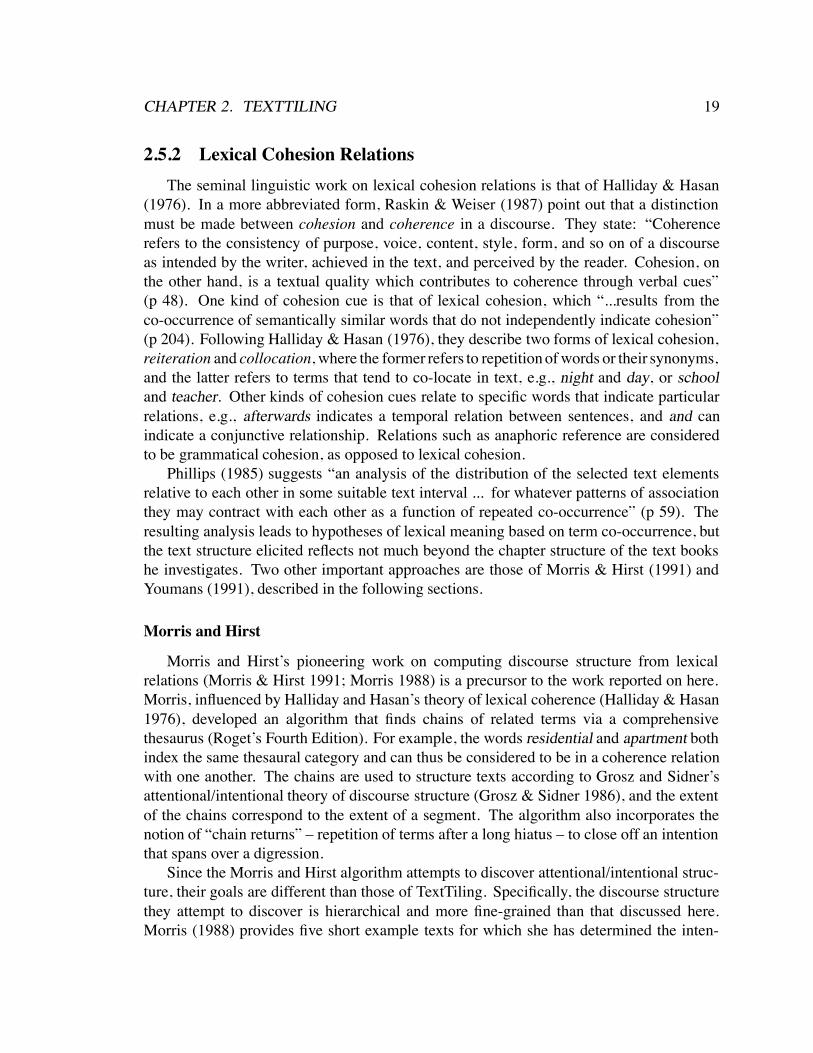
tional structure, and states that the lexical chains generated by her algorithm provide a goodindication of the segment boundaries that Grosz and Sidner’s theory assumes. In Morris(1988) and Morris & Hirst (1991), tables are presented showing the sentences spanned bythe lexical chains and by the corresponding segments of the attentional/intentional structure(derived by hand). Figure 2.3 shows a graphical depiction of the same information for oneof the test texts. It shows how different chains cover the structure at different levels ofgranularity, as well as which portions of the structure are not accounted for.
Several aspects of the algorithm are problematic, especially when applied to longertexts. First, the algorithm was executed by hand because the thesaurus is not generallyavailable online. However, Project Gutenberg has donated an online copy of Roget’s 1911thesaurus which, although smaller and less structured than the thesaurus used by Morris,can be used for an implementation of the algorithm. Aside from the fact that using such athesaurus lowers the quality of the connections found among terms, an implementation ofthe Morris algorithm using found that often the choice of which thesaural relation to usewas not unambiguous.
Second, although ambiguous chain links were rare in Morris’s texts, the texts analyzedhere had many ambiguous links, even when connections were restricted to being madebetween terms in the same thesaurus category. Another problem results from the fact thatthe model does not take advantage of the tendency for multiple simultaneous chains mightoccur over the same intention. For example, Text 4-3 of Morris (1988) contains a discussionof the role of women in the USSR as embodied in the life of Raisa Gorbachev. Two differentchains span most of the text: One consists of terms relating to the Soviet Union and theUnited States, and the other refers to women, men, husbands, and wives (see Figure 2.3).
0 5 10 15 20 25 30 35
"chains""intentions"
Figure 2.3: The target intentional structure and the extents of actual chains found in Morris88 for text 4-3. The x-axis indicates sentence numbers, the y-axis indicates relative depthof embedding of the intentional structure.
Another, more serious problem arises when looking at longer texts: chain overlap.In other words, many chains end at a particular paragraph while at the same time manyother chains extend past that paragraph. Figure 2.4 shows the distribution, by sentence

CHAPTER 2. TEXTTILING 21
number, of selected terms from the Stargazers text. The first two terms have fairly uniformdistribution and so should not be expected to provide much information about the divisionsof the discussion. The next two terms co-occur a few times at the beginning of the text(although star also occurs quite frequently at the end of the text as well), while terms binarythrough planet have considerable overlap from sentences 58 to 78. There is a somewhatwell-demarked cluster of terms between sentences 35 and 50, corresponding to the groupingtogether of paragraphs 10, 11, and 12 by human judges who have read the text.
From the diagram it is evident that simply looking for chains of repeated terms is notsufficient for determining subtopic breaks. Even combining terms that are closely relatedsemantically into single chains is insufficient, since often several different themes are activein the same segment. For example, sentences 37 - 51 contain dense interaction among theterms move, continent, shoreline, time, species, and life, and all but the latter occur onlyin this region. Few thesauri would group all of these terms together. However, it is thecase that the interlinked terms of sentences 57 - 71 (space, star, binary, trinary, astronomer,orbit) are closely related semantically, assuming the appropriate senses of the terms havebeen determined.
One way to get around this difficulty is to extend the Morris algorithm to create graphsthat plot the number of active chains against paragraph or sentence numbers. This optionis discussed in more detail in Section 2.7.
Youmans
Another recent analytic technique that makes use of lexical information is described inYoumans (1991). Youmans introduces a variant on type/token curves, called the Vocabulary-Management Profile, that keeps track of how many first-time uses of terms occur at themidpoint of each 35-word window in a text. Youmans’ goal is to study the distributionof vocabulary in discourse rather than to segment it along topical lines, but the peaks andvalleys in the resulting plots “correlate closely to constituent boundaries and informationflow” (although Youmans points out that they are correlated, but not directly related).Youmans begins with the hypothesis that new topics will be met with a sharp burst of newterm uses, but this kind of activity is not visible on a typical type/token ratio plot. Wheninstead of simple type/token ratios the number of new words within an interval of wordsare plotted, the changes become more visible.
Youmans discovers, upon examining many English narratives, essays, and transcripts,that new vocabulary is introduced less often in the first part than the second part of clausesand sentences, and that sharp upturns after deep valleys in the curve signal shifts to newsubjects in essays and new episodes in stories. The analysis focuses on more fine-graineddivisions than those of interest for TextTiling, subdividing each paragraph into multipletopic units. Youmans finds that for certain kinds of texts, the profile lags behind the onsetof paragraphs for a sentence or two, since much expository writing includes repetition ofinformation from one paragraph into the next,
Youmans also finds that longer intervals yield smoother plots, with lower peaks and

CHAPTER 2. TEXTTILING 22
Figure 2.4: Distribution of selected terms from the Stargazer text, with a single digitfrequency per sentence number (blanks indicate a frequency of zero).
CHAPTER 2. TEXTTILING 23
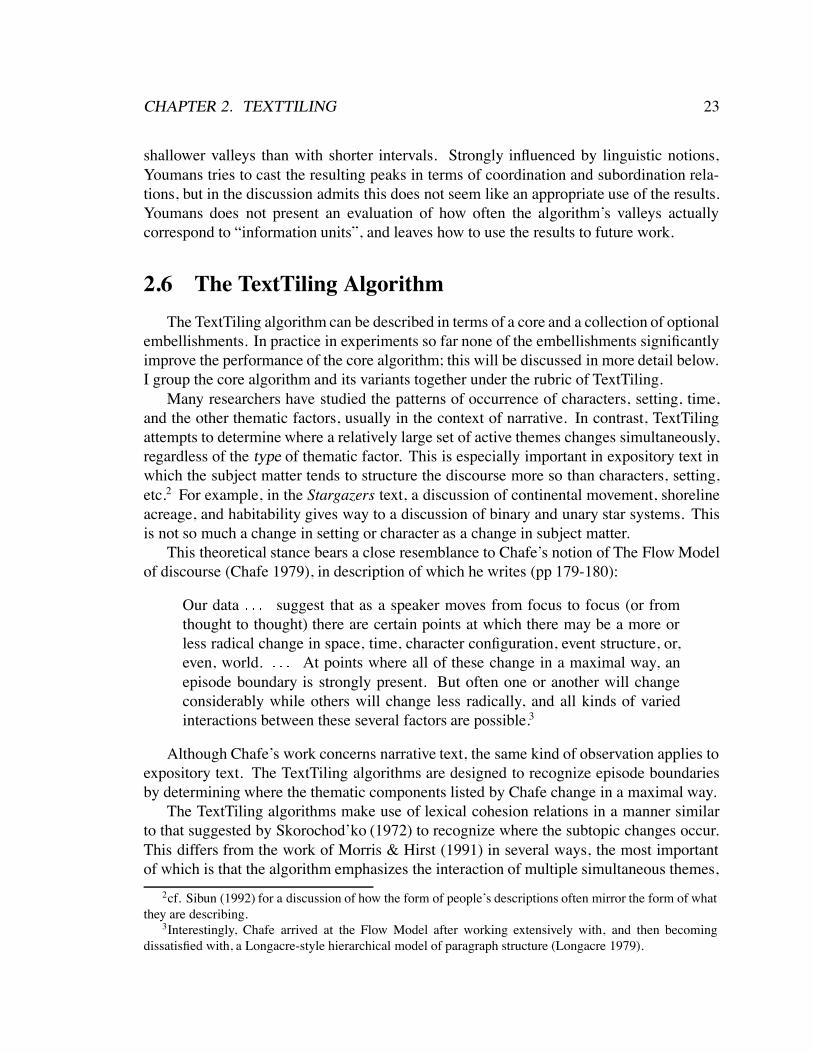
shallower valleys than with shorter intervals. Strongly influenced by linguistic notions,Youmans tries to cast the resulting peaks in terms of coordination and subordination rela-tions, but in the discussion admits this does not seem like an appropriate use of the results.Youmans does not present an evaluation of how often the algorithm’s valleys actuallycorrespond to “information units”, and leaves how to use the results to future work.
2.6 The TextTiling AlgorithmThe TextTiling algorithm can be described in terms of a core and a collection of optional
embellishments. In practice in experiments so far none of the embellishments significantlyimprove the performance of the core algorithm; this will be discussed in more detail below.I group the core algorithm and its variants together under the rubric of TextTiling.
Many researchers have studied the patterns of occurrence of characters, setting, time,and the other thematic factors, usually in the context of narrative. In contrast, TextTilingattempts to determine where a relatively large set of active themes changes simultaneously,regardless of the type of thematic factor. This is especially important in expository text inwhich the subject matter tends to structure the discourse more so than characters, setting,etc.2 For example, in the Stargazers text, a discussion of continental movement, shorelineacreage, and habitability gives way to a discussion of binary and unary star systems. Thisis not so much a change in setting or character as a change in subject matter.
This theoretical stance bears a close resemblance to Chafe’s notion of The Flow Modelof discourse (Chafe 1979), in description of which he writes (pp 179-180):
Our data suggest that as a speaker moves from focus to focus (or fromthought to thought) there are certain points at which there may be a more orless radical change in space, time, character configuration, event structure, or,even, world. At points where all of these change in a maximal way, anepisode boundary is strongly present. But often one or another will changeconsiderably while others will change less radically, and all kinds of variedinteractions between these several factors are possible.3
Although Chafe’s work concerns narrative text, the same kind of observation applies toexpository text. The TextTiling algorithms are designed to recognize episode boundariesby determining where the thematic components listed by Chafe change in a maximal way.
The TextTiling algorithms make use of lexical cohesion relations in a manner similarto that suggested by Skorochod’ko (1972) to recognize where the subtopic changes occur.This differs from the work of Morris & Hirst (1991) in several ways, the most importantof which is that the algorithm emphasizes the interaction of multiple simultaneous themes,
2cf. Sibun (1992) for a discussion of how the form of people’s descriptions often mirror the form of whatthey are describing.
3Interestingly, Chafe arrived at the Flow Model after working extensively with, and then becomingdissatisfied with, a Longacre-style hierarchical model of paragraph structure (Longacre 1979).

CHAPTER 2. TEXTTILING 24
rather than following single threads of discussion alone. Main topics are themes thatcontinue on throughout the ebb and flow of the interacting subtopics.
Many researchers (e.g., Halliday & Hasan (1976), Tannen (1989), Walker (1991)) havenoted that term repetition is a strong cohesion indicator. In this work, term repetitionalone, when used in terms of multiple simultaneous threads of information, is a very usefulindicator of subtopic structure. This section describes the core algorithm for discoveringsubtopic structure using term repetition as a lexical cohesion indicator.
The core algorithm compares, for a given window size, each pair of adjacent blocksof text according to how similar they are lexically (see Figure 2.5). This method assumesthat the more similar two blocks of text are, the more likely it is that the current subtopiccontinues, and, conversely, if two adjacent blocks of text are dissimilar, the current subtopicgives way to a new one.
A
B
C
D
E
A
C
E
F
G
B
C
F
H
I
A
D
F
I
B
I
J
K
L
M
K
L
M
N
O
J
M
N
P
Q
B
F
J
K
M
1 2 3 4 5 6 7 8
Figure 2.5: Illustration of the core lexical cohesion comparison algorithm. Letters signifylexical items, numbers signify sentence numbers. In the diagram, similarity comparison isdone on adjacent blocks with a blocksize of 2. Arrows indicate which blocks are comparedto yield scores for sentence gaps 2, 4, and 6. Blocks are shifted by one sentence forsimilarity measurements for gaps 3, 5, and 7.
The rationale behind this strategy is that it is an attempt to detect when a dense,interrelated discussion ends and a new one begins, in the spirit of Skorodch’ko’s PiecewiseMonolithic discourse topology. The appearance of a set of new terms indicates the onsetof a new topic, as in Youmans’ approach, but the repetition of existing terms also provideshelpful evidence – that is, evidence that the current discussion is still ongoing. However,there is no explicit requirement about how close together individual terms must be. In otherwords, the algorithm does not need to specify how far apart individual terms can be; rather

CHAPTER 2. TEXTTILING 25
it looks for a change in the overall patterns among the terms in the blocks being compared.The core algorithm has three main parts:
1. Tokenization
2. Similarity Determination
3. Boundary Identification
Each is described in detail below.
2.6.1 TokenizationTokenization refers to the division of the input text into individual lexical units, and
is sensitive to the format of the input text. For example, if the document has markupinformation, the header and other auxiliary information is skipped until the body of thetext is located. Tokens that appear in the body of the text are converted to all lower-casecharacters and checked against a “stoplist” of 898 words, the most frequent terms in a largetext collection. If the token is a stopword then it is not passed on to the next step. Otherwise,the token is reduced to its root by a morphological analysis function which uses WordNet’snoun and verb term lists and exception lists, converting regularly and irregularly inflectednouns and verbs to their roots.
The text is subdivided into psuedosentences of a pre-defined size w (a parameter ofthe algorithm) rather than actual syntactically-determined sentences, thus circumventingnormalization problems. For the purposes of the rest of the discussion these groupingsof tokens will be referred to as token-sequences. In practice, setting w to 20 tokens pertoken-sequence works best for many texts. The morphologically-analyzed token is stored ina table along with a record of the token-sequence number it occurred in, and how frequentlyit appeared in the token-sequence. A record is also kept of the locations of the paragraphbreaks within the text.
2.6.2 Similarity DeterminationThe next step is the comparison of adjacent pairs of blocks of token-sequences for
overall lexical similarity. (See the sketch in Figure 2.5.) Another important parameter forthe algorithm is the blocksize: the number of token-sequences that are grouped togetherinto a block to be compared against an adjacent group of token-sequences. This value,labeled , varies slightly from text to text; as a heuristic it is the average paragraph length(in token-sequences). In practice, a value of 6 works well for many texts. Actualparagraphs are not used because their lengths can be highly irregular, leading to unbalancedcomparisons.
Similarity values are computed for every token-sequence gap number; that is, a score isassigned to token-sequence gap corresponding to how similar the token-sequences from

CHAPTER 2. TEXTTILING 26
token-sequence through are to the token-sequences from 1 to 1. Note thatthis moving window approach means that each token-sequence appears in 2 similaritycomputations.
Similarity between blocks is calculated by a cosine measure: given two text blocks 1and 2, each with token-sequences,
1 21 2
21 1
22
where ranges over all the terms that have been registered during the tokenization step, and1 is the weight assigned to term in block 1. In the core version of the algorithm, the
weights on the terms are simply their frequency within the block. Thus if the similarityscore between two blocks is high, then the blocks have many terms in common. Thisformula yields a score between 0 and 1, inclusive.
These scores can be plotted, token-sequence number against similarity score. However,since similarity is measured between blocks 1 and 2, where 1 spans token-sequences
through and 2 spans 1 to 1, the measurement’s -axis coordinate fallsbetween token-sequences and 1. Therefore, the -axis corresponds to token-sequencegap number .
2.6.3 Boundary IdentificationBoundary identification takes place in several steps. First, the plot is smoothed with
average smoothing; that is,
for each token-sequence gap and an even window size 1find the scores of the 2 gaps to the left offind the scores of the 2 gaps to the right offind the score attake the average of these scores and assign it to
repeat this procedure times
In practice, for most of the examined texts, one round of average smoothing with a windowsize of three works best.
Boundaries are determined by changes in the sequence of similarity scores. The token-sequence gap numbers are ordered according to how steeply the slopes of the plot are toeither side of the token-sequence gap, rather than by their absolute similarity score. For agiven token-sequence gap , the algorithm looks at the scores of the token-sequence gaps tothe left of as long are their values are increasing. When the values to the left peak out, thedifference between the score at the peak and the score at is recorded. The same proceduretakes place with the token-sequence gaps to the right of ; their scores are examined as longas they continue to rise. The relative height of the peak to the right of is added to the

CHAPTER 2. TEXTTILING 27
relative height of the peak to the left. (A gap occurring at a peak will have a score of zerosince neither of its neighbors is higher than it.)
These new scores, called depth scores, corresponding to how sharp a change occurson both sides of the token-sequence gap, are sorted. Segment boundaries are assigned tothe token-sequence gaps with the largest corresponding scores, adjusted as necessary tocorrespond to true paragraph breaks. A proviso check is done that prevents assignment ofvery close adjacent segment boundaries. Currently there must be at least three interveningtoken-sequences between boundaries. This helps control for the fact that many texts havespurious header information and single-sentence paragraphs.
A consequence of the boundary determination strategy is that a token-sequence gap thatlies between two sharply rising peaks will receive a higher score than a token-sequence gapin the middle of a long valley with low hills. Thus a gap with a high peak on only one sidecan receive a good-sized score. A potential problem occurs if there is a rise on one side ofa gap, and a decline on the other. However, the gap at the bottom of the decline will receivean even larger score than the first gap and so will overrule the first gap’s score, if the twogaps are close together. On the other hand if the two gaps are far apart, there is probably acall for the intermediate gap to serve as a boundary.
Another issue concerns the number of segments to be assigned to a document. Everyparagraph is a potential segment boundary. Any attempt to make an absolute cutoff isproblematic since there would need to be some correspondence to the document style andlength. A cutoff based on a particular valley depth is similarly problematic.
I have devised a method for determining how many boundaries to assign that scales withthe size of the document and is sensitive to the patterns of similarity scores that it produces.The cutoff is a function of the average and standard deviations of the depth scores for thetext under analysis. Currently a boundary is drawn only if the depth score exceeds ¯ 2.
2.6.4 EmbellishmentsThere are several ways to modify the algorithm in order to attempt to improve its results.
Some of these are:
Varying the specifics of tokenization, e.g., increasing or reducing the stoplist or thedegree morphological analysis (e.g., derivational vs. inflectional vs. no analysis)
Using thesaural relations in addition to term repetition to make better estimates aboutthe cohesiveness of the discussion.
Using localized discourse cue information to help better determine exact locations ofboundaries.
Weighting terms according to their prior probability, how frequent they are in the textunder analysis, or some other property.

CHAPTER 2. TEXTTILING 28
Using a different similarity measure, such as one that weights the terms according toa gaussian distribution centered at each token-sequence gap number.
Treating the plot as a probabilistic time series and detected the boundaries based onthe likelihood of a transition from nontopic to topic.4
Earlier work (Hearst 1993) incorporated thesaural information into the algorithms;surprisingly the latest experiments find that this information degrades the performance.This could very well be due to problems with the thesaurus and assignment algorithmused (a variation on that described in Chapter 4. A simple algorithm that just positsrelations among terms that are a small distance apart according to WordNet (Miller et al.1990) or Roget’s 1911 thesaurus (from Project Gutenberg), modeled after Morris and Hirst’sheuristics, might work better. Therefore I do not feel the issue is closed, and instead considersuccessful grouping of related words as future work. As another possible alternative Kozima(1993) has suggested using a (computationally expensive) semantic similarity metric to findsimilarity among terms within a small window of text (5 to 7 words). This work does notincorporate the notion of multiple simultaneous themes but instead just tries to find breaksin semantic similarity among a small number of terms. A good strategy may be to substitutethis kind of similarity information for term repetition in algorithms like those describedhere. Another possibility would be to use semantic similarity information as computed inSchutze (1993b), Resnik (1993), or Dagan et al. (1993).
The use of discourse cues for detection of segment boundaries and other discoursepurposes has been extensively researched, although predominantly on spoken text (seeHirschberg & Litman (1993) for a summary of six research groups’ treatments of 64 cuewords). It is possible that incorporation of such information may help improve the caseswhere the algorithm is off by one paragraph, as might reference resolution or an accountof tense and aspect. Informal experiments with versions of all of the other items do notseem to produce significantly better results than the most stripped-down version of the corealgorithm.
Another way to alter the algorithm is to change the comparison strategy. It is possible tomodify the approach of Morris & Hirst (1991), discussed above, to take multiple simulta-neous themes into account, and to apply it to the multi-paragraph segmentation problem asopposed to the attentional/intentional segment recognition problem. Rather than assumingthat each chain corresponds directly to one segment, and vice versa, an algorithm can createa collection of active chains, and then place boundaries at the points in the text where morechains are inactive than active (see Figure 2.6). This approach does not make use of explicitchain returns; they are accounted for implicitly instead. A version of Youmans’ algorithm(Youmans 1991), also discussed above, and modified to apply to larger segmentation units,might also prove successful, although preliminary experiments did not show it to performsignificantly better.
4I am grateful to Isabelle Guyon for her help with this suggestion.

CHAPTER 2. TEXTTILING 29
xïïxïïïïïxxïïïïïxïïïïïxxïïxïïxxïïïïïïïïxxïïxïïïïïx xïïxïïxïïx xïïxïïïïïx xïïxïïïïïx xïïxïïx xïïx xïïxïïxïïx x
ABCDEFIJKLMN
1 2 3 4 5 6 7 8
Figure 2.6: Accumulating counts of chains of terms: letters signify lexical items, numberssignify token-sequence numbers, ‘x’ indicates that the term occurs in the token-sequence,‘-’ indicates continuation of a chain, and arrows cut through the active chains that contributeto the cumulative count for token-sequence gaps 2, 4, and 6. In the diagram there is evidencefor a break between token-sequences 4 and 5 because there are few active chains there.
2.7 EvaluationOne way to evaluate these segmentation algorithms is to compare against judgments
made by human readers, another is to see how well the results improve a computationaltask, and a third possible evaluation measure is to compare the algorithms against textspre-marked by authors. This section compares the algorithm against reader judgments,since author markups are fallible and are usually applied to text types that this algorithmis not designed for, and Chapter 3 shows how to use tiles in a task (although it does notformally prove that the results of the algorithm improve the task more than some otheralgorithm with similar goals would).
2.7.1 Reader JudgmentsJudgments were obtained from seven readers for each of thirteen magazine articles which
satisfied the length criteria (between 1800 and 2500 words)5 and which contained littlestructural demarkation. The judges were asked simply to mark the paragraph boundaries at
5One longer text of 2932 words was used since reader judgments had been obtained for it from an earlierexperiment. Note that this represents an amount of test data on the order of that used in the experiments ofPassonneau & Litman (1993). Judges were technical researchers. Two texts had three or four short headerswhich we removed.

CHAPTER 2. TEXTTILING 30
which the topic changed; they were not given more explicit instructions about the granularityof the segmentation.
Figure 2.7(a) shows the boundaries marked by seven judges on the Stargazers text. Thisformat helps illuminate the general trends made by the judges and also helps show whereand how often they disagree. For instance, all but one judge marked a boundary betweenparagraphs 2 and 3. The dissenting judge did mark a boundary after 3, as did two of theconcurring judges. The next three major boundaries occur after paragraphs 5, 9, 12, and13. There is some contention in the later paragraphs; three readers marked both 16 and 18,two marked 18 alone, and two marked 17 alone. The outline in Section 2.1 gives an idea ofwhat each segment is about.
Passonneau & Litman (1993) discuss at length considerations about evaluating seg-mentation algorithms according to reader judgment information. As Figure 2.7(b) shows,agreement among judges is imperfect, but trends can be discerned. In Passonneau & Lit-man’s (1993) data, if 4 or more out of 7 judges mark a boundary, the segmentation isfound to be significant using a variation of the Q-test (Cochran 1950). My data showedsimilar results. However, it isn’t clear how useful this significance information is, sincea simple majority does not provide overwhelming proof about the objective reality of thesubtopic break. Since readers often disagree about where to draw a boundary marking fora topic shift, one can only use the general trends as a basis from which to compare differentalgorithms. Since the goals of TextTiling are better served by algorithms that produce morerather than fewer boundaries, I set the cutoff for “true” boundaries to three rather than fourjudges per paragraph.6 The remaining gaps are considered nonboundaries.
2.7.2 ResultsFigure 2.7(b) shows a plot of the results of applying the block comparison algorithm to
the Stargazer text. When the lowermost portion of a valley is not located at a paragraph gap,the judgment is moved to the nearest paragraph gap.7 For the most part, the regions of strongsimilarity correspond to the regions of strong agreement among the readers. (These resultswere fifth highest out of the 13 test texts.) Note however, that the similarity informationaround paragraph 12 is weak. This paragraph acts as a summary paragraph, summarizingthe contents of the previous three and revisiting much of the terminology that occurredin them all in one location (in the spirit of a Grosz & Sidner (1986) “pop” operation).Thus it displays low similarity both to itself and to its neighbors. This is an example of abreakdown caused by the assumption about the linear sequence of the subtopic discussions.It is possible that an additional pass through the text could be used to find structure of thiskind.
6Paragraphs of three or fewer sentences were combined with their neighbor if that neighbor was deemedto follow at “true” boundary, as in paragraphs 2 and 3 of the Stargazers text.
7The need for this adjustment might be explained in part by Stark (1988) who shows that readers disagreemeasurably about where to place paragraph boundaries when presented with texts with those boundariesremoved.
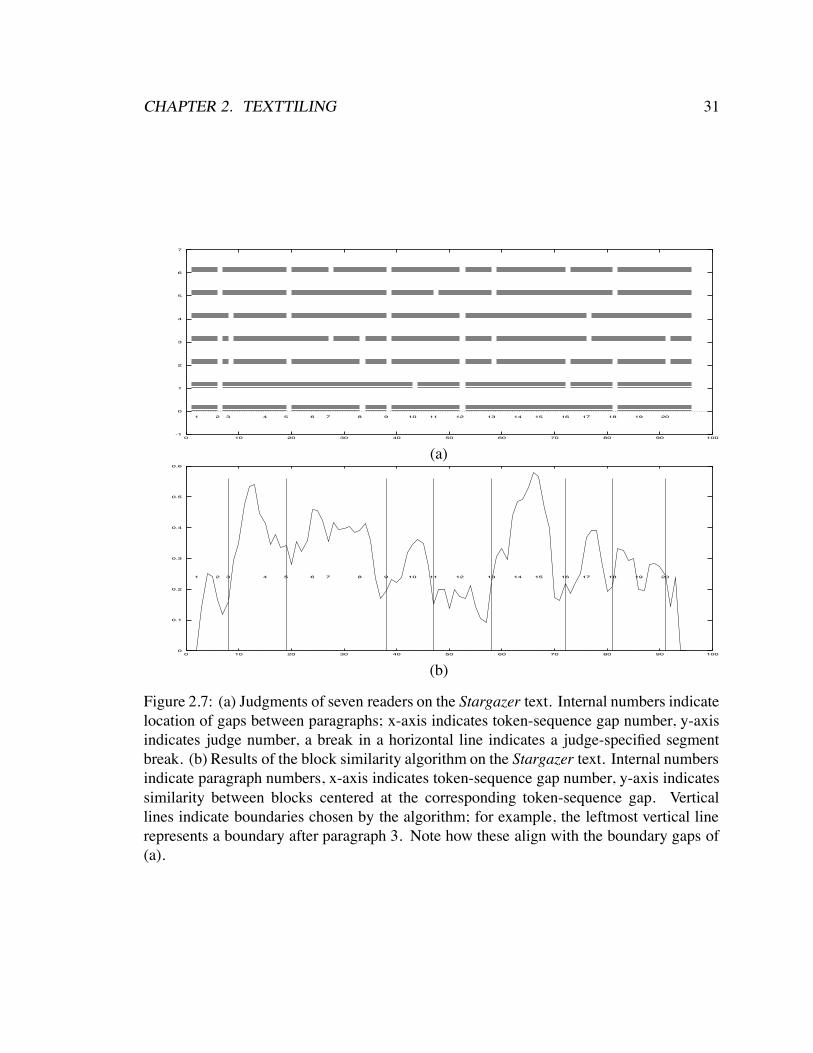
CHAPTER 2. TEXTTILING 31
-1
0
1
2
3
4
5
6
7
0 10 20 30 40 50 60 70 80 90 100
1 2 3 4 5 6 7 8 9 10 11 12 13 14 15 16 17 18 19 20
(a)
0
0.1
0.2
0.3
0.4
0.5
0.6
0 10 20 30 40 50 60 70 80 90 100
1 2 3 4 5 6 7 8 9 10 11 12 13 14 15 16 17 18 19 20
(b)
Figure 2.7: (a) Judgments of seven readers on the Stargazer text. Internal numbers indicatelocation of gaps between paragraphs; x-axis indicates token-sequence gap number, y-axisindicates judge number, a break in a horizontal line indicates a judge-specified segmentbreak. (b) Results of the block similarity algorithm on the Stargazer text. Internal numbersindicate paragraph numbers, x-axis indicates token-sequence gap number, y-axis indicatessimilarity between blocks centered at the corresponding token-sequence gap. Verticallines indicate boundaries chosen by the algorithm; for example, the leftmost vertical linerepresents a boundary after paragraph 3. Note how these align with the boundary gaps of(a).

CHAPTER 2. TEXTTILING 32
Precision Recallavg sd avg sd
Baseline 33% .44 .08 .37 .04Baseline 41% .43 .08 .42 .03Chains .64 .17 .58 .17Blocks .66 .18 .61 .13Judges .81 .06 .71 .06
Table 2.1: Precision and Recall values for 13 test texts.
Total Baseline 41% (avg) Blocks Chains Judges (avg)Text Possible Prec Rec C I Prec Rec C I Prec Rec C I Prec Rec C I
1 9 .44 .44 4 5 1.0 .78 7 0 1.0 .78 7 0 .78 .78 7 22 9 .50 .44 4 4 .88 .78 7 1 .75 .33 3 1 .88 .78 7 13 9 .40 .44 4 6 .78 .78 7 2 .56 .56 5 4 .75 .67 6 24 12 .63 .42 5 3 .86 .50 6 1 .56 .42 5 4 .91 .83 10 15 8 .43 .38 3 4 .70 .75 6 2 .86 .75 6 1 .86 .75 6 16 8 .40 .38 3 9 .60 .75 6 3 .42 .63 5 8 .75 .75 6 27 9 .36 .44 4 7 .60 .56 5 3 .40 .44 4 6 .75 .67 6 28 8 .43 .38 3 4 .50 .63 5 4 .67 .75 6 3 .86 .75 6 19 9 .36 .44 4 7 .50 .44 4 3 .60 .33 3 2 .75 .67 6 2
10 8 .50 .38 3 3 .50 .50 4 3 .63 .63 5 3 .86 .75 6 111 9 .36 .44 4 7 .50 .44 4 4 .71 .56 5 2 .75 .67 6 212 9 .44 .44 4 5 .50 .56 5 5 .54 .78 7 6 .86 .67 6 113 10 .36 .40 4 7 .30 .50 5 9 .60 .60 6 4 .78 .70 7 2
Table 2.2: Scores by text, showing precision and recall. (C) indicates the number ofcorrectly placed boundaries, (I) indicates the number of inserted boundaries. The numberof deleted boundaries can be determined by subtracting (C) from Total Possible.
The final paragraph is a summary of the entire text; the algorithm recognizes the changein terminology from the preceding paragraphs and marks a boundary; only two of the readerschose to differentiate the summary; for this reason the algorithm is judged to have madean error even though this sectioning decision is reasonable. This illustrates the inherentfallibility of testing against reader judgments, although in part this is because the judgeswere given loose constraints.
Following the advice of Gale et al. (1992a), I compare the algorithm against both upperand lower bounds. The upper bound in this case is the averages of the reader judgment data.The lower bound is a baseline algorithm that is a simple, reasonable approach to the problemthat can be automated. In the test data, boundaries are placed in about 41% of the paragraphgaps. A simple way to segment the texts is to place boundaries randomly in the document,constraining the number of boundaries to equal that of the average number of paragraphgaps assigned by judges. A program was written that places a boundary randomly at eachpotential gap 41% of the time, was run a large number of times (10,000) for each text, and

CHAPTER 2. TEXTTILING 33
the average of the scores of these runs was found.The algorithms are evaluated according to how many true boundaries they select out
of the total selected (precision) and how many true boundaries are found out of the totalpossible (recall) (Salton 1988). The recall measure implicitly signals the number of missedboundaries (false negatives, or deletion errors); the table also indicates the number of falsepositives, or insertion errors, explicitly. The precision and recall for the average of theresults appear in Table 2.1 (results at 33% are also shown for comparison purposes).
I also compared the core TextTiling algorithm against the chaining algorithm variantdiscussed in Section 2.6.4. The best variation on the chaining algorithm allows gaps of upto six token-sequences before the chain is considered to be broken. For both algorithms, wis 20, and morphological analysis and a stoplist are applied, as described in Section 2.6.1.
Table 2.1 shows that the blocking algorithm is sandwiched between the upper and lowerbounds. The block similarity algorithm seems to work slightly better than the chainingalgorithm, although the difference may not prove significant over the long run. Table 2.2shows some of these results in more detail.
In many cases the algorithms are almost correct but off by one paragraph, especiallyin the texts that the algorithm performs poorly on. When the block similarity algorithmis allowed to be off by one paragraph, there is dramatic improvement in the scores for thetexts that lower part of Table 2.2, yielding an overall precision of 83% and recall of 78%.As in Figure 2.7, it is often the case that where the algorithm is incorrect, e.g., paragraphgap 11, the overall blocking is very close to what the judges intended.
2.8 An Extended Example: The Tocqueville ChapterThis section illustrates the results of TextTiling on Chapter 1, Volume 1 of Tocqueville’s
Democracy in America discussed in Section 2.3.3. As mentioned there, this text is interest-ing because the author has provided a subtopic-like structure in the chapter preamble. Thetext of the chapter, labeled with paragraph numbers and sectioning information from thetiling algorithm, appears in Appendix A. The paragraph-level breakdown of the subtopicdescriptions is reproduced in Figure 2.8 for convenient reference and Figure 2.9 shows thecorresponding plot produced by the TextTiling algorithm. Note that the last two paragraphsin the text are summary in nature, and are not referred to in the subtopic list.
Comparing the results of tiling against the subtopic list of Figure 2.8, we see that thealgorithm is generally successful. However, it does make some off-by-one errors and insertsat least one boundary that is not specified by the subtopic list. Figure 2.10 compares theresults of the algorithm to that specified in Tocqueville’s subtopic list according to token-sequence gap number (the final paragraphs are not shown since they are not referred to inTocqueville’s subtopic list). Using the precision/recall measures of the previous section wesee that according to these boundaries the algorithm correctly chooses 6/9 of the possibleboundaries (recall = 67%), and of the boundaries it chooses, 6/9 were also chosen accordingto the subtopic structure (precision = 67%). Looking at Figure 2.10 and at the text of the
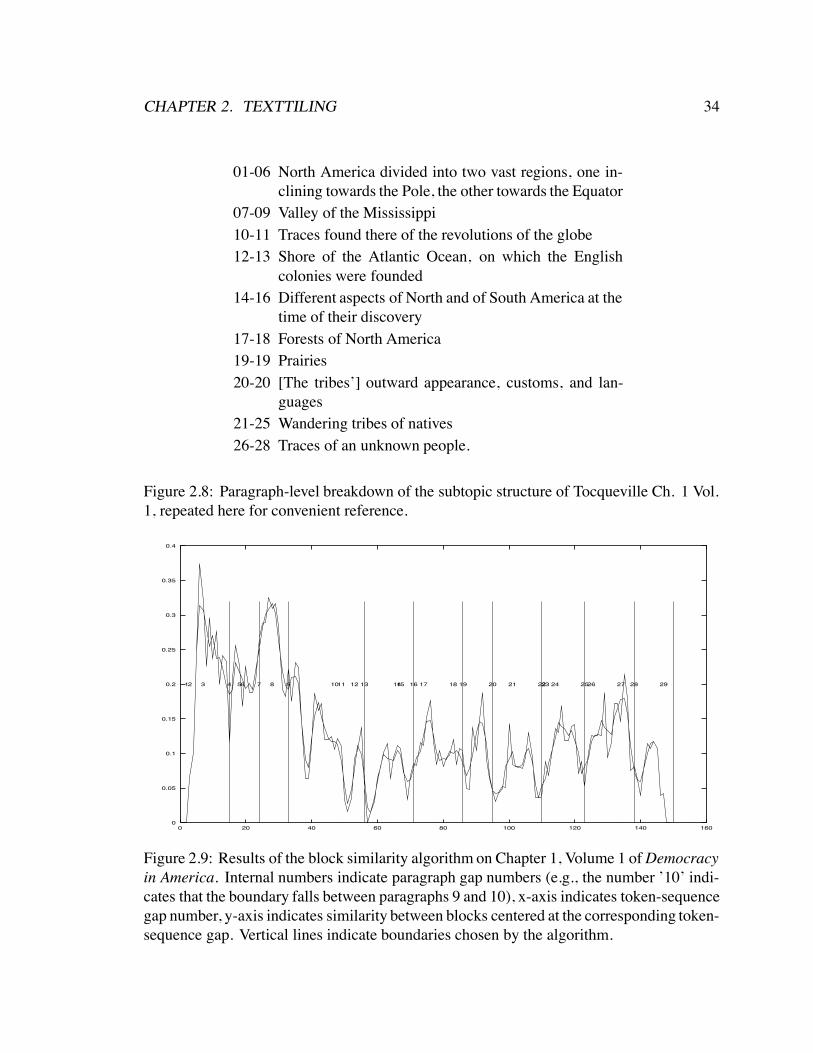
CHAPTER 2. TEXTTILING 34
01-06 North America divided into two vast regions, one in-clining towards the Pole, the other towards the Equator
07-09 Valley of the Mississippi10-11 Traces found there of the revolutions of the globe12-13 Shore of the Atlantic Ocean, on which the English
colonies were founded14-16 Different aspects of North and of South America at the
time of their discovery17-18 Forests of North America19-19 Prairies20-20 [The tribes’] outward appearance, customs, and lan-
guages21-25 Wandering tribes of natives26-28 Traces of an unknown people.
Figure 2.8: Paragraph-level breakdown of the subtopic structure of Tocqueville Ch. 1 Vol.1, repeated here for convenient reference.
0
0.05
0.1
0.15
0.2
0.25
0.3
0.35
0.4
0 20 40 60 80 100 120 140 160
12 3 4 56 7 8 9 1011 12 13 1415 16 17 18 19 20 21 2223 24 2526 27 28 29
Figure 2.9: Results of the block similarity algorithm on Chapter 1, Volume 1 ofDemocracyin America. Internal numbers indicate paragraph gap numbers (e.g., the number ’10’ indi-cates that the boundary falls between paragraphs 9 and 10), x-axis indicates token-sequencegap number, y-axis indicates similarity between blocks centered at the corresponding token-sequence gap. Vertical lines indicate boundaries chosen by the algorithm.
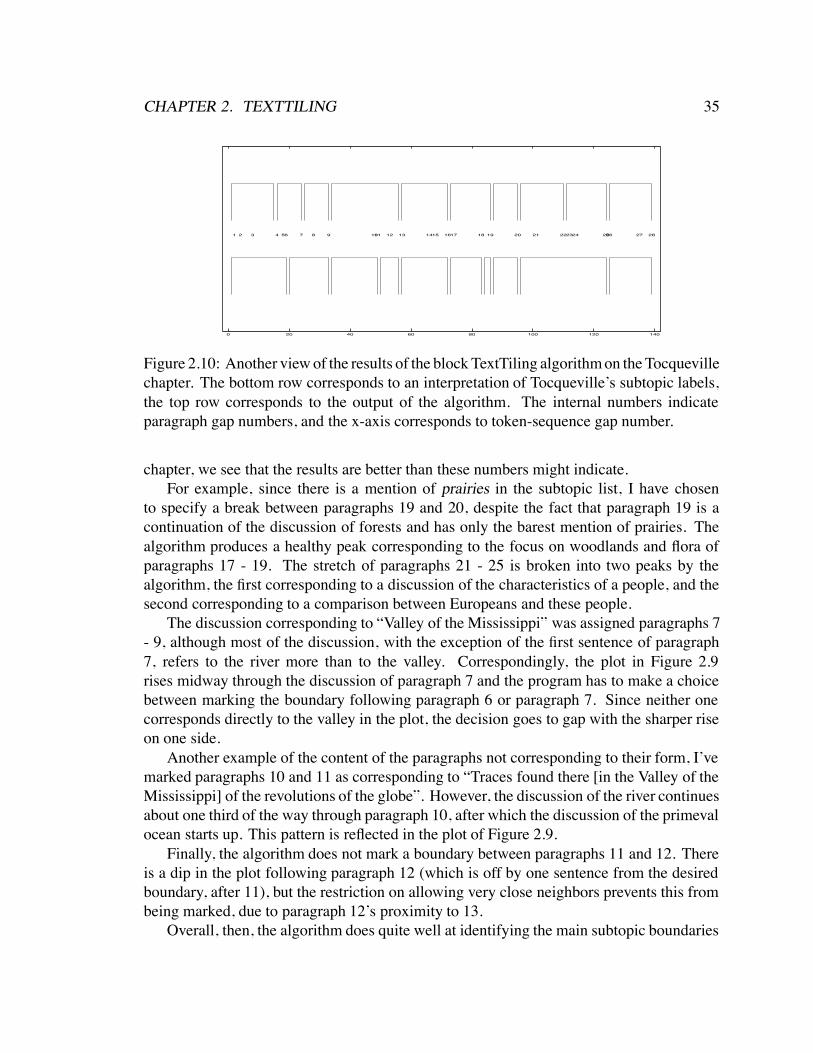
CHAPTER 2. TEXTTILING 35
0 20 40 60 80 100 120 140
1 2 3 4 56 7 8 9 1011 12 13 1415 1617 18 19 20 21 222324 2526 27 28
Figure 2.10: Another view of the results of the block TextTiling algorithm on the Tocquevillechapter. The bottom row corresponds to an interpretation of Tocqueville’s subtopic labels,the top row corresponds to the output of the algorithm. The internal numbers indicateparagraph gap numbers, and the x-axis corresponds to token-sequence gap number.
chapter, we see that the results are better than these numbers might indicate.For example, since there is a mention of prairies in the subtopic list, I have chosen
to specify a break between paragraphs 19 and 20, despite the fact that paragraph 19 is acontinuation of the discussion of forests and has only the barest mention of prairies. Thealgorithm produces a healthy peak corresponding to the focus on woodlands and flora ofparagraphs 17 - 19. The stretch of paragraphs 21 - 25 is broken into two peaks by thealgorithm, the first corresponding to a discussion of the characteristics of a people, and thesecond corresponding to a comparison between Europeans and these people.
The discussion corresponding to “Valley of the Mississippi” was assigned paragraphs 7- 9, although most of the discussion, with the exception of the first sentence of paragraph7, refers to the river more than to the valley. Correspondingly, the plot in Figure 2.9rises midway through the discussion of paragraph 7 and the program has to make a choicebetween marking the boundary following paragraph 6 or paragraph 7. Since neither onecorresponds directly to the valley in the plot, the decision goes to gap with the sharper riseon one side.
Another example of the content of the paragraphs not corresponding to their form, I’vemarked paragraphs 10 and 11 as corresponding to “Traces found there [in the Valley of theMississippi] of the revolutions of the globe”. However, the discussion of the river continuesabout one third of the way through paragraph 10, after which the discussion of the primevalocean starts up. This pattern is reflected in the plot of Figure 2.9.
Finally, the algorithm does not mark a boundary between paragraphs 11 and 12. Thereis a dip in the plot following paragraph 12 (which is off by one sentence from the desiredboundary, after 11), but the restriction on allowing very close neighbors prevents this frombeing marked, due to paragraph 12’s proximity to 13.
Overall, then, the algorithm does quite well at identifying the main subtopic boundaries

CHAPTER 2. TEXTTILING 36
of the Tocqueville chapter. In several cases in which the algorithm seems to be off, it isthe result of the fact that the actual transition takes place mid-paragraph. This is perhapsan argument for loosening the restriction of TextTiling into non-overlapping text units,especially when used for the purposes of user interface display.8
2.9 ConclusionsThis chapter has described algorithms for the segmentation of expository texts into multi-
paragraph discourse units that reflect the subtopic structure of the texts. It has introducedthe notion of the recognition of multiple simultaneous themes as an approximation toSkorodch’ko’s Piecewise Monolithic text structure type. The algorithm is fully implementedand term repetition alone, without use of thesaural relations, knowledge bases, or inferencemechanisms, works well for many of the experimental texts.
The chaining algorithm variation is adapted from that of Morris & Hirst (1991), withthe following differences: (i) the scores from multiple simultaneous chains are combined atthe boundary of each sentence (or token-sequence) and used to determine where segmentbreaks should be made, (ii) no thesaurus terms are used, and (iii) no chain returns are usedto determine if a chain that broke off restarted later. This algorithm seems comparable tothe block algorithm; in both cases, one algorithm performs better than the other on some ofthe test texts. This may well occur because both algorithms make use only of lexical co-occurrence information, and the evidence for boundaries given by this kind of informationis impoverished compared to the phenomena it tries to account for. Furthermore, the readerjudgment data being used as a yardstick is not terribly reliable since agreement among thejudges, although significant at frequency four according to the measure of Passonneau &Litman (1993), is still rather low. Apparently there is more than one way to tile a text, asindicated by disagreement among judges and algorithms. Furthermore, in both versions ofthe algorithm, changes to the parameters of the algorithm perturb the resulting boundarymarkings. This is an undesirable property and perhaps could be remedied with some kindof information-theoretic formulation of the problem.9
These issues are not too damaging if the results are useful. Chapter 3 describes anew information access framework which uses the results of the block tiling algorithm todetermine whether terms in a query overlap in a passage. Although no attempt is madethere to show formally that the tiles perform better than randomly divided texts (sinceplatforms for evaluation of such information do not currently exist), informal interactionswith that system indicate that when tiling is correct the results of the system are betterthan when tiling is incorrect. This indirect evidence implies that the technique, despite thedisagreement in judgments among readers and the errors in the algorithm itself, is betterthan arbitrarily divided texts or paragraphs alone.
8I am grateful to Jan Pedersen for this observation.9This idea was suggested by Graeme Hirst and Andreas Stolcke.

37
Chapter 3
Term Distribution in Full-TextInformation Access
3.1 IntroductionAs mentioned in Chapter 1, most information retrieval methods are better suited to titles
and abstracts than full text documents. In this chapter, I argue that the advent of full-lengthtext should be accompanied by corresponding new approaches to information access. Mostimportantly, I emphasize that even more than short text, full text requires context: termcontext is important in computing retrieval rankings and in displaying retrieved passagesand documents.
Information access mechanisms should not be thought of as retrieval in isolation. Themechanisms for querying as well as display are intimately tied with the retrieval mechanism,whether the implementor recognizes this or not. Cutting et al. (1990:1) advocate a textaccess paradigm that “weaves together interface, presentation and search in a mutuallyreinforcing fashion”; this viewpoint is adopted here as well.
In Hearst & Plaunt (1993), we suggest that in the analysis of full-length texts a distinctionshould be made between main topics and subtopics, and we suggest that users be allowed tospecify a search for a subtopic with respect to some main topic. To see why this distinctionmight be useful, consider the following scenario: A user would like to find a discussionof funding for cold fusion research. There is a long text about cold fusion that has atwo-paragraph discussion of funding two-thirds of the way in. This discussion, because itis in the context of a document about cold fusion, does not mention the term cold fusionanywhere near the discussion of funding. A full-document retrieval will either assign lowrank to this document because funding-related terms are infrequent relative to the whole, orelse it will assign high rank to any articles about cold fusion. A retrieve against individualparagraphs or segments will either assign low rank to this document because it will see onlyfunding terms but no cold fusion terms in the relevant segment, or it will give high rank toany documents that have discussions of funding. Thus the distribution of terms with respect

CHAPTER 3. TERM DISTRIBUTION IN FULL-TEXT INFORMATION ACCESS 38
to one another can play a role in determining the potential relevance of a document to aquery.
In this chapter I emphasize the importance of relative term distribution informationin information access from full-text documents. The chapter first discusses the standardinformation retrieval ranking measures. It then suggests that because the makeup of longtexts is qualitatively different from that of abstracts and short texts, the standard approachesare not necessarily appropriate for long texts. Since a critical aspect of long text structure isthe pattern of term distribution, I enumerate the possible distribution relations that can holdbetween two sets of terms, and make predictions about the usefulness of each distributiontype.
I then point out that existing approaches to information access do not suggest a way touse this distributional information. Furthermore, standard ranking mechanisms are opaque;users do not know what role their query terms played in the ranking of the retrieveddocuments. This problem is exacerbated when retrieving against full-text documents, sinceit is less clear how the terms in the query relate to the contents of a long text than an abstract.
An analogous situation arises in the use of query languages: in both cases the situationcan be improved by making information visible and explicit to the largest extent possible(while avoiding complexity). A serious attitude toward considerations of clarity and con-ciseness leads to an information access paradigm in which the query specification and theresults of retrieval are integrated, and the relationships between the query and the retrieveddocuments are displayed clearly.
Toward these ends, I introduce a new display paradigm, called TileBars, which allowsthe user to simultaneously view the relative length of the retrieved documents, the relativefrequency of the query terms, and their distributional properties with respect to the documentand each other. I show TileBars to be a useful analytical tool for determining documentrelevance when applied to sample queries from the TREC collection (Harman 1993), and Isuggest using this tool to help explain why standard information retrieval measures succeedor fail for a given query.
I also discuss general issues in passage retrieval. No test collections exist for passageretrieval, and in general the issue has not been well-defined. Therefore, I suggest that theissues of relative distribution of terms and context from which the passage is extracted betaken into account in the development of a test collection for passage retrieval.
3.2 Background: Standard Retrieval TechniquesThe purpose of information retrieval is to develop techniques to provide effective access
to large collections of objects (containing primarily text) with the purpose of satisfying auser’s stated information need (Croft & Turtle 1992). The most common approaches forthis purpose are Boolean term retrieval and similarity search. I use the term “similaritysearch” as an umbrella term covering the vector space model (Salton 1988), probabilisticmodels (van Rijsbergen 1979), (Cooper et al. 1994), (Fuhr & Buckley 1993), and any
CHAPTER 3. TERM DISTRIBUTION IN FULL-TEXT INFORMATION ACCESS 39
other approach which attempts to find documents that are most similar to a query or toone another based on the terms they contain. In similarity search, the best overall matchesare not necessarily the ones in which the largest percentage of the query terms are found,however. For example, given a query with 30 terms in it, the vector space model permitsa document that contains only a few of the query terms to be ranked very highly if thesewords occur infrequently in the corpus as a whole but frequently in the document.
In the vector space model (Salton 1988), a query’s terms are weighted and placed into avector that is compared against vectors representing the documents of the collection. Theunderlying assumption is that documents’ content can be represented in a geometric spaceand the relative distance between their vectors represents their relative semantic distance.In probabilistic models (van Rijsbergen 1979), the goal is to rank the database of documentsin order of their probability of usefulness for satisfying the user’s stated information need.However, in practice these systems also represent queries and documents with weightedterms and try to predict the probability of relevance of a document to a query by combiningthe scores of the weighted terms.
In Boolean retrieval a query is stated in terms of disjunctions, conjunctions, and nega-tions among sets of documents that contain particular words and phrases. Documents areretrieved whose contents satisfy the conditions of the Boolean statement. The users canhave more control over what terms actually appear in the retrieved documents than they dowith similarity search. However, a drawback of Boolean retrieval is that in this frameworkno ranking order is specified. This problem is sometimes assuaged by applying rankingcriteria as used in similarity search to the results of the Boolean search (Fox & Koll 1988).
Most information retrieval similarity measures treat the terms in a document uniformlythroughout. That is, a term’s weight is the same no matter where it occurs in the text.1Many researchers assume this is a valid assumption when working with abstracts, since itis a fair approximation to say that the location of the term does not significantly effect itsimport. These comments apply as well to short news articles, another text type commonlystudied in information retrieval research.
Although there are other approaches, such as knowledge-based systems, e.g., McCuneet al. (1985),Fung et al. (1990), Mauldin (1991), DeJong (1982), which attempt to interpretthe text to some degree, and systems that attempt to answer questions, e.g., O’Connor (1980)and Kupiec (1993), the bulk of information retrieval research has focused on satisfying aquery that can be paraphrased as: “Find more documents like this one.” This a naturalway to phrase a query, and is perhaps one of the more accessible to formalization, but it iscertainly not the only useful question to allow a user to ask. In the next section I describewhy alternatives to the query “Find more documents like this one” should be consideredfor full-text information access, and outline an alternative viewpoint on how to retrieve anddisplay information from full-text documents.
1Small windows of adjacency information are sometimes used in Boolean systems, but not in probabilisticor vector-space models. The recent experiments of Keen (1991),Keen (1992) are an exception to this.
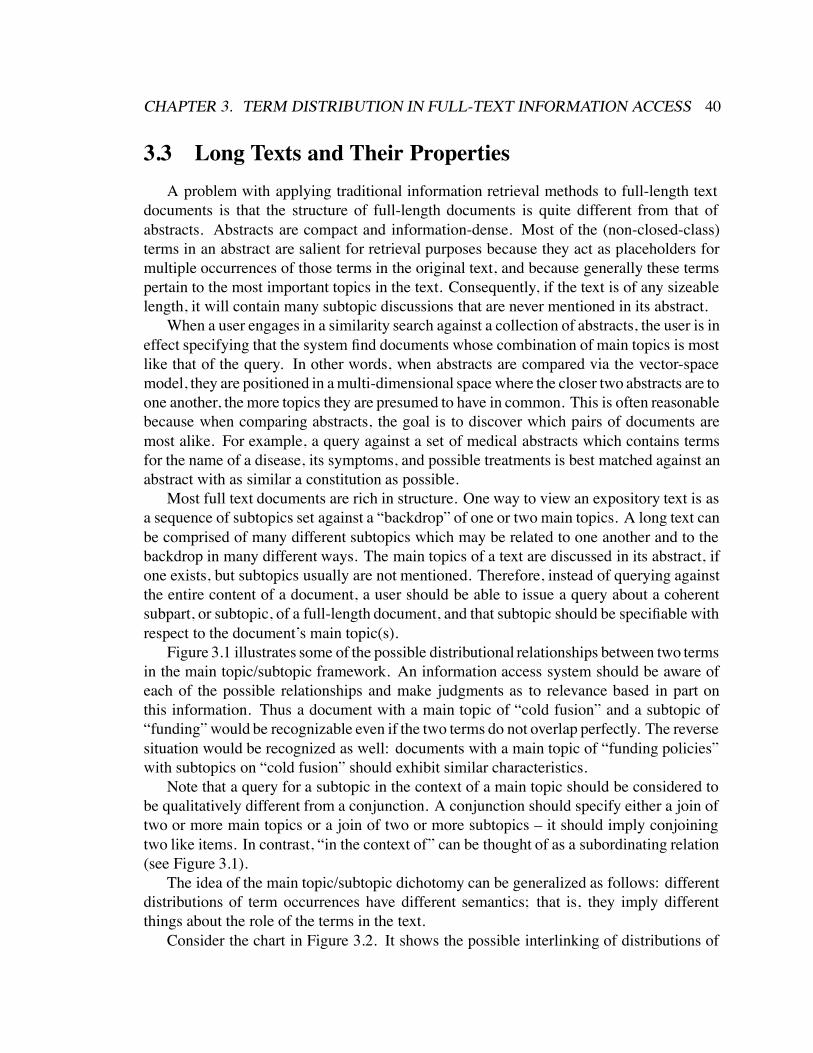
CHAPTER 3. TERM DISTRIBUTION IN FULL-TEXT INFORMATION ACCESS 40
3.3 Long Texts and Their PropertiesA problem with applying traditional information retrieval methods to full-length text
documents is that the structure of full-length documents is quite different from that ofabstracts. Abstracts are compact and information-dense. Most of the (non-closed-class)terms in an abstract are salient for retrieval purposes because they act as placeholders formultiple occurrences of those terms in the original text, and because generally these termspertain to the most important topics in the text. Consequently, if the text is of any sizeablelength, it will contain many subtopic discussions that are never mentioned in its abstract.
When a user engages in a similarity search against a collection of abstracts, the user is ineffect specifying that the system find documents whose combination of main topics is mostlike that of the query. In other words, when abstracts are compared via the vector-spacemodel, they are positioned in a multi-dimensional space where the closer two abstracts are toone another, the more topics they are presumed to have in common. This is often reasonablebecause when comparing abstracts, the goal is to discover which pairs of documents aremost alike. For example, a query against a set of medical abstracts which contains termsfor the name of a disease, its symptoms, and possible treatments is best matched against anabstract with as similar a constitution as possible.
Most full text documents are rich in structure. One way to view an expository text is asa sequence of subtopics set against a “backdrop” of one or two main topics. A long text canbe comprised of many different subtopics which may be related to one another and to thebackdrop in many different ways. The main topics of a text are discussed in its abstract, ifone exists, but subtopics usually are not mentioned. Therefore, instead of querying againstthe entire content of a document, a user should be able to issue a query about a coherentsubpart, or subtopic, of a full-length document, and that subtopic should be specifiable withrespect to the document’s main topic(s).
Figure 3.1 illustrates some of the possible distributional relationships between two termsin the main topic/subtopic framework. An information access system should be aware ofeach of the possible relationships and make judgments as to relevance based in part onthis information. Thus a document with a main topic of “cold fusion” and a subtopic of“funding” would be recognizable even if the two terms do not overlap perfectly. The reversesituation would be recognized as well: documents with a main topic of “funding policies”with subtopics on “cold fusion” should exhibit similar characteristics.
Note that a query for a subtopic in the context of a main topic should be considered tobe qualitatively different from a conjunction. A conjunction should specify either a join oftwo or more main topics or a join of two or more subtopics – it should imply conjoiningtwo like items. In contrast, “in the context of” can be thought of as a subordinating relation(see Figure 3.1).
The idea of the main topic/subtopic dichotomy can be generalized as follows: differentdistributions of term occurrences have different semantics; that is, they imply differentthings about the role of the terms in the text.
Consider the chart in Figure 3.2. It shows the possible interlinking of distributions of

CHAPTER 3. TERM DISTRIBUTION IN FULL-TEXT INFORMATION ACCESS 41
A BB
A BAA
B
(a) (b) (c) (d)
Figure 3.1: Possible relationships between two terms in a full text. (a) The distribution isdisjoint, (b) co-occurring locally, (c) term A is discussed globally throughout the text, B isonly discussed locally, (d) both A and B are discussed globally throughout the text.
two term sets, Term Set 1 and Term Set 2, where a term set is a set of terms that bearsome kind of semantic relationship to one another (e.g., election, poll, and vote or barney,dinosaur, and cloying). The term sets are considered to be symmetric; that is, neither oneis more important than the other, and so the lower triangle of the chart is omitted. Within adocument, each term set can be characterized as belonging to one of four possible frequencyranges: high, medium, low, and zero, and one of two distribution patterns: global and local.(Term sets with frequency zero are not considered in the chart.) The frequencies are meantto be relative to the length of the document, and the difference between high, medium, andlow should be thought of as graded.
For the purposes of interpreting term set distribution it is convenient to assume that thedocuments have been divided into TextTiles: adjacent, non-overlapping multi-paragraphunits of text that are assumed to correspond roughly to the subtopic structure of the text. Thedistinction between global and local distribution is also meant to be relative to documentlength. A term set with low frequency and local distribution occurs in one or two tiles; aterm set with medium frequency and local distribution occurs in perhaps two groupings oftwo tiles each, or one grouping of one to three tiles. On the other hand, a term set withmedium frequency and global distribution will have terms in roughly half the tiles.
With the aid of this chart we can form hypotheses about the role of interactions amongterm distribution and frequency and their relationship to document relevance (assuming thatif the terms in a term set occur with high frequency then they are globally distributed):
A Instances of both term sets occur with high frequency, or one term set is highlyfrequent and the other has medium frequency. The document describes both term setconcepts to a large extent; this would be useful for a user who wants a main topicdiscussion of both concepts simultaneously.
B Term set 2 is quite frequent, Term Set 1 infrequent and scattered; probably usefulonly if the user is primarily interested in Term Set 1.
C Term Set 2 is quite frequent, Term Set 1 infrequent but, as opposed to type B, is

CHAPTER 3. TERM DISTRIBUTION IN FULL-TEXT INFORMATION ACCESS 42
MediumGlobal
LowLocal
HighGlobal Local
MediumGlobalLow
HighGlobal
MediumGlobal
LocalMedium
GlobalLow
LowLocal
TERM SET 1
TERM SET 2
A A A B C
D E F G
H I
I
H
H
J
Figure 3.2: Frequency and distributional relationships between two term sets. See the textfor an explanation of the letter labels.

CHAPTER 3. TERM DISTRIBUTION IN FULL-TEXT INFORMATION ACCESS 43
locally organized. There is probably a brief but real discussion of Term Set 1 inrelation to Set 2, perhaps a subtopic to 2’s main topic. If the frequency is extremelylow (e.g, 1), then this is probably a passing reference.
D Both terms are of medium frequency but globally distributed. Most likely the samesituation as A, but somewhat less likely to be fully about both term sets.
E Both term sets have medium frequency; one is locally distributed and one globally. Ifthey have some tiles with significant overlap then the document is probably of interestif the user is interested in a main topic/subtopic-like distribution.
F Term Set 2 has medium frequency, Term Set 1 is infrequent, and both are scattered.The two might bear a relationship to one another but there is not enough evidence todecide either way. Less likely to be useful than in G.
G Term Set 2 has medium frequency, globally distributed, and Term Set 1 is infrequentbut localized. If the two overlap there is a good chance of a discussion involving bothterm sets but with only a brief reference to Term Set 1.
H Both term sets have medium or low frequency and are localized. If they overlap thenthis has some chance of being a good isolated discussion. If they do not overlap, thedocument should be discarded.
I Both term sets are infrequent, one localized, one not. This document should probablybe discarded.
J Both term sets are infrequent and globally distributed. This document should probablybe discarded.
Of course these observations should be generalized to more than two term sets, but formultiple term sets the implications of each combination are less clear.
Interestingly, Grimes (1975) had the prescience to suggest the value of localized infor-mation as determined by discourse structure. He wrote in 1975:
Now that information retrieval is taking on greater importance because of the prolif-eration of circulated information, linguistics may have something to contribute to itthrough discourse studies. In the first place, studies of discourse seem to show that theessential information in some discourses is localized, which implied that for retrievalit might be possible to specify parts of the discourse that do not have to be taken intoaccount. There is definitely a pattern of organization of information in any discoursethat can be recognized and should therefore be explored for its usefulness in retrieval;for example, Halliday’s notion of the distribution of given and new information.
Grimes’ suggestion of using the localized structure of discourse to eliminate certain passagesis a useful one, although different than that suggested here. Work along related lines doesappear in Liddy (1991), which discusses the usefulness of understanding the structure of anabstract when using a natural-language based information retrieval approach, and Liddy &Myaeng (1993), which uses information about the kind of sentence a term occurs in; e.g.,

CHAPTER 3. TERM DISTRIBUTION IN FULL-TEXT INFORMATION ACCESS 44
differentiating terms that occur in background sentences from those that occur in spokenquotations and those that are in lead sentences in order to better understand the relationsamong terms.
Given the analysis surrounding the chart of Figure 3.2, how can these observations aboutrelative term distribution be incorporated into an information access system? The followingsection discusses this issue, first touching on problems with existing approaches, and thensuggesting a new solution.
3.4 Distribution-Sensitive Information Access
3.4.1 The Problem with RankingNoreault et al. (1981) performed an experiment on bibliographic records in which
they tried every combination of 37 weighting formulas working in conjunction with 64combining formulas on Boolean queries. They found that the choice of scheme madealmost no difference: the best combinations got about 20% better than random ordering,and no one scheme stood out above the rest.
These results imply that small changes to weighting formulas don’t have much of aneffect. As found in other aspects of text analysis for information retrieval, (e.g., effectsof stemming, or morphological analysis, or using phrases instead of isolated terms), amodification of an algorithm improves the results in some situations and degrades theresults in others.
Why might this be the case? Perhaps the answer is that there is no single correct answer.Perhaps trying to assign numbers to the impoverished information that we have about thedocuments (or in this case of the experiment in Noreault et al. (1981), bibliographic records)is not an appropriate thing to do. It could be the case that when different kinds of informationare present in the texts the term ranking serves only to hide this information from the user.Rather than hiding what is going on behind a ranking strategy, I contend it is better to showthe users what has happened as a result of their query and allow the users to determinefor themselves what looks interesting or relevant. Of course, this is the intended goalof ranking. But an ordered list of titles and probabilities is under-informative. The linkbetween the query terms, the similarity comparison, and the contents of the texts in thedataset is too underspecified to assume that a single indicator of relevance can be assigned.
Instead, the representation of the results of the retrieval should present as many attributesof the texts and their relationship to the queries as possible, and present the information ina compact, coherent and accurate manner. Accurate in this case means a true reflection ofthe relationship between the query and the documents.
Consider for example what happens when one performs a keyword search using WAIS(Kahle & Medlar 1991). If the search completes, it results in a list of document titles andrelevance rankings. The rankings are based on the query terms in some capacity, but it isunclear what role the terms play or what the reasons behind the rankings are. The length

CHAPTER 3. TERM DISTRIBUTION IN FULL-TEXT INFORMATION ACCESS 45
of the document is indicated by a number, which although interpretable, is not easily readfrom the display. Figure 3.3 represents the results of a search on image and network on adatabase of conference announcements. The user cannot determine to what extent eitherterm is discussed in the document or what role the terms play with respect to one another.If the user prefers a dense discussion of images and would be happy with only a tangentalreference to networking, there is no way to express this preference.
Attempts to place this kind of expressiveness into keyword based system are usuallyflawed in that the users find it difficult to guess how to weight the terms. If the guess isoff by a little they may miss documents that might be relevant, especially because the rolethe weights play in the computation is far from transparent. Furthermore, the user may bewilling to look at documents that are not extremely focused on one term, so long as thereferences to the other terms are more than passing ones. Finally, the specification of suchinformation is complicated and time-consuming.
The concern in the information retrieval literature about how to rank the results ofBoolean and vector space-type queries is misplaced. Once there is a baseline of evidencefor choosing a subset of the thousands of available documents, then the issue becomes amatter of providing the user with information that is informative and compact enough to beable to be interpreted swiftly. As discussed in the previous section, there are many differentways a long text can be “similar” to the query that issued it, and so we need to supply theuser with a way to understand the relationship between the retrieved documents and thequery.
3.4.2 Analogy to Problems with Query SpecificationThere have been many studies showing that users have difficulty with Boolean logic
queries and many attempts at making the query formulation process easier. Research papersdiscuss at great length the relative benefits of one query language over another. However,this issue is circumvented to some extent if instead a system provides the user with anintuitive, direct-manipulation interface (Shneiderman 1987).
A good example of this is the difference between the keyword-based interface to largeonline bibliographic systems. The user has to remember the correct keywords to use fromsystem to system, and must remember where to place AND and OR connectives. Forexample, with MELVYL, the online bibliographic system for the University of California(Lynch 1992), to look for a book by de Tocqueville containing the word Democracy, onemust enter
fi pa tocqueville and tw democracy
where pa indicates “personal author” and tw indicates “title words”. However, to find a titlewith both words democracy and america one need enter only one copy of the keyword tw:
fi tw democracy america
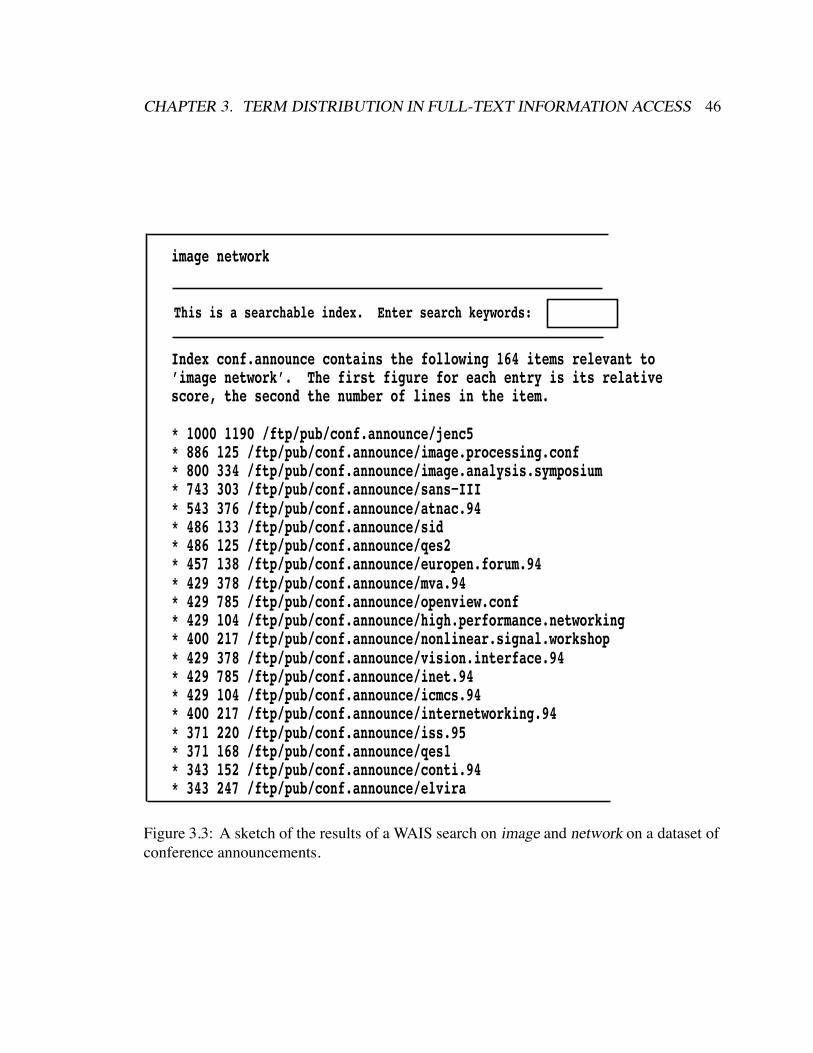
CHAPTER 3. TERM DISTRIBUTION IN FULL-TEXT INFORMATION ACCESS 46
Index conf.announce contains the following 164 items relevant to’image network’. The first figure for each entry is its relativescore, the second the number of lines in the item.
image network
* 1000 1190 /ftp/pub/conf.announce/jenc5* 886 125 /ftp/pub/conf.announce/image.processing.conf* 800 334 /ftp/pub/conf.announce/image.analysis.symposium* 743 303 /ftp/pub/conf.announce/sans−III
This is a searchable index. Enter search keywords:
* 543 376 /ftp/pub/conf.announce/atnac.94* 486 133 /ftp/pub/conf.announce/sid* 486 125 /ftp/pub/conf.announce/qes2* 457 138 /ftp/pub/conf.announce/europen.forum.94* 429 378 /ftp/pub/conf.announce/mva.94* 429 785 /ftp/pub/conf.announce/openview.conf* 429 104 /ftp/pub/conf.announce/high.performance.networking* 400 217 /ftp/pub/conf.announce/nonlinear.signal.workshop* 429 378 /ftp/pub/conf.announce/vision.interface.94* 429 785 /ftp/pub/conf.announce/inet.94* 429 104 /ftp/pub/conf.announce/icmcs.94* 400 217 /ftp/pub/conf.announce/internetworking.94* 371 220 /ftp/pub/conf.announce/iss.95* 371 168 /ftp/pub/conf.announce/qes1* 343 152 /ftp/pub/conf.announce/conti.94* 343 247 /ftp/pub/conf.announce/elvira
Figure 3.3: A sketch of the results of a WAIS search on image and network on a dataset ofconference announcements.

CHAPTER 3. TERM DISTRIBUTION IN FULL-TEXT INFORMATION ACCESS 47
(although it is legal to enter “fi tw democracy and tw america” this results in a much longersearch due to the indexing structure underlying the system (Farley 1989)). However, to finda book by two authors, two copies of the keyword pa (and the AND connective) must beused, as demonstrated by the error below:
CAT-> find pa mosteller wallace
Search request: FIND PA MOSTELLER WALLACESearch result: 0 records at all libraries
Please type HELP
CAT-> find pa mosteller and pa wallace
Search request: FIND PA MOSTELLER AND PA WALLACESearch result: 2 records at all libraries
Type D to display results, or type HELP.
GLADIS is the other major bibliographic system available at UC Berkeley, indexingmainly the local collection and providing timely information such as check-out status.Unfortunately, its keyword list is slightly different and the interface is unforgiving withrespect to this:
===> find pa tocqueville**> THE SEARCH CODE WAS NOT RECOGNIZED**> Type a search code listed above**>===> find pn tocqueville
Your search for the Personal Name: TOCQUEVILLEretrieved 41 name entries.
Another problem with these systems is that although they have some very powerfulspecial purpose search capabilities (such as the capability to look for PhD dissertationsspecifically, in the case of MELVYL) users are unaware of the options because they requireknowledge of special keywords.
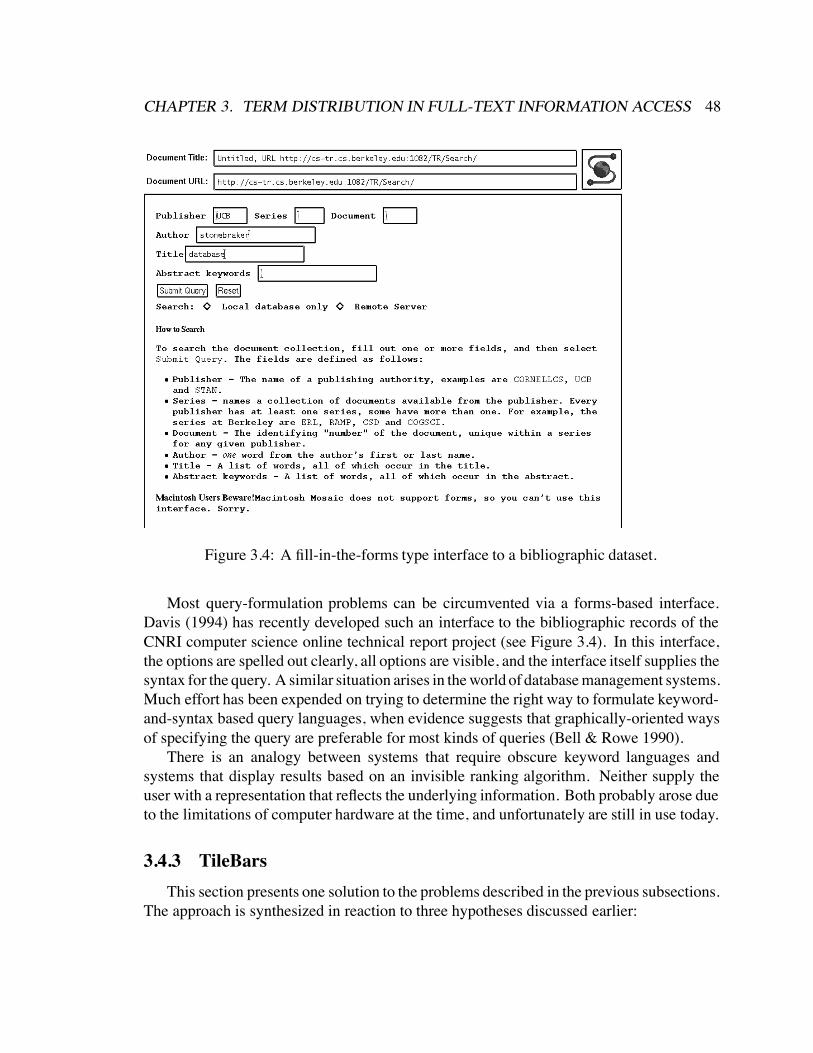
CHAPTER 3. TERM DISTRIBUTION IN FULL-TEXT INFORMATION ACCESS 48
Figure 3.4: A fill-in-the-forms type interface to a bibliographic dataset.
Most query-formulation problems can be circumvented via a forms-based interface.Davis (1994) has recently developed such an interface to the bibliographic records of theCNRI computer science online technical report project (see Figure 3.4). In this interface,the options are spelled out clearly, all options are visible, and the interface itself supplies thesyntax for the query. A similar situation arises in the world of database management systems.Much effort has been expended on trying to determine the right way to formulate keyword-and-syntax based query languages, when evidence suggests that graphically-oriented waysof specifying the query are preferable for most kinds of queries (Bell & Rowe 1990).
There is an analogy between systems that require obscure keyword languages andsystems that display results based on an invisible ranking algorithm. Neither supply theuser with a representation that reflects the underlying information. Both probably arose dueto the limitations of computer hardware at the time, and unfortunately are still in use today.
3.4.3 TileBarsThis section presents one solution to the problems described in the previous subsections.
The approach is synthesized in reaction to three hypotheses discussed earlier:

CHAPTER 3. TERM DISTRIBUTION IN FULL-TEXT INFORMATION ACCESS 49
Long texts differ from abstracts and short texts in that, along with term frequency,term distribution information is important for determining relevance.
The relationship between the retrieved documents and the terms of the query shouldbe presented to the user in a compact, coherent, and accurate manner (as opposed tothe single-point of information provided by a ranking).
Passage-based retrieval should be set up to provide the user with the context in whichthe passage was retrieved, both within the document, and with respect to the query(this issue is discussed in more detail in Section 3.5).
Figure 3.5 shows an example of a new representational paradigm, called TileBars, whichprovides a compact and informative iconic representation of the documents’ contents withrespect to the query terms. TileBars allow users to make informed decisions about notonly which documents to view, but also which passages of those documents, based on thedistributional behavior of the query terms in the documents. The goal is to simultaneouslyindicate the relative length of the document, the relative frequency of the term sets inthe document, their distribution with respect to the document, and their distribution withrespect to each other. Each large rectangle indicates a document, and each square withinthe document represents a TextTile. The darker the tile, the more frequent the term (whiteindicates 0, black indicates 9 or more instances, the frequencies of all the terms withina term set are added together). Since the bars for each set of query terms are lined upone next to the other, this produces a representation that simultaneously and compactlyindicates relative document length, query term frequency, and query term distribution. Therepresentation exploits the natural pattern-recognition capabilities of the human perceptualsystem (Mackinlay 1986); the patterns in a column of TileBars can be quickly scanned anddeciphered. I hypothesize that the interpretation of the patterns should be along the linesoutlined in Section 3.3. Some case studies appear in Section 3.4.4 below.
Term overlap and term distribution are easy to compute and can be displayed in amanner in which both attributes together create easily recognized patterns. For example,overall darkness indicates a text in which both term sets are discussed in detail. When bothterm sets are discussed simultaneously, their corresponding tiles blend together to cause aprominent block to appear. Scattered discussions have lightly colored tiles and large areasof white space. Note that the patterns that can be seen here bear some resemblence to Figure2.4 in Chapter 2, in which term distributions for a text are displayed.
TileBars make use of the following visualization properties (extracted from Senay &Ignatius (1990)):
A variation in position, size, value [gray scale saturation], or texture is ordered[ordinal] that is, it imposes an order which is universal and immediately perceptible.(Bertin 1983)
A variation in position, size, value [gray scale saturation], texture or color is selective,that is, it enables us to isolate all marks belonging to the same category. (Bertin 1983)

CHAPTER 3. TERM DISTRIBUTION IN FULL-TEXT INFORMATION ACCESS 50
Figure 3.5: The TileBar display paradigm. Rectangles correspond to documents, squarescorrespond to TextTiles, the darkness of a square indicates the frequency of terms in thecorresponding Term Set. Titles and the initial words of a document appear next to itsTileBar. Term Set 1 consists of law, legal, attorney, lawsuit and Term Set 2 consists ofnetwork and lan.
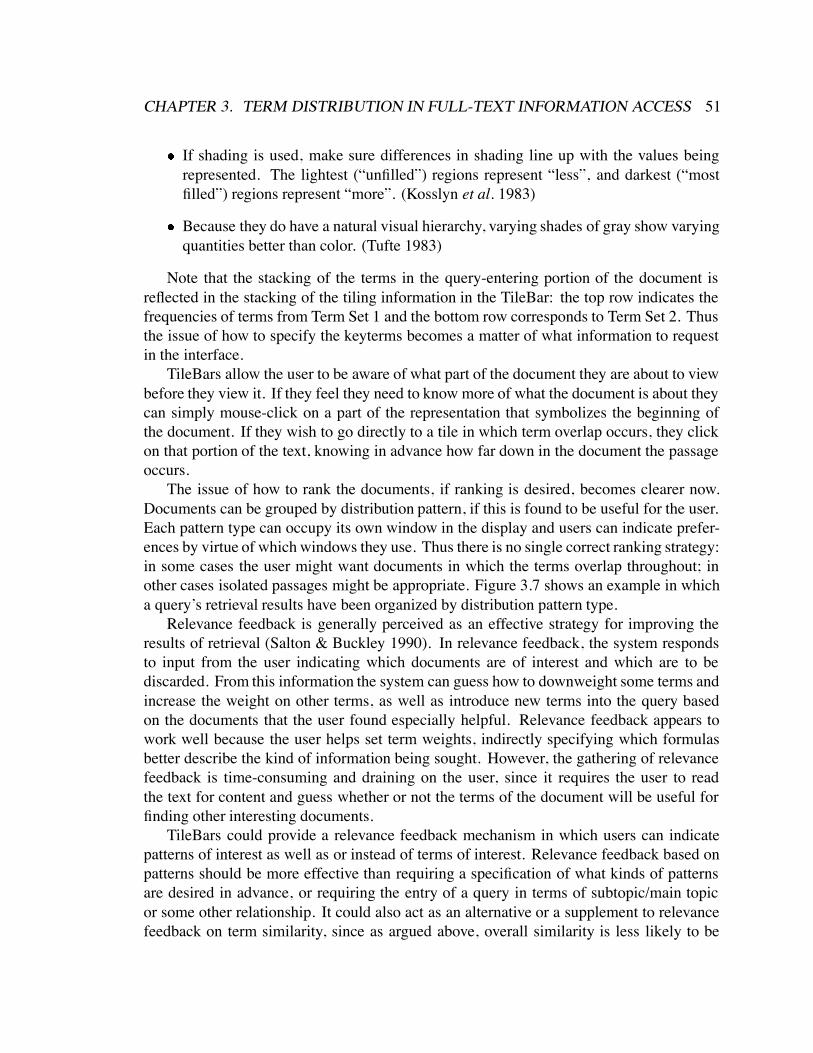
CHAPTER 3. TERM DISTRIBUTION IN FULL-TEXT INFORMATION ACCESS 51
If shading is used, make sure differences in shading line up with the values beingrepresented. The lightest (“unfilled”) regions represent “less”, and darkest (“mostfilled”) regions represent “more”. (Kosslyn et al. 1983)
Because they do have a natural visual hierarchy, varying shades of gray show varyingquantities better than color. (Tufte 1983)
Note that the stacking of the terms in the query-entering portion of the document isreflected in the stacking of the tiling information in the TileBar: the top row indicates thefrequencies of terms from Term Set 1 and the bottom row corresponds to Term Set 2. Thusthe issue of how to specify the keyterms becomes a matter of what information to requestin the interface.
TileBars allow the user to be aware of what part of the document they are about to viewbefore they view it. If they feel they need to know more of what the document is about theycan simply mouse-click on a part of the representation that symbolizes the beginning ofthe document. If they wish to go directly to a tile in which term overlap occurs, they clickon that portion of the text, knowing in advance how far down in the document the passageoccurs.
The issue of how to rank the documents, if ranking is desired, becomes clearer now.Documents can be grouped by distribution pattern, if this is found to be useful for the user.Each pattern type can occupy its own window in the display and users can indicate prefer-ences by virtue of which windows they use. Thus there is no single correct ranking strategy:in some cases the user might want documents in which the terms overlap throughout; inother cases isolated passages might be appropriate. Figure 3.7 shows an example in whicha query’s retrieval results have been organized by distribution pattern type.
Relevance feedback is generally perceived as an effective strategy for improving theresults of retrieval (Salton & Buckley 1990). In relevance feedback, the system respondsto input from the user indicating which documents are of interest and which are to bediscarded. From this information the system can guess how to downweight some terms andincrease the weight on other terms, as well as introduce new terms into the query basedon the documents that the user found especially helpful. Relevance feedback appears towork well because the user helps set term weights, indirectly specifying which formulasbetter describe the kind of information being sought. However, the gathering of relevancefeedback is time-consuming and draining on the user, since it requires the user to readthe text for content and guess whether or not the terms of the document will be useful forfinding other interesting documents.
TileBars could provide a relevance feedback mechanism in which users can indicatepatterns of interest as well as or instead of terms of interest. Relevance feedback based onpatterns should be more effective than requiring a specification of what kinds of patternsare desired in advance, or requiring the entry of a query in terms of subtopic/main topicor some other relationship. It could also act as an alternative or a supplement to relevancefeedback on term similarity, since as argued above, overall similarity is less likely to be

CHAPTER 3. TERM DISTRIBUTION IN FULL-TEXT INFORMATION ACCESS 52
useful for long texts, with their varied internal structure, than abstracts. However, this ideahas not yet been implemented.
TileBars display context corresponding directly to the users’ query; specifically to theterms used in a free-text search. Sometimes, however, the user is unsure of what kind ofqueries to make and needs to get familiar with new textbases rapidly. Chapter 5 describesthe use of main topic information to help provide context in this situation.
Implementation Notes
The current implementation of the information access method underlying the TileBardisplay makes use of 3800 texts of length 100-500 lines from the ZIFF portion of theTIPSTER corpus and 250 texts of the same length from the AP portion of TIPSTER,for a total of about 57Mbytes (Harman 1993). (ZIFF is comprised mainly of commercialcomputer news and AP is world news from the late 1980s.) The interface was writtenusing the Tcl/TK X11-based toolkit (Ousterhout 1991). The search engine makes use ofcustomized inverted index code created especially for this task2; each term is indexed bydocument and tile number, and the associated frequencies. In the future this may be replacedwith the POSTGRES database management system, which has support for large objectsand user-defined types (Stonebraker & Kemnitz 1991). An alternative indexing stratum isthat of GLIMPSE (Manber & Wu 1994) (built on agrep Wu & Manber (1992)) which storesa small index (about 2-4% of the size of the text collection) but has an acceptable speed formany tasks.
The informativeness of the TileBar representation is hindered when the results of tilingare inaccurate. The ZIFF database contains many documents comprised of lists of concate-nated short news articles, and some documents comprised of single-line calendar items.The tiling algorithm is set up so that a single line segment is too fine a division; therefore,documents like the calendar text will have erroneous tilings (although arbitrary groupingson terms like these are perhaps preferable to assigning each sentence its own tile, due to ef-ficiency considerations). The algorithm does do fairly well at distinguishing slightly longerconcatenated articles, such as sequences of paragraph-long news summaries and letters tothe editor. It is also quite good at recognizing the boundaries of summarizing informationat the beginning of articles when such information appears.
3.4.4 Case StudiesThis section examines the properies of TileBars in more detail, using two example
queries on the ZIFF corpus.2I am grateful to Marc Teitelbaum for the swift implementation of this code.

CHAPTER 3. TERM DISTRIBUTION IN FULL-TEXT INFORMATION ACCESS 53
Networks and the Law
Figure 3.5 shows some of the TileBars produced for the query on the term sets law legalattorney lawsuit and network lan. In this portion of the ZIFF collection, the terms of interesthave the following averages of occurrence, in the documents in which they appear at leastonce:
¯legal 2.4 3.6law 2.8 4.2attorney 1.5 1.0lawsuit 2.3 3.5network 10.7 5.2lan 6.8 10.2
What kind of documents can we expect to find in response to this query? Use ofcomputer networks by law firms, lawsuits involving illegal use of networks, and patentbattles among network vendors are all possibilities that come to mind. We know that sincewe are searching in a collection of commercial computer documents, most instances ofthe word network will refer to the computer network sense, with exceptions for telephonesystems, neural networks, and perhaps some references to the construct used in theoreticalanalyses. Since legal is an adjective, it can be used as a modifier in a variety of situations,but together with the other terms in its set, a large showing of these terms should indicate alegitimate instance of a discussion in the legal frame. These two term sets were specificallychosen because their meanings are usually in quite separate semantic frames; the nextexample will discuss a query involving terms that are more related in meaning.
In Figure 3.5, the results have not been sorted in any manner other than document IDnumber. It is instructive to examine what the bars indicate about the content of the texts andcompare that against the hypothesis of Section 3.3 and against what actually is discussed inthe texts. Document 1433 jumps out because it appears to discuss both term sets in somedetail (type A from the chart). Documents 1300 and 1471 are also prominent because of astrong showing of the network term set (type C). Document 1758 also has well-distributedinstances of both term sets, although with less frequency than in document 1433 (type H).Legal terms have a strong distributional showing in 1640, 1766, 1781 as well (types C andG). We also note a large number of documents with very few occurrences of either term,although in some cases terms are more locally concentrated than in others. Document 1298is interesting in that it seems to have an isolated but intense discussion of both term sets(type H); the fact that neither term set continues on into the rest of the document implies thatthis discussion is isolated from the rest in meaning as well. Most of the other documentslook uninteresting due to their lack of overlap or infrequency of term occurrences.
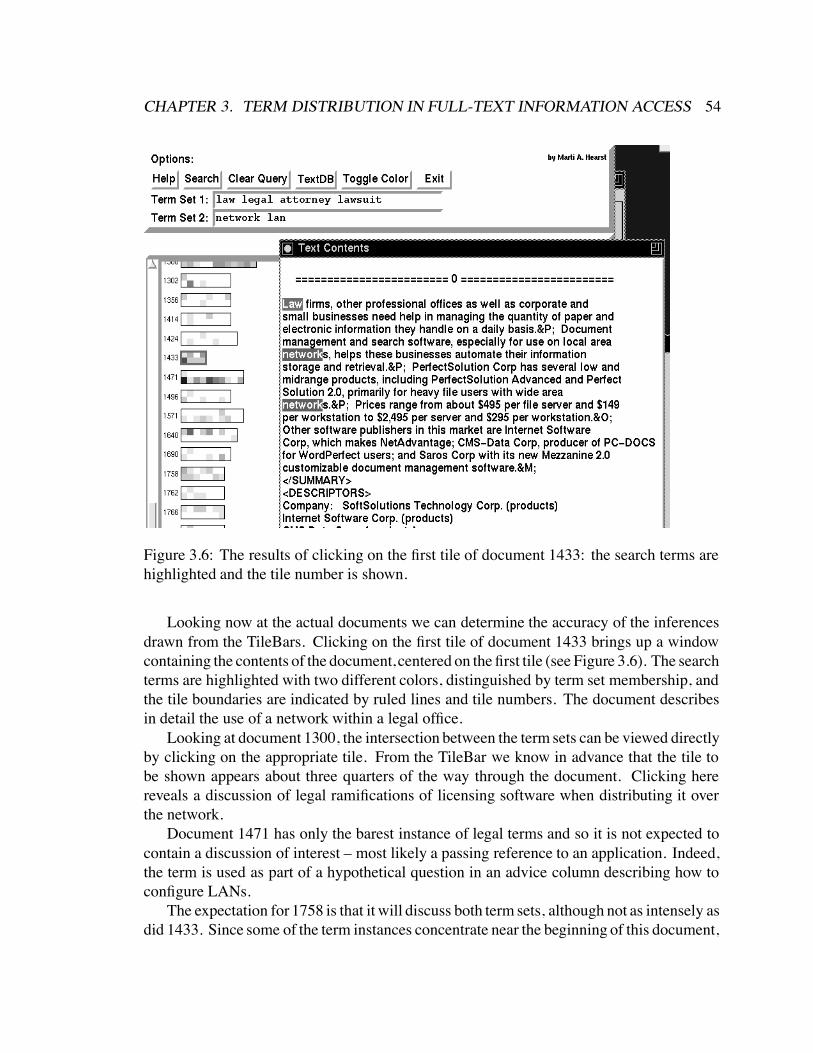
CHAPTER 3. TERM DISTRIBUTION IN FULL-TEXT INFORMATION ACCESS 54
Figure 3.6: The results of clicking on the first tile of document 1433: the search terms arehighlighted and the tile number is shown.
Looking now at the actual documents we can determine the accuracy of the inferencesdrawn from the TileBars. Clicking on the first tile of document 1433 brings up a windowcontaining the contents of the document, centered on thefirst tile (see Figure 3.6). The searchterms are highlighted with two different colors, distinguished by term set membership, andthe tile boundaries are indicated by ruled lines and tile numbers. The document describesin detail the use of a network within a legal office.
Looking at document 1300, the intersection between the term sets can be viewed directlyby clicking on the appropriate tile. From the TileBar we know in advance that the tile tobe shown appears about three quarters of the way through the document. Clicking herereveals a discussion of legal ramifications of licensing software when distributing it overthe network.
Document 1471 has only the barest instance of legal terms and so it is not expected tocontain a discussion of interest – most likely a passing reference to an application. Indeed,the term is used as part of a hypothetical question in an advice column describing how toconfigure LANs.
The expectation for 1758 is that it will discuss both term sets, although not as intensely asdid 1433. Since some of the term instances concentrate near the beginning of this document,

CHAPTER 3. TERM DISTRIBUTION IN FULL-TEXT INFORMATION ACCESS 55
selecting this viewing point seems sensible, yielding a discussion of a documentationmanagement system on a networked PC system in a legal office.
The remaining documents with strong distributions of legal terms – IDs 1640,1766, 1781– discuss a lawsuit between software providers, computer crime, and another discussionof a law firm using a new networked software system, respectively. Appropriately, onlythe latter has overlap with networking terms, since the other two documents do not discussnetworking in the legal context. Interestingly, the solitary mention of networking at theend of 1766 lists it as a computer crime problem to be worried about in the near future.This is an example of the suggestive nature of the positional information inherent in therepresentation.
Finally, looking at the seemingly isolated discussion of document 1298 we see a letter-to-the-editor about the lack of liability and property law in the area of computer networking.This letter is one of several letters-to-the-editor; hence its isolated nature. This is an exampleof a perhaps useful instance of isolated, but strongly overlapping, term occurrences. In thisexample, one might wonder why one legal term continues on into the next tile. This is acase in which the tiling algorithm is slightly off in the boundary determination.
As mentioned above, the remaining documents appear uninteresting since there is littleoverlap among the terms and within each tile the terms occur only once or twice. We canconfirm this suspicion with a couple of examples. Document 1270 (type F/G) has oneinstance of a legal term; it is a passing reference to the former profession of an interviewsubject. Document 1356 (type I/H) discusses a court’s legal decision about intellectualproperty rights on information. Tile 3 provides a list of ways to protect confidentialinformation, one item of which is to avoid storing confidential information on a LAN. Soin this case the reference is relevant if not compelling.
Figure 3.7 shows the results of the same query when placed in an interface that sortsthe terms according to their frequency and patterns of distribution. The upper lefthandwindow displays the documents in which both term sets occur in at least 40% of the tiles.The upper righthand window shows those documents in which at least 40% of the tileshave occurrences of terms from Term Set 1, but occurrences from Term Set 2 are lesswell-distributed. The lower lefthand window shows the symmetric case, and the lowerrighthand window displays the documents in which neither term occurs in more than 40%of the tiles. Within each window the documents are sorted by overall query term frequency.Experiments need to be run to evaluate the effectiveness of variations in pattern criteria.
CD-ROMs and Games
Section 3.3 hypothesized about the role of medium frequency terms. This exampleexamines how term distribution can make a difference in whether or not two term sets standin a modificational relationship. In response to a query on cd-rom and game, 49 documentswere retrieved. Figure 3.8 shows a clip of some of the documents’ TileBars.
Viewed by frequency alone, documents 2238 and 2003 seem equally viable (or notviable):

CHAPTER 3. TERM DISTRIBUTION IN FULL-TEXT INFORMATION ACCESS 56
Figure 3.7: The results of sorting TileBars according to the frequency and distribution ofthe query terms. As before, Term Set 1 consists of law, legal, attorney, and lawsuit andTerm Set 2 consists of network and lan.
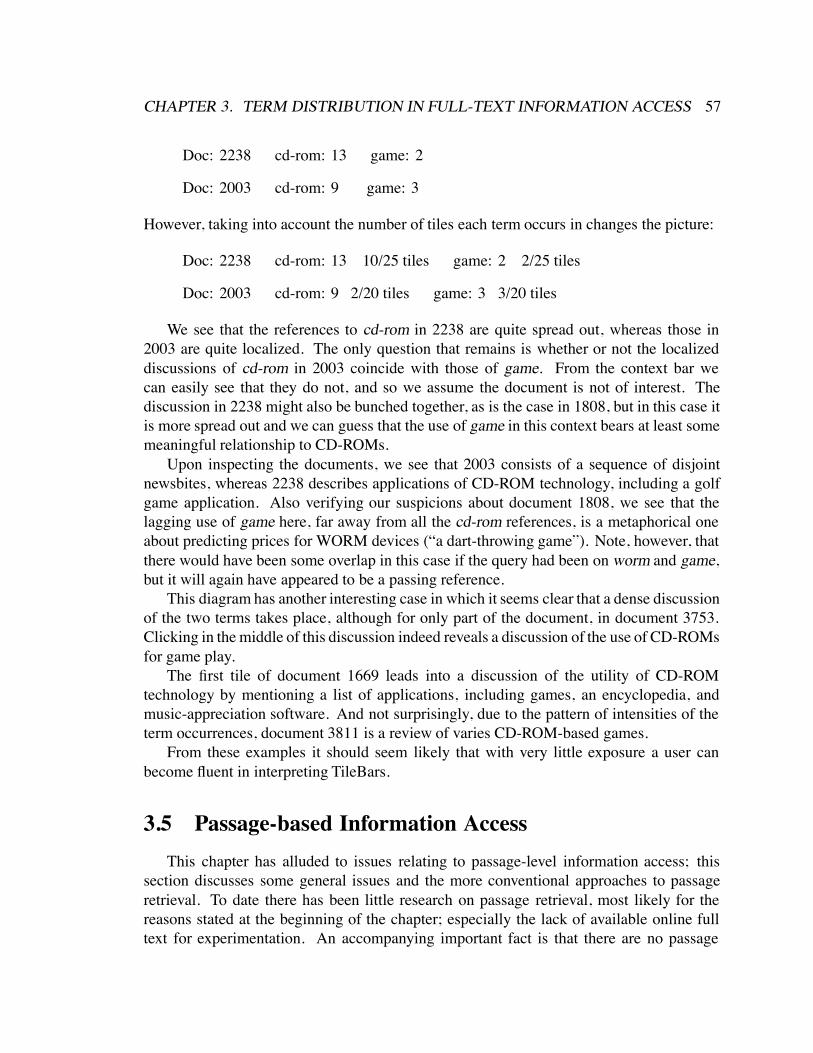
CHAPTER 3. TERM DISTRIBUTION IN FULL-TEXT INFORMATION ACCESS 57
Doc: 2238 cd-rom: 13 game: 2
Doc: 2003 cd-rom: 9 game: 3
However, taking into account the number of tiles each term occurs in changes the picture:
Doc: 2238 cd-rom: 13 10/25 tiles game: 2 2/25 tiles
Doc: 2003 cd-rom: 9 2/20 tiles game: 3 3/20 tiles
We see that the references to cd-rom in 2238 are quite spread out, whereas those in2003 are quite localized. The only question that remains is whether or not the localizeddiscussions of cd-rom in 2003 coincide with those of game. From the context bar wecan easily see that they do not, and so we assume the document is not of interest. Thediscussion in 2238 might also be bunched together, as is the case in 1808, but in this case itis more spread out and we can guess that the use of game in this context bears at least somemeaningful relationship to CD-ROMs.
Upon inspecting the documents, we see that 2003 consists of a sequence of disjointnewsbites, whereas 2238 describes applications of CD-ROM technology, including a golfgame application. Also verifying our suspicions about document 1808, we see that thelagging use of game here, far away from all the cd-rom references, is a metaphorical oneabout predicting prices for WORM devices (“a dart-throwing game”). Note, however, thatthere would have been some overlap in this case if the query had been on worm and game,but it will again have appeared to be a passing reference.
This diagram has another interesting case in which it seems clear that a dense discussionof the two terms takes place, although for only part of the document, in document 3753.Clicking in the middle of this discussion indeed reveals a discussion of the use of CD-ROMsfor game play.
The first tile of document 1669 leads into a discussion of the utility of CD-ROMtechnology by mentioning a list of applications, including games, an encyclopedia, andmusic-appreciation software. And not surprisingly, due to the pattern of intensities of theterm occurrences, document 3811 is a review of varies CD-ROM-based games.
From these examples it should seem likely that with very little exposure a user canbecome fluent in interpreting TileBars.
3.5 Passage-based Information AccessThis chapter has alluded to issues relating to passage-level information access; this
section discusses some general issues and the more conventional approaches to passageretrieval. To date there has been little research on passage retrieval, most likely for thereasons stated at the beginning of the chapter; especially the lack of available online fulltext for experimentation. An accompanying important fact is that there are no passage

CHAPTER 3. TERM DISTRIBUTION IN FULL-TEXT INFORMATION ACCESS 58
1586 CD-ROM takes on dial-up data O
1655 Multimedia and the network O
1669 Free and easy CD-ROM applications column
1712 Byting Barker report from Europe Commodore Total Dynamic Vis
1797 The compact disc myth a lousy paradigm for the computer indu
1808 Multifunction optical disks to drive market Tech Trends
1978 Life before the chips simulating Digital Video Interactive t
2003 Newsbytes Index week of Aug 1 1989 highlights
2051 Thoughts and observations at the Microsoft CD-ROM Conference
2130 Newsbytes Index illustration
2156 Home is where the interaction is compact disk-interactive in
2238 The road to respect digital video interactive Video Special
2497 Newsbytes index highlights M
2730 Release 1 0 calendar April 1989-March 1990 M
2761 Multimedia about interface Macintosh graphical user interfac
2774 Getting the facts strategies for using the PC’s power to hel
3349 CD-ROMs the BMUG PD ROM Educorp CD ROM ClubMac Software Revi
3753 Innovation busting out all over Japan Report M
3811 Stephen Manes column
Figure 3.8: Some TileBars found in response to a query in which Term Set 1 is cd-rom andTerm Set 2 is game.

CHAPTER 3. TERM DISTRIBUTION IN FULL-TEXT INFORMATION ACCESS 59
retrieval test sets; that is, no test sets in which portions of long texts have been identifiedas relevant for a query set. The closest available is the recent TIPSTER/TREC collectionand relevance judgments (Harman 1993), but although this collection includes some longdocuments, it does not include relevance judgments for passages alone.
Several questions need to be addressed in the study of passage retrieval, related to thediscussions of the previous sections. For example, given a retrieved passage, where in thetext did the passage come from: the beginning, middle, end of the document? How area passage’s neighbors in a document related to it? Was the passage chosen because of itscontribution in isolation to the relevance of the document or is it just a representative part,and if so, representative in what way? If chosen for a Boolean query, how much and inwhat context does each term of the query contribute? There is a need for a test collectionfor passage retrieval that is sensitive to these kinds of distinctions.
Researchers working with hypertext have explored issues pertaining to organizing in-formation within one or a few long documents, but have not focused on issues related topresenting isolated pieces of texts drawn from a large collection of texts. Fuller et al. (1993),in discussing strategies for hypertext, make the important suggestion of providing contextfor the text nodes that are retrieved as a result of a query, rather than just presenting a list ofrelevant nodes. They contrast the approach in standard information retrieval, in which thestructure is not accessible to the similarity engine or viewable by the users, with hypertextsystems that do not provide good search capabilities or sophisticated storage systems. Theydo not supply viable solutions to the problem, however.
3.5.1 An Analysis of two TREC Topic DescriptionsAs mentioned above, the relevance judges for TREC were not concerned with distin-
guishing retrieval of passages versus retrieval of documents overall. Bearing in mind thatonly a small percentage of the TREC documents are long, this is not surprising. But the factthat relevance judgments do not refer to particular parts of long documents is problematicfor the purposes of training and evaluating passage retrieval algorithms. Another problemwith the collection is that the documents have not been ranked according to their relativerelevance, so there is no way to know what variations in ranking are to be preferred for aquery that has many positive relevance assignments.
It is an illuminating exercise to convert TREC topic descriptions to representationsapplicable to TileBars. Some of the topic descriptions, although long and detailed, can beaddressed by simply finding the documents with a few key terms. For example, all and onlythe documents in the ZIFF subset that contain the word superconductivity are relevant toTopic 021. Many of the topic descriptions require a particular product or company name tobe identified, or a company name in conjunction with some other specifically named item.Relevant documents for this kind of topic description often have all the key terms in a singlesentence. In these cases only very local parts of a long text need to match in order to satisfythe query. In other cases, topic descriptions require the topics to be discussed throughoutthe document.

CHAPTER 3. TERM DISTRIBUTION IN FULL-TEXT INFORMATION ACCESS 60
Still other topic descriptions require the mention of a company name or a country orsome other proper noun in conjunction with a general topic, e.g., companies working onmultimedia systems. This is most likely meant to simulate a filtering or message-stuffingtask, as in the MUC competitions (Sundheim 1990). It also requires recognition of country,company, and other proper names. This is a case where distributional information willplay a role in some cases, but again often the relevant terms need be found only locally.Still other topics include a context or environment in which a topic is to be discussed hasbeen specified. This kind of topic might benefit from an understanding of term distributioninformation.
Below I show two examples of TREC queries, their tranformations into TileBar represen-tations, and the different characteristics that can be discerned about the relevant documentsusing this representation.
Consider the following TREC topic description:
Topic 005 <dom> Domain: International Economics<title> Topic: Dumping Charges
<desc> Description:The U.S. or the EC charges Japan with dumping a product on any market and/or takesaction against Japan for proven or suspected dumping.
<narr> Narrative:To be relevant, a document must discuss current charges made by the U.S. or the ECagainst Japan for dumping a product on the U.S., EC, or any third-country market,and/or action(s) taken by the U.S. or the EC against Japan for proven or suspecteddumping. The product must be identified.
<con> Concept(s):1. dumping2. duties, tariffs, anti-dumping measures, punitive trade sanctions, protective penalties3. below market, unfair, predatory pricing4. Commerce Department, International Trade Commission (ITC), European Com-munity (EC), Common Market
5. ruling, charges, investigation
Figure 3.9 shows the results of searching on dump dumping anti-dumping and japanjapanese in the subset of ZIFF used. The relevance judgments assigned by the TREC judgesstate that of the visible documents, the following ones are relevant: 1700, 1765, 2184, and3670. For example, from Document 2184 (ZF07-376-802), which is judged relevant, comesthe following passage:

CHAPTER 3. TERM DISTRIBUTION IN FULL-TEXT INFORMATION ACCESS 61
150 OCR software moves into the mainstream optical character rec
720 Minigrams M
744 The European Community and information technology effect of
942 Minigrams M
946 Minigrams M
957 Minigrams M
1022 Minigrams M
1700 Life after dumping key system market
1765 Japan’s view of EC 92 1992 single European market transcript
1785 Sony acquiring Grass Valley Commerce no to Corning amp Japan
1819 Minigrams M
2003 Newsbytes Index week of Aug 1 1989 highlights
2184 Minigrams M
2413 Minigrams M
2596 Minigrams M
2652 Minigrams M
2859 Minigrams M
3557 Minigrams M
3670 Minigrams M
3697 Tokyograms M
3709 Minigrams M
3738 Minigrams M
Total: 22
Figure 3.9: TileBars found in response to a simplified version of TREC topic description005. Term Set 1 = dump dumping anti-dumping and Term Set 2 = japan japanese.

CHAPTER 3. TERM DISTRIBUTION IN FULL-TEXT INFORMATION ACCESS 62
[ ... ]
One of the more worrying prospects for 1989 is for a big surge of protectionism,and in the US, AT&T Co has asked the International Trade Commission to look intoalleged dumping by manufacturers in Japan, South Korea and Taiwan of small PABXsand key systems: AT&T claims that US firms have been severely injured by thepractices of more than a dozen Far East manufacturers marketing systems at unfairprices under more than 17 brand names; the companies named in the complaint areToshiba, Matsushita, Hasegawa, Iwatsu, Meisei, Makayo, Nitsuko and Tamura, all ofJapan; Goldstar, Samsung and OPC of South Korea, and Sun Moon Star of Taiwan;AT&T says the practices have enabled the companies to raise their share of the marketto 60% from 40% since 1985.[ ... ]
The TileBars for each of these documents display appropriate overlap. But what aboutthe documents whose TileBars indicate overlap, but are not marked relevant? Some of theseare documents 2413, 2859, 3557, and 3709. In only one case (2413) does either term setoccur frequently, so the others might be irrelevant references. The pertinent fragments areshown below; three out of four could be considered relevant.
In Document 2413 (ZF07-387-928), tile 4:, we find:
[ ... ]
Japan has removed all the controls on exports of memory chips to the EuropeanCommunity in compliance with international trade rules, the European Commissionsaid: the restrictions arose from the controversial third country fair market valueprovisions of the US-Japan Semiconductor Trade Agreement, which were declaredillegal under the General Agreement on Tariffs & Trade - but the Commission is stillstudying possible dumping of memory chips in Europe by Japan.[ ... ]
In Document 2859 (ZF07-755-876), has the following passage:
[ ... ]Japanese printer manufacturers Star Micronics and NEC Corp, presently using theirUK plants to penetrate the European market, have agreed to increase the numberof European components in their machines, so avoiding the European Communityanti-dumping taxes recently imposed on them: last week, a sitting of the EuropeanCommission found that fewer than 40% of the components came from European firms,and as such the printers came under the same tax ruling as direct imports from Japan- around $15 dollars a printer for Star and $33 for NEC; accordingly, both firmshave undertaken to include more European components, and if this is accepted at theCommission’s next sitting, the taxes will be duly annulled.[ ... ]
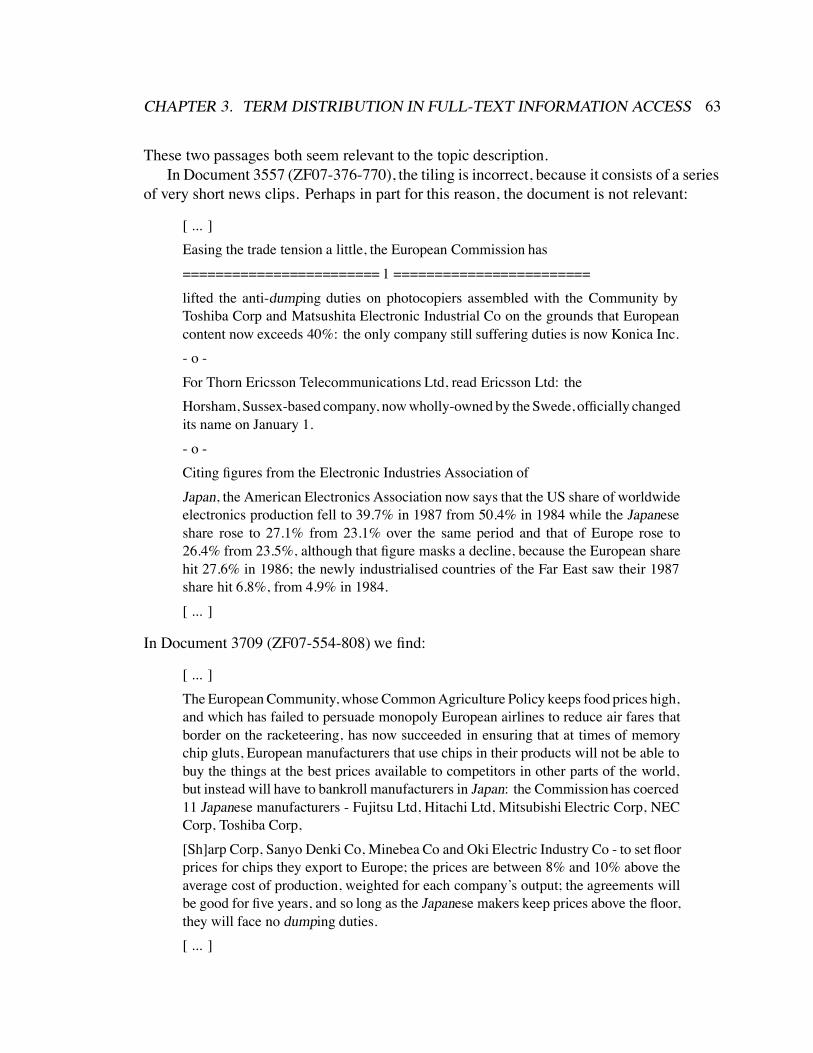
CHAPTER 3. TERM DISTRIBUTION IN FULL-TEXT INFORMATION ACCESS 63
These two passages both seem relevant to the topic description.In Document 3557 (ZF07-376-770), the tiling is incorrect, because it consists of a series
of very short news clips. Perhaps in part for this reason, the document is not relevant:
[ ... ]Easing the trade tension a little, the European Commission has======================== 1 ========================lifted the anti-dumping duties on photocopiers assembled with the Community byToshiba Corp and Matsushita Electronic Industrial Co on the grounds that Europeancontent now exceeds 40%: the only company still suffering duties is now Konica Inc.- o -For Thorn Ericsson Telecommunications Ltd, read Ericsson Ltd: theHorsham, Sussex-based company, now wholly-owned by the Swede, officially changedits name on January 1.- o -Citing figures from the Electronic Industries Association ofJapan, the American Electronics Association now says that the US share of worldwideelectronics production fell to 39.7% in 1987 from 50.4% in 1984 while the Japaneseshare rose to 27.1% from 23.1% over the same period and that of Europe rose to26.4% from 23.5%, although that figure masks a decline, because the European sharehit 27.6% in 1986; the newly industrialised countries of the Far East saw their 1987share hit 6.8%, from 4.9% in 1984.[ ... ]
In Document 3709 (ZF07-554-808) we find:
[ ... ]The European Community, whose Common Agriculture Policy keeps food prices high,and which has failed to persuade monopoly European airlines to reduce air fares thatborder on the racketeering, has now succeeded in ensuring that at times of memorychip gluts, European manufacturers that use chips in their products will not be able tobuy the things at the best prices available to competitors in other parts of the world,but instead will have to bankroll manufacturers in Japan: the Commission has coerced11 Japanese manufacturers - Fujitsu Ltd, Hitachi Ltd, Mitsubishi Electric Corp, NECCorp, Toshiba Corp,[Sh]arp Corp, Sanyo Denki Co, Minebea Co and Oki Electric Industry Co - to set floorprices for chips they export to Europe; the prices are between 8% and 10% above theaverage cost of production, weighted for each company’s output; the agreements willbe good for five years, and so long as the Japanese makers keep prices above the floor,they will face no dumping duties.[ ... ]

CHAPTER 3. TERM DISTRIBUTION IN FULL-TEXT INFORMATION ACCESS 64
This last is perhaps questionable since the topic description asks for actions taken againstproven or suspected dumping, and the passage from document 3709 describes an avoidanceof a dumping charge.
If the hypotheses about term distribution hold true, then documents that are listed inFigure 3.9 but do not demonstrate overlap, such as 1022, 3738, and 3697 should notbe relevant. An examination of their contents reveals that one paragraph in 1022 can beconsidered relevant, although Japan is not mentioned specifically, nor is America or Europe:
[ ... ]Talking of soap operas, Toshiba appears to be doing its partner IBM and the othermanufacturers involved in the dispute over the alleged dumping of liquid crystaldisplays (CI No 1,501) no favours: the Herald Tribune quotes Takashi Shimada, topengineer in Toshiba’s electron tube group, as saying "in terms of importance (to thecomputer system) our executives say the 1990s equivalent of the DRAM chip is liquidcrystal displays" - cue more hysterical yellow perilism.[ ... ]
but the other two have irrelevant references (e.g., dumping data onto a tape). Document2003 presents conflicting messages: it turns out to be a series of very short newsbite,including:
[ ... ]Also: JAPANESE SPEECH RECOGNITION PROJECTAUDIOTEX SYSTEM BUSINESS BRISK CENTURY HIGH SCHOOL DEDICATEDUSERS BEMOAN QUALITY, TRAINING
TECHNOLOGY DUMPING IN MALAYSIA[ ... ]
Another example topic description is shown below:
Topic 034<dom> Domain:Science and Technology<title>Topic:
Entities Involved In Building ISDN Applications and Developing Strategies to ExploitISDN<desc> Description:Document must describe applications companies plan to build (are building, havebuilt) for themselves or for others, which exploit ISDN’s services and capabilities oridentify general strategies for using ISDN.

CHAPTER 3. TERM DISTRIBUTION IN FULL-TEXT INFORMATION ACCESS 65
<narr> Narrative:
To be relevant, a document must identify a company’s strategy for using Integrated Ser-vices Digital Networks (ISDN) or building or using applications which take advantageof ISDN.<con> Concept(s):1. ISDN2. Strategy, Applications, Products,3. Networks
<fac> Factor(s):<def> Definition(s):Integrated Services Digital Networks (ISDN) - An international telecommunicationsstandard for transmitting voice, video and data over a digital communications line.
There are 49 documents judged relevant to this topic description. By converting it to asimple TileBar query, of the form: Term Set 1: ISDN and Term Set 2: application strategy,we find TileBar descriptions like those shown in Figure 3.10. In this case it is useful touse the sorted TileBar representation. Interestingly, all of the documents in the “Both TermSets” window, and all the documents in the “Term Set 1” window are judged to be relevant.Only document 525 in the “Term Set 2” window is relevant, and only two documents in the“Passing References” window are relevant.
These examples graphically illustrate how differences in term distribution can havedifferent effects on relevance judgments. In topic description 034, it is important thatthe term ISDN be frequent and well-distributed throughout the text, whereas in topicdescription 005, both term sets needed to occur in an overlapping configuration, but in mostcases in only one or two passages of the document.
These examples also show how powerful certain selected terms can be in finding thedocuments that have been marked as relevant. The vector space model and other similaritycomparison models are designed to determine which terms are important terms automat-ically, usually using via inverse document frequency. In future work I plan to use theTileBar representation on vector space scores to help determine which parts of the longtexts contribute to the overall vector space rankings.
3.5.2 Similarity-based Passage Retrieval ExperimentsSo far this chapter has focussed on the use of term distribution in passage-based retrieval.
There has been a small amount of work on application of similarity-based measures to fulltexts; this work is discussed in this section.

CHAPTER 3. TERM DISTRIBUTION IN FULL-TEXT INFORMATION ACCESS 66
Figure 3.10: TileBars found in response to a simplified version of TREC topic description034. Term Set 1 = isdn and Term Set 2 = application strategy.

CHAPTER 3. TERM DISTRIBUTION IN FULL-TEXT INFORMATION ACCESS 67
Salton, Buckley, and Allan
One way to get an approximation to subtopic structure is to break the document intoparagraphs, or for very long documents, sections. In both cases this entails using theorthographic marking supplied by the author to determine topic boundaries.
Salton, Buckley, and Allan (1991, 1993, 1994) have examined issues pertaining to theinterlinking of segments of full-text documents. In the applications they have described,Salton et al. focus on finding subparts of a large document that either have pointers to otherdocuments (as in “See Also” references in the encyclopedia, or replies to previously postedemail messages), or are very similar in content. These links are used for the purposesautomatic passage linking for hypertext. They focus more on how to find similarity amongblocks of text of greatly differing length, and not so much on the role of the text blockin the document that it is a part of. They find that a good way to ensure that two largersegments, such as two sections, are similar to one another is to make sure they are similarboth globally and locally.
Their algorithms ensure that a document is similar to a query at several levels ofgranularity: over the entire text, at the paragraph level, and at the sentence level. (In thiswork, when applied to encyclopedia text, queries usually consist of encyclopedia articlesthemselves.) For two sections to be similar, they must be similar overall, at the paragraphlevel, and at the sentence level. To accommodate for the fact that most paragraphs differin length, they normalize the term frequency component for the comparisons. Their resultsshow that this procedure is more effective than using full-text information alone. Thisstrategy, especially the sentence-level comparison, serves as a form of disambiguation,since it forces terms that have more than one sense to be used together in their sharedsenses. Salton et al. have found this approach to work quite well for the encyclopediadata, using the pre-existing See-Also links as the evaluation measure. (They point out theproblems with this as an evaluation measure: since the encyclopedia is parsimonious withits reference links, many links that could reasonably be present are deliberately left out toavoid clutter.)
However, when they applied the same technique to the TREC collection, they found theresults were not improved by the global/local strategy (Buckley et al. 1994). They attributethis to the lack of need for disambiguation among the TREC queries, since the datasetsinvolved are more homogenous than those of the encyclopedia.
Other reasons might be that the structure of the TREC queries do not reflect the structureof the dataset, as is the case with the encyclopedia text, and that the TREC dataset is muchmore varied and irregular than is the encyclopedia text.
Hearst and Plaunt
An alternative approach is presented in Hearst & Plaunt (1993), which presents anexperiment that demonstrates the utility of treating full-length documents as composed ofa sequence of locally concentrated discussions. The strategy is to divide the documents

CHAPTER 3. TERM DISTRIBUTION IN FULL-TEXT INFORMATION ACCESS 68
into motivated segments, retrieve the top-scoring 200 segments that most closely match thequery (according to the vector space model), and then sum the scores for all segments thatare from the same document. This causes the parts of the documents that are most similar tothe queries to contribute to the final score for the document. This experiment was performedon a small subset of the TREC ZIFF collection (274 documents of at least 1500 words oftext each). Similarity search on segmented documents was found to perform better thanfull documents, and the approach of combining the scores for the top 200 segments workedsignificantly better than either full texts or segments alone. To be explored is the question ofwhat portions of the documents contribute to the sum – are there several different discussionsabout the same subtopic, or different passages of the text corresponding to different partsof the query? Perhaps, as seen in the examples in Section 3.5.1, different explanations holdfor different queries. An examination using a modified version of TileBars should helpelucidate these issues.
Moffat et al.
Moffat et al. (1994) and Fuller et al. (1993) are also concerned with structured retrievalfrom long texts, as well as efficiency considerations required for indexing document sub-parts. Moffat et al. (1994) performed a series of experiments varying the type of documentsubpart that was compared and the way the subparts’ were used in the ranking.
Interestingly, Moffat et al. (1994) found that manually supplied sectioning informationmay lead to poorer retrieval results than techniques that automatically divide the text. Theycompared two methods of dividing up long texts. The first consisted of the premarkedsectioning information based on the internal markup supplied (presumably by the author)with the texts. The second used a heuristic in which small numbers of paragraphs weregrouped together until they exceeded a size threshold. The results were that the small,artificial multi-paragraph groupings seemed to perform better than the author-suppliedsectioning information. More experiments are necessary in this vein to firmly establishthis result, but it does lend support to the conjecture that multi-paragraph subtopic-sizedsegments, such as those produced by TextTiling, are useful for similarity-based comparisons.
3.5.3 Other ApproachesAnother recent piece of work on passage retrieval (Mittendorf & Schauble 1994) creates
a Hidden Markov Model representation of the text and the query. In order to evaluate theresults the authors concatenate a sequence of abstracts (from the MEDLAR collection,which consists of 1003 abstracts and 30 queries) and try to both recognize the originalboundaries of the documents as well as find the documents that are relevant to the query.
Other researchers have approximated local structure in long documents by breaking thedocuments into even-size pieces, without regard for any boundaries. Stanfill & Waltz (1992)report on such a technique, using the efficiency of a massively parallel computer. Theydivide the documents into 30-word segments and compare the queries to each segment. They
CHAPTER 3. TERM DISTRIBUTION IN FULL-TEXT INFORMATION ACCESS 69
also combine the scores for adjacent 30-word segments in case they break the document inan inopportune position, and then report the best combined scores. The user can chooseto see either the best sections or the heads of the best documents. This simple method,performed on texts from the Dow Jones newswire service, consisting of about 1 Gigabyteof newswires, magazines, newspapers, among others, achieves good results after extensivetesting. The authors cite a precision-recall product of 0.65 on their task but do not furtherelaborate on this claim (it would be a challenge to accurately determine recall on such acollection unless some kind of sampling-based estimation is used).
Hahn (1990) has eloquently addressed the need for imposing structure on full-lengthdocuments in order to improve information retrieval, but proposes a knowledge-intensive,strongly domain dependent approach, which is difficult to scale to sizable text collections.Croft et al. (1990) describe a system that allows users direct access to structured information.Rus & Subramanian (1993) make use of certain kinds of structural information, e.g., tablelayout, for information extraction.
Ro (1988a) has performed experiments addressing the issue of retrieval from full textsin contrast to using controlled vocabulary, abstracts, and paragraphs alone. PerformingBoolean retrieval for a set of nine queries against business management journal articles, Rofound that retrieving against full text produced the highest recall but the lowest precision ofall the methods. In subsequent experiments, Ro (1988b) tried various weighting schemesin an attempt to show that retrieving against full text would perform better than againstparagraphs alone, but did not achieve significant results to this effect.
3.6 ConclusionsThis chapter has discussed retrieval from full-text documents. I have shown how
relative term distribution can be useful information for understanding the relationshipbetween a query and retrieved documents. I have generalized the contrast between maintopics and subtopics to an analysis of all the possible combinations of term frequencyand distribution between two term sets and hypothesized about the usefulness of eachdistributional relationship.
I have also introduced a new display device, called TileBars, that demonstrates theusefulness of explicit term distribution information. The representation simultaneously andcompactly indicates relative document length, query term frequency, and query term distri-bution. The patterns in a column of TileBars can be quickly scanned and deciphered, aidingusers in making fast judgments about the potential relevance of the retrieved documents.TileBars can be sorted according to their distribution patterns and term frequencies, aidingthe users’ evaluation task still more. Two queries from the TREC collection were analyzedusing TileBars and it was shown that the relevant documents for each query demonstratedradically different patterns of distribution of the chosen query terms.
Currently only two term sets are contrasted at a time; this can be easily extended tothree or four. It is most likely the case that any more than four term sets will make
CHAPTER 3. TERM DISTRIBUTION IN FULL-TEXT INFORMATION ACCESS 70
the representation difficult to interpret. Another extension to be made to the existingimplementation of TileBars is improvement of the simple pattern sorting heuristic. Studiesshould to be done to determine what kinds of pattern sortings are most informative. Inthe future the Tilebars should also be evaluated in terms of their use in relevance feedbackand with respect to how users interpret the meaning of the term distributions. The analysisshould compare users’ expectations about the meaning of the term distributions against theanalysis shown in the distribution chart. It may be useful to determine in what situationsthe users’ expectations are not met, in hopes of identifying what additional information willhelp prevent misconceptions.
Information access mechanisms should not be thought of as retrieval in isolation. Cuttinget al. (1990) advocate a text access paradigm that “weaves together interface, presentationand search in a mutually reinforcing fashion”; this viewpoint is adopted here as well. Forexample, the user might send the contents of the Passing References window of a TileBarsession to a Scatter/Gather session (Cutting et al. 1993), which would then cluster thedocuments, thus indicating what main topics the passing references occurred in. The usercould select a subset of the clusters to be sent back to the TileBar session. This kind ofintegration will be attempted in future work.
71
Chapter 4
Main Topic Categories
4.1 IntroductionThis chapter presents an algorithm that automatically assigns multiple main topic cate-
gories to texts, based on computing the posterior probability of the topic given its surround-ing words, without requiring pre-labeled training data or heuristic rules. The algorithmsignificantly outperforms a baseline measure and approaches the levels of inter-indexerconsistency displayed by nonprofessional human indexers. The chapter also describes theconstruction of a general category set from an existing hand-built lexical hierarchy.
The approach to categorization described here is one in which only the simplest assump-tions are made about what it means to categorize the contents of a text. This is done forthe purposes of robustness, scalability, and genre transferability. More reasonable resultscould be obtained from more structured and domain-specific analyses of the text, but at thecost of not allowing for wide applicability.
4.2 Preview: How to use Multiple Main Topic CategoriesThe capability to automatically assign main topic labels (in this and the next chapter,
the terms “categories”, “main topics”, and “labels” are used interchangeably) leads to anew paradigm for browsing the contents of full-length texts: the labels can be used tohelp contextualize the results of a query; i.e., show the user the topics that characterize thedocuments associated with the results of a query. In Chapter 5, I explore the hypothesisthat users need more contextual information when dealing with full-length texts than withabstracts and short text, in part because similarity information is less useful when comparinglengthy documents. Here I present one example of this idea.
If the results of a user’s query are situated with respect to the main topics of thedocuments, a user with only a vague notion of what context the term should appear in canbrowse the output of the categorizer to find appropriate texts. For example, Figure 4.1 showsautomatically assigned main topic categories for five texts from the ACL/DCI collection

CHAPTER 4. MAIN TOPIC CATEGORIES 72
vegetablesbiologyfoodmedicine medicine
biologytroublemilitary
foodvegetablesplantsalcohol
financecommercelawgovernment
A
B
C
D
E
vehiclesliquidstechnologychemistry
Figure 4.1: Main topic categories assigned by the algorithm described in this chapter totexts that contain the term “contaminant” at least twice in a small corpus of newspaper text.
(Church & Liberman 1991) of articles from the Wall Street Journal in which the string“contaminant” occurs at least twice. Glancing at these we can get a feeling for the “gist”of each article. For example, documents A and B are assigned categories relating to food,while document C is assigned two very different categories – medicine and military –because the article discusses the accidental release of an agent for biological warfare andthe subsequent medical damage control efforts. Document D discusses contaminants in atechnical context while document E discusses contaminants in a financial context; in otherwords, rather than focusing on the medical or environmental aspects of a contamination, itfocuses on associated business and legal costs.
Note that this example, especially document C, highlights another point: texts, espe-cially long texts, are not always best represented as one topic from one semantic class.Rather they are often about two or more themes and some relationship among these. Thusclassifying documents strictly within a topic hierarchically can be misleading, because themultiple themes that co-exist are not necessarily ones that are commonly considered to bein the same semantic frame. These and related issues are discussed in greater detail inChapter 5.
This chapter is structured as follows: Section 4.3 describes the categorization algorithm,Section 4.4 presents an evaluation of the algorithm, and Section 4.5 describes the way thegeneral thesaurus-like category set was acquired.
CHAPTER 4. MAIN TOPIC CATEGORIES 73
4.3 Automatic Assignment of Multiple Main TopicsThis chapter describes a mechanism for assigning multiple main topics to lengthy
expository texts. The algorithm is a modification of a disambiguation algorithm describedin Yarowsky (1992). It requires a training phase that determines which terms should beweighted highly as evidence for each category. The training does not require pre-labeledtexts; rather it relies on the tendency for instances of different categories to occur in differentlexical contexts to separate the evidence. When assigning topics to a text, the algorithmmeasures how much evidence is present for every category; the categories with the mostevidence are considered to be the main topic categories of the text.
The categorization algorithm is statistical in nature and is based on the assumption thatmain topics of a text are discussed throughout the length of the text. Thus although it looksat the evidence supplied by individual lexical items, it does not take the structure of thetext into account, e.g., how the lexical items are related to one another syntactically or bydiscourse structure. The algorithm is successful at identifying schema-like categories; itidentifies terms associated with the categories that are not necessarily originally specified asmembers of the categories. However, because the categories are pre-defined, the algorithmcannot recognize or produce novel labels. For this reason, the results of the categorizationalgorithm should be used in conjunction with terms that occur frequently throughout thetext when characterizing the texts’ content. Fixed categories should play only a partial rolein the characterization of the contents of the text.
This chapter also discusses an approach to creating thesaurus-like categories from anexisting hand-built lexicon, WordNet (Miller et al. 1990). The first step is an algorithm forbreaking up the WordNet noun hierarchy into small groups of related terms, and the secondstep determines which groups to combine together in an attempt to create schema-likecategories. This step uses lexical association information from a large corpus to determinewhich groups are most similar to one another. This procedure yields a set of categories thatcan then be used as general category labels for lengthy expository texts.
4.3.1 OverviewThe category assignment algorithm works as follows. A measure of association between
words and categories is found by training on a large text collection; the training algorithmis described in the following sections. This measure of association is used to characterizethe words of the document to which categories are to be assigned. The algorithm looks uphow strongly associated each word in the text is with all of the categories in the categoryset. The scores for each category are added together, and the top scoring categories, subjectto a user-specified cutoff, are reported after the entire document has been processed. Theassociation measure is a normalization of as shown below.
Earlier I experimented with algorithms that tried to determine which sense (category)of a word was being used before allowing that word to contribute to evidence for the overallcategorization of the algorithm. This requires using a window of words surrounding a word

CHAPTER 4. MAIN TOPIC CATEGORIES 74
to determine which sense of the target term is in use (using a variation of Yarowsky’s (1992)algorithm, see below). Although I abandoned this approach, the actual current implemen-tation processes whole windows of words at a time, in effect periodically “probing” thedocument. Depending on the window size and the frequency of the probes, this can resultin counting each term a constant number of times, rather than one time only, but this doesnot change the resulting ranking of the categories.
4.3.2 Yarowsky’s Disambiguation AlgorithmThe topic assignment algorithm described here is a modification of a disambiguation
algorithm described in Yarowsky (1992). Yarowsky defines word senses as the categorieslisted for a word in Roget’s Thesaurus (Fourth Edition), where a category is something likeTOOLS/MACHINERY. For each category, the algorithm
1. Collects contexts that are representative of the Roget category2. Identifies salient words in the collective contexts and deter-
mines weights for each word, and3. Uses the resulting weights to predict the appropriate category
for a polysemous word occurring in a novel text. (Yarowsky1992)
In other words, the disambiguation algorithm assumes each major sense of a homographis represented by a different thesaurus-like category. Therefore, an algorithm that candetermine which category an instance of a term belongs to can in effect disambiguate theterm. The disambiguation is accomplished by comparing the terms that fall into a widewindow surrounding the target term to contexts that have been seen, in a training phase,to characterize each of the categories in which the target term is a potential member. Thetraining phase determines which terms should be weighted highly for each category, usinga mutual-information-like statistic. The training does not require pre-labeled texts; ratherit relies on the tendency for instances of different categories to occur in different lexicalcontexts to separate the senses. After the training is completed a word is assigned a senseby combining the weights of all the terms surrounding the target word and seeing which ofthe possible senses that word can take on has the highest weight.
I extend this algorithm to the text categorization problem as follows. Instead of choosingfrom the set of categories that can be assigned to a particular target word, this new versionof the algorithm measures how much evidence is present for all categories, independentlyof what word occurs in the center of the context being measured. After the entire documenthas been processed, the categories with the most evidence are identified as the main topiccategories of the text. This algorithm is based on the assumption, discussed in Chapter 3,that main topics of a text are discussed throughout the length of the text. The algorithm isdescribed in more detail in the next two subsections.

CHAPTER 4. MAIN TOPIC CATEGORIES 75
4.3.3 Lexically-Based CategoriesFor the purposes of this algorithm, a category is defined by the set of lexical items that
comprise it. The implementation uses a category set derived from WordNet (Miller et al.1990), a large, hand-built online repository of English lexical items organized accordingto several lexico-semantic relations. The implementation does not use Roget’s categoriesbecause at the time of writing they are no available to the public in electronic form. Thealgorithm used to derive the WordNet-based categories is described in Section 4.5, with thegoal of achieving wide coverage using general categories. A moderate size category setwas used in order to facilitate comparisons against judgements made by human subjects(who would be overwhelmed by too large a category set).
The algorithm works by automatically determining, for each category, which lexicalitems tend to indicate the presence of that category. The evidence for presence of a categoryis determined by not only by the presence of the lexical items that make up the category,but also by terms that have been found to co-occur in a salient manner with the categoryterms (described in detail below). For example, the “vehicles” category, consisting ofnames of kinds of vehicles, could be indicated by terms indicating where vehicles are used,e.g., “road”, “ocean”, etc. Ideally, the category itself might contain terms that indicate thesemantic frame in which the category is used. For example, the “athletics” category containsterms about athletes, playing fields, and sports implements, as well as names of sports. It isdifficult to determine where to draw a line between category-specific terms and terms thatoccur more generally. However, the algorithm helps decide this by indicating which termsoutside the category nevertheless co-occur with it significantly and to the exclusion of othercategories. Thus, in some cases the algorithm discovers terms that support the frame-likemeaning of the categories.
Sparck-Jones (1971) discusses at length the difference between synonyms and seman-tically related terms in a category definition. For example, terms grouped with “desire” inRoget’s Thesaurus include “wish”, “fancy”, and “want”, which can be called synonyms. Incontrast, terms grouped with “navigation” include “boating”, “oar”, and “voyage”; theseare not synonyms but are semantically, associationally related to the navigation schema.She concludes in Sparck-Jones (1986) that the semantic-based classes are more effectivefor information retrieval, although does not claim to verify this rigorously.
4.3.4 Determining Salient TermsYarowsky 1992 defines a salient word as “one which appears significantly more often in
the context of a category than at other points in the corpus” (p 455). For example, the term“lift” can be salient for the machine sense of “crane” but not for the bird sense. He formalizesthis with a mutual-information-like estimate: , the probability of a word
occurring in the context of the Roget category divided by the probability of theterm occurring in the corpus as a whole. Yarowsky notes that can be computedby determining the number of times occurs in the context surrounding terms that are

CHAPTER 4. MAIN TOPIC CATEGORIES 76
members of . He notes, however, that this estimate is unreliable when is infrequentin the corpus, and corrects for this by employing a smoothing algorithm described in Galeet al. (1992b).
Once all of the computations for have been computed, disambiguation cantake place. Yarowsky combines the evidence supplied by the words surrounding an instanceof the word that is being disambiguated as follows:
Argmax log
where a context of 50 words is allotted on either side of the target word (addition is usedsince the formula takes the logs of the evidence weights). Yarowsky assumes a uniformdistribution for , and notes that can be omitted as well since it will not effectthe results of the maximization.
This algorithm does not enforce mutual exclusivity on evidence for different categories,although weight assigned to one category does detract from weight that can be assigned toany other category (since the frequency of co-occurrence of a word with a category memberis divided by the overall frequency of the word). The lack of mutual-exclusivity is usefulin that it allows one word to provide partial evidence for multiple categories.
Training proceeds by first collecting global frequency counts over a corpus. For thecurrent implementation, training was done on Grolier’s American Academic Encyclopedia( 8 7M words). In the current implementation of the algorithm, terms are checked againstWordNet (Miller et al. 1990) in order to place them in a “canonicalized” form. Wordsthat are listed on a 454-word “stoplist,” (i.e., a list of closed-class words and other highlyfrequent words) are not used in the calculation of evidence for category membership.
If a pair of adjacent words matches a compound contained in WordNet, then that pairis considered a term, instead of as the individual words that comprise it. If the worddoes not participate in a two-member compound, then its membership in WordNet alone isinvestigated. If this check fails, then the term’s inflections are removed using a modifiedversion of WordNet’s morphological analyzer, and the stemmed version is looked up inWordNet. In case of failure, the next two modifications are conversion of the term’scharacters to lowercase and reapplication of morphological stemming. If all else fails, theword is recorded in its original form.
As mentioned above, Yarowsky’s algorithm is designed to perform word disambigua-tion. After training has been completed, the term weights can be used to classify a newinstance of a term that is a member of one or more categories into the category with the mostcontextual evidence. However, category assignment is computed somewhat differently.
Evidence for category membership is determined by evaluating co-occurrence informa-tion within a fixed-length window of terms surrounding each instance of a target term. Toprevent the evidence supplied by frequent terms from dominating the evidence supplied byinfrequent terms, the evidence contributed by a particular member of a category is normal-ized by the number of times that term occurs in the corpus as a whole. (Yarowsky (1992)

CHAPTER 4. MAIN TOPIC CATEGORIES 77
also weights the terms in this manner), thus requiring two passes through the training data.Instead of smoothing estimates for infrequent terms, this implementation simply excludesinfrequent terms (terms whose frequency is less than a threshold) from contributing ev-idence. This is done because it is unlikely that a very infrequent term will be able toprovide reliable evidence for the category, and thus it is excluded from making any kind ofcontribution at all.
In the current implementation of the algorithm a term window surrounding an instance ofa word that is a member of a category is counted equally as evidence for all of the categoriesof which the word is a member. However, it would be interesting to incorporate this anddetermine whether or not re-estimation caused results to improve. Another possibility is touse the re-estimation step to adjust the bias of the algorithm to a corpus different than theone initially trained on.
Another issue is that of context window size. Gale et al. (1992b) find that sometimeswords even 10,000 positions away from the target term are useful for training; Yarowsky(1992) uses a fixed window of 100 words. That window size was also used in the currentimplementation of the algorithm; however, a more meaningful way to specify the contextwindow would be to use coherent multi-paragraph units as discovered by the TextTilingalgorithm of Chapter 2. The re-estimation algorithm can also play a role in determiningan appropriate window size, as follows (see Figure 4.2). The tiling algorithm, using onlyterm repetition, determines the windows to be used as input to the training phase of thecategorization algorithm. The categorization algorithm is then used to assign disambiguatedlabels to many of the terms which are then re-input to the tiling algorithm, which presumablycan now generate more accurate tile information, and so on. The training loop idea has notyet been implemented.
In the training phase of the current implementation, if a word is a member of a category,then that word is not allowed to count as evidence for the category. This makes more sensefor the disambiguation algorithm than for the topic labeling algorithm, but in both cases theword should be able to count as evidence for the category it is a member of, according tosome prior probability of its tendency to represent that category versus any other categoryof which it may be a member.
4.3.5 Related Work and Advantages of the AlgorithmThere exist other systems in which multiple categories are assigned to documents,
e.g., Masand et al. (1992), Jacobs & Rau (1990), Hayes (1992). However, unlike themethod suggested here, these systems require large volumes of pre-labeled texts in orderto perform these classifications. Larson (1992), Larson (1991) presents an algorithm thatautomatically assigns Library of Congress Classification numbers to bibliographic recordsconsisting of titles and subject headings after forming clusters based on training fromexisting records. The method works well but requires pre-defined subject headings asattributes for classification.
The approach of Liddy & Paik (1992) is most similar to that presented here. Liddy &

CHAPTER 4. MAIN TOPIC CATEGORIES 78
Tiling
Training forCategorization
coherent textunits
word counts
categorizedwords
Figure 4.2: A proposed training loop: TextTiling, using only term repetition information,provides context window information for the categorization algorithm which then suppliesterm category information to improve the results of TextTiling,which aids in the reestimationof the priors for the categorization algorithm, and so on.
Paik (1992) use Subject Code assignments from the LDOCE dictionary, creating in effecta set of general categories. The algorithm presented here makes a probabilistic estimate ofthe likelihood of a category given the terms that occur. In contrast, the system of Liddy& Paik (1992) uses heuristics to determine word senses based on how many words thatcan be assigned a particular code occur in a sentence, as well as how likely it is for thecandidate codes in the sentence to co-occur. Thus it also does not require pre-labeled textsbut it does require a large number of words to have been assigned to categories in advance.The categorization algorithm described here also requires some terms to be assigned toeach category in advance, but it automatically chooses additional terms from the corpusto act as strong indicators for each category. Thus it should be more adaptable to newcategory sets, that is, category sets that characterize specialized domains such as academiccomputer science. It would be useful to run an experiment comparing the results of the twoalgorithms.
Other categorization algorithms also deal with the issue of choosing salient features.Lewis (1992) defines feature selection as the process of choosing, for each category, asubset of terms from an indexing language to be used in predicting occurrences of thatcategory. He uses a mutual information statistic within a probabilistic framework, choosingthe highest scoring terms for each category to act as indicators for the presence of thatcategory. This approach to term weighting is the most similar to that described here.
Many knowledge-based classification systems also recognize the need to determine

CHAPTER 4. MAIN TOPIC CATEGORIES 79
which terms outside of those already specified are good indicators of the category. Riloff& Lehnert (1992) use a pre-labeled training set to extract defining features from a frame-like representation for each document, in a framework in which a single phrase can beenough to indicate the presence of a category. Jacobs (1993), in a framework combiningknowledge-based and statistical information, explores several different ways to determinegood indicators, including weighting terms according to a mutual information statistic,using exception lists, and finding terms that tend to surround category terms but are nota part of the category themselves. Fung et al. (1990) using a probabilistic network forcategorization, requires users to select which features from a set indicate the relevance oftraining documents and then automatically determines the weights to place on the links. Thedisadvantage to all these approaches is that they require pre-labeled texts or user judgmentsfor the training step.
Many algorithms have been developed that use co-occurrence information for deter-mining category membership or to build thesaurus classes. Crouch (1990),Grefenstette(1992),Salton (1972),Sparck-Jones (1986), and Ruge (1991) all use co-occurrence infor-mation derived from corpora to determine how to expand queries with related terms, andshow that this information can improve retrieval. (But see Peat & Willett (1991) for acriticism of this kind of approach.) Deerwester et al. (1990) use co-occurrence termsamong documents (compressed with multivariant decomposition) to determine semanticrelatedness among documents. Co-occurrence information has been found to be useful fora variety of tasks in computational linguistics as well (e.g., Church & Hanks (1989), Smadja& McKeown (1990), Justeson & Katz (1991)).
An advantage of the Yarowsky weighting scheme is that it uses co-occurrence infor-mation to classify terms into pre-defined, intuitively understandable classes, as opposedto classes derived from the data. Although categories or classes derived from data areuseful for many kinds of applications, intuitive categories may be more appropriate wheninterfacing between the system and the user. This supposition is visited in more detail inChapter 5.
Another advantage of the algorithm is that it can accommodate multiple category sets.Categorization algorithms based on clustering can only present one view on the data, basedon the results of the clustering algorithm, but as shown above, documents may be similaron only one out of several main topic dimensions. Algorithms that train on pre-labeledtexts can also represent multiple simultaneous categories, but are confined to using onlythe category sets that have been pre-assigned (since in most cases thousands of pre-labeleddocuments are necessary to train these algorithms).
4.4 Evaluation of the Categorization AlgorithmA common way to evaluate a categorization algorithm is to compare its labelings with
those assigned by human categorizers. For some test collections a “correct” set of labelsalready exists, and the program’s results can be measured directly against these. For

CHAPTER 4. MAIN TOPIC CATEGORIES 80
example, Masand et al. (1992), Jacobs (1993), and Hayes (1992) use human-assignedlabels both for training and judging their classification systems.
When there exists a large training base of examples, it is safer to assume that comparingagainst one judgment per document is accurate. However, because no large training set isavailable for this task, and because inter-indexer consistency tends to be low (Bates 1986),a better evaluation metric is to compare the inter-indexer consistency of the algorithmwith that of human judges. (Inter-indexer consistency is the average number of categoryassignments a judge makes in common with the other judges for a particular document.)Furthermore, Cooper (1969) shows that in a restricted case at least, increased inter-indexerconsistency leads to increased expected search effectiveness, and Rolling (1981) providesmore supporting evidence to this effect.
Following Gale et al. (1992a), the performance of the algorithm is evaluated against botha lower bound and an upper bound. The lower bound represents the minimal performancethat any algorithm ought to be able to surpass. Often this boundary is what would resultif an algorithm always made the most likely choice, e.g., for a part-of-speech tagger,a lower bound might be the percentage correct obtained by always assigning the mostlikely part-of-speech category for each word. Useful lower bounds are not always easilyformulated; sometimes an algorithm’s results should just be compared against what analgorithm making random assignments would produce (surprisingly, it is not infrequentthat proposed algorithms do not perform much better than chance). Since no priors oncategory assignments are available for evaluation of the category set described here, thelower bound or baseline in this evaluation is the performance of an algorithm makingrandom choices. Often in computational linguistics algorithms the upper bound is that ofhuman performance; the algorithm should not be expected to do better than a human wouldon a task with a goal of matching human intuitions. In this evaluation, human inter-indexerindexing, as described above, is the upper bound for evaluation.
4.4.1 The Test SetThe texts used in the evaluation experiments were chosen to satisfy several desiderata.
They are:
CHAPTER 4. MAIN TOPIC CATEGORIES 81
lengthy, but short enough for human judges to skimseveral of them in a reasonable amount of time,
general in subject matter in order to match the the testcategory set,
varied in terms of main topic subject matter, so that avariety of categories will be assigned, and
publically accessible to facilitate comparison againstother categorization methods.
The Brown Corpus satisfies these criteria; this experiment uses the first 300 articles.1Each document is approximately 190 lines long (or 2030 words, on average) and in mostcases consists of an unbroken stream of text.2 The texts of the documents are cut off afterthe first 190 lines, so in most cases readers do not see the entire text.
4.4.2 The ExperimentOut of these 300 articles, 10 were chosen at random. The 10 texts were separated into
two groups (labeled A and B) of 5 texts each, in order to reduce the reading load on thejudges. Each judge was given the list of 106 categories and the five texts from either groupA or group B, and the following instructions:
I’d like you to look over the categories briefly, and then read quickly or skimeach text. Each time after you read a text, look at the category list again andchoose the five best categories to describe the text’s main topic(s). List thecategories in ranked order, with best first. Use the category number, and pleaseinclude at least the beginning of the category name so I know you didn’t put thewrong number by accident. The text name occurs at the beginning of each file.
The judges did not know that their rankings would be compared against those generated bya computer program.
Ten sets of judgments were collected; five for each group of texts. There is disagreementin the literature about how to compute inter-indexer consistency (e.g., Rolling (1981),Hen-zler (1978)), however, in most cases this is done in a pairwise manner. We are interested inhow closely the program matches the human judgments on average.
1Document numbers A.01-F.48, H.01-H.30, J.01-J.80.2A few documents consisted of several distinct articles combined, the first blending directly in to the next.

CHAPTER 4. MAIN TOPIC CATEGORIES 82
4.4.3 Analysis of ResultsThe inter-indexer agreement was computed for each judge and each document; that is,
the average number of category assignments the judge made in common with the otherjudges for a particular document. More formally, if there are judges making choicesfor each document,
11
where is the list of five categories assigned by judge to document , and isthe number of categories assigned to document by both judge and judge . (Thisis equivalent to taking the average of the pairwise scores.) Note that for this calculation,relative ranking of categories is not taken into account.
Table 4.1 shows the categories chosen by the judges and the algorithm for two of thetest documents. The labeling of document A.08 had high inter-indexer consistency bothamong judges and the algorithm. For document E.25, the algorithm did not rank medicine,the judges’ highest category, in its top five (rather, it was ranked eighth), although there isstrong agreement among the other terms; this was an exceptional case (see below). Thedocument in question discusses research advances on technology to be used in a medicalcontext.
judge A judge B judge C judge D judge E Algorithm33 government 34 politics 102 actions 34 politics 33 government 33 government32 legal system 33 government 104 happening 33 government 34 politics 36 finance34 politics 37 work 34 politics 104 happening 36 finance 32 legal system36 finance 102 actions 37 work 06 cities 32 legal system 35 commerce37 work 36 finance 59 information 29 conflict 29 conflict 29 conflict
judge F judge G judge H judge I judge J Algorithm27 medicine 27 medicine 27 medicine 27 medicine 25 body process 87 light02 measure 44 technology 44 technology 02 measure 27 medicine 44 technology45 electronics 45 electronics 02 measure 44 technology 44 technology 45 electronics44 technology 52 science 87 light 45 electronics 45 electronic 53 physics99 defense 71 cell biology 26 body parts 26 body parts 100 stuff 66 machines
Table 4.1: Category assignments to two documents (A.08 and E.25) by human judges andby the algorithm.
One way to evaluate the results of an algorithm is to compare its performance againsta baseline. In this case, we compute the expected inter-indexer consistency score of analgorithm that chooses from the category set at random. This baseline is computed asfollows, if we are not concerned with relative ranking of categories. The model is oneof chosing categories without replacement from a set of unique categories, whereeach choice of category is independent from the previous and subsequent choices. Theunderlying distribution is assumed to be hypergeometric (sampling without replacement).

CHAPTER 4. MAIN TOPIC CATEGORIES 83
The algorithm is required to choose categories, and its choices are compared againstthose of one judge, who is assumed to be correct in all choices. The number of ways tochoose categories correctly out of choices, from a set of categories without replacement(if order does not matter), is .
When categories are identified correctly, the percentage correct is ; therefore theexpected percentage correct when comparing against one judge for a random categoryassignment is 1 .
In this experiment, 5 and 106. Substituting in these values we determinethat the expected percent correct for a random choosing process is 5%. The variance is
2 2 0 01 0025 0075.Since we havefive independent comparisons, the average score (the mean of the average)
is the sum of the five means divided by five, or the mean of any one (0 05). The varianceof the average is the sum of the variances divided by 2, 0.0015. Thus we have a Gaussianrandom variable with mean 0 05 and variance 0 0015. This means a score greater than 13%(two standard deviations greater than the mean) happens less than 5% of the time if thecategories are chosen at random.
Table 4.2 presents summary data for the judges and two ways of scoring the output ofthe algorithm. The judges’ average consistency score is 54%; the algorithm when restrictedto its top 5 choices has a consistency score of 39% and when allowed to present its top7 choices has an average score of 52%. Thus our results perform much better than thebaseline, since on average the algorithm matches 39% (1 96 5) of the judges’ choices.
Average for Average for Average forJudges Algorithm-5 Algorithm-7
Group A 0.54 0.39 0.50Group B 0.54 0.39 0.53Average 0.54 0.39 0.52
Table 4.2: Overall inter-indexer consistency scores. Algorithm-5 indicates the score forthe algorithm’s five top-ranked categories, while Algorithm-7 indicates the score for thealgorithm’s top seven categories.
Tables 4.3 and 4.4 present these results in more detail. Table 4.3 shows the percentageof inter-indexer agreement for each document and for each judge in group A, as well as theaverage consistency over all judges for each document. Table 4.4 shows the correspondinginformation for group B.
These tables indicate the percentage agreement between the program’s scores and thoseof the judges. Note that when comparing a judge against the other judges, comparisonsare made against four other rankings, but when comparing the program against the judges,comparisons are made against all five judges. (Including the program’s scores whencomparing judges against judges would bias the comparison to favor the program bygiving its assignments equal weight to the judges’ assignments. Excluding the program’s
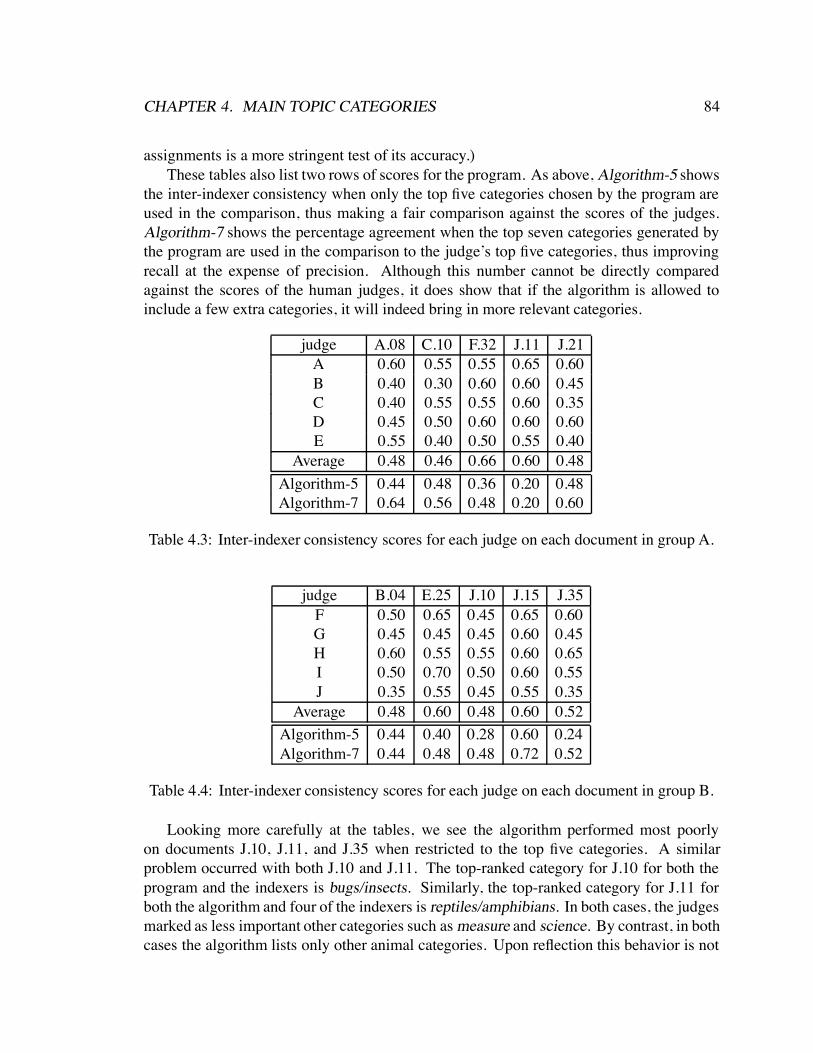
CHAPTER 4. MAIN TOPIC CATEGORIES 84
assignments is a more stringent test of its accuracy.)These tables also list two rows of scores for the program. As above, Algorithm-5 shows
the inter-indexer consistency when only the top five categories chosen by the program areused in the comparison, thus making a fair comparison against the scores of the judges.Algorithm-7 shows the percentage agreement when the top seven categories generated bythe program are used in the comparison to the judge’s top five categories, thus improvingrecall at the expense of precision. Although this number cannot be directly comparedagainst the scores of the human judges, it does show that if the algorithm is allowed toinclude a few extra categories, it will indeed bring in more relevant categories.
judge A.08 C.10 F.32 J.11 J.21A 0.60 0.55 0.55 0.65 0.60B 0.40 0.30 0.60 0.60 0.45C 0.40 0.55 0.55 0.60 0.35D 0.45 0.50 0.60 0.60 0.60E 0.55 0.40 0.50 0.55 0.40
Average 0.48 0.46 0.66 0.60 0.48Algorithm-5 0.44 0.48 0.36 0.20 0.48Algorithm-7 0.64 0.56 0.48 0.20 0.60
Table 4.3: Inter-indexer consistency scores for each judge on each document in group A.
judge B.04 E.25 J.10 J.15 J.35F 0.50 0.65 0.45 0.65 0.60G 0.45 0.45 0.45 0.60 0.45H 0.60 0.55 0.55 0.60 0.65I 0.50 0.70 0.50 0.60 0.55J 0.35 0.55 0.45 0.55 0.35
Average 0.48 0.60 0.48 0.60 0.52Algorithm-5 0.44 0.40 0.28 0.60 0.24Algorithm-7 0.44 0.48 0.48 0.72 0.52
Table 4.4: Inter-indexer consistency scores for each judge on each document in group B.
Looking more carefully at the tables, we see the algorithm performed most poorlyon documents J.10, J.11, and J.35 when restricted to the top five categories. A similarproblem occurred with both J.10 and J.11. The top-ranked category for J.10 for both theprogram and the indexers is bugs/insects. Similarly, the top-ranked category for J.11 forboth the algorithm and four of the indexers is reptiles/amphibians. In both cases, the judgesmarked as less important other categories such as measure and science. By contrast, in bothcases the algorithm lists only other animal categories. Upon reflection this behavior is not

CHAPTER 4. MAIN TOPIC CATEGORIES 85
surprising since animal terms will tend to occur in similar contexts in training, and sincethe categories were not trained to be mutually exclusive.
Another way to measure the results is to determine how often the program assigns themost important categories. Overall, the program’s performance was strong with respect tochoosing highest-ranked categories.
If a majority ( 3) of the judges agree on the top-ranked category, this category is calledthe majority top choice. A category that is ranked highest by at least one judge is referredto as a minority top choice. Eight out of the ten documents had majority top choices. Ofthese, in four cases, the program’s top choice was the majority top choice. In two cases,the program’s top choice matched a minority top choice. In one of the remaining cases,the program was off-by-one, ranking the majority top choice second, and in the other, themajority top choice was the program’s eighth choice. In the two remaining cases in whichno majority existed, the program’s top choice matched a minority top choice.
4.5 Creating Thesaural CategoriesRecently, much effort has been applied to the creation of lexicons and the acquisi-
tion of semantic and syntactic attributes of the lexical items that comprise them, e.g,Alshawi (1987), Calzolari & Bindi (1990),Grefenstette (1992),Hearst (1992), Markowitzet al. (1986), Pustejovsky (1987), Schutze (1993a), Wilks et al. (1990). However, a lexiconas given may not suit the requirements of a particular computational task. Lexicons are ex-pensive to build; therefore, it is preferable to adjust an existing one to meet an application’sneeds over creating a new one from scratch. This section describes a way to add associ-ational information to a hierarchically structured lexicon in order to create thesaurus-likecategories useful for the topic assignment task.3
One way to label texts, when working within a limited domain of discourse, is to startwith a pre-defined set of topics and specify the word contexts that indicate the topics ofinterest, as in Jacobs & Rau (1990). Another way, assuming that a large collection of pre-labeled texts exists, is to use statistics to automatically infer which lexical items indicatewhich labels, as in Masand et al. (1992). In contrast, the goal here is to assign labelsto general, domain-independent text, without benefit of pre-classified texts. In all threecases, a lexicon that specifies which lexical items correspond to which topics is required.The topic labeling method of this chapter is statistical and thus requires a large number ofrepresentative lexical items for each category.
Because a good, large, online public-domain thesaurus is not currently available, thissection describes a way to derive one from a hierarchical lexicon. The starting point for thethesaurus is WordNet (Miller et al. 1990), which is readily available online and providesa large repository of English lexical items. WordNet4 is composed of synsets, structurescontaining sets of terms with synonymous meanings, thus allowing a distinction to be made
3Much of the work in this section appeared in a similar form in Hearst & Schutze (1993).4All work described here pertains to Version 1.3 of WordNet.
CHAPTER 4. MAIN TOPIC CATEGORIES 86
between different senses of homographs. Associated with each synset is a list of relationsthat the synset participates in. One of these, in the noun dataset, is the hyponymy relation(and its inverse, hypernymy), roughly glossed as the “ISA” relation. This relation imposes ahierarchical structure on the synsets, indicating how to generalize from a subordinate termto a superordinate one, and vice versa.5 This is a very useful kind of information for manytasks, such as reasoning with generalizations and assigning probabilities to grammaticalrelations (Resnik 1992).
This lexicon must be adjusted in two ways in order to facilitate the label assignmenttask. The first is to collapse the fine-grained hierarchical structure into a set of coarse butsemantically-related categories. These categories will provide the lexical evidence for thetopic labels. (After the label is assigned, the hierarchical structure can be reintroduced.)Once the hierarchy has been converted into categories, the categories can be augmentedwith new lexical items culled from free text corpora, in order to further improve the labelingtask.
The second way the lexicon must be adjusted is to combine categories from distant partsof the hierarchy. Of particular interest are groupings of terms that contribute to a frame orschema-like representation (Minsky 1975); this can be achieved by finding associationallexical relations among the existing taxonymic relations. For example, WordNet has thefollowing synsets: “athletic game” (hyponyms: baseball, tennis), “sports implement”(hyponyms: bat, racquet), and “tract, piece of land” (hyponyms: baseball diamond, court),none of which are closely related in the hierarchy. We would like to automatically findrelations among categories headed by synsets like these. (In Version 1.3, the WordNetencoders have placed some associational links among these categories, but still only someof the desired connections appear.)
In other words, links should be derived among schematically related parts of the hierar-chy, where these links reflect the text genre on which text processing is to be done. Schutze(1993b) describes a method, called WordSpace, that represents lexical items according tohow semantically close they are to one another, based on evidence from a large text cor-pus. To create structured associational information, the term-similarity information fromWordSpace is combined with the category information derived from WordNet to createschema-like super-categories.
The next subsection describes the algorithm for converting the WordNet hierarchyinto a set of categories. This is followed, in subsection 4.5.2 by a discussion of how thesecategories are to be used and why they need to be improved. Subsection 4.5.3 describes howWordSpace an be used to bring disparate categories together to form schematic groupingswhile retaining the given hierarchical structure.
5Actually, the hyponomy relation is a directed acyclic graph, in that a minority of the nodes are childrenof more than one parent. I will at times refer to it as a hierarchy nonetheless.
CHAPTER 4. MAIN TOPIC CATEGORIES 87
4.5.1 Creating Categories from WordNetAn algorithm is needed to decompose the WordNet noun hierarchy into a set of disjoint
categories, each consisting of a relatively large number of synsets, creating categories of aparticular average size with as small a variance as possible, where each category consistsof a relatively large number of synsets (this is necessary for the text-labeling task, becauseeach topic must be represented by many different terms). There is some limit as to howsmall this variance can be because there are several synsets that have a very large number ofchildren (there are sixteen nodes (synsets) with a branching factor greater than 100). Thisprimarily occurs with synsets of a taxonymic flavor, i.e., mushroom species and languagesof the world. There are two other reasons why it is not straightforward to find uniformlysized, meaningful categories:
(i) There is no explicit measure of semantic distance among the children of a synset.
(ii) The hierarchy is not balanced, i.e., the depth from root to leaf varies dramaticallythroughout the hierarchy, as does the branching factor. (The hierarchy has ten rootnodes; on average their maximum depth is 10.5 and their minimum depth is 2.)
Reason (ii) rules out a strategy of traveling down a uniform depth from the root or up auniform height from the leaves in order to achieve uniform category sizes.
For the purposes of the description of this algorithm, a synset is a node in the hierarchy.A descendant of synset N is any synset reachable via a hyponym link from N or any ofN’s descendants (recursively). This means that intermediate, or non-leaf synsets, are alsoclassified as descendants. The term “child” refers to an immediate descendant, i.e., a synsetdirectly linked to N via a hyponym link, and “descendant” to indicate linkage throughtransitive closure.
The algorithm used here is controlled by two parameters: upper and lower bounds onthe category size (see Figure 4.3). For example, the result of setting the lower bound to25 and the upper bound to 60 yields categories with an average size of 58 members. Anarbitrary node N in the hierarchy is chosen, and if it has not yet been marked as a memberof a category, the algorithm checks to see how many unmarked descendants it has. In everycase, if the number of descendants is too small, the assignment to a category is deferreduntil a node higher in the hierarchy is examined (unless the node has no parents). Thishelps avoid extremely small categories, which are especially undesirable.
If the number of descendants of N falls within the boundaries, the node and its unmarkeddescendants are bundled into a new category, marked, and assigned a label which is derivedfrom the synset at N. Thus, if N and its unmarked descendants create a category with kmembers, the number of unmarked descendants of the parent of N decreases by k.
If N has too many descendants, that is, the count of its unmarked descendants exceedsthe upper bound, then each of its immediate children is checked in turn: if the child’sdescendant count falls between the boundaries, then the child and its descendants arebundled into a category. If the child and its unmarked descendants exceed the upper bound,

CHAPTER 4. MAIN TOPIC CATEGORIES 88
for each synset N in the noun hierarchya_cat(N)
a_cat(N):if N has not been entered in a category
T <- #descendents(N)
if ((T >= LOWER_BRACKET)&& (T <= UPPER_BRACKET))
mark(N,NewCatNumber)
else if (T > UPPER_BRACKET)
for each (direct) child C of NCT <- #descendents(C)if ((CT >= LOWER_BRACKET)
&& (CT <= UPPER_BRACKET))mark(C,NewCatNumber)
else if (CT > UPPER_BRACKET)a_cat(C)
T <- #descendents(N)if (T >= LOWER_BRACKET)
mark(N,NewCatNumber)
Figure 4.3: Algorithm for creating categories from WordNet’s noun hierarchy.

CHAPTER 4. MAIN TOPIC CATEGORIES 89
United States Constitution Genesis0 assembly (court, legislature) deity divinity god1 due process of law relative relation (mother, aunt)2 legal document legal instrument worship3 administrative unit man adult male4 body (legislative) professional5 charge (taxes) happiness gladness felicity6 administrator decision maker woman adult female7 document written document evildoing transgression8 approval (sanction, pass) literary composition9 power powerfulness religionist religious person
Figure 4.4: Output using original category set on two well-known texts.
then the procedure is called recursively on the child. Otherwise, the child is too smalland is left alone. After all of N’s children have been processed, the category that N willparticipate in has been made as small as the algorithm will allow. There is a chance thatN and its unmarked descendants will now make a category that is too small, and if this isthe case, N is left alone, and a higher-up node will eventually subsume it (unless N hasno parents remaining). Otherwise, N and its remaining unmarked descendants are bundledinto a category.
If N has more than one parent, N can end up assigned to the category of any of itsparents (or none), depending on which parent was accessed first and how many unmarkedchildren it had at any time, but each synset is assigned to only one category.
The function “mark” places the synset and all its descendents that have not yet beenentered into a category into a new category. Note that #descendents is recalculated in thethird-to-last line in case any of the children of N have been entered into categories.
In the end there may be isolated small pieces of hierarchy that aren’t stored in anycategory, but this can be fixed by a cleanup pass, if desired.
4.5.2 Assigning Topics using the Original Category SetUsing the 726 categories derived from WordNet, the category assignment algorithm
produces the output shown in Figure 4.4 for two well-known texts (made available onlineby Project Gutenberg). The first column indicates the rank of the category, the secondcolumn indicates the score for comparison purposes, and the third column shows the wordsin the synset at the top-most node of the category (these are not always entirely descriptive,so some glosses are provided in parentheses).
Note that although most of the categories are appropriate (with the glaring exception of“professional” in Genesis), there is some redundancy among them, and in some cases they

CHAPTER 4. MAIN TOPIC CATEGORIES 90
are too fine-grained to indicate main topic information.In an earlier implementation of this algorithm, the categories were in general larger but
less coherent than in the current set. The larger categories resulted in better-trained classi-fications, but the classes often conflated quite disparate terms. The current implementationproduces smaller, more coherent categories. The advantage is that a more distinct meaningcan be associated with a particular label, but the disadvantage is that in many cases sofew of the words in the category appear in the training data that a weak model is formed.Then the categories with little distinguishing training data dominate the labeling scoresinappropriately.
In the category-derivation algorithm described above, in order to increase the size of agiven category, terms must be taken from nodes adjacent in the hierarchy (either descendantsor siblings). However, adjacent terms are not necessarily closely related semantically, andso after a point, expanding the category via adjacent terms introduces noise. To remedy thisproblem, WordSpace is used to determine which categories are semantically related to oneanother, despite the fact that they come from quite different parts of the hierarchy, so theycan be combined to form schema-like associations.
4.5.3 Combining Distant CategoriesTo find which categories should be considered closest to one another, we first determine
how close they are in WordSpace (Schutze 1993b) and then group categories together thatmutually ranked one another highly.6 WordSpace is a corpus-based method for inducingsemantic representations for a large number of words from lexical coocurrence statistics.The medium of representation is a multi-dimensional, real-valued vector space. The cosineof the angle between two vectors in the space is a continuous measure of their semanticrelatedness.
First-degree closeness of two categories and is defined as:
12
1
where is:2
The primary rank of category for category indicates how closely related is toaccording to first-degree closeness. For instance rank 1 means that is the closest categoryto , and rank 3 means there are only two closer categories to than .
We define second-degree closeness from the primary ranks. Secondary ranking isneeded because some categories are especially “popular,” attracting many other categoriesto them; the secondary rank enables the popular categories to retain only those categories
6All work involving the WordSpace algorithm was done in collaboration with Hinrich Schutze. We aregrateful to Robert Wilensky for suggesting collaboration on this problem.

CHAPTER 4. MAIN TOPIC CATEGORIES 91
that they mutually rank highly. To determine that close association is mutual between twocategories, we check for mutual high ranking. Thus category and are grouped togetherif and only if ranks highly and ranks highly (where “highly” was determined by acutoff value – and had to be ranked or above with respect to each other, for a threshold
).The results of this algorithm are best interpreted via a graphical layout. Figure 4.5 shows
a piece of a network created using a presentation tool (Amir 1993) based on theoreticalwork by Fruchtermann & Rheingold (1990). The underlying algorithm uses a force-directedplacement model to layout complex networks (edges are modeled as springs; nodes linkedby edges are attracted to each other, but all other pairs of nodes are repelled from oneanother).
In these networks only connectivity has meaning; distance between nodes does notconnote semantic distance. The connectivity of the network is interesting also becauseit indicates the interconnectivity between categories. From Figure 4.5, we see that cate-gories associated with the notion sports, such as athletic game, race, sports equipment, andsports implement, have been grouped together. Athletics is linked to vehicle and competi-tion categories; these in turn link to military vehicles and weaponry categories, which thenlead in to legal categories.
The network also shows that categories that are specified to be near one another inWordNet, such as the categories related to bread, are found to be closely interrelated. Thisis useful in case we would like to begin with smaller categories, in order to eliminate someof the large, broad categories that we are currently working with.
Most of the connectivity information suggested by the network was used to create thenew categories. However, many of the desirable relationships do not appear in the network,perhaps because of the requirement for highly mutual co-ranking. If we were to relax thisassumption we may find better coverage, but perhaps at the cost of more misleading links.The remaining associations were determined by hand, so that the original 726 categorieswere combined into 106 new super-categories.
4.5.4 Revised Topic AssignmentsThe super-categories are intended to group together related categories in order to elim-
inate topical redundancy in the labeler and to help eliminate inappropriate labels (since thecategories are larger and so have more lexical items serving as evidence). Thus the top fouror five super-categories should suffice to indicate the main topics of documents.
Figure 4.6 compares the results of the labeler using the original categories against thesuper-categories. The numbers beside the category names are the scores assigned by thealgorithm; the scores in both cases are roughly similar. It is important to realize that only thetop four or five labels are to be used from the super-categories; since each super-categorysubsumes many categories, only a few super-categories should be expected to contain themost relevant information. The first article is a 31-sentence magazine article, publishedin 1987, taken from Morris (1988). It describes how Soviet women have little political
CHAPTER 4. MAIN TOPIC CATEGORIES 92
power, discusses their role as working women, and describes the benefits of college life.The second article is a 77-sentence popular science magazine article about the Magellanspace probe exploring Venus. When using the super-categories, the labeler avoids grosslyinappropriate labels such as “mollusk genus” and “goddess” in the Magellan article, andcombines categories such as “layer”, “natural depression”, and “rock stone” into the onesuper-category “land terra firma”.
Looking again at the longer texts of theUnited States Constitution andGenesiswe see inFigure 4.7 that the super-categories are more general and less redundant than the categoriesshown in Table 4.4. (Although the high scores for the “breads” category seems incorrect,even though the term “bread” occurs 25 times in Genesis.) In some cases the user mightdesire more specific categories; this experiment suggests that the labeler can generate topiclabels at multiple levels of granularity.
Section 4.4 evaluates the results of assigning topics based on the supercategories; how-ever we have not rigorously compared the supercategories against the original categories.
4.6 ConclusionsThis chapter has presented an algorithm that automatically assigns multiple main topic
categories to texts, based on computing the posterior probability of the topic given itssurrounding words, without requiring pre-labeled training data or heuristic rules. The algo-rithm significantly outperforms a baseline measure and approaches the levels of inter-indexerconsistency displayed by nonprofessional human indexers. The chapter also describes theconstruction of a general category set from a hand-built lexical hierarchy. The structureof the WordNet hyponym hierarchy is large and uneven; the bracketing algorithm pro-vides a simple and effective way to automatically subdivide it. The algorithm that usesWordSpace to combine distant parts of the hierarchy is partially effective, but requires amanual postprocessing pass.
The categorization algorithm is effective on texts that have strong thematic discussions,but many kinds of improvements and alternatives remain to be explored. If a documentcontains terms which are members of small categories, or categories whose terms occur onlyrarely, then the algorithm erroneously assigns too much weight to these rarer senses. Ananalysis of the terms whose weights are most strongly associated with each category wouldbe useful for analyzing how to fix this problem. Finally, because the goal of the algorithmis to allow assignment of multiple categories to documents, in the cases in which severalcategories have significant overlap in meaning, e.g., reptiles and birds, the algorithm tendsto assign both categories to the document, even though a human indexer usually would not.
Fisher (1994) has performed a series of experiments that compare variations of thisalgorithm. Preliminary results indicate that using direct counts of category membershipcan improve the results.
It would be interesting to try the training loop idea in which the output of TextTilingis used as input to the category training algorithm, and so on, improving both algorithms

CHAPTER 4. MAIN TOPIC CATEGORIES 93
simultaneously. This is an area for future work.

CHAPTER 4. MAIN TOPIC CATEGORIES 94
t i m e
h o n o r a b l e n e s s
d i s h o n o r a b l e n e s s
c h r
c i a l _ l a n g u a g e
m
r c i a l _ d o c u m e n t
e g a l _ d o c u m e n t
d o c u m e n t
f a l s e h o o d
c o m p a s s _ p o i n t
d i r e c t i o n
o n t h
t i m e _ p e r i o d
s c o m b r o i d
u i s i t i o n
t r a v e l
a t h l e t i c _ g a m e
s p o r t
s t r o k e
c r i m e
d i s h o n e s t y
o i n g
c o n s u m p t i o n
a t t a c k
o p e r a t i o n
l _ e n t e r p r i s e
m a n a g e m e n t d u e _ p r o c e s s
v e _ u n i t
a d m i n i s t r a t o r
c r i m i n a l
a t h l e t e
c o n t e s t a n t
l a w m a n
c o m b a t a n t
o n
m i l i t a r y _ o f f i c e r
m a n
s k i l l e d _ w o r k e r
a i r c r a f t
w i n e
a l g a
c o u r s e
d i s h
c a n d y d a i n t y
p a s t r y c o o k i e
c a k e
q u i c k _ b r e a d
b r e a d
cu t
m e a t
s e a _ f i s h
s h e l l f i s h
s e a f o o d
a l i m e n t
f i n c h
g a l l i n a c e o u s _ b i r d
c o l u b r i d _ s n a k e
a q u a t i c _ m a m m a l b a t
h o r s e
m o n k e y
s o f t - f i n n e d _ f i s h
t e l e o s t _ f i s h
f i sh
c r u s t a c e a n b i v a l v e
m o l l u s k
i n v e r t e b r a t e
a p p r a i s a l
g u n
w e a p o n r y
n g e m e n t
m o t o r _ v e h i c
b o a t
w a r s h i p
w h e e
v e h i c l e
c o n v e y a n c
m o t o r
s p o r t s _ e q u i p m e
e a t
s p o r t s _ i m p l e m
b r i d g e
b e a m
c o n d u i t
r o a d
s i d e
A s c o m y c e t e
a s s e m b l y
C
T r i c h o l o m a t a c e a e
v i n e f r u i t _ t r e e
t r e e
s h r u b
w o o
b e v e r a g e
p h y l u m
G r a m i n e a e
P i
m a i n
t e r n a l _ b o d y _ p a r t
o v u l e
l a n
r a c e
c o n t e s t
f ru i t
l e g u m e
f o o d s t u
f o o d
i ns t i t u t i on
w a t e r
l i qu id
m i l i t a r y_un i t
f o r c e
l i ne
l i ne s u r f a c e
r a t e
d i v i s i o n
Figure 4.5: A piece of the category network. The grouping algorithm finds relatednessbetween categories that are near one another in WordNet (e.g., the food terms) as well ascategories that are far apart (e.g., “sports equipment” with “athlete”).

CHAPTER 4. MAIN TOPIC CATEGORIES 95
Raisa Gorbachev articleOriginal Categories Super-Categories
0 woman adult female social standing1 status social state education2 man adult male politics3 political orientation ideology legal system4 force personnel people5 charge psychological state6 relationship socializing7 fear social group8 attitude personal relationship9 educator pedagogue government
Magellan space probe articleOriginal Categories Super-Categories
0 celestial body heavenly body outer space1 mollusk genus light and energy2 electromagnetic radiation atmosphere3 layer (surface) land terra firma4 atmospheric phenomenon physics5 physical phenomenon arrangement6 goddess shapes7 natural depression depression water and liquids8 rock stone properties9 space (hole) amounts
Figure 4.6: Comparison of original and super categories.

CHAPTER 4. MAIN TOPIC CATEGORIES 96
United States ConstitutionOriginal Categories Super-Categories
0 assembly (court, legislature) legal system1 due process of law government2 legal document legal instrument politics3 administrative unit conflict4 body (legislative) crime5 charge (taxes) finance6 administrator decision maker social standing7 document written document honesty8 approval (sanction, pass) communication
GenesisOriginal Categories Super-Categories
0 deity divinity god religion1 relative relation (mother, aunt) breads2 worship mythology3 man adult male people4 professional social outcasts5 happiness gladness felicity social group6 woman adult female psychological state7 evildoing transgression personality8 literary composition literature
Figure 4.7: Comparison of original and super categories for two well-known texts.

97
Chapter 5
Multiple Main Topics in InformationAccess
5.1 IntroductionIn this Chapter I address some issues relating to display of results of retrieval from full-
text collections. I claim that displaying query results in terms of inter-document similarityis inappropriate with long texts, and suggest instead assigning categories that correspondto documents’ main topics. I argue that main topics of long texts should be representedby multiple categories, since in many cases one category cannot adequately classify a text.The display makes use of the automatic categorization algorithm described in Chapter 4.I introduce Cougar, a browsing interface that presents a simple mechanism for displayingmultiple category information.
An increasingly important concern to information access is that of passage retrievalfrom full-text document collections. Full-length expository texts can be thought of in termsof a sequence of subtopical discussions tied together by one or more main topic discussions(see Chapter 3). Two different passages, both of which share terms with a query, mayoriginate in documents with entirely different main topic discussions. For example, Figure5.1 shows a sketch in which three different passage-level discussions of volcanic activitytake place in three different main topic contexts (exploration of Venus, Roman history, andthe eruption of Mt. St. Helens). Users should receive some indication of the contexts fromwhich a set of retrieved passages originated in order to decide which passages are worthfurther scrutiny.
In the text retrieval scenario of retrieval of passages from long texts it is important tosupply the user with information that places the results in a meaningful context. Mostexisting approaches to display of retrieval results can be characterized in two ways: all ofthe returned documents are displayed either (i) according to their overall similarity to oneanother, or (ii) in terms of user-selected keywords or attributes they are associated with. Isuggest an alternative viewpoint with the following characteristics:

CHAPTER 5. MULTIPLE MAIN TOPICS IN INFORMATION ACCESS 98
Explorationof Venus
RomanHistory
Mt. St. Helens
volcanicactivity
volcanicactivity
volcanicactivity
Figure 5.1: Retrieval of passages from full-length text: the contexts in which the localizeddiscussions take place may be entirely different from one another.
The documents’ contents are represented by multiple independent attributes thatcharacterize the main topics of the text.
The system displays all and only the attributes or topics that are assigned as a resultof the query, as opposed to displaying documents that meet pre-selected attributes.
The system allows display of interactions among the attributes.
The next section expands on the discussion of related work and explains the drawbacksof the two most common retrieval display options with respect to passage retrieval anddataset familiarization. Section 5.3 presents an alternative approach which makes use ofcategory information in order to indicate the main topic discussions of texts. Section 5.4summarizes the chapter.
5.2 Current ApproachesTextual information does not conform to the expectations of sophisticated display
paradigms, such as those seen in the Information Visualizer (Robertson et al. 1993). Thesetechniques either require the input to be structured (e.g., hierarchical, for the Cone Tree) orscalar along at least one dimension (e.g., for the Perspective Wall). However, the aspectsof a document that satisfy these criteria (e.g., a timeline of document creation dates) do notilluminate the actual content of the documents.

CHAPTER 5. MULTIPLE MAIN TOPICS IN INFORMATION ACCESS 99
The simplest approach to displaying retrieval results is, of course, to list the titles orfirst lines of the retrieved documents. One alternative, the TileBar display, is described inChapter 3. Other systems that do more than this can be characterized as performing one oftwo functions:
(1) Displaying the retrieved documents according to their overall similarity to otherretrieved documents, and/or
(2) Displaying the retrieved documents in terms of keywords or attributes pre-selectedby the user.
Both of these approaches, and their drawbacks, are discussed in the subsections thatfollow.
5.2.1 Overall Similarity ComparisonSeveral systems display documents in what can be described as a similarity network. A
focus document, usually one that the user has expressed interest in, is shown as a node in thecenter of the display, and documents that are similar to the focus document are represented asnodes linked by edges surrounding the focus document node. Here similarity is measuredin terms of the vector space model or a probabilistic model’s measure of probability ofrelevance.
Systems of this kind include the Bead system (Chalmers & Chitson 1992), whichdisplays documents according to their similarity in a two-dimensional rendition of multi-dimensional document space, I3R (Thompson & Croft 1989) and the system of Fowler et al.(1991), which display retrieved documents in networks based on interdocument similarity.
A different way to display documents according to their inter-similarity is to clusterthe results of the retrieval and make visible the cluster centroids and the distance of thedocuments from each centroid. Scatter-Gather (Cutting et al. 1992), (Cutting et al. 1993) isan innovative, query-free browsing technique that allows users to become familiar with thecontents of a corpus by interactively clustering subparts of the collection to create table-of-contents-like descriptions. This technique is very effective on shorter texts but, as arguedbelow, will probably be less effective on collections of longer texts. Additionally, Scat-ter/Gather emphasizes query-free browsing, although it could be augmented with Booleanand similarity search.
Drawbacks of Comparing Full-Length Texts
Most (non-Boolean) information retrieval systems use inter-document similarity tocompare documents to a query and determine their relevance. For example, the vector spacemodel of similarity search (Salton 1988), clustering, e.g., (Cutting et al. 1992), (Griffithset al. 1986), and latent semantic indexing for determining inter-document similarity, e.g.,
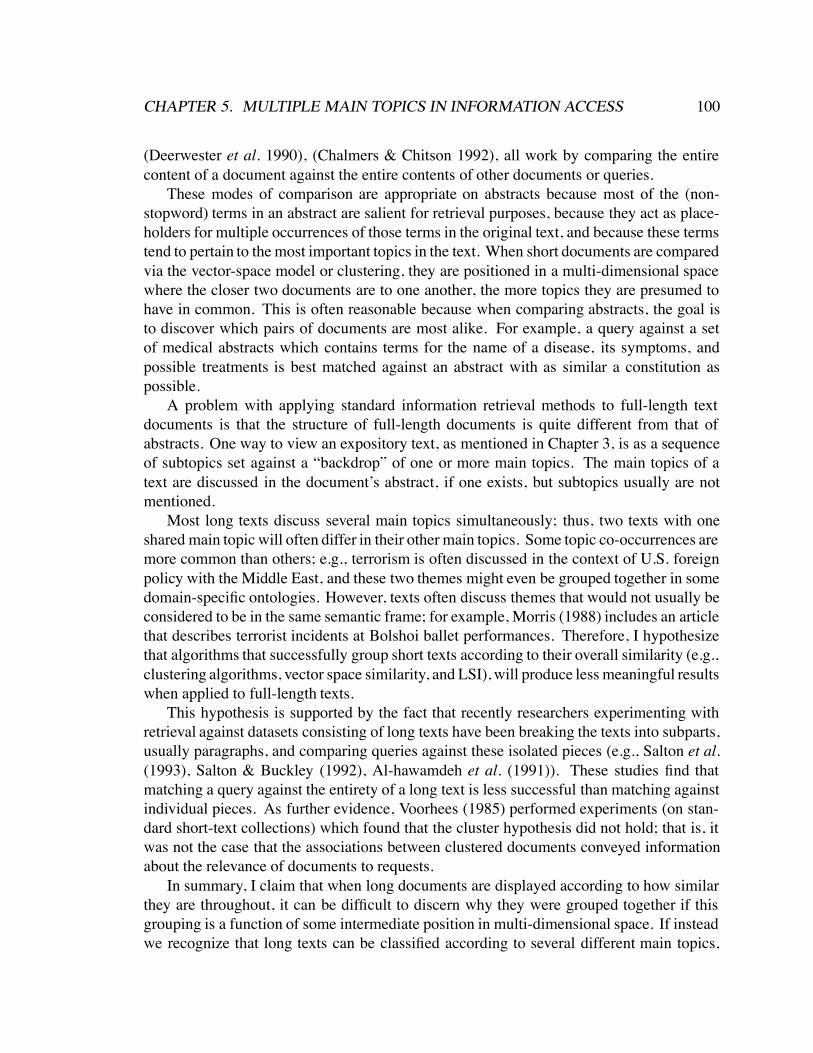
CHAPTER 5. MULTIPLE MAIN TOPICS IN INFORMATION ACCESS 100
(Deerwester et al. 1990), (Chalmers & Chitson 1992), all work by comparing the entirecontent of a document against the entire contents of other documents or queries.
These modes of comparison are appropriate on abstracts because most of the (non-stopword) terms in an abstract are salient for retrieval purposes, because they act as place-holders for multiple occurrences of those terms in the original text, and because these termstend to pertain to the most important topics in the text. When short documents are comparedvia the vector-space model or clustering, they are positioned in a multi-dimensional spacewhere the closer two documents are to one another, the more topics they are presumed tohave in common. This is often reasonable because when comparing abstracts, the goal isto discover which pairs of documents are most alike. For example, a query against a setof medical abstracts which contains terms for the name of a disease, its symptoms, andpossible treatments is best matched against an abstract with as similar a constitution aspossible.
A problem with applying standard information retrieval methods to full-length textdocuments is that the structure of full-length documents is quite different from that ofabstracts. One way to view an expository text, as mentioned in Chapter 3, is as a sequenceof subtopics set against a “backdrop” of one or more main topics. The main topics of atext are discussed in the document’s abstract, if one exists, but subtopics usually are notmentioned.
Most long texts discuss several main topics simultaneously; thus, two texts with oneshared main topic will often differ in their other main topics. Some topic co-occurrences aremore common than others; e.g., terrorism is often discussed in the context of U.S. foreignpolicy with the Middle East, and these two themes might even be grouped together in somedomain-specific ontologies. However, texts often discuss themes that would not usually beconsidered to be in the same semantic frame; for example, Morris (1988) includes an articlethat describes terrorist incidents at Bolshoi ballet performances. Therefore, I hypothesizethat algorithms that successfully group short texts according to their overall similarity (e.g.,clustering algorithms, vector space similarity, and LSI), will produce less meaningful resultswhen applied to full-length texts.
This hypothesis is supported by the fact that recently researchers experimenting withretrieval against datasets consisting of long texts have been breaking the texts into subparts,usually paragraphs, and comparing queries against these isolated pieces (e.g., Salton et al.(1993), Salton & Buckley (1992), Al-hawamdeh et al. (1991)). These studies find thatmatching a query against the entirety of a long text is less successful than matching againstindividual pieces. As further evidence, Voorhees (1985) performed experiments (on stan-dard short-text collections) which found that the cluster hypothesis did not hold; that is, itwas not the case that the associations between clustered documents conveyed informationabout the relevance of documents to requests.
In summary, I claim that when long documents are displayed according to how similarthey are throughout, it can be difficult to discern why they were grouped together if thisgrouping is a function of some intermediate position in multi-dimensional space. If insteadwe recognize that long texts can be classified according to several different main topics,

CHAPTER 5. MULTIPLE MAIN TOPICS IN INFORMATION ACCESS 101
and contain as well a sequence of subtopical discussions, we have a new basis on which todetermine in what ways long documents are similar to one another. This chapter focusesonly on accounting for main topic information; the recognition of subtopic structure forinformation retrieval is a problem unto itself and is discussed in Chapter 3.
5.2.2 User-specified AttributesMany systems show the relation of the contents of the texts to user-selected attributes;
these include VIBE (Korfhage 1991), the InfoCrystal (Spoerri 1993), the Cube of Contents(Arents & Bogaerts 1993), and the system of Aboud et al. (1993).
These systems require the users to select which the classifications the display shouldbe organized around. The goal of VIBE (Korfhage 1991) is to display the contents of theentire document collection in a meaningful way. The user defines N “reference points”(which can be weighted terms or term weights) which are placed in various positions in thedisplay, and a document icon is drawn in a location that indicates the distance between thedocument and all the relevant reference points.
Two interesting graphical approaches are the InfoCrystal and the Cube of Contents.The InfoCrystal (Spoerri 1993) is a sophisticated interface which allows visualization of allpossible relations among N attributes. The user specifies which N concepts are of interest(actually Boolean keywords in the implementation, but presumably any kind of labelinginformation would be appropriate) and the InfoCrystal displays, in an ingenious extensionof the Venn-diagram paradigm, the number of documents retrieved that have each possiblesubset of the N concepts. When the query involves more than four terms the crystals becomerather complicated, although there is a provision to build up queries hierarchically. Figure5.2 shows a sketch of what the InfoCrystal might display as the results of a query againstfour keywords or Boolean phrases, labeled A, B, C, and D. The diamond in the centerindicates that one document was discovered that contains all four keywords. The trianglemarked with “12” indicates that twelve documents were found containing attributes A, B,and D, and so on.
The Cube of Contents of (Arents & Bogaerts 1993) is used to help a user build a query byselecting values for up to three mutually exclusive attributes (see Figure 5.3). This assumesa text pre-labeled with relevant information and an understanding of domain-dependentstructural information for the document set. Note that this is used to specify the queryalthough it could be used to characterize retrieval results as well. Note that only oneintersection of two or three attributes is viewable at any time.
The system of Aboud et al. (1993), allows the user to specify multiple class criteria,where the classes are specified in a hierarchy, to help narrow or expand the search set.
The limitations with these approaches are:
(3a) The attributes in question are simply the keywords the user specified in the query,and so do not add information about the contents of the texts retrieved, and/or
(3b) The user must expend effort to choose the attributes to be displayed, and/or

CHAPTER 5. MULTIPLE MAIN TOPICS IN INFORMATION ACCESS 102
A B
C D
1
2 12
222
84 90
4442295 12818
2942612
6
127
8490
234
2846 13623
862 3424
Figure 5.2: The InfoCrystal (Spoerri 1993).
(3c) The user might select attributes that do not correspond to the retrieved documents,thus undercutting the goal of supplying information about the documents returned inresponse to a general query.
These problems can be easily remedied; the point here is that the standard goal of suchsystems is to facilitate query construction with attribute information, rather than enhancingdisplay of retrieval results. Note, however, that none of these display paradigms can impartthe term distribution information that TileBars do (see Chapter 3).
To summarize this section, previous approaches to displaying retrieval results eitherdisplay documents in terms of their overall similarity to one another, in terms of similarityto clusters formed from the corpus or the retrieval set, or in terms of attributes preselectedby the user. I have discussed problems with each of these approaches. The next sectionpresents an alternative in which these drawbacks are eliminated.
5.3 Multiple Main Topic DisplayAs mentioned in the Section 5.1, I propose an approach in which multiple independent
categories are assigned to the “main topics” of each document1. I emphasize the importanceof displaying all and only the attributes that are actually assigned to retrieved documents,rather than requiring the user to specify in advance which topics are of interest. Thiscircumvents problems arising from erroneous guesses and reduces the mental effort required
1In this discussion, the terms attribute, topic, and category are interchangeable.
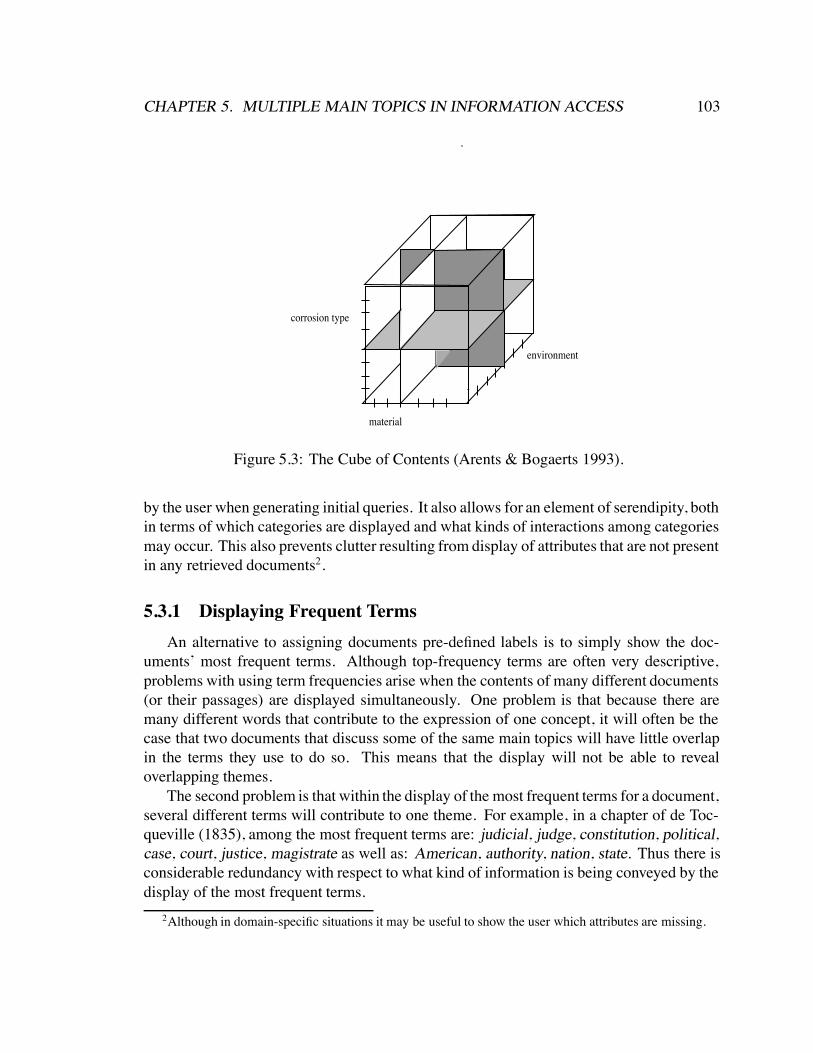
CHAPTER 5. MULTIPLE MAIN TOPICS IN INFORMATION ACCESS 103
corrosion type
material
environment
Figure 5.3: The Cube of Contents (Arents & Bogaerts 1993).
by the user when generating initial queries. It also allows for an element of serendipity, bothin terms of which categories are displayed and what kinds of interactions among categoriesmay occur. This also prevents clutter resulting from display of attributes that are not presentin any retrieved documents2.
5.3.1 Displaying Frequent TermsAn alternative to assigning documents pre-defined labels is to simply show the doc-
uments’ most frequent terms. Although top-frequency terms are often very descriptive,problems with using term frequencies arise when the contents of many different documents(or their passages) are displayed simultaneously. One problem is that because there aremany different words that contribute to the expression of one concept, it will often be thecase that two documents that discuss some of the same main topics will have little overlapin the terms they use to do so. This means that the display will not be able to revealoverlapping themes.
The second problem is that within the display of the most frequent terms for a document,several different terms will contribute to one theme. For example, in a chapter of de Toc-queville (1835), among the most frequent terms are: judicial, judge, constitution, political,case, court, justice, magistrate as well as: American, authority, nation, state. Thus there isconsiderable redundancy with respect to what kind of information is being conveyed by thedisplay of the most frequent terms.
2Although in domain-specific situations it may be useful to show the user which attributes are missing.
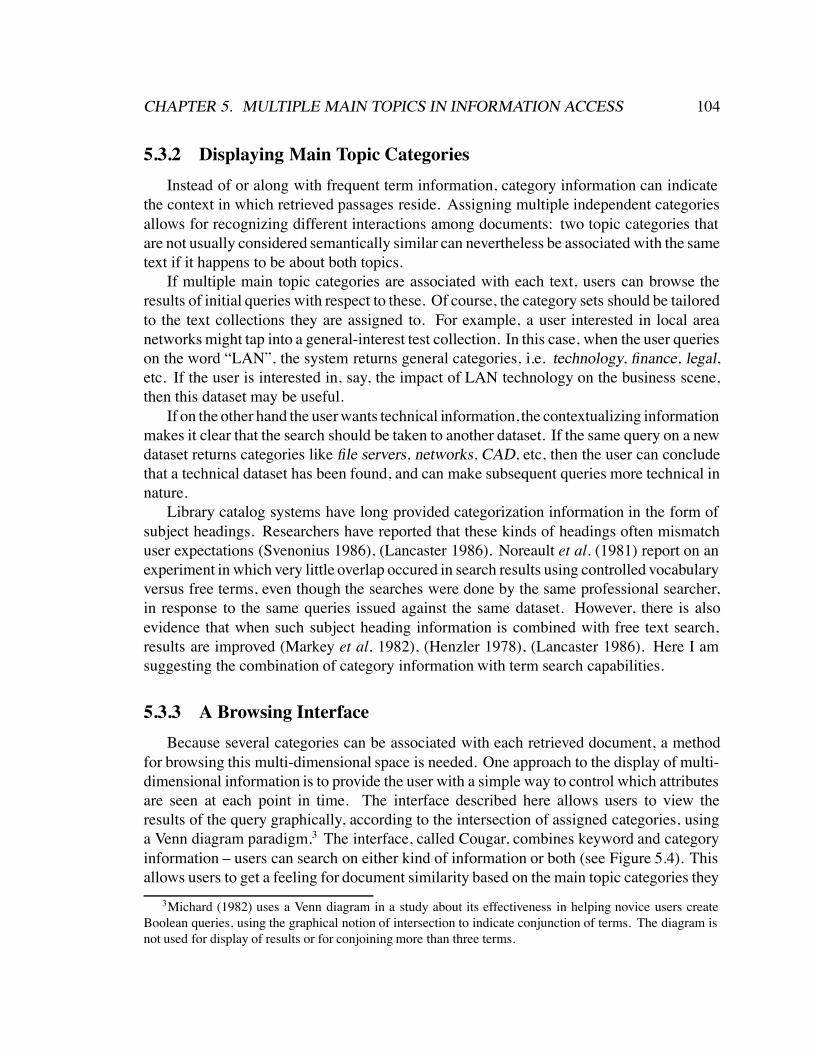
CHAPTER 5. MULTIPLE MAIN TOPICS IN INFORMATION ACCESS 104
5.3.2 Displaying Main Topic CategoriesInstead of or along with frequent term information, category information can indicate
the context in which retrieved passages reside. Assigning multiple independent categoriesallows for recognizing different interactions among documents: two topic categories thatare not usually considered semantically similar can nevertheless be associated with the sametext if it happens to be about both topics.
If multiple main topic categories are associated with each text, users can browse theresults of initial queries with respect to these. Of course, the category sets should be tailoredto the text collections they are assigned to. For example, a user interested in local areanetworks might tap into a general-interest test collection. In this case, when the user querieson the word “LAN”, the system returns general categories, i.e. technology, finance, legal,etc. If the user is interested in, say, the impact of LAN technology on the business scene,then this dataset may be useful.
If on the other hand the user wants technical information, the contextualizing informationmakes it clear that the search should be taken to another dataset. If the same query on a newdataset returns categories like file servers, networks, CAD, etc, then the user can concludethat a technical dataset has been found, and can make subsequent queries more technical innature.
Library catalog systems have long provided categorization information in the form ofsubject headings. Researchers have reported that these kinds of headings often mismatchuser expectations (Svenonius 1986), (Lancaster 1986). Noreault et al. (1981) report on anexperiment in which very little overlap occured in search results using controlled vocabularyversus free terms, even though the searches were done by the same professional searcher,in response to the same queries issued against the same dataset. However, there is alsoevidence that when such subject heading information is combined with free text search,results are improved (Markey et al. 1982), (Henzler 1978), (Lancaster 1986). Here I amsuggesting the combination of category information with term search capabilities.
5.3.3 A Browsing InterfaceBecause several categories can be associated with each retrieved document, a method
for browsing this multi-dimensional space is needed. One approach to the display of multi-dimensional information is to provide the user with a simple way to control which attributesare seen at each point in time. The interface described here allows users to view theresults of the query graphically, according to the intersection of assigned categories, usinga Venn diagram paradigm.3 The interface, called Cougar, combines keyword and categoryinformation – users can search on either kind of information or both (see Figure 5.4). Thisallows users to get a feeling for document similarity based on the main topic categories they
3Michard (1982) uses a Venn diagram in a study about its effectiveness in helping novice users createBoolean queries, using the graphical notion of intersection to indicate conjunction of terms. The diagram isnot used for display of results or for conjoining more than three terms.

CHAPTER 5. MULTIPLE MAIN TOPICS IN INFORMATION ACCESS 105
share. Note that different documents can be grouped together as being similar based onwhich categories are being looked at. E.g., if one document is about the cost of removingcontaminants from food and another the cost of removing contaminants from an ecologicaldisaster, when viewed according to the finance category they have an intersection, whereasif the finance category is not selected, the two documents do not appear to have similarities.
This particular cut on how to display information begins with a fixed set of categories,membership in which is designed to correspond to users’ intuitions. Of course this approachis flawed, both because no one set of category choices is going to fit every document set andbecause users will have to guess what categorization according to the topic really means.Nevertheless, I posit that this approach is better than requiring the user to guess why a groupof long documents have been labeled as being similar to one another, and better than simplylooking at a list of titles ranked by vector-space based similarity to the query. Furthermore,since users do not have to specify in advance which categories are of interest, they are lesslikely to miss interesting documents just because their understanding of the classificationprocedure is inaccurate.
In Cougar, documents are assigned a fixed number of categories from a pre-determinedset using the automatic categorization algorithm described in Chapter 4. In the currentsystem each document is assigned its three top-scoring categories. The documents are thenindexed on the category information as well as on all (non-stopword) lexical items from thetitle and the body. Indexing and retrieval is currently done using Cornell’s Smart system(Salton 1971), although this will soon change to the indexing structure used in Chapter 3(Section 3.4.3). The interface was created using Tcl/Tk (Ousterhout 1991).
Two datasets have been assigned categories and indexed. The first is a subset of acollection of AP news articles taken from month of 1989 from the TIPSTER collection(Harman 1993) and is indexed with the general category set described in Chapter 4. Thesecond is a collection of computer science technical reports, part of the CNRI CS-TR projectcollection, and is indexed with computer-related categories.
Users issue queries by entering words or selecting categories from an available list. Asmentioned above, typically the user only enters term information. After the user initiates thesearch a list of titles of the top-scoring documents appears. The number of titles displayedis a parameter that is set in Smart; currently 50 documents are retrieved at a time. Thetop three categories for each document are also retrieved and the most frequently occurringof these are displayed in a bank of color-coded buttons above a Venn diagram skeleton.The user selects up to three of the categories and sees how the documents intersect withrespect to those categories. One category can be unselected in order to allow the selectionof another; the display of documents in the Venn diagram changes accordingly.
More specifically, the user selects one of the categories by mouse-clicking on a categorybox. The system paints one of the Venn-diagram rings with the corresponding color andplaces document ID numbers that have been assigned this category into the part of the ringthat indicates no intersection with other categories. Clicking on an ID number causes thecorresponding title to be highlighted, and double-clicking brings up a window containingthe document itself. The user can now unselect this category, causing the ring to become
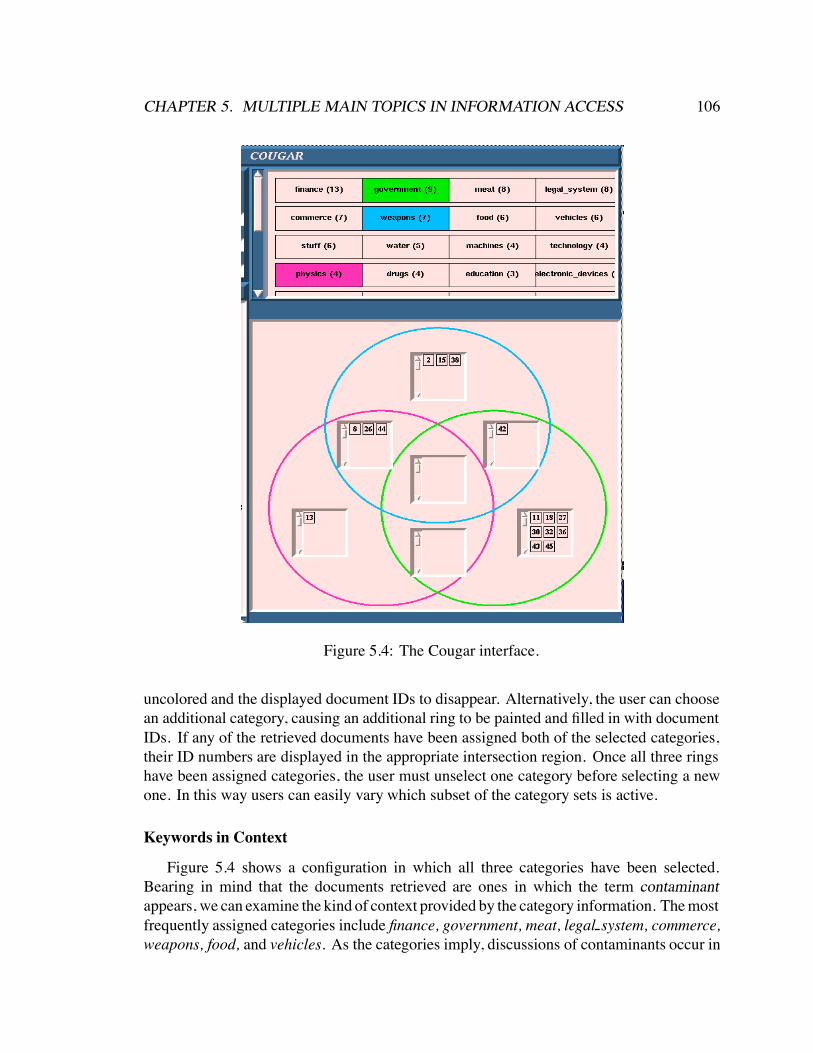
CHAPTER 5. MULTIPLE MAIN TOPICS IN INFORMATION ACCESS 106
Figure 5.4: The Cougar interface.
uncolored and the displayed document IDs to disappear. Alternatively, the user can choosean additional category, causing an additional ring to be painted and filled in with documentIDs. If any of the retrieved documents have been assigned both of the selected categories,their ID numbers are displayed in the appropriate intersection region. Once all three ringshave been assigned categories, the user must unselect one category before selecting a newone. In this way users can easily vary which subset of the category sets is active.
Keywords in Context
Figure 5.4 shows a configuration in which all three categories have been selected.Bearing in mind that the documents retrieved are ones in which the term contaminantappears, we can examine the kind of context provided by the category information. The mostfrequently assigned categories include finance, government, meat, legal system, commerce,weapons, food, and vehicles. As the categories imply, discussions of contaminants occur in

CHAPTER 5. MULTIPLE MAIN TOPICS IN INFORMATION ACCESS 107
many different contexts.Document 42, at the intersection of government and weapons, discusses a government
proposal to cleanup a nuclear weapons production complex. Documents 8, 26, and 44, at theintersection of physics and weapons, discuss the reopening of a plutonium processing plant,obstacles to the development of orbiting nuclear reactors, and modernization of nuclearreactors. Document 13 describes a nuclear waste leak, document 38 the risks of the launchof a satellite containing plutonium, and document 30 discusses the Reagan administration’srecord in treating the ozone layer.
One article labeled with ships, bodies of water, and nature describes the effects of anoil spill on birdlife. Articles labeled with the food category include two about an incidentof cyanide poisoning in yogurt. Note that if a user were interested in documents that talkabout contamination in food, in order to discover this article using keywords alone, the userwould have had to specify all food terms of interest. However, with appropriate categoryinformation this is not necessary.
Categories to Determine Relevance of Keywords
In the next example, only eight of the top fifty retrieved documents in response to aquery on the word cattle are labeled with the higher-level category that corresponds to cattle(herd animals). Most of those that are not labeled with herd animals are about financialmatters relating to crops and foods (e.g., crop futures). Two of those that are labeledwith herd animals, when intersected with meat describe cattle in the role of livestock, thethird describes a cattle drive, and the fourth, whose other category labels are countries andbodies of water, has only a passing reference to cattle and really describes a murder relatedto land ownership of tropical rainforests.
By contrast, retrieving on the word cow results in articles about land disputes withNative Americans (at the intersection of government, herd animals, and legal system) andgrazing fees. One document that is not labeled with herd animals but instead with crime,weapons, and defense, has only a passing reference to cows and is about a robbery.
Thus the categories can be used to show whether or not a search term is actually well-represented in a text. If the text is not assigned the category that the search time is a memberof, then this is a strong indicator that the term is only discussed in passing.
The set of 106 general categories used to characterize the AP data was derived fromWordNet (Miller et al. 1990) as described in Chapter 4. The algorithm has also been trainedon a collection of computer science technical reports using a set of 11 categories derivedfrom a loose interpretation of the ACM Computing Reviews classifications.
5.3.4 DiscussionThe AIR/SCALIR system (Rose & Belew 1991) has an interface that most closely
incorporates the goals set forth here. The system allows for very simple queries, andprovides a kind of contextualizing information. A connectionist network determines in

CHAPTER 5. MULTIPLE MAIN TOPICS IN INFORMATION ACCESS 108
advance a set of terms that characterize documents from a collection of bibliographicrecords. When the user issues a query, the system retrieves documents that contain theterms of the query (restricting the number of documents that are displayed at any onetime). Additional terms that are strongly associated with the retrieved documents are alsoretrieved. The system displays three rows of nodes corresponding to the associated terms, thedocuments, and the authors of the documents, respectively. The term nodes are connectedto the document nodes via edge links, so the user can see which documents are associatedwith each important term. Only those terms relevant to the retrieved documents are shown,although the documents retrieved are influenced to some extent by which associated termsare retrieved. Figure 5.6 is a sketch of the interface’s output when presented with the query((:TERM “ASSOCIATIVE”)(:AUTH “ANDERSON, J.A.”)).
PARALL
EL
MEM
ORY
ASSOCIA
TI
MODEL
INFO
RMATI
NETW
ORK
PROCES
SIN
SELE
CTIV
NEURON
ANDERSON
HINTON
MOZER
BAR99 WIC69 WIL81 FIN79 AND81 HIN84 AND81 BAR81 KOH81
CATEGORIZ
Figure 5.6: A sketch of the AIR system interface (Rose & Belew 1991).
The AIR interface differs from that suggested here in that it is not geared towarddisplaying subsets of interacting attributes. For this reason, it appears that if there area large number of links between associated terms and documents, or if the links are notneatly organized, the relationships will be difficult to discern. Furthermore, categorizinginformation is not geared toward characterizing full-text documents. However, the approachpresented here might benefit by incorporating an option to display the categories anddocuments in a similar manner.
Similarly, rather than using a Venn diagram display, the four-attribute InfoCrystal (Spo-erri 1993) might be a useful alternative, applied as suggested here to display subsets of therelevant categories.

CHAPTER 5. MULTIPLE MAIN TOPICS IN INFORMATION ACCESS 109
5.4 ConclusionsA full-fledged information access system should consist of several different tools for
query formulation, document indexing, dataset selection, and characterization of retrievalresults. I have described an information access situation – passage retrieval from full-lengthtexts – in which users can benefit from an interface that displays information about the maintopic contexts of the retrieved documents.
Users requesting passages from long texts do not know the contexts from which thepassages were extracted. Existing approaches either (i) show how similar documents areto one another or the query, or (ii) require users to specify terms or attributes to organizethe resulting documents around. I have described problems with both approaches andsuggested that retrieval results be displayed in terms of multiple independent attributesthat characterize the main topics of the texts, and that the system volunteer display of therelevant attributes, rather than require the user to guess them.
The attributes or categories can vary depending on what kind of information is availableand/or appropriate for the corpus. I have suggested assigning categories that characterize themain topics of long texts, and have described an algorithm that can do so with some degreeof success without requiring pre-labeled texts. I anticipate improvement in automatedcategory assignment algorithms in future.
A consequence of allowing multiple categories to be assigned to documents is that theymake the display problem a multi-dimensional one. To handle this, I suggest a mechanismthat gives the user some control over which categories are at the focus of attention at anygiven time, and a simple way to see how the retrieved documents are related to one anotherwith respect to these categories.
I have implemented a prototype of this display paradigm; it illustrates the main pointsbehind the ideas presented here although user evaluation studies remain to be done. Infuture I plan to incorporate these mechanisms into an interface for for querying againstsubtopic structure, and for allowing queries to specify subtopic terms with respect to maintopic categories, like that described in Section 3.
Although I have not formally evaluated the Cougar display, anecdotal user reaction ispositive. Users find appealing the ability to switch among the category assignments and seethe resulting topic intersections. When the topic assignments are incorrect, however, thetool is probably worse than no tool at all. Furthermore, the highest-ranked categories for adocument are those that are similar in meaning. This detracts from the goal of showing theinteraction of the disparate main topics. Thus an improved category assignment algorithmshould improve the appeal of the tool.

110
Chapter 6
Conclusions and Future Work
In this dissertation I have introduced new ways to view and analyze the structure offull-text documents. I have investigated the role of contextual information in the automatedretrieval and display of full-text documents, using computational linguistics algorithms toautomatically detect structure in and assign topic labels to texts. I have shown how, forthe purposes of information access, full texts are qualitatively different from abstracts, andhave suggested that as a consequence, full text requires new approaches to informationaccess. As a first step, I have suggested the examination of patterns of term distributionin long texts, and have shown how these patterns are useful both for recognizing subtopicstructure and for describing the results of a query. I have also argued, following Cuttinget al. (1990), that the mechanisms for querying and displaying documents should receiveas much attention as the retrieval algorithm, and that all three components should mutuallyreinforce one another.
I have described an algorithm, called TextTiling, that uses lexical frequency and distri-bution to identify the subtopic structure of expository texts. The currently most successfulversion of this algorithm requires only a short stoplist and a morphological analyzer andanalyzes about 20 megabytes of text an hour (including tokenization). I have also describedan algorithm that assigns multiple main topic categories to long texts. This algorithmrequires a pre-defined category set and a training run but does not require pre-labeled texts,which are much harder to come by than category sets. Both algorithms are comparedagainst reader judgments and are found to perform well, although not flawlessly, on theseapproximate tasks.
I have also presented a framework for the interpretation of query term distributionpatterns within full text documents. This analysis leads to a new interface paradigm, calledTileBars, that provides a compact and informative iconic representation of the documents’contents with respect to the query terms. TileBars allow users to make informed decisionsabout not only which documents to view, but also which passages of those documents, basedon the distributional behavior of the query terms in the documents. I have demonstrated theuse of TileBars in an analysis of some of the TREC queries (Harman 1993). In the courseof this analysis I showed that the patterns of term distributions for relevant documents can

CHAPTER 6. CONCLUSIONS AND FUTURE WORK 111
vary depending on the query. This supports my conjecture that the criteria upon whichranking is based should be shown explicitly in such a way that users can make informeddecisions about which documents to view. It also lends partial support to my hypothesesabout the meanings of various patterns of term distribution.
I have also described a new interface, called Cougar, that allows users to view retrieveddocuments according to multiple main topic assignments. Cougar has an appealing interac-tive component that allows users to see the main topic context in which retrieved documentsare used, providing them with information that can be missing in the TileBar display. Bothdisplay tools need to be integrated into one interface, along with other text analysis facilitiesto allow fast assimilation of the contents of retrieved information. Together, the represen-tation of main topic and subtopic structural information provides a powerful new paradigmfor interpreting the results of queries against full-text collections.
The TextTiling work introduces a new granularity of analysis for the text segmentationtask. Evidence for the usefulness of multi-paragraph segments is increasing, despite thefact that this is a nontraditional discourse unit. Aside from the use in information accessdescribed here, other potential applications of multi-paragraph segments are multiple-window text displays and text window identification for corpus-based natural languageprocessing algorithms.
This work should be extended in several directions. First, I plan to more formally testsome of the embellishments to the TextTiling algorithm. I am particularly interested intrying different ways to integrate thesaural terms into the algorithm (perhaps simply byusing a good online thesaurus, should one become generally available). I would also liketo improve the results in the cases in which the evidence for one paragraph boundary overanother is weak (e.g., when a valley in the similarity score plot falls within a paragraph,or when two short paragraphs are adjacent to one another near a valley). One approach isto try simple discourse cues; another is to make a more localized analysis of term overlapwhen the boundary choice is unclear. Still another alternative is to find a way to expresstile overlap, especially when transitions takes place mid-paragraph.
I would also like to formally compare TextTiles to paragraphs in some task. If tilesperform better, or for that matter, no worse than paragraphs in information access tasks,then tiles are preferable for the simple reason that they are less expensive to store andprocess simply because there are fewer tiles than paragraphs per document (if positionalinformation within tiles or paragraphs is not important).
I would also like to formally evaluate TileBars in terms of their use in relevance feedbackand with respect to how users interpret the meaning of the term distributions. The analysiscould compare user’s expectations about the meaning of the term distributions against theanalysis shown in the chart of Chapter 3. It may be useful to determine in what situationsthe users’ expectations are not met, in hopes of identifying what additional informationshould be added in order to prevent misconceptions.
Both display mechanisms described here should be extended to work with texts thatalready do have some hierarchical structure built in.
The information access community needs to develop a passage retrieval test collection.

CHAPTER 6. CONCLUSIONS AND FUTURE WORK 112
The examples and discussion in this dissertation suggest that such a collection should becognizant of issues relating to term distribution: relevance judgments should indicate whattopical or distributional role the query terms are to play within the retrieved documents.

113
Appendix A
Tocqueville, Chapter 1
The text ofDemocracy in America, by Alexisde Tocqueville, 1835, Volume 1 Chapter 1.
DOC SEGMENT 11 North America presents in its external form certain
general features which it is easy to distinguish at the first glance.2 A sort of methodical order seems to have regulated the
separation of land and water, mountains and valleys. A simple butgrand arrangement is discoverable amid the confusion of objectsand the prodigious variety of scenes.
3 This continent is almost equally divided into two vastregions. One is boundedon the north by the Arctic Pole, and on theeast and west by the two great oceans. It stretches towards the south,forming a triangle, whose irregular sides meet at length above thegreat lakes of Canada. The second region begins where the otherterminates, and includes all the remainder of the continent. Theone slopes gently towards the Pole, the other towards the Equator.
4 The territory included in the first region descendstowards the north with a slope so imperceptible that it may almostbe said to form a plain. Within the bounds of this immense leveltract there are neither high mountains nor deep valleys. Streamsmeander through it irregularly; great rivers intertwine, separate,and meet again, spread into vast marshes, losing all trace of theirchannels in the labyrinth of waters they have themselves created,and thus at length, after innumerable windings, fall into the Polarseas. The great lakeswhich boundthis first regionare not walled in,like most of those in the Old World, between hills and rocks. Theirbanks are flat and rise but a few feet above the level of their waters,each thus forming a vast bowl filled to the brim. The slightestchange in the structure of the globe would cause their waters torush either towards the Pole or to the tropical seas.
DOC SEGMENT 25 The second region has a more broken surface and is
better suited for the habitation of man. Two long chains of moun-tains divide it, from one to the other: one, named the Allegheny,follows the direction of the shore of the Atlantic Ocean; the otheris parallel with the Pacific.
6 The space that lies between these two chains of moun-tains contains228,843square leagues. Its surface is thereforeaboutsix times as great as that of France.
7 This vast territory, however, forms a single valley, oneside of which descends from the rounded summits of the Alleghe-nies, while the other rises in an uninterrupted course to the topsof the Rocky Mountains. At the bottom of the valley flows animmense river, into which you can see, flowing from all directions,the waters that come down from the mountains. In memory of their
native land, the French formerly called this river the St. Louis. TheIndians, in their pompous language, have named it the Father ofWaters, or the Mississippi.
DOC SEGMENT 38 The Mississippi takes its source at the boundary of the
two great regions of which I have spoken, not far from the highestpoint of the plateau that separates them. Near the same spot risesanother river, which empties into the Polar seas. The course of theMississippi is at first uncertain: it winds several times towards thenorth, whence it rose, and only at length, after having been delayedin lakes and marshes, does it assume its definite direction and flowslowly onward to the south.
9 Sometimes quietly gliding along the chalky bed thatnature has assigned to it, sometimes swollen by freshets, the Mis-sissippi waters over 1,032 leagues in its course. At the distance of600 leagues from its mouth this river attains an average depth of 15feet; and it is navigated by vessels of 300 tons for a course of nearly200 leagues. One counts, among the tributaries of the Mississippi,one river of 1,300 leagues, one of 900, one of 600, one of 500, fourof 200, not to speak of a countless multitide of small trams thatrush from all directions to mingle in its flow.
DOC SEGMENT 410 The valley which is watered by the Mississippi seems
to have been created for it alone, and there, like a god of antiquity,the river dispenses both good and evil. Near the stream naturedisplays an inexhaustible fertility; the farther you get from its banks,the more sparse the vegetation, the poorer the soil, and everythingweakens or dies. Nowhere have the great convulsions of the globeleft more evident traces than in the valley of the Mississippi. Thewhole aspect of the country shows the powerful effects of water,both by its fertility and by its barrenness. The waters of the primevalocean accumulated enormous beds of vegetable mold in the valley,which they leveled as they retired. Upon the right bank of the riverare found immense plains, as smooth as if the tiller had passedover them with his roller. As you approach the mountains, thesoil becomes more and more unequal and sterile; the ground is,as it were, pierced in a thousand places by primitive rocks, whichappear like the bones of a skeleton whose flesh has been consumedby time. The surface of the earth is covered with a granitic sandand irregular masses of stone, among which a few plants forcetheir growth and give the appearance of a green field covered withthe ruins of a vast edifice. These stones and this sand disclose,on examination, a perfect analogy with those that compose thearid and broken summits of the Rocky Mountains. The flood ofwaters which washed the soil to the bottom of the valley afterwardscarried away portions of the rocks themselves; and these, dashed

APPENDIX A. TOCQUEVILLE, CHAPTER 1 114
and bruised against the neighboring cliffs, were left scattered likewrecks at their feet.
11 The valley of the Mississippi is, on the whole, themost magnificentdwelling-place preparedby God for man’s abode;and yet it may be said that at present it is but a mighty desert.
12 On the eastern side of the Alleghenies, between thebase of these mountains and the Atlantic Ocean, lies a long ridgeof rocks and sand, which the sea appears to have left behind asit retired. The average breadth of this territory does not exceed48 leagues; but it is about 300 leagues in length. This part ofthe American continent has a soil that offers every obstacle to thehusbandman, and its vegetation is scanty and unvaried.
13 Upon this inhospitable coast the first united efforts ofhuman industry were made. This tongue of arid land was the cradleof those English colonies which were destined one day to becomethe United States of America. The center of power still remainshere; while to the west of it the true elements of the great peopleto whom the future control of the continent belongs are gatheringtogether almost in secrecy.
DOC SEGMENT 514 When Europeans first landed on the shores of the
West Indies, and afterwards on the coast of South America, theythought themselves transported into those fabulous regions of whichpoets had sung. The sea sparkled with phosphoric light, and theextraodinary transparency of its waters disclosed to the view of thenavigator all the depths of the ocean. Here and there appeared littleislands perfumed with odoriferous plants, and resembling basketsof flowers floating on the tranquil surface of the ocean. Everyobject that met the sight in this enchanting region seemed preparedto satisfy the wants or contribute to the pleasures of man. Almost allthe trees were loaded with nourishing fruits, and those which wereuseless as food delighted the eye by the brilliance and variety oftheir colors. In groves of fragrant lemon trees, wild figs, floweringmyrtles, acacias, and oleanders, which were hung with festoons ofvarious climbing plants, covered with flowers, a multitude of birdsunknownin Europe displayed their bright plumange, glittering withpurple and azure, and mingled their warbling with the harmony ofa world teeming with life and motion.
15 Underneath this brilliant exterior death was con-cealed. But this fact was not then known, and the air of theseclimates had an indefinable enervating influence, which made mancling to the present, heedless of the future.
16 North America appeared under a very different aspect:there everything was grave, serious, and solemn; it seemed createdto be the domain of intelligence, as the South was that of sensualdelight. A turbulent and foggy ocean washed its shores. It was girtround by a belt of granitic rocks or by wide tracts of sand. Thefoliage of its woods was dark and gloomy, for they were composedof firs, larches, evergreen oaks, wild olive trees, and laurels.
DOC SEGMENT 617 Beyond this outer belt lay the thick shades of the
central forests, where the largest trees which are produced in thetwo hemispheres grow side by side. The plane, the catalpa, thesugar maple, and the Virginian poplar mingled their branches withthose of the oak, the beech, and the lime.
18 In these, as in the forests of the Old World, destructionwas perpetually going on. The ruins of vegetation were heapedupon one another; but there was no laboring hand to remove them,and their decay was not rapidenough to makeroom for thecontinualwork of reproduction. Climbing plants, grasses, and other herbsforced their way throught the mass of dying trees; they crept alongtheir bending trunks, found nourishment in their dusty cavities, anda passage beneath the lifeless bark. Thus decay gave its assistance
to life, and their respective productionswere mingled together. Thedepths of these forests were gloomy and obscure, and a thousandrivulets, undirected in their course by human industry, preserved inthem a constant moisture. It was rare to meet with flowers, wildfruits, or birds beneath their shades. The fall of a tree overthrownby age, the rushing torrent of a cataract, the lowing of the buffalo,and the howling of the wind were the only sounds that broke thesilence of nature.
19 To the east of the great river the woods almost dis-appeared; in their stead were seen prairies of immense extent.Whether Nature in her infinite variety had denied the germs oftrees to these fertile plains, or whether they had once been coveredwith forests, subsequently destroyed by the hand of man, is a ques-tion which neither tradition nor scientific research has been able toanswer.
DOC SEGMENT 720 These immense deserts were not, however, wholly
untenanted by men. some wandering tribes has been for agesscattered among the forest shades or on the green pastures of theprairie. From the mouth of the St. Lawrence to the Delta ofthe Mississippi, and from the Atlantic to the Pacific Ocean, thesesavages possessed certain points of resemblance that bore witnessto their common origin; but at the same time they differed fromall other known races of men; they were neither white like theEuropeans, nor yellow like most of the Asiatics, nor black like theNegroes. Their skin was reddish brown, their hair long and shining,the lips thin, and their cheekbones very prominent. The languagesspoken by the North American tribes had different vocabularies,but all obeyed the same rules of grammar. These rules differed inseveral points from such as had been observed to govern the originof language. The idiom of the Americans seemed to be the productof new combinations, and bespoke an effort of the understandingof which the Indians of our days would be incapable.
DOC SEGMENT 821 The social state of these tribes differed also in many
respects from all that was seen in the Old World. They seemto have multiplied freely in the midst of their deserts, withoutcoming in contact with other races more civilized than their own.Accordingly, they exhibited none of those indistinct, incoherentnotions of right and wrong,none of that deep corruption of manners,which is usually joined with ignorance and rudenessamong nationswho, after advancing to civilization, have relapsed into a state ofbarbarism. The Indian was indebted to no one but himself; hisvirtues, his vices, and his prejudices were his own work; he hadgrown up in the wild independence of his nature.
DOC SEGMENT 922 If in polished countries the lowest of the people
are rude and uncivil, it is not merely because they are poor andignorant, but because, being so, they are in daily contat with richand enlightened men. The sight of their own hard lot and theirweakness, which is daily contrasted with the happiness and powerof some of their fellow creatures, excites in their hearts at the sametime the sentiments of anger and of fear: the consciousnessof theirinferiority and their dependence irritates while it humiliates them.This state of mind displays itself in their manners and language;they are at once insolent and servile. The truth of this is easilyproved by observation: the people are more rude in aristocraticcounties than elsewhere; in opulent cities than in rural districts. Inthose places where the richand powerful are assembled together, theweak and the indigent feel themselves oppressed by their inferiorcondition. Unable to perceive a single chance of regaining theirequality, they give up to despair and allow themselves to fall belowthe dignity of human nature.
APPENDIX A. TOCQUEVILLE, CHAPTER 1 115
23 This unfortunate effect of the disparity of conditionsis not observable in savage life: the Indians, although they areignorant and poor, are equal and free.
24 When Europeans first came among them, the nativesof North America were ignorant of the value of riches, and indif-ferent to the enjoyments that civilized man procures for himselfby their means. Nevertheless there was nothing coarse in theirdemeanor; they practiced habitual reserve and a kind of aristocraticpoliteness.
25 Mild and hospitable when at peace, though merci-less in war beyondany known degree of human ferocity, the Indianwould expose himself to die of hunger in order to succor the strangerwho asked admittance by night at the door of his hut; yet he couldtear in pieces with this hands the still quivering limbs of his pris-oner. The famous republics of antiquity never gave examples ofmore unshaken courage, more haughty spirit, or more intractablelove of independence than were hidden in former times among thewild forests of the New World. The Europeans produced no greatimpression when they landed upon the shores of North America;their presence engendered neither envy nor fear. What influencecould they possess over such men as I have described? The Indiancould live without wants, suffer without complaint, and pour outhis death-song at the stake. Like all the other members of the greathuman family, these savages believed in the existence of a betterworld, and adored, under different names, God, the Creator, ofthe universe. Their notions on the great intellectual truths were ingeneral simple and philosophical.
DOC SEGMENT 1026 Although we have here traced the character of a
primitive people, yet it cannot be doubted that another people,more civilized and more advanced in all respects, had preceded itin the same regions.
27 An obscure tradition which prevailed among the In-dians on the borders of the Atlantic informs us that these very tribesformerly dwelt on the west side of the Mississippi. Along the banksof the Ohio, and throughout the central valley, there are frequentlyfound, at this day, tumuli raised by the hands of men. On exploringthese heaps of earth to their center, it is usual to meet with humanbones, strange instruments, arms and utensils of all kinds, madeof metal, and destined for purposes unknown to the present race.The Indians of our time are unable to give any information rela-tive to the history of this unknown people. Neither did those wholived three hundred years ago, when America was first discovered,leave any accounts from which even a hypothesis could be formed.Traditions, those perishable yet ever recurrent monuments of theprimitive world, do not provide any light. There, however, thou-sands of our fellow men have lived; one cannot doubt that. Whendid they go there, what was their origin, their destiny, their history?When and how did they disappear? No one can possibly tell.
28 How strange it appears that nations have existedand afterwards so completely disappeared from the earth that thememory even of their names is effaced! Their languages are lost;their glory is vanished like a soundwithout an echo; thoughperhapsthere is not one which has not left behind it some tomb in memoryof its passage. Thus the most durable monument of human labor isthat which recalls the wretchedness and nothingness of man.
DOC SEGMENT 1129 Although the vast country that I have been describing
was inhabited by many indigenous tribes, it may justly be said, atthe time of its discovery by Europeans, to have formed one greatdesert. The Indians occupiedwithout possessing it. It is by agricul-tural labor that man appropriates the soil, and the early inhabitantsof North America lived by the produce of the chase. Their impla-
cable prejudices, their uncontrolled passions, their vices, and stillmore, perhaps, their savage virtues, consigned them to inevitabledestruction. The ruin of these tribes began from the day whenEuropeans landed on their shores; it has proceeded ever since, andwe are now witnessing its completion. They seem to have beenplaced by Providence amid the riches of the New World only toenjoy them for a season; they were there merely to wait till otherscame. Those coasts, so admirably adapted for commerce and in-dustry; those wide and deep rivers; that inexhaustible valley of theMississippi; the whole continent, in short, seemed prepared to bethe abode of a great nation yet unborn.
30 In that land the great experiment of the attempt toconstruct society upon a new basis was to be made by civilizedman; and it was there, for the first time, that theories hithertounknown, or deemed impracticable, were to exhibit a spectacle forwhich the world had not been prepared by the history of the past.

116
Bibliography
ABOUD, M., C. CHRISMENT, R. RAZOUK, & F. SEDES. 1993. Querying a hypertextinformation retrieval system by the use of classification. Information Processing andManagement 29.387–396.
AL-HAWAMDEH, S., R. DEVERE, G. SMITH, & P. WILLETT. 1991. Using nearest-neighborsearching techniques to access full-text documents. Online Review 15.173–191.
ALSHAWI, HIYAN. 1987. Processing dictionary definitions with phrasal pattern hierarchies.American Journal of Computational Linguistics 13.195–202.
ALTERMAN, RICHARD, & LARRY A. BOOKMAN. 1990. Some computational experiments insummarization. Discourse Processes 13.143–174.
AMIR, ELAN, 1993. Carta: A network topology presentation tool. Project Report, UCBerkeley.
ARENTS, H. C., & W. F. L. BOGAERTS. 1993. Concept-based retrieval of hypermediainformation – from term indexing to semantic hyperindexing. Information Processingand Management 29.373–386.
BACHENKO, JOAN, EILEEN FITZPATRICK, & C.E. WRIGHT. 1986. The contribution of parsingto prosodic phrasing in an experimental text-to-speech system. In Proceedings of the24th Annual Meeting of the Association for Computational Linguistics, 145–155.
BAREISS, RAY. 1989. Exemplar-based knowledge acquisition. Perspectives in ArtificialIntelligence. Academic Press, Inc.
BATALI, JOHN, 1991. Automatic acquisition and use of some of the knowledge in physicstexts. Massachusetts Institute of Technology, Artificial Intelligence Laboratory disser-tation.
BATES, MARCIA J. 1986. Subject access in online catalogs a design model. Journal of theAmerican Society for Information Science 37.
BELL, JOHN E., & LAWRENCE A. ROWE. 1990. Human factors evaluation of a textual,graphical, and natural language query interfaces. Technical Report M90/12, UCBerkeley ERL.
BERTIN, JACQUES. 1983. Semiology of graphics. Madison, WI: The University of WisconsinPress. Translated by William J. Berg.

BIBLIOGRAPHY 117
BRENT, MICHAEL R. 1991. Automatic acquisition of subcategorization frames from un-tagged, free-text corpora. InProceedings of the 29th AnnualMeeting of the Associationfor Computational Linguistics.
BROWN, GILLIAN, & GEORGE YULE. 1983. Discourse analysis. Cambridge Textbooks inLinguistics Series. Cambridge University Press.
BUCKLEY, CHRIS, JAMES ALLAN, & GERARD SALTON. 1994. Automatic routing and ad-hocretrieval using SMART: TREC 2. In Proceedings of TREC-2, ed. by Donna Harman.To appear.
CALZOLARI, NICOLETTA, & REMO BINDI. 1990. Acquisition of lexical information from alarge textual italian corpus. In Proceedings of the Thirteenth International Conferenceon Computational Linguistics, Helsinki.
CARDIE, CLAIRE. 1992. Corpus-based acquisition of relative pronoun disambiguationheurisitics. In Proceedings of the 30th Meeting of the Association for ComputationalLinguistics, 216–223.
CHAFE, WALLACE L. 1979. The flow of thought and the flow of language. In Syntaxand semantics: Discourse and syntax, ed. by Talmy Givon, volume 12, 159–182.Academic Press.
CHALMERS, MATTHEW, & PAUL CHITSON. 1992. Bead: Exploration in information visu-alization. In Proceedings of the 15th Annual International ACM/SIGIR Conference,330–337, Copenhagen, Denmark.
CHARNIAK, EUGENE. 1983. Passing markers: a theory of contextual influence in languagecomprehension. Cognitive Science 7.171–190.
CHEN, FRANCINE R., & MARGARET WITHGOTT. 1992. The use of emphasis to automaticallysummarize a spoken discourse. In Proceedings of ICASSP.
CHURCH, KENNETH W., & PATRICK HANKS. 1989. Word association norms, mutualinformation, and lexicography. In Proceedings of the 27th Annual Meeting of theAssociation for Computational Linguistics, 76–83.
——, & PATRICK HANKS. 1990. Word association norms, mutual information, and lexicog-raphy. American Journal of Computational Linguistics 16.22–29.
——, & MARK Y. LIBERMAN. 1991. A status report on the ACL/DCI. In The Proceedingsof the 7th Annual Conference of the UW Centre for the New OED and Text Research:Using Corpora, 84–91, Oxford.
——, & ROBERT L. MERCER. 1993. Introduction to the special issue on computationallinguistics using large corpora. Computational Linguistics 19.1–24.
COCHRAN, W. G. 1950. The comparison of percentages in matched samples. Biometrika37.256–266.

BIBLIOGRAPHY 118
COOPER, WILLIAM S. 1969. Is interindexer consistency a hobgoblin? American Documen-tation 20.268–278.
——, FREDRIC C. GEY, & AITOA CHEN. 1994. Probabilistic retrieval in the TIPSTERcollections: An application of staged logistic regression. In Proceedings of TREC-2,ed. by Donna Harman.
CROFT, W. BRUCE, ROBERT KROVETZ, & H. TURTLE. 1990. Interactive retrieval of complexdocuments. Information Processing and Management 26.593–616.
——, & HOWARD R. TURTLE. 1992. Text retrieval and inference. In Text-based intelligentsystems: Current research and practice in information extraction and retrieval, ed. byPaul S. Jacobs, 127–156. Lawrence Erlbaum Associates.
CROUCH, C. J. 1990. An approach to the automatic construction of global thesauri.Information Processing and Management 26.629–640.
CUTTING, DOUGLAS R., DAVID KARGER, & JAN PEDERSEN. 1993. Constant interaction-time Scatter/Gather browsing of very large document collections. In Proceedings ofthe 16th Annual International ACM/SIGIR Conference, 126–135, Pittsburgh, PA.
——, JAN O. PEDERSEN, DAVID KARGER, & JOHN W. TUKEY. 1992. Scatter/Gather: Acluster-based approach to browsing large document collections. In Proceedings of the15th Annual International ACM/SIGIR Conference, 318–329, Copenhagen, Denmark.
CUTTING, DOUGLASS R., JAN O. PEDERSEN, PER-KRISTIAN HALVORSEN, & MEG WITH-GOTT. 1990. Information theater versus information refinery. In AAAI Spring Sympo-sium on Text-based Intelligent Systems, ed. by Paul S. Jacobs.
DAGAN, IDO, SHAUL MARCUS, & SHAUL MARKOVITCH. 1993. Contextual word similarityand estimation from sparse data. In Proceedings of the 31th Annual Meeting of theAssociation for Computational Linguistics, 164–171.
DALRYMPLE, MARY, STUART M. SHEIBER, & F PEREIRA. 1991. Ellipsis and higher-orderunification. Linguistics and Philosophy 14.399–452.
DAVIS, JAMES R. 1994. A server for a distributed digital technical report library. TechnicalReport Computer Science Report Number 94-1418, Cornell University.
DE TOCQUEVILLE, ALEXIS. 1835. Democracy in America, Volume I. London: Saundersand Otley.
DEERWESTER, SCOTT, SUSAN T. DUMAIS, GEORGE W. FURNAS, THOMAS K. LANDAUER,& RICHARD HARSHMAN. 1990. Indexing by latent semantic analysis. Journal of theAmerican Society for Information Science 41.391–407.
DEJONG, GERALD F. 1982. An overview of the FRUMP system. In Strategies for nat-ural language processing, ed. by Wendy G. Lehnert & Martin H. Ringle, 149–176.Hillsdale: Erlbaum.

BIBLIOGRAPHY 119
FARLEY, LAINE. 1989. Dissecting slow searches. University of California Division ofLibrary Automation Bulletin (DLA) 9.
FILLMORE, CHARLES J. 1981. Pragmatics and the description of discourse. In Radicalpragmatics, ed. by Peter Cole. New York: Academic Press Inc.
FISHER, DAVID, 1994. Topic characterization of full length texts using direct and indirectterm evidence. Masters Report, University of California, Berkeley, to appear.
FOWLER, RICHARD H., WENDY A. L. FOWLER, & BRADLEY A. WILSON. 1991. Integratingquery, thesaurus, and documents through a common visual representation. In Proceed-ings of the 14th Annual International ACM/SIGIR Conference, 142–151, Chicago.
FOX, EDWARD A., & MATTHEW B. KOLL. 1988. Practical enhanced Boolean retrieval: Expe-riences with the SMART and SIRE systems. Information Processing and Management24.
FRUCHTERMANN, T., & E. RHEINGOLD. 1990. Graph drawing by force-directed placement.Technical Report UIUCDCS-R-90-1609, Department of Computer Science, Universityof Illinois, Urbana-Champagne, Ill.
FUHR, NORBERT, & CHRIS BUCKLEY. 1993. Optimizing document indexing and searchterm weighting based on probabilistic models. In The first text retrieval conference(TREC-1), ed. by Donna Harman, 89–100. NIST Special Publication 500-207.
FULLER, MICHAEL, ERIC MACKIE, RON SACKS-DAVIS, & ROSS WILKINSON. 1993. Coherentanswers for a large structured document collection. In Proceedings of the 16th AnnualInternational ACM/SIGIR Conference, 204–213, Pittsburgh, PA.
FUNG, ROBERT M., STUART L. CRAWFORD, LEE A. APPELBAUM, & RICHARD M. TONG.1990. An architecture for probabilistic concept-based information retrieval. In Pro-ceedings of the 13th International ACM/SIGIR Conference, 455–467.
GALE, WILLIAM A., KENNETH W. CHURCH, & DAVID YAROWSKY. 1992a. Estimatingupper and lower bounds on the performance of word-sense disambiguation programs.In Proceedings of the 30th Meeting of the Association for Computational Linguistics,249–256.
——, KENNETH W. CHURCH, & DAVID YAROWSKY. 1992b. A method for disambiguatingword senses in a large corpus. Computers and the Humanities 5-6.415–439.
——, KENNETH W. CHURCH, & DAVID YAROWSKY. 1992c. One sense per discourse. InProceedings of the DARPA Speech and Natural Language Workshop.
GIRILL, T. R. 1991. Information chunking as an interface design issue for full-text databases.In Interfaces for information retrieval and online systems, ed. by Martin Dillon, 149–158. New York, NY: Greenwood Press.

BIBLIOGRAPHY 120
GREFENSTETTE, G. 1992. A new knowledge-poor technique for knowledge extractionfrom large corpora. In Proceedings of the 15th Annual International ACM/SIGIRConference, Copenhagen, Denmark. ACM.
GRIFFITHS, ALAN, H. CLAIRE LUCKHURST, & PETER WILLETT. 1986. Using interdocumentsimilarity information in document retrieval systems. Journal of the American Societyfor Information Science 37.3–11.
GRIMES, J. 1975. The thread of discourse. The Hague: Mouton.GROSZ, BARBARA J. 1986. The representation and use of focus in a system for understand-
ing dialogs. In Readings in natural language processing, ed. by Barbara J. Grosz,Karen Sparck Jones, & Bonnie Lynn Webber, 353–362. Morgan Kaufmann.
——, & CANDACE L. SIDNER. 1986. Attention, intention, and the structure of discourse.Computational Linguistics 12.172–204.
HAHN, UDO. 1990. Topic parsing: Accounting for text macro structures in full-text analysis.Information Processing and Management 26.135–170.
HALLIDAY, M. A. K., & R. HASAN. 1976. Cohesion in English. London: Longman.HARDT, DANIEL. 1992. An algorithm for VP ellipsis. In Proceedings of the 30th Meeting
of the Association for Computational Linguistics, 9–14.HARMAN, DONNA. 1993. Overview of the first Text REtrieval Conference. In Proceedings
of the 16th Annual International ACM/SIGIR Conference, 36–48, Pittsburgh, PA.HAYES, PHILLIP J. 1992. Intelligent high-volume text processing using shallow, domain-
specific techniques. In Text-based intelligent systems: Current research and practicein information extraction and retrieval, ed. by Paul S. Jacobs, 227–242. LawrenceErlbaum Associates.
HEARST, MARTI A. 1992. Automatic acquisition of hyponyms from large text corpora. InProceedings of the Fourteenth InternationalConference onComputational Linguistics,539–545, Nantes, France.
——. 1993. TextTiling: A quantitative approach to discourse segmentation. Techni-cal Report Sequoia 93/24, Computer Science Department, University of California,Berkeley.
——, & CHRISTIAN PLAUNT. 1993. Subtopic structuring for full-length document access.In Proceedings of the 16th Annual International ACM/SIGIR Conference, 59–68,Pittsburgh, PA.
——, & HINRICH SCHUTZE. 1993. Customizing a lexicon to better suit a computationaltask. In Proceedings of the SIGLEX Workshop on Acquisition of Lexical Knowledgefrom Text, 55–69, Columbus, OH.
HENZLER, ROLF G. 1978. Free or controlled vocabularies: Some statistical user-orientedevaluations of biomedical information systems. International Classification 5.21–26.

BIBLIOGRAPHY 121
HINDS, JOHN. 1979. Organizational patterns in discourse. In Syntax and semantics:Discourse and syntax, ed. by Talmy Givon, volume 12, 135–158. Academic Press.
HIRSCHBERG, JULIA, & DIANE LITMAN. 1993. Empirical studies on the disambiguation ofcue phrases. Computational Linguistics 19.501–530.
HOBBS, JERRY. 1978. Resolving pronoun references. Lingua 44.311–338.
HOVY, ED. 1990. Parsimonious and profligate approaches to the question of discoursestructure relations. In 5th ACL Workshop on Natural Language Generation, Dawson,Pennsylvania.
HWANG, CHUNG HEE, & LENHART K. SCHUBERT. 1992. Tense trees as the ’fine structure’of discourse. In Proceedings of the 30th Meeting of the Association for ComputationalLinguistics, 232–240.
JACOBS, PAUL. 1993. Using statistical methods to improve knowledge-based news catego-rization. IEEE Expert 8.13–23.
——, & LISA RAU. 1990. SCISOR: Extracting information from On-Line News. Commu-nications of the ACM 33.88–97.
JURAFSKY, DANIEL, 1992. An on-line computational model of human sentence interpre-tation: A theory of the representation and use of linguistic knowledge. Universityof California at Berkeley dissertation. (Computer Science Division Report Number92/676).
JUSTESON, J. S., & S. M. KATZ. 1991. Co-occurrences of antonymous adjectives and theircontexts. Computational Lingustics 17.1–19.
KAHLE, BREWSTER, & ART MEDLAR. 1991. An information system for corporate users:Wide area information servers. Technical Report TMC199, Thinking Machines Cor-poration.
KEEN, E. MICHAEL. 1991. The use of term position devices in ranked output experiment.Journal of Documentation 47.1–22.
——. 1992. Term position ranking: some new test results. In Proceedings of the 15thAnnual International ACM/SIGIR Conference, 66–76, Copenhagen, Denmark.
KOLODNER, JANET L. 1983. Maintaining organization in a dynamic long-term memory.Cognitive Science 7.243–280.
KORFHAGE, ROBERT R. 1991. To see or not to see – is that the query? In Proceedings ofthe 14th Annual International ACM/SIGIR Conference, 134–141, Chicago.
KOSSLYN, S., S. PINKER, W. SIMCOX, & L. PARKIN. 1983. Understanding charts andgraphs: A project in applied cognitive science. National Institute of Education. ED1.310/2:238687.
BIBLIOGRAPHY 122
KOZIMA, HIDEKI. 1993. Text segmentation based on similarity between words. In Pro-ceedings of the 31th Annual Meeting of the Association for Computational Linguistics,286–288, Columbus, OH.
KUNO, SUSUMO. 1972. Functional sentence perspective: A case study from Japanese andEnglish. Linguistic Inquiry 3.269–320.
KUPIEC, JULIAN. 1993. MURAX: A robust linguistic approach for question answering usingan on-line encyclopedia. In Proceedings of the 16th Annual International ACM/SIGIRConference, 181–190, Pittsburgh, PA.
LAKOFF, GEORGE P. 1972. Structural complexity in fairy tales. The Study ofMan 1.128–150.
LAMBERT, LYNN, & SANDRA CARBERRY. 1991. A tripartite plan-based model of dialogue.In Proceedings of the 29th Annual Meeting of the Association for ComputationalLinguistics, 47–54.
LANCASTER, F. 1986. Vocabulary control for information retrieval, second edition. Arling-ton, VA: Information Resources.
LARSON, RAY R. 1991. Classification clustering, probabilistic information retrieval, andthe online catalog. The Library Quarterly 61.133–173.
——. 1992. Experiments in automatic library of congress classification. Journal of theAmerican Society for Information Science 43.130–148.
LEWIS, DAVID D. 1992. An evaluation of phrasal and clustered representations on a textcategorization task. In Proceedings of the 15th Annual International ACM/SIGIRConference, 37–50, Copenhagen.
LIDDY, ELIZABETH. 1991. The discourse level structure of empirical abstracts – an ex-ploratory study. Information Processing and Management 27.55–81.
LIDDY, ELIZABETH D., & S. MYAENG. 1993. DR-LINK’s linguistic-conceptual approachto document detection. In The first text retrieval conference (TREC-1), ed. by DonnaHarman, 113–129. NIST Special Publication 500-207.
——, & WOOJIN PAIK. 1992. Statistically-guided word sense disambiguation. In Proceed-ings of the AAAI Fall Symposium on Probabilistic Approaches to Natural Language.
LONGACRE, R. E. 1979. The paragraph as a grammatical unit. In Syntax and semantics:Discourse and syntax, ed. by Talmy Givon, volume 12, 115–134. Academic Press.
LUPERFOY, SUSANN. 1992. The representation of multimodal user interface dialoguesusing discourse pegs. In Proceedings of the 30th Meeting of the Association forComputational Linguistics, 22–31.
LYNCH, CLIFFORD. 1992. The next generation of public access information retrieval systemsfor research libraries – lessons from 10 years of the melvyl system. InformationTechnology and Libraries 11.405–415.

BIBLIOGRAPHY 123
MACKINLAY, JOCK, 1986. Automatic design of graphical presentations. Stanford Universitydissertation. Technical Report Stan-CS-86-1038.
MANBER, UDI, & SUN WU. 1994. GLIMPSE: a tool to search through entire file systems.In Proceedings of the Winter 1994 USENIX Conference, 23–31, San Francisco, CA.
MANN, WILLIAM C., & SANDRA A. THOMPSON. 1987. Rhetorical structure theory: Atheory of text organization. Technical Report ISI/RS 87-190, ISI.
MANNING, CHRISTOPHER D. 1993. Automatic acquisition of a large subcategorizationdictionary from corpora. In Proceedings of the 31st Annual Meeting of the Associationfor Computational Lingusitics, 235–242, Columbus, OH.
MARCHIONINI, GARY, PETER LIEBSCHER, & XIA LIN. 1991. Authoring hyperdocuments:Designing for interaction. In Interfaces for information retrieval and online systems,ed. by Martin Dillon, 119–131. New York, NY: Greenwood Press.
MARKEY, KAREN, PAULINE ATHERTON, & CLAUDIA NEWTON. 1982. An analysis ofcontrolled vocabulary and free text search statements in online searches. OnlineReview 4.225–236.
MARKOWITZ, JUDITH, THOMAS AHLSWEDE, & MARTHA EVENS. 1986. Semanticallysignificant patterns in dictionary definitions. Proceedings of the 24th Annual Meetingof the Association for Computational Linguistics 112–119.
MARTIN, JAMES H. 1990. A computational model of metaphor interpretation. Boston:Academic Press.
MASAND, BRIJ, GORDON LINOFF, & DAVID WALTZ. 1992. Classifying news stories usingmemory based reasoning. In Proceedings of ACM/SIGIR, 59–65.
MAULDIN, MICHAEL L., 1989. Information retrieval by text skimming. Pittsburg, PA:Carnegie Mellon University dissertation.
——. 1991. Retrieval performance in ferret. In Proceedings of ACM/SIGIR, 347–355,Chicago, IL.
MCCUNE, B., R. TONG, J.S. DEAN, & D. SHAPIRO. 1985. Rubric: A system for rule-basedinformation retrieval. IEEE Transactions on Software Engineering 11.
MICHARD, A. 1982. Graphical presentation of Boolean expressions in a database querylanguage: design notes and an ergonomic evaluation. Behaviour and InformationTechnology 1.
MILLER, GEORGE A., RICHARD BECKWITH, CHRISTIANE FELLBAUM, DEREK GROSS, &KATHERINE J. MILLER. 1990. Introduction to WordNet: An on-line lexical database.Journal of Lexicography 3.235–244.
MINSKY, MARVIN. 1975. A framework for representing knowledge. In The psychology ofcomputer vision, ed. by Patrick Winston. McGraw-Hill.
BIBLIOGRAPHY 124
MITTENDORF, ELKE, & PETER SCHAUBLE. 1994. Passage retrieval based on hidden markovmodels. In Proceedings of the 17th Annual International ACM/SIGIR Conference,Dublin, Ireland. To appear.
MOFFAT, ALISTAIR, RON SACKS-DAVIS, ROSS WILKINSON, & JUSTIN ZOBEL. 1994. Retrievalof partial documents. In Proceedings of TREC-2, ed. by Donna Harman. To appear.
MOONEY, DAVID J., M. SANDRA CARBERRY, & KATHLEEN F. MCCOY. 1990. The generationof high-level structure for extended explanations. In Proceedings of the ThirteenthInternational Conference on Computational Linguistics, volume 2, 276–281, Helsinki.
MOORE, JOHANNA D., & MARTHA E. POLLACK. 1992. A problem for RST: The need formulti-level discourse analysis. Computational Linguistics 18.
MORRIS, JANE. 1988. Lexical cohesion, the thesaurus, and the structure of text. TechnicalReport CSRI-219, Computer Systems Research Institute, University of Toronto.
——, & GRAEME HIRST. 1991. Lexical cohesion computed by thesaural relations as anindicator of the structure of text. Computational Linguistics 17.21–48.
NOREAULT, TERRY, MICHAEL MCGILL, & MATTHEW B. KOLL. 1981. A performance eval-uation of similarity measures, document term weighting schemes and representationsin a Boolean environment. In Information retrieval research, ed. by R. N. Oddy, S. E.Robertson, C. J. van Rijsbergen, & P. W. Williams, 57–76. London: Butterworths.
NORVIG, PETER, 1987. A unified theory of inference for text understanding. Universityof California, Berkeley dissertation. (Computer Science Division Report Number87/339).
O’CONNOR, J. 1980. Answer passage retrieval by text searching. Journal of the ASIS32.227–239.
OUSTERHOUT, JOHN. 1991. An X11 toolkit based on the Tcl language. In Proceedings ofthe Winter 1991 USENIX Conference, 105–115, Dallas, TX.
PAICE, CHRIS D. 1990. Constructing literature abstracts by computer: Techniques andprospects. Information Processing and Management 26.171–186.
PASSONNEAU, REBECCA J., & DIANE J. LITMAN. 1993. Intention-based segmentation:Human reliability and correlation with linguistic cues. In Proceedings of the 31stAnnual Meeting of the Association for Computational Linguistics, 148–155.
PEAT, HELEN J., & PETER WILLETT. 1991. The limitations of term co-occurence data forquery expansion in document retrieval systems. JASIS 42.378–383.
PHILLIPS, MARTIN. 1985. Aspects of text structure: An investigation of the lexical organi-sation of text. Amsterdam: North-Holland.
POLLOCK, J. J., & A. ZAMORA. 1975. Automatic abstracting research at Chemical AbstractsService. Journal of Chemical Information and Computer Sciences 15.226–233.

BIBLIOGRAPHY 125
PUSTEJOVSKY, JAMES. 1987. On the acquisition of lexical entries: The perceptual originof thematic relations. Proceedings of the 25th Annual Meeting of the Association forComputational Linguistics .
RASKIN, VICTOR, & IRWIN WEISER. 1987. Language and writing: Applications of lin-guistics to rhetoric and composition. Norwood, New Jersey: ABLEX PublishingCorporation.
RESNIK, PHILIP. 1992. WordNet and Distributional Analysis: A Class-based Approachto Lexical Discovery. In Statistically-based natural language programming tech-niques: Papers from the 1992 workshop, ed. by Carl Weir. Menlo Park, CA: AAAIPress,Technical Report W-92-01.
——, 1993. Selection and information: A class-based approach to lexical relationships.University of Pennsylvania dissertation. (Institute for Research in Cognitive Sciencereport IRCS-93-42).
RILOFF, ELLEN, & WENDY LEHNERT. 1992. Classifying texts using relevancy signatures.In Proceedings of the Tenth National Conference on Artificial Intelligence. AAAIPress/The MIT Press.
RO, JUNG SOON. 1988a. An evaluation of the applicability of ranking algorithms toimprove the effectiveness of full-text retrieval. I. On the effectiveness of full-textretrieval. Journal of the American Society for Information Science 39.73–78.
——. 1988b. An evaluation of the applicability of ranking algorithms to improve theeffectiveness of full-text retrieval. II. On the effectiveness of ranking algorithms onfull-text retrieval. Journal of the American Society for Information Science 39.147–160.
ROBERTSON, GEORGE C., STUART K. CARD, & JOCK D. MACKINLAY. 1993. Informationvisualization using 3D interactive animation. Communications of the ACM 36.56–71.
ROLLING, L. 1981. Indexing consistency, quality, and efficiency. Information Processingand Management 17.69–76.
ROSE, DANIEL E., & RICHARD K. BELEW. 1991. Toward a direct-manipulation interfacefor conceptual information retrieval systems. In Interfaces for information retrievaland online systems, ed. by Martin Dillon, 39–54. New York, NY: Greenwood Press.
ROTONDO, JOHN A. 1984. Clustering analysis of subjective partitions of text. DiscourseProcesses 7.69–88.
RUGE, GERDA. 1991. Experiments on linguistically based term associations. InProceedingsof the RIAO, 528–545.
RUMELHART, DAVID. 1975. Notes on a schema for stories. In Representation and under-standing, ed. by Daniel G. Bobrow & Allan Collins, 211–236. New York: AcademicPress.
BIBLIOGRAPHY 126
RUS, DANIELA, & DEVIKA SUBRAMANIAN. 1993. Multi-media RISSC informatics: Re-trieving information with simple structural components. In Proceedings of the ACMConference on Information and Knowledge Management (CIKM).
SALTON, GERARD (ed.) 1971. The Smart retrieval system – experiments in automaticdocument processing. Englewood Cliffs, NJ: Prentice Hall.
——. 1972. Experiments in automatic thesaurus construction for information retrieval. InInformation Processing 71, 115–123. North Holland Publishing Co.
——. 1988. Automatic text processing : the transformation, analysis, and retrieval ofinformation by computer. Reading, MA: Addison-Wesley.
——, JAMES ALLAN, & CHRIS BUCKLEY. 1993. Approaches to passage retrieval in full textinformation systems. In Proceedings of the 16th Annual International ACM/SIGIRConference, 49–58, Pittsburgh, PA.
——, JAMES ALLAN, & CHRIS BUCKLEY. 1994. Automatic structuring and retrieval of largetext files. Communications of the ACM 37.97–108.
——, & CHRIS BUCKLEY. 1990. Improving retrieval performance by relevance feedback.JASIS 41.288–297.
——, & CHRIS BUCKLEY. 1991. Automatic text structuring and retrieval: Experiments inautomatic encyclopedia searching. In Proceedings of the 14th Annual InternationalACM/SIGIR Conference, 21–31.
——, & CHRIS BUCKLEY. 1992. Automatic text structuring experiments. InText-based intel-ligent systems: Current research and practice in information extraction and retrieval,ed. by Paul S. Jacobs, 199–209. Lawrence Erlbaum Associates.
SCHANK, ROGER, & R. ABELSON. 1977. Scripts, plans, goals, and understanding. Hillsdale,NJ: Erlbaum.
SCHIFFRIN, DEBORAH. 1987. Discourse markers. Cambridge: Cambridge University Press.
SCHUTZE, HINRICH. 1993a. Part-of-speech induction from scratch. In Proceedings of ACL31, Ohio State University.
——. 1993b. Word space. In Advances in neural information processing systems 5, ed.by Stephen J. Hanson, Jack D. Cowan, & C. Lee Giles. San Mateo CA: MorganKaufmann.
SENAY, HIKMET, & EVE IGNATIUS. 1990. Rules and principles of scientific data visualization.Technical Report GWU-IIST-90-13, Institute for Information Science and Technology,The George Washington University.
SHNEIDERMAN, BEN. 1987. Designing the user interface: strategies for effective human-computer interaction. Reading, MA: Addison-Wesley.

BIBLIOGRAPHY 127
SIBUN, PENELOPE. 1992. Generating text without trees. Computational Intelligence:Special Issue on Natural Language Generation 8.102–122.
SIDNER, CANDACE L. 1983. Focusing in the comprehension of definite anaphora. InComputational models of discourse, ed. by Michael Brady & Robert C. Berwick,267–330. Cambridge, MA: MIT Press.
SKOROCHOD’KO, E.F. 1972. Adaptive method of automatic abstracting and indexing. InInformationProcessing 71: Proceedings of the IFIP Congress 71, ed. by C.V. Freiman,1179–1182. North-Holland Publishing Company.
SMADJA, FRANK A., & KATHLEEN R. MCKEOWN. 1990. Automatically extracting andrepresenting collocations for language generation. In Proceedings of the 28th AnnualMeeting of the Association for Computational Linguistics, 252–259.
SPARCK-JONES, KAREN. 1971. Automatic keyword classification for information retrieval.London: Butterworth & Co.
——. 1986. Synonymy and semantic classification. Edinburgh: Edinburgh University Press.
SPOERRI, ANSELM. 1993. InfoCrystal: A visual tool for information retrieval & manage-ment. In Proceedings of Information Knowledge and Management ’93, Washington,D.C.
STANFILL, CRAIG, & DAVID L. WALTZ. 1992. Statistical methods, artificial intelligence, andinformation retrieval. In Text-based intelligent systems: Current research and practicein information extraction and retrieval, ed. by Paul S. Jacobs, 215–226. LawrenceErlbaum Associates.
STARK, HEATHER. 1988. What do paragraph markers do? Discourse Processes 11.275–304.
STODDARD, SALLY. 1991. Text and texture: Patterns of cohesion, volume XL of Advancesin Discourse Processes. Norwood, NJ: Ablex Publishing Corporation.
STONEBRAKER, MICHAEL, & G. KEMNITZ. 1991. The POSTGRES next-generation databasemanagement system. Communications of the ACM 34.78–92.
SUNDHEIM, BETH. 1990. Second message understanding conference(MUC-II). TechnicalReport 1328, Naval Ocean Systems Center, San Diego, CA.
SVENONIUS, ELAINE. 1986. Unanswered questions in the design of controlled vocabularies.Journal of the American Society for Information Science 37.331–340.
TANNEN, DEBORAH. 1984. Conversational style: Analyzing talk among friends. Norwood,NJ: Ablex.
——. 1989. Talking voices: Repetition, dialogue, and imagery in conversational discourse.Studies in Interactional Sociolinguistics 6. Cambridge University Press.
TENOPIR, CAROL, & JUNG SOON RO. 1990. Full text databases. New Directions inInformation Management. Greenwood Press.

BIBLIOGRAPHY 128
THOMPSON, R. H., & B. W. CROFT. 1989. Support for browsing in an intelligent textretrieval system. International Journal of Man [sic] -Machine Studies 30.639–668.
TOMBAUGH, J., A. LICKORISH, & P. WRIGHT. 1987. Multi-window displays for readers oflengthy texts. International Journal of Man [sic] -Machine Studies 26.597–615.
TUFTE, EDWARD. 1983. The visual display of quantitative information. Chelshire, CT:Graphics Press.
VAN DIJK, TEUN A. 1980. Macrostructures. Hillsdale, N.J.: Lawrence Erlbaum Associates.
——. 1981. Studies in the pragmatics of discourse. The Hague: Mouton Publishers.
VAN RIJSBERGEN, C. J. 1979. Information retrieval. London: Butterworths.
VOORHEES, ELLEN M. 1985. The cluster hypothesis revisited. In Proceedings ofACM/SIGIR, 188–196.
WALKER, MARILYN. 1991. Redundancy in collaborative dialogue. In AAAI Fall Symposiumon Discourse Structure in Natural Language Understanding and Generation, ed. byJulia Hirschberg, Diane Litman, Kathy McCoy, & Candy Sidner, Pacific Grove, CA.
WANG, MICHELLE Q., & JULIA HIRSCHBERG. 1992. Automatic classification of intonationalphrase boundaries. Computer Speech and Language 6.175–196.
WEBBER, BONNIE LYNN. 1987. The interpretation of tense in discourse. In Proceedings ofthe 25th Annual Meeting of the Association for Computational Linguistics, 147–154.
WILENSKY, ROBERT. 1981. Meta-planning: representing and using knowledge aboutplanning in problem solving and natural language understanding. Cognitive Science5.197–235.
——. 1983a. Planning and understanding. Reading, MA: Addison-Wesley.
——. 1983b. Story grammars vs. story points. The Behavior and Brain Sciences 6.
——, YIGAL ARENS, & DAVID N. CHIN. 1984. Talking to UNIX in English: An overviewof UC. Communications of the ACM 27.
WILKS, YORICK. 1975. An intelligent analyzer and understander of English. Communica-tions of the ACM 18.264–274.
WILKS, YORICK A., DAN C. FASS, CHENG MING GUO, JAMES E. MCDONALD, TONY PLATE,& BRIAN M. SLATOR. 1990. Providing machine tractable dictionary tools. Journal ofComputers and Translation 2.
WINOGRAD, TERRY. 1972. Understanding natural language. New York, NY: AcademicPress.
WU, SUN, & UDI MANBER. 1992. Agrep – a fast approximate pattern-matching tool. InProceedings of the Winter 1992 USENIX Conference, 153–162, San Francisco, CA.
BIBLIOGRAPHY 129
YAROWSKY, DAVID. 1992. Word sense disambiguation using statistical models of Roget’scategories trained on large corpora. In Proceedings of the Fourteenth InternationalConference on Computational Linguistics, 454–460, Nantes, France.
YOUMANS, GILBERT. 1991. A new tool for discourse analysis: The vocabulary-managementprofile. Language 67.763–789.