Contents · Web viewMs Anne Wells, Assistant Director of Nursing, TIPCU Suggested reference:...
34
Tasmanian Acute Public Hospitals Healthcare Associated Infection Surveillance Report 37 – Quarter 1 2018
Transcript of Contents · Web viewMs Anne Wells, Assistant Director of Nursing, TIPCU Suggested reference:...

Tasmanian Acute Public Hospitals Healthcare Associated Infection Surveillance Report 37 – Quarter 1 2018

Tasmanian Acute public Hospital Healthcare Associated Infection Surveillance Report 37 – Quarter 1 2018 Department of Health and Human Services, TasmaniaPublished 2018Copyright—Department of Health and Human ServicesPermission to copy is granted provided the source is acknowledgedAuthors Ms Fiona Wilson, Clinical Nurse Consultant, TIPCU Dr Tara Anderson, Specialist Medical Advisor, TIPCU Ms Anne Wells, Assistant Director of Nursing, TIPCUSuggested reference: Wilson, F., Anderson, T., Wells, A. (2018). Tasmanian Acute Public Hospitals Healthcare Associated Infection Report No 37 – Quarter 1 2018. Hobart: Department of Health and Human Services. Reviewed and approved by the Executive Director of Nursing North, Executive Director of Nursing North West, Nursing Director South – Critical Care, Clinical Support and Investigations, and the Director of Public Health, DHHS Tasmania.NotesData is subject to ongoing revision so data from previous reports should not be relied upon. Use the most up to date report when citing data.
Page 2 of 30

ContentsIndex of figures and tables 4Executive summary 5Staphylococcus aureus bacteraemia 6
Tasmanian rates 6Hospital rates 7
Clostridium difficile infection 8Tasmanian rates 8Hospital rates – by quarter 9
Vancomycin resistant enterococci 10Carbapenemase-producing Enterobacteriaceae 12Hand Hygiene 13
Tasmanian rates 13Acknowledgements 16Appendix 1 17
Explanatory notes 17What types of healthcare surveillance are done in Tasmania?......................17What do the rates mean?..............................................................................17What are the definitions for Clostridium difficile infection (CDI)?..................17What are the definitions for healthcare associated Staphylococcus aureus bacteraemia (SAB)?.......................................................................................18Confidence intervals......................................................................................18Can I compare Tasmanian hospital infection rates?......................................19
Appendix 2 20Healthcare associated Staphylococcus aureus bacteraemia (SAB) 20Clostridium difficile infection (CDI) 22Vancomycin resistant enterococci (VRE) 24Hand hygiene compliance data - audit period 1, 2018 26
Page 3 of 30
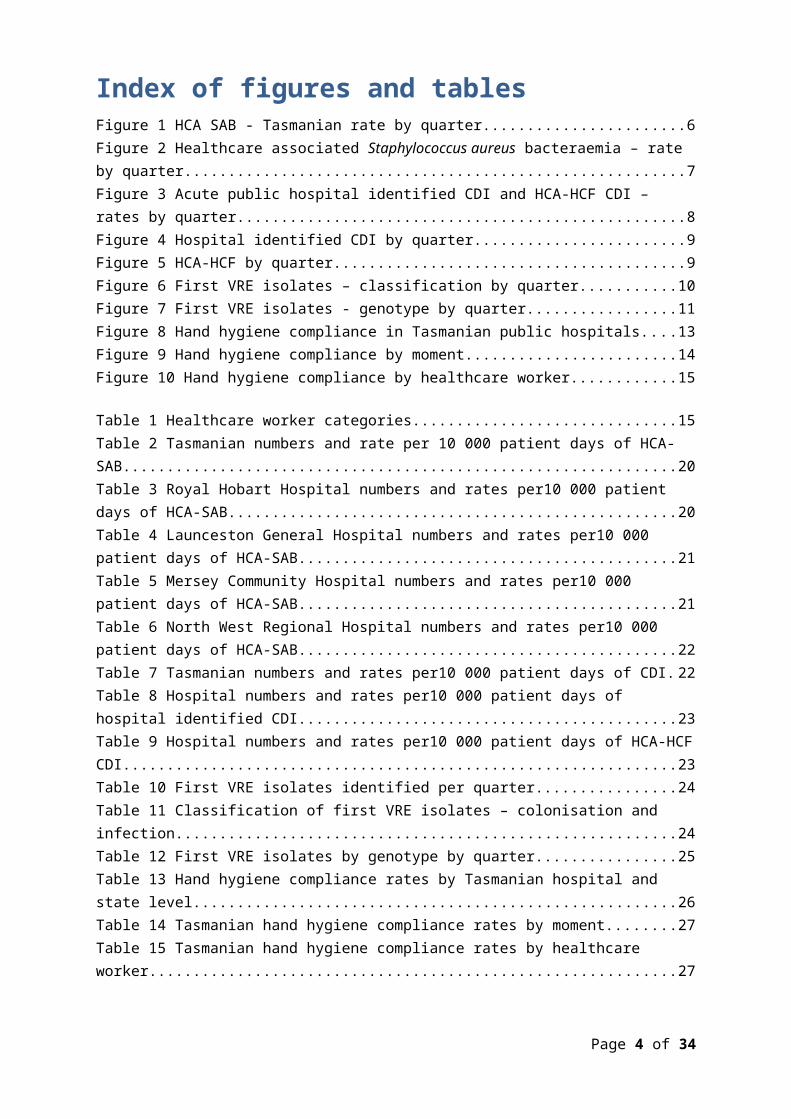
Index of figures and tablesFigure 1 HCA SAB - Tasmanian rate by quarter.....................................................6Figure 2 Healthcare associated Staphylococcus aureus bacteraemia – rate by quarter...................................................................................................................7Figure 3 Acute public hospital identified CDI and HCA-HCF CDI – rates by quarter.............................................................................................................................. 8Figure 4 Hospital identified CDI by quarter............................................................9Figure 5 HCA-HCF by quarter.................................................................................9Figure 6 First VRE isolates – classification by quarter..........................................10Figure 7 First VRE isolates - genotype by quarter................................................11Figure 8 Hand hygiene compliance in Tasmanian public hospitals......................13Figure 9 Hand hygiene compliance by moment..................................................14Figure 10 Hand hygiene compliance by healthcare worker.................................15
Table 1 Healthcare worker categories.................................................................15Table 2 Tasmanian numbers and rate per 10 000 patient days of HCA-SAB.......20Table 3 Royal Hobart Hospital numbers and rates per10 000 patient days of HCA-SAB......................................................................................................................20Table 4 Launceston General Hospital numbers and rates per10 000 patient days of HCA-SAB..........................................................................................................21Table 5 Mersey Community Hospital numbers and rates per10 000 patient days of HCA-SAB..........................................................................................................21Table 6 North West Regional Hospital numbers and rates per10 000 patient days of HCA-SAB..........................................................................................................22Table 7 Tasmanian numbers and rates per10 000 patient days of CDI...............22Table 8 Hospital numbers and rates per10 000 patient days of hospital identified CDI....................................................................................................................... 23Table 9 Hospital numbers and rates per10 000 patient days of HCA-HCF CDI... .23Table 10 First VRE isolates identified per quarter................................................24Table 11 Classification of first VRE isolates – colonisation and infection.............24Table 12 First VRE isolates by genotype by quarter............................................25Table 13 Hand hygiene compliance rates by Tasmanian hospital and state level............................................................................................................................ 26Table 14 Tasmanian hand hygiene compliance rates by moment.......................27Table 15 Tasmanian hand hygiene compliance rates by healthcare worker.......27
Page 4 of 30
Executive summaryThis quarterly report provides an overview of the Tasmanian acute public hospitals’ healthcare associated infection surveillance for the first quarter (Q1) of 2018. Details of the surveillance program, including the rationale for the indicators measured and the methodologies used in data collection, validation and analysis are available at the TIPCU website Any form of comparison between hospitals should be done with caution because data are not adjusted for patient characteristics that vary between hospitals. Further, the relatively small Tasmanian population and small number of events can result in volatility of rates from time to time. The raw data in the appendices illustrate this.This report contains the following findings: the Tasmanian rate of healthcare associated Staphylococcus aureus
bacteraemia (SAB) remains low and below the National Benchmark the rate of ‘hospital identified Clostridium difficile infection (CDI)’ and
‘hospital identified, healthcare associated-healthcare facility onset (HCA-HCF) CDI’ increased slightly this quarter but the overall trend remains stable
the number of new isolates of vancomycin resistant enterococcus (VRE) continues to increase
there were no cases of Carbapenemase-producing Enterobacteriaceae (CPE) notified
the consolidated Tasmanian public hospital hand hygiene compliance rate is 80 per cent which is equal to the National Hand Hygiene Benchmark (NHHB).
Page 5 of 30

Staphylococcus aureus bacteraemiaStaphylococcus aureus, a common cause of serious healthcare associated bloodstream infection (bacteraemia), may cause significant patient morbidity and mortality. Many healthcare associated Staphylococcus aureus bacteraemias (SAB) are preventable. SAB was made notifiable in Tasmania in 2008 pursuant to the Public Health Act 1997. Tasmania was the first Australian jurisdiction to introduce this measure to capture SAB data.SAB surveillance is carried out in Tasmania using the national surveillance definitions published by the Australian Commission on Safety and Quality in Health Care (ACSQHC). Under this definition a SAB is defined as healthcare associated if the patient’s first SAB positive blood culture was collected either >48 hours after hospital admission or <48 hours after discharge (Criterion A) OR ≤48 hours after hospital admission and one of four key clinical healthcare related criteria was met (Criterion B). The National Healthcare Agreement (2011) target is no more than two HCA SAB per10 000 patient days.Tasmanian ratesFigure 1 presents the combined Tasmanian acute public hospital rates of HCA SAB by quarter. Figure 1 Healthcare associated Staphylococcus aureus bacteraemia - Tasmanian rate by quarter
There were seven cases of HCA SAB in all Tasmanian public hospitals in Q1 2018. The corresponded to a combined Tasmanian public hospital rate of HCA SAB for Q1 2018 was 0.8 per 10 000 patient days (95% CI 0.2 – 1.3) which met the National Healthcare Agreement target of no more than two HCA SAB per10 000 patient days.
Page 6 of 30

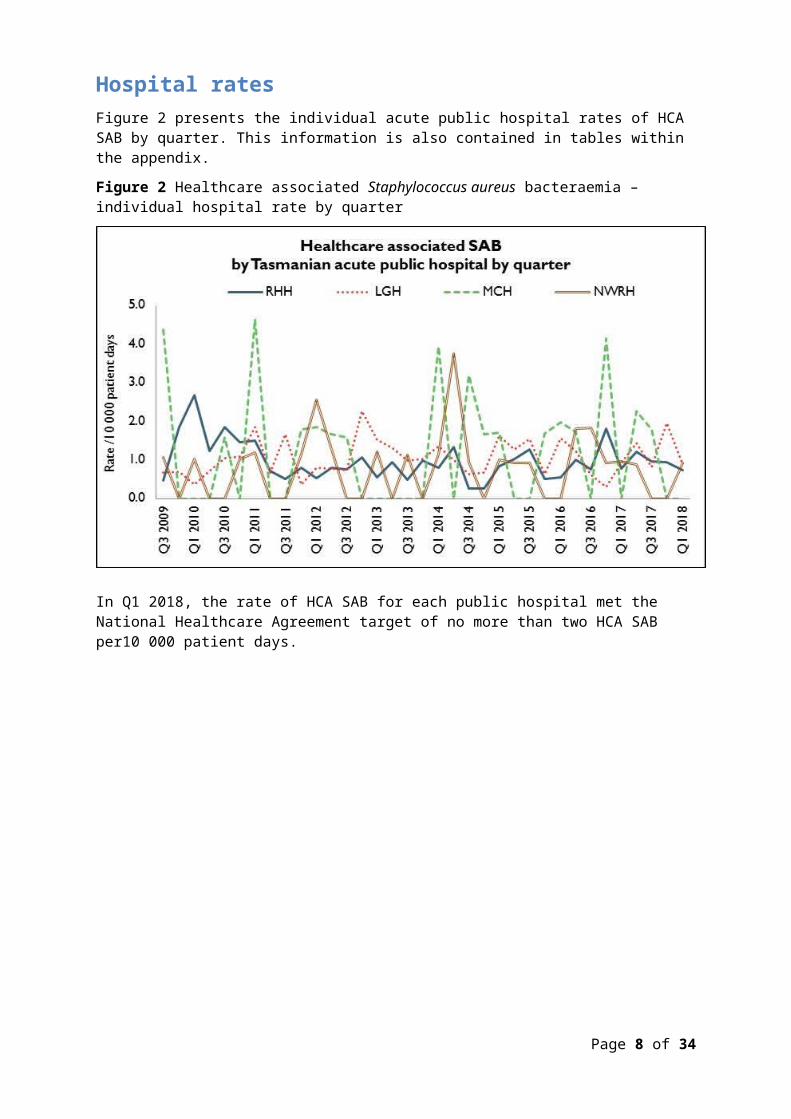
Hospital rates Figure 2 presents the individual acute public hospital rates of HCA SAB by quarter. This information is also contained in tables within the appendix.Figure 2 Healthcare associated Staphylococcus aureus bacteraemia – individual hospital rate by quarter
In Q1 2018, the rate of HCA SAB for each public hospital met the National Healthcare Agreement target of no more than two HCA SAB per10 000 patient days.
Page 7 of 30
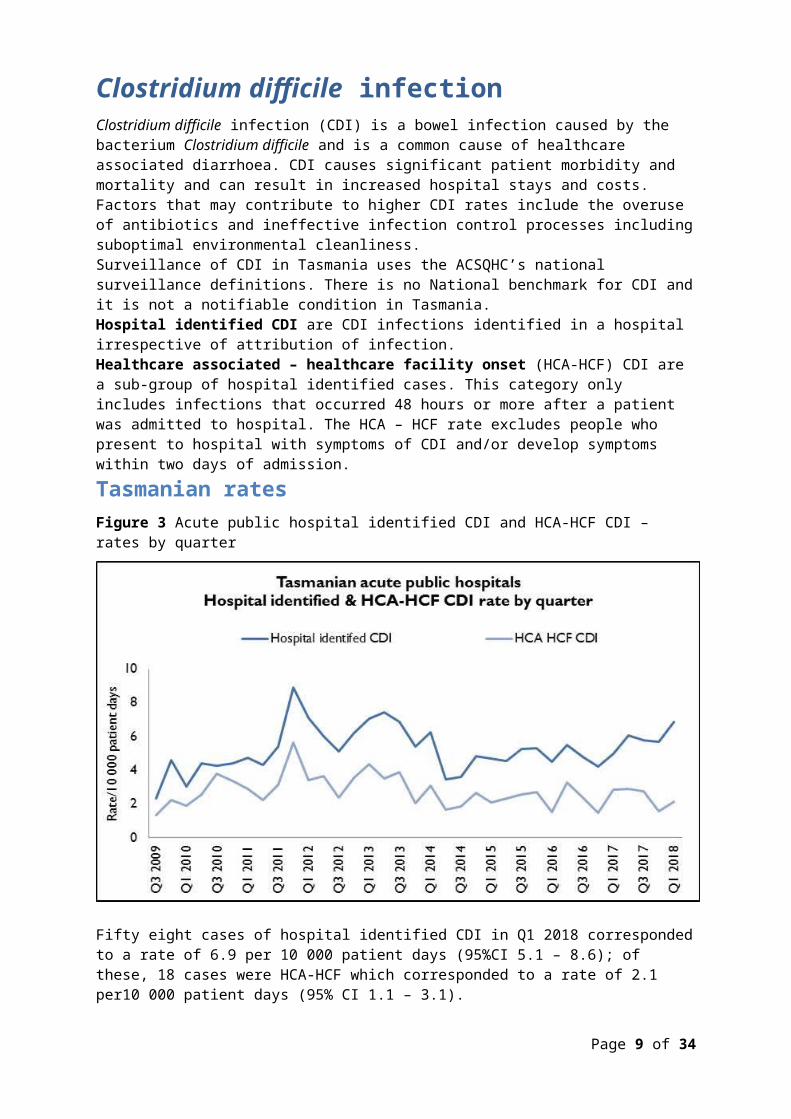
Clostridium difficile infection Clostridium difficile infection (CDI) is a bowel infection caused by the bacterium Clostridium difficile and is a common cause of healthcare associated diarrhoea. CDI causes significant patient morbidity and mortality and can result in increased hospital stays and costs. Factors that may contribute to higher CDI rates include the overuse of antibiotics and ineffective infection control processes including suboptimal environmental cleanliness. Surveillance of CDI in Tasmania uses the ACSQHC’s national surveillance definitions. There is no National benchmark for CDI and it is not a notifiable condition in Tasmania.Hospital identified CDI are CDI infections identified in a hospital irrespective of attribution of infection.Healthcare associated – healthcare facility onset (HCA-HCF) CDI are a sub-group of hospital identified cases. This category only includes infections that occurred 48 hours or more after a patient was admitted to hospital. The HCA – HCF rate excludes people who present to hospital with symptoms of CDI and/or develop symptoms within two days of admission. Tasmanian ratesFigure 3 Acute public hospital identified CDI and HCA-HCF CDI – rates by quarter
Fifty eight cases of hospital identified CDI in Q1 2018 corresponded to a rate of 6.9 per 10 000 patient days (95%CI 5.1 – 8.6); of these, 18 cases were HCA-HCF which corresponded to a rate of 2.1 per10 000 patient days (95% CI 1.1 – 3.1). The rate of HCA-HCF is higher than in Q4, 2017 but lower than in the first three quarters of 2017.
Page 8 of 30
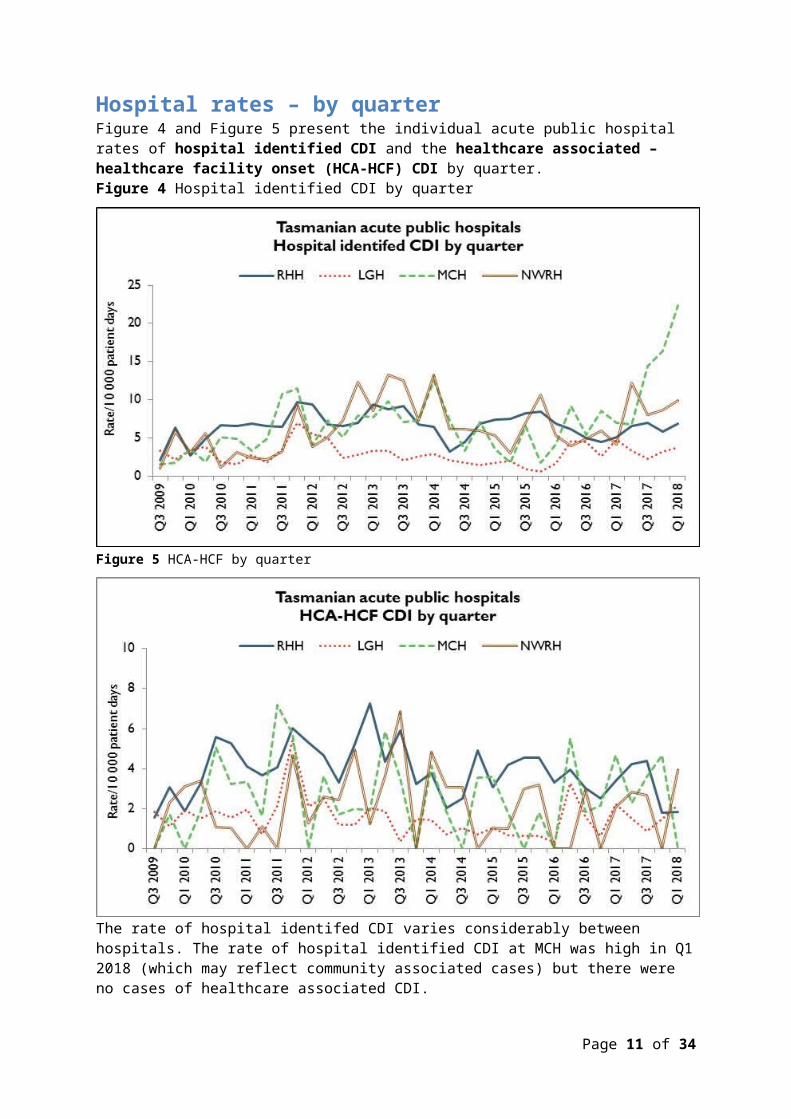
Hospital rates – by quarterFigure 4 and Figure 5 present the individual acute public hospital rates of hospital identified CDI and the healthcare associated – healthcare facility onset (HCA-HCF) CDI by quarter. Figure 4 Hospital identified CDI by quarter
Figure 5 HCA-HCF by quarter
The rate of hospital identifed CDI varies considerably between hospitals. The rate of hospital identified CDI at MCH was high in Q1 2018 (which may reflect community associated cases) but there were no cases of healthcare associated CDI.
Page 9 of 30

Vancomycin resistant enterococciEnterococci are bacteria normally present in the human gastrointestinal and female genital tract and can cause infections of the urinary tract, bloodstream and wounds. Enterococci that have acquired resistance to the antibiotic vancomycin are called vancomycin-resistant enterococci or VRE. VRE infections can be more difficult to treat then those caused by vancomycin sensitive enterococci. Factors that can contribute to the transmission of VRE in hospitals are inadequate infection control practices, overuse of antibiotics and suboptimal environmental cleanliness.Identification of VRE is notifiable in Tasmania pursuant to the Public Health Act 1997.Figure 6 presents all patients with a first VRE isolate identified within Tasmania by quarter. These numbers include all new patients identified within Tasmania from public and private hospitals, rural hospitals, GP clinics and long term and residential care facilities. A person’s first VRE isolate is classified according to whether it represents colonisation or infection.
Figure 6 First VRE isolates – classification by quarter
The number of people newly identified with VRE within hospitals does not necessarily reflect that VRE was acquired at that hospital. The numbers of VRE isolates identified can be affected by the amount of screening undertaken by hospitals and those that have an intensive screening program are likely to identify more VRE. The number of new VRE identified in Q1 2018 is the highest since surveillance of VRE began in 2007 and there has been an increase in the proportion of these isolates which have the vanA gene. Infections caused by vanA VRE can be more difficult to treat than infections caused by vanB VRE.
Page 10 of 30
Most isolates continue to be colonisations. The proportion of isolates that represent infections has remained stable over the last seven quarters with infections representing around three per cent of total isolates.
Page 11 of 30
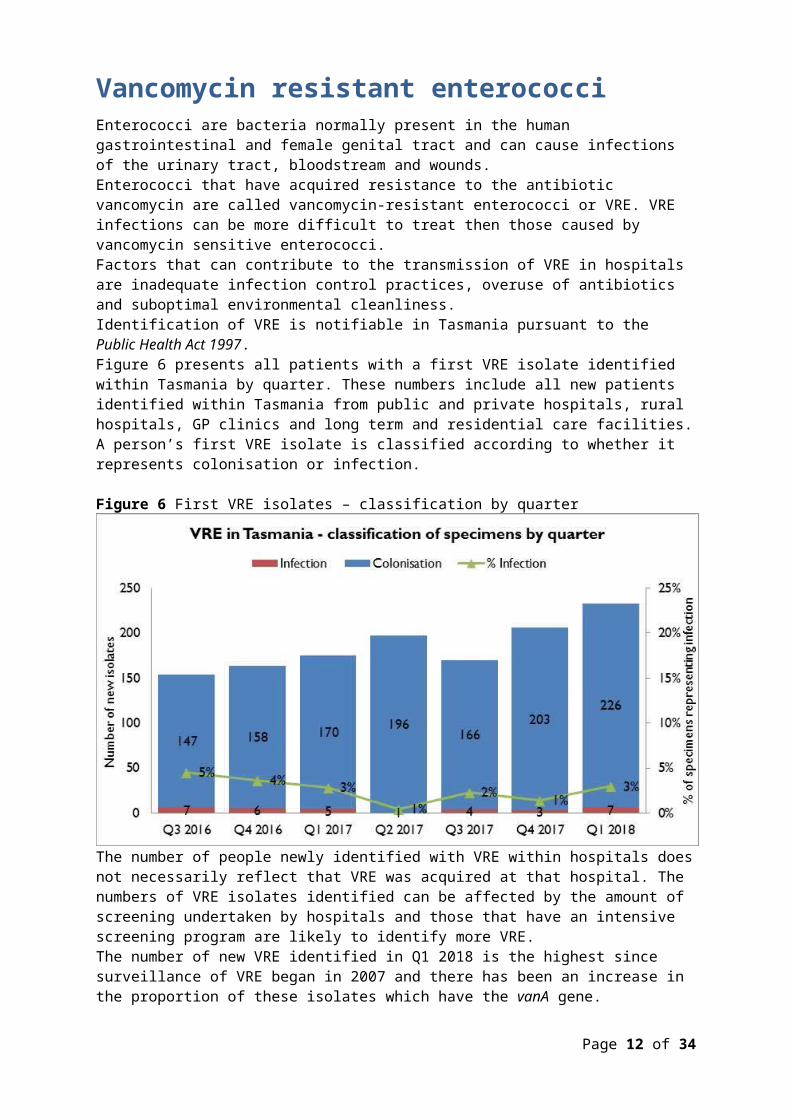
Figure 7 First VRE isolates - genotype by quarter
The majority of VRE within Tasmania remains vanB E. faecium. The number and proportion of isolates with the vanA genotype has increased substantially over the past two quarters and represents 37 per cent of the total isolates for the current quarter.
Page 12 of 30

Carbapenemase-producing EnterobacteriaceaeCarbapenem resistance in Enterobacteriaceae is an emerging clinical and public health problem that threatens the effectiveness of the last currently available antibiotic group – carbapenems – that are highly active against multi-drug resistant Gram negative organisms. The epidemiology of Carbapenemase-producing Enterobacteriaceae (CPE) varies between countries and it is evident that without active surveillance and subsequent stringent infection control measures these organisms may rapidly become endemic. In areas where few CPE cases have occurred, it is recommended that health departments take an aggressive approach to contain CPE. With current low prevalence rates, surveillance through mandatory laboratory notification creates an opportunity for proactive measures to prevent, detect and contain CPE within Tasmania. Identification of CPE was made notifiable in Tasmania pursuant to the Public Health Act 1997 in 2016 and there have been three cases of CPE identified in Tasmania since then. None were locally acquired.There were no cases of CPE identified in Tasmania in Q1 2018.
Page 13 of 30

Hand Hygiene The National Hand Hygiene Initiative (NHHI) was introduced in Tasmania in 2009 to increase healthcare workers hand hygiene compliance and monitor its effectiveness by measuring reductions in HCA SAB. Hand hygiene compliance is monitored by direct observation of healthcare workers performing hand hygiene at the appropriate times. Hand Hygiene Australia (HHA) requires hand hygiene compliance data to be submitted three times per year with all acute care areas in a facility audited at least once per annum ideally every audit period. The National Hand Hygiene Benchmark (NHHB) is ≥80 per cent for total moments, individual moments and each healthcare worker group.Tasmanian ratesFigure 8 Hand hygiene compliance in Tasmanian public hospitals
Audit period 1 2018 is from 1 November 2017 to 31 March 2018. For this period the overall Tasmanian public hospital compliance rate was 80 per cent which is the same as the NHHB. Campbell Town Health and Community Service did not submit hand hygiene compliance data for Audit Period One, 2018 due to auditor shortages. This has been rectified by training new auditors. The rate at King Island was based on only 16 moments submitted for the period (reflecting an auditor shortage). The compliance rate at Midlands MPC was also less than the NHHB but the rate of 71 per cent is evidence of continued improvement over the past two years. The LGH rate of 78 per cent is just below the NHHB and is a small (2 per cent) decrease in the rate since the previous data collection period. There are differences in the number of hand hygiene moments observed in the acute hospitals versus the rural hospitals and these numbers are presented in Table 13 in Appendix 2.
Page 14 of 30

Page 15 of 30
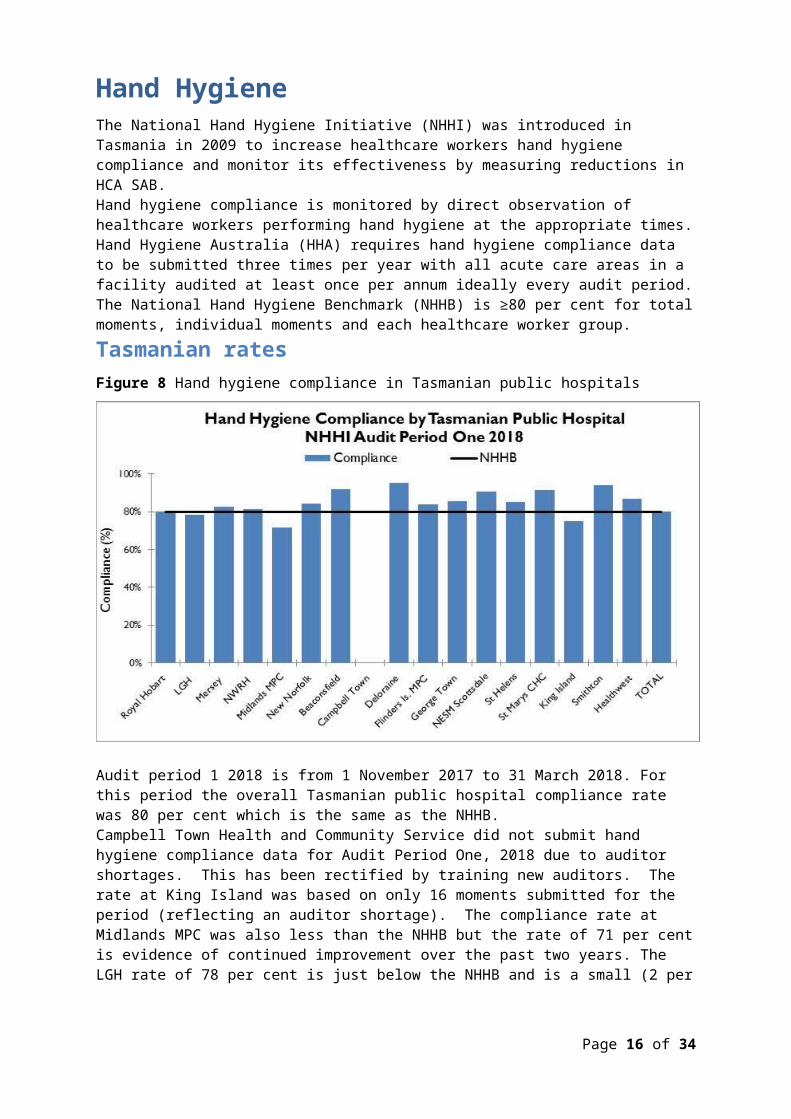
Figure 9 Hand hygiene compliance by moment
Hand hygiene compliance before touching a patient (Moment 1), undertaking a procedure (Moment 2) and after touching patient surroundings (Moment 5) are lower than the target of 80 per cent and lower than those reported after undertaking a procedure (Moment 3) or after touching a patient (Moment 4). Moment 1 and Moment 2 are key opportunities for hand hygiene that may have a direct effect on the risk of transmission of pathogens within the healthcare setting. Moment 2, particularly relates to compliance with appropriate aseptic technique and procedural activity. Work has commened to identify strategies to improve complaince with Moment 2 in all facilites.
Page 16 of 30

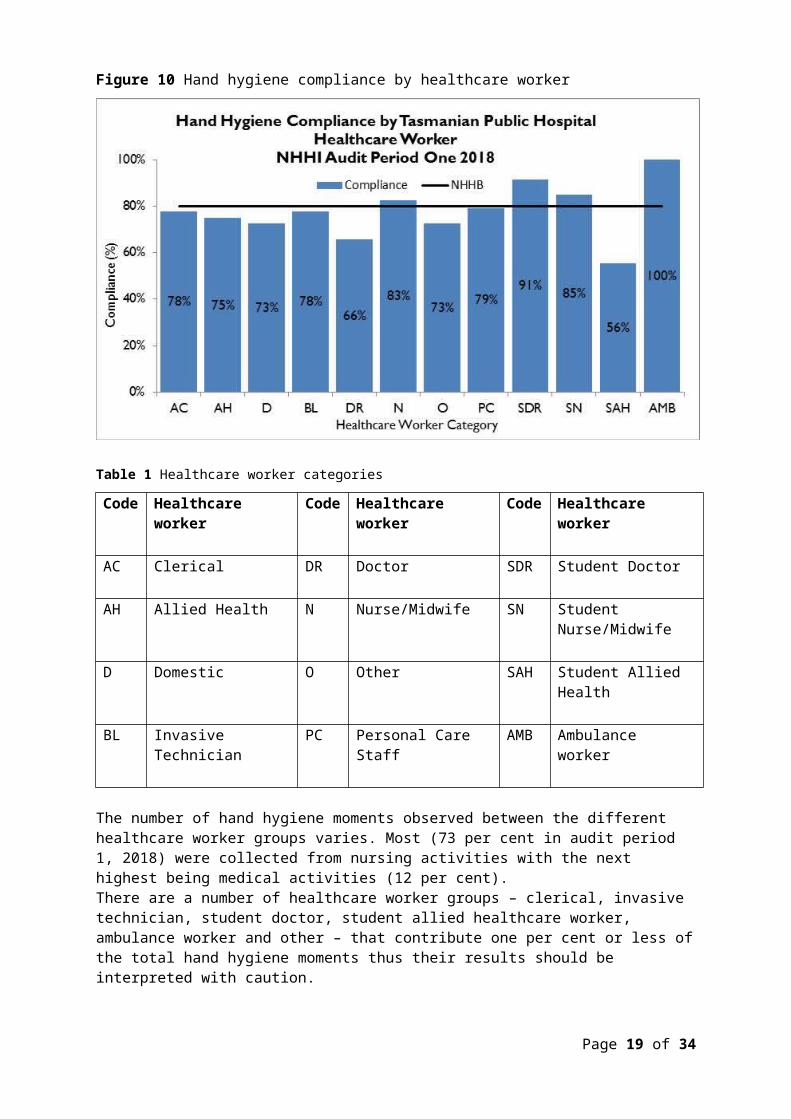
Figure 10 Hand hygiene compliance by healthcare worker
Table 1 Healthcare worker categories
Code
Healthcare worker
Code
Healthcare worker
Code
Healthcare worker
AC Clerical DR Doctor SDR Student Doctor
AH Allied Health N Nurse/Midwife SN Student Nurse/Midwife
D Domestic O Other SAH Student Allied Health
BL Invasive Technician
PC Personal Care Staff
AMB Ambulance worker
The number of hand hygiene moments observed between the different healthcare worker groups varies. Most (73 per cent in audit period 1, 2018) were collected from nursing activities with the next highest being medical activities (12 per cent). There are a number of healthcare worker groups – clerical, invasive technician, student doctor, student allied healthcare worker, ambulance worker and other – that contribute one per cent or less of the total hand hygiene moments thus their results should be interpreted with caution. Of the healthcare worker groups that contribute more than one per cent of the total moments, allied health staff, domestic staff, doctors and personal care staff
Page 17 of 30

are not meeting the compliance target of 80 per cent. Doctor compliance at 66 per cent, is well below the benchmark but has increased slightly since the last audit period. HHA is considering prioritising medical hand hygiene compliance for 2018/19.TIPCU continue to work with and support the work of HHA and the NHHI.
Page 18 of 30
AcknowledgementsThe production of this report is the culmination of data collection, analysis and input from several different organisations. In particular, we would like to acknowledge: Executive Director of Nursing North Executive Director of Nursing North West Nursing Director South – Critical Care, Clinical Support and Investigations Launceston General Hospital Infection Prevention and Control Unit North West Regional Hospital Infection Control Team Mersey Community Hospital Infection Control Team Royal Hobart Hospital Infection Prevention and Control Unit Microbiology Departments at the Royal Hobart Hospital, Launceston General
Hospital and DSPL Hand Hygiene Australia Communicable Diseases Prevention Unit, Public Health Services Contributing Primary Health Sites
Page 19 of 30

Appendix 1Explanatory notes What types of healthcare surveillance are done in Tasmania?TIPCU undertakes surveillance of the following: Staphylococcus aureus bacteraemia (bloodstream infection). Clostridium difficile infection (CDI). Vancomycin resistant enterococci (VRE). Carbapenemase-producing Enterobacteriaceae. Hand hygiene compliance rates. Antibiotic utilisation – reported annually. What do the rates mean? The healthcare surveillance data are expressed as a rate or a raw number. SAB and CDI are expressed as a rate per 10 000 patient days, VRE is expressed as a raw number, hand hygiene compliance is expressed as a percentage and antibiotic utilisation is expressed as hospital use measured by defined daily doses, per 1 000 occupied bed days. What are the definitions for Clostridium difficile infection (CDI)? TIPCU use the national surveillance definitions published by the Australian Commission on Safety and Quality in Health Care (ACSQHC) to classify CDI. TIPCU reports on:1. Hospital identified CDI is defined as a case diagnosed in a patient
attending an acute care facility. This includes positive specimens obtained from admitted patients and those attending the emergency department and outpatient departments. This definition excludes patients less than two years old and cases with a positive test within the previous eight weeks.
2. Healthcare associated – healthcare facility onset CDI (HCA-HCF CDI) is defined as a patient with CDI symptom onset (or date and time of stool specimen collection if a laboratory system is used) more than 48 hours after admission to a healthcare facility. This definition excludes patients less than two years old and cases with a positive test within the previous eight weeks.
Page 20 of 30

What are the definitions for healthcare associated Staphylococcus aureus bacteraemia (SAB)? Criterion A the patient’s first SAB blood culture was collected more than 48 hours after hospital admission or less than 48 hours after discharge.ORCriterion B the patient’s first positive SAB blood culture was collected less than or equal to 48 hours after hospital admission and one or more of the following key clinical criteria was met for the patient-episode of SAB.Key clinical criteria:1. SAB is a complication of the presence of an indwelling medical device (eg
intravascular line, haemodialysis vascular access, CSF shunt, urinary catheter).
2. SAB occurs within 30 days of a surgical procedure or 365 days for surgically implanted devices, where the SAB is related to the surgical site.
3. SAB was diagnosed within 48 hours of a related invasive instrumentation or incision.
4. SAB is associated with neutropenia (less 1 x 10⁹/L) contributed to by cytotoxic therapy.
What is the definition for vancomycin resistant enterococci (VRE)?The definition for VRE is an isolate identified as VRE by an accredited laboratory. TIPCU reports on the total number of people with new isolates of VRE identified in Tasmania per quarter and this number includes all people with new VRE isolates from public and private hospitals, rural hospitals, GP clinics and long term and residential care facilities. What is the definition for Carbapenemase-producing Enterobacteriaceae (CPE)?The definition for CPE is an Enterobacteriaceae isolate with a carbapenemase gene identified by an accredited laboratory. TIPCU reports on the total number of people with new isolates of CPE identified in Tasmania per annum and this number includes all people with new CPE isolates from public and private hospitals, rural hospitals, GP clinics and long term and residential care facilities. Confidence intervalsConfidence intervals are used to calculate the range in which the true rate probably lies. As an example, when looking at the hand hygiene compliance (HHC) data confidence intervals calculate the range in which the true compliance result lies, based on the data collected and the compliance measured, thus providing an indication of the reliability of the reported HHC level. When only a small number of moments are collected, the confidence interval will be larger, as it is more difficult to establish the true compliance level from a small sample of moments. If a large number of moments are collected the confidence interval will be smaller, meaning the reliability of the result is higher. Hand Hygiene Australia (HHA) calculates 95 per cent confidence intervals, indicating the intervals in which 95 per cent of the time the true compliance level lies (HHA 2011).
Page 21 of 30

Patient care daysPatient days is the term to explain the total days patients are in hospital. In Tasmania’s four larger acute public hospitals there are around 330 000 patient care days a year. When a rate is presented as a number per 10 000 patient days this presents the number of infections that occur for every 10 000 patient care days.Can I compare Tasmanian hospital infection rates?Each Tasmanian hospital provides different services and has patients with different levels of illness. This affects infection rates. For example, very sick immuno-compromised patients may be more likely to get infections. It is difficult to remove all of the factors outside the control of a hospital that can cause its infection rate to differ from other hospitals.Other reasons for caution when comparing hospitals include: some hospitals may screen patients more than others. This can affect data
for CDI and VRE in particular hospital laboratories may use different ways of identifying organisms. A
laboratory that has a more sensitive way of looking for organisms may find more
for hand hygiene, rural hospitals are not required to collect as many moments as the four acute public hospitals, which limits the comparability of data for rural and acute hospitals.
Page 22 of 30
Appendix 2Healthcare associated Staphylococcus aureus bacteraemia (SAB)Table 2 Tasmanian numbers and rate per 10 000 patient days of HCA-SAB. Quarter Total HCA-
SABNumber MSSA
Number MRSA
HCA SAB Rate
Q1 2016 8 6 2 1.0Q2 2016 11 10 1 1.2Q3 2016 7 7 0 0.8Q4 2016 11 10 1 1.3Q1 2017 7 6 1 0.8Q2 2017 12 10 2 1.3Q3 2017 8 8 0 0.8Q4 2017 11 8 3 1.2Q1 2018 7 7 0 0.8
Table 3 Royal Hobart Hospital numbers and rates per10 000 patient days of HCA-SABQuarter Total HCA-
SABNumber MSSA
Number MRSA
HCA SAB Rate
Q1 2016 2 2 0 0.5Q2 2016 4 4 0 1.0Q3 2016 3 3 0 0.8Q4 2016 7 7 0 1.8Q1 2017 3 2 1 0.8Q2 2017 5 5 0 1.2Q3 2017 4 4 0 1.0Q4 2017 4 3 1 0.9Q1 2018 3 3 0 0.7
Page 23 of 30
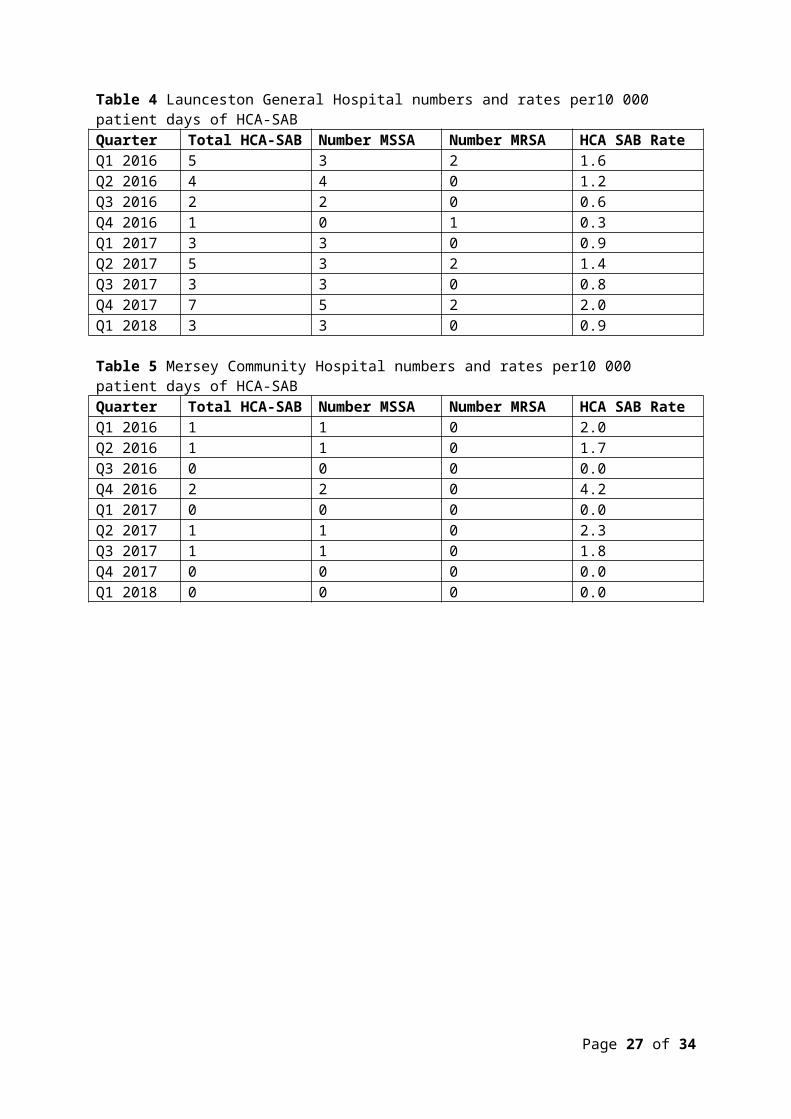
Table 4 Launceston General Hospital numbers and rates per10 000 patient days of HCA-SABQuarter Total HCA-
SABNumber MSSA
Number MRSA
HCA SAB Rate
Q1 2016 5 3 2 1.6Q2 2016 4 4 0 1.2Q3 2016 2 2 0 0.6Q4 2016 1 0 1 0.3Q1 2017 3 3 0 0.9Q2 2017 5 3 2 1.4Q3 2017 3 3 0 0.8Q4 2017 7 5 2 2.0Q1 2018 3 3 0 0.9
Table 5 Mersey Community Hospital numbers and rates per10 000 patient days of HCA-SABQuarter Total HCA-
SABNumber MSSA
Number MRSA
HCA SAB Rate
Q1 2016 1 1 0 2.0Q2 2016 1 1 0 1.7Q3 2016 0 0 0 0.0Q4 2016 2 2 0 4.2Q1 2017 0 0 0 0.0Q2 2017 1 1 0 2.3Q3 2017 1 1 0 1.8Q4 2017 0 0 0 0.0Q1 2018 0 0 0 0.0
Page 24 of 30
Table 6 North West Regional Hospital numbers and rates per10 000 patient days of HCA-SAB.Quarter Total HCA-
SABNumber MSSA
Number MRSA
HCA SAB Rate
Q1 2016 0 0 0 0.0Q2 2016 2 1 1 1.8Q3 2016 2 2 0 1.8Q4 2016 1 1 0 0.9Q1 2017 1 1 0 1.0Q2 2017 1 1 0 0.9Q3 2017 0 0 0 0.0Q4 2017 0 0 0 0.0Q1 2018 1 1 0 0.9
Clostridium difficile infection (CDI)Table 7 Tasmanian numbers and rates per10 000 patient days of CDI
Quarter Total hospital identified CDI
Hospital identified Rate
Total HCA HCF HCA HCF Rate
Q1 2016 35 4.5 12 1.5Q2 2016 45 5.5 17 2.1Q3 2016 40 4.8 20 2.4Q4 2016 34 4.2 12 1.5Q1 2017 40 5.0 23 2.9Q2 2017 52 6.1 25 2.9Q3 2017 52 5.8 25 2.8Q4 2017 50 5.7 14 1.6Q1 2018 58 6.9 18 2.1
Page 25 of 30

Table 8 Hospital numbers and rates per10 000 patient days of hospital identified CDI
Quarter RHH Total
RHH Rate
LGH Total
LGH Rate
MCH Total
MCH Rate
NWRH Total
NWRH Rate
Q1 2016 23 6.9 5 1.6 2 4.2 5 5.3Q2 2016 22 6.2 14 4.6 5 9.2 4 3.9Q3 2016 18 5.0 14 4.4 3 5.5 5 4.9Q4 2016 16 4.5 8 2.6 4 8.6 6 5.9Q1 2017 18 5.1 15 4.8 3 7.0 4 4.2Q2 2017 25 6.6 11 3.3 3 6.8 13 12.3Q3 2017 27 6.9 8 2.3 8 14.4 9 8.0Q4 2017 23 5.9 11 3.2 7 16.4 9 8.7Q1 2018 26 6.9 12 3.7 10 22.3 10 9.9
Table 9 Hospital numbers and rates per10 000 patient days of HCA-HCF CDIQuarter RHH
TotalRHH Rate
LGH Total
LGH Rate
MCH Total
MCH Rate
NWRH Total
NWRH Rate
Q1 2016
11 3.3 1 0.3 0 0.0 0 0.0
Q2 2016
14 3.9 10 3.3 3 5.5 0 0.0
Q3 2016
11 3.0 5 1.6 1 1.8 3 3.0
Q4 2016
9 2.5 2 0.7 1 2.1 0 0.0
Q1 2017
12 3.4 7 2.2 2 4.7 2 2.1
Q2 2017
16 4.2 5 1.5 1 2.3 3 2.8
Q3 2017
17 4.4 3 0.9 2 3.6 3 2.7
Q4 2017
7 1.8 5 1.5 2 4.7 0 0.0
Q1 2018
7 1.9 7 2.2 0 0.0 4 3.9
Page 26 of 30
Vancomycin resistant enterococci (VRE)
Table 10 First VRE isolates identified per quarter within acute public hospitals, and other healthcare settings (private hospitals, rural hospitals, GP clinics and long term and residential care facilities).Quarter
RHH LGH MCH NWRH Other healthcare settings
TOTAL
Q1 2016 28 26 7 4 8 73Q2 2016 51 48 12 14 12 138Q3 2016 30 65 8 23 28 154Q4 2016 51 67 5 15 26 164Q1 2017 41 82 13 13 26 175Q2 2017 70 78 9 12 28 197Q3 2017 28 89 10 11 32 170Q4 2017 58 85 10 21 32 206Q1 2018 78 89 6 27 33 233
Table 11 Classification of first VRE isolates – colonisation and infectionQuarter Total VRE Colonisation Infection % infectionQ1 2016 73 71 2 3%Q2 2016 138 134 4 3%Q3 2016 154 147 7 5%Q4 2016 164 158 6 4%Q1 2017 175 170 5 3%Q2 2017 197 196 1 1%Q3 2017 170 166 4 2%Q4 2017 206 203 3 1%Q1 2018 233 226 7 3%
Page 27 of 30
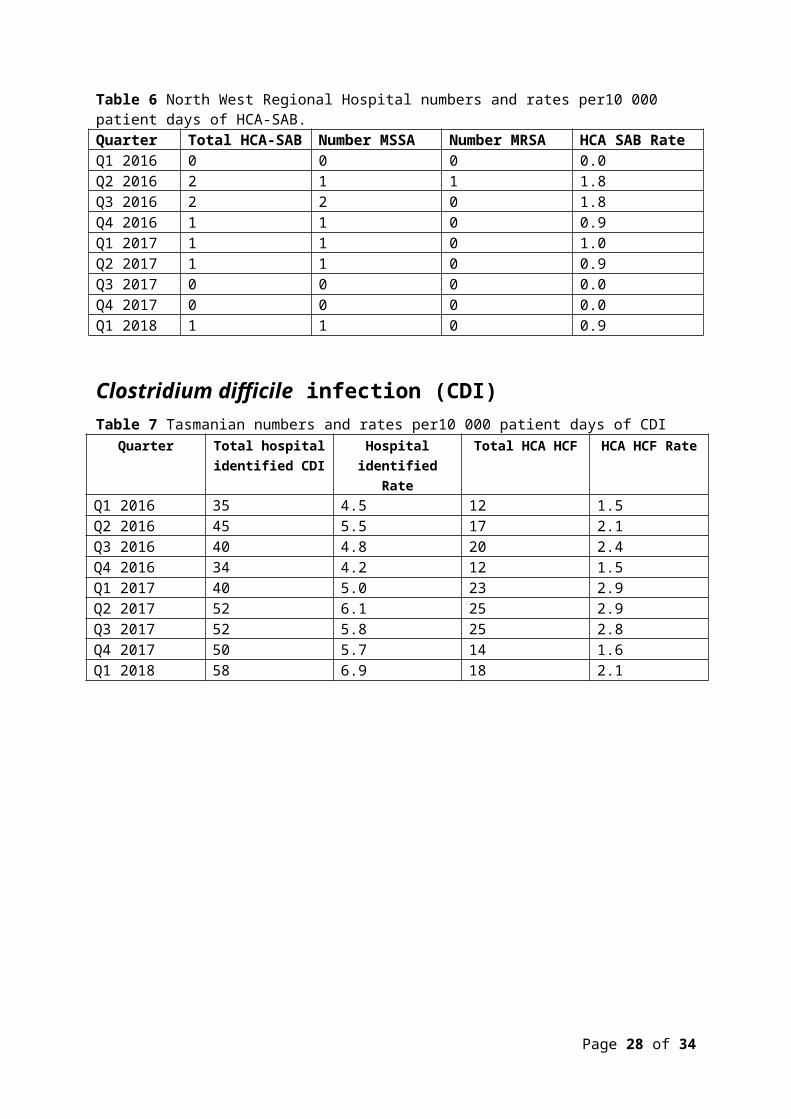
Table 12 First VRE isolates by genotype by quarterQuarter vanA vanB vanA and
vanBUnknown
Q1 2016 10 61 1 1Q2 2016 14 120 2 2Q3 2016 55 93 4 2Q4 2016 46 111 7 0Q1 2017 47 119 4 1Q2 2017 31 164 1 1Q3 2017 18 152 0 0Q4 2017 41 165 0 0Q1 2018 86 146 1 0
Page 28 of 30

Hand hygiene compliance data - audit period 1, 2018Table 13 Hand hygiene compliance rates by Tasmanian hospital and state level
Hospital Name
HH Correctly Performed
HH Moments ComplianceLower 95% confidence interval
Upper 95% confidence interval
Royal Hobart 2147 2688 80% 78% 81%LGH 4452 5693 78% 77% 79%Mersey 634 768 83% 80% 85%NWRH 570 702 81% 78% 84%Midlands MPC 35 49 71% 58% 82%New Norfolk 48 57 84% 73% 91%Beaconsfield 55 60 92% 82% 96%Campbell Town - - - - -Deloraine 118 124 95% 90% 98%Flinders Is. MPC 84 100 84% 76% 90%George Town 77 90 86% 77% 91%NESM Scottsdale 79 87 91% 83% 95%St Helens 68 80 85% 76% 91%St Marys CHC 98 107 92% 85% 96%King Island 12 16 75% 51% 90%Smithton 48 51 94% 84% 98%Healthwest 60 69 87% 77% 93%TOTAL 8585 10741 80% 79% 81%
Page 29 of 30

Table 14 Tasmanian hand hygiene compliance rates by moment
Moments
HH Correctly
Performed
Total HH Moments Compliance
Lower 95% confidence
interval
Upper 95% confidence
intervalMoment 1 2230 2968 75% 74% 77%Moment 2 557 792 70% 67% 73%Moment 3 981 1150 85% 83% 87%Moment 4 2874 3298 87% 86% 88%Moment 5 1943 2533 77% 75% 78%TOTAL 8585 10741 80% 79% 81%
Table 15 Tasmanian hand hygiene compliance rates by healthcare worker
Staff TypeHH
Correctly Performed
HH Moments Compliance
Lower 95% confidence
interval
Upper 95% confidence
intervalClerical 21 27 78% 59% 89%Allied Health 282 377 75% 70% 79%Domestic 175 241 73% 67% 78%Invasive Technician 70 90 78% 68% 85%Doctor 841 1282 66% 63% 68%Nurse/Midwife 6443 7806 83% 82% 83%Other 8 11 73% 43% 90%Personal care staff 356 450 79% 75% 83%Student Doctor 32 35 91% 78% 97%Student Nurse/Midwife 346 407 85% 81% 88%Student Allied Health 5 9 56% 27% 81%Ambulance worker 6 6 100% 61% 100%TOTAL 8585 10741 80% 79% 81%
Page 30 of 30
![ENVIRONMENTAL PROTECTION COMMISSION[567] · 2014-06-25 · wells, recreational-use wells, monitoring wells, heat pump supply wells or GHEX loop boreholes, industrial wells, and dewatering](https://static.fdocuments.us/doc/165x107/5f3f728939b254613866ae00/environmental-protection-commission567-2014-06-25-wells-recreational-use-wells.jpg)