CONTENTS · Syed Majid Ali Chief Financial Officer Mr. Aurangzeb Amin Company Secretary & Head of...
38
Transcript of CONTENTS · Syed Majid Ali Chief Financial Officer Mr. Aurangzeb Amin Company Secretary & Head of...

Third Quarter September 30, 2017 1
Registered Office
Faysal House, St-02, Sharah-e-Faisal, Karachi
Tel: 021-32795200 Fax: 021-32795226
CONTENTS
Condensed Interim Statement of Financial Position
Condensed Interim Profit and Loss Account
Condensed Interim Statement of Comprehensive Income
Condensed Interim Cash Flow Statement
Condensed Interim Statement of Changes in Equity
Notes to and Forming part of the Condensed Interim Financial Information
Corporate Information
Directors' Review
2
4
10
11
12
13
14
15

2 Third Quarter September 30, 2017
Board of Directors
Mr. Farooq Rahmatullah Khan Chairman/Non-Executive Director
Mr. Ahmed Abdulrahim Mohamed Abdulla Bucheery Vice Chairman/Non-Executive Director
Mr. Yousaf Hussain President & CEO
Mian Muhammad Younis Independent Director
Mr. Imtiaz Ahmad Pervez Non-Executive Director
Mr. Juma Hasan Ali Abul Non-Executive Director
Mr. Abdulelah Ebrahim Mohamed AlQasimi Non-Executive Director
Mr. Abdulla Abdulaziz Ali Taleb Non-Executive Director
Mr. Fuad Azim Hashimi Independent Director
Mr. Ali Munir Independent Director
Board Audit & Corporate Governance Committee
Mian Muhammad Younis Chairman
Mr. Juma Hasan Ali Abul Member
Mr. Ali Munir Member
Board Risk Management Committee
Mr. Imtiaz Ahmad Pervez Chairman
Mr. Abdulelah Ebrahim Mohamed AlQasimi Member
Mr. Abdulla Abdulaziz Ali Taleb Member
Mr. Yousaf Hussain Member
Recruitment Nomination and Remuneration Committee
Mr. Ahmed Abdulrahim Mohamed Abdulla Bucheery Chairman
Mr. Juma Hasan Ali Abul Member
Mian Muhammad Younis Member
Mr. Fuad Azim Hashimi Member
Mr. Ali Munir Member
Board Strategy Committee
Mr. Farooq Rahmatullah Khan Chairman
Mr. Ahmed Abdulrahim Mohamed Abdulla Bucheery Member
Mr. Juma Hasan Ali Abul Member
Mr. Fuad Azim Hashimi Member
Mr. Yousaf Hussain Member
CORPORATE INFORMATION

Third Quarter September 30, 2017 3
CORPORATE INFORMATION
Board IT Committee*
Mr. Ali Munir Chairman
Mr. Abdulelah Ebrahim Mohamed AlQasimi Member
Mr. Abdulla Abdulaziz Ali Taleb Member
Mr. Yousaf Hussain Member
(*Constituted on October 16, 2017)
Syed Majid Ali Chief Financial Officer
Mr. Aurangzeb Amin Company Secretary & Head of Legal
M/s. A.F. Ferguson & Co, Chartered Accountants Auditors
M/s. Mohsin Tayebaly & Co, Advocate Legal Advisors
Registered Office Share Registrar
Faysal Bank Limited M/s. Central Depository Company of
Faysal House, St-02, Commercial Lane, Pakistan Limited
Main Shahrah-e-Faisal, (Share Registrar Department)
Karachi-Pakistan CDC House, 99-B, Block-B,
SMCHS, Main Shahra-e-Faisal,
Karachi-74400
UAN : (92-21) 111-747-747
Tel : (92-21) 3279-5200 Tel: (92-21) 111-111-500
Fax : (92-21) 3279-5226 Fax: (92-21) 34326053
Website: www.faysalbank.com Email: [email protected]

4 Third Quarter September 30, 2017
DIRECTORS’ REVIEW
On behalf of the Board of Directors, we are pleased to present the Directors’ Report of Faysal
Bank Limited along with financial statements for nine months ended September 30, 2017.
Economic Update:
2016-2017 was the first fiscal year Pakistan completed after exiting the IMF program. The
authorities declared that the country may not need the IMF. However, the fears of reverting to
economic indiscipline without the IMF supervision have materialized as many budgetary
benchmarks were missed, the most notable being the current account and the fiscal deficit
targets which have broader implications for the economy. The current account deficit for FY17
was recorded at USD 12.1 bln as compared to USD 4.87 bln in the preceding year. Fiscal deficit
was recorded at 5.8% of GDP as compared to an initial target of 3.8%. The only silver lining in
terms of economy was CPI inflation that averaged at 4.15% comfortably below the revised 4.5 ~
5.5% target (SBP’s state of the economy report).
In contrast to FY17, 1st Qtr FY18 has witnessed a mix of economic ups and downs. The
deterioration in the current account deficit has continued; recording USD 2.6 bln in the first two
months of the current fiscal year vis-a-vis USD 1.29 bln during the corresponding period last
year. In stark contrast to the current account deficit, the fiscal deficit for the first quarter of FY18
was recorded at 0.9% of GDP as compared to 1.3% of GDP this time last year. This was
achieved primarily because of significant growth in tax collection. Inflation as highlighted by SBP
in its recent monetary policy is also set to remain manageable. It is definitely off to a good start
as the reading for the first quarter, as per SBP, has been recorded at 3.39% - well below the
annual target of 4.5%-5.5%. Furthermore, SBP has projected the fiscal account deficit of 5-6%
and current account deficit of 4-5% of GDP compared to the targets of 4.1% and 2.6%,
respectively.
The Pakistan Stock Exchange has suffered losses, having fallen about 25% from its pinnacle of
52,876 in May 2017 to 40,000 level in October 2017.
Going forward it would be critical that the external account is managed carefully. Decline of
foreign currency reserves at the current rate is unsustainable and may lead to another currency
crisis and push towards IMF.
Company Profile
Faysal Bank Limited (FBL) was incorporated in Pakistan on 3rd October, 1994 as a public limited
company. The Bank’s shares are listed on the Pakistan Stock Exchange. Its footprint spreads
over more than 114 cities with 376 branches and 372 ATM’s all over the country. Bank’s total
assets are in excess of PKR 472 billion.
FBL is engaged in Commercial, Retail, Corporate and Islamic banking activities. Its ambition is
to meet the financial needs of the customers while providing them high quality of service.
Branches have been transformed to multiproduct selling hub. Cross sell opportunities are being
pursued through synergies and partnerships between business segments within the Bank.

Third Quarter September 30, 2017 5
DIRECTORS’ REVIEW
FBL is on the path of transforming the bank into an Islamic Financial Institution. This will be done
after careful evaluation of the conversion progress while ensuring that the interest of all
stakeholders are sufficiently protected. Bank is also in the process of developing Digital Banking
strategy so as to provide secured, state of art and user friendly banking services to its
customers.
Bank foresees gradual resurgence in inflation due to growing aggregate demand and fiscal
deficit. The USD/PKR parity and KIBOR will remain under pressure. Main positive factor that
may boost Pakistan’s economy among others is the CPEC. In a low interest rate environment,
the Bank has extended its branch network to generate low cost deposits, increase its core
business on selective basis within chosen segments, rationalize its administrative & distribution
cost and recovery of non-performing loans from delinquent clients so as to maintain profitability.
The increase in branch network is expected to create sustainable value in terms of future
profitability of the Bank.
The Bank is aware of its responsibilities with regard to environment protection and has
undertaken the task of developing a comprehensive environment policy. To support environment,
in case of load shedding, FBL has shifted all its night branch network operations to heavy duty
UPS instead of generators, thereby reducing environmental hazards. Also strict working hours
are observed to benefit from natural light and save precious energy resources.
Bank’s Performance:
The Bank is pursuing a well-defined strategy with focus on technological advancement to
support digital banking, asset growth, cost efficiency and transformation to Islamic Banking.
Some of the notable milestones achieved during the period under review are as follows:
Project Financing & Syndication
Ÿ FBL acted as Joint Lead Arranger and Shariah Structuring Advisor for PKR 1,000 million
syndicated facility arranged under mix of Islamic & Conventional modes of financing. The
facility is being utilized to finance the procurement and installation of waste heat recovery
system at a leading cement manufacturer’s plant.
Ÿ FBL acted as Shariah Structuring Advisor for PKR 3,450 million syndicated facility arranged
under mix of Islamic & Conventional modes of financing. The facility is being utilized to
finance the Balancing, Modernization, Rehabilitation and Expansion (BMRE) requirements
of a leading cement plant.
Ÿ FBL acted as Joint Arranger and Shariah Structuring Advisor for PKR 4,480 million
syndicated facility arranged under mix of Islamic & Conventional modes of financing. The
facility is being utilized to partially finance acquisition of tangible assets of a sugar mill.

6 Third Quarter September 30, 2017
DIRECTORS’ REVIEW
Product Development & New Initiatives
Ÿ New home improvement proposition by the name of ‘Home Styles’ comprising of 16
partners and 1000+ products was introduced for credit card customers.
Ÿ Shariah compliant product “Barkat LifePlus Saving Account” catering specifically to the
financial needs of our senior citizen clients was launched.
Ÿ Barkat Kamil Business saving account product was revamped by adding Takaful coverage.
Ÿ Internet Banking has shown significant growth, 39,733 subscribers using this facility and
365,605 transactions worth PKR 10.3 bln were executed against 195,716 transactions
worth PKR 5.3 bln in 2016 making a total of 54% growth in usage.
Ÿ ATM transactions registered 28% growth in volume to PKR 130 bln. Credit Card spend
witnessed 32% increase over same period last year.
Ÿ Faysal bank E-Banking team has teamed up with 1LINK (Guarantee) Limited to launch
Pakistan’s First Domestic Payment Scheme “PayPak Debit Card”. This new card offers low
cost, easy and affordable solution to customers.
Training & Development
Ÿ 7,543 participants were trained in 3rd quarter with a total of 42,518 training man hours.
Ÿ Business continuity plan (BCP) operational readiness training was conducted to all relevant
stake holders.
Ÿ The online Islamic Banking training has been completed by 86% of our Bank staff.
Ÿ More than 1,000 staff members were imparted regulatory trainings as part of our annual
refreshers in 3rd quarter of 2017.
Ÿ 65 Branch Service (Trainee) Officers graduated after completing their on job trainings and
were placed in branches.
Ÿ Soft Skills training has been initiated for Branch Operations and Distribution teams.
Corporate Social Responsibility:
Ÿ President & CEO celebrated the independence day with young cancer patients of Child Aid
Association at National Institute of Child Health. Donation was also given to the hospital.
Ÿ New relationship with Bait ul Sukoon Cancer Hospital has been established.

Third Quarter September 30, 2017 7
Future Outlook:
In line with Bank’s strategic decision of gradual transformation into an Islamic Bank, 50 new
Islamic branches are being opened in 2017. Bank is in the process of developing a seamless
end-to-end branch technology based conversion solution for swift and efficient branch
conversions to Islamic Banking.
The Bank will continue with its growth momentum in terms of ramping up its loan book, with
primary focus on SME segment through branch led model, consumer finance and new customer
inductions within both Commercial & Corporate business segments.
Focus on internal controls & compliance with both regulatory guidelines and adherence to best
practices would remain a centerpiece of the strategy. The Bank will also remain focused on its
sound risk management framework, including credit, operational and IT risk management
practices.
Financial Highlights:
DIRECTORS’ REVIEW
Operating Profit
September
2017
September
2016
PKR in Million
Reversal / ( provision) for non-performing advances
6,084
(295)
Reversal for diminution in value of investments 4
Reversal against off balance sheet obligations 6
(285)
Profit before tax 5,799
Provision for taxation (2,051)
Profit after tax 3,748
Earnings per share – Rupees 2.84
5,585
764
1
-
765
6,350
(2,525)
3,825
2.90
Bank earned Profit after Tax of PKR 3.825 bln as against PKR 3.748 bln of corresponding period
of the last year, registering an improvement of 2.0%. This growth in profitability is despite of the
fact that 2016 nine months profit included capital gain on PIB’s amounting to PKR 1.5 bln which
was not available in the current period. Bank improved its net margins by reducing cost of
deposits and increasing its lending book. Recoveries of non-performing loans resulted in a net-
reversal of provisions to the tune of PKR 765 mln against charge of PKR 285 mln in the
corresponding period last year. As a result, EPS of the Bank increased to PKR 2.90 from
8 Third Quarter September 30, 2017
DIRECTORS’ REVIEW
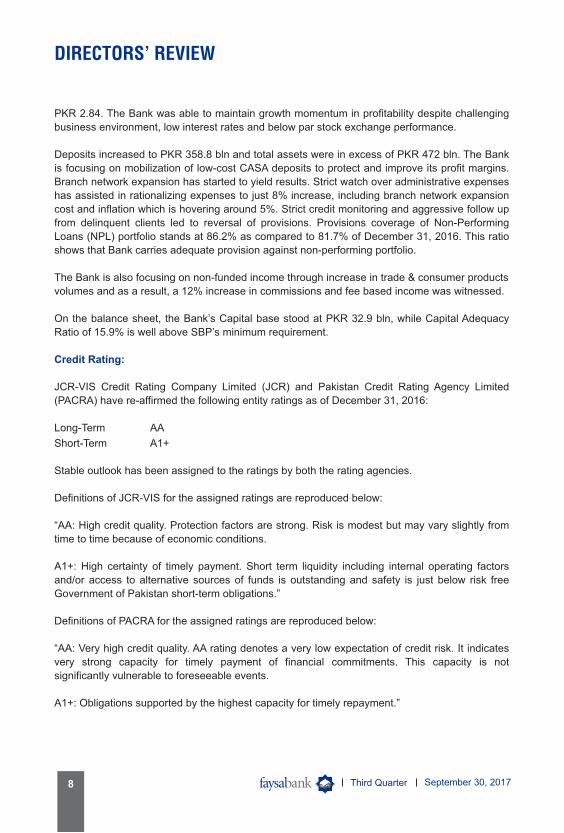
PKR 2.84. The Bank was able to maintain growth momentum in profitability despite challenging
business environment, low interest rates and below par stock exchange performance.
Deposits increased to PKR 358.8 bln and total assets were in excess of PKR 472 bln. The Bank
is focusing on mobilization of low-cost CASA deposits to protect and improve its profit margins.
Branch network expansion has started to yield results. Strict watch over administrative expenses
has assisted in rationalizing expenses to just 8% increase, including branch network expansion
cost and inflation which is hovering around 5%. Strict credit monitoring and aggressive follow up
from delinquent clients led to reversal of provisions. Provisions coverage of Non-Performing
Loans (NPL) portfolio stands at 86.2% as compared to 81.7% of December 31, 2016. This ratio
shows that Bank carries adequate provision against non-performing portfolio.
The Bank is also focusing on non-funded income through increase in trade & consumer products
volumes and as a result, a 12% increase in commissions and fee based income was witnessed.
On the balance sheet, the Bank’s Capital base stood at PKR 32.9 bln, while Capital Adequacy
Ratio of 15.9% is well above SBP’s minimum requirement.
Credit Rating:
JCR-VIS Credit Rating Company Limited (JCR) and Pakistan Credit Rating Agency Limited
(PACRA) have re-affirmed the following entity ratings as of December 31, 2016:
Long-Term AA
Short-Term A1+
Stable outlook has been assigned to the ratings by both the rating agencies.
Definitions of JCR-VIS for the assigned ratings are reproduced below:
“AA: High credit quality. Protection factors are strong. Risk is modest but may vary slightly from
time to time because of economic conditions.
A1+: High certainty of timely payment. Short term liquidity including internal operating factors
and/or access to alternative sources of funds is outstanding and safety is just below risk free
Government of Pakistan short-term obligations.”
Definitions of PACRA for the assigned ratings are reproduced below:
“AA: Very high credit quality. AA rating denotes a very low expectation of credit risk. It indicates
very strong capacity for timely payment of financial commitments. This capacity is not
significantly vulnerable to foreseeable events.
A1+: Obligations supported by the highest capacity for timely repayment.”

Third Quarter September 30, 2017 9
Acknowledgement:
On behalf of the Board and Management of the bank, we would like to take this opportunity to
express our sincere thanks to the shareholders for the trust they have reposed in the Bank. We
are also grateful to the State Bank of Pakistan and Securities and Exchange Commission of
Pakistan for their continued support and guidance and the customers for their patronage. We
would also like to express sincere appreciation for the employees of the Bank for their dedication
and hard work.
On behalf of the board of Directors
President & CEO Chairman
Karachi
Dated: October 25, 2017
DIRECTORS’ REVIEW
10 Third Quarter September 30, 2017
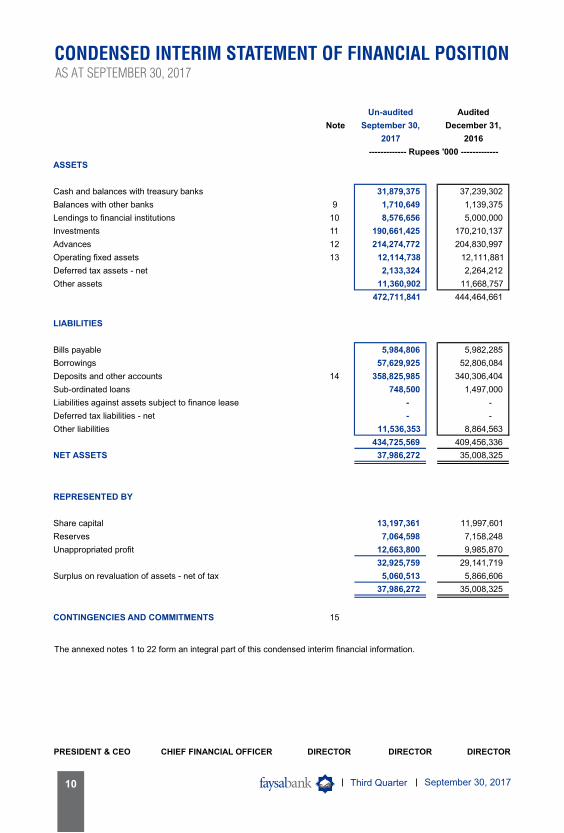
CONDENSED INTERIM STATEMENT OF FINANCIAL POSITIONAS AT SEPTEMBER 30, 2017
PRESIDENT & CEO CHIEF FINANCIAL OFFICER DIRECTOR DIRECTOR DIRECTOR
Un-audited Audited
Note September 30, December 31,
2017 2016
ASSETS
Cash and balances with treasury banks 31,879,375 37,239,302
Balances with other banks 9 1,710,649 1,139,375
Lendings to financial institutions 10 8,576,656 5,000,000
Investments 11 190,661,425 170,210,137
Advances 12 214,274,772 204,830,997
Operating fixed assets 13 12,114,738 12,111,881
Deferred tax assets - net 2,133,324 2,264,212
Other assets 11,360,902 11,668,757
472,711,841 444,464,661
LIABILITIES
Bills payable 5,984,806 5,982,285
Borrowings 57,629,925 52,806,084
Deposits and other accounts 14 358,825,985 340,306,404
Sub-ordinated loans 748,500 1,497,000
Liabilities against assets subject to finance lease - -
Deferred tax liabilities - net - -
Other liabilities 11,536,353 8,864,563
434,725,569 409,456,336
NET ASSETS 37,986,272 35,008,325
REPRESENTED BY
Share capital 13,197,361 11,997,601
Reserves 7,064,598 7,158,248
Unappropriated profit 12,663,800 9,985,870
32,925,759 29,141,719
Surplus on revaluation of assets - net of tax 5,060,513 5,866,606
37,986,272 35,008,325
CONTINGENCIES AND COMMITMENTS 15
The annexed notes 1 to 22 form an integral part of this condensed interim financial information.
------------- Rupees '000 -------------
Third Quarter September 30, 2017 11
The annexed notes 1 to 22 form an integral part of this condensed interim financial information.
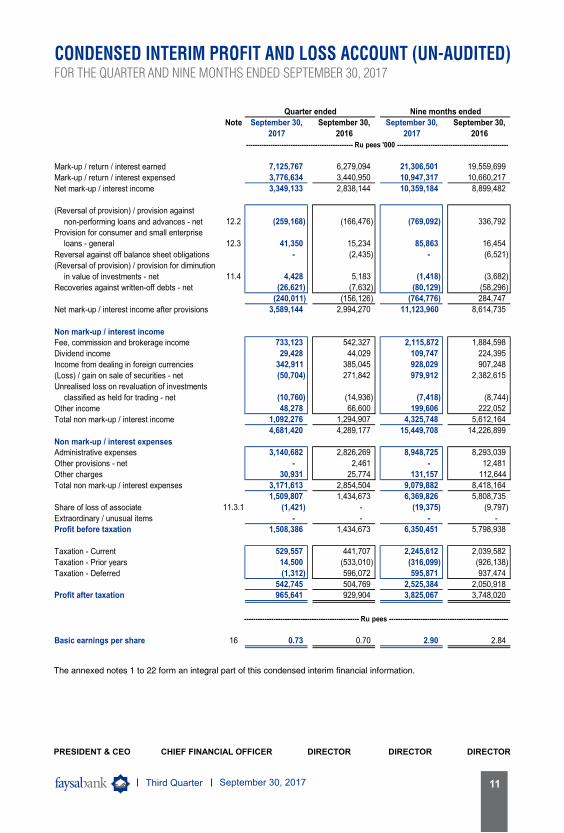
CONDENSED INTERIM PROFIT AND LOSS ACCOUNT (UN-AUDITED)FOR THE QUARTER AND NINE MONTHS ENDED SEPTEMBER 30, 2017
PRESIDENT & CEO CHIEF FINANCIAL OFFICER DIRECTOR DIRECTOR DIRECTOR
Note September 30, September 30, September 30, September 30,
2017 2016 2017 2016
Mark-up / return / interest earned 7,125,767 6,279,094 21,306,501 19,559,699
Mark-up / return / interest expensed 3,776,634 3,440,950 10,947,317 10,660,217
Net mark-up / interest income 3,349,133 2,838,144 10,359,184 8,899,482
(Reversal of provision) / provision against
non-performing loans and advances - net 12.2 (259,168) (166,476) (769,092) 336,792
Provision for consumer and small enterprise
loans - general 12.3 41,350 15,234 85,863 16,454
Reversal against off balance sheet obligations - (2,435) - (6,521)
(Reversal of provision) / provision for diminution
in value of investments - net 11.4 4,428 5,183 (1,418) (3,682)
Recoveries against written-off debts - net (26,621) (7,632) (80,129) (58,296)
(240,011) (156,126) (764,776) 284,747
Net mark-up / interest income after provisions 3,589,144 2,994,270 11,123,960 8,614,735
Non mark-up / interest income
Fee, commission and brokerage income 733,123 542,327 2,115,872 1,884,598
Dividend income 29,428 44,029 109,747 224,395
Income from dealing in foreign currencies 342,911 385,045 928,029 907,248
(Loss) / gain on sale of securities - net (50,704) 271,842 979,912 2,382,615
Unrealised loss on revaluation of investments
classified as held for trading - net (10,760) (14,936) (7,418) (8,744)
Other income 48,278 66,600 199,606 222,052
Total non mark-up / interest income 1,092,276 1,294,907 4,325,748 5,612,164
4,681,420 4,289,177 15,449,708 14,226,899
Non mark-up / interest expensesAdministrative expenses 3,140,682 2,826,269 8,948,725 8,293,039
Other provisions - net - 2,461 - 12,481
Other charges 30,931 25,774 131,157 112,644
Total non mark-up / interest expenses 3,171,613 2,854,504 9,079,882 8,418,164
1,509,807 1,434,673 6,369,826 5,808,735
Share of loss of associate 11.3.1 (1,421) - (19,375) (9,797)
Extraordinary / unusual items - - - -
Profit before taxation 1,508,386 1,434,673 6,350,451 5,798,938
Taxation - Current 529,557 441,707 2,245,612 2,039,582
Taxation - Prior years 14,500 (533,010) (316,099) (926,138)
Taxation - Deferred (1,312) 596,072 595,871 937,474
542,745 504,769 2,525,384 2,050,918
Profit after taxation 965,641 929,904 3,825,067 3,748,020
Basic earnings per share 16 0.73 0.70 2.90 2.84
Quarter ended Nine months ended
------------------------------------------------ Ru pees '000 --------------------------------------------------
--------------------------------------------------- Ru pees -----------------------------------------------------
12 Third Quarter September 30, 2017
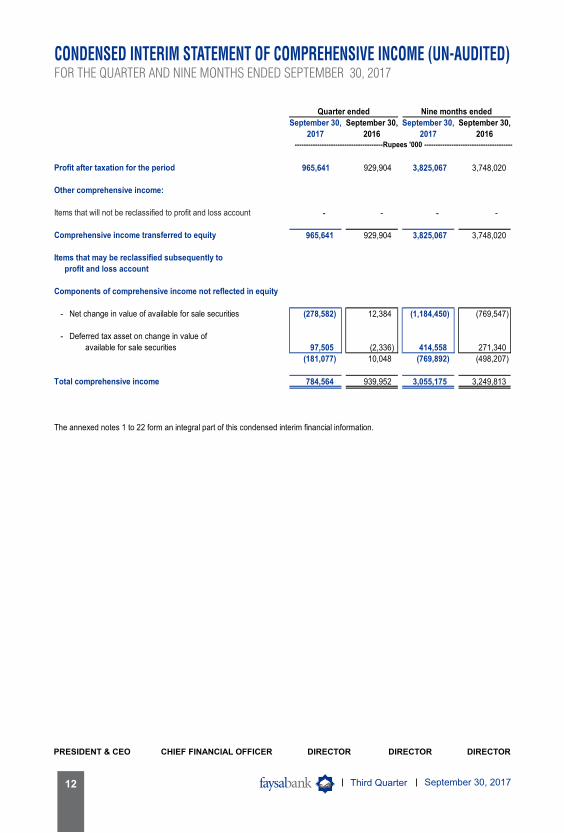
CONDENSED INTERIM STATEMENT OF COMPREHENSIVE INCOME (UN-AUDITED)FOR THE QUARTER AND NINE MONTHS ENDED SEPTEMBER 30, 2017
PRESIDENT & CEO CHIEF FINANCIAL OFFICER DIRECTOR DIRECTOR DIRECTOR
September 30, September 30, September 30, September 30,
2017 2016 2017 2016
Profit after taxation for the period 965,641 929,904 3,825,067 3,748,020
Other comprehensive income:
Items that will not be reclassified to profit and loss account - - - -
Comprehensive income transferred to equity 965,641 929,904 3,825,067 3,748,020
Items that may be reclassified subsequently to
profit and loss account
Components of comprehensive income not reflected in equity
- Net change in value of available for sale securities (278,582) 12,384 (1,184,450) (769,547)
- Deferred tax asset on change in value of
available for sale securities 97,505 (2,336) 414,558 271,340
(181,077) 10,048 (769,892) (498,207)
Total comprehensive income 784,564 939,952 3,055,175 3,249,813
The annexed notes 1 to 22 form an integral part of this condensed interim financial information.
Quarter ended Nine months ended
--------------------------------------- Rupees '000 ---------------------------------------
Third Quarter September 30, 2017 13
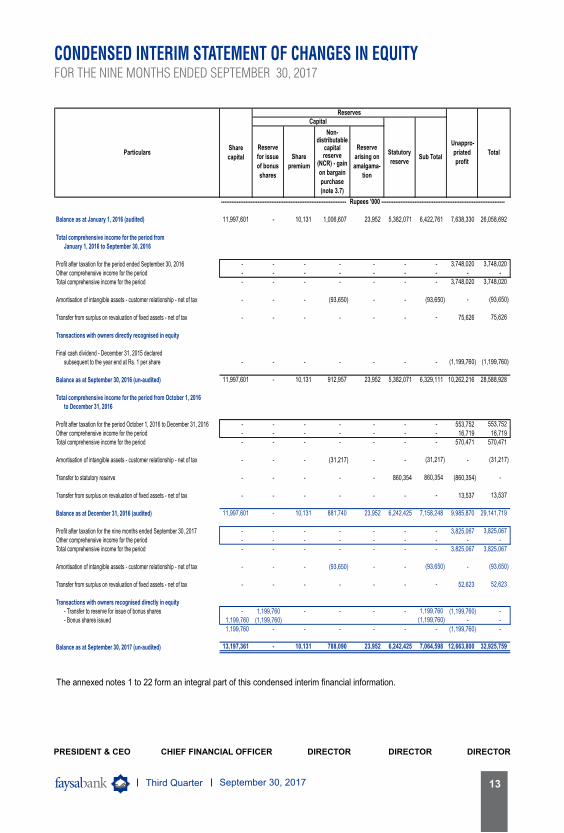
CONDENSED INTERIM STATEMENT OF CHANGES IN EQUITY FOR THE NINE MONTHS ENDED SEPTEMBER 30, 2017
PRESIDENT & CEO CHIEF FINANCIAL OFFICER DIRECTOR DIRECTOR DIRECTOR
Balance as at January 1, 2016 (audited) 11,997,601 - 10,131 1,006,607 23,952 5,382,071 6,422,761 7,638,330 26,058,692
Total comprehensive income for the period fromJanuary 1, 2016 to September 30, 2016
Profit after taxation for the period ended September 30, 2016 - - - - - - - 3,748,020 3,748,020
Other comprehensive income for the period - - - - - - - - -
Total comprehensive income for the period - - - - - - - 3,748,020 3,748,020
Amortisation of intangible assets - customer relationship - net of tax - - - (93,650) - - (93,650) - (93,650)
Transfer from surplus on revaluation of fixed assets - net of tax - - - - - - - 75,626 75,626
Transactions with owners directly recognised in equity
Final cash dividend - December 31, 2015 declaredsubsequent to the year end at Rs. 1 per share - - - - - - - (1,199,760) (1,199,760)
Balance as at September 30, 2016 (un-audited) 11,997,601 - 10,131 912,957 23,952 5,382,071 6,329,111 10,262,216 28,588,928
Total comprehensive income for the period from October 1, 2016to December 31, 2016
Profit after taxation for the period October 1, 2016 to December 31, 2016 - - - - - - - 553,752 553,752
Other comprehensive income for the period - - - - - - - 16,719 16,719Total comprehensive income for the period - - - - - - - 570,471 570,471
Amortisation of intangible assets - customer relationship - net of tax - - - (31,217) - - (31,217) - (31,217)
Transfer to statutory reserve - - - - - 860,354 860,354 (860,354) -
Transfer from surplus on revaluation of fixed assets - net of tax - - - - - - - 13,537 13,537
Balance as at December 31, 2016 (audited) 11,997,601 - 10,131 881,740 23,952 6,242,425 7,158,248 9,985,870 29,141,719
Profit after taxation for the nine months ended September 30, 2017 - - - - - - - 3,825,067 3,825,067
Other comprehensive income for the period - - - - - - - - -
Total comprehensive income for the period - - - - - - - 3,825,067 3,825,067
Amortisation of intangible assets - customer relationship - net of tax - - - (93,650) - - (93,650) - (93,650)
Transfer from surplus on revaluation of fixed assets - net of tax - - - - - - - 52,623 52,623
Transactions with owners recognised directly in equity- Transfer to reserve for issue of bonus shares - 1,199,760 - - - - 1,199,760 (1,199,760) -
- Bonus shares issued 1,199,760 (1,199,760) (1,199,760) - -
1,199,760 - - - - - - (1,199,760) -
Balance as at September 30, 2017 (un-audited) 13,197,361 - 10,131 788,090 23,952 6,242,425 7,064,598 12,663,800 32,925,759
The annexed notes 1 to 22 form an integral part of this condensed interim financial information.
Non-distributable
capital reserve
(NCR) - gain
on bargain
purchase
(note 3.7)
Reserve
arising on
amalgama-
tion
------------------------------------------------------------------------ Rupees '000 -----------------------------------------------------------------------
ParticularsShare
capital
Reserves
Unappro-
priated
profit
Total
Capital
Statutory
reserveSub Total
Reserve
for issue
of bonus
shares
Share
premium
14 Third Quarter September 30, 2017
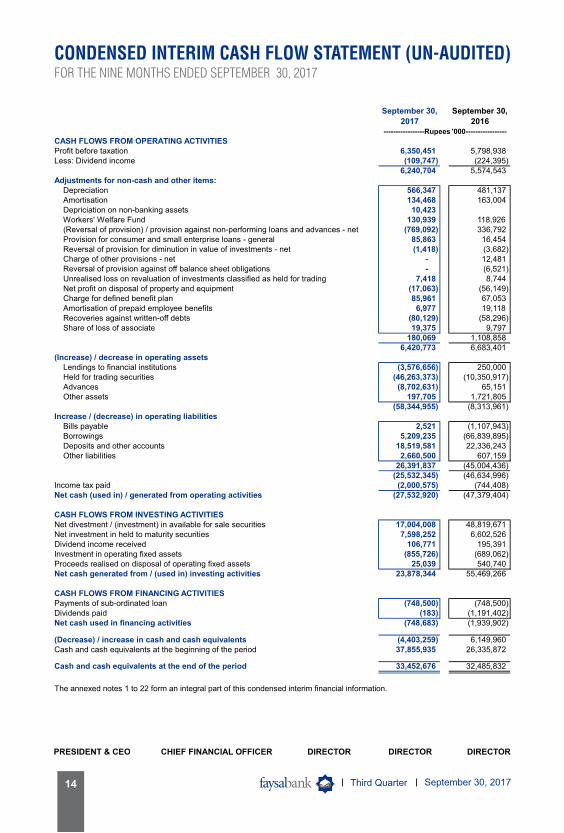
CONDENSED INTERIM CASH FLOW STATEMENT (UN-AUDITED)FOR THE NINE MONTHS ENDED SEPTEMBER 30, 2017
PRESIDENT & CEO CHIEF FINANCIAL OFFICER DIRECTOR DIRECTOR DIRECTOR
September 30, September 30,
2017 2016
CASH FLOWS FROM OPERATING ACTIVITIESProfit before taxation 6,350,451 5,798,938Less: Dividend income (109,747) (224,395)
6,240,704 5,574,543Adjustments for non-cash and other items:
Depreciation 566,347 481,137Amortisation 134,468 163,004Depriciation on non-banking assets 10,423Workers' Welfare Fund 130,939 118,926(Reversal of provision) / provision against non-performing loans and advances - net (769,092) 336,792Provision for consumer and small enterprise loans - general 85,863 16,454Reversal of provision for diminution in value of investments - net (1,418) (3,682)Charge of other provisions - net - 12,481Reversal of provision against off balance sheet obligations - (6,521)Unrealised loss on revaluation of investments classified as held for trading 7,418 8,744Net profit on disposal of property and equipment (17,063) (56,149)Charge for defined benefit plan 85,961 67,053Amortisation of prepaid employee benefits 6,977 19,118Recoveries against written-off debts (80,129) (58,296)Share of loss of associate 19,375 9,797
180,069 1,108,8586,420,773 6,683,401
(Increase) / decrease in operating assetsLendings to financial institutions (3,576,656) 250,000Held for trading securities (46,263,373) (10,350,917)Advances (8,702,631) 65,151Other assets 197,705 1,721,805
(58,344,955) (8,313,961)Increase / (decrease) in operating liabilities
Bills payable 2,521 (1,107,943)Borrowings 5,209,235 (66,839,895)Deposits and other accounts 18,519,581 22,336,243Other liabilities 2,660,500 607,159
26,391,837 (45,004,436)(25,532,345) (46,634,996)
Income tax paid (2,000,575) (744,408)Net cash (used in) / generated from operating activities (27,532,920) (47,379,404)
CASH FLOWS FROM INVESTING ACTIVITIESNet divestment / (investment) in available for sale securities 17,004,008 48,819,671Net investment in held to maturity securities 7,598,252 6,602,526Dividend income received 106,771 195,391Investment in operating fixed assets (855,726) (689,062)Proceeds realised on disposal of operating fixed assets 25,039 540,740Net cash generated from / (used in) investing activities 23,878,344 55,469,266
CASH FLOWS FROM FINANCING ACTIVITIESPayments of sub-ordinated loan (748,500) (748,500)Dividends paid (183) (1,191,402)Net cash used in financing activities (748,683) (1,939,902)
(Decrease) / increase in cash and cash equivalents (4,403,259) 6,149,960Cash and cash equivalents at the beginning of the period 37,855,935 26,335,872
Cash and cash equivalents at the end of the period 33,452,676 32,485,832
The annexed notes 1 to 22 form an integral part of this condensed interim financial information.
-----------------Rupees '000-----------------

Third Quarter September 30, 2017 15
1 STATUS AND NATURE OF BUSINESS
1.1 Faysal Bank Limited (the Bank) was incorporated in Pakistan on October 3, 1994 as a public limited company under the provisions of the Companies Ordinance, 1984. Its shares are listed on the Pakistan Stock Exchange Limited. The Bank is mainly engaged in Corporate, Commercial and Consumer banking activities. The Bank has a network of 376 branches (December 31, 2016: 355); including 168 Islamic banking branches (December 31, 2016: 146) and 1 Islamic sub-branch (December 31, 2016: 1) in Pakistan.
The Registered Office of the Bank is located at Faysal House, ST-02, Shahra-e-Faisal, Karachi.
IB Bank B.S.C (closed)- a wholly owned subsidiary of Ithmaar Holding Company B.S.C, is the parent company of the Bank, holding directly and indirectly 66.78% (December 31, 2016: 66.78%) of the shareholding of the Bank. Dar Al-Maal Al-Islami Trust (DMIT), (ultimate parent of the Bank) is the holding company of Ithmaar Holding Company B.S.C.
1.2 Based on the financial statements of the Bank for the year ended December 31, 2016, the Pakistan Credit Rating Agency Limited (PACRA) and JCR-VIS Credit Rating Company Limited have determined the Bank's long-term rating as 'AA' (December 31, 2015: 'AA') and the short term rating as 'A1+' (December 31, 2015: 'A1+').
2 BASIS OF PRESENTATION
2.1 In accordance with the directives of the Federal Government regarding the shifting of the banking system to Islamic modes, the State Bank of Pakistan (SBP) has issued various circulars from time to time. Permissible forms of trade related modes of financing include purchase of goods by banks from their customers and immediate resale to them at appropriate mark-up in price on deferred payment basis. The purchases and sales arising under these arrangements are not reflected in this condensed interim financial information as such but are restricted to the amount of facility actually utilised and the appropriate portion of mark-up thereon.
2.2 The results of the Islamic banking branches have been consolidated in this condensed interim financial information for reporting purposes only. Inter branch transactions and balances have been eliminated. In accordance with the directives issued by the SBP, the key financial figures of Islamic banking branches are disclosed in note 20 to this condensed interim financial information.
3 STATEMENT OF COMPLIANCE
3.1 This condensed interim financial information has been prepared in accordance with the approved accounting standards as applicable in Pakistan. The approved accounting standards comprise of such International Financial Reporting Standards (IFRSs) issued by the International Accounting Standards Board (IASB) and Islamic Financial Accounting Standards (IFASs) issued by the Institute of Chartered Accountants of Pakistan, as are notified under the Companies Ordinance, 1984, the requirements of the Companies Ordinance, 1984, the requirements of the Banking Companies Ordinance, 1962, or the directives issued by the Securities & Exchange Commission of Pakistan (SECP) and the SBP. Wherever the requirements of the Companies Ordinance, 1984, the Banking Companies Ordinance, 1962, the IFASs notified under the Companies Ordinance, 1984 or the directives issued by the SECP and the SBP differ with the requirements of IFRSs, the requirements of the Companies Ordinance, 1984, the Banking Companies Ordinance, 1962, IFASs n otified under the Companies Ordinance, 1984 or the requirements of the said directives issued by the SECP and the SBP prevail. The Companies Ordinance, 1984 has been repealed after the enactment of the Companies Act, 2017. However, as allowed by the SECP vide its circular no 23 dated October 04, 2017, this condensed interim financial information has been prepared in accordance with the provisions of the repealed Companies Ordinance, 1984.
3.2 The SBP has deferred the applicability of International Accounting Standard (IAS) 39, 'Financial Instruments: Recognition and Measurement' and International Accounting Standard (IAS) 40, 'Investment Property' for Banking Companies through BSD Circular Letter No. 10 dated August 26, 2002 till further instructions. Further, the SECP has also deferred the applicability of International Financial Reporting Standard (IFRS) 7, 'Financial Instruments: Disclosures' through its S.R.O. 633(I)/2014 dated July 10, 2014. Accordingly, the requirements of these standards have not been considered in the preparation of this condensed interim financial information. However, investments have been classified and valued in accordance with the requirements prescribed by the SBP through various circulars.
3.3 IFRS 8, 'Operating Segments' is effective for the Bank's accounting period beginning on or after January 1, 2009. All banking companies in Pakistan are required to prepare their condensed interim financial information in line with the format prescribed by the SBP. The management of the Bank believes that as the SBP has defined the segment categorisation in the above mentioned format, the SBP's requirements prevail over the requirements specified in IFRS 8. Accordingly, segment information disclosed in this condensed interim financial information is based on the requirements laid down by the SBP.
NOTES TO AND FORMING PART OF THE CONDENSED INTERIM FINANCIAL INFORMATION (UN-AUDITED)FOR THE NINE MONTHS ENDED SEPTEMBER 30, 2017
16 Third Quarter September 30, 2017
3.4 The SBP vide its BSD Circular No. 07 dated April 20, 2010 has clarified that for the purpose of preparation of financial statements in accordance with International Accounting Standard - 1 (Revised), 'Presentation of Financial Statements', two statement approach shall be adopted i.e. separate 'Profit and Loss Account' and 'Statement of Comprehensive Income' shall be presented, and Balance Sheet shall be renamed as 'Statement of Financial Position'. Furthermore, only the surplus / (deficit) on revaluation of available for sale (AFS) securities, may be included in the 'Statement of Comprehensive Income'. However, it should continue to be shown separately in the statement of financial position below equity. Accordingly, the above requirements have been adopted in the preparation of this condensed interim financial information.
3.5 The SECP has directed that the requirements of IFRS 10, 'Consolidated Financial Statements' are not applicable in case of investments by Companies in mutual funds established under Trust Deed structure. Accordingly, implications of IFRS 10 in respect of mutual funds are not considered in the preparation of this condensed interim financial information.
3.6 The disclosures made in this condensed interim financial information have been limited based on the format prescribed by the State Bank of Pakistan through BSD Circular Letter No. 2 dated May 12, 2004 and the requirements of International Accounting Standard 34, "Interim Financial Reporting". They do not include all of the information required for the full annual financial statements and this condensed interim financial information should be read in conjunction with the financial statements of the Bank for the year ended December 31, 2016.
3.7 As per the directive of the SBP through its letter BPRD (R&P-02)/625-99/2011/3744 dated March 28, 2011, gain arising on bargain purchase of Pakistan operations of Royal Bank of Scotland (ex-RBS Pakistan) was credited directly into equity as Non-Distributable Capital Reserve (NCR). The SBP allowed the Bank to adjust the amortisation of intangible assets against the portion of reserve which arose on account of such assets. Accordingly, during the period ended September 30, 2017 the Bank has adjusted amortisation of intangible assets amounting to Rs. 93.650 million (net of tax) from the Non-distributable Capital Reserve.
3.8 The SBP vide its BPRD Circular No. 04 dated February 25, 2015 has clarified that the reporting requirements of IFAS-3 for Institutions offering Islamic Financial Services (IIFS) relating to annual, half yearly and quarterly financial statements would be notified by SBP through issuance of specific instructions and uniform disclosure formats in consultation with (IIFS). These reporting requirements have not been ratified to date. Accordingly, the disclosure requirements under IFAS 3 have not been considered in this condensed interim financial information.
4 BASIS OF MEASUREMENT
This condensed interim financial information has been prepared under the historical cost convention, except that certain fixed assets and non-banking assets acquired in satisfaction of claims are carried at revalued amounts and certain investments and derivative contracts have been marked to market and are carried at fair value. In addition, obligation in respect of staff retirement benefit is carried at present value.
5 FUNCTIONAL AND PRESENTATION CURRENCY
Items included in this condensed interim financial information are measured using the currency of the primary economic environment in which the Bank operates. This condensed interim financial information is presented in Pakistani Rupees, which is the Bank's functional and presentation currency.
6 SUMMARY OF SIGNIFICANT ACCOUNTING POLICIES
The accounting policies applied in the preparation of this condensed interim financial information are the same as those applied in the preparation of the annual financial statements of the Bank for the year ended December 31, 2016.
7 CRITICAL ACCOUNTING ESTIMATES AND JUDGMENTS
The basis and the methods used for critical accounting estimates and judgments adopted in this condensed interim financial information are the same as those applied in the preparation of the annual financial statements of the Bank for the year ended December 31, 2016.
8 FINANCIAL RISK MANAGEMENT
The Bank's Financial Risk Management objectives and policies are consistent with those disclosed in the annual financial statements for the year ended December 31, 2016.
NOTES TO AND FORMING PART OF THE CONDENSED INTERIM FINANCIAL INFORMATION (UN-AUDITED)FOR THE NINE MONTHS ENDED SEPTEMBER 30, 2017

Third Quarter September 30, 2017 17
Un-audited Audited
Note September 30, December9 BALANCES WITH OTHER BANKS 2017 31, 2016
In Pakistan
- Current accounts 1,227,660 699,488
Outside Pakistan
- Current accounts 482,989 439,887
1,710,649 1,139,375
10 LENDINGS TO FINANCIAL INSTITUTIONS
Call money lending 1,500,000 -
Repurchase agreement lendings 3,000,000 5,000,000
Bai Muajjal with State Bank of Pakistan 10.1 4,076,656 -
8,576,656 5,000,000
10.1 Bai Muajjal placements - gross 4,188,664 -
Less: deferred income (49,577) -
Less: profit receivable shown in other assets (62,431) -
Bai Muajjal placements - net 4,076,656 -
----------------------Rupees '000--------------------
11 INVESTMENTS
11.1 Investments by type Note
Held for trading securities
Market Treasury Bills
Pakistan Investment Bonds
Fully paid up ordinary shares / certificates ofclosed end mutual funds
Available for sale securities
Market Treasury Bills
Pakistan Investment Bonds
Ijara Sukuk Bonds
Sukuk Bonds
Units of open end mutual funds
- Faysal Balanced Growth Fund *
- Faysal Income Growth Fund *
- Faysal Savings Growth Fund *
- Faysal Islamic Savings Growth Fund *
- Faysal Financial Sector Opportunity Fund *
Fully paid up ordinary shares / modaraba certificates /
certificates of closed end mutual funds 11.2Fully paid up preference shares
Term finance certificates
Held to maturity securities
Pakistan Investment Bonds
Term finance certificates
Sukuk Bonds
Associate *
Fully paid up ordinary shares of
Faysal Asset Management Limited 11.3
Investments at cost
Less: Provision for diminution in the value of investments 11.4 &12.2.1
Investments (net of provisions)
Surplus on revaluation of investments
classified as held for trading - net
Surplus / (deficit) on revaluation of investments
classified as available for sale - net
Total investments - net
* related parties
TotalHeld by
BankGiven ascollateral
Total
September 30, 2017 December 31, 2016
Held by Bank
Given ascollateral
AuditedUn-audited
-
-
-
-
29,646,237
2,074,936
-
-
-
-
-
-
-
-
-
-
31,721,173
-
-
-
-
-
31,721,173
-
31,721,173
-
(20,137)
31,701,036
533,530
1,170,038
-
1,703,568
59,502,461
41,351,395
4,474,967
2,900,000
37,480
257,544
680,606
189,432
-
4,370,242
22,490
762,149
114,548,766
9,931,757
2,455,213
11,861,617
24,248,587
46,032
140,546,953
(3,265,833)
137,281,120
461
1,227,520
138,509,101
36,557,759
11,396,147
13,035
47,966,941
86,728,260
25,519,376
6,312,593
5,118,895
37,480
257,544
680,606
189,432
15,000
3,696,836
22,490
687,419
129,265,931
-
2,107,588
14,542,74716,650,335
26,657
193,909,864
(3,264,415)
190,645,449
(6,957)
22,933
190,661,425
533,530
1,170,038
-
1,703,568
89,148,698
43,426,331
4,474,967
2,900,000
37,480
257,544
680,606
189,432
-
4,370,242
22,490
762,149
146,269,939
9,931,757
2,455,213
11,861,617
24,248,587
46,032
172,268,126
(3,265,833)
169,002,293
461
1,207,383
170,210,137
1,082,858
-
-
1,082,858
34,852,283
-
-
-
-
-
-
-
-
-
-
-
34,852,283
-
-
-
-
-
35,935,141
-
35,935,141
48
1,955
35,937,144
35,474,901
11,396,147
13,035
46,884,083
51,875,977
25,519,376
6,312,593
5,118,895
37,480
257,544
680,606
189,432
15,000
3,696,836
22,490
687,419
94,413,648
-
2,107,588
14,542,747
16,650,335
26,657
157,974,723
(3,264,415)
154,710,308
(7,005)
20,978
154,724,281
------------------------------------------------ Rupees '000 --------------------------------------------------------
NOTES TO AND FORMING PART OF THE CONDENSED INTERIM FINANCIAL INFORMATION (UN-AUDITED)FOR THE NINE MONTHS ENDED SEPTEMBER 30, 2017

18 Third Quarter September 30, 2017
11.2 These include an investment of the Bank in unlisted shares of DHA Cogen Limited (DHA) (a related party of the Bank) representing 19.1% (December 31, 2016: 19.1%) equity holding of DHA.
11.3 Investment of the Bank in Faysal Asset Management Limited (FAML) has been accounted for under the equity method of accounting as per the requirement of IAS 28 - Investment in associates and joint ventures. The Bank's share of post acquisition profit or loss is recognised using the latest available un-audited financial statements of FAML which relate to the period ended September 30, 2017 with a corresponding adjustment to the carrying amount of investment. The details of the Bank's investment, post acquisition changes and certain other details relating to FAML are as under:
Note Un-audited Audited
September 30, December 31,
11.3.1 Faysal Asset Management Limited - 2017 2016
percentage holding 30% (December 31, 2016: 30%)
At January 1 46,032 68,082
Post acquisition changes during the period / year
- recognised in the profit and loss account
Closing Balance
Cost of investment 45,000 45,000
11.3.2 Summary of the financial information of the associate
Revenue for the period / year 32,942 139,032
Net Loss for the period / year (10,071) (73,499)
Assets 129,114 166,896
Liabilities 40,255 13,456
Net Assets 88,859 153,440
Percentage (%) holding of the Bank 30% 30%
Share of net assets of the Bank 26,657 46,032
11.4 Particulars of provision for diminution in the value of investments
Opening balance 3,265,833 3,282,763
Charge for the period / year 57,501 75,478
Reversals during the period / year (58,919) (92,408)
(1,418) (16,930)
Closing balance 3,264,415 3,265,833
12 ADVANCES
185,488,607 180,518,663
9,061,423 10,431,613
194,550,030 190,950,276
Bills discounted and purchased (excluding government treasury bills)
Loans, cash credits, running finances, etc. – in Pakistan
Net investment in finance lease – in Pakistan
- Payable in Pakistan 2,655,086 5,289,466
- Payable outside Pakistan 910,227 909,279
3,565,313 6,198,745
Islamic financing and related assets 40,274,939 32,588,297
Margin financing / reverse repo transactions 88,200 88,200
Gross advances 238,478,482 229,825,518
Provision against non-performing advances 12.1 & 12.2 (23,653,590) (24,530,264)
Provision against consumer and small enterprise loans - general 12.3 (550,120) (464,257)
(24,203,710) (24,994,521)
Advances - net of provision 214,274,772 204,830,997
(19,375) (22,050)
26,657 46,032
----------------------Rupees '000--------------------
NOTES TO AND FORMING PART OF THE CONDENSED INTERIM FINANCIAL INFORMATION (UN-AUDITED)FOR THE NINE MONTHS ENDED SEPTEMBER 30, 2017
Third Quarter September 30, 2017 19
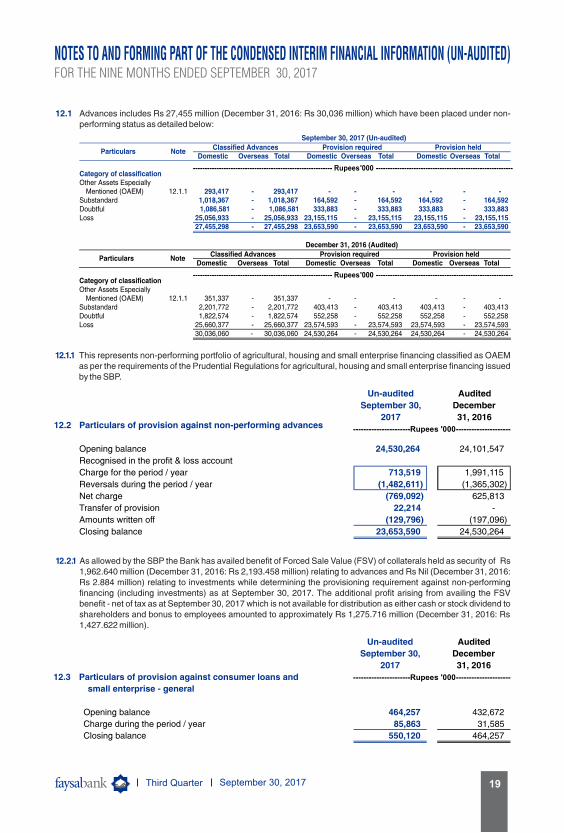
12.1 Advances includes Rs 27,455 million (December 31, 2016: Rs 30,036 million) which have been placed under non-performing status as detailed below:
Domestic Overseas Total Domestic Overseas Total Domestic Overseas Total
Category of classificationOther Assets Especially
Mentioned (OAEM) 293,417 - 293,417 - - - - - -Substandard 1,018,367 - 1,018,367 164,592 - 164,592 164,592 - 164,592Doubtful 1,086,581 - 1,086,581 333,883 - 333,883 333,883 - 333,883Loss 25,056,933 - 25,056,933 23,155,115 - 23,155,115 23,155,115 - 23,155,115
27,455,298 - 27,455,298 23,653,590 - 23,653,590 23,653,590 - 23,653,590
Category of classificationOther Assets Especially
Mentioned (OAEM) - - - -Substandard - - - 403,413Doubtful - - - 552,258Loss - - - 23,574,593
351,3372,201,7721,822,574
25,660,37730,036,060 -
OverseasDomestic Total
351,3372,201,7721,822,574
25,660,37730,036,060
-403,413552,258
23,574,59324,530,264 -
OverseasDomestic Total
-403,413552,258
23,574,59324,530,264
Overseas TotalDomestic
-403,413552,258
23,574,59324,530,264 - 24,530,264
ParticularsProvision held
Particulars
12.1.1
12.1.1
Note
Note
December 31, 2016 (Audited)
September 30, 2017 (Un-audited)
Classified Advances Provision required Provision held
Classified Advances Provision required
----------------------------------------------------------- Rupees '000 ----------------------------------------------------------
----------------------------------------------------------- Rupees '000 ----------------------------------------------------------
12.1.1 This represents non-performing portfolio of agricultural, housing and small enterprise financing classified as OAEM as per the requirements of the Prudential Regulations for agricultural, housing and small enterprise financing issued by the SBP.
Un-audited Audited
September 30, December
2017 31, 201612.2 Particulars of provision against non-performing advances
Opening balance 24,530,264 24,101,547
Recognised in the profit & loss account
Charge for the period / year 713,519 1,991,115
Reversals during the period / year (1,482,611) (1,365,302)
Net charge (769,092) 625,813
Transfer of provision 22,214 -
Amounts written off (129,796) (197,096)
Closing balance 23,653,590 24,530,264
----------------------Rupees '000---------------------
Un-audited Audited
September 30, December
2017 31, 2016
12.3 Particulars of provision against consumer loans and
small enterprise - general
Opening balance 464,257 432,672
Charge during the period / year 85,863 31,585
Closing balance 550,120 464,257
----------------------Rupees '000---------------------
12.2.1 As allowed by the SBP the Bank has availed benefit of Forced Sale Value (FSV) of collaterals held as security of Rs 1,962.640 million (December 31, 2016: Rs 2,193.458 million) relating to advances and Rs Nil (December 31, 2016: Rs 2.884 million) relating to investments while determining the provisioning requirement against non-performing financing (including investments) as at September 30, 2017. The additional profit arising from availing the FSV benefit - net of tax as at September 30, 2017 which is not available for distribution as either cash or stock dividend to shareholders and bonus to employees amounted to approximately Rs 1,275.716 million (December 31, 2016: Rs 1,427.622 million).
NOTES TO AND FORMING PART OF THE CONDENSED INTERIM FINANCIAL INFORMATION (UN-AUDITED)FOR THE NINE MONTHS ENDED SEPTEMBER 30, 2017

20 Third Quarter September 30, 2017
12.3.1 The Bank maintains a general provision against consumer financing in accordance with the applicable requirements of the Prudential Regulations for Consumer Financing issued by the SBP. The prudential regulations specify that general provision should be maintained at varying percentages based on the non-performing loan ratio present in the portfolio ranging from 1% to 2.5% for secured and 4% to 7% for unsecured portfolio.
The Bank also maintains general provision in accordance with the applicable requirements of the Prudential Regulations for Housing Finance and Small and Medium Enterprise Financing issued by the SBP. The provision ranges between 1.0% to 1.5% for secured and 2% for unsecured.
12.4 Although the Bank has made provision against its non-performing portfolio as per the category of classification of the loans, however, the Bank still holds enforceable collateral against certain non-performing loans in the event of recovery through litigation. These securities comprise of charge against various tangible assets of the borrower including land, building and machinery, stock in trade, etc.
Un-audited Audited
September 30, December 31,
2017 2016
13
505,470 513,696
10,234,927 9,991,126
1,374,341 1,607,059
12,114,738 12,111,881
Un-audited
Nine months ended
September 30, September 30,
2017 2016
13.1 Additions to operating fixed assets - cost
Leasehold property and improvements 305,796 126,496
Office furniture, fixtures, equipment and computers 507,300 558,734
Vehicles 5,189 5,698
Capital work-in-progress 855,723 688,186
Additions to Intangibles
Software 45,667 38,641
13.2 Disposals of operating fixed assets - cost
Freehold land - 455,000
Leasehold property and improvements 16,212 -
Office furniture, fixtures, equipment and computers 127,092 15,081
Vehicles 23,096 53,386
Capital work-in-progress
Tangible fixed assets
Intangible assets
OPERATING FIXED ASSETS
----------------------Rupees '000---------------------
----------------------Rupees '000---------------------
NOTES TO AND FORMING PART OF THE CONDENSED INTERIM FINANCIAL INFORMATION (UN-AUDITED)FOR THE NINE MONTHS ENDED SEPTEMBER 30, 2017

Third Quarter September 30, 2017 21
Un-audited Audited
September 30, December 31,
14 DEPOSITS AND OTHER ACCOUNTS 2017 2016
Customers
Fixed deposits 102,996,358 101,774,589
Savings deposits 116,781,487 107,940,436
3,736,798 3,076,212
111,721,115 108,820,931
Margin accounts 3,493,226 2,970,671
338,728,984 324,582,839
Financial institutions
Remunerative deposits 19,677,485 15,537,363
Non-remunerative deposits 419,516 186,202
20,097,001 15,723,565
358,825,985 340,306,404
----------------------Rupees '000---------------------
15 CONTINGENCIES AND COMMITMENTS
15.1 Direct credit substitutes
Contingent liability in respect of guarantees favouring:
- Banking companies and other financial institutions 867,816 483,766
Acceptances
- Others 4,569,040 7,558,310
15.2 Transaction-related contingent liabilities
Contingent liability in respect of performance bonds, bid bonds,
shipping guarantees and standby letters of credit etc. favouring:
- Government 12,532,207 10,688,334
- Banking companies and other financial institutions 60,657 225,272
- Others 2,873,949 2,369,202
15,466,813 13,282,808
15.3 Trade-related contingent liabilities
Letters of credit
- Government 13,970,007 8,078,616
- Others 21,931,302 9,057,727
35,901,309 17,136,343
15.4 Other contingencies
i) Indemnity issued favouring the High Court in one of the cases 457,543 457,543
There are certain claims against the Bank not acknowledged as debt amounting to Rs 34,119 million (December 31, 2016: Rs 34,086 million). These mainly represent counter claims filed by the borrowers for restricting the Bank from disposal of assets (such as mortgaged / pledged assets kept as security), cases where the Bank was proforma defendant for defending its interest in the underlying collateral kept by it at the time of financing, certain cases filed by ex- employees of the Bank for damages sustained by them consequent to the termination from the Bank's employment and cases for damages towards opportunity losses sufferred
NOTES TO AND FORMING PART OF THE CONDENSED INTERIM FINANCIAL INFORMATION (UN-AUDITED)FOR THE NINE MONTHS ENDED SEPTEMBER 30, 2017
Current accounts – Remunerative
Current accounts – Non-remunerative
22 Third Quarter September 30, 2017
by customers due to non disbursements of running finance facility as per the agreed terms. The above also includes an amount of Rs 25,299 million in respect of a suit filed against the Bank for declaration, recovery of monies, release of securities, rendition of account and damages.
Based on legal advice and / or internal assessments, management is confident that the matters will be decided in the Bank's favour and the possibility of any outcome against the Bank is remote and accordingly no provision has been made in this condensed interim financial information.
(ii) Income tax assessments of the Bank have been finalised upto the tax year 2016 (accounting year 2015).
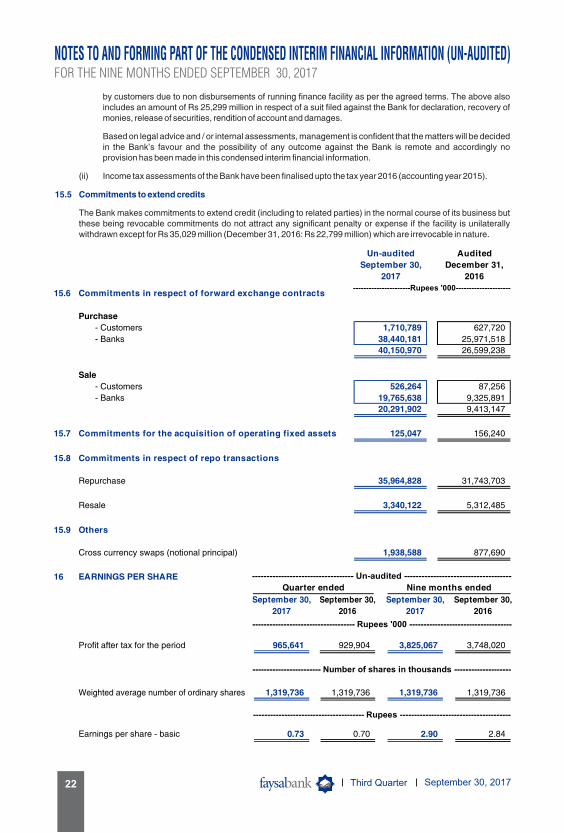
15.5 Commitments to extend credits
The Bank makes commitments to extend credit (including to related parties) in the normal course of its business but these being revocable commitments do not attract any significant penalty or expense if the facility is unilaterally withdrawn except for Rs 35,029 million (December 31, 2016: Rs 22,799 million) which are irrevocable in nature.
Un-audited Audited
September 30, December 31,
2017 2016
15.6 Commitments in respect of forward exchange contracts
Purchase
- Customers 1,710,789 627,720
- Banks 38,440,181 25,971,518
40,150,970 26,599,238
Sale
- Customers 526,264 87,256
- Banks 19,765,638 9,325,891
20,291,902 9,413,147
15.7 Commitments for the acquisition of operating fixed assets 125,047 156,240
15.8 Commitments in respect of repo transactions
Repurchase 35,964,828 31,743,703
Resale 3,340,122 5,312,485
15.9 Others
Cross currency swaps (notional principal) 1,938,588 877,690
16 EARNINGS PER SHARE
Profit after tax for the period
Weighted average number of ordinary shares
Earnings per share - basic
Nine months endedQuarter ended
September 30,
2017
1,319,736
September 30,
2016
929,904
1,319,736
0.70
September 30,
2017
1,319,736
September 30,
2016
3,748,020
1,319,736
2.84
------------------------------------ Rupees '000 ------------------------------------
------------------------ Number of shares in thousands --------------------
--------------------------------------- Rupees ---------------------------------------
----------------------------------- Un-audited -------------------------------------
----------------------Rupees '000---------------------
NOTES TO AND FORMING PART OF THE CONDENSED INTERIM FINANCIAL INFORMATION (UN-AUDITED)FOR THE NINE MONTHS ENDED SEPTEMBER 30, 2017
965,641 3,825,067
0.73 2.90
Third Quarter September 30, 2017 23
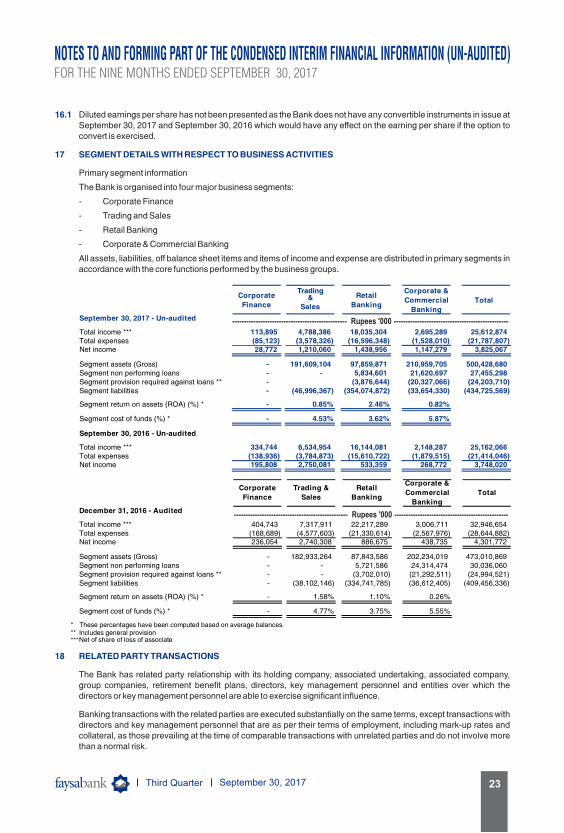
16.1 Diluted earnings per share has not been presented as the Bank does not have any convertible instruments in issue at September 30, 2017 and September 30, 2016 which would have any effect on the earning per share if the option to convert is exercised.
17 SEGMENT DETAILS WITH RESPECT TO BUSINESS ACTIVITIES
Primary segment information
The Bank is organised into four major business segments:
- Corporate Finance
- Trading and Sales
- Retail Banking
- Corporate & Commercial Banking
All assets, liabilities, off balance sheet items and items of income and expense are distributed in primary segments in accordance with the core functions performed by the business groups.
September 30, 2017 - Un-audited
Total income *** 113,895 4,788,386 18,035,304Total expenses (85,123) (3,578,326) (16,596,348) (1,528,010) (21,787,807)Net income 28,772 1,210,060 1,438,956
Segment assets (Gross) - 191,609,104 97,859,871 210,959,705 500,428,680Segment non performing loans - - 5,834,601 21,620,697 27,455,298Segment provision required against loans ** - (3,876,644) (20,327,066) (24,203,710)Segment liabilities - (46,996,367) (354,074,872) (33,654,330) (434,725,569)
Segment return on assets (ROA) (%) * - 0.85% 2.46% 0.82%
Segment cost of funds (%) * - 4.53% 3.62% 5.87%
September 30, 2016 - Un-audited
Total income *** 334,744 6,534,954 16,144,081 2,148,287 25,162,066Total expenses (138,936) (3,784,873) (15,610,722) (1,879,515) (21,414,046)Net income 195,808 2,750,081 533,359 268,772 3,748,020
December 31, 2016 - Audited
Total income *** 404,743 7,317,911 22,217,289 3,006,711 32,946,654Total expenses (168,689) (4,577,603) (21,330,614) (2,567,976) (28,644,882)Net income 236,054 2,740,308 886,675 438,735 4,301,772
Segment assets (Gross) - 182,933,264 87,843,586 202,234,019 473,010,869Segment non performing loans - - 5,721,586 24,314,474 30,036,060Segment provision required against loans ** - - (3,702,010) (21,292,511) (24,994,521)Segment liabilities - (38,102,146) (334,741,785) (36,612,405) (409,456,336)
Segment return on assets (ROA) (%) * - 1.58% 1.10% 0.26%
Segment cost of funds (%) * - 4.77% 3.75% 5.55%
* These percentages have been computed based on average balances.** Includes general provision***Net of share of loss of associate
Corporate
Finance
Trading &
Sales
Retail
Banking
Corporate &
Commercial
Banking
Total
Corporate
Finance Sales
Retail
Banking
Corporate &
Commercial
Banking
Total
------------------------------------------------- Rupees '000 -------------------------------------------------
------------------------------------------------- Rupees '000 -------------------------------------------------
18 RELATED PARTY TRANSACTIONS
The Bank has related party relationship with its holding company, associated undertaking, associated company, group companies, retirement benefit plans, directors, key management personnel and entities over which the directors or key management personnel are able to exercise significant influence.
Banking transactions with the related parties are executed substantially on the same terms, except transactions with directors and key management personnel that are as per their terms of employment, including mark-up rates and collateral, as those prevailing at the time of comparable transactions with unrelated parties and do not involve more than a normal risk.
NOTES TO AND FORMING PART OF THE CONDENSED INTERIM FINANCIAL INFORMATION (UN-AUDITED)FOR THE NINE MONTHS ENDED SEPTEMBER 30, 2017
Trading&
2,695,289
1,147,279
25,612,874
3,825,067
24 Third Quarter September 30, 2017
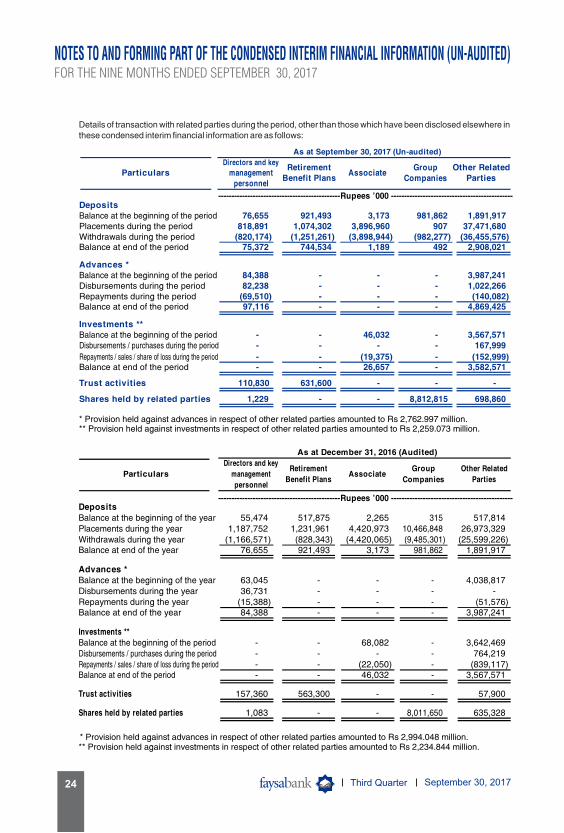
Details of transaction with related parties during the period, other than those which have been disclosed elsewhere in these condensed interim financial information are as follows:
DepositsBalance at the beginning of the periodPlacements during the periodWithdrawals during the periodBalance at end of the period
Advances *Balance at the beginning of the periodDisbursements during the periodRepayments during the periodBalance at end of the period
Investments **Balance at the beginning of the periodDisbursements / purchases during the period
Repayments / sales / share of loss during the periodBalance at end of the period
Trust activities
Shares held by related parties
* Provision held against advances in respect of other related parties amounted to Rs 2,762.997 million.** Provision held against investments in respect of other related parties amounted to Rs 2,259.073 million.
---------------------------------------------- Rupees '000 ----------------------------------------------
Particulars
As at September 30, 2017 (Un-audited)
Directors and key
management personnel
Other Related Parties
Retirement Benefit Plans
AssociateGroup
76,655818,891
(820,174)75,372
84,38882,238
(69,510)97,116
--
--
110,830
1,229
921,4931,074,302
(1,251,261)744,534
----
--
--
631,600
-
3,1733,896,960
(3,898,944)1,189
----
46,032-
(19,375)26,657
-
-
981,862907
(982,277)492
----
--
--
-
8,812,815
1,891,91737,471,680
(36,455,576)2,908,021
3,987,2411,022,266(140,082)
4,869,425
3,567,571167,999
(152,999)3,582,571
-
698,860
Companies
Balance at the beginning of the yearPlacements during the year Withdrawals during the year Balance at end of the year
Balance at the beginning of the yearDisbursements during the year Repayments during the year Balance at end of the year
Balance at the beginning of the periodDisbursements / purchases during the periodRepayments / sales / share of loss during the periodBalance at end of the period
Shares held by related parties
* Provision held against advances in respect of other related parties amounted to Rs 2,994.048 million.** Provision held against investments in respect of other related parties amounted to Rs 2,234.844 million.
Particulars
Directors and key
management
personnel
As at December 31, 2016 (Audited)
Retirement
Benefit PlansAssociate
Group Other Related
Parties
55,4741,187,752
(1,166,571)76,655
63,04536,731
(15,388)84,388
----
157,360
1,083
517,8751,231,961(828,343)921,493
----
----
563,300
-
2,2654,420,973
(4,420,065)3,173
----
68,082-
(22,050)46,032
-
-
31510,466,848(9,485,301)
981,862
----
----
-
8,011,650
517,81426,973,329
(25,599,226)1,891,917
4,038,817-
(51,576)3,987,241
3,642,469764,219
(839,117)3,567,571
57,900
635,328
Deposits
Advances *
Investments **
Trust activities
Companies
---------------------------------------------- Rupees '000 ----------------------------------------------
NOTES TO AND FORMING PART OF THE CONDENSED INTERIM FINANCIAL INFORMATION (UN-AUDITED)FOR THE NINE MONTHS ENDED SEPTEMBER 30, 2017

Third Quarter September 30, 2017 25
Profit paid / accruedProfit return / earned
- Directors fee
Capital lossDividend Income
their behalf *
Dividend payableBonus shares issued
Profit paid / accruedProfit return / earnedRemuneration of the key management personnel
- Salaries and other short-term employee benefits- Post-employment benefits- Directors fee
Contribution / charge relating to staff retirement benefitsCapital gainDividend IncomeGuarantees issued favouring related parties or on
their behalf *Trade related commitmentsShare of loss from associateDividend paidBonus shares issued
* represents outstanding guarantee
Shares / units purchased during the periodShares / units sold during the periodGovernment securities purchased during the periodGovernment securities sold during the period
Remuneration of the key management personnel- Salaries and other short-term employee benefits- Post-employment benefits
Contribution / charge relating to staff retirement benefits
Guarantees issued favouring related parties or on
Trade related commitmentsShare of loss from associate
Shares / units purchased during the periodShares / units sold during the periodGovernment securities purchased during the periodGovernment securities sold during the period
Retirement
Benefit
Plans
AssociateParticularsGroup
Companies
Other Related
Parties
For the nine months ended September 30, 2017 (Un-audited)
Retirement
Benefit
Plans
AssociateParticularsGroup
Companies
Other Related
Parties
For the nine months ended September 30, 2017 (un-audited)
1,4003,109
261,52714,34139,678
---
---111-
--
404,905442,942
26,426-
---
162,590--
-----
---
189,940201-
------
--
9,797--
---
--
------
---
801,165-
---
--
235,711473,760
9003,368
253,7848,166
58,557---
----111
--
509,255720,391
41,251-
---
188,621--
-----
----330-
------
--
19,375--
------
------
----
801,165**
167,999149,460
-429,093
59,18946,846
----
3,53957,379
29,3971,795,894
--
63,532
14,60653,626
----
2,00886,775
29,397360,077
-63,532
-
289,720706,290
-297,749
------------------------------------------ Rupees '000 -------------------------------------------
------------------------------------------ Rupees '000 -------------------------------------------
* represents outstanding guarantee
** These include 4,005,826 shares in respect of withholding tax on bonus shares issued by the Bank during the period. These shares have not been released by the Bank to the
Government Treasury based on the stay order issued by the Honorable High Court of Sindh.
18.1 Balances pertaining to parties that were related at the beginning of the period but ceased to be so related during any part of the current period are not reflected as part of the closing balance. The same are accounted for through the movement presented above.
NOTES TO AND FORMING PART OF THE CONDENSED INTERIM FINANCIAL INFORMATION (UN-AUDITED)FOR THE NINE MONTHS ENDED SEPTEMBER 30, 2017
- -
Directors and key
management personnel
Directors and key
management personnel

26 Third Quarter September 30, 2017
19 FAIR VALUE DISCLOSURES
Fair value is the price that would be received to sell an asset or paid to transfer a liability in an orderly transaction between market participants at the measurement date.
19.1 Fair value hierarchy
The table below analyses financial instruments carried at fair value. The different levels have been defined as follows:
- Quoted prices (unadjusted) in active markets for identical assets or liabilities (Level 1).
- Inputs other than quoted prices included within level 1 that are observable for the asset or liability, either directly (that is, as prices) or indirectly (that is, derived from prices) (Level 2).
- Inputs for the assets or liabilities that are not based on observable market data (i.e. unobservable inputs e.g. estimated future cash flows) (Level 3).
Recurring fair value measurementsLevel 1 Level 2 Level 3 Total
Investments - netMarket Treasury Bills - 123,294,055 - 123,294,055Pakistan Investment Bonds - 37,046,936 - 37,046,936Ijara Sukuk Bonds - 6,311,694 - 6,311,694Fully Paid up Ordinary Shares 1,756,197 - - 1,756,197Term Finance Certificates - 54,774 - 54,774Units of Open end Mutual Funds 1,166,931 - - 1,166,931Sukuk Bonds - 5,187,893 - 5,187,893
Commitments in respect of forward exchange contracts
Forward purchase of foreign exchange - 40,126,958 - 40,126,958Forward sale of foreign exchange - 20,347,195 - 20,347,195
Derivative instruments - 1,938,588 - 1,938,588
Other LiabilitiesPakistan Investment Bonds - 2,526,988 - 2,526,988
Recurring fair value measurementsLevel 1 Level 2 Level 3 Total
Investments - netMarket Treasury Bills - 89,672,481 - 89,672,481Pakistan Investment Bonds - 44,903,414 - 44,903,414Ijara Sukuk Bonds - 4,477,685 - 4,477,685Fully Paid up Ordinary Shares 4,132,522 - - 4,132,522Term Finance Certificates - 197,156 - 197,156Units of Open end Mutual Funds 1,158,017 - - 1,158,017Sukuk Bonds - 2,900,000 - 2,900,000
Commitments in respect of forward exchange contracts
Forward purchase of foreign exchange - 26,508,068 - 26,508,068Forward sale of foreign exchange - 9,422,329 - 9,422,329
Derivative instruments - 877,690 - 877,690
September 30, 2017 (Un-audited)
December 31, 2016 (Audited)
----------------------------------- Rupees '000 ----------------------------------
NOTES TO AND FORMING PART OF THE CONDENSED INTERIM FINANCIAL INFORMATION (UN-AUDITED)FOR THE NINE MONTHS ENDED SEPTEMBER 30, 2017
The Bank's policy is to recognise transfers into and out of the different fair value hierarchy levels at the date when the event or change in circumstances require Bank to exercise such transfers.
There were no transfers between levels 1 and 2 during the period.
----------------------------------- Rupees '000 ----------------------------------
Third Quarter September 30, 2017 27
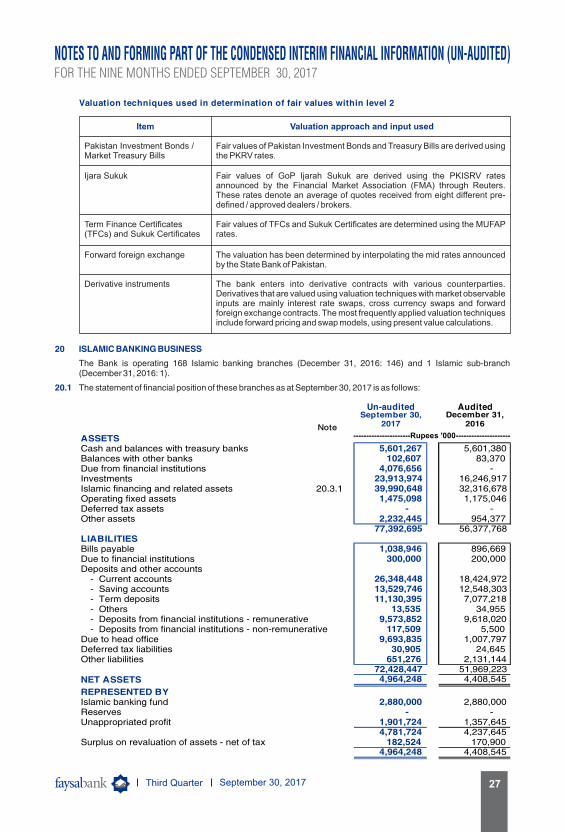
Valuation techniques used in determination of fair values within level 2
Item Valuation approach and input used
Pakistan Investment Bonds / Market Treasury Bills
Fair values of Pakistan Investment Bonds and Treasury Bills are derived using the PKRV rates.
Ijara Sukuk Fair values of GoP Ijarah Sukuk are derived using the PKISRV rates announced by the Financial Market Association (FMA) through Reuters. These rates denote an average of quotes received from eight different pre-defined / approved dealers / brokers.
Term Finance Certificates (TFCs) and Sukuk Certificates
Fair values of TFCs and Sukuk Certificates are determined using the MUFAP rates.
Forward foreign exchange The valuation has been determined by interpolating the mid rates announced by the State Bank of Pakistan.
Derivative instruments The bank enters into derivative contracts with various counterparties. Derivatives that are valued using valuation techniques with market observable inputs are mainly interest rate swaps, cross currency swaps and forward foreign exchange contracts. The most frequently applied valuation techniques include forward pricing and swap models, using present value calculations.
20 ISLAMIC BANKING BUSINESS
The Bank is operating 168 Islamic banking branches (December 31, 2016: 146) and 1 Islamic sub-branch (December 31, 2016: 1).
20.1 The statement of financial position of these branches as at September 30, 2017 is as follows:
NOTES TO AND FORMING PART OF THE CONDENSED INTERIM FINANCIAL INFORMATION (UN-AUDITED)FOR THE NINE MONTHS ENDED SEPTEMBER 30, 2017
Un-audited AuditedSeptember 30, December 31,
Note 2017 2016
ASSETSCash and balances with treasury banks 5,601,267 5,601,380Balances with other banks 102,607 83,370Due from financial institutions 4,076,656 -Investments 23,913,974 16,246,917Islamic financing and related assets 20.3.1 39,990,648 32,316,678Operating fixed assets 1,475,098 1,175,046Deferred tax assets - -Other assets 2,232,445 954,377
77,392,695 56,377,768LIABILITIESBills payable 1,038,946 896,669Due to financial institutions 300,000 200,000Deposits and other accounts
- Current accounts 26,348,448 18,424,972- Saving accounts 13,529,746 12,548,303- Term deposits 11,130,395 7,077,218- Others 13,535 34,955- Deposits from financial institutions - remunerative 9,573,852 9,618,020- Deposits from financial institutions - non-remunerative 117,509 5,500
Due to head office 9,693,835 1,007,797Deferred tax liabilities 30,905 24,645Other liabilities 651,276 2,131,144
72,428,447 51,969,223NET ASSETS 4,964,248 4,408,545
REPRESENTED BYIslamic banking fund 2,880,000 2,880,000Reserves - -Unappropriated profit 1,901,724 1,357,645
4,781,724 4,237,645Surplus on revaluation of assets - net of tax 182,524 170,900
4,964,248 4,408,545
----------------------Rupees '000---------------------

28 Third Quarter September 30, 2017
20.2 The profit and loss account of the Bank's Islamic Banking branches for the nine months ended September 30, 2017 is as follows:
Nine months ended
September 30, September 30,
2017 2016
Profit / return earned on financing and investments 3,425,193 2,446,100
Profit / return expensed 1,370,806 1,436,937
Net spread earned 2,054,387 1,009,163
(Reversal of provision) / provision against non-performing
financings - net (2,546) 24,371
Provision / (reversal of provision) against consumer financings - general 15,218 (3,436)
Recoveries against written off debts - (220)
12,672 20,715
2,041,715 988,448Other Income
Fee, commission and brokerage income 191,005 113,224
Income from dealing in foreign currencies - net 43,519 4,312
Loss on sale of securities - net (712) -
Other income 4,015 1,508
Total other income 237,827 119,044
2,279,542 1,107,492
Other expenses
Administrative expenses 1,735,444 1,116,279
Other provision / write-offs - 31,336
Other charges 19 18
Total other expenses 1,735,463 1,147,633
544,079 (40,141)
Extraordinary items / unusual items - -
Profit / (loss) for the period 544,079 (40,141)
Unappropriated profit brought forward 1,357,645 1,436,604
Unappropriated profit carried forward1,901,724 1,396,463
Remuneration to shariah board7,818 7,672
Un-audited Audited
September 30, December 31,
2017 2016
CHARITY FUND
Opening balance 4,844 1,034
Additions during the period / year 6,041 5,610
Payments / utilisation during the period / year (4,800) (1,800)
Closing balance6,085 4,844
Sector wise details of charity disbursement
Health 4,300 1,300
Education 200 200
Social Work 300 300
4,800 1,800
Un-audited
----------------------Rupees '000---------------------
----------------------Rupees '000---------------------
The charity has been paid by the Bank on account of non-shariah compliant income, late payment amount received from customers and profit earned thereon.
NOTES TO AND FORMING PART OF THE CONDENSED INTERIM FINANCIAL INFORMATION (UN-AUDITED)FOR THE NINE MONTHS ENDED SEPTEMBER 30, 2017
Third Quarter September 30, 2017 29
Note Un-audited Audited
September 30, December 31,
2017 2016
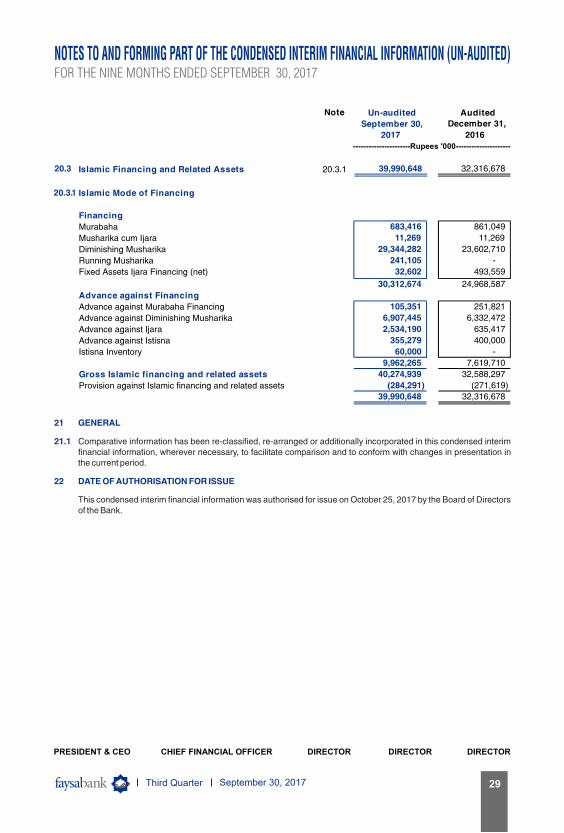
20.3 Islamic Financing and Related Assets 20.3.1 39,990,648 32,316,678
20.3.1 Islamic Mode of Financing
Financing
Murabaha 683,416 861,049
Musharika cum Ijara 11,269 11,269
Diminishing Musharika 29,344,282 23,602,710
Running Musharika 241,105 -
Fixed Assets Ijara Financing (net) 32,602 493,559
30,312,674 24,968,587
Advance against Financing
Advance against Murabaha Financing 105,351 251,821
Advance against Diminishing Musharika 6,907,445 6,332,472
Advance against Ijara 2,534,190 635,417
Advance against Istisna 355,279 400,000
Istisna Inventory 60,000 -
9,962,265 7,619,710
Gross Islamic financing and related assets 40,274,939 32,588,297
Provision against Islamic financing and related assets (284,291) (271,619)
39,990,648 32,316,678
----------------------Rupees '000---------------------
21 GENERAL
21.1 Comparative information has been re-classified, re-arranged or additionally incorporated in this condensed interim financial information, wherever necessary, to facilitate comparison and to conform with changes in presentation in the current period.
22 DATE OF AUTHORISATION FOR ISSUE
This condensed interim financial information was authorised for issue on October 25, 2017 by the Board of Directors of the Bank.
NOTES TO AND FORMING PART OF THE CONDENSED INTERIM FINANCIAL INFORMATION (UN-AUDITED)
PRESIDENT & CEO CHIEF FINANCIAL OFFICER DIRECTOR DIRECTOR DIRECTOR
FOR THE NINE MONTHS ENDED SEPTEMBER 30, 2017
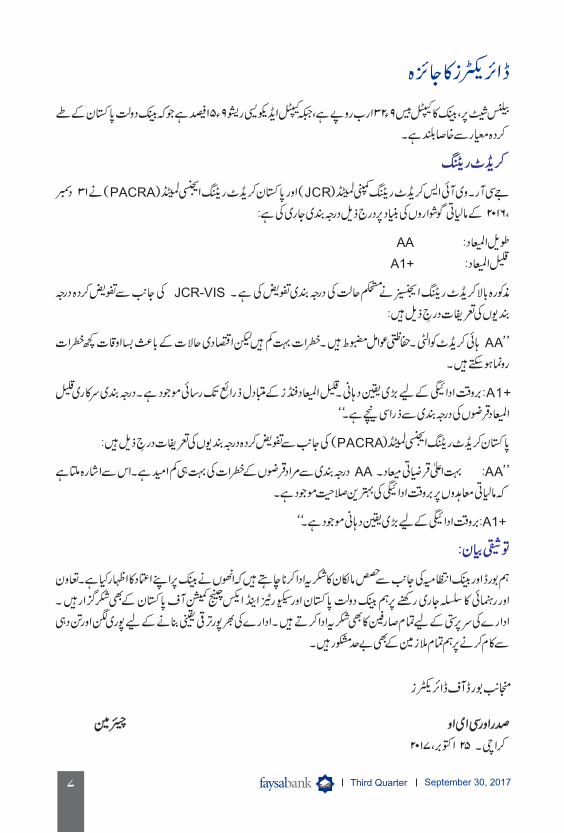
30 Third Quarter September 30, 2017٧
� ��� �رڈ آف ڈا���ز�

Third Quarter September 30, 2017 31٦
٥،٥٨٥
٧٦٤
١
٧٦٥
٦،٣٥٠
(٢،٥٢٥)
٣،٨٢٥
٢٫٩٠
٦،٠٨٤
(٢٩٥)
٤
(٢٨٥)
٥،٧٩٩
(٢،٠٥١)
٣،٧٤٨
٢٫٨٤
-
آ�� ���� � �
� �و��ن ��ا� ��ن ��ر� ���������� �رى � �ر � � � � �و��ن� � ����� � ��� �� � � �� �� ���� � �� � � او �و��ن ��ا� آف
� از �ل ���
� �و��ن ��ا� �ل �
� از �ل ��
� � آ�ن (رو�)
�۲۰۱۷
�۲۰۱۶
٦

32 Third Quarter September 30, 201732٥

Third Quarter September 30, 2017 33٤

34 Third Quarter September 30, 201734٣
Third Quarter September 30, 2017 35٢

36 Third Quarter September 30, 201736١


![Evaluation of the angiogenesis activity of Crataeva magna ... · Semin Cancer Biol 2003;13(2):159–167. [6] Lay-Jing Seaw, Hooi-Kheng Beh, Amin Malik Shah, Abdul Majid, Vikneswaram](https://static.fdocuments.us/doc/165x107/5fb85fef5fa3175bc342b814/evaluation-of-the-angiogenesis-activity-of-crataeva-magna-semin-cancer-biol.jpg)