Contents - Real Russia · almost four times its current market valuation. Lukoil has finally stated...
43
Transcript of Contents - Real Russia · almost four times its current market valuation. Lukoil has finally stated...
MAY 2018 RUSSIAN OIL AND GAS – TICKLING GIANTS
2 SBERBANK CIB INVESTMENT RESEARCH
Contents
Report Summary .............................................................................................................................. 3
Gazprom: Performing As Designed .................................................................................................. 4
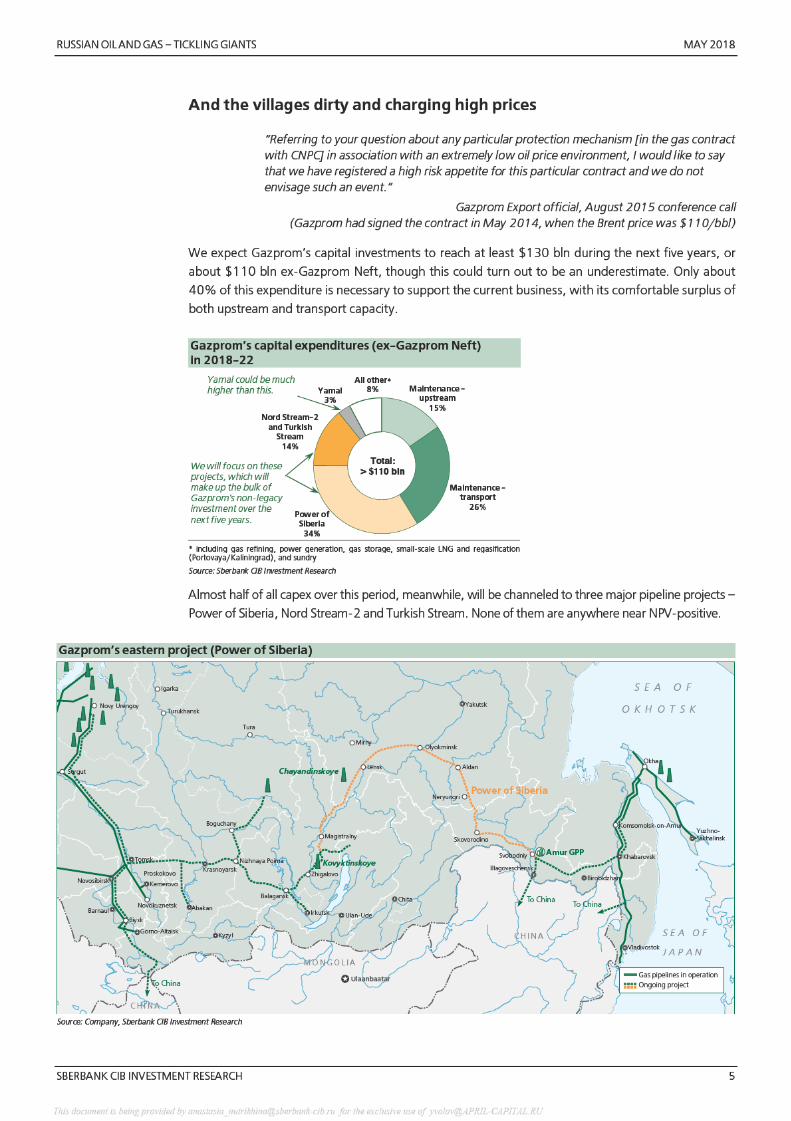
And the villages dirty and charging high prices ........................................................................... 5
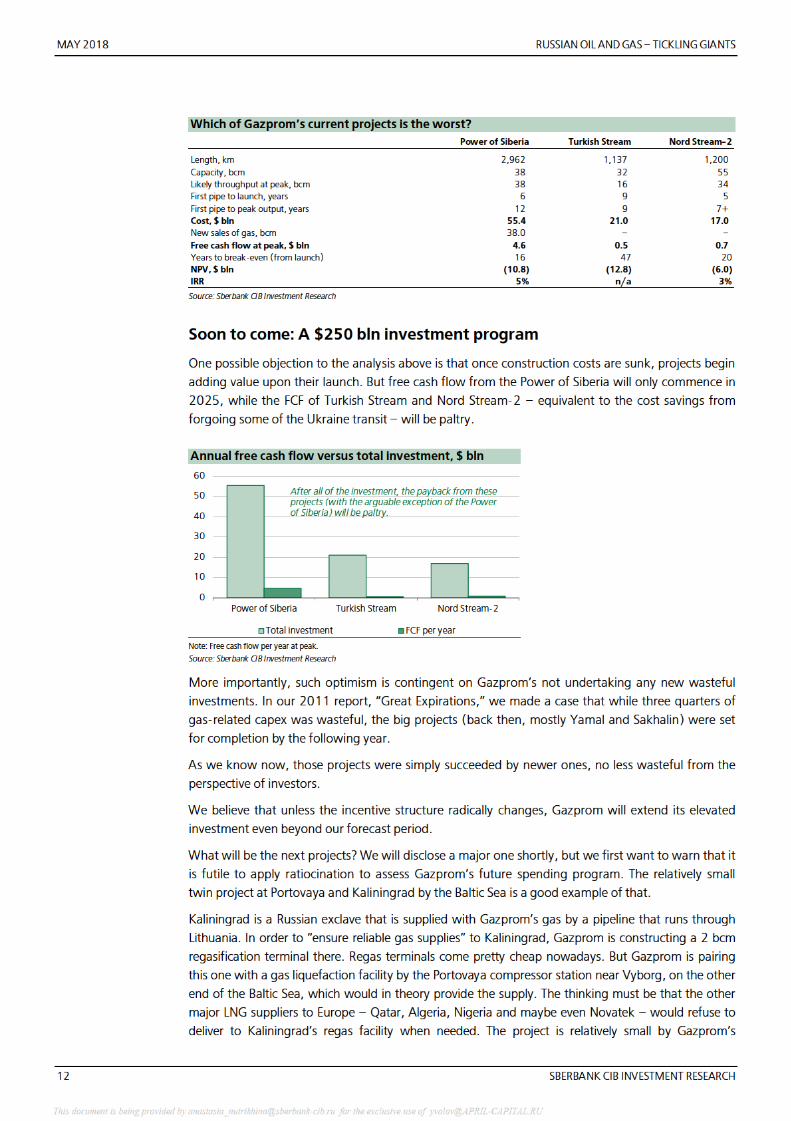
The Ukraine pincer ...................................................................................................................... 9
Soon to come: A $250 bln investment program ....................................................................... 12
Quantifying a dream ................................................................................................................. 16
Lukoil: Will They Walk the Walk? .................................................................................................... 19
Putting its cards on the table ..................................................................................................... 21
The market might not believe the management ........................................................................ 26
The market might fear a change in control ................................................................................ 27
The market might be starved of the marginal investor ............................................................... 29
Valuations ...................................................................................................................................... 31
Financial Profiles ............................................................................................................................ 32
This document is being provided by [email protected] for the exclusive use of [email protected]
RUSSIAN OIL AND GAS – TICKLING GIANTS MAY 2018
SBERBANK CIB INVESTMENT RESEARCH 3
Report Summary
We invert the common criticism of Gazprom and ask what needs to be assumed about the company to
conclude that it actually serves its function well. We discover that Gazprom’s decisions make perfect
sense if the company is assumed to be run for the benefit of its contractors, not for commercial profit.
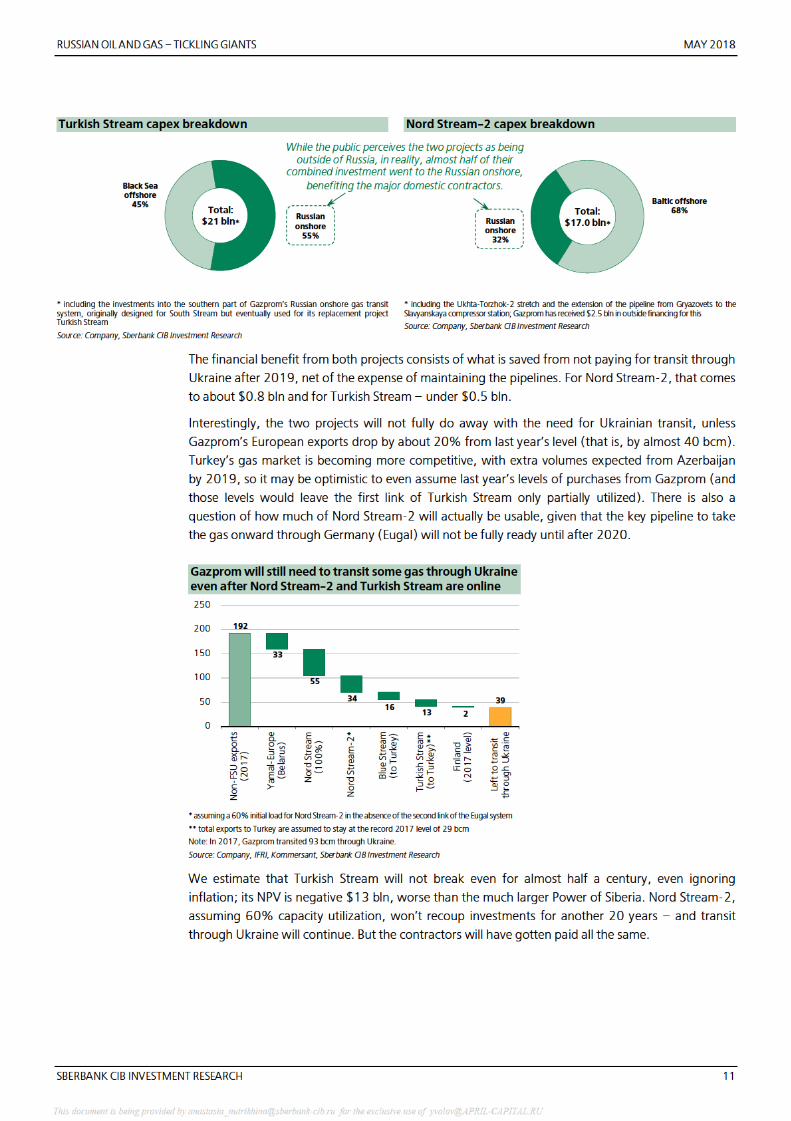
The Power of Siberia, Nord Stream�2 and Turkish Stream are all deeply value�destructive projects that
will eat up almost half of Gazprom’s investments over the next five years. They are commonly
perceived as being foisted on the company by the government pursuing a geopolitical agenda. A more
important characteristic that they share, however, is the ability to employ a closely knit group of
suppliers in Russia, with little outside supervision. On the other hand, forgone or delayed projects –
Shtokman, Baltic LNG and Vladivostok LNG – would have been almost wholly constructed without the
help of Gazprom’s main current builders and with external oversight. This made them less attractive
from the standpoint of the interests that really set the company’s agenda.
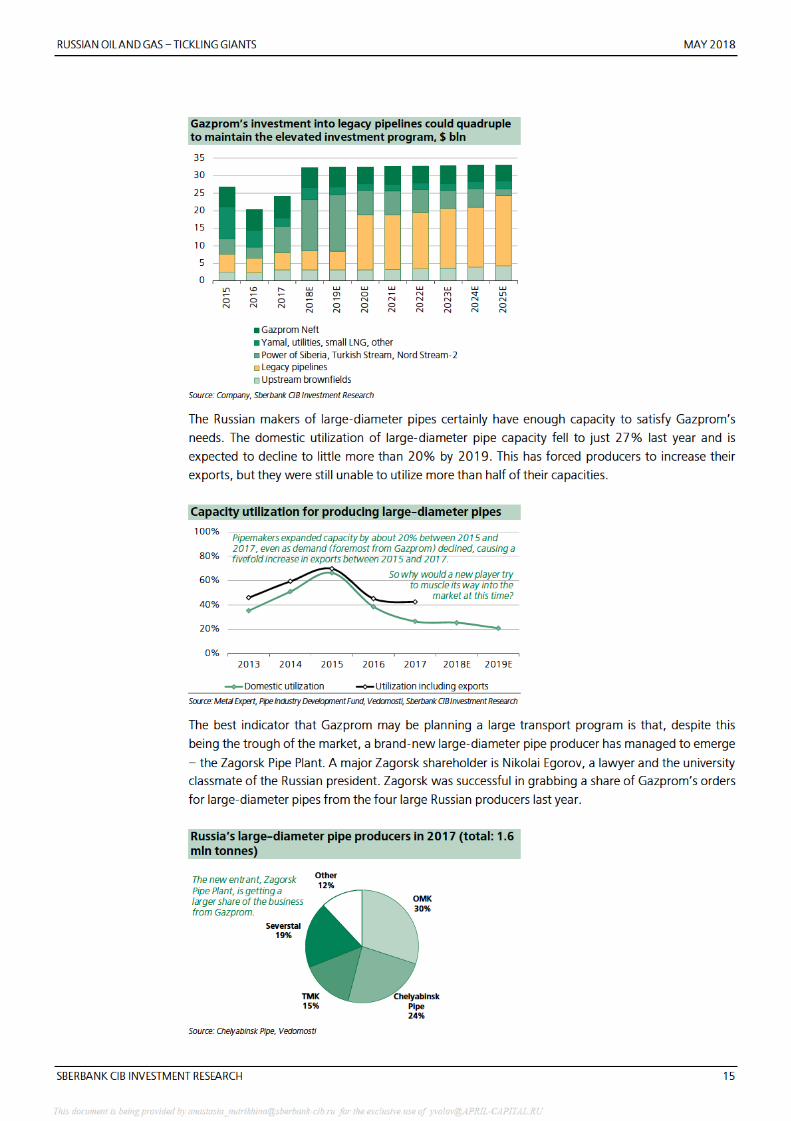
Taking the contractors’ perspective will help gauge Gazprom’s future investment path. The rapid aging
of trunk infrastructure presents an excuse to undertake an indefinite investment drive to revamp the
network. This would play perfectly to the construction experience of Gazprom’s current slew of
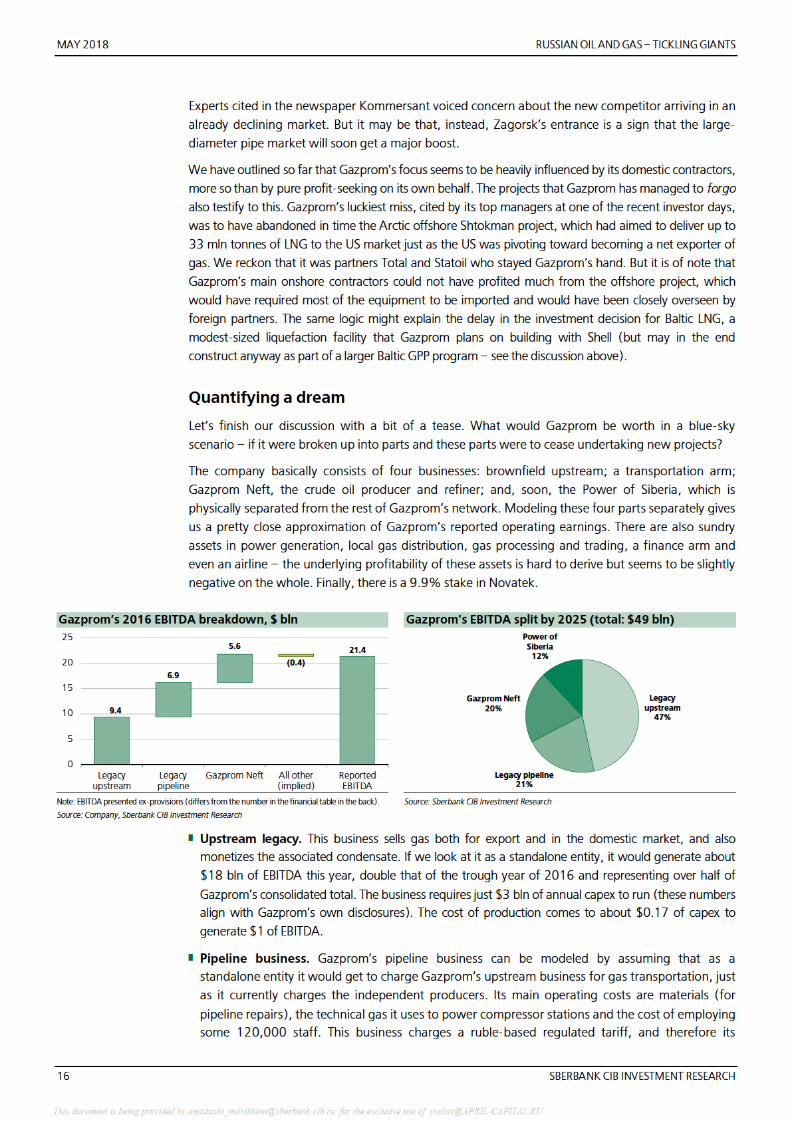
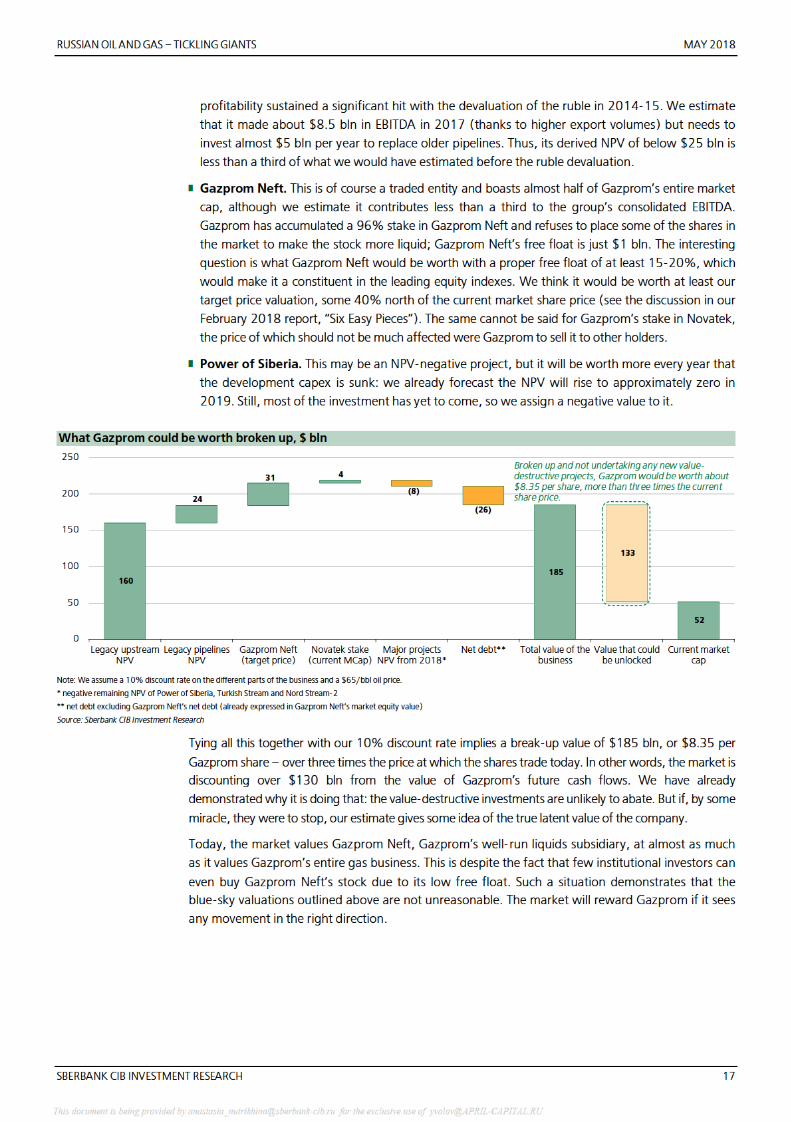
suppliers. We see the emergence of Zagorsk Pipe Plant at the trough of the pipe market as a signal that
Russian large�diameter pipe makers could soon get a major boost from an accelerated pipeline
replacement program. Unfortunately, such a project would bring no new revenues to Gazprom.
A possible reshuffling of the government later this month may present a rare chance to break this
pattern. We show that Gazprom, as a profit�oriented entity, would be worth almost $200 bln, or
almost four times its current market valuation.
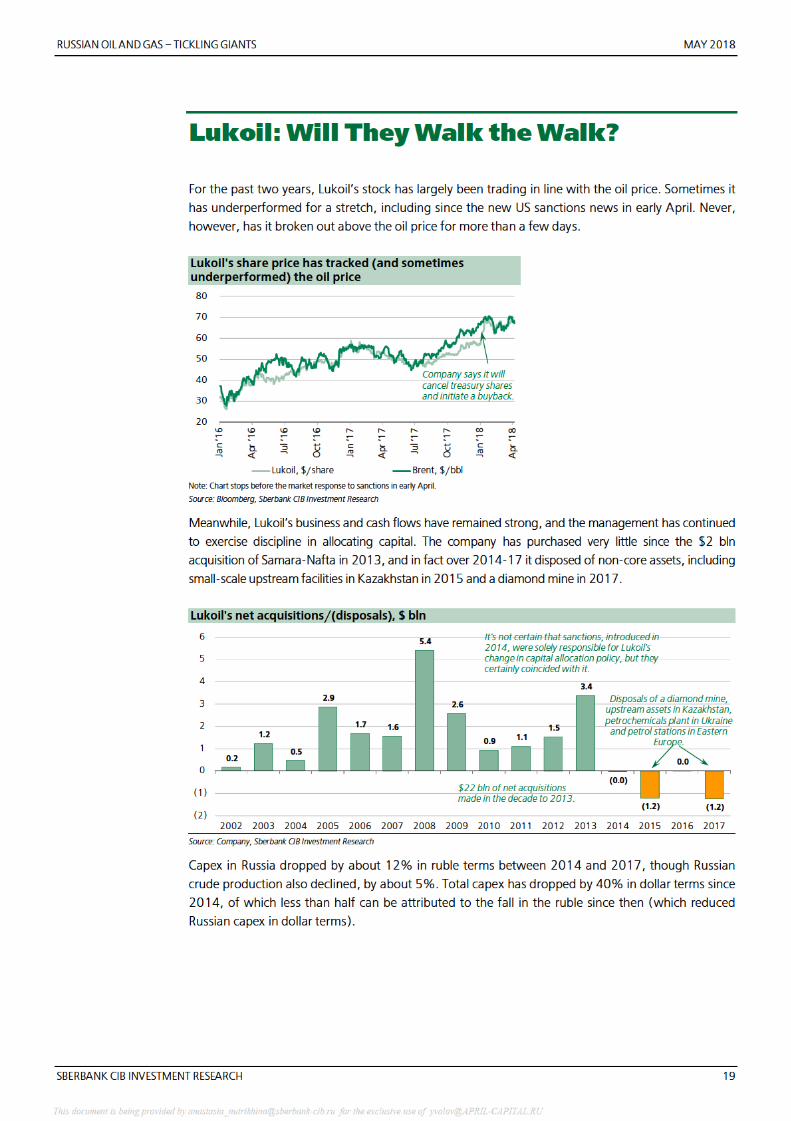
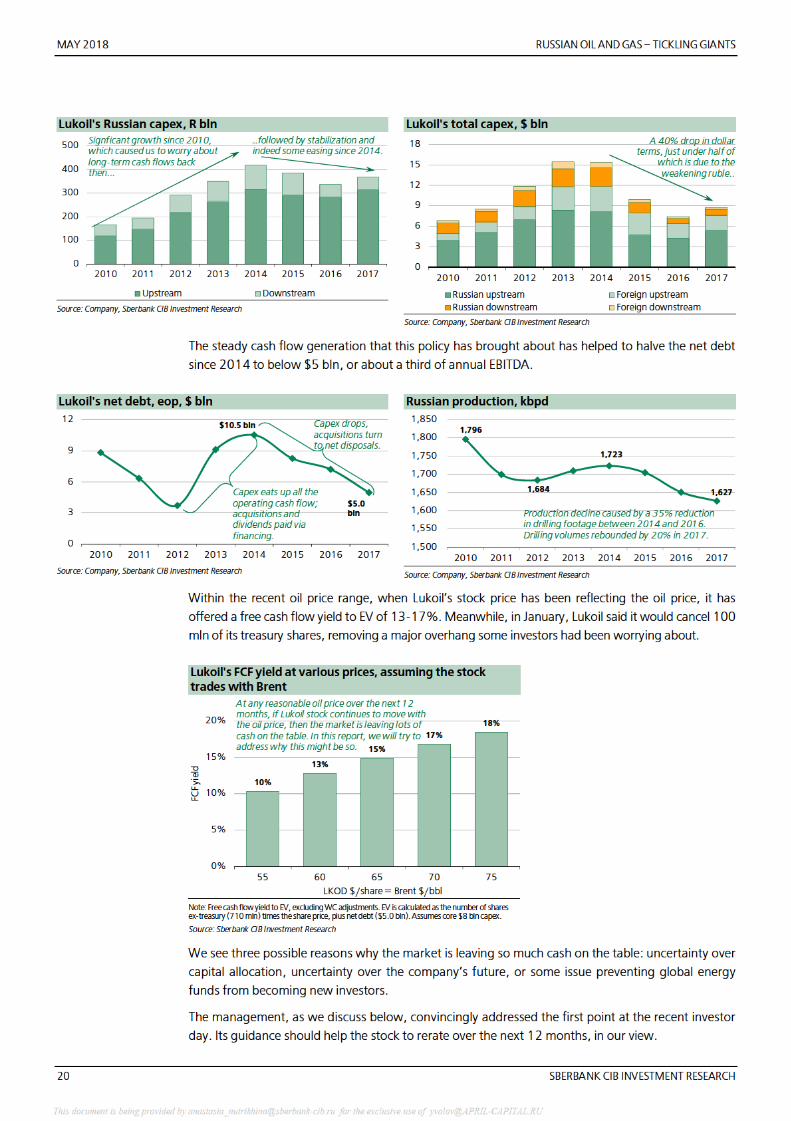
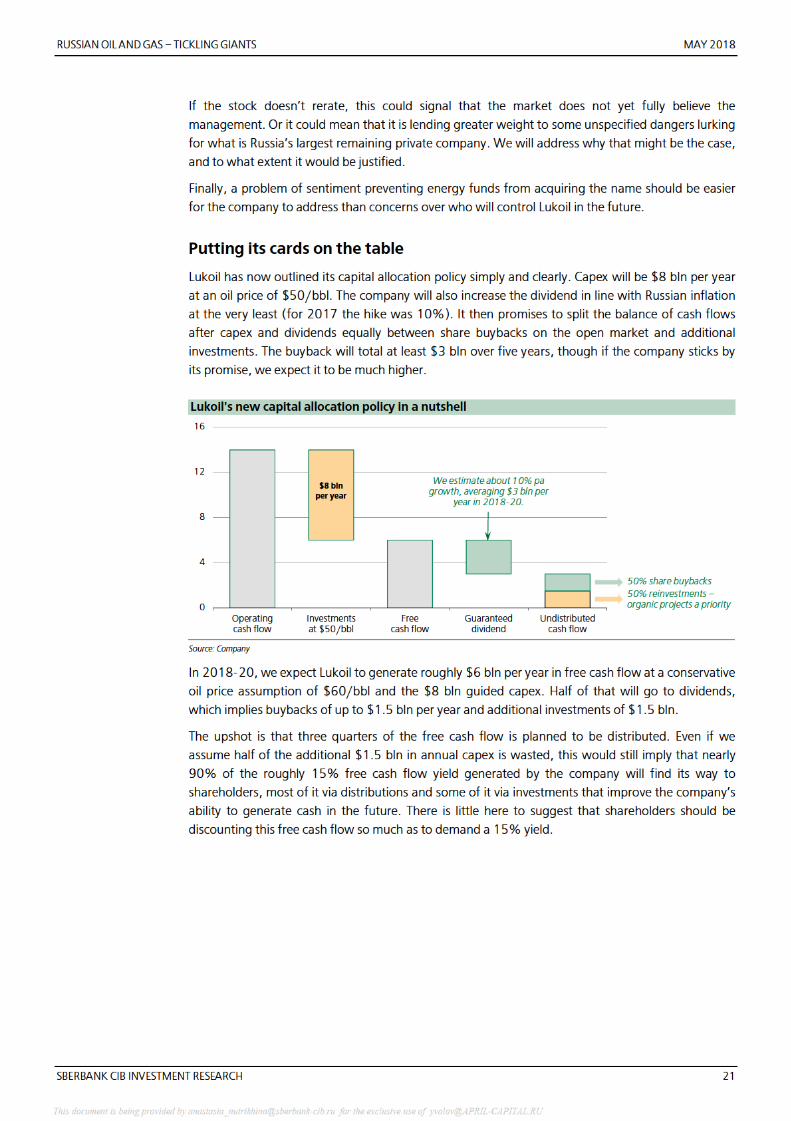
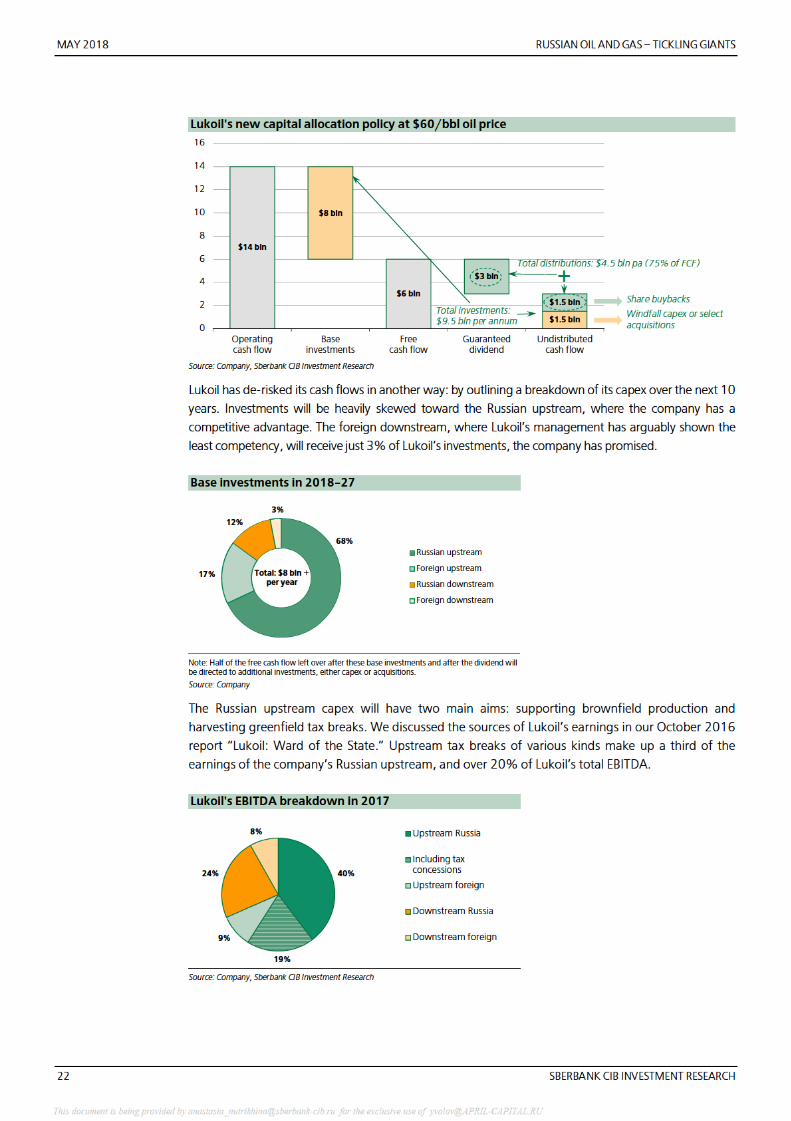
Lukoil has finally stated its capital allocation policy simply and clearly. The company will share the
vast majority of its free cash flow with shareholders, either through dividends or buybacks. It will
reinvest 80% of its capex in the Russian business, where it enjoys competencies (not the least of
which is extracting tax concessions). We believe that if the company follows through on its
promises, the market will have no cause to demand the current double�digit free cash flow yields
from the shares. The stock price should catch up with the Brent price and surpass it.
In the report, however, we also examine what may prevent this from happening. First and foremost,
the market may simply take a wait�and�see attitude. The current management has failed to win
investors’ trust in the past, and has delivered a performance that ranks in the bottom half of the
sector. Investors may also fear a change in control, especially since Vagit Alekperov’s contingent
legacy may rob his heirs of the flexibility needed to deal with a potential pursuer. Finally, the
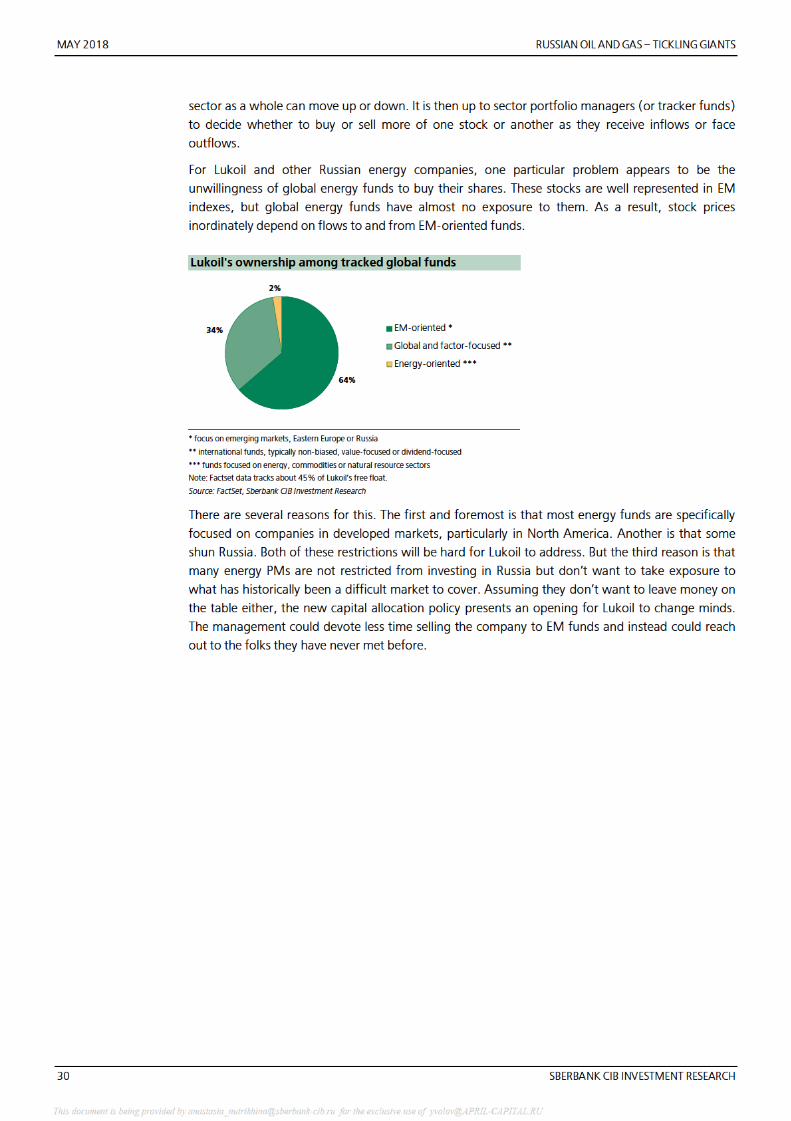
problem may simply lie in attracting the new class of investor. In particular, Lukoil is barely owned
by global energy�oriented funds, which we ascribe to an unwillingness to deal with all the external
risk factors that come with owning Russian stocks. This is something the company could partially
address by simply showing up to meet with these investors.
This document is being provided by [email protected] for the exclusive use of [email protected]
MAY 2018 RUSSIAN OIL AND GAS – TICKLING GIANTS
4 SBERBANK CIB INVESTMENT RESEARCH
Gazprom: Performing As Designed
“What if Gazprom were better run?” our predecessors at Troika Dialog, the progenitor of Sberbank
CIB, asked in the title of a report back in 2002. That report came out less than a year after
Gazprom’s current CEO, Alexei Miller, took the reins.
Since then, investors have continued posing this same question, with increasing resignation. The
potential government reshuffle, expected later this month, has again given scope for some
optimism. Some investors see Gazprom as the proverbial “low�hanging fruit” for any domestic
reform effort. The eventual completion of the current slate of major pipeline projects appears to
open a window for a reform effort to succeed. The ultimate desire of investors, of course, is the
breakup of the company (which we will touch upon later), although they would gladly settle for
something much more modest, such as a cap on annual capital expenditures.
In this report, we propose an alternative point of view. What if we were to presume that Gazprom is
well�run – that is, that it perfectly serves its function, from the standpoint of the parties who really
call the shots? And what if by these parties we meant not the government (the controlling
shareholder), and, of course, not the minority shareholders, who own almost 40% of the company,
but Gazprom’s main contractors?
Why them? Because power tends to be exercised by those who can coalesce their energies around a
unifying objective. What is often generalized as “the government” is actually a collection of diverse and
often contradictory interests. For instance, the Economics Ministry might prefer Gazprom to invest in
Russia’s neglected Far East regions, the Finance Ministry could like it to direct available funds toward the
dividend, while the Federal Antimonopoly Service may rather open up the export market to competing
Russian gas – and thus cause Gazprom to earn less money down the line. The Kremlin, meanwhile,
might prefer the company to focus on geopolitical projects, like expanding export infrastructure.
The contractors, however, face no such confusion of purpose. They are united in their desire to promote
any and all boondoggles, at least within the boundaries of Russia, where their activities will face less
scrutiny. Moreover, they are thought to be better connected to the ultimate node of power in Russia than
anyone who might possibly be interested in running Gazprom for shareholders. They therefore probably
exercise much more sway in Gazprom’s decision�making than does “the government.”
Once you take this contractor�oriented view, Gazprom’s choice of focus over the past 15 years –
including projects the company ultimately rejected – starts to make perfect sense. More
importantly, this viewpoint will help better inform a future outlook on the stock. In this section, we
will disclose what Gazprom might embark on after its current three major projects are concluded.
We believe this will include a major undertaking that the company has never aired in public, but
which could tie up its cash flows indefinitely.
This document is being provided by [email protected] for the exclusive use of [email protected]
RUSSIAN OIL AND GAS – TICKLING GIANTS MAY 2018
SBERBANK CIB INVESTMENT RESEARCH 27
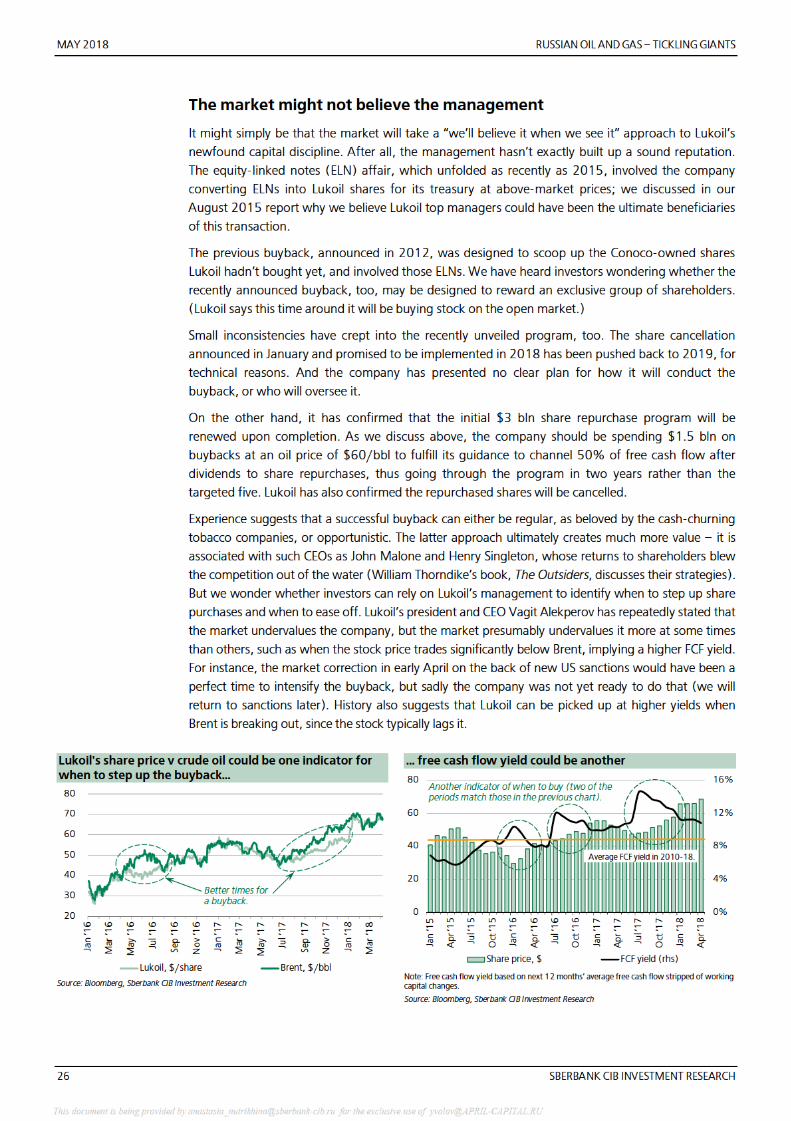
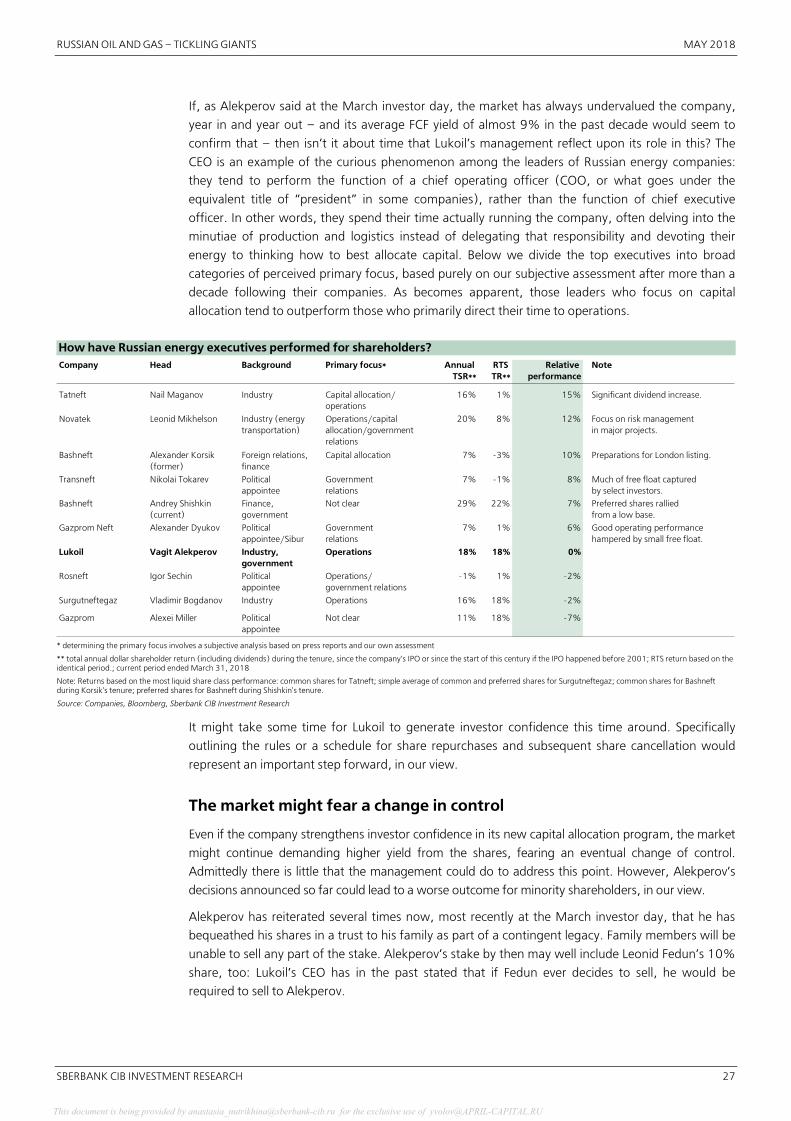
If, as Alekperov said at the March investor day, the market has always undervalued the company,
year in and year out – and its average FCF yield of almost 9% in the past decade would seem to
confirm that – then isn’t it about time that Lukoil’s management reflect upon its role in this? The
CEO is an example of the curious phenomenon among the leaders of Russian energy companies:
they tend to perform the function of a chief operating officer (COO, or what goes under the
equivalent title of “president” in some companies), rather than the function of chief executive
officer. In other words, they spend their time actually running the company, often delving into the
minutiae of production and logistics instead of delegating that responsibility and devoting their
energy to thinking how to best allocate capital. Below we divide the top executives into broad
categories of perceived primary focus, based purely on our subjective assessment after more than a
decade following their companies. As becomes apparent, those leaders who focus on capital
allocation tend to outperform those who primarily direct their time to operations.
How have Russian energy executives performed for shareholders? Company Head Background Primary focus* Annual
TSR**RTS TR**
Relative performance
Note
Tatneft Nail Maganov Industry Capital allocation/operations
16% 1% 15% Significant dividend increase.
Novatek Leonid Mikhelson Industry (energy transportation)
Operations/capital allocation/governmentrelations
20% 8% 12% Focus on risk management in major projects.
Bashneft Alexander Korsik (former)
Foreign relations, finance
Capital allocation 7% �3% 10% Preparations for London listing.
Transneft Nikolai Tokarev Political appointee
Government relations
7% �1% 8% Much of free float captured by select investors.
Bashneft Andrey Shishkin (current)
Finance, government
Not clear 29% 22% 7% Preferred shares rallied from a low base.
Gazprom Neft Alexander Dyukov Political appointee/Sibur
Government relations
7% 1% 6% Good operating performance hampered by small free float.
Lukoil Vagit Alekperov Industry, government
Operations 18% 18% 0%
Rosneft Igor Sechin Political appointee
Operations/government relations
�1% 1% �2%
Surgutneftegaz Vladimir Bogdanov Industry Operations 16% 18% �2%
Gazprom Alexei Miller Political appointee
Not clear 11% 18% �7%
* determining the primary focus involves a subjective analysis based on press reports and our own assessment
** total annual dollar shareholder return (including dividends) during the tenure, since the company's IPO or since the start of this century if the IPO happened before 2001; RTS return based on the identical period.; current period ended March 31, 2018
Note: Returns based on the most liquid share class performance: common shares for Tatneft; simple average of common and preferred shares for Surgutneftegaz; common shares for Bashneft during Korsik's tenure; preferred shares for Bashneft during Shishkin's tenure.
Source: Companies, Bloomberg, Sberbank CIB Investment Research
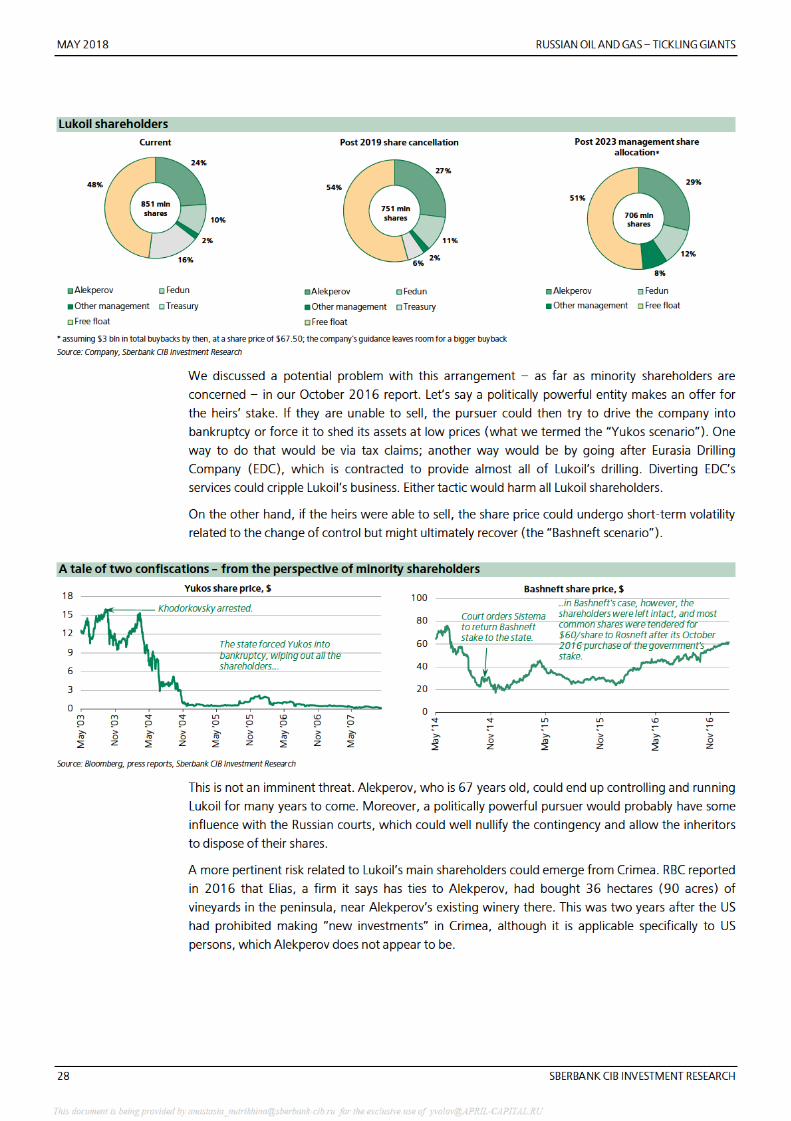
It might take some time for Lukoil to generate investor confidence this time around. Specifically
outlining the rules or a schedule for share repurchases and subsequent share cancellation would
represent an important step forward, in our view.
The market might fear a change in control
Even if the company strengthens investor confidence in its new capital allocation program, the market
might continue demanding higher yield from the shares, fearing an eventual change of control.
Admittedly there is little that the management could do to address this point. However, Alekperov’s
decisions announced so far could lead to a worse outcome for minority shareholders, in our view.
Alekperov has reiterated several times now, most recently at the March investor day, that he has
bequeathed his shares in a trust to his family as part of a contingent legacy. Family members will be
unable to sell any part of the stake. Alekperov’s stake by then may well include Leonid Fedun’s 10%
share, too: Lukoil’s CEO has in the past stated that if Fedun ever decides to sell, he would be
required to sell to Alekperov.
This document is being provided by [email protected] for the exclusive use of [email protected]
RUSSIAN OIL AND GAS – TICKLING GIANTS MAY 2018
SBERBANK CIB INVESTMENT RESEARCH 31
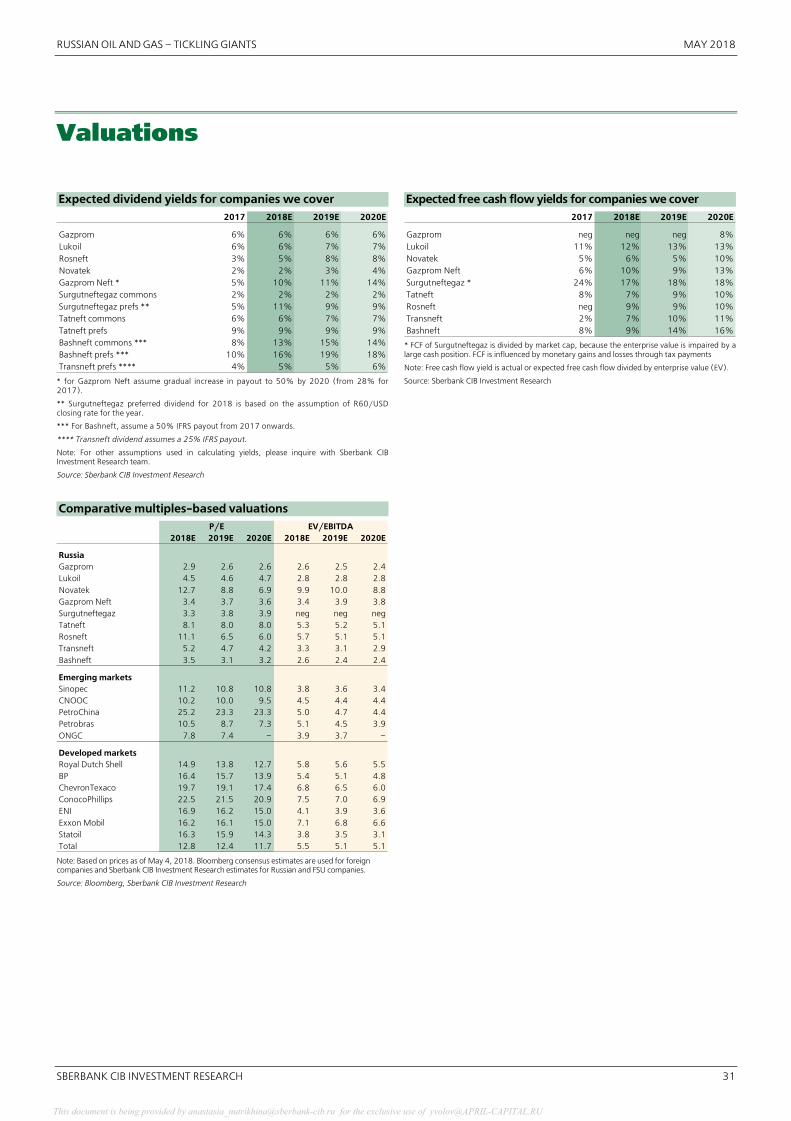
Valuations
Expected dividend yields for companies we cover
2017 2018E 2019E 2020E
Gazprom 6% 6% 6% 6%Lukoil 6% 6% 7% 7%Rosneft 3% 5% 8% 8%Novatek 2% 2% 3% 4%Gazprom Neft * 5% 10% 11% 14%Surgutneftegaz commons 2% 2% 2% 2%Surgutneftegaz prefs ** 5% 11% 9% 9%Tatneft commons 6% 6% 7% 7%Tatneft prefs 9% 9% 9% 9%Bashneft commons *** 8% 13% 15% 14%Bashneft prefs *** 10% 16% 19% 18%Transneft prefs **** 4% 5% 5% 6%
* for Gazprom Neft assume gradual increase in payout to 50% by 2020 (from 28% for2017).
** Surgutneftegaz preferred dividend for 2018 is based on the assumption of R60/USDclosing rate for the year.
*** For Bashneft, assume a 50% IFRS payout from 2017 onwards.
**** Transneft dividend assumes a 25% IFRS payout.
Note: For other assumptions used in calculating yields, please inquire with Sberbank CIBInvestment Research team.
Source: Sberbank CIB Investment Research
Expected free cash flow yields for companies we cover
2017 2018E 2019E 2020E
Gazprom neg neg neg 8%Lukoil 11% 12% 13% 13%Novatek 5% 6% 5% 10%Gazprom Neft 6% 10% 9% 13%Surgutneftegaz * 24% 17% 18% 18%Tatneft 8% 7% 9% 10%Rosneft neg 9% 9% 10%Transneft 2% 7% 10% 11%Bashneft 8% 9% 14% 16%
* FCF of Surgutneftegaz is divided by market cap, because the enterprise value is impaired by alarge cash position. FCF is influenced by monetary gains and losses through tax payments
Note: Free cash flow yield is actual or expected free cash flow divided by enterprise value (EV).
Source: Sberbank CIB Investment Research
Comparative multiples�based valuations
2018E 2019E 2020E 2018E 2019E 2020E
Russia Gazprom 2.9 2.6 2.6 2.6 2.5 2.4Lukoil 4.5 4.6 4.7 2.8 2.8 2.8Novatek 12.7 8.8 6.9 9.9 10.0 8.8Gazprom Neft 3.4 3.7 3.6 3.4 3.9 3.8Surgutneftegaz 3.3 3.8 3.9 neg neg negTatneft 8.1 8.0 8.0 5.3 5.2 5.1Rosneft 11.1 6.5 6.0 5.7 5.1 5.1Transneft 5.2 4.7 4.2 3.3 3.1 2.9Bashneft 3.5 3.1 3.2 2.6 2.4 2.4
Emerging marketsSinopec 11.2 10.8 10.8 3.8 3.6 3.4CNOOC 10.2 10.0 9.5 4.5 4.4 4.4PetroChina 25.2 23.3 23.3 5.0 4.7 4.4Petrobras 10.5 8.7 7.3 5.1 4.5 3.9ONGC 7.8 7.4 – 3.9 3.7 –
Developed marketsRoyal Dutch Shell 14.9 13.8 12.7 5.8 5.6 5.5BP 16.4 15.7 13.9 5.4 5.1 4.8ChevronTexaco 19.7 19.1 17.4 6.8 6.5 6.0ConocoPhillips 22.5 21.5 20.9 7.5 7.0 6.9ENI 16.9 16.2 15.0 4.1 3.9 3.6Exxon Mobil 16.2 16.1 15.0 7.1 6.8 6.6Statoil 16.3 15.9 14.3 3.8 3.5 3.1Total 12.8 12.4 11.7 5.5 5.1 5.1
P/E EV/EBITDA
Note: Based on prices as of May 4, 2018. Bloomberg consensus estimates are used for foreign companies and Sberbank CIB Investment Research estimates for Russian and FSU companies.
Source: Bloomberg, Sberbank CIB Investment Research
This document is being provided by [email protected] for the exclusive use of [email protected]
MAY 2018 RUSSIAN OIL AND GAS – TICKLING GIANTS
32 SBERBANK CIB INVESTMENT RESEARCH
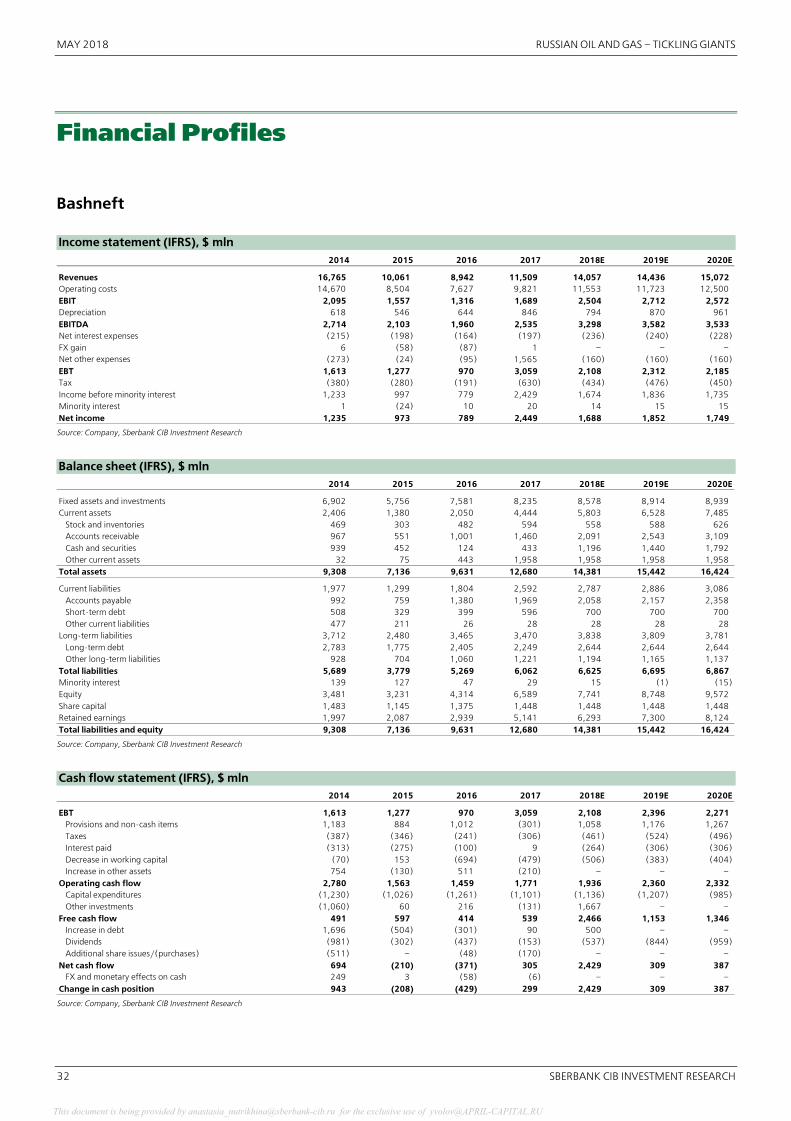
Financial Profiles
Bashneft Income statement (IFRS), $ mln
2014 2015 2016 2017 2018E 2019E 2020E
Revenues 16,765 10,061 8,942 11,509 14,057 14,436 15,072Operating costs 14,670 8,504 7,627 9,821 11,553 11,723 12,500EBIT 2,095 1,557 1,316 1,689 2,504 2,712 2,572Depreciation 618 546 644 846 794 870 961EBITDA 2,714 2,103 1,960 2,535 3,298 3,582 3,533Net interest expenses (215) (198) (164) (197) (236) (240) (228)FX gain 6 (58) (87) 1 – – –Net other expenses (273) (24) (95) 1,565 (160) (160) (160)EBT 1,613 1,277 970 3,059 2,108 2,312 2,185Tax (380) (280) (191) (630) (434) (476) (450)Income before minority interest 1,233 997 779 2,429 1,674 1,836 1,735Minority interest 1 (24) 10 20 14 15 15Net income 1,235 973 789 2,449 1,688 1,852 1,749
Source: Company, Sberbank CIB Investment Research
Balance sheet (IFRS), $ mln
2014 2015 2016 2017 2018E 2019E 2020E
Fixed assets and investments 6,902 5,756 7,581 8,235 8,578 8,914 8,939Current assets 2,406 1,380 2,050 4,444 5,803 6,528 7,485
Stock and inventories 469 303 482 594 558 588 626Accounts receivable 967 551 1,001 1,460 2,091 2,543 3,109Cash and securities 939 452 124 433 1,196 1,440 1,792Other current assets 32 75 443 1,958 1,958 1,958 1,958
Total assets 9,308 7,136 9,631 12,680 14,381 15,442 16,424
Current liabilities 1,977 1,299 1,804 2,592 2,787 2,886 3,086Accounts payable 992 759 1,380 1,969 2,058 2,157 2,358Short�term debt 508 329 399 596 700 700 700Other current liabilities 477 211 26 28 28 28 28
Long�term liabilities 3,712 2,480 3,465 3,470 3,838 3,809 3,781Long�term debt 2,783 1,775 2,405 2,249 2,644 2,644 2,644Other long�term liabilities 928 704 1,060 1,221 1,194 1,165 1,137
Total liabilities 5,689 3,779 5,269 6,062 6,625 6,695 6,867Minority interest 139 127 47 29 15 (1) (15)Equity 3,481 3,231 4,314 6,589 7,741 8,748 9,572Share capital 1,483 1,145 1,375 1,448 1,448 1,448 1,448Retained earnings 1,997 2,087 2,939 5,141 6,293 7,300 8,124Total liabilities and equity 9,308 7,136 9,631 12,680 14,381 15,442 16,424
Source: Company, Sberbank CIB Investment Research
Cash flow statement (IFRS), $ mln
2014 2015 2016 2017 2018E 2019E 2020E
EBT 1,613 1,277 970 3,059 2,108 2,396 2,271Provisions and non�cash items 1,183 884 1,012 (301) 1,058 1,176 1,267Taxes (387) (346) (241) (306) (461) (524) (496)Interest paid (313) (275) (100) 9 (264) (306) (306)Decrease in working capital (70) 153 (694) (479) (506) (383) (404)Increase in other assets 754 (130) 511 (210) – – –
Operating cash flow 2,780 1,563 1,459 1,771 1,936 2,360 2,332Capital expenditures (1,230) (1,026) (1,261) (1,101) (1,136) (1,207) (985)Other investments (1,060) 60 216 (131) 1,667 – –
Free cash flow 491 597 414 539 2,466 1,153 1,346Increase in debt 1,696 (504) (301) 90 500 – –Dividends (981) (302) (437) (153) (537) (844) (959)Additional share issues/(purchases) (511) – (48) (170) – – –
Net cash flow 694 (210) (371) 305 2,429 309 387FX and monetary effects on cash 249 3 (58) (6) – – –
Change in cash position 943 (208) (429) 299 2,429 309 387 Source: Company, Sberbank CIB Investment Research
This document is being provided by [email protected] for the exclusive use of [email protected]
RUSSIAN OIL AND GAS – TICKLING GIANTS MAY 2018
SBERBANK CIB INVESTMENT RESEARCH 33
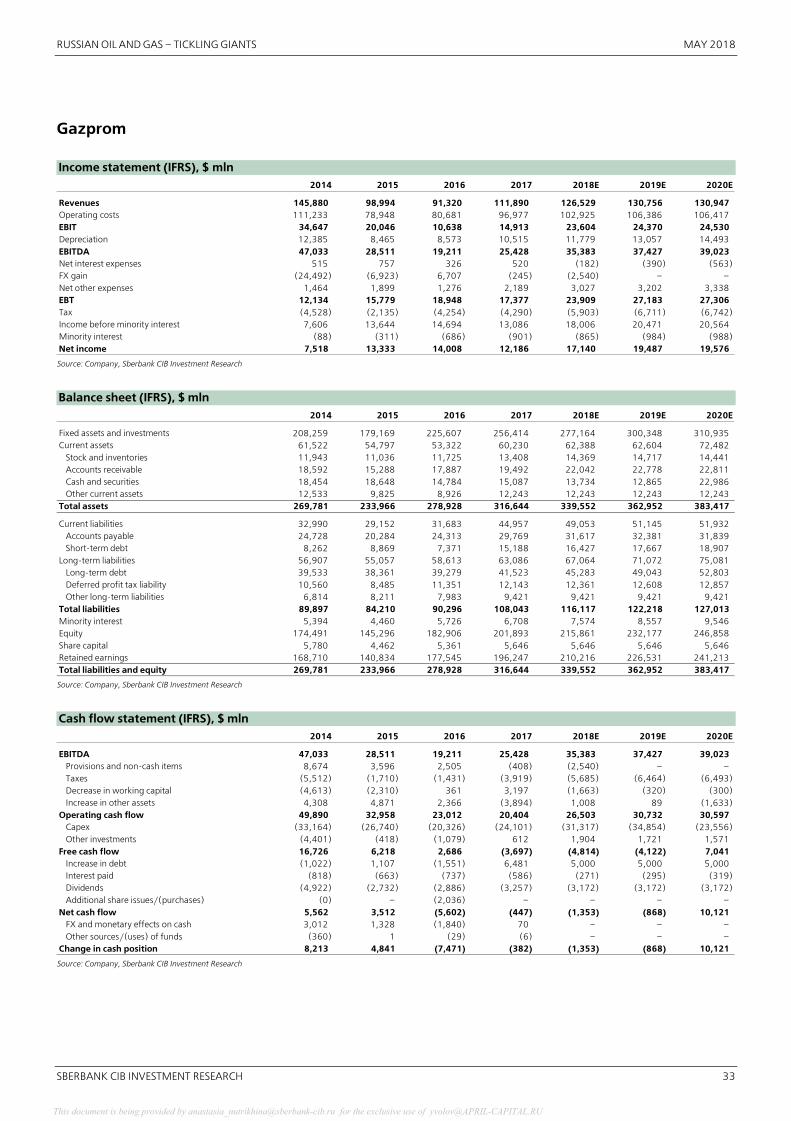
Gazprom Income statement (IFRS), $ mln
2014 2015 2016 2017 2018E 2019E 2020E
Revenues 145,880 98,994 91,320 111,890 126,529 130,756 130,947Operating costs 111,233 78,948 80,681 96,977 102,925 106,386 106,417EBIT 34,647 20,046 10,638 14,913 23,604 24,370 24,530Depreciation 12,385 8,465 8,573 10,515 11,779 13,057 14,493EBITDA 47,033 28,511 19,211 25,428 35,383 37,427 39,023Net interest expenses 515 757 326 520 (182) (390) (563)FX gain (24,492) (6,923) 6,707 (245) (2,540) – –Net other expenses 1,464 1,899 1,276 2,189 3,027 3,202 3,338EBT 12,134 15,779 18,948 17,377 23,909 27,183 27,306Tax (4,528) (2,135) (4,254) (4,290) (5,903) (6,711) (6,742)Income before minority interest 7,606 13,644 14,694 13,086 18,006 20,471 20,564Minority interest (88) (311) (686) (901) (865) (984) (988)Net income 7,518 13,333 14,008 12,186 17,140 19,487 19,576
Source: Company, Sberbank CIB Investment Research
Balance sheet (IFRS), $ mln
2014 2015 2016 2017 2018E 2019E 2020E
Fixed assets and investments 208,259 179,169 225,607 256,414 277,164 300,348 310,935 Current assets 61,522 54,797 53,322 60,230 62,388 62,604 72,482
Stock and inventories 11,943 11,036 11,725 13,408 14,369 14,717 14,441 Accounts receivable 18,592 15,288 17,887 19,492 22,042 22,778 22,811 Cash and securities 18,454 18,648 14,784 15,087 13,734 12,865 22,986 Other current assets 12,533 9,825 8,926 12,243 12,243 12,243 12,243
Total assets 269,781 233,966 278,928 316,644 339,552 362,952 383,417
Current liabilities 32,990 29,152 31,683 44,957 49,053 51,145 51,932 Accounts payable 24,728 20,284 24,313 29,769 31,617 32,381 31,839 Short�term debt 8,262 8,869 7,371 15,188 16,427 17,667 18,907
Long�term liabilities 56,907 55,057 58,613 63,086 67,064 71,072 75,081 Long�term debt 39,533 38,361 39,279 41,523 45,283 49,043 52,803 Deferred profit tax liability 10,560 8,485 11,351 12,143 12,361 12,608 12,857 Other long�term liabilities 6,814 8,211 7,983 9,421 9,421 9,421 9,421
Total liabilities 89,897 84,210 90,296 108,043 116,117 122,218 127,013 Minority interest 5,394 4,460 5,726 6,708 7,574 8,557 9,546 Equity 174,491 145,296 182,906 201,893 215,861 232,177 246,858 Share capital 5,780 4,462 5,361 5,646 5,646 5,646 5,646 Retained earnings 168,710 140,834 177,545 196,247 210,216 226,531 241,213 Total liabilities and equity 269,781 233,966 278,928 316,644 339,552 362,952 383,417
Source: Company, Sberbank CIB Investment Research
Cash flow statement (IFRS), $ mln
2014 2015 2016 2017 2018E 2019E 2020E
EBITDA 47,033 28,511 19,211 25,428 35,383 37,427 39,023Provisions and non�cash items 8,674 3,596 2,505 (408) (2,540) – –Taxes (5,512) (1,710) (1,431) (3,919) (5,685) (6,464) (6,493)Decrease in working capital (4,613) (2,310) 361 3,197 (1,663) (320) (300)Increase in other assets 4,308 4,871 2,366 (3,894) 1,008 89 (1,633)
Operating cash flow 49,890 32,958 23,012 20,404 26,503 30,732 30,597Capex (33,164) (26,740) (20,326) (24,101) (31,317) (34,854) (23,556)Other investments (4,401) (418) (1,079) 612 1,904 1,721 1,571
Free cash flow 16,726 6,218 2,686 (3,697) (4,814) (4,122) 7,041Increase in debt (1,022) 1,107 (1,551) 6,481 5,000 5,000 5,000Interest paid (818) (663) (737) (586) (271) (295) (319)Dividends (4,922) (2,732) (2,886) (3,257) (3,172) (3,172) (3,172)Additional share issues/(purchases) (0) – (2,036) – – – –
Net cash flow 5,562 3,512 (5,602) (447) (1,353) (868) 10,121FX and monetary effects on cash 3,012 1,328 (1,840) 70 – – –Other sources/(uses) of funds (360) 1 (29) (6) – – –
Change in cash position 8,213 4,841 (7,471) (382) (1,353) (868) 10,121
Source: Company, Sberbank CIB Investment Research
This document is being provided by [email protected] for the exclusive use of [email protected]
MAY 2018 RUSSIAN OIL AND GAS – TICKLING GIANTS
34 SBERBANK CIB INVESTMENT RESEARCH
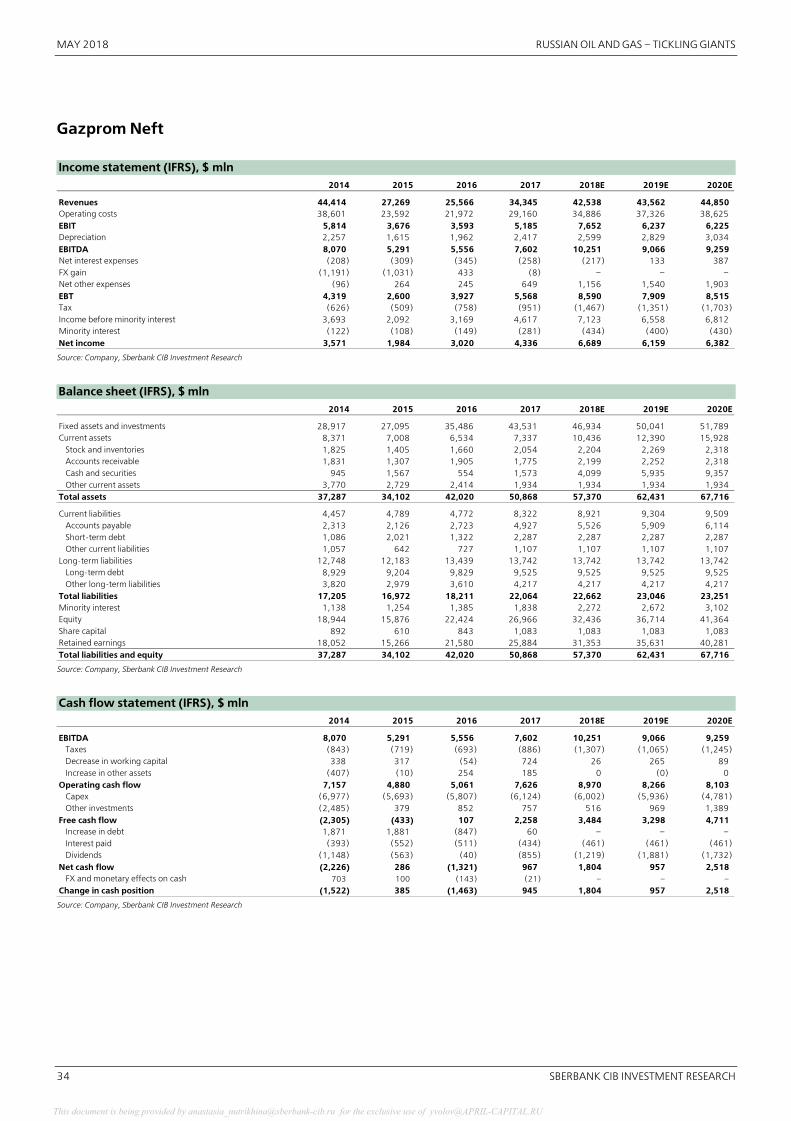
Gazprom Neft Income statement (IFRS), $ mln
2014 2015 2016 2017 2018E 2019E 2020E
Revenues 44,414 27,269 25,566 34,345 42,538 43,562 44,850Operating costs 38,601 23,592 21,972 29,160 34,886 37,326 38,625EBIT 5,814 3,676 3,593 5,185 7,652 6,237 6,225Depreciation 2,257 1,615 1,962 2,417 2,599 2,829 3,034EBITDA 8,070 5,291 5,556 7,602 10,251 9,066 9,259Net interest expenses (208) (309) (345) (258) (217) 133 387FX gain (1,191) (1,031) 433 (8) – – –Net other expenses (96) 264 245 649 1,156 1,540 1,903EBT 4,319 2,600 3,927 5,568 8,590 7,909 8,515Tax (626) (509) (758) (951) (1,467) (1,351) (1,703)Income before minority interest 3,693 2,092 3,169 4,617 7,123 6,558 6,812Minority interest (122) (108) (149) (281) (434) (400) (430)Net income 3,571 1,984 3,020 4,336 6,689 6,159 6,382
Source: Company, Sberbank CIB Investment Research
Balance sheet (IFRS), $ mln
2014 2015 2016 2017 2018E 2019E 2020E
Fixed assets and investments 28,917 27,095 35,486 43,531 46,934 50,041 51,789Current assets 8,371 7,008 6,534 7,337 10,436 12,390 15,928
Stock and inventories 1,825 1,405 1,660 2,054 2,204 2,269 2,318Accounts receivable 1,831 1,307 1,905 1,775 2,199 2,252 2,318Cash and securities 945 1,567 554 1,573 4,099 5,935 9,357Other current assets 3,770 2,729 2,414 1,934 1,934 1,934 1,934
Total assets 37,287 34,102 42,020 50,868 57,370 62,431 67,716
Current liabilities 4,457 4,789 4,772 8,322 8,921 9,304 9,509Accounts payable 2,313 2,126 2,723 4,927 5,526 5,909 6,114Short�term debt 1,086 2,021 1,322 2,287 2,287 2,287 2,287Other current liabilities 1,057 642 727 1,107 1,107 1,107 1,107
Long�term liabilities 12,748 12,183 13,439 13,742 13,742 13,742 13,742Long�term debt 8,929 9,204 9,829 9,525 9,525 9,525 9,525Other long�term liabilities 3,820 2,979 3,610 4,217 4,217 4,217 4,217
Total liabilities 17,205 16,972 18,211 22,064 22,662 23,046 23,251Minority interest 1,138 1,254 1,385 1,838 2,272 2,672 3,102Equity 18,944 15,876 22,424 26,966 32,436 36,714 41,364Share capital 892 610 843 1,083 1,083 1,083 1,083Retained earnings 18,052 15,266 21,580 25,884 31,353 35,631 40,281Total liabilities and equity 37,287 34,102 42,020 50,868 57,370 62,431 67,716
Source: Company, Sberbank CIB Investment Research
Cash flow statement (IFRS), $ mln
2014 2015 2016 2017 2018E 2019E 2020E
EBITDA 8,070 5,291 5,556 7,602 10,251 9,066 9,259Taxes (843) (719) (693) (886) (1,307) (1,065) (1,245)Decrease in working capital 338 317 (54) 724 26 265 89Increase in other assets (407) (10) 254 185 0 (0) 0
Operating cash flow 7,157 4,880 5,061 7,626 8,970 8,266 8,103Capex (6,977) (5,693) (5,807) (6,124) (6,002) (5,936) (4,781)Other investments (2,485) 379 852 757 516 969 1,389
Free cash flow (2,305) (433) 107 2,258 3,484 3,298 4,711Increase in debt 1,871 1,881 (847) 60 – – –Interest paid (393) (552) (511) (434) (461) (461) (461)Dividends (1,148) (563) (40) (855) (1,219) (1,881) (1,732)
Net cash flow (2,226) 286 (1,321) 967 1,804 957 2,518FX and monetary effects on cash 703 100 (143) (21) – – –
Change in cash position (1,522) 385 (1,463) 945 1,804 957 2,518
Source: Company, Sberbank CIB Investment Research
This document is being provided by [email protected] for the exclusive use of [email protected]
RUSSIAN OIL AND GAS – TICKLING GIANTS MAY 2018
SBERBANK CIB INVESTMENT RESEARCH 35
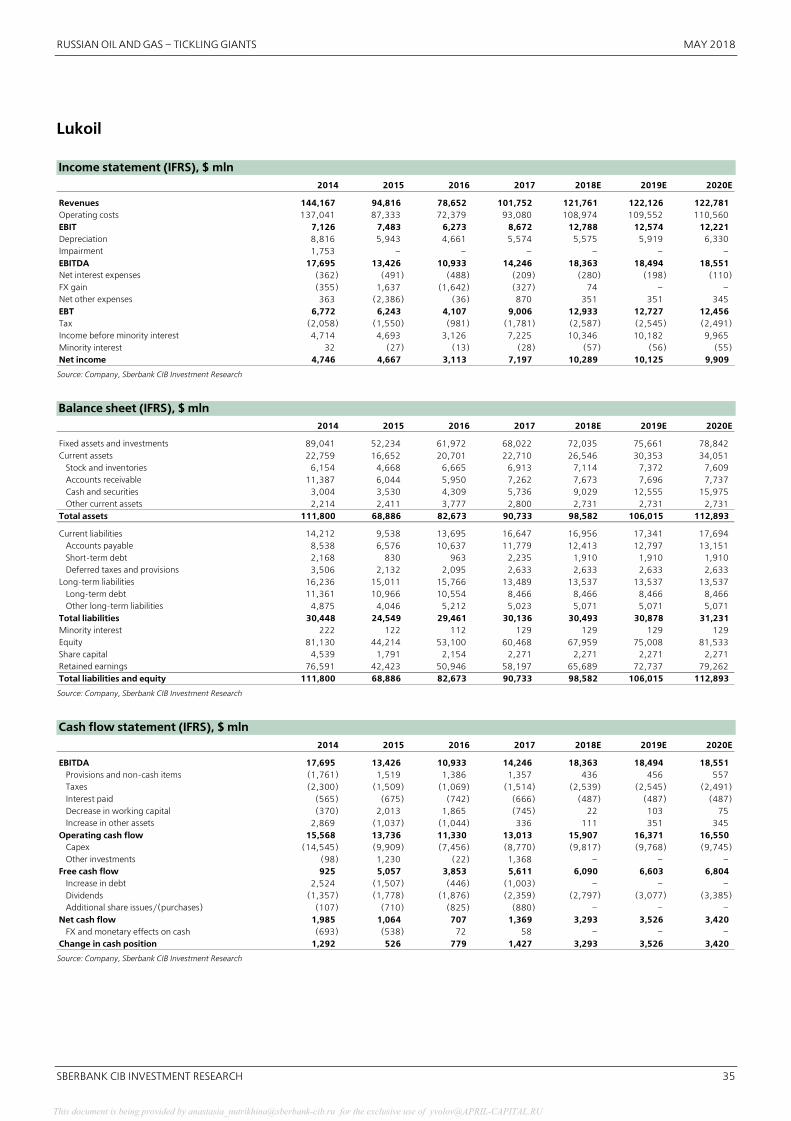
Lukoil Income statement (IFRS), $ mln
2014 2015 2016 2017 2018E 2019E 2020E
Revenues 144,167 94,816 78,652 101,752 121,761 122,126 122,781Operating costs 137,041 87,333 72,379 93,080 108,974 109,552 110,560EBIT 7,126 7,483 6,273 8,672 12,788 12,574 12,221Depreciation 8,816 5,943 4,661 5,574 5,575 5,919 6,330Impairment 1,753 – – – – – –EBITDA 17,695 13,426 10,933 14,246 18,363 18,494 18,551Net interest expenses (362) (491) (488) (209) (280) (198) (110)FX gain (355) 1,637 (1,642) (327) 74 – –Net other expenses 363 (2,386) (36) 870 351 351 345EBT 6,772 6,243 4,107 9,006 12,933 12,727 12,456Tax (2,058) (1,550) (981) (1,781) (2,587) (2,545) (2,491)Income before minority interest 4,714 4,693 3,126 7,225 10,346 10,182 9,965Minority interest 32 (27) (13) (28) (57) (56) (55)Net income 4,746 4,667 3,113 7,197 10,289 10,125 9,909
Source: Company, Sberbank CIB Investment Research
Balance sheet (IFRS), $ mln
2014 2015 2016 2017 2018E 2019E 2020E
Fixed assets and investments 89,041 52,234 61,972 68,022 72,035 75,661 78,842Current assets 22,759 16,652 20,701 22,710 26,546 30,353 34,051
Stock and inventories 6,154 4,668 6,665 6,913 7,114 7,372 7,609Accounts receivable 11,387 6,044 5,950 7,262 7,673 7,696 7,737Cash and securities 3,004 3,530 4,309 5,736 9,029 12,555 15,975Other current assets 2,214 2,411 3,777 2,800 2,731 2,731 2,731
Total assets 111,800 68,886 82,673 90,733 98,582 106,015 112,893
Current liabilities 14,212 9,538 13,695 16,647 16,956 17,341 17,694Accounts payable 8,538 6,576 10,637 11,779 12,413 12,797 13,151Short�term debt 2,168 830 963 2,235 1,910 1,910 1,910Deferred taxes and provisions 3,506 2,132 2,095 2,633 2,633 2,633 2,633
Long�term liabilities 16,236 15,011 15,766 13,489 13,537 13,537 13,537Long�term debt 11,361 10,966 10,554 8,466 8,466 8,466 8,466Other long�term liabilities 4,875 4,046 5,212 5,023 5,071 5,071 5,071
Total liabilities 30,448 24,549 29,461 30,136 30,493 30,878 31,231Minority interest 222 122 112 129 129 129 129Equity 81,130 44,214 53,100 60,468 67,959 75,008 81,533Share capital 4,539 1,791 2,154 2,271 2,271 2,271 2,271Retained earnings 76,591 42,423 50,946 58,197 65,689 72,737 79,262Total liabilities and equity 111,800 68,886 82,673 90,733 98,582 106,015 112,893
Source: Company, Sberbank CIB Investment Research
Cash flow statement (IFRS), $ mln
2014 2015 2016 2017 2018E 2019E 2020E
EBITDA 17,695 13,426 10,933 14,246 18,363 18,494 18,551Provisions and non�cash items (1,761) 1,519 1,386 1,357 436 456 557Taxes (2,300) (1,509) (1,069) (1,514) (2,539) (2,545) (2,491)Interest paid (565) (675) (742) (666) (487) (487) (487)Decrease in working capital (370) 2,013 1,865 (745) 22 103 75Increase in other assets 2,869 (1,037) (1,044) 336 111 351 345
Operating cash flow 15,568 13,736 11,330 13,013 15,907 16,371 16,550Capex (14,545) (9,909) (7,456) (8,770) (9,817) (9,768) (9,745)Other investments (98) 1,230 (22) 1,368 – – –
Free cash flow 925 5,057 3,853 5,611 6,090 6,603 6,804Increase in debt 2,524 (1,507) (446) (1,003) – – –Dividends (1,357) (1,778) (1,876) (2,359) (2,797) (3,077) (3,385)Additional share issues/(purchases) (107) (710) (825) (880) – – –
Net cash flow 1,985 1,064 707 1,369 3,293 3,526 3,420FX and monetary effects on cash (693) (538) 72 58 – – –
Change in cash position 1,292 526 779 1,427 3,293 3,526 3,420
Source: Company, Sberbank CIB Investment Research
This document is being provided by [email protected] for the exclusive use of [email protected]
MAY 2018 RUSSIAN OIL AND GAS – TICKLING GIANTS
36 SBERBANK CIB INVESTMENT RESEARCH
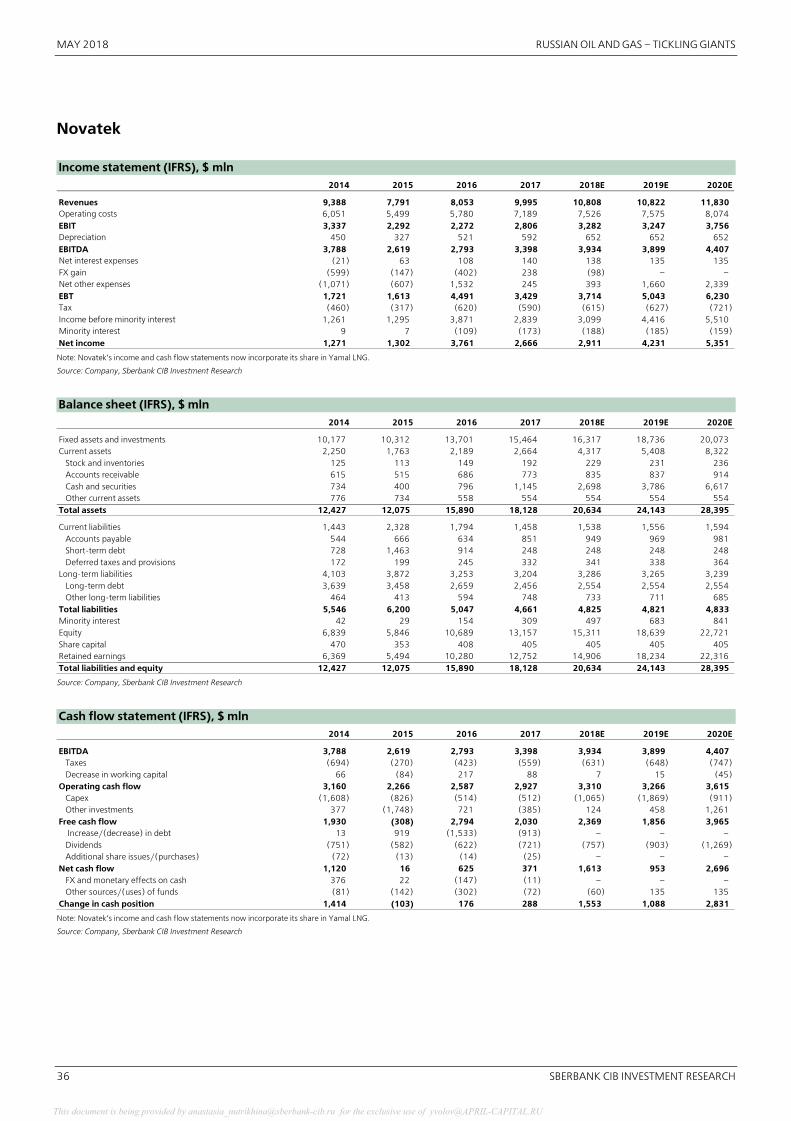
Novatek Income statement (IFRS), $ mln
2014 2015 2016 2017 2018E 2019E 2020E
Revenues 9,388 7,791 8,053 9,995 10,808 10,822 11,830Operating costs 6,051 5,499 5,780 7,189 7,526 7,575 8,074EBIT 3,337 2,292 2,272 2,806 3,282 3,247 3,756Depreciation 450 327 521 592 652 652 652EBITDA 3,788 2,619 2,793 3,398 3,934 3,899 4,407Net interest expenses (21) 63 108 140 138 135 135FX gain (599) (147) (402) 238 (98) – –Net other expenses (1,071) (607) 1,532 245 393 1,660 2,339EBT 1,721 1,613 4,491 3,429 3,714 5,043 6,230Tax (460) (317) (620) (590) (615) (627) (721)Income before minority interest 1,261 1,295 3,871 2,839 3,099 4,416 5,510Minority interest 9 7 (109) (173) (188) (185) (159)Net income 1,271 1,302 3,761 2,666 2,911 4,231 5,351
Note: Novatek’s income and cash flow statements now incorporate its share in Yamal LNG.
Source: Company, Sberbank CIB Investment Research
Balance sheet (IFRS), $ mln
2014 2015 2016 2017 2018E 2019E 2020E
Fixed assets and investments 10,177 10,312 13,701 15,464 16,317 18,736 20,073Current assets 2,250 1,763 2,189 2,664 4,317 5,408 8,322
Stock and inventories 125 113 149 192 229 231 236Accounts receivable 615 515 686 773 835 837 914Cash and securities 734 400 796 1,145 2,698 3,786 6,617Other current assets 776 734 558 554 554 554 554
Total assets 12,427 12,075 15,890 18,128 20,634 24,143 28,395
Current liabilities 1,443 2,328 1,794 1,458 1,538 1,556 1,594Accounts payable 544 666 634 851 949 969 981Short�term debt 728 1,463 914 248 248 248 248Deferred taxes and provisions 172 199 245 332 341 338 364
Long�term liabilities 4,103 3,872 3,253 3,204 3,286 3,265 3,239Long�term debt 3,639 3,458 2,659 2,456 2,554 2,554 2,554Other long�term liabilities 464 413 594 748 733 711 685
Total liabilities 5,546 6,200 5,047 4,661 4,825 4,821 4,833Minority interest 42 29 154 309 497 683 841Equity 6,839 5,846 10,689 13,157 15,311 18,639 22,721Share capital 470 353 408 405 405 405 405Retained earnings 6,369 5,494 10,280 12,752 14,906 18,234 22,316Total liabilities and equity 12,427 12,075 15,890 18,128 20,634 24,143 28,395
Source: Company, Sberbank CIB Investment Research
Cash flow statement (IFRS), $ mln
2014 2015 2016 2017 2018E 2019E 2020E
EBITDA 3,788 2,619 2,793 3,398 3,934 3,899 4,407Taxes (694) (270) (423) (559) (631) (648) (747)Decrease in working capital 66 (84) 217 88 7 15 (45)
Operating cash flow 3,160 2,266 2,587 2,927 3,310 3,266 3,615Capex (1,608) (826) (514) (512) (1,065) (1,869) (911)Other investments 377 (1,748) 721 (385) 124 458 1,261
Free cash flow 1,930 (308) 2,794 2,030 2,369 1,856 3,965 Increase/(decrease) in debt 13 919 (1,533) (913) – – –Dividends (751) (582) (622) (721) (757) (903) (1,269)Additional share issues/(purchases) (72) (13) (14) (25) – – –
Net cash flow 1,120 16 625 371 1,613 953 2,696FX and monetary effects on cash 376 22 (147) (11) – – –Other sources/(uses) of funds (81) (142) (302) (72) (60) 135 135
Change in cash position 1,414 (103) 176 288 1,553 1,088 2,831 Note: Novatek’s income and cash flow statements now incorporate its share in Yamal LNG.
Source: Company, Sberbank CIB Investment Research
This document is being provided by [email protected] for the exclusive use of [email protected]
RUSSIAN OIL AND GAS – TICKLING GIANTS MAY 2018
SBERBANK CIB INVESTMENT RESEARCH 37
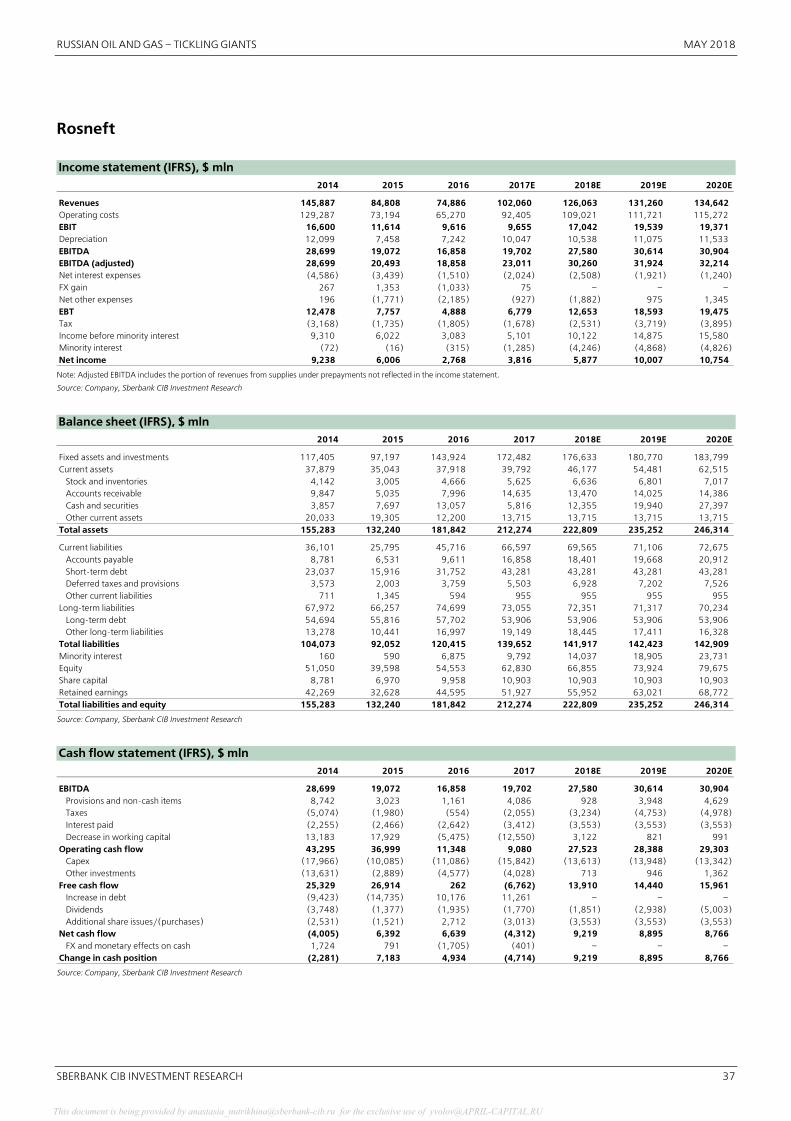
Rosneft Income statement (IFRS), $ mln
2014 2015 2016 2017E 2018E 2019E 2020E
Revenues 145,887 84,808 74,886 102,060 126,063 131,260 134,642Operating costs 129,287 73,194 65,270 92,405 109,021 111,721 115,272EBIT 16,600 11,614 9,616 9,655 17,042 19,539 19,371Depreciation 12,099 7,458 7,242 10,047 10,538 11,075 11,533EBITDA 28,699 19,072 16,858 19,702 27,580 30,614 30,904EBITDA (adjusted) 28,699 20,493 18,858 23,011 30,260 31,924 32,214Net interest expenses (4,586) (3,439) (1,510) (2,024) (2,508) (1,921) (1,240)FX gain 267 1,353 (1,033) 75 – – –Net other expenses 196 (1,771) (2,185) (927) (1,882) 975 1,345EBT 12,478 7,757 4,888 6,779 12,653 18,593 19,475Tax (3,168) (1,735) (1,805) (1,678) (2,531) (3,719) (3,895)Income before minority interest 9,310 6,022 3,083 5,101 10,122 14,875 15,580Minority interest (72) (16) (315) (1,285) (4,246) (4,868) (4,826)Net income 9,238 6,006 2,768 3,816 5,877 10,007 10,754
Note: Adjusted EBITDA includes the portion of revenues from supplies under prepayments not reflected in the income statement.
Source: Company, Sberbank CIB Investment Research
Balance sheet (IFRS), $ mln
2014 2015 2016 2017 2018E 2019E 2020E
Fixed assets and investments 117,405 97,197 143,924 172,482 176,633 180,770 183,799Current assets 37,879 35,043 37,918 39,792 46,177 54,481 62,515
Stock and inventories 4,142 3,005 4,666 5,625 6,636 6,801 7,017Accounts receivable 9,847 5,035 7,996 14,635 13,470 14,025 14,386Cash and securities 3,857 7,697 13,057 5,816 12,355 19,940 27,397Other current assets 20,033 19,305 12,200 13,715 13,715 13,715 13,715
Total assets 155,283 132,240 181,842 212,274 222,809 235,252 246,314
Current liabilities 36,101 25,795 45,716 66,597 69,565 71,106 72,675Accounts payable 8,781 6,531 9,611 16,858 18,401 19,668 20,912Short�term debt 23,037 15,916 31,752 43,281 43,281 43,281 43,281Deferred taxes and provisions 3,573 2,003 3,759 5,503 6,928 7,202 7,526Other current liabilities 711 1,345 594 955 955 955 955
Long�term liabilities 67,972 66,257 74,699 73,055 72,351 71,317 70,234Long�term debt 54,694 55,816 57,702 53,906 53,906 53,906 53,906Other long�term liabilities 13,278 10,441 16,997 19,149 18,445 17,411 16,328
Total liabilities 104,073 92,052 120,415 139,652 141,917 142,423 142,909Minority interest 160 590 6,875 9,792 14,037 18,905 23,731Equity 51,050 39,598 54,553 62,830 66,855 73,924 79,675Share capital 8,781 6,970 9,958 10,903 10,903 10,903 10,903Retained earnings 42,269 32,628 44,595 51,927 55,952 63,021 68,772Total liabilities and equity 155,283 132,240 181,842 212,274 222,809 235,252 246,314
Source: Company, Sberbank CIB Investment Research
Cash flow statement (IFRS), $ mln
2014 2015 2016 2017 2018E 2019E 2020E
EBITDA 28,699 19,072 16,858 19,702 27,580 30,614 30,904Provisions and non�cash items 8,742 3,023 1,161 4,086 928 3,948 4,629Taxes (5,074) (1,980) (554) (2,055) (3,234) (4,753) (4,978)Interest paid (2,255) (2,466) (2,642) (3,412) (3,553) (3,553) (3,553)Decrease in working capital 13,183 17,929 (5,475) (12,550) 3,122 821 991
Operating cash flow 43,295 36,999 11,348 9,080 27,523 28,388 29,303Capex (17,966) (10,085) (11,086) (15,842) (13,613) (13,948) (13,342)Other investments (13,631) (2,889) (4,577) (4,028) 713 946 1,362
Free cash flow 25,329 26,914 262 (6,762) 13,910 14,440 15,961Increase in debt (9,423) (14,735) 10,176 11,261 – – –Dividends (3,748) (1,377) (1,935) (1,770) (1,851) (2,938) (5,003)Additional share issues/(purchases) (2,531) (1,521) 2,712 (3,013) (3,553) (3,553) (3,553)
Net cash flow (4,005) 6,392 6,639 (4,312) 9,219 8,895 8,766FX and monetary effects on cash 1,724 791 (1,705) (401) – – –
Change in cash position (2,281) 7,183 4,934 (4,714) 9,219 8,895 8,766 Source: Company, Sberbank CIB Investment Research
This document is being provided by [email protected] for the exclusive use of [email protected]
MAY 2018 RUSSIAN OIL AND GAS – TICKLING GIANTS
38 SBERBANK CIB INVESTMENT RESEARCH
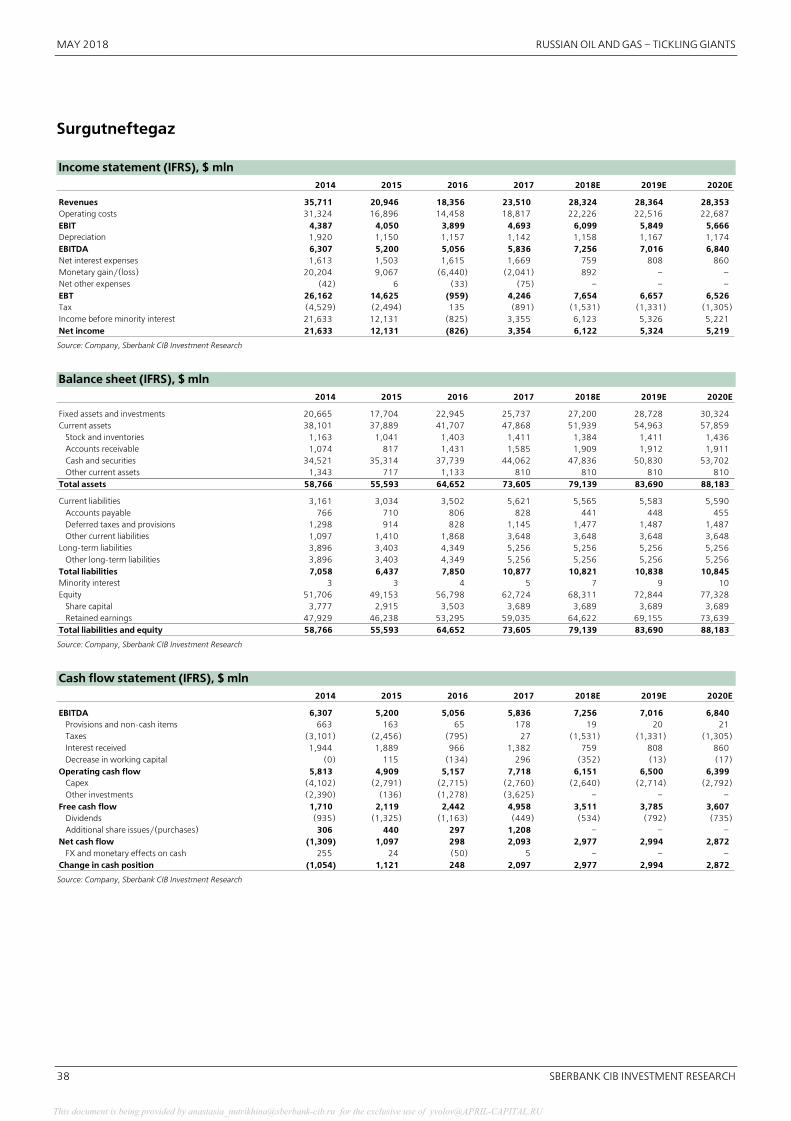
Surgutneftegaz Income statement (IFRS), $ mln
2014 2015 2016 2017 2018E 2019E 2020E
Revenues 35,711 20,946 18,356 23,510 28,324 28,364 28,353Operating costs 31,324 16,896 14,458 18,817 22,226 22,516 22,687EBIT 4,387 4,050 3,899 4,693 6,099 5,849 5,666Depreciation 1,920 1,150 1,157 1,142 1,158 1,167 1,174EBITDA 6,307 5,200 5,056 5,836 7,256 7,016 6,840Net interest expenses 1,613 1,503 1,615 1,669 759 808 860Monetary gain/(loss) 20,204 9,067 (6,440) (2,041) 892 – –Net other expenses (42) 6 (33) (75) – – –EBT 26,162 14,625 (959) 4,246 7,654 6,657 6,526Tax (4,529) (2,494) 135 (891) (1,531) (1,331) (1,305)Income before minority interest 21,633 12,131 (825) 3,355 6,123 5,326 5,221Net income 21,633 12,131 (826) 3,354 6,122 5,324 5,219
Source: Company, Sberbank CIB Investment Research
Balance sheet (IFRS), $ mln
2014 2015 2016 2017 2018E 2019E 2020E
Fixed assets and investments 20,665 17,704 22,945 25,737 27,200 28,728 30,324Current assets 38,101 37,889 41,707 47,868 51,939 54,963 57,859
Stock and inventories 1,163 1,041 1,403 1,411 1,384 1,411 1,436Accounts receivable 1,074 817 1,431 1,585 1,909 1,912 1,911Cash and securities 34,521 35,314 37,739 44,062 47,836 50,830 53,702Other current assets 1,343 717 1,133 810 810 810 810
Total assets 58,766 55,593 64,652 73,605 79,139 83,690 88,183
Current liabilities 3,161 3,034 3,502 5,621 5,565 5,583 5,590Accounts payable 766 710 806 828 441 448 455Deferred taxes and provisions 1,298 914 828 1,145 1,477 1,487 1,487Other current liabilities 1,097 1,410 1,868 3,648 3,648 3,648 3,648
Long�term liabilities 3,896 3,403 4,349 5,256 5,256 5,256 5,256Other long�term liabilities 3,896 3,403 4,349 5,256 5,256 5,256 5,256
Total liabilities 7,058 6,437 7,850 10,877 10,821 10,838 10,845Minority interest 3 3 4 5 7 9 10Equity 51,706 49,153 56,798 62,724 68,311 72,844 77,328
Share capital 3,777 2,915 3,503 3,689 3,689 3,689 3,689Retained earnings 47,929 46,238 53,295 59,035 64,622 69,155 73,639
Total liabilities and equity 58,766 55,593 64,652 73,605 79,139 83,690 88,183 Source: Company, Sberbank CIB Investment Research
Cash flow statement (IFRS), $ mln
2014 2015 2016 2017 2018E 2019E 2020E
EBITDA 6,307 5,200 5,056 5,836 7,256 7,016 6,840Provisions and non�cash items 663 163 65 178 19 20 21Taxes (3,101) (2,456) (795) 27 (1,531) (1,331) (1,305)Interest received 1,944 1,889 966 1,382 759 808 860Decrease in working capital (0) 115 (134) 296 (352) (13) (17)
Operating cash flow 5,813 4,909 5,157 7,718 6,151 6,500 6,399Capex (4,102) (2,791) (2,715) (2,760) (2,640) (2,714) (2,792)Other investments (2,390) (136) (1,278) (3,625) – – –
Free cash flow 1,710 2,119 2,442 4,958 3,511 3,785 3,607Dividends (935) (1,325) (1,163) (449) (534) (792) (735)Additional share issues/(purchases) 306 440 297 1,208 – – –
Net cash flow (1,309) 1,097 298 2,093 2,977 2,994 2,872FX and monetary effects on cash 255 24 (50) 5 – – –
Change in cash position (1,054) 1,121 248 2,097 2,977 2,994 2,872 Source: Company, Sberbank CIB Investment Research
This document is being provided by [email protected] for the exclusive use of [email protected]
RUSSIAN OIL AND GAS – TICKLING GIANTS MAY 2018
SBERBANK CIB INVESTMENT RESEARCH 39
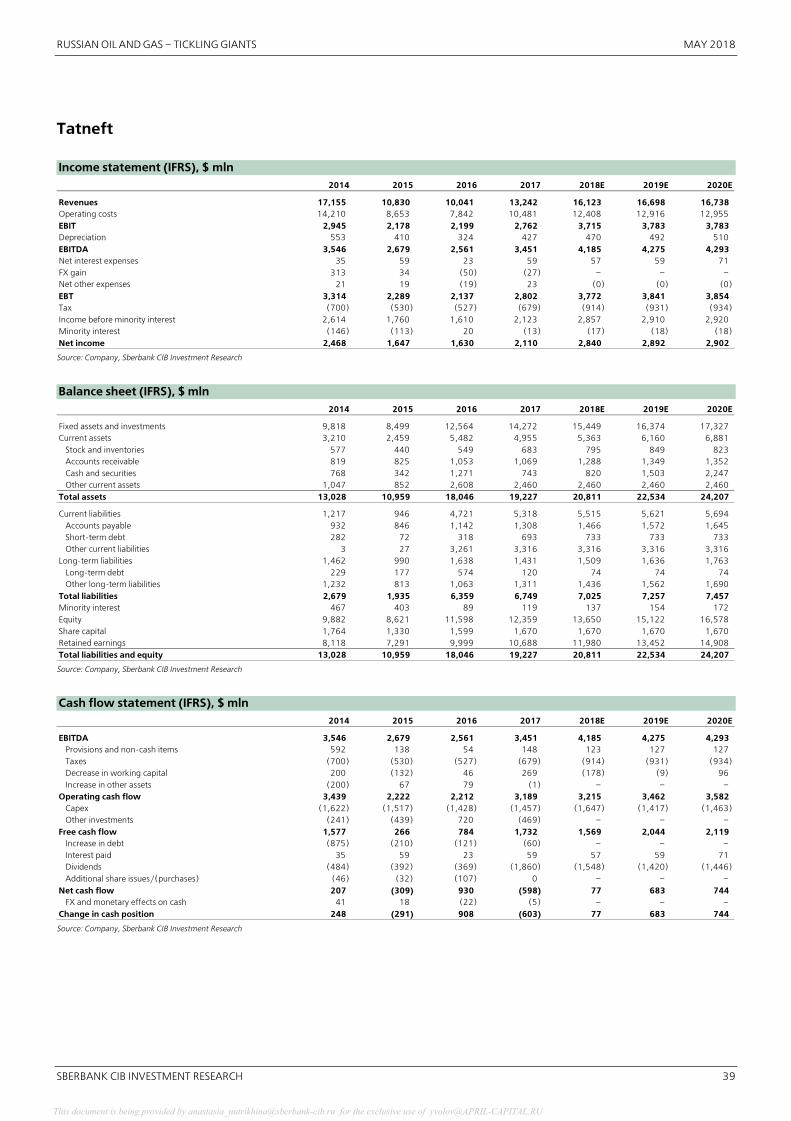
Tatneft Income statement (IFRS), $ mln
2014 2015 2016 2017 2018E 2019E 2020E
Revenues 17,155 10,830 10,041 13,242 16,123 16,698 16,738Operating costs 14,210 8,653 7,842 10,481 12,408 12,916 12,955EBIT 2,945 2,178 2,199 2,762 3,715 3,783 3,783Depreciation 553 410 324 427 470 492 510EBITDA 3,546 2,679 2,561 3,451 4,185 4,275 4,293Net interest expenses 35 59 23 59 57 59 71FX gain 313 34 (50) (27) – – –Net other expenses 21 19 (19) 23 (0) (0) (0)EBT 3,314 2,289 2,137 2,802 3,772 3,841 3,854Tax (700) (530) (527) (679) (914) (931) (934)Income before minority interest 2,614 1,760 1,610 2,123 2,857 2,910 2,920Minority interest (146) (113) 20 (13) (17) (18) (18)Net income 2,468 1,647 1,630 2,110 2,840 2,892 2,902
Source: Company, Sberbank CIB Investment Research
Balance sheet (IFRS), $ mln
2014 2015 2016 2017 2018E 2019E 2020E
Fixed assets and investments 9,818 8,499 12,564 14,272 15,449 16,374 17,327Current assets 3,210 2,459 5,482 4,955 5,363 6,160 6,881
Stock and inventories 577 440 549 683 795 849 823Accounts receivable 819 825 1,053 1,069 1,288 1,349 1,352Cash and securities 768 342 1,271 743 820 1,503 2,247Other current assets 1,047 852 2,608 2,460 2,460 2,460 2,460
Total assets 13,028 10,959 18,046 19,227 20,811 22,534 24,207
Current liabilities 1,217 946 4,721 5,318 5,515 5,621 5,694Accounts payable 932 846 1,142 1,308 1,466 1,572 1,645Short�term debt 282 72 318 693 733 733 733Other current liabilities 3 27 3,261 3,316 3,316 3,316 3,316
Long�term liabilities 1,462 990 1,638 1,431 1,509 1,636 1,763Long�term debt 229 177 574 120 74 74 74Other long�term liabilities 1,232 813 1,063 1,311 1,436 1,562 1,690
Total liabilities 2,679 1,935 6,359 6,749 7,025 7,257 7,457Minority interest 467 403 89 119 137 154 172Equity 9,882 8,621 11,598 12,359 13,650 15,122 16,578Share capital 1,764 1,330 1,599 1,670 1,670 1,670 1,670Retained earnings 8,118 7,291 9,999 10,688 11,980 13,452 14,908Total liabilities and equity 13,028 10,959 18,046 19,227 20,811 22,534 24,207
Source: Company, Sberbank CIB Investment Research
Cash flow statement (IFRS), $ mln
2014 2015 2016 2017 2018E 2019E 2020E
EBITDA 3,546 2,679 2,561 3,451 4,185 4,275 4,293Provisions and non�cash items 592 138 54 148 123 127 127Taxes (700) (530) (527) (679) (914) (931) (934)Decrease in working capital 200 (132) 46 269 (178) (9) 96Increase in other assets (200) 67 79 (1) – – –
Operating cash flow 3,439 2,222 2,212 3,189 3,215 3,462 3,582Capex (1,622) (1,517) (1,428) (1,457) (1,647) (1,417) (1,463)Other investments (241) (439) 720 (469) – – –
Free cash flow 1,577 266 784 1,732 1,569 2,044 2,119Increase in debt (875) (210) (121) (60) – – –Interest paid 35 59 23 59 57 59 71Dividends (484) (392) (369) (1,860) (1,548) (1,420) (1,446)Additional share issues/(purchases) (46) (32) (107) 0 – – –
Net cash flow 207 (309) 930 (598) 77 683 744FX and monetary effects on cash 41 18 (22) (5) – – –
Change in cash position 248 (291) 908 (603) 77 683 744 Source: Company, Sberbank CIB Investment Research
This document is being provided by [email protected] for the exclusive use of [email protected]
MAY 2018 RUSSIAN OIL AND GAS – TICKLING GIANTS
40 SBERBANK CIB INVESTMENT RESEARCH
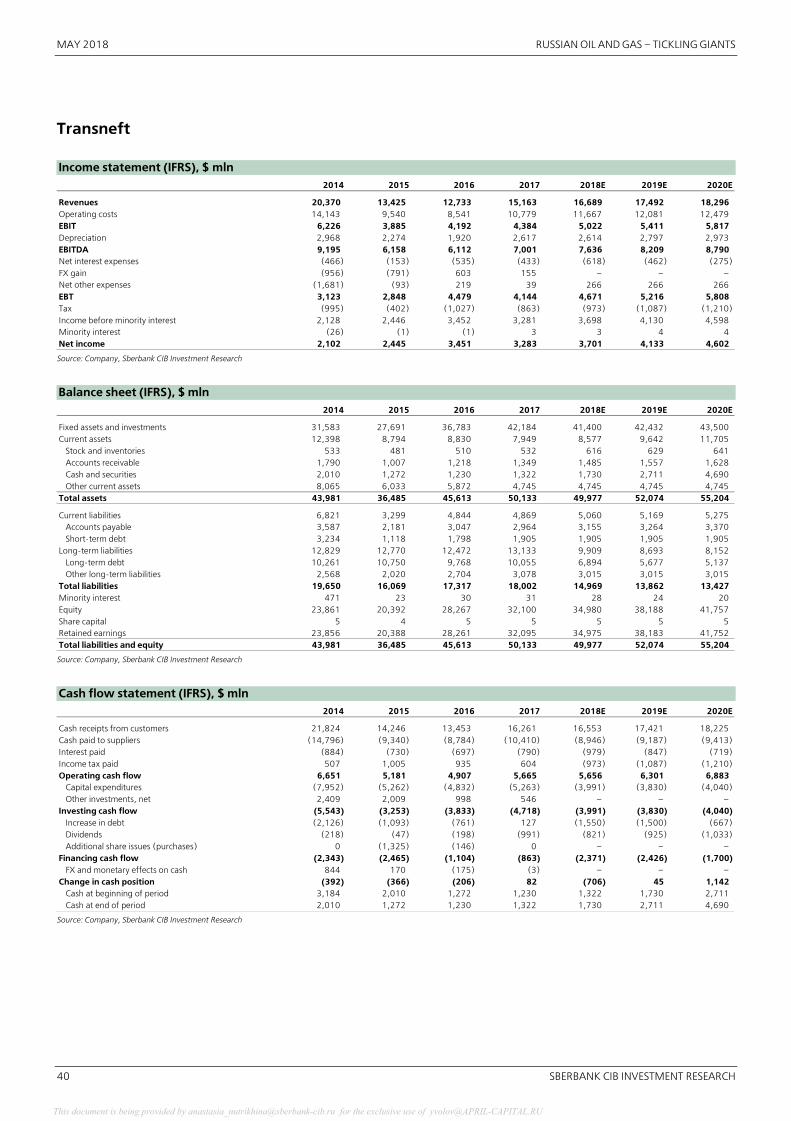
Transneft Income statement (IFRS), $ mln
2014 2015 2016 2017 2018E 2019E 2020E
Revenues 20,370 13,425 12,733 15,163 16,689 17,492 18,296Operating costs 14,143 9,540 8,541 10,779 11,667 12,081 12,479EBIT 6,226 3,885 4,192 4,384 5,022 5,411 5,817Depreciation 2,968 2,274 1,920 2,617 2,614 2,797 2,973EBITDA 9,195 6,158 6,112 7,001 7,636 8,209 8,790Net interest expenses (466) (153) (535) (433) (618) (462) (275)FX gain (956) (791) 603 155 – – –Net other expenses (1,681) (93) 219 39 266 266 266EBT 3,123 2,848 4,479 4,144 4,671 5,216 5,808Tax (995) (402) (1,027) (863) (973) (1,087) (1,210)Income before minority interest 2,128 2,446 3,452 3,281 3,698 4,130 4,598Minority interest (26) (1) (1) 3 3 4 4Net income 2,102 2,445 3,451 3,283 3,701 4,133 4,602
Source: Company, Sberbank CIB Investment Research
Balance sheet (IFRS), $ mln
2014 2015 2016 2017 2018E 2019E 2020E
Fixed assets and investments 31,583 27,691 36,783 42,184 41,400 42,432 43,500Current assets 12,398 8,794 8,830 7,949 8,577 9,642 11,705
Stock and inventories 533 481 510 532 616 629 641Accounts receivable 1,790 1,007 1,218 1,349 1,485 1,557 1,628Cash and securities 2,010 1,272 1,230 1,322 1,730 2,711 4,690Other current assets 8,065 6,033 5,872 4,745 4,745 4,745 4,745
Total assets 43,981 36,485 45,613 50,133 49,977 52,074 55,204
Current liabilities 6,821 3,299 4,844 4,869 5,060 5,169 5,275Accounts payable 3,587 2,181 3,047 2,964 3,155 3,264 3,370Short�term debt 3,234 1,118 1,798 1,905 1,905 1,905 1,905
Long�term liabilities 12,829 12,770 12,472 13,133 9,909 8,693 8,152Long�term debt 10,261 10,750 9,768 10,055 6,894 5,677 5,137Other long�term liabilities 2,568 2,020 2,704 3,078 3,015 3,015 3,015
Total liabilities 19,650 16,069 17,317 18,002 14,969 13,862 13,427Minority interest 471 23 30 31 28 24 20Equity 23,861 20,392 28,267 32,100 34,980 38,188 41,757Share capital 5 4 5 5 5 5 5Retained earnings 23,856 20,388 28,261 32,095 34,975 38,183 41,752Total liabilities and equity 43,981 36,485 45,613 50,133 49,977 52,074 55,204
Source: Company, Sberbank CIB Investment Research
Cash flow statement (IFRS), $ mln
2014 2015 2016 2017 2018E 2019E 2020E
Cash receipts from customers 21,824 14,246 13,453 16,261 16,553 17,421 18,225Cash paid to suppliers (14,796) (9,340) (8,784) (10,410) (8,946) (9,187) (9,413)Interest paid (884) (730) (697) (790) (979) (847) (719)Income tax paid 507 1,005 935 604 (973) (1,087) (1,210)Operating cash flow 6,651 5,181 4,907 5,665 5,656 6,301 6,883
Capital expenditures (7,952) (5,262) (4,832) (5,263) (3,991) (3,830) (4,040)Other investments, net 2,409 2,009 998 546 – – –
Investing cash flow (5,543) (3,253) (3,833) (4,718) (3,991) (3,830) (4,040)Increase in debt (2,126) (1,093) (761) 127 (1,550) (1,500) (667)Dividends (218) (47) (198) (991) (821) (925) (1,033)Additional share issues (purchases) 0 (1,325) (146) 0 – – –
Financing cash flow (2,343) (2,465) (1,104) (863) (2,371) (2,426) (1,700)FX and monetary effects on cash 844 170 (175) (3) – – –
Change in cash position (392) (366) (206) 82 (706) 45 1,142Cash at beginning of period 3,184 2,010 1,272 1,230 1,322 1,730 2,711Cash at end of period 2,010 1,272 1,230 1,322 1,730 2,711 4,690
Source: Company, Sberbank CIB Investment Research
This document is being provided by [email protected] for the exclusive use of [email protected]
RUSSIAN OIL AND GAS – TICKLING GIANTS MAY 2018
SBERBANK CIB INVESTMENT RESEARCH 41
Disclosure appendix
IMPORTANT US REGULATORY DISCLOSURES
Within the last 12 months, an affiliate of Sberbank CIB USA managed or co�managed a public
offering of the securities of Bashneft, Gazprom, Gazprom Neft, Transneft.
Within the last 12 months, an affiliate of Sberbank CIB USA has received compensation for
investment banking services from Bashneft, Gazprom, Gazprom Neft, Transneft.
In the next three months, an affiliate of Sberbank CIB USA expects to receive or intends to seek
compensation for investment banking services from Gazprom Neft, Transneft.
An affiliate of Sberbank CIB USA makes a market in the securities of Gazprom, Gazprom Neft,
Lukoil, Novatek, Rosneft, Surgutneftegaz, Tatneft, Transneft.
This report may not be independent of Sberbank's proprietary interests. Sberbank may trade the
securities covered in this report for its own account and on a discretionary basis on behalf of certain
clients. Such trading interests may be contrary to the recommendation(s) offered in this report.
The research analysts, strategists, or research associates principally responsible for the preparation
of this research communication have received compensation based upon various factors, including
quality of research, investor client feedback, stock picking, competitive factors, firm revenues and
overall investment banking revenues.
Analyst certification
The following analyst(s) hereby certify that the views expressed in this research report accurately
reflect such research analyst's personal views about the subject securities and issuers and that no
part of his or her compensation was, is, or will be directly or indirectly related to the specific
recommendations or views contained in the research report: Alex Fak, Anna Kotelnikova.
This document is being provided by [email protected] for the exclusive use of [email protected]
Senior Management
Head of Sberbank CIB Igor Bulantsev
Co�Head of Sberbank CIB Aleksandr Bazarov
Head of Global Markets Department,
Vice�President Andrey Shemetov
Research Department +7 (495) 258 0511
Head of Research Alexander Kudrin +7 (495) 933 9847
Equity Strategy
Chief Equity Strategist Andrey Kuznetsov +7 (495) 933 9868
Equity Strategist Cole Akeson +7 (495) 933 9851
Economy
Chief Economist Anton Stroutchenevski +7 (495) 933 9843
Senior Economist Rodion Lomivorotov, CFA +7 (495) 787 2364
Economist Sergei Konygin +7 (495) 933 9848
Junior Economist Artem Vinogradov +7 (495) 258 0541
Oil and Gas
Senior Analyst Alex Fak +7 (495) 933 9829
Analyst Anna Kotelnikova +7 (495) 787 2382
Metals and Mining, Chemicals
Senior Analyst Irina Lapshina +7 (495) 933 9852
Financials
Senior Analyst Andrew Keeley +44 (20) 7936 0439
Analyst Elena Tsareva +7 (495) 258 0561
Telecoms, Media and Internet
Senior Analyst Svetlana Sukhanova +7 (495) 933 9835
Analyst Maria Sukhanova +7 (495) 933 9856
Consumer
Senior Analyst Mikhail Krasnoperov +7 (495) 933 9838
Junior Analyst Andrey Krylov +7 (495) 258 0511
Utilities
Senior Analyst Igor Vasilyev +7 (495) 933 9842
Junior Analyst Aleksey Ryabushko +7 (495) 258 0511
IT
Senior Analyst Julia Gordeyeva, CFA +7 (495) 933 9846
Senior Analyst Igor Vasilyev +7 (495) 933 9842
Junior Analyst Aleksey Ryabushko +7 (495) 258 0511
Real Estate, Construction
Senior Analyst Julia Gordeyeva, CFA +7 (495) 933 9846
Senior Analyst Igor Vasilyev +7 (495) 933 9842
Junior Analyst Aleksey Ryabushko +7 (495) 258 0511
Transport, Industrials
Senior Analyst Igor Vasilyev +7 (495) 933 9842
Senior Analyst Julia Gordeyeva, CFA +7 (495) 933 9846
J Junior Analyst Aleksey Ryabushko +7 (495) 258 0511
FICC Strategy
Chief Strategist FX/IR Tom Levinson +7 (495) 933 9858
Junior Strategist FX/IR Yuri Popov +7 (495) 787 2383
Commodity Strategist Mikhail Sheybe +7 (495) 258 0521
Strategist FI Alexander Golinsky + 7 (495) 258 0511
Fixed Income Credit Research
Senior Credit Analyst Alexey Bulgakov +7 (495) 933 9866
Senior Credit Analyst Ekaterina Sidorova, CFA +7 (495) 933 9834
Credit Analyst Alexander Sychev, CFA +7 (495) 933 9886
Analyst Nikolay Minko + 7 (495) 933 9857
Junior Analyst Alisa Zakirova + 7 (495) 258 0542
Head Office, Moscow
19, ul VavilovaMoscow 117997, Russia
Phone +7 (495) 258 0500Research +7 (495) 258 0511Equity Sales +7 (495) 258 0550Fixed Income Sales +7 (495) 258 0510Trading +7 (495) 258 0525Options Trading +7 (495) 258 0555Structured Products +7 (495) 258 0572Treasury Products +7 (495) 258 0530
Sberbank CIB USA, Inc
Carnegie Hall Tower, 152 West 57th Street44th floor, New York, NY 10019
Phone +1 (212) 300 9600
Sberbank CIB (UK) Limited
85 Fleet Street, 4th floor, London, EC4Y 1AE
Phone +44 (20) 7583 3257
Authorized and regulated by the Financial Conduct AuthorityA member of the London Stock Exchange
This document is being provided by [email protected] for the exclusive use of [email protected]
This Sberbank CIB Investment Research analytical review (hereinafter – “this analytical review”) was prepared jointly by JSC Sberbank CIB and Sberbank CIB (UK) and/or any of their affiliated persons(collectively – “Sberbank CIB”).
This analytical review accurately reflects analysts’ personal opinions about the company (companies) analyzed and its (their) securities. Analysts’ compensation is not in any way, directly or indirectly,related to the specific recommendations and opinions expressed in this analytical review. The personal views of analysts may differ from one another. Sberbank CIB may have issued or may issueSberbank CIB Investment Research analytical reviews that are inconsistent with, and/or reach different conclusions from, the information presented herein.
This analytical review may be used as general information only and is based on current public information that Sberbank CIB considers reliable, but Sberbank CIB does not represent it as accurate orcomplete, and it should not be relied on as such. Neither the information nor any opinion expressed constitutes a recommendation, an offer or an invitation to make an offer, to buy or sell any securitiesor other investment or any options, futures or any other financial instruments. This analytical review does not constitute investment advice and does not take into account any special or individualinvestment objectives, financial situations or particular needs of any particular person who may receive this analytical review. The services, securities and investments discussed in this analytical reviewmay be neither available to nor suitable for all investors. Investors should seek financial advice regarding the appropriateness of investing in any security or other investment and the investmentstrategies discussed or recommended in this analytical review and should understand that statements regarding future prospects may not be realized.
Investors should note that income from such securities or other investments, if any, may fluctuate and that the price or value of such securities and investments may rise or fall. Accordingly, investorsmay receive back less than was originally invested. Past performance is not necessarily a guide to future performance, future returns are not guaranteed, and a loss of original capital may occur.Sberbank CIB accepts no liability whatsoever for any direct and indirect losses, damage, or other consequences of any kind that may arise out of the partial or full usage of the materials from SberbankCIB Investment Research analytical reviews. Investors should conduct their own evaluation of risks and should not rely solely on the information presented in Sberbank CIB Investment Research analyticalreviews. Investors should obtain individual legal, tax, financial, accounting or other professional advice based on their particular circumstances. Any information relating to the tax status of financialinstruments discussed herein is not intended to provide tax advice or to be used by anyone to provide tax advice.
Sberbank CIB is not committed to update the information or to correct any inaccuracies contained in Sberbank CIB Investment Research analytical reviews.
From time to time, Sberbank CIB or the principals or employees and their connected persons of Sberbank CIB may have or have had positions in the securities or other instruments referred to herein ormay conduct or may have conducted market�making activities or otherwise act or have acted as principal in transactions in any of these securities or instruments or may provide or have providedinvestment banking or consulting services to or serve or have served as a director or a supervisory board member of a company referred to in this analytical review. Sberbank CIB’s sales managers,traders, and other professionals may provide oral or written market commentary or trading strategies to Sberbank CIB’s clients, as well as its proprietary trading desks, where transactions are enteredinto at the expense and in the interest of Sberbank CIB, and such commentary may reflect opinions that are contrary to the opinions expressed in analytical reviews of Sberbank CIB Investment Research.Sberbank CIB’s asset management, proprietary trading and investment banking business units may make investment decisions that are inconsistent with the recommendations or views expressed in thisanalytical review. Sberbank CIB maintains internal policies that are designed to manage any actual or potential conflicts of interest.
Other than certain industry specific analytical reviews published on a regular basis, Sberbank CIB Investment Research analytical reviews are published at irregular intervals as appropriate in the analyst’sjudgment.
Further information on the securities referred to herein may be obtained from Sberbank CIB upon request. This analytical review may not be reproduced or copied in whole or in any part without writtenconsent of Sberbank CIB.
This analytical review does not constitute or contain legal advice. Further, Sberbank CIB should not in any way be viewed as soliciting, facilitating, brokering or causing any persons within any country toinvest in or otherwise engage in transactions that may be prohibited to those persons under relevant law. Sberbank CIB Investment Research analytical reviews are provided in respect of entities orinvestments in both Russian domestic and international financial markets (as applicable in each case) and are intended for eligible investors in compliance with the legal requirements and trading rulesof the relevant markets. Sberbank CIB Investment Research analytical reviews received by such eligible investors concerning entities or investments that may be sanctioned in other jurisdictions are notdirected to, and should not be considered as investment advice in respect of, any transaction that implicates such sanctions or that involves persons within the jurisdiction of such sanctions, includingbut not limited to U.S., Canadian, Australian, Japanese, Swiss, European or EU investors. Sberbank CIB Investment Research analytical reviews are never to be used for unlawful activity, including activitythat is contrary to or that circumvents economic sanctions requirements. After having read this analytical review, investors should determine the legality of any planned transactions in consultation withtheir legal advisers in respect of their compliance with the legal requirements and trading rules applicable to their activities.
UNITED KINGDOM. For Professional and/or Eligible Counterparties (not to be used with or passed on to retail clients). The research and analysis included in this document has been produced andapproved for distribution in the United Kingdom by Sberbank CIB for its own investment management activities. Sberbank (CIB) UK Limited is registered in England and Wales under No. 4783112 at 85Fleet Street, London, EC4Y 1AE, United Kingdom and is authorised and regulated in the UK by the Financial Conduct Authority.
EUROPEAN UNION. Unless otherwise specified herein, this analytical review is intended for persons who are qualified as eligible counterparties or professional clients only and not for distribution toretail clients, as defined by the EU Markets in Financial Instruments Directive – 2004/39/EC. This document is distributed in the EU by Sberbank (CIB) UK Limited and is authorised and regulated in theUK by the Financial Conduct Authority.
For investors outside of the EU and Switzerland this analytical review is disseminated to either eligible or professional investors as regulated in the respective jurisdiction. If this analytical review isobtained by a person who is not considered to be an eligible or professional investor under applicable local laws in the respective jurisdiction, this person should not review it, should disregard and/orimmediately delete it and undertake their best effort to inform Sberbank CIB about having received this analytical review by mistake.
FOR RESIDENTS OF THE UNITED STATES. Under Rule 15a�6 under the Securities Exchange Act of 1934, this research report is available solely for distribution from JSC Sberbank CIB, to major U.S.institutional investors, and is not subject to all of the independence and disclosure standards applicable to debt research reports prepared for retail investors. All major U.S. institutional investors orpersons outside the United States that have received this analytical review shall neither distribute the original nor a copy hereof to any other person in the United States. This analytical review has beenprepared and reviewed by research analysts who are neither employed by Sberbank CIB USA, Inc., nor registered or qualified as research analysts with FINRA, and are not subject to the rules of FINRA.Sberbank CIB USA, Inc. accepts responsibility for the contents hereof.
This analytical review, however, may also be redistributed in the United States by Sberbank CIB USA, Inc., a U.S. registered broker and dealer and a member of FINRA, to both major and non majorinstitutional investors under FINRA Rules for the redistribution of research. All transactions in any security or financial instrument mentioned herein with or for any U.S. institutional investor or major U.S.institutional investor must be effected through Sberbank CIB USA, Inc. Please contact a registered representative of Sberbank CIB USA, Inc., by phone at 212.300.9600 or by mail at Carnegie HallTower 152 W 57th Street 46th Floor New York, NY 10019.
© SBERBANK CIB 2018 This document is being provided by [email protected] for the exclusive use of [email protected]