CONTENTS page Address by Head of Physics Department 2 fileProf. Madya Dr Wan Muhamad Saridan Wan...
59
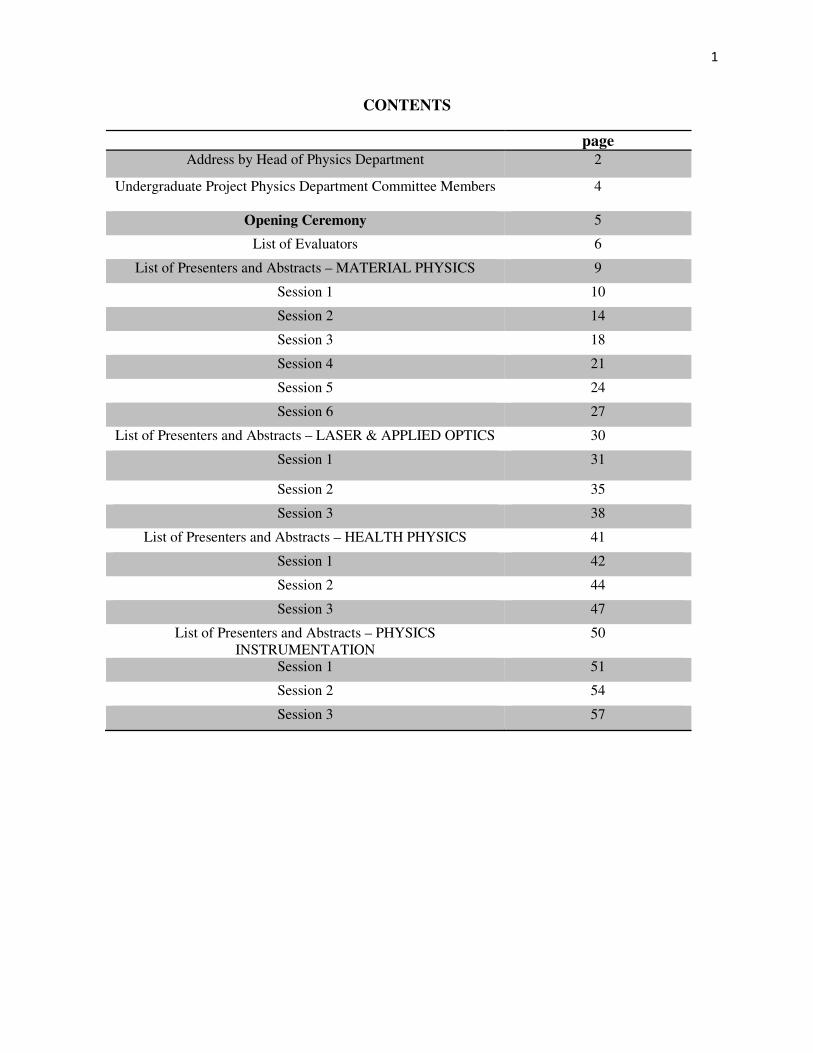
1 CONTENTS page Address by Head of Physics Department 2 Undergraduate Project Physics Department Committee Members 4 Opening Ceremony 5 List of Evaluators 6 List of Presenters and Abstracts – MATERIAL PHYSICS 9 Session 1 10 Session 2 14 Session 3 18 Session 4 21 Session 5 24 Session 6 27 List of Presenters and Abstracts – LASER & APPLIED OPTICS 30 Session 1 31 Session 2 35 Session 3 38 List of Presenters and Abstracts – HEALTH PHYSICS 41 Session 1 42 Session 2 44 Session 3 47 List of Presenters and Abstracts – PHYSICS INSTRUMENTATION 50 Session 1 51 Session 2 54 Session 3 57
Transcript of CONTENTS page Address by Head of Physics Department 2 fileProf. Madya Dr Wan Muhamad Saridan Wan...
1
CONTENTS
page
Address by Head of Physics Department 2
Undergraduate Project Physics Department Committee Members
4
Opening Ceremony 5
List of Evaluators 6
List of Presenters and Abstracts – MATERIAL PHYSICS 9
Session 1 10
Session 2 14
Session 3 18
Session 4 21
Session 5 24
Session 6 27
List of Presenters and Abstracts – LASER & APPLIED OPTICS 30
Session 1 31
Session 2 35
Session 3 38
List of Presenters and Abstracts – HEALTH PHYSICS 41
Session 1 42
Session 2 44
Session 3 47
List of Presenters and Abstracts – PHYSICS
INSTRUMENTATION
50
Session 1 51
Session 2 54
Session 3 57

2
FOREWORD BY HEAD OF DEPARTMENT OF PHYSICS
Assalamua'laikum warahmatullahi wabarakatuh and greetings..
Welcome to the Undergraduate Project Symposium 2015.
Firstly, I would like to express my heartiest congratulations to the final-year students
of the Physics Department whom have successfully completed their Undergraduate projects. To
the academic staffs who gave their full dedication in assisting, supervising and
guiding the students, I would like to congratulate them for their endless efforts. I would also like
to thank all the supporting staffs for their technical assistances provided to the students during
the execution of their respective projects.
Within approximately one year of doing these projects, I am sure a lot of experiences and
knowledge have been gained by the students. These projects should train the students to stand
on their feet, find the right information as well as assert them to be positive and
proactive. All these skills can be integrated and applied in their respective future careers.
Finally, I would like to congratulate and thank the Committee of Undergraduate Project,
Department of Physics who have worked hard to ensure the success of this Symposium.
Wassalam.
SELAMAT BERSIMPOSIUM!
Prof. Madya Dr Wan Muhamad Saridan Wan Hassan
Ketua Jabatan Fizik, Fakulti Sains,
Universiti Teknologi Malaysia.

3
FOREWORD BY CHAIRPERSON UNDERGRADUATE PROJECT
PHYSICS DEPARTMENT
Assalamu'alaikum w.b.t and greetings,
In the name of Allah, the Beneficent, the Merciful. God willing, the committee of the
Undergraduate Project, Department of Physics, Faculty of Science, is able to plan and conduct
the relevant activities until its peak, which is the Undergraduate Project Symposium. I
congratulate all the members of the committee for their full cooperation and commitment to
ensure the success of this program.
To all the Final-year students of Physics Department, we thank you for your efforts and smart
works that have been shown throughout these projects. Hopefully, the patience, perseverance and
experiences in order to overcome all these problems will foster a strong sense of identity to
prepare for a more challenging career environment later.
Congratulations and well done also to the dedicated supervisors who never tired of scouting and
guiding and caring for the students in order to be able to complete their projects successfully.
Not forgetting the supporting staffs who have made a significant technical assistance and
guidance needed by students in the course of their projects.
Finally, wishing everyone, have a pleasant day!
Thank you,
Mr. Muhammad Zaki Yaacob

4
Undergraduate Project Physics Department Committee Members
Chairperson : Mr. Muhammad Zaki Yaacob
Secretary : Mdm. Masleeyati Yusop
Dr. Wan Nurulhuda Wan Shamsuri (Assistant)
Mdm Fadzilah Lasim (Assistant)
Members : Material Physics
- Dr. Rosnita Muhammad
- Dr. Ezza Syuhada Sazali
- Mr. Nor Azman Abu Bakar
: Intrumentation Physics
- Mr. Abdul Rashid Abdul Rahman
- Mdm. Siti Sarah Safaei
- Mdm. Azlina Amir
: Health Physics
- Dr. Izyan Hazwani Hashim
- Dr. Koh Meng Hock
- Mdm. Sarah Sulaiman
: Laser & Applied Optic Physics
- Dr. Nor Ain Husein
- Dr. Nabilah Kasim
- Mdm. Tan Sew Chu
Technical:
- Mr. Zaki Selan
- Mr. Bakhtiar Mat Sari
5
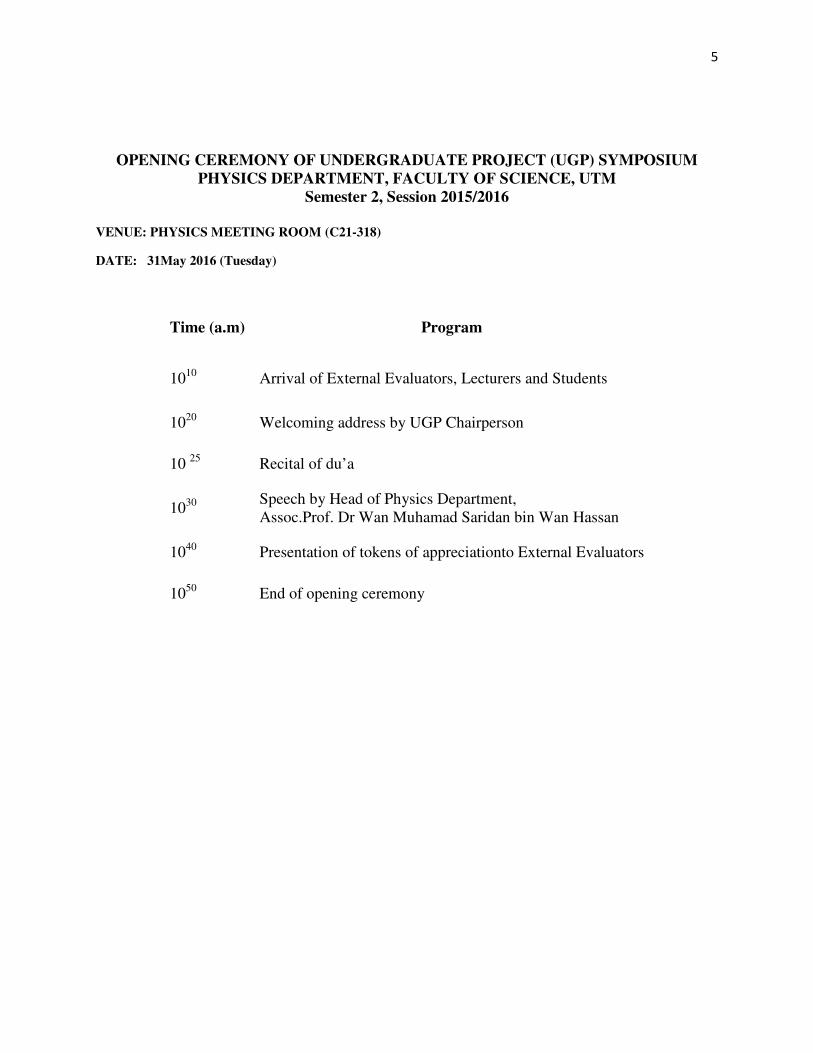
OPENING CEREMONY OF UNDERGRADUATE PROJECT (UGP) SYMPOSIUM
PHYSICS DEPARTMENT, FACULTY OF SCIENCE, UTM
Semester 2, Session 2015/2016
VENUE: PHYSICS MEETING ROOM (C21-318)
DATE: 31May 2016 (Tuesday)
Time (a.m)
Program
1010
Arrival of External Evaluators, Lecturers and Students
1020
Welcoming address by UGP Chairperson
10 25
Recital of du’a
1030
Speech by Head of Physics Department,
Assoc.Prof. Dr Wan Muhamad Saridan bin Wan Hassan
1040
Presentation of tokens of appreciationto External Evaluators
1050
End of opening ceremony
6
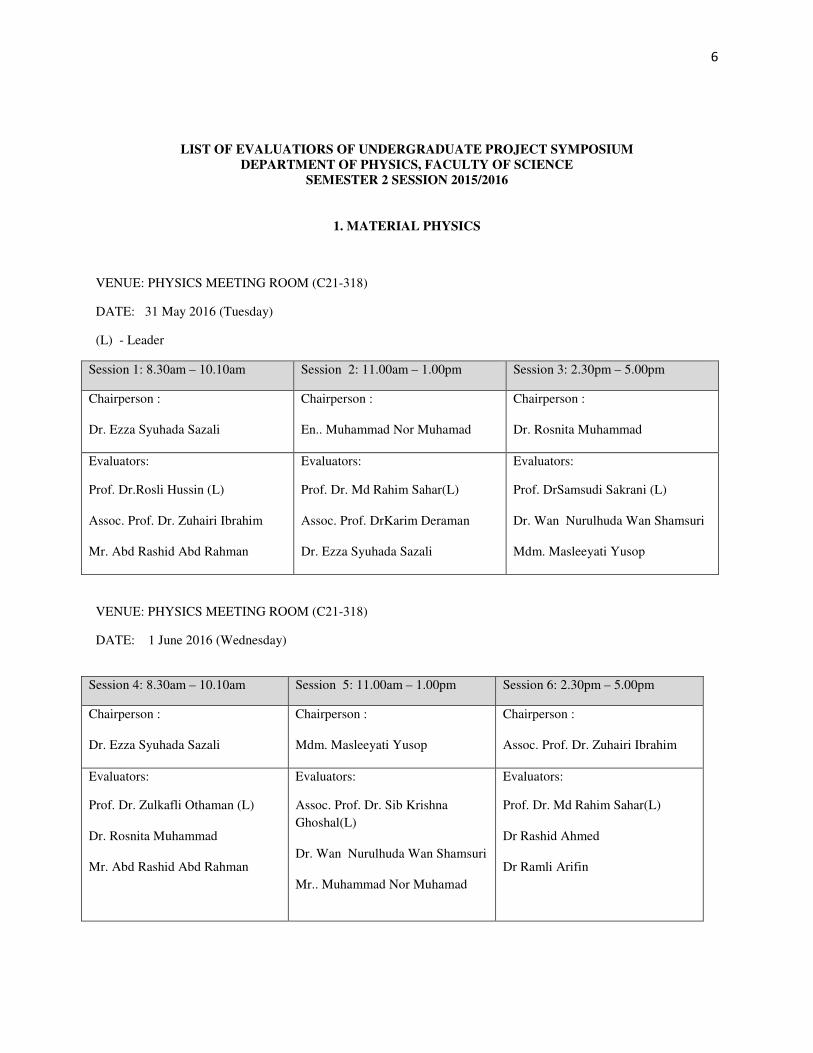
LIST OF EVALUATIORS OF UNDERGRADUATE PROJECT SYMPOSIUM
DEPARTMENT OF PHYSICS, FACULTY OF SCIENCE
SEMESTER 2 SESSION 2015/2016
1. MATERIAL PHYSICS
VENUE: PHYSICS MEETING ROOM (C21-318)
DATE: 31 May 2016 (Tuesday)
(L) - Leader
Session 1: 8.30am – 10.10am Session 2: 11.00am – 1.00pm Session 3: 2.30pm – 5.00pm
Chairperson :
Dr. Ezza Syuhada Sazali
Chairperson :
En.. Muhammad Nor Muhamad
Chairperson :
Dr. Rosnita Muhammad
Evaluators:
Prof. Dr.Rosli Hussin (L)
Assoc. Prof. Dr. Zuhairi Ibrahim
Mr. Abd Rashid Abd Rahman
Evaluators:
Prof. Dr. Md Rahim Sahar(L)
Assoc. Prof. DrKarim Deraman
Dr. Ezza Syuhada Sazali
Evaluators:
Prof. DrSamsudi Sakrani (L)
Dr. Wan Nurulhuda Wan Shamsuri
Mdm. Masleeyati Yusop
VENUE: PHYSICS MEETING ROOM (C21-318)
DATE: 1 June 2016 (Wednesday)
Session 4: 8.30am – 10.10am Session 5: 11.00am – 1.00pm Session 6: 2.30pm – 5.00pm
Chairperson :
Dr. Ezza Syuhada Sazali
Chairperson :
Mdm. Masleeyati Yusop
Chairperson :
Assoc. Prof. Dr. Zuhairi Ibrahim
Evaluators:
Prof. Dr. Zulkafli Othaman (L)
Dr. Rosnita Muhammad
Mr. Abd Rashid Abd Rahman
Evaluators:
Assoc. Prof. Dr. Sib Krishna
Ghoshal(L)
Dr. Wan Nurulhuda Wan Shamsuri
Mr.. Muhammad Nor Muhamad
Evaluators:
Prof. Dr. Md Rahim Sahar(L)
Dr Rashid Ahmed
Dr Ramli Arifin

7
2. LASER & APPLIED OPTICS
VENUE: PHYSICS INSTRUMENTATION TEACHING LABORATORY 3 (C20-307)
DATE: 31May 2016 (Tuesday)
(L) - Leader
Session 1: 8.30am – 10.30am Session 2: 11.00am – 1.00pm Session 3: 2.30pm – 5.00pm
Chairperson :
Dr. Nor Ain Husein
Chairperson :
Dr Nabilah Kasim
Chairperson :
Dr. Suzairi Daud
Evaluators:
Dr. Raja Kamarulzaman(L)
Dr..Muhammad. Arif Jalil
Dr. Mahdi Bahadoran
Evaluators:
Prof.Dr. Noriah Bidin (L)
Dr. Muhammad Safwan
Dr. Kashif Tufail
Evaluators:
P.M Dr. Yusof Munajat (L)
Dr. Nor Ain Husein
Dr Nabilah Kasim
3. HEALTH PHYSICS
VENUE: PHYSICS INSTRUMENTATION TEACHING LABORATORY 1(C20- 302)
DATE: 31May2016 (Tuesday)
(L) - Leader
Session 1: 9.00a.m – 10.00a.m Session 2: 11.00a.m – 12.20p.m Session 3: 2.30p.m – 3.50p.m
Chairperson :
Dr Nor Ezzaty Ahmad
Chairperson :
Dr Izyan Hazwani Hashim
Chairperson :
Dr Koh Meng Hock
Evaluators:
Dr Izyan Hazwani Hashim(L)
Dr Muhammad Alam Saeed
Evaluators:
Dr Koh Meng Hock (L)
Dr Nor Ezzaty Ahmad
Evaluators:
PM Dr Wan M Saridan (L)
Dr Muhammad Alam Saeed
8
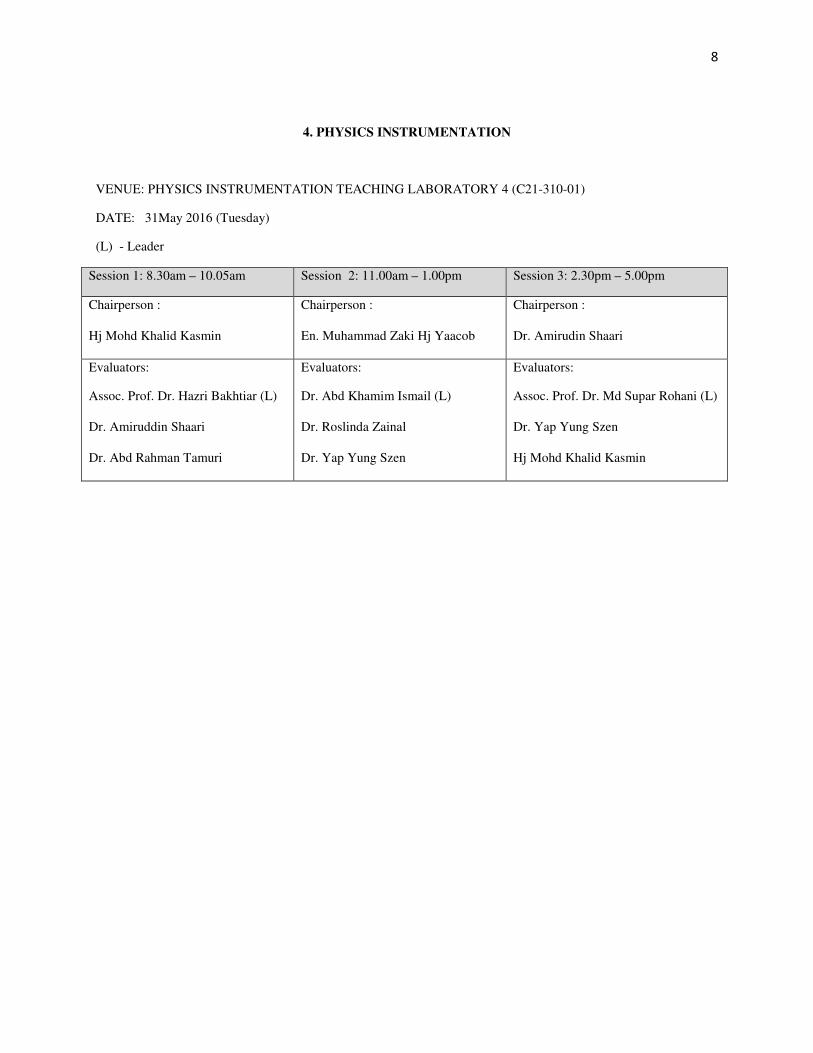
4. PHYSICS INSTRUMENTATION
VENUE: PHYSICS INSTRUMENTATION TEACHING LABORATORY 4 (C21-310-01)
DATE: 31May 2016 (Tuesday)
(L) - Leader
Session 1: 8.30am – 10.05am Session 2: 11.00am – 1.00pm Session 3: 2.30pm – 5.00pm
Chairperson :
Hj Mohd Khalid Kasmin
Chairperson :
En. Muhammad Zaki Hj Yaacob
Chairperson :
Dr. Amirudin Shaari
Evaluators:
Assoc. Prof. Dr. Hazri Bakhtiar (L)
Dr. Amiruddin Shaari
Dr. Abd Rahman Tamuri
Evaluators:
Dr. Abd Khamim Ismail (L)
Dr. Roslinda Zainal
Dr. Yap Yung Szen
Evaluators:
Assoc. Prof. Dr. Md Supar Rohani (L)
Dr. Yap Yung Szen
Hj Mohd Khalid Kasmin

9
1. MATERIAL PHYSICS
(LIST OF PRESENTERS AND ABSTRACTS)
10
VENUE :Physics Meeting Room (C21-318)
DATE :31May2016 (Tuesday)
Chairperson session 1 : Dr. Ezza Syuhada Sazali
Time : 08:30 am– 10:10am
1. The Optical Absorption of Samarium Doped Magnesium Zinc Lithium Tellurite Glass
Maizatul Akmal Binti Rani & Prof. Dr. Md Rahim Sahar
2. Thermal Conductivity and Thermal Stability of Tellurite Glass
Norashidah Binti Mohd Hanafiah & Prof. Dr. Md Rahim Sahar
3. Physical and Infra-Red Spectroscopy of Samarium Doped Lithium-Magnesium-Zinc-Tellurite Glass
Nurajira Binti Roslan & Prof. Dr. Md Rahim Sahar
4. Zinc Oxide Films Prepared by Modified Sol Gel Technique
Nur E'zzati Nabilah Syaqilah Binti Abdul Hamid & Prof. Dr. Samsudi Sakrani
5. Structure and Optical Properties of Zinc Oxide Nanowires Prepared Using Hydrothermal Method
Nurul Alina Afifi Binti Norizan & Prof Dr. Samsudi Sakrani
ABSTRACTS
THE OPTICAL ABSORPTION OF SAMARIUM DOPED MAGNESIUM ZINC LITHIUM
TELLURITE GLASS
Maizatul Akmal Binti Rani and Prof. Dr. Md Rahim Sahar
A series of glass based on (71-x)TeO2-20ZnO-8MgO-xLi2O- 1Sm2O3 with 0 20 (mol %) has
successfully been prepared using melt quench technique. The amorphousity of the glass
sample has been characterized by using the X-ray Diffraction (XRD). It is clearly seen that,
there is no sharp peak that confirm the amouphous nature of the glass. The optical absorption
has been determined using UV-Vis Spectroscopy in the range of 300 – 800nm. The energy
band gap, Eg is found to be in the range of (2.03 – 2.85) eV whereas the Urbach Energy is found
to be around (0.27 0.87) eV. Meanwhile, the refractive index is range from 2.44 2.73. It is
discussed that as the Li2 content increased, the band gap energy decreases, the Urbach energy
is increases and the refractive index increases.
11
THERMAL CONDUCTIVITY AND THERMAL STABILITY OF TELLURITE GLASS
Norashidah binti Mohd Hanafiah and Prof. Dr. Md. Rahim Sahar A series of glass based on (0.71-x)TeO2 - (x)Li2O - (0.2)ZnO - (0.08)Mg - (0.01) Sm2O3 where x =
0, 0.05, 0.10, 0.15, 0.20 mol% is prepared by melt quenching technique. An X-ray diffraction
method (XRD) method is used to characterize the structure of the glass. It is observed that all
glasses are amorphous in nature. The thermal conductivity, κ and thermal convection, his
determined by Lee Disc’s method. It is observed that the thermal conductivity achieve its
maximum value at 5 mol % Li2O and slightly decrease with the increase of Li2O content (0-20
mol %). It is also found that the convection coefficient, h is the same for all the composition.
The thermal stability of tellurite glass is investigated by differential thermal analysis (DTA). All
thermal parameters including glass transition temperature, Tg, crystallization temperature, Tc
and melting temperature, Tm are obtained. Thermal stability, S and glass forming tendency, Hr
are also determined. It is observed that the thermal stability and forming tendency increases as
the Li2O content increase. This indicates that the tellurite glass is a promising candidate for
glass fabrication and has potential applications for optical devices.
PHYSICAL AND INFRA-RED SPECTROSCOPY OF SAMARIUM DOPED LITHIUM-MAGNESIUM-ZINC-TELLURITE GLASS
Nurajira Bt Roslan and Prof. Dr. Md. Rahim Sahar
Glasses with composition of (71-x)TeO2-20ZnO-8MgO-xLi2O-1Sm2O3 where 0≤x≤20 mol% are
prepared using the melt quenching technique. X-ray diffraction (XRD) method is used to
confirm the amorphous nature while the physical parameters in terms of density (ρ) and molar
volume () are measured and calculated. The Fourier Transform Infrared (FTIR) spectroscopy
is manipulated to observe the structural modification of TeO4 trigonal bipyramidal (tbp) unit
and the variation of the absorption due to O-H stretching vibration as the Li2O concentration is
increased. The absence of sharp peak in the XRD pattern indicates that the glass is
amorphous. Meanwhile, it is observed that both density and molar volume decrease as the Li2O
concentration is increased. From the FTIR spectra, it is found that TeO4 tbp unit is located at
683-706 cm-1 while TeO3+1 polyhedral and/or TeO3ctrigonal pyramidal (tp) unit is located at
770-775 cm-1. However, the TeO4 tbp peak is found to be shifted to a higher wavenumber as
the concentration of Li2O is increased. Besides, the spectrum also indicates an increase in
relative absorption area of O-H stretching for up to 10 mol% of Li2O. The relative area
decreases as the content of Li2O is increased.

12
ZINC OXIDE FILMS PREPARED BY MODIFIED SOL GEL TECHNIQUE
Nur E’zzati Nabilah Syaqilah Bt Abdul Hamid and Prof. Dr. Samsudi Sakrani
Zinc Oxide (ZnO) is a wide band gap semiconducting oxide with many potential applications
due to its excellent properties. In this study, thin films with composition of zinc acetate
diydrate, n-propyl alcohol and diethanolamine (DEA) were prepared using modified sol gel dip
coating technique. ZnO thin filmswere deposited on glass substrate with four different
thicknesses of 2 layers, 4 layers, 6 layers and 8 layers at fixed temperature of 450 °C for 1
hour.The influences of different thickness of ZnO thin films in terms of structural and optical
properties were characterized using Field Emission Scanning Electron Microscope (FESEM),
Atomic Force Microscopy (AFM), X-ray Diffraction (XRD), Photoluminescence Spectroscopy (PL)
and UV-Vis Spectrometer. It is observed that FESEM result exhibited spherically shapes that
are closely packed together among particles. The AFM results displays grain size of ZnO thin
films with the range from 55.27 - 109.30 nm. Meanwhile,XRD analyses assigned (002) peak
becomes more dominant peaks, indicates the ZnO thin films prefer to grow along c-axis
orientation and formation of good crystallinity. Two peaks were observed in PL spectra which
appear in visible region at400 - 500 nm. UV-Vis spectrareveal the transmittance between 420 –
800 nm is found to decrease with the increases in the thickness. Energy band gaps
wereobtained from the extrapolation graph with the range from 3.19 - 3.22 eV.The result were
found to be comparable with those obtain by other researchers.
STRUCTURAL AND OPTICAL PROPERTIES OF ZINC OXIDE NANOWIRES PREPARED USING HYDROTHERMAL METHOD
Nurul Alina Afifi Binti Norizan nnd Prof. Dr. Samsudi Sakrani
Hexagonal zinc oxide (ZnO) nanowires were synthesized on glass substrate using a
hydrothermal method with different thicknesses and concentrations of zinc oxide (ZnO)
precursor solution at a fixed temperature of 70 °C. The pre-seeded layer was produced by sol-
gel dip coating method with zinc acetate dihydrate in ethanol and diethanolamine (DEA).
Different concentrations of zinc acetate dihydrate, 0.3 M, 0.5 M and 0.6 M were prepared.
Thicknesses of ZnO films were altered by dipping the glass substrates for 5 times and 8 times
in each sol concentration. The structural properties were characterized using X-ray diffraction
(XRD) and field emission scanning electron microscopic (FE-SEM). XRD spectra revealed that
the ZnO nanowires are polycrystalline with wurtzite structures that are formed randomly on
the glass substrates. FE-SEM images showed that ZnO nanowires have hexagonal unit cell
and the average diameter and average length of 27.39 nm and 773.76 nm respectively. The

13
optical properties of ZnO nanowires were determined using photoluminescence (PL) and UV-Vis
spectra. The PL revealed fairly strong UV emission at 300 nm and relatively weak visible
emission (between 412 – 480 nm) which implied that the ZnO nanowires have good optical
properties with less impurities and structural defects. The UV-Vis spectra have transmittance
of 10 % to 30 % and the energy band gaps were found to be in the range of 2.97 eV to 3.22 eV.
The results were found to be comparable with those obtained by other researchers.

14
Chairperson session 2 : Mr. Muhammad Nor Muhamad
T ime : 11:00am – 1:00pm
1. The Structure and Luminescence Properties of Copper Sulfophosphate Glass Doped with Europium
Naemah Binti Omar & Prof. Dr. Rosli Hussin
2. The Structure and Luminscence Properties of Zinc Sodium Sulfophosphate Glasses Doped With Er2O3
Marsyuhada Binti Mamat @ Mohamad & Prof. Dr. Rosli Hussin
3. The Structure and Luminescence Properties of Zinc Magnesium Sulfophosphate Glasses Doped with
Samarium (III) Oxide
Shahirah Binti Deraman & Prof. Dr. Rosli Hussin
4. Preparation and Characterization of Cobalt-Substituted Manganese Ferrite Nanoparticle
Nurulhuda Binti Azman&Prof. Dr. Zulkafli Bin Othaman
5. Effect of Mg-Al Substitution on the Structural and Morphological Properties of Co Ferrites
Wan Muhammad Izuddin Bin Wan Nawi & Prof. Dr. Zulkafli Othaman
ABSTRACTS
THE STRUCTURE AND LUMINESCENCE PROPERTIES OF COPPER SULFOPHOSPHATE GLASS DOPED WITH EUROPIUM
Naemah Bt Omar and Prof. Dr. Rosli Hussin
Structural investigation of (70-x-y) P2O5-xCuSO4-30Li2O-yEu2O3 glass systems with 5 ≤ x ≤ 30
mol% and 0 ≤ y ≤ 0.8 mol% have been prepared by melt quenching technique. The sample were
characterized by Fourier Transform Infrared spectroscopy (FTIR) and Photoluminescence
spectroscopy (PL). The structural and luminescence properties of the prepared Eu2O3doped
copper sulfophosphate glasses were studied and compared with reported results. FTIR spectra
revealed the vibrational modes in the prepared glass. Increase in the concentration of Eu2O3
resulted in gradual depolymerization of the phosphate chains and EuPO4 crystalline phase was
form. The infrared spectrum of these glass sample showed the deformation mode of P-O bond,
stretching vibrations of bridging oxygens, asymmetric stretching modes of P-O-P linkages, PO2
symmetric stretching modes and the stretching mode of P=O double bonds in the branching
group. The luminescence properties of the glass sample were measured based on the analysis
of emission spectra. Luminescence spectra of these glasses at the excitation wavelength of 396
nm shows transitions of 5D1 to 7F1 (519 nm), 5D1 to 7F2 (540 nm), 5D1 to 7F3 (548 nm), 5D0 to 7F4
(562 nm) and 5D0 to 7F5 (649 nm).
15
THE STRUCTURE AND LUMINSCENCE PROPERTIES OF ZINC SODIUM SULFOPHOSPHATE GLASSES DOPED WITH Er2O3
Marsyuhada Bt Mamat @ Mohamad and Prof. Dr. Rosli Hussin
A study of luminescence and glass structure had been done to a glass system. Erbium-doped
zinc sodium sulfophosphate glasses with composition (55-x)P2O5-10Na2SO4-35ZnO-xEr2O3 are
prepared (x = 0, 0.5, 1.0, 1.5, 2.0 mol%) using melt quenching technique. The structural was
measured using Ultraviolet Visible Spectroscopy and Fourier transformed infrared (FTIR)
spectroscopy and the Photoluminescence (PL) Spectroscopy was used to measure the
luminescence properties. The colour of the glass changed from light yellow to deep pink due to
the introduction of Er3+ ions. The UV-Vis absorption spectra exhibits six prominent peak
centered at 380, 490, 520,650, 800 and 982 nm ascribed to the transition in erbium ion from
ground state to the excited states 4G11/2, 4F7/2, 2H11/2, 4F9/2, 4I9/2 and 4I11/2 respectively. The
mode vibrations observed in this glass system are asymmetry stretching (PO2) at 1260cm-1,
symmetric stretching mode (P-O-P) at 892cm-1, asymmetric stretching mode (P-O-P) at 747cm-1
and deformation modes of PO43- at 535cm-1. The luminescence properties of the doped sample
were measured based on analysis of emission spectra. Result showed that the emission band of
Er3+ are 606nm and 634nm due to the transition of 4S3/2→ 4I15/2 and 4F9/2 →4I15/2.
THE STRUCTURE AND LUMINESCENCE PROPERTIES OF ZINC MAGNESIUM SULFOPHOSPHATE GLASSES DOPED WITH SAMARIUM (III) OXIDE
Shahirah Binti Deraman and Prof. Dr. Rosli Hussin
A series of Zinc magnesium sulfophosphate glasses doped with Samarium (III) oxide with
composition (60-x) P2O5 -30MgSO4-10ZnO-xSm2O3 are prepared (x = 0, 0.5, 1.0, 1.5, 2.0 mole
%) using melt quenching technique. P2O5 -MgSO4-ZnO-Sm3+ glasses optically active with rare
earth ion with 4f electronic configuration of Sm3+.The structure of these materials has been
studied by ultraviolet –visible spectroscopy meanwhile the structural information via vibration
modes was provided by Fourier Transform Infrared spectroscopy. The luminescence were also
observed by photoluminescence spectroscopy. The result shows absorption spectra consist five
absorption peak at 320, 400, 480, 820, and 950nm corresponding to the transition from the
ground state 6H5/2 to various excited energy level. The modes of vibration from infrared
spectroscopy in this sulfophosphte glass system have two dominant absorption bands in the
frequency range of 550-760 cm-1. The absorption spectra were obtained at around 554cm-1 can
be ascribed to deformation modes of PO43-and 753cm-1 was referred to asymmetric stretching
16
mode of P-O- P linkages. The luminescence properties of the doped sample were measured
based on analysis of emission spectra. Result showed that the emission band of Sm3+ are 555
and 579 nm due to the transition of 4G5/2 → 6H5/2 and 4G5/2 → 4H7/2respectively.
PREPARATION AND CHARACTERIZATION OF COBALT-SUBSTITUTED MANGANESE FERRITE NANOPARTICLE
Nurulhuda Binti Azman and Prof. Dr. Zulkafli Bin Othaman
Ferrites is a ceramic ferromagnetic materials that have been considered as highly important
electronic materials for more than half a century. Recent studies showed it contribution and
application in electronics, automobile and computer are limitless and keep growing as the day
passing by due to their extraordinary properties of electrical, magnetic and optical. The effect
of different synthesize temperature on the structure and morphology properties of Cobalt
substituted Manganese Ferrites was investigated in this study. Cobalt substituted Manganese
Ferrites with composition of Co1-x Mnx Fe2-x Alx O4 where x are (0.0, 0.4, 0.8) were prepared
using co-precipitation method at three different synthesize temperature 600ºC, 750ºC and
900ºC. X-ray diffraction (XRD) technique is used to confirm the identification crystalline
structures of samples. The Fourier Transform Infrared (FTIR) spectroscopy is manipulated to
observe the functional groups structural. The nanocrystalline structure and grain distribution
were recognized by Field Emission Scanning Electron Microscope (FESEM). The crystallite size
of 19-26 nm is procured using Scherer’s Formula and as the synthesize temperature increase,
the size of the particle also experience the increment. The fragment showed a supreme amount
which is 26 nm for the sample synthesize at 900ºC. FT-IR studies indicate that the spinal
phase formation which are tetrahedral and octahedral takes place at higher synthesize
temperature. The homogenous grain distribution of cubic shape with gain in size as accretion
in synthesize temperature were revealed by FE-SEM.

17
EFFECT OF Mg-Al SUBSTITUTION ON THE STRUCTURAL AND MORPHOLOGICAL PROPERTIES OF Co FERRITES
Wan Muhammad Izuddin B. Wan Nawi and Prof. Dr. Zulkafli Othaman
Ferrite magnetic materials have wide applications in various technological fields. They are used
in applications such as electronic, automobile, computers and in new emerging fields due to
their remarkable electrical, magnetic and optical and other properties. The structural, magnetic
and electrical properties of ferrites are depending on several factors such as the method of
preparation, stoichiometry, substitution of cations and annealing temperature. In this study,
the effect of Magnesium-Aluminium substitution on the structural and morphological
properties of Cobalt ferrites in different temperature was investigated. Magnesium-Aluminium
substitute in Cobalt ferrites with the general formula Co1-xMgxFe2-xAlxO4 (x = 0.0, 0.4 and 0.8)
were prepared by co-precipitation method and the samples were annealed at temperature of
600°C, 750°C and 900°C. The formation of nano-particles with different composition,
microstructure and sizes were confirmed by X-ray diffraction (XRD), FT-IR and FESEM. The
XRD acquired shows pure phase of Magnesium-Aluminium substitute in Cobalt ferrites. The
crystallite size of 14 – 25 nm is obtained using Scherer’s formula and the crystallinity of the
samples increases with increasing annealing temperature. The lattice parameter showed a
minimum value for the sample heated at 900 ºC. It has been observed that the grain size
increases as annealed temperature increases and it is maximum (25nm) for the powder
annealed at 900°C. FT-IR studies indicate that the spinel phase formation takes place at higher
annealing temperature. The absorption bands shifted to lower values for the annealed samples.
Grain size distribution for the samples is investigated by FE-SEM which displayed
homogeneous grains of cubic shape with increased in grain size along with the increasing of
annealing temperature.

18
Chairperson session 3 : Dr. Rosnita Muhammad
Time : 2.30pm – 5.00pm
1. Surface Morphology and Photoluminiscence Properties of Zinc Oxide Thin Films Prepared By Dip Coating
Method with Different Number of Layer of Coating
Hasinah Binti Alias & Assoc. Prof. Dr Karim Deraman
2. Effect of Withdrawal Speed on Structural, Photoluminescene and Optical Properties of Zinc Oxide Thin
Film by Dip Coating Method
Khairulanwar Bin Abu Shah & Prof Madya Dr Karim Deraman
3. Optical Properties and Surface Morphology of Zinc Oxide Thin Films Synthesized by Sol Gel Dip Coating
Method with Different Annealing of Temperature
Muhammad Akmal Bin Mohd Minhat & Prof Madya Dr Karim Deraman
4. Physical and Optical Properties of Neodymium Doped Tellurite Glass
Loh Chun Seng & Assoc. Prof. Dr. Sib Krishna Ghoshal
ABSTRACTS
SURFACE MORPHOLOGY AND PHOTOLUMINISCENCE PROPERTIES OF ZINC OXIDE THIN FILMS PREPARED BY DIP COATING METHOD WITH DIFFERENT NUMBER OF LAYER OF
COATING
Hasinah binti Alias andAssoc. Prof. Dr. Karim Deraman
In this research, zinc oxide, ZnO thin films with different thickness were prepared by sol-gel
dip coating method on glass substrates. The precursor solution used were zinc acetate
dehydrate (Zn(CH3COO)2.2H2O) and 2-propanol (C3H8O). Diethanolamine (DEA) was used as a
stabilizer to produce a clear solution that was aging for 24 hours. Dip coating was repeated
several times to produce different thickness of films from 1 to 9 layers at constant withdrawal
speed, 0.9cm/min. After each successive coating, the films were preheated at 170oC for 15
minutes. Then the films were annealed at 500oC for 1 hour to get a better surface structure.
The surface morphology and photoluminescence properties of these films were studied by using
atomic force microscopic (AFM) and photoluminescence (PL). The thickness of films was in the
range of 150 nm to 370 nm, measured by using ellipsometer. While the refractive index of films
were in the range of 2.3 to 2.7. With the increase of film thickness, the surface roughness and
grain sizes were increased from 2.44 to 51.02 nm and 71.32 to 430 nm respectively.
Photoluminiscence spectra showed that the peak emission were varies in the wavelength of
383.75 to 388.22 nm.
19
EFFECT OF WITHDRAWAL SPEED ON STRUCTURAL, PHOTOLUMINESCENE AND OPTICAL PROPERTIES OF ZINC OXIDE THIN FILM BY DIP COATING METHOD
Khairulanwar Bin Abu Shah and Assoc. Prof. Dr. Karim Deraman
Zinc oxide (ZnO) thin films were prepared by using sol-gel technique. To prepare zinc solution,
zinc acetate dehydrated was used as starting material and dissolve in 2- propanol.
Diethanolamine was used in this solution as a stabilizer. Then the solution was stirred at 60oC
for one hour and keep at room temperature for one night. The ZnO thin films were deposited on
glass substrate by using dip coating method. Various withdrawal speed is used in the
deposition of ZnO thin films from the range of 40 mm/s – 90 mm/s for five layers each speed.
After each layer of coating the films were preheated at 200o C for 15 minutes.The deposited
films were annealed at 550oC for one hour to remove impurities and to form oxide layers. The
effects of withdrawal speed on ZnO thin films on morphology and optical properties has been
investigated using atomic force microscopy (AFM), photoluminescence spectroscopy and UV-Vis
spectroscopy. The grain size of the thin film increases with an increasing withdrawal speed.
The average grain size of ZnO thin films for four different speed is increasing from 120nm to
135nm. All the thin films shows optical transmittance in the visible region about 60 ~80%. The
photoluminescence spectra shows that the peak emission of all films were varies in the
wavelength of 378.92nm to 383.32nm.
OPTICAL PROPERTIES AND SURFACE MORPHOLOGY OF ZINC OXIDE THIN FILMS SYNTHESIZED BY SOL GEL DIP COATING METHOD WITH DIFFERENT ANNEALING OF
TEMPERATURE
Muhammad Akmal bin Mohd Minhat and Assoc. Prof. Dr. Karim Deraman
The Zinc Oxide thin films with different annealing temperature from 3000c to 5000c are
prepared by using sol gel dip coating method .The sol gel solution is prepared by using
chemical mixtures which is diethanolamine (DEA) ,ethanol ,and zinc acetate .Five samples of
zinc oxide thin film with different temperatures were achieved to determine their surface
morphology and optical properties .The surface morphology of the samples are investigated by
Atomic Force Microscopy (AFM ). The roughness of ZnO thin films samples with different
temperature samples were obtained in the range 3.15 nm to 7.30 nm . The optical properties
of ZnO thin films were analysis by using Photoluminescence Spectroscopy (PL) and UV-VIS
Spectroscopy .Meanwhile ,the emission behaviour is detected by photoluminescence
spectroscopy .The emission spectra shows the strong peak in the UV range at 330nm and
20
relatively with peak at 380nm . The emission of spectra was dominated at 375 nm and the
peak intensity of the luminescence were found increased at temperature 3000c until 4000c then
,at temperature 4500c decrease to 500 0c . The energy bandgap of the ZnO was determined
using UV-VIS Spectrometer and it was found that the energy band gap of the ZnO is between
3.20 eV and 3.24 eV. The results were found to be comparable with those obtained by other
journals.
PHYSICAL AND OPTICAL PROPERTIES OF NEODYMIUM DOPED TELLURITE GLASS
Loh Chun Seng and Assoc.Prof. Dr. Sib Krishna Ghoshal Tellurite glass has emerged to be a vital photonics material due to its high refractive index,
wide transmission range, low phonon energy and good corrosion resistance. Its optical
property is enhanced by doping rare earths (RE) while neodymium (Nd) has been frequently
doped for lasing purpose attributed to its sharp emissions and good solubility. However, self-
quenching due to Nd3+-Nd3+ interaction oppresses the lasing efficiency. In fact, the physical
and optical properties of glass doped with relatively higher RE concentration (2–4 mol %) are
yet far from being understood. In this study, a series of (70-x)TeO2–30ZnO–xNd2O3 (x=0.0,
2.0, 2.4, 2.8, 3.2, 3.6, 4.0) glasses is synthesised using melt-quenching technique. XRD
analysis confirms the amorphous nature of the samples. UV-Vis spectroscopy reveals 9
absorption peaks in the visible range at where 584 nm is dominating. The UV absorption edge
is further analyzed to calculate band gap energy, Urbach energy, refractive index and
polarizability. Conversions of TeO3 and TeO3+1 to TeO4 units are deduced from the increasing
indirect band gap energy and decreasing refractive index with RE addition. The increasing
polarizability may be contributed by the lower field intensity of Nd ions than that of Te.
Photoluminescence spectroscopy exhibits 4 peaks of visible light correspond to the transitions
to the 4I9/2 ground state from 2D5/2 (422 nm), 2P1/2 (443 nm), 2G9/2 (485 nm) and 4G7/2 (543
nm). From most of the peaks, optimum luminescence intensity is determined to be at 2.80 mol
% Nd2O3 concentration. Self-quenching happens at the onward concentration until a recovery
is demonstrated at 4.00 mol%. FTIR spectroscopy confirms the existences of bridging oxygen
(BO) and non-bridging oxygen (NBO) in the glasses. Glass transition (Tg), crystallization (Tx)
and melting temperature (Tm) are affirmed to be in the range of 350-366 °C, 420-434 °C and
878-881 °C respectively using DTA.
21
VENUE :Physics Meeting Room (C21-318)
DATE :1June 2016 (Wednesday)
Chairperson session 4 : Dr. Ezza Syuhada Sazali
Time : 08:30am – 10:10am
1. Influence of Erbium Ions Concentration on Structural and Optical Properties of Zinc Tellurite Glass
Sylviana Jones & Assoc Prof Dr. Sib Krishna Ghoshal
2. Absorption and Emission Features of Europium Doped Zinc Tellurite Glass
Nur Hafawati Binti Abdullah & Assoc Prof Dr. Sib Krishna Ghoshal
3. The Effect of Pelletizing Time on Hap Ceramics
Mohammad Dzarul Hafiz Bin Dol Malek & Assoc Prof. Dr. Zuhairi Ibrahim
4. The Structural and Optical Properties of GaAsThin Film for Solar Cell Application
Nor Hidayah Binti Md Amin & Dr. Wan Nurulhuda Wan Shamsuri
ABSTRACTS
INFLUENCE OF ERBIUM IONS CONCENTRATION ON STRUCTURAL AND OPTICAL PROPERTIES OF ZINC TELLURITE GLASS
Sylviana Jones and Assoc Prof. Dr. Sib Krishna Ghoshal
Rare earth ions doped tellurite glass have been a great deal of interest for diverse industrial
applications. -doped zinc tellurite glasses with molar composition of 70
20 10 where 0.00 0.25 % are prepared by melt quenching
technique. The structural and optical properties of synthesized glasses are investigated and
characterized using X-Ray Diffraction (XRD), Differential Thermal Analysis (DTA), Fourier
Transformation Infrared (FTIR), UV-Vis-NIR and Photoluminescence spectroscopy. Density and
molar volume have been measured and lies within the range of 5.229 to 5.453 "#$ and
25.9768to 27.0949 #$', respectively. The non-crystalline nature of synthesized samples are
shown in the XRD pattern. Thermal stability of samples are overall increases (127.9-137.0 ()
due to increasing concentration obtained from DTA results. UV-Vis-NIR spectra was
observed at room temperature in the wavelength range of 400-1000 nm displays five absorption
bands. The indirect transition of optical band gap (3.02-3.22 eV), Urbach energy (0.13-0.26 eV)
and refractive index (2.3404-2.3917) are calculated and revealed to be firmly erbium
concentration dependent. Photoluminescence spectra are evaluated at the excitation of 380 nm
at room temperature in the wavelength range of 520-650 nm showed emission peaks of

22
4)*/,transition Results are analysed, explained and compared which developed a good
understanding of influence of erbium concentration on zinc tellurite glass.
ABSORPTION AND EMISSION FEATURES OF EUROPIUM DOPED ZINC TELLURITE GLASS
Nur Hafawati Bt Abdullah and Assoc. Prof. Dr. Sib Krishna Ghoshal
Series of europium (Eu3+) doped zinc tellurite glasses of composition (75-
x)TeO225ZnOxEu2O3 with (0.0≤x≤ 2.0 mol%) are prepared via melt quenching method.
Synthesized glasses are characterized using X-Ray Diffraction (XRD), Differential Thermal
Analyzer (DTA), Fourier Transform Infrared (FTIR) Spectroscopy, UV-Vis-NIR, and
Photoluminescence (PL) spectroscopy. The XRD pattern confirmed the amorphous nature of
samples. The density is found to be increase in the range of 5.3466 to 5.4610 g/cm3. The molar
volume increase from 26.1944 to 26.3797 cm3/mol-1 but decreases to 26.3500 cm3/mol-1. The
refractive index (2.3651 to 2.3895), the molar refraction (15.8459 to 16.0970 cm3mol-1) and
polarizability (6.2818 -10-24 to 6.3814 -10-24 cm3) are found to be increase. All glasses posses
good thermal stability where ∆T > 100 °C.The glass forming tendency, Hruby parameter
increase from 0.28 to 0.35. FTIR spectral analysis explore the presence of linkage bond of Te-
O-Te, O-H, H-O-H and TeO3tp at range 4000 – 400 cm-1. UV-VIS-NIR spectra displayed four
absorption bands centered at 462, 533, 580 and 635 nm corresponding to the transition from
the ground to the excited states 7F0.5D2, 7F0. 5D1, 7F0.5D0, 7F1.5D0 respectively. Direct and
indirect band gap energy are found decreasing where the values are 3.426 to 3.336 eV and
3.122 to 3.028 eV respectively. Urbach energy is increasing from 0.404 to 0.850 eV. Emission
spectra under the excitation of 393 nm showed emissions peaks due to the transition for
5D2.7F0, 5D2.7F1, 5D1.7F0, 5D1.7F1, 5D1.7F2, 5D0.7F1, 5D0.7F2, 5D0.7F3, 5D0.7F4 were found to
be around 468nm, 483nm, 509nm, 535nm, 554nm, 586nm, 613nm, 650nm and 698nm
respectively. Results are analyzed, explained, and compared.

23
THE EFFECT OF PELLETIZING TIME ON HAp CERAMICS
Mohammad Dzarul Hafiz Bin Dol Malek and Assoc. Prof. Dr Zuhairi Ibrahim
Calcium Phosphate ceramics, Ca10(PO4)6(OH)2 or Hydroxyapatite, HAp in powder were prepared
using the dry pressing method at difference palletizing time at 2 minutes, 4 minutes, 6
minutes, 8 minutes and 10 minutes to produce a round shape ceramic at different times. HAp
ceramics had been sintered for an hour in temperature of 800oC. The strength of HAp
ceramics was evaluated and had been tested by measuring its Young’s Modulus, density,
number of Vickers’ Pyramid or hardness and porosity. The results showed an increase in
Young’s Modulus (1226-1282)MPa, density (2.36-2.41) gcm-3 and Vickers’ Pyramid number
(10.2-13.5)Hv whilst decreased on porosity (8.13-3.35)% with increasing palletizing time. As
such, the palletizing time plays an important role in strengthening the HAp ceramics.
THE STRUCTURAL AND OPTICAL PROPERTIES OF GaAs THIN FILM FOR SOLAR CELL APPLICATION
Nor Hidayah Binti Md Amin and Dr Wan NurulhudaBinti Wan Shamsuri
The purpose of this research is to investigate the structural and optical properties of gallium
arsenide thin films which is prepared using RF magnetron sputtering. The samples have been
deposited on the glass substrates using a high purity GaAs target at 2.7 x 10⁻²Torr and power
of 50 W at different time of deposition. The different time of samples deposition is between 2,
4, 6 , 8 and 10 minutes. Five samples of undopedgallium arsenide thin filmswere achieved to
determine their structure and optical properties. The optical properties of the samples
wereinvestigated using UV-Vis Spectrophotometer 3101-PC. The absorption and transmittance
were obtained in the range of 200 nm to 1000 nm. From the absorption investigations, the
optical band gap(Eg) were determined to be in the range 1.63 eV to 1.70 eV (direct energy band
gap). The transmittance has more than 50% in the wavelength range of 250 nm to 500 nm.
Meanwhile, the structural of GaAs thin film was studied using Atomic Force Microscopy(AFM)
where the highest value of surface roughness was 7.86 nm.

24
Chairperson session 5 : Mdm Masleeyati Yusop
Time : 11:00am – 1:00pm
1. Effects of Lithium Chloride on Phosphate Oxychloride Glass
Dayang Nur'irma Farahain & Dr Ramli Arifin
2. Structure and Electrical Properties of Yttria-Stabilized Zirconia Thin Film Grown Using Radio Frequency
Magnetron Sputtering
Syarifah Aloyah Binti Syed Husin & Dr. Rosnita Muhammad
3. Computational Study of Barium Titanate, BaTiO3 Properties
Mohd Afzol Bin Ramle & Dr. Rashid Ahmed
4. Fabrication and Characterization of Zinc Antimony Sulfide (ZAS) Thin Films
Nor Afifah Nashuha Binti Azmi & Dr Rashid Ahmed
ABSTRACTS
EFFECTS OF LITHIUM CHLORIDE ON PHOSPHATE OXYCHLORIDE GLASS
Dayang Nur' Irma Farahain and Dr. Ramli Ariffin
Phosphate glasses in a system of magnesium lithium phosphate were synthesised. The glass
samples in a nominal composition of (80-x) P2O5–10MgO–10Li2O–xLiCl where x = 0, 5, 10, 15,
20 mol % were prepared by means of the conventional melt-quenching technique. The effect of
lithium chloride content on the structural properties of glass samples in the system of P2O5–
MgO–Li2O–LiCl has been established using the Fourier Transform Infrared (FTIR) spectra.
Whilst physical properties; density and molar volume of the glass samples have also been
measured as supportive data for the study. Results obtained from this study indicated that
increasing of glass/network modifier LiCl content (mol fraction) in the phosphate glasses
increase the density progressively at the same time decreasing the molar volume. The observed
changes in the FTIR spectra of the glass samples were associated to the role of phosphate
oxide, P2O5 as glass/network former. Both variation of frequencies and intensity of the infrared
bands have been actualised all the compositions for phosphate group frequencies’
characteristic which includes P=O-P stretching modes, P-O-P stretching and bending modes
and P-O bending mode and etc. Furthermore, the intensity and wavenumbers of the infrared
bands around 1635 cm-1 and 3450 cm-1, associated to P-O-H bond or water. The changes
observed in these infrared bands validated the role of water as an additional glass modifier. The
local structure, analysed by the FTIR absorption spectroscopy can be concluded to be almost
myopic to the content of lithium.

25
STRUCTURE AND ELECTRICAL PROPERTIES OF YTTRIA-STABILIZED ZIRCONIA THIN FILM GROWN USING RADIO FREQUENCY MAGNETRON SPUTTERING
Syarifah Aloyah Binti Syed Husin and Dr. Rosnita Binti Muhammad
Solid oxide fuel cells (SOFC) is an efficient device for converting chemical energy into
electrical energy. Yttria Stabilised Zirchonia (YSZ) material is one of the most important
materials as electrolyte in SOFC applications. In this study, YSZ thin film has been prepared
using Radio Frequency Magnetron Sputtering. Glass substrate was used as a substrate for the
YSZ thin film deposition. Samples were prepared by two different growth parameters which are
deposition time and RF power. The samples was then annealed at 400oC for one hour. The YSZ
thin film were characterized using FESEM, EDX, AFM and XRD. The electrical properties of
YSZ material were characterized using CAFM. From the structural measurement, FESEM
images shown that the thickness of thin film increased with the growth time from 15 to 60
minutes. AFM morphology shows that with the annealing at 400oC, grain size of the YSZ
materials decreased with the increasing of growth time with the increasing of density. The
measured grain size was 267, 172 and 101 nm for the growth time of 15, 30 and 60 minutes
respectively. The XRD results shows that some of the significant peak of YSZ obtained such as
[111] and [002] at 2θ at 30o and 36o. YSZ thin film composition was determined using the EDX.
The conductivity of YSZ thin film shows that the effect of electron tunneling occurs between
CAFM tip and YSZ thin film with a graph in the form of forward bias at the positive voltage
supply.
COMPUTATIONAL STUDY OF BARIUM TITANATE, BaTiO2PROPERTIES
Mohamad Afizol Bin Ramle and Dr. Rashid Ahmed
The study of Barium Titanate, BaTiO2structure commonly investigate by experimental but in
this research, the computational study applied. Investigation on the electronic structure of
Barium Titanate (BT), band structure and density of state (DOS) of paraelectric BT in the cubic
phase using the full potential-linearized augmented plane wave (FP-LAPW) method in WIEN2k
package software.WIEN2k package calculation based on the density functional theory. The
electronic band structure were calculated and simulate based on this theory. This study
discussed on the simulate and modelling the electronic structure of BT. Determine the
thermoelectric and ferroelectric properties of BT. One fundamental model of the BT with the
changing of the electronic structure was created. The changing of the electronic structure were
based on the adjusted cubic unit cell of BT. The band structure, total density of states (DOS),

26
and electronic density in paraelectric cubic crystal BT determined based on the generalized
gradient approximation (GGA) from the graph plotted by the FP-LAPW analysis on the WIEN2k
package. The calculation were done within the density functional theory with GGA for solving
the Kohn-Sham equation. The band gap were calculated by using this GGA approximation is
below than experimental result. Full potentials-linearized augmented plane wave (FP-LAPW)
method used the improved approach to calculate the precious result.
FABRICATION AND CHARACTERIZATION OF ZINC ANTIMONY SULFIDE (ZAS) THIN FILMS
Nor Afifah Nashuha Binti Azmi and Dr. Rashid Ahmed
Zinc antimony sulfide thin films were prepared on glass substrate by using thermal
vaporization technique. Zinc antimony sulfide thin films is a ternary compound, has wide gap
and direct transition semiconductor. Zinc powder and antimony sulfide powder have been
deposited on a substrate by using the molybdenum as a boat. The thin films were annealed in
argon gas at various substrate temperature range of 150 – 300˚C. The characterization of the
thin films properties of four samples were performed by means of UV-Visible Spectroscopy.
Optical properties of the thin films were characterized by measuring absorbance and
transmittance in the range of wavelength 200 – 1000 nm by subtracting the glass substrate as
a reference. The films were found to exhibit high transmittance (25 - 50%). The absorbance of
the thin films was found to be high in the ultra violet region with peak around 310 nm. The
band gap was found to be high also. It was observed that the energy gap increase with the
increase in the annealing temperature. The films were also characterized by investigating
optical microscopy. Atomic-force microscopy or AFM is a scanning probe microscopy to
measure the topography and other surface properties. It was observed that the surface
roughness of the thin films were different from each other. The value of root mean square for
roughness was found to be high around 4 nm – 9 nm.
27
Chairperson session 6 : Assoc. Prof. Dr. Zuhairi Ibrahim
Time : 2.30pm – 5.00pm
1. Effect of Alumina Particle Size on Hardness and Physical Properties of Alumina Copper Composite
Nurul Najwa Binti Ahmad Jusoh & Mdm. Masleeyati Yusop
2. Effect of Plastic Deformation on Curie Temperature of Gadolinium Using Pc Interfaced Resistivity System
Masilah Binti Tumeran & Mr. Abd Rashid Abd Rahman
3. Determination of Surface Roughness and Topography of Different Types of Salts Using AFM Analysis
Muhammad Naqib Bin Mohd Rashdi &En. Muhammad Nor Muhamad
4. Structural and Optical Properties of Dysprosium Doped Tellurite Glass
Rezki Sabrina Binti Masse & Assoc Prof Dr Sib Krishna Ghoshal
ABSTRACTS
EFFECT OF ALUMINA PARTICLE SIZE ON HARDNESS AND PHYSICAL PROPERTIES OF ALUMINA COPPER COMPOSITE
Nurul Najwa Bt Ahmad Jusoh and Mdm. Masleeyati Bt Yusop
Ceramic matrix composite (CMC) is a composite that has excellent physical and mechanical
properties as well as its unique ability. In this study Al2O3-10 wt. % Cu composite with
different alumina particle size (50µm, 100µm, and 125µ) were investigated on its properties.
This composite were successfully produced by dry pressing method with constant pressure at
199MPa. All the three samples were sintered at constant temperature of 1200°C for 2 hours.
Physical properties and hardness of these samples were observed as the particle sizes of
alumina were varied. The hardness of the composite was measured by the Vickers test whereas
the density and the porosity of composite were measured by using analytical balance. The
result shows the density of composite increased from 2.489gcm-3 to 2.783gcm-3 with the
increased of alumina particle size. As the particle size increased, the porosity of ceramic metal
composite decreased from 67.09% to 56.10%. This is due to the void space between the
particles are not compacted together and it leads to an increase of total porosity. Other than
that, the bond between composite particles also increases when the smaller alumina particles
were sintered. Besides, hardness of the ceramic matrix composite also decreased as the
increase of particle size which are from 52.4 HV to 42.77 HV. It shows that particle size of
alumina had significant effects to the mechanical and physical properties of Al2O3-Cu
composite.
28
EFFECT OF PLASTIC DEFORMATION ON CURIE TEMPERATURE OF GADOLINIUM USING PC INTERFACED RESISTIVITY SYSTEM
Masilah Binti Tumeran andMr. Abd Rashid Abd Rahman
A study had been conducted on a Gadolinium (Gd), to see the effect of plastic deformation on
its curie temperature using PC interfaced resistivity system – the transition between its
ferromagnetic and paramagnetic phases. The dimension of the sample used was 1.8mm wide
by 25mm long and 0.28mm thick. The sample was subjected to plastic deformation upon it by
bending process. A set of rollers were designed and built for the purpose of bending the strip
back and forth in order to introduce plastic deformation by a controlled amount. The amount
of plastic deformation was determined by the Young’s Modulus of the sample measured by the
bending method. Observation from the change in the slope of its resistivity curve as a function
of temperature gives the information of the transition between the paramagnetic and
ferromagnetic stage of the sample. The resistivity was determined by using four point probe
technique. In order to hold the sample during the resistivity measurement, a contact type
Copper-Beryllium point was design and built. Cryostat was developed by using a stainless
steel flask. While maintaining electrical and thermal insulation, the temperature was able to
maintain by placing the sample on a copper block with a massive thermal mass. Coolants used
were liquid Nitrogen and ice, and a pair of 1 W carbon resistors was used which has been fixed
at the bottom of the copper block to raise the temperature. The interfacing concept was applied
to get the accurate and faster result than before.
DETERMINATION OF SURFACE ROUGHNESS AND TOPOGRAPHY OF DIFFERENT TYPES OF SALTS USING AFM ANALYSIS
Muhammad Naqib Bin Mohd Rashdi andMr. Mohammad Noor Muhamad
The aim of this study is to determine surface roughness and topography of different types of
salts. Salt that been used in the study are mountain salt and common. The mountain salt is
separated into two different type of salt. First sample of each salt was polished using sand
paper that attach to rotary platform with adjustable revolution per minute. After finish
polishing, the samples were rinse with water to remove the unwanted remaining and wipe dry
then stored inside container with silica gel. Second sample of each salt was polished using
sand paper using hand. The sample were brushed with brush to remove the remaining then
stored inside container with silica gel. Topography of each sample was examined by SPA300HV
Atomic Force Microscope. Sample’s surface has been scanned in non-contact mode with
OMCL-AC200TS-C3 tip. Measured topography data were processed by Gwyddion V2.45

29
software. Average roughness and maximum peak-to-valley distance were compared among the
same type of salt. First sample of mountain salts have lower average roughness compare to
second sample while opposite result in common salt. Average maximum peak-to-valley distance
also have similar pattern between first and second sample. Method to polish the salt and
finishing touch do influence the average values of roughness and maximum peak-to-valley
distance.
STRUCTURAL AND OPTICAL PROPERTIES OF DYSPROSIUM DOPED TELLURITE GLASS
Rezki Sabrina Bt Masse and Assoc Prof. Dr. Sib Krishna Goshal
Series of dysprosium (Dy3+) doped zinc tellurite glasses of molar composition (75–x) TeO2-
25ZnO-xDy2O3 where 0.0x1.0 mol% are prepared using melt quenching technique. For
these synthesized glasses Differential Thermal Analysis (DTA), X-Ray Diffraction (XRD), Fourier
Transform Infrared (FTIR), UV-Vis-NIR, and Photoluminescence (PL) spectroscopy were carried
out. The thermal parameters are characterized using DTA. The influence varying
concentrations of Dy3+ on the physical and optical features of the samples is determined. The
XRD pattern confirmed the amorphous nature of the glass while the structural properties of
Dy3+ have been studied through FTIR spectra. The calculated glass density is increased from
5.352 to 5.479 gcm-3 attributes to addition of Dy3+ ions. The molar volume (2.803 to 2.738 cm3)
is found to decrease due to the formation of the number of non-bridging oxygen (NBO). UV-VIS
absorption spectra revealed six peaks and subsequently used to determine the energy band
gap and Urbach energy. The refractive index (2.425-2.581), the molar refraction (21.603-
23.299 cm3) and polarizability (8.564×10⁻²⁴ to 9.236×10⁻²⁴ cm3) are obtained due to alteration
of dysprosium contents. The luminescence spectra exhibit three emission peaks at 459, 483
and 573nm corresponding to 4I15/2 → 6H15/2 (violet), 4F9/2 → 6H15/2 (blue) and 4F9/2 → 6H13/2
(yellow) transitions respectively. Results corresponding to the compositional changes were
analyzed, explained and compared with previous studies. Careful characterization for physical
and optical properties are capable to provide useful ideas for the development of dysprosium
doped zinc tellurite glass based devices.
30
2. LASER & APPLIED OPTICS
(LIST OF PRESENTERS AND ABSTRACTS)
31
VENUE :Physics Instrumentation Teaching Laboratory 3 (C20-307)
DATE :31May 2016 (Tuesday)
Chairperson session 1 :
Time : 08:30 am– 10:30am
1. The Effect of Transverse Magnetic Field on Growth of Carbon Nanotubes by Arc Discharge Technique
Nurul Shahirah Binti Mohamad & Prof.Dr.Jalil Bin Ali
2. Laser Cleaning
Nursyahida Binti Jamalludin & Prof. Dr. Noriah Binti Bidin
3. Electrical Conductivity of Honey
Faten Nurhanani binti Abdul Razak & Dr.Ganesan A/L Krishnan
4. Characteristics Performance of Erbium Doped Fiber Laser
Siti Fatihah Binti Selamat & Prof Madya Dr Yusuf Munajat
5. LIBS for Elemental Composition Determination In Potato Skin From Different Variance
Low Jia Hooi & Prof Madya Dr. Yusof Bin Munajat
ABSTRACTS
THE EFFECT OF TRANSVERSE MAGNETIC FIELD ON GROWTH OF CARBON NANOTUBES BY ARC DISCHARGE TECHNIQUE
Nurul Shahirah Binti Mohamad and Prof.Dr.Jalil Bin Ali
Unique properties of carbon nanotubes (CNTs) make them potential material for
differenttechnological applications in field of engineering, medicine, material science and
electronics.In present study, the effect of external transverse magnetic fields on growth of
carbon nanotubes by arc discharge technique is investigated. Carbon nanotubes are grown in
presence of external magnetic fields0mT, 5mT, 10mT, 15mT, 20mT and 25mT.The arc
discharge is produced between two graphite in hydrogen environment at low pressure 10 mbar
with applied DC voltage 12 V and arc current 70 A. The samples of CNTs synthesized at
different magnetic fields are characterized using field emission scanning electron microscopy
(FESEM) and X-ray diffraction (XRD).FESEM analysis reveals that the diameter of CNTs
increases from 10 nm to 25 nm with increase in strength of applied magnetic fields. Besides
that, XRD analysis of CNTs prepared under different magnetic fields show peak shift of (002)
plan towards lower angle to 25.09°. By comparison with the sharp reflection peak (002) of
graphite at 26.66°, it indicatespresence of CNTs structure with large quantity and smaller
diameter.FESEM and XRD analyses of synthesized CNTs showthat the increase in the external
transverse magnetic fields significantly increases the growth of CNTs and also increases the
size of diameter.

32
LASER CLEANING
Nursyahida Binti Jamalludin and Prof. Dr. Noriah Binti Bidin
The projects aim was to develop a laser ablation clean system as the alternative way to clean
contaminated layer ratherthan using chemical substances. Nd:YAG solid state laser at
wavelength of 1064 nm was acted as gain medium of laser with Q-switch technique that
produced pulse laser. Chromium (Cr) was been chosen as the sample which being covered
with molding compound contained carbon (C) as main elements of the compound. Scanning
electron microscope with energy dispersive X-ray spectroscopy analysis (SEM/EDX) was used
to analyze the samples before and after laser cleaning. The results shows that the percentage
mass for carbon decreased after cleaning and the existence of oxide layer due to passivation.
Cleaning efficiency for all samples shows 140 kJ was the most efficient in cleaning with
efficiency at 89.5% whereas 80kJ shows the least effective with 82% only. Based on the results,
it shows that cleaning can be done by using laser which has advantage where laser cleaning
system is environmental friendly which do not produce any waste product.
ELECTRICAL CONDUCTIVITY OF HONEY
Faten Nurhanani binti Abdul Razak and Dr.Ganesan A/L Krishnan
Honey exhibits varying degrees of electrical conductivity due to variation in electrolyte
content.Manufacturers do not usually publish or measures the electrical conductivity of
honey.In this study, the electrical conductivity of different types of honey was determined via
Wenner method. The Wenner method system was developed and the four-electrode plates were
arranged with inner plate of 0.51cm apart.Direct current voltage was supplied to the outer
plates and a current was induced between inner plates. The induced current and potential
differences across inner plates were measured by ammeter and voltmeter respectively. The
system was verified by using a standard solution with conductivity of 1413µS/cm. The
conductivity of the solution measured by the system was 1413.75µS/cm with the percentage
error of 0.05%. The conductivity of sample Cis109.75µS/cmis the highest among three
samples. Sample A show the lowest electrical conductivity which is 1.403µS/cm, while the
conductivity of sample B is 40.91µS/cm.This indicates that the content of mineral substance in
sample C is higher than other samples.Sample C also has the darkest hue compared to other
samples while sample A has the lightest hue. Qualitatively, honey with darkest hue has higher
mineral content and therefore higher electrical conductivity.
33
CHARACTERISTICS PERFORMANCE OF ERBIUM DOPED FIBER LASER
Siti Fatihah Binti Selamat and Assoc.Prof. Dr. Yusuf Munajat
In area of research in telecommunication, signal with 1550 nm wavelength is the most
desirable wavelength for transmitting data because its attenuation and loss in glass fiber are
much lesser with wavelength at this region. Previous research has found that erbium doped
fiber produce output wavelength that is close to 1550 nm. In this work an erbium doped fiber
laser was studied to achieve the effect of output power in varying input current. A
semiconductor laser diode was used to pump 980nm to a ring configuration EDFL. Wavelength
division multiplex of 980/1550 nm was used to converge two different wavelengths from pump
source, 980 nm and output coupler, 1550 nm into one channel. A 50/50 split ratio output
coupler was used to split 1550 nm wavelength into two portions for measurement purpose and
to resonate light of the fiber laser. After light passes through the EDF, two peaks were
discovered due to lasing of 1550 nm wavelength and from laser diode 980 nm. Experimental
result shows with input power of 0.114 µW (from 70 mA input current) produced the threshold
output wavelength for EDFL which was 1562.4 nm. Input current was varied up until 450 mA
with its output power 1.507 µW. The results for output spectrum were filtered using Gaussian
Kernel Density filter to observe the changes in bandwidth (Full width at half maximum, FWHM)
for both wavelengths at 975.193 nm and 1562.41 nm. As increasing input current, the
bandwidth for 975.193 nm does not change and stays for 117.947 nm. For wavelength 1562.41
nm at threshold point, its bandwidth was 355.85 nm and increases as input current increases.
This is due to the gain medium of EDF where wavelength at approximately close to 1550nm
where lasing occurs.
LIBS FOR ELEMENTAL COMPOSITION DETERMINATION IN POTATO SKIN FROM DIFFERENT VARIANCE
Low Jia Hooi and Assoc.Prof. Dr. Yusof Bin Munajat
Potato is a cheap and enrich source of carbohydrate which require elemental
composition determination. In this research, laser-induced breakdown spectroscopy (LIBS)
technique was used for elemental analysis of potato skin. Four commercially available potatoes
originated from Malaysia, Thailand, Australia and United State were selected as samples. An
ungated LIBS system was constructed using Q-switch Nd:YAG pulsed laser as the excitation
source and an atomic emission detection system consist of optical fibre, spectrometer and
computer. The elements in potato skin detected in this work are sodium, magnesium,
34
aluminium, calcium, titanium, iron, hydrogen and carbon. The result of this research shows
that the elemental composition of the potatoes skins from different countries is the same.
However, the intensity of each peak of the elements in the potatoes skins from different
countries is different. Qualitative potato differentiation was done by analyzing the intensity
ratios of atomic emission lines. Six different ratio combinations among the monitored elements
were investigated and only the ratio of Ca II to Mg I present in each potato skin, can be taken
as a promising reference point to differentiate between the potatoes from Malaysia, Thailand,
Australia and United State.

35
Chairperson session 2 : Dr Nabilah Kasim
Time : 11:00 am– 1:00am
1. Non-thermal Plasma Technology In Wire Cleaning
Muhamad Naqiuddin Bin Razali & Dr. Raja Kamarulzaman Bin Raja Ibrahim
2. Performance of Non-thermal Plasma in Deposition of Thin Film onto Fibre Optic
Mohamad Eqbal Hamdy Bin Kamarun & Dr Raja Kamarulzaman Bin Raja Ibrahim
3. Comparison of Several Characteristics of Single Mode Step-Index (SMSI), Multimode Step-Index (MMSI),
and Multimode Graded-Index (MMGI) Fiber for Optical Communication System
Nur Amira Aqila Binti Zaini & Dr Muhammad Arif Bin Jalil
4 Dielectric Barrier Discharge Plasma Reactor Temperature Profiling Using Fiber Bragg Grating Sensors
Muhamad Khaidir Bin Mohd Zamri & Dr Nor Ain Husein
ABSTRACTS
NON-THERMAL PLASMA TECHNOLOGY IN WIRE CLEANING
Muhamad Naqiuddin Bin Razali and Dr. Raja Kamarulzaman Bin Raja Ibrahim
In this works,bare wires that contaminated with dust and has oxide layer has been successfully
cleaned using Non-Thermal Plasma method.The cleaning process was carried out under
different conditions; type of gases at varies of flow rate and voltage. Helium, nitrogen, and air
were used to generate plasma where plasma operated at flow rates in the range of 20 – 140
mL/min while voltage set up in the range of 1 – 7 kV.The performances of wires undergo
plasma cleaningwere examined by using Olympus SZX9 Stereozoom Microscope. It was found
that nitrogen plasma has the best cleaning performance at voltage of 2.05 kV and flow rate of
60 mL/min.

36
PERFORMANCE OF NON-THERMAL PLASMA IN DEPOSITION OF THIN FILM ONTO FIBRE OPTIC
Mohamad Eqbal Hamdy Bin Kamarun and Dr. Raja Kamarulzaman Bin Raja Ibrahim
The aim of the research is to achieve a uniform cylindrical coating by applying the non-thermal
plasma technique to achieve that consistent cylindrical coating with precise uniformity. A fibre
is exposed in the plasma reactor so the non-thermal plasma were performed to aid the coating
process onto the fibre and Tetraethyl Orthosilicate (TEOS) solution is used to obtain a gold
coating. It was found that the gold coating, which, when performed properly, has form a non-
thermal plasma that can act on the fibre in all direction, resulting a precise uniform coating.
Research limitation. However, the plasma performance differ by different variable. The best
choice of variable need to being investigate to achieve the best coating. The coating part are
subjected to thermal and electrical resistance, so this may affect the coating process. For future
work, we can try using other coating materials, stable yttria can be used as the best coating
material with optimum thermal resistance. This paper fulfils the identified information and
offers practical help to the industrial firms working with coatings and also to the academicians
working on wear of materials.
COMPARISON OF SEVERAL CHARACTERISTICS OF SINGLE MODE STEP-INDEX (SMSI), MULTIMODE STEP-INDEX (MMSI), AND MULTIMODE GRADED-INDEX (MMGI) FIBER FOR
OPTICAL COMMUNICATION SYSTEM
Nur Amira Aqila Binti Zaini and Dr. Muhammad Arif Bin Jalil Optical fiber is a medium that made by silica or plastic, and widely used in transmitting
information over longer distance especially in communication system. There are three types of
fiber optic used in this project which are single mode step-index (SMSI), multimode step-index
(MMSI), and multimode graded-index (MMGI) in optical communication system. There are three
objectives in this project in order to get the suitable optical fibers in the communication system.
First objectiveis to simulate the result by using Excel and Origin software. The data and the
formulaof fiber optics will be key in through Excel software while the graph will be analyzed by
using Origin software. The second objective is to compare the different types of fiber optics in
communication system by comparingthe several of their characteristics such as numerical
aperture (NA), acceptance angle (θa), solid acceptance angle (Ω) and propagation constant
(β).The performance of all types fiber optics are analyzed from the result using the standard
communication wavelength of 1550 nm. The core diameter for SMSI, MMSI, and MMGI are 9,
200 and 50 µmrespectively while the cladding diameter for SMSI and MMGI is 125 µm and 240
37
µm for MMSI. This diameter also been analyzed by using the standard value for optical
communication system. Then, the comparison between SMSI, MMSI and MMGI will be made to
choose the more suitable for optical communication system based on their characteristics.
From the results, MMSI and MMGI give best performance compared to SMSI. After that, the
third objectiveis to make the comparison between MMSI and MMGI in term of intermodal
dispersion to compare the efficiencies of fiber optics. MMGI give the better result in terms of
efficiencies for communication system compared to MMSI.
DIELECTRIC BARRIER DISCHARGE PLASMA REACTOR TEMPERATURE PROFILING USING FIBER BRAGG GRATING SENSORS
Muhamad Khaidir Bin Mohd Zamri and Dr.Nor Ain Husein
The purpose of this study is to investigate the sensing performance in monitoring temperature
of dielectric barrier discharge (DBD) plasma reactor operating at atmospheric pressure using
fiber Bragg grating (FBG). The FBG was made from germanium doped fiber were embedded
inside the DBD reactor to monitor the temperature inside the reactor. The FBG has single
grating series with the Bragg wavelength, λB of 1550 ± 0.2 nm, Grating’s length of 3 mm,
Bandwidth at 3 dB of less than 0.7 nm.Three types of plasma was generated using different
gasses; nitrogen (N2), Helium (He) and air in the reactor at gas flow rate in the range of 20 –
140 mL/min and applied voltage in the range of 1 – 8 kV.The FBG was recorded to have
a response time up to 0.2 seconds/°C. The sensitivity of the FBG temperature sensor used in
this study is estimated at 2.683 pm/°C.

38
Chairperson Session 3 : Dr. Suzairi Daud
Time : 2.30 pm– 5.00 pm
1. Diagnosis of Calcium Lines by Laser-Induced Plasma Spectroscopy
Nordini Najwa Zakaria & Dr. Muhammad Safwan Bin Abd. Aziz
2. Characterization of CarbonIon in Arc Discharge Plasma
Natasya Binti Zainal Abidin & Dr. Suzairi Bin Daud
3. Optimization of Optical Transfer Function of Microring Resonator Using Genetic Algorithm
Mohammad Farizuddin Bin Salebi & Dr Mahdi Bahadoran
4. Synthesis of Graphene by arc Discharge Technique
Farah Shahirah Binti Norazmi & Dr. Kashif Tufail Chaudhary
ABSTRACTS
DIAGNOSIS OF CALCIUM LINES BY LASER-INDUCED PLASMA SPECTROSCOPY
Nordini Najwa Zakaria and Dr. Muhammad Safwan Bin Abd. Aziz
Plasma is a rich source of radiations that carry information about the species inside plasma
which is directly associated with surface of the target sample. Its nature is dynamic and
complex that is not fully understood. Conditions inside LIP vary temporally and spatially. Core
of plasma is the hottest region while it gradually cools down along the radius. Cooler species
reside in the outer region of plasma that can absorb the radiations coming out from the inner
regions. This phenomenon is called as self-absorption which results in detection of lesser
radiations outside the plasma than originally emitted from inner regions of the plasma. It
causes erroneous measurements. The prominence of self-absorption varies with plasma
conditions which are strongly dependent upon experimental parameters. In this study, we have
explored the self-absorption in Ca I and Ca II emission lines as a function of laser energy. Self-
absorption is estimated through intensity ratio of emission lines. Laboratory prepared samples
with careful account of elemental concentrations were utilized in this study. Results have
shown the dominance of self-absorption when higher laser energies were used to ablate the
sample. Self-absorption effect is more strongly observed in resonant lines which, in general,
gradually decreased as laser energies were decreased.
39
CHARACTERIZATION OF CARBON ION IN ARC DISCHARGE PLASMA
Natasya Binti Zainal Abidin and Dr. Suzairi Bin Daud
The objective of this study is to determine the energy of carbon ion in different environment
and pressures. The purposes of determination the energy of carbon ion is to get better
knowledge regarding on the fabrication of different type of carbon nanostructures. Carbon
nanostructures become more useful due to their unique carbon elements. They can form ball-
shaped, fullerenes and cylindrical nanotubes. The energy of carbon ion can be obtained by
measuring the ion track sizes on the CR-39 target. Solid state nuclear track detector (SSNTD)
was used to track the charged nuclear particles, such as alpha particles or fission fragments.
In this study, arc discharge plasma generated by graphite electrode were chosen to produce
carbon nanostructures and the CR-39 were exposed to energetic carbon ion under different
environment and pressures. The energetic carbon ion was etched by 6.25 M of NaOH solution
for 8 hours. The temperature was maintained at (72±1)°C to ensure the etching process going
smoothly. The ion tracks was observed under optical microscope and the diameter of ion track
were measured. The energy was determined from the diameter obtained by using the related
formula. From the data taken and graph plotted, the diameter of carbon ion in air at 10-1 mbar
pressure is 18.29 µm and 15.07 µm for hydrogen. The energy of carbon ion is influenced by the
diameter ion track. Energy of carbon ion in air was higher than hydrogen. The energy of carbon
ion under 10-1 mbar pressure for air and hydrogen were measured to be 54858846.15 keV and
16641324.04keV respectively. The energy of carbon ion under 102 mbar pressure for air and
hydrogen were measured to be169931.7 keV and215228.3747 keV respectively. It is conclude
that, higher energy of carbon ion is measured at lower pressure.
OPTIMIZATION OF OPTICAL TRANSFER FUNCTION OF MICRORING RESONATOR USING GENETIC ALGORITHM
Mohammad Farizuddin Bin Salebi and Dr. Mahdi Bahadoran
In optical communication, a sharp carrier signal is required for the purpose of conveying
information. Microring resonators have been introduced as suitable tools to generate low cost
and a qualitative sharp carrier signals. In fabrication process of microring resonator, some
optical coefficients such as couplings coefficient and coupling loss are crucial and sensitive
factors to achieve high quality carrier signals. In this work, the Mason rule together with signal
flow graph method are used to calculate the optical transfer function (OTF) of some microring
40
resonating systems like add-drop resonator and flower shape layout. Genetic algorithms (GAs)
is known as an effective optimization method based on principles of natural selection and
genetics. The GA has been used in widespread scientific areas especially solving of quantum
mechanical problems, designing tools and engineering optimization problems. As an objective
of this work, the GA is used to optimise the OTF based on determining optical parameters
including coupling ring resonator and coupling loss coefficient. Our approach include finding
optimise parametric values to minimise full width at half maximum (FWHM) and maximise out
of band rejection ratio (OBRR). For the value of g1, g2, k1 and k2in the first generation the
FWHM and OBRR are 10nm and 5dB while using GA for optimizing minimum FWHM and
maximum OBRR within five generation in Table 4.4.The simulated result for add-drop
resonator by Matlab software show that increasing the generations contributes to achieve the
optimum critical values for coupling coefficients and losses.
SYNTHESIS OF GRAPHENE BY ARC DISCHARGE TECHNIQUE
Farah Shahirah Binti Norazmi and Dr. Kashif Tufail Chaudhary
Synthesis of carbon nanotubes (CNTs) and graphene by arc discharge technique are
conducted in controlled hydrogen environment. The arc discharge is carried out between two
graphite electrodesin hydrogen environment at ambient pressures 10-3mbar, 10-1mbar,
100mbar, 101mbar and 103mbar. Hydrogen is used as a buffer gas on the growth of CNTs and
graphene. The samples of CNTs and graphene are prepared in different conditions
andcharacterized using Field Emission Electron Microscopy (FESEM), X-Ray Diffraction (XRD)
and Raman Spectroscopy.FESEM images of CNTs and graphene gives a clear picture of the
tubes morphology with their bundle organization and naturally wavy fused nanosheets type
morphology. The results of XRD exhibits the structural properties of CNTs and graphene which
indicates the strongest (002) plane of diffraction peak corresponds to a d-spacing of 3.46Å and
implying the number of layers in nanostructures.Lastly, Raman Spectroscopy describes the
high intensity of G-line and G*-line which confirms the presence of CNTs and graphene in the
prepared samples. The highest growth of CNTs and graphene are observed at 101 mbar while
above that ambient pressures, the CNTs and graphene are less growth.

41
3. HEALTH PHYSICS
(ABSTRACTS)

42
VENUE :Physics Instrumentation Teaching Laboratory 1 (C20-302)
DATE :31May 2016 (Tuesday)
Chairperson session 1 : Dr Nor Ezzaty Ahmad
Time : 08:30 am– 9:30am
1. Radiological And Nuclear Emergency Plan Universiti Teknologi Malaysia
Siti Hajar Binti Suliman &Assoc. Prof. Dr. Suhairul Hashim
2. Radiation Dose Of Betatron X-Ray
Noraina Hanim Binti Jusoh &Assoc. Prof. Dr. Wan Muhamad Saridan Wan Hasan
3. Band-Head Energy Spectra Of Well-Deformed Odd-Mass Nuclei Within Quasi-Particle Approach
Siti Nor Afsan Binti Abdul Rahman & Dr. Koh Meng Hock
ABSTRACTS
RADIOLOGICAL AND NUCLEAR EMERGENCY PLAN UNIVERSITI TEKNOLOGI MALAYSIA
Siti Hajar Suliman and Assoc. Prof. Dr. Suhairul Hashim
Aspects of radiation safety is a priority when handling hazardous radioactive materials. In this
study, Universiti Teknologi Malaysia (UTM) as the holder of a license under the Atomic Energy
Licensing Act 1984 (Act 304) shall provide Radiological and Nuclear Emergency Plan (RNEP).
The objective of the plan is to ensure the preparedness programme during radiological
emergencies and provide protection to workers, students, the public, property and the
environment against the use of radioactive materials in UTM. In addition, this plan was
developed so that an appropriate and fast response can be taken to reduce the effects, reduce
the level of radiation hazards and the costs involved at a rate as low as possible. Based on the
regular audit inspection Atomic Energy Licensing Board (AELB), UTM should carry out the
disposal of radioactive material with the help of the Malaysian Nuclear Agency, after obtaining
the approval of the disposal from AELB to keep records of radioactive updated as well. Among
the material identified for disposal are two units of neutron source 238Pu-Be and 141 units of
sealed radioactive materials. Radiation hazard risk assessments have been carried out to
identify and quantify any potential hazards that affect the safety and health at UTM. The risk is
the probability multiplied by the seriousness that involves a scale of 0 to 3, where 3 is
indicating high. The hazards that have been assessed including the incidents caused by
natural disasters, technological, human and hazardous materials. In conclusion, this study
has helped on UTM license renewal of radioactive material after the AELB satisfied with the
disposal of radioactive materials
43
RADIATION DOSE OF BETATRON X-RAY
Noraina Hanim binti Jusoh and Assoc. Prof. Dr. Wan Muhamad Saridan Wan Hassan
Betatron is a type of particle accelerator and the particles accelerated are electrons. Since
betatron is able to produce high-energy electrons, it can also produce narrow beam of photon
and the radiation produced by the betatron is x-ray. This investigation aims to calculate the
radiation dose of the x-ray at certain points in the room when a betatron of 6 MeV was used.
The radiation dose was calculated by conducting a simulation using Monte Carlo N-Particle
Transport Code (MCNPX). This simulation is important as it provides an alternative in
calculating radiation dose of the radiation without needing to go on a fieldwork. In this
research, there were 6 points of interest chosen in determining the radiation dose in a room at
Billion Prima Sdn. Bhd. Three of the points were in the air with the standard density of
1.29x10⁻³ g/cm3 while the other 2 were the points on the concrete wall with a density of 2.35
g/cm3 and the last one was the cadmium tungstate (CdWO4) surface of the detector having the
density of 7.9 g/cm3. The room dimension was declared in the coding of the MCNPX where
basically, the shape of the room is a cuboid and made up of concrete wall. The radiation dose
outside of the room was not calculated as the concrete wall of room is assumed made of
appropriate thickness for safety features guided by As Low As Reasonably Achievable (ALARA)
principle. The radiation dose on each of the 6 points obtained from the simulation was different
as the distance of the points from the betatron are different. Other than that, the factor of
density of the material also causes the dose on those points varies.
BAND-HEAD ENERGY SPECTRA OF WELL-DEFORMED ODD-MASS NUCLEI WITHIN QUASI-PARTICLE APPROACH
Siti Nor Afsan binti Abdul Rahman and Dr. Koh Meng Hock
The energy spectra of odd-mass heavy nuclei namely 235U and 239Pu have been determined
using quasi-particle approach. Calculations were first performed for the neighboring even-even
core nuclei (234U, 236U, 238Pu and 240Pu) within the Hartree-Fock-plus-Bardeen-Cooper-
Schrieffer (HF+BCS) framework. The effective nucleon-nucleon interaction has been
approximated with a Skyrme interaction using the SIII and SkM* parameterizations while the
pairing interaction was approximated by a seniority force. Band-head energies of the odd-mass
nuclei were then computed from the even-even core solutions. It was found that the results
obtained from the quasi-particle approach yields results which are in less good agreement with
experimental data, as compared to those obtained from a proper self-consistent blocking
calculation taking into account the effect of time-reversal symmetry breaking.
44
Chairperson session 2 : Dr Izyan Hazwani Hashim
Time : 11.00 a.m– 12.20p.m
1. Performance Measurement Of The Helium-Ethane Gas Mixture In Prototype-Iv Chamber
Mohd Hanafi Bin Ghazali &Dr. Muhammad Alam Saeed
2. Suitability Analysis For The Site Of Nuclear Reactor In Terengganu
Nor Syazwani Binti Daud & Prof. Dr. Ahmad Termizi Ramli
3. Thermoluminescence Dosimetric Properties Of Thulium Doped Optical Fiber By Gamma Irradiations
Noorhalina Binti Ghazali &Dr. Muhammad Alam Saeed
4. Suitability Analysis For Nuclear Reactor Siting In Selangor, Negeri Sembilan And Melaka
Nurul Amira Binti Noorhisham & Prof. Dr. Ahmad Termizi Ramli
ABSTRACTS
PERFORMANCE MEASUREMENT OF THE HELIUM-ETHANE GAS MIXTURE IN PROTOTYPE-IV CHAMBER
Mohd Hanafi bin Ghazali and Dr. Mohammad Alam Saeed
Coherent Muon to Electron Transition (COMET) is an experiment that aims to search for a
Charged Lepton Flavour Violation (CLFV) process; muon-to-electron conversion in the presence
of nucleus. The process is forbidden in the Standard Model (SM). However, it is predicted to
occur in various extension of SM. Using the J-PARC proton beam and the pion capture by a
solenoidal field, COMET will have Single Event Sensitivity (SES) 10000 times better than the
current limit that is 2.6 - 10$'/ SES. The COMET collaboration has started its first phase;
COMET Phase-I in 2013 and initial data collection will start in 2017. In this study, the
performance of prototype chamber; Prototype-IV, which is a partial copy of the real Cylindrical
Drift Chamber (CDC) in COMET Phase-I was tested by using high energy beam with finger
scintillator that held in synchrotron radiation facility Spring-8. The drift velocity and spatial
resolution of prototype was measured by using Helium-Ethane gas mixture with high voltage of
2300V Threshold 20mV. From the analysis that we have done, it shows that the drift velocity
and the spatial resolution is 32900ms$' and 161.2µm respectively. The result will help COMET
member to choose gas mixture whether Helium-Methane, Helium-Ethane or Helium-Isobutene
is suitable to be filled in the real CDC.

45
SUITABILITY ANALYSIS FOR THE SITE OF NUCLEAR REACTOR IN TERENGGANU
Norsyazwani Binti Daud and Prof. Dr. Ahmad Termizi Bin Ramli Electrical energy is the primary energy used in everyday life. Malaysia proposes that nuclear
energy as an alternative power generation in the country. The process of selecting a site for the
construction of nuclear power reactors is done according to the criteria established by the
Atomic Energy Licensing Board, AELB and the International Atomic Energy Agency, IAEA. The
study conducted in Terengganu done by limiting the distance of 10 km from the border area of
the beach as a candidate site. The selection of a suitable site to build a nuclear power reactor is
filtered through the analysis of demographic parameters analysis, geology, seismology,
geography and soil structure. This process involves sketching and mapping using software
ArcGis and scoring parameters given to each candidate sites at once to get rid of areas that do
not meet the prescribed conditions. HotSpot’s software is used for analysis of radiological
safety by identifying the level of wind speed and direction of wind that would affect the
distribution of radioactivity around the site selected. Based on the scoring of each parameter,
lived around Kuala Paka, Dungun is potential as the reactor site because it has a population
density of 250 people per km2, stable soil structure and meet the safety requirements that have
been set.
THERMOLUMINESCENCE DOSIMETRIC PROPERTIES OF THULIUM DOPED OPTICAL FIBER BY GAMMA IRRADIATIONS
Noorhalina binti Ghazali and Dr. Muhammad Alam Saeed
This work investigates the performance of two commercial optical fibres; Thulium doped and
Thulium-Holmium doped fibre optics to be used as ionizing radiation dosimeter sensors
compared to TLD-100. Thermoluminescence (TL) properties of these fibres such as dose
response, linearity, sensitivity and glow curve have been studied. Thulium and Thulium-
Holmium doped fibre optics were the basic material for this study manufactured by CorActive
with core diameter 3.0 ± 0.5 µm and 10.0 ± 1.0 µm respectively. The fibres were exposed to 1
Gy to 5 Gy doses under 1.25 MeV gamma radiations, provided by Gammacell 220 Excel
available at Applied Physics Study Centre, Faculty of Science and Technology, Universiti
Kebangsaan Malaysia, Bangi, Selangor. Results clearly show that the commercially available
Thulium doped and Thulium-Holmium doped optical fibres have a linear dose – TL signal
relationship. However, TLD-100 has surpassed both commercial optical fibres in terms of
response and sensitivity to produce luminescence. Thulium-Holmium doped provides better

46
sensitivity 30 times higher than Thulium doped fibre optic. This indicates that the addition of
Holmium improves the TL characteristics of fibers.
SUITABILITY ANALYSIS FOR NUCLEAR REACTOR SITING IN SELANGOR, NEGERI SEMBILAN AND MELAKA
Nurul Amira Binti Noorhisham and Prof. Dr. Ahmad Termizi Bin Ramli
The use of nuclear energy can be utilized in the generation of electricity to meet the demands
and needs of the energy sector in Malaysia. Malaysian government has decided to consider the
necessity for the construction of a nuclear power reactor due to this purpose. The selection
process of the reactor site must conform the basic needs of nuclear safety recommended by the
Atomic Energy Licensing Board (AELB) and the International Atomic Energy Agency (IAEA).
There are various parameters that need to be evaluated, therefore this study is designed to
propose the steps to identify a suitable candidate site in a clearer and more systematic
measure. The selected study area are in Selangor, Negeri Sembilan and Melaka. Scope of this
study area was reduced to the region within 10 km of coastline due to the mandatory
requirement as suggested in previous studies. The methodology consists of the elimination
process and selection of suitable candidates sites based on analysis of the selected main
parameters which is the parameter of geology, seismology, demographic and radiological safety.
Candidates for the suitable site are determined by a scoring system to each parameter, and
involves sketching and mapping using ArcGIS software. High marks are given to the
parameters that comply with nuclear safety; and vice versa. To identify the radiological risks at
the site, Hotspot software is used to analyze the distribution of radionuclides in the air for that
area. This analysis contributes to determine the suitability of potential sites for radiological
safety parameters. Due to results of the selection and elimination process based on the scoring
system, potential sites which is considered as suitable for construction of the reactor has been
obtained at the end of the study.

47
Chairperson session 3 : Dr Koh Meng Hock
Time : 2.30 p.m– 3.50p.m
1. The Analysis On Thermoluminescence (Tl) Glow Curve Of TLD -100 By Initial Rise And Peak Shape
Methods.
Nur Nafiah Binti Rosdi &Assoc. Prof. Dr. Suhairul Hashim
2. Determination of TL Properties Of TLD -100 Using Two Different TLD Reader
Aida Norsyafiza Binti Azmi & Dr Izyan Hazwani Hashim
3. Development ff Neutron Statistical Calculator For Muon Neutrino Response
Siti Syahirah Binti Saroni &Dr Izyan Hazwani Hashim
4. Nuclear Cascade Effect On 152
Eu
Wan Noor Amelia Binti Wan Mohd Rasdi &Dr Izyan Hazwani Hashim
ABSTRACTS
THE ANALYSIS ON THERMOLUMINESCENCE (TL) GLOW CURVE OF TLD-100 BY INITIAL RISE AND PEAK SHAPE METHODS.
Nur Nafiah binti Rosdi and Assoc. Prof. Dr Suhairul Hashim
The dosimeter of TLD-100 was used in chips form as the sample for this study. The samples
were exposed to 5Gy of 60Co gamma ray by Gamma Cell Model 220 Excel. The TL
measurements was carried out by Harshaw 4500 TLD reader with WINREMS software. The
graph of the amount light emitted during the TL process as a function of temperature known as
TL glow curves were plotted by using OriginPro 8.5. This study conducted to analyse of each TL
glow peaks with different heating rate from 1 °C s−1 to 20 °C s−1. The optimum heating rate of
TLD-100 was recorded at 20 °C s−1 with value of peak temperature, TM = 239 °C. The kinetic
parameters such as an order of kinetic, the activation energy (E) and the frequency factors (s)
of the TL glow peaks were determined by using this two methods. TL kinetic parameters were
determine using initial rise (IR) method and peak shape (PS) method. The values of activation
energy for initial rise (IR) method and peak shape (PS) method were recorded E = 1.3346 ±
0.0472 eV and E = 1.8613 ± 3.7564 eV respectively and the values of the frequency factor
respectively recorded for initial rise (IR) method and peak shape (PS) method were s = 0.7041 ×
1012 s−1 and s = 2.24 × 10⁸ s−1. The first kinetic order of TL glow peaks were determined as an
asymmetrical shape of TL glow curve.

48
DETERMINATION OF TL PROPERTIES OF TLD-100 USING TWO DIFFERENT TLD READER
Aida Norsyahafiza binti Azmi and Dr. Izyan Hazwani binti Hashim
This study is to investigate and compares the thermoluminescence glow curve, dose response,
linearity and sensitivity of TLD-100 using two different TLD readers. Readings of TL
measurements were made using a model Harshaw 3500 and 4500 manual TLD reader with
WINREMS. Both of the TLD reader has flowing nitrogen atmosphere. Hot pressed chips of TLD-
100 were used as the basic material for this research. Samples were exposed to doses at range
from 1.0 Gy to 10.0 Gy of Co-60 gamma ray by Gammacell 220 facility manufactured by
Atomic Energy and provided by University Kebangsaan Malaysia. The glow curve are analysed
to determine TL properties of the TLD-100 and its sensitivity. The sensitivity of TLD-100 using
TLD reader Harshaw 4500 model shows the high sensitivity compared to sensitivity of TLD-100
using TLD reader 3500 which is 533775.708 nCg-1and 278442.806 nCg-1. Besides that, the
intensity of TL response of TLD-100 using TLD reader 4500 had shown a good linear TL
response with the absorb dose for 1250 keV of gamma energy in range of 1.0 – 10.0 Gy absorb
dose. From this research, it was found that TLD-100 has good sensitivity towards read-out
process by using model 4500 Harshaw TLD reader. TLD-100 also shows a good response
towards determination of TL properties by using TLD reader Harshaw model 4500 compared to
using TLD reader Harshaw model 3500.
DEVELOPMENT OF NEUTRON STATISTICAL CALCULATOR FOR MUON NEUTRINO RESPONSE
Siti Syahirah Saroni and Dr. Izyan Hazwani Hashim
The study of muon response are important due to its significance towards the nuclear matrix
elements (NMEs) of double beta decays (DBD). Although the experimental approaches toward
the development of understanding of nuclear environment have been greatly developed,
unresolved problems still remain. The development of neutron statistical model was an
extension to the current model proposed in 2014 which focusing more on heavy nuclei (A>100)
with the ratio of fast to slow neutron emission in the range of 15-25%. This report revises the
neutron model made in 2014 by introducing a strength distribution model to identify the effect
of nuclear density parameter (a) towards isotopic population distribution after muon capture
reaction. The effect of PEQ and EQ ratio towards isotopic population distribution after muon
capture and the relative capture strength for 100Mo, 109Ag dan89Yfor DBD experiment are
determined. Simulation result indicates that from the statistical estimation, one could provide
49
information of eventful neutron emission after every capture process for validation of the
experimental observation of isotopic population after muon capture, thus, provide useful
information about relative capture strength for DBD experiment.
NUCLEAR CASCADE EFFECT ON 152Eu
Wan Noor Amelia binti Wan Mohd Rasdi and Dr. Izyan Hazwani binti Hashim
Gamma spectroscopy technique is widely used in the nuclear industry, geochemical
investigation and astrophysics field by providing quantitative analysis of radioisotope activity.
However, the nuclear gamma cascade resulting from the simultaneous detection of gamma rays
will affect the efficiency of the detector. Therefore, the evaluation of the nuclear cascade effect
on 152Eu which associated with the emission of gamma rays will be reported in this thesis. The
activity of 152Eu can be determined from the net count in the photopeak area from the gamma
ray spectrum. The gamma ray spectrum is produced due to detection of the discrete energy
and count rate of gamma rays by High Purity Germanium (HPGe) detector. The source-to-
distance is varied from 1cm to 12 cm. In addition, the effect of collimator on the activity of
152Eu will also be evaluated whereby the collimator is fixed on the detector with the same
source-to-detector distance. The results from both collimated and non-collimated
measurement are tabulated, compared and elaborated. Besides, the analysis of this
experiment is mainly on the gamma rays detected by HPGe detector. Thus, for maximum
detection to happen, three different aspects which are energy, peak resolution and detector
efficiency should be considered.

50
4. PHYSICS INSTRUMENTATION
(ABSTRACTS)
51
VENUE :PhysicsInstrumentation Teaching Laboratory 4 (C21-310-01)
DATE :31May 2016 (Tuesday)
Chairperson session 1 : Hj Mohd Khalid Kasmin
Time : 08:30 am– 10:05am
1. Determination of Efficiency and Fluence of Flashlamp Pumped Nd:YAG Laser
Iffah Nor Syahirah Binti Mohd Zaid & Dr. Roslinda Binti Zainal
2. Acoustic Guitar Tuner Using Piezoelectric Transducer
Md Amiruddin bin Md Iskandar & Muhammad Zaki Yaacob
3. Infrared Light Emitting Diode to Detect Heart Pulse
Muhamad Muizzudin bin Azali & Assoc. Prof. Dr. Ahmad Radzi bin Mat Isa
4. Development of An Optical Character Recognition Android Application for Digital Display Fonts
Nurul Farhana Bt Muhammad Ghafi & Dr. Yang Yung Szen
ABSTRACT
DETERMINATION OF EFFICIENCY AND FLUENCE OF FLASHLAMP PUMPED Nd:YAG
LASER
Iffah Nor Syahirah Binti Mohd Zaid and Dr. Roslinda Binti Zainal
Flashlamp pumped Nd:YAG laser is widely used and essential in many applications such as
medical and industrial. The purpose of this research is to determine the threshold voltage,
conversion efficiency and fluence of flashlamp pumped Nd:YAG laser. The characterization of
the output beam Nd:YAG laser was investigated as a result of a single pulse and variable
repetition rate of 1-5 Hz. The Nd:YAG laser at 1064 nm was pumped by xenon flashlamp. The
flashlamp was triggered using external triggering method. This laser system is in free running
mode. The variable high input voltage of 650 – 1000 V range was supplied to the 92 uF
capacitor bank. The operation of the Nd:YAG laser was controlled by a custom made control
unit. The result shows that the lowest threshold voltage of 502.6 V was obtained at 2 Hz
repetition rate. Meanwhile, the highest electrical to optical conversion efficiency of 2.76% was
obtained at 5 Hz repetition rate. The Nd:YAG laser fluence on sand paper sample was
investigated at high output energy of 1000 V and variable repetition rate. The highest laser
damage threshold was obtained at 4 Hz of 2.94 x 10⁵ mJ/cm2.

52
ACOUSTIC GUITAR TUNER USING PIEZOELECTRIC TRANSDUCER
Md Amiruddin bin Md Iskandar and Muhammad Zaki Yaacob
The purpose of this study is to design an audio frequency detector that can be used to precisely
tune an acoustic guitar. This device consists of piezoelectric disc as the transducer, an
operational amplifier, Arduino Nano microcontroller, a computer and a Java-based open-source
software, Netbean. The piezolectric disc will measure the acoustic sound waves produced by an
acoustic guitar and give out an analogue output in the form of voltage. The operational
amplifier will amplify the input voltage up until 4V. The voltage signal then will be processed by
the Arduino Nano microcontroller. The Arduino will measure the frequency of the incoming
voltage signal to be processed by the computer. The favored range of frequency will be from 80
Hz until 350 Hz. During this stage, the analogue value of the voltage is converted into the form
of digital value so that it can be processed by the computer. The Netbean software will compute
the frequency of the voltage measured and differentiate it with the setpoint value of the
precised frequency of a perfectly-tuned acoustic guitar. The result of such process is presented
in the form of a display with a fluctuating bar. This bar will exhibit whether the measured
frequency of the waves is the same as the setpoint value or not. And thus, we have ourselves a
guitar tuner using a piezoelectric disc. This instrument is now capable of aiding in calibrating a
guitar.
INFRARED LIGHT EMITTING DIODE TO DETECT HEART PULSE
Muhamad Muizzudin bin Azali and Prof. Madya Dr. Ahmad Radzi bin Mat Isa
Infrared (IR) is invisible radiant energy. The wavelength of the infrared is longer than the visible
light, extending from the nominal red edge of the visible spectrum at 700nm to 1mm. The
range adjacent to the visible spectrum is called “near infrared” and the longer wavelength part
is called “far infrared”. Infrared light emitting diode (LED) used in this study due to infared is a
good absorbance of oxygenated blood at infrared wavelength. In addition, the IR receiver is
used to specified the wavelength of light received, so the other source of light cannot be
interfere the result. The TLV2741 amplifier is used to amplify and a capacitor is used to filter
the signal of the sensor. The hole cover is built up to make a appropriate sensor cover. The
program interface is built using Ardiuno and this program can show immediately the signal of
heart pulse. The data of the time domain graph can be transform into frequency domain by
using Octave software to measure the value of beat per minute (BPM). This study will detect the
heart pulse with the various condition such as in normal condition or after doing exercise
53
condition. The result will be show the reading in range of 60 – 100 bpm at normal condition
and above 100 bpm at after exercise condition. The result of heart pulse will be shown
instantenously using NetBeans IDE 7.4 and Gnuplot sofware.
DEVELOPMENT OF AN OPTICAL CHARACTER RECOGNITION ANDROID APPLICATION FOR DIGITAL DISPLAY FONTS
Nurul Farhana Bt Muhammad Ghafi and Dr. Yang Yung Szen
In recent years, smartphones are drastically becoming part of human's daily life in ways
unimaginable just 20 years ago. Current smartphones are equipped with multicore processors,
high resolution cameras and a multitude of sensors for various purposes. The aim of this
project is to study the feasibility of using a smartphone to acquire data from digital displays
commonly found on many scientific instruments. This project utilizes the built-in camera of a
smartphone to photograph images of the digital displays, which are then converted into text - a
process is known as optical character recognition (OCR). A homemade software running on
Android mobile operating system (colloquially known as "apps") was developed based on
Tesseract OCR engine for image processing. The image recognition accuracy depends on the
quality of the image and a major complication is that Tesseract OCR does not recognize digital
display fonts.Using the homemade "apps", training of Tesseract OCR was done using two other
softwares based on three types of fonts: "Digital Dream Fat Narrow", "Let's Go Digital" and
"Serak Seven Segment" using two other softwares. The first software, jTessBoxEditor, was
used to generate Tagged Image File Format (TIFF) images, which was then fed into the second
software, Serak Tesseract Trainer to generate TessData. By incorporating TessData into
Tesseract OCR engine, the homemade "app" was able to recognize similar digital display fonts.
To further improve the image recognition accuracy, the effects of surrounding brightness and
camera setting were also investigated to determine the optimal conditions to produce the most
accurate results.From the experimental results, the "Digital Dream Fat Narrow" font was found
to produce the most accurate results for the test samples. By varying the surrounding light
intensity around the test subject and measuring the light intensity using a lux meter, accurate
text recognition was obtained above 40 lx for ISO setting at 100,200,400 and 800. As a
conclusion, this project concludes that a smartphone can be made into a data acquisition
device provided that the OCR has been trained properly and that the camera settings and
surrounding brightness are within the optimal conditions.
54
Chairperson Session 2 : Mr. Muhammad Zaki Hj. Yaacob
Time : 11.00am – 1.00pm
1. (No abstract)
Nur Qamaliyah Binti Mohd Tarmidi & Dr. Abd Rahman Tamuri
2. The Development of Robot Arm for Stem Education
Nazirah Binti Mohd Razali & Assoc. Prof. Dr. Hazri Bakhtiar
3. Lane Departure Helper System
Nur Emalina Binti Mohd Suhaimi & Mohd Khalid Bin Kasmin
4. (No abstract)
Muhammad Afiq Aiman Bin Maleki & Assoc. Prof. Dr. Md Supar Rohani
5. Simulation of Single Mode-Multimode-Single Mode Fiber Temperature Sensor
Ng Ying Xuan & Dr. Amiruddin Shaari
ABSTRACT
THE DEVELOPMENT OF ROBOT ARM FOR STEM EDUCATION
Nazirah Binti Mohd Razali and Assoc. Prof. Dr. Hazri Bakhtiar
Integrating robot activities in Science, Technology, Engineering and Mathematics (STEM)
curriculum provides a lot of opportunities to engage students in real world science and
technology. Through these activities, it can help them to develop conceptual understanding of
science and mathematics principles through the process of investigation, data analysis,
physical design, and construction. In this project, a model of robotic arm for educational
purpose is developed. Its workspace and payloads capacity are analyzed. The robot arm is
controlled using Arduino micro-controller board and the instructions are programmed using
S4A software interface. The model is designed using SolidWorks and the parts are printed using
3D printer. The limitation of the robot movement is determined by data analysis. Gnuplot
software is used to plot 2-Dimensional (2D) workspace of robot arm. The robot is tested to lift
the slotted masses using different mass and torque to determine its payload capacity. The
finding shows the mathematical equation developed from the design can be used to determine
the robot 2D workspace. Higher torque motor can lift greater mass of payloads.

55
LANE DEPARTURE HELPER SYSTEM
Nur Emalina Binti Mohd Suhaimi and Mohd Khalid Bin Kasmin
Advanced Driver Assistance Systems and Intelligent Transport System are installed in some
recent cars to enhance car safety features. Lane Departure Warning and Lane Keeping Assist
for instance are for making the sure the vehicle does not leave the lane. None of the latest
technology is for helping a driver leaving the lane in overtaking or changing lane based on
human decision. Lane Departure Helper System is a system built to assist drivers changing
lane easily and safely. It is a human decision system that shows whether the next lane is safe
to change into. The system captures video using a rear facing wifi web camera installed at the
back of the car. The program then breaks the video in frames for it easier analyzing. The
program then analyze each frame of the video to detect the presence of car at the other lane.
Detection of car in the scene is done by using object recognition algorithm. The program then
calculate the area of the detected car. The difference of area of detection of car in each frame
will give us information about the speed of the car. However, the driver makes the decision
whether he wants to change lane or not. If the relative speed of the incoming rear car in the
next lane is greater than 30kmh, it is considered unsafe to change lane and red indicator is
given to the driver. If it is safe to change lane, green indicator is given. Lane Departure Helper
System is hope to improve on how we are driving and for a better idea designs in safety
features in a car.
SIMULATION OF SINGLE MODE-MULTIMODE-SINGLE MODE FIBER TEMPERATURE SENSOR
Ng Ying Xuan and Dr. Amiruddin Shaari
A temperature sensor which can immune to electromagnetic interference and resists to
chemicals is overwhelming in various industries especially in chemical and petroleum industry.
This project is about the theoretical investigation of the in-fiber temperature sensor with single
mode – multimode – single mode fiber (SMS) structure by achieving multimode interference
(MMI) in reflection mode. The SMS structure has been studied by many researchers due to the
high sensitivity compares to existing method such as fiber Bragg grating. Besides, the SMS
structure is also much easier to be fabricated since it is only constructed by splicing one of
multimode fiber (MMF) segment in between two of single mode fiber (SMF) segments. Despite
the fact, the effect from the length of different segments to the temperature sensitivity still
remains unclear. Finite-difference time-domain (FDTD) method has been used to simulate the
temperature sensing property of SMS structure. The structure first been built using computer

56
aid design, then a c-band Gaussian pulsed plane wave is used to excite the sensor. The
reflected electric field is recorded and the shifting of the dip wavelength in the spectral is used
to detect the change in temperature. The different MMF and end tip SMF’s lengths
combinations’ sensitivities then been analysed. The spectral response of the sensors to the
temperature are agreed with the literature.

57
Chairperson Session 3 : Dr. Amirudin Shaari
Time : 2.30pm – 5.00pm
1. The Design and Construction of a Motorized Rotary Gyroscope
Amalina Athira binti Ibrahim & Dr. Abd. Khamim bin Ismail
2. The Design and Construction of a Cantilever-Based Resonant Mass Sensor
Nor Hariz Bin Kadir Rosman & Dr. Abd Khamim Ismail
3. No abstract
Zairil Azmil bin Zulkifli & Assoc. Prof. Dr. Hazri Bakhtiar
4. White Light Generation Using RGB Laser
Nor Aisyah Zawawi & Dr. Abd Rahman Tamuri
5. Variable Voltage and Repetation Rates Dependance Properties of Er:YAG Laser
Nur Syazana Binti Abdul Kadir & Dr. Roslinda Binti Zainal
ABSTRACT
THE DESIGN AND CONSTRUCTION OF A MOTORIZED ROTARY GYROSCOPE
Amalina Athira binti Ibrahim and Dr. Abd. Khamim bin Ismail
Multi-axis rotary gyroscope is a simple classical model to study directional reference,
orientation, positioning, balancing and stabilizing as part of the navigation system. The rotary
gyroscope construction is very challenging especially to manufacture a perfect balance of cyclic
symmetry structure of the disc, gimbal and its multi-axis frame. The dynamic of the system
should also minimize the vibration which can produce resonance to the parts and components
of the system. The structural imperfection will cause deterioration to the whole performance of
the gyroscope. In this study, a one-axis rotary gyroscope has been successfully constructed by
using a motorized spinning disc, gimbal, base frame, rotational position sensor and signal
conditioning circuit. The rotation of the gimbal is detected by rotational position sensor using a
precision potentiometer (20kΩ ± 5%) mounted to the axis. A signal conditioning circuit converts
the rotation into analog voltage and finally into digital signal using Arduino nano USB interface
card connected to the computer. A graphical user interface was built using Netbeans IDE for
signal interpretation. The rate of change in angle is measured as the gyroscope gimbal
response to yawing and pitching. From the angular displacement reading, instantaneous
angular velocity, and instantaneous angular acceleration were measured. The highest
deflection of the gimbal measured is up to 90 degrees.

58
THE DESIGN AND CONSTRUCTION OF A CANTILEVER-BASED RESONANT MASS SENSOR
Nor Hariz Bin Kadir Rosman and Dr. Abd Khamim Ismail
A traditional spring balance and ordinary electronic scales intrinsically measure the weight of
an object which varies with location due to the variation of gravitational field strength. In
contrast, the mass of an object is a measure of the amount of matter in the object and should
be measured without the influence of gravitational field. A resonant cantilever mass sensor is a
device used to measure mass and it works based on resonant frequency. Its resonant
frequency can be altered by adding mass to further decrease the resonant frequency. In this
study, a vibrating structure of a resonant mass sensor was built based on a steel cantilever
with an electromagnetic actuation and optical detection. The electromagnet was actuated using
a PWM pulse generator circuit in order to vibrate the cantilever to its resonant frequency. The
pulse generator circuit was constructed using Timer 555 in astable mode circuit configuration
and the output current driving capability was boosted using Darlington transistor TIP 122. The
vibration of the cantilever is detected by an optical detection technique. An infrared beam was
transmitted using infrared LED to the vibrating cantilever and the reflected IR beam was
detected by infrared photodiode into oscillating photocurrent. The photodiode current was
further amplified into voltage using I-to-V convertor amplifier and finally converted into digital
signal using Arduino nano USB interface card to the computer. For signal interpretation a
graphical user interface was built using Netbeans IDE. The resonant cantilever mass sensor
was successfully designed and constructed to measure added mass between 6g to 12g range.
WHITE LIGHT GENERATION USING RGB LASER
Nor Aisyah Zawawi and Dr. Abd Rahman Tamuri
White light is significant in household applications. Laser is used due to its high efficiency and
brighter generation of white light. In this study, red, green and blue (RGB) lasers were used to
produce high intensity of white light. In order to control the intensity of each laser, a laser
driver is designed using Arduino Uno. Three pulse width modulations (PWM) channels were
programmed to produce three different output with different duty cycle which is from 0 to
100%.Three potentiometer were used to control the output of PWM. The maximum value for
each laser diode was set to 100mW. Then, all the lasers were combined using combiner prism
and combiner mirrors. A digital camera, power meter and spectrometer were used to
characterise the white light generated using RGB lasers. The image of white light is captured

59
using a digital camera. The power meter was used to measure the power for each laser while
the spectrometer was used to measure the intensity of different wavelength. Current is
employed to control power of the lasers as well as their intensities. The power of two laser were
kept constant with one laser was varied and red laser was kept constant while other lasers
were varied. In order to get white light, the variations of intensity were captured using digital
camera. Image captured is then analysed using software of ImageJ. From the result obtained,
the image captured was compared to HTML color codes. The average of the percentage error is
0.2%, 0.1% and 0.1% for red, green and blue laser respectively. As a conclusion, the high
intensity of white light can be produced by controlling the power of RGB lasers.
VARIABLE VOLTAGE AND REPETITION RATES DEPENDANCE PROPERTIES OF Er:YAG LASER
Nur Syazana Binti Abdul Kadir and Dr. Roslinda Binti Zainal
Er:YAG laser have been proposed for medical treatments and the development of such laser is
worth exploring. The purpose of this research is to determine the threshold voltage, conversion
efficiency and laser fluence of Er:YAG laser pumped by a Xenon flashlamp. The output laser at
2940 nm was characterized with an input voltage of 900 – 1200 V and repetition rates of 1 – 6
Hz. The results show that the mid-infrared Er:YAG laser produced no output at 1 Hz. Er:YAG
laser at low repetition rate at 2 Hz needed very high threshold voltage of 960.14 V and it
decreases as the repetition rate increases. The optimum electrical to optical conversion
efficiency off 2.94 % of flashlamp pumped Er:YAG laser was obtained at 5 Hz repetition rate.
The Er:YAg laser-matter interaction was observed on several green leaves and the laser fluence
was calculated. Er:YAG laser damage threshold was investigated on the green leaves with
variable repetition rates. The laser damage threshold was obtained at 4 Hz which was 8318.87
mJ/cm2.