Contents lists available at ScienceDirect International ... · International Journal of Hygiene and...
9
International Journal of Hygiene and Environmental Health 217 (2014) 796–804 Contents lists available at ScienceDirect International Journal of Hygiene and Environmental Health jou rn al hom ep age: www.elsevier.com/locate/ijheh Study of selenium intake and disposition in various matrices based on mathematical algorithms derived from pooled biomonitoring data Nolwenn Noisel a , Gaétan Carrier a,b , Michèle Bouchard a,∗ a Department of Environmental and Occupational Health, Chair of Toxicological Risk Assessment and Management and Université de Montréal Public Health Research Institute (IRSPUM), University of Montreal, P.O. Box 6128, Main Station, Montreal, Quebec, Canada H3 C 3J7 b Direction de la santé environnementale et de la toxicologie, Institut national de santé publique du Québec (INSPQ), 190, boul. Crémazie Est, Montréal, Québec, Canada H2P 1E2 a r t i c l e i n f o Article history: Received 13 January 2014 Received in revised form 25 April 2014 Accepted 29 April 2014 Keywords: Selenium Blood Plasma Urine Toenail Hair a b s t r a c t Biomonitoring is increasingly used to assess exposure to selenium (Se) in the population. However, there is little harmonization among protocols used in the different studies (varying biological matrices, differ- ences in expression of results (concentrations versus amounts, units)). This makes inter-comparison of biomonitoring results across studies difficult. From a public health risk perspective, it also becomes chal- lenging to estimate baseline levels in biological matrices for populations exposed by various sources. The aim of this study was thus to perform a systematic analysis of the relationship between Se intakes and biological concentrations based on published data. Inclusion and exclusion criteria were used and led to select 75 published biomonitoring data in humans from an extended review of Se biomonitoring studies. This represents 8 628 individuals who provided biological samples aiming at documenting Se expo- sure and/or Se concentrations in two or more biological matrices. Mathematical algorithms that relate Se intakes to biological concentrations and establish matrix-to-matrix associations were derived from these pooled biomonitoring data. Logarithmic regressions showed good correlations between Se intakes and whole blood concentrations (R 2 = 0.884), plasma concentrations (R 2 = 0.863) and urinary excretion rates (R 2 = 0.958). Blood and plasma concentrations were also strongly related (R 2 = 0.874), as were whole blood concentrations and urinary excretion rates (R 2 = 0.953). The interpretation of the log-regression coefficients allowed illustrating Se physiology. Se concentrations in plasma tend to plateau when daily intake exceed 150 g/d, whereas Se in urine increases rapidly above this threshold. The application of the algorithms to other independent data sets in order to reconstruct past Se intakes confirmed that interpretation of results on the basis of Se in integuments may be misleading if external contamination is not avoided. This approach based on pooled data covered a wide range of exposure and the large number of data integrated increased the level of confidence of results. © 2014 Elsevier GmbH. All rights reserved. Abbreviations: Se, for selenium; ISe, represents Se intake expressed in g/d from objective measurements; BSe, represents Se concentration in whole blood expressed in g/L; PSe, represents Se concentration indistinctly in plasma or serum expressed in g/L; SSe, represents Se in serum; HSe, represents Se concentration in hair expressed in g/g; USe, represents Se in urine; U1Se, represents daily excretion of urinary Se expressed in g/d; U2Se, represents Se concentration in urine expressed in g/L; U3Se, represents Se concentration in urine adjusted to the creatinine level expressed in g/g creat.; TSe, represents Se concentration in toenails expressed in g/g. ∗ Corresponding author at: Department of Environmental and Occupational Health University of Montreal P.O. Box 6128, Roger-Gaudry Building, U424, Main Station, Montreal, Quebec, Canada. Tel.: +1 514 343 6111x1640; fax: +1 514 343 2200. E-mail addresses: [email protected] (N. Noisel), [email protected] (G. Carrier), [email protected] (M. Bouchard). Introduction In the last decades, human biomonitoring has been extensively developed to monitor exposure to environmental contaminants and assess associated health risks in the population (Angerer et al., 2007; Cerna et al., 2012; Wilhelm et al., 2004). This approach is also applicable to essential elements such as selenium (Se). This element plays a predominant role in the formation of numerous enzymes and proteins (Brown and Arthur, 2001; Herbette et al., 2007; Holben and Smith, 1999). It helps protecting the body against oxidative stress given its antioxidant properties (El-Bayoumy, 2001; Papp et al., 2007; Ravoori et al., 2010). However, high doses of Se may induce toxic effects (Lopez et al., 2010; MacFarquhar et al., 2010; Yang et al., 1983; Yang and Xia, 1995). http://dx.doi.org/10.1016/j.ijheh.2014.04.005 1438-4639/© 2014 Elsevier GmbH. All rights reserved.
-
Upload
trinhtuyen -
Category
Documents
-
view
240 -
download
0
Transcript of Contents lists available at ScienceDirect International ... · International Journal of Hygiene and...

Sm
Na
Hb
Q
a
ARRA
KSBPUTH
feehoie�
HSf
gm
h1
International Journal of Hygiene and Environmental Health 217 (2014) 796–804
Contents lists available at ScienceDirect
International Journal of Hygiene andEnvironmental Health
jou rn al hom ep age: www.elsev ier .com/ locate / i jheh
tudy of selenium intake and disposition in various matrices based onathematical algorithms derived from pooled biomonitoring data
olwenn Noisela, Gaétan Carriera,b, Michèle Boucharda,∗
Department of Environmental and Occupational Health, Chair of Toxicological Risk Assessment and Management and Université de Montréal Publicealth Research Institute (IRSPUM), University of Montreal, P.O. Box 6128, Main Station, Montreal, Quebec, Canada H3 C 3J7Direction de la santé environnementale et de la toxicologie, Institut national de santé publique du Québec (INSPQ), 190, boul. Crémazie Est, Montréal,uébec, Canada H2P 1E2
r t i c l e i n f o
rticle history:eceived 13 January 2014eceived in revised form 25 April 2014ccepted 29 April 2014
eywords:eleniumloodlasmarineoenailair
a b s t r a c t
Biomonitoring is increasingly used to assess exposure to selenium (Se) in the population. However, thereis little harmonization among protocols used in the different studies (varying biological matrices, differ-ences in expression of results (concentrations versus amounts, units)). This makes inter-comparison ofbiomonitoring results across studies difficult. From a public health risk perspective, it also becomes chal-lenging to estimate baseline levels in biological matrices for populations exposed by various sources. Theaim of this study was thus to perform a systematic analysis of the relationship between Se intakes andbiological concentrations based on published data. Inclusion and exclusion criteria were used and led toselect 75 published biomonitoring data in humans from an extended review of Se biomonitoring studies.This represents 8 628 individuals who provided biological samples aiming at documenting Se expo-sure and/or Se concentrations in two or more biological matrices. Mathematical algorithms that relate Seintakes to biological concentrations and establish matrix-to-matrix associations were derived from thesepooled biomonitoring data. Logarithmic regressions showed good correlations between Se intakes andwhole blood concentrations (R2 = 0.884), plasma concentrations (R2 = 0.863) and urinary excretion rates(R2 = 0.958). Blood and plasma concentrations were also strongly related (R2 = 0.874), as were wholeblood concentrations and urinary excretion rates (R2 = 0.953). The interpretation of the log-regressioncoefficients allowed illustrating Se physiology. Se concentrations in plasma tend to plateau when daily
intake exceed 150 �g/d, whereas Se in urine increases rapidly above this threshold. The application ofthe algorithms to other independent data sets in order to reconstruct past Se intakes confirmed thatinterpretation of results on the basis of Se in integuments may be misleading if external contamination isnot avoided. This approach based on pooled data covered a wide range of exposure and the large numberof data integrated increased the level of confidence of results.© 2014 Elsevier GmbH. All rights reserved.
Abbreviations: Se, for selenium; ISe, represents Se intake expressed in �g/drom objective measurements; BSe, represents Se concentration in whole bloodxpressed in �g/L; PSe, represents Se concentration indistinctly in plasma or serumxpressed in �g/L; SSe, represents Se in serum; HSe, represents Se concentration inair expressed in �g/g; USe, represents Se in urine; U1Se, represents daily excretionf urinary Se expressed in �g/d; U2Se, represents Se concentration in urine expressedn �g/L; U3Se, represents Se concentration in urine adjusted to the creatinine levelxpressed in �g/g creat.; TSe, represents Se concentration in toenails expressed ing/g.∗ Corresponding author at: Department of Environmental and Occupationalealth University of Montreal P.O. Box 6128, Roger-Gaudry Building, U424, Maintation, Montreal, Quebec, Canada. Tel.: +1 514 343 6111x1640;ax: +1 514 343 2200.
E-mail addresses: [email protected] (N. Noisel),[email protected] (G. Carrier),[email protected] (M. Bouchard).
ttp://dx.doi.org/10.1016/j.ijheh.2014.04.005438-4639/© 2014 Elsevier GmbH. All rights reserved.
Introduction
In the last decades, human biomonitoring has been extensivelydeveloped to monitor exposure to environmental contaminantsand assess associated health risks in the population (Angerer et al.,2007; Cerna et al., 2012; Wilhelm et al., 2004). This approach is alsoapplicable to essential elements such as selenium (Se). This elementplays a predominant role in the formation of numerous enzymesand proteins (Brown and Arthur, 2001; Herbette et al., 2007; Holbenand Smith, 1999). It helps protecting the body against oxidative
stress given its antioxidant properties (El-Bayoumy, 2001; Pappet al., 2007; Ravoori et al., 2010). However, high doses of Se mayinduce toxic effects (Lopez et al., 2010; MacFarquhar et al., 2010;Yang et al., 1983; Yang and Xia, 1995).
ne an
uaelWriw
cSdawe(bapaec(eapt(aiNo(RototoaTtHc2
da1ieSac22fe(te2s
b
N. Noisel et al. / International Journal of Hygie
Biomonitoring of exposure to Se is thus useful to assess if pop-lation intake remains within an optimal range in order to avoiddverse health effects related to a deficiency or an excess (Niskart al., 2003). As for other contaminants such as metals (mercury,ead) or organic compounds (Angerer et al., 2007; Cerna et al., 2012;
ilhelm et al., 2004), the use of biomonitoring to assess healthisks relies on the establishment of the relationship between dailyntakes, body burden, biological concentrations and health effects,
hile considering various factors, such as nutritional requirement.Since Se exposure in general population occurs through food
onsumption (Barceloux, 1999), numerous studies have assessede dietary intake with simple and inexpensive tools such as foodiaries or food frequency questionnaires (FFQ). However, severaluthors found that using this approach provides low correlationsith Se biological levels (Ravn-Haren et al., 2008; Serra-Majem
t al., 2009) and does not reflect accurately dietary Se intakeHawkes et al., 2008). For these reasons, scientists agree that usingiomonitoring data of Se is a better approach to assess aver-ge daily exposure (Mayne et al., 2004; Mozaffarian, 2009). Asroposed by Angerer et al. (2007), suitable biological matricesnd parameters are needed to reflect internal exposure and tonsure reliable human biomonitoring assessment. In the case of Se,oncentrations measured in whole blood reflect long-term statusDuffield and Thomson, 1999; Fan and Kizer, 1990) mainly becauserythrocytes contain protein-bound Se and have a life-span ofpproximately 120 days (Barceloux, 1999; Dumont et al., 2006). Selasma or serum concentrations are indicators of relatively short-erm nutritional status since they reflect rapid changes in Se intakeBarceloux, 1999; Dumont et al., 2006; Hambidge, 2003). Urinelso serves as a biological matrix to assess recent Se intake sincet is a major excretory route of Se (Francesconi and Pannier, 2004;avarro-Alarcon and Cabrera-Vique, 2008); daily urinary excretionf Se accounts for approximately half of the average daily intakeDumont et al., 2006; Griffiths et al., 1976; Longnecker et al., 1996;obinson et al., 1973; Thomson, 1998). For this reason, the choicef units is of importance: 24-h daily excretion rates are preferableo urinary concentrations from a single void even with creatininer density normalization (Ohira et al., 2008). Integuments (hair andoenails), like whole blood, provide a long-term average estimatef Se status, i.e. over a period of time of weeks or months (Al-Salehnd Billedo, 2006; Longnecker et al., 1993; Mannisto et al., 2000).heir sampling has the advantage of being non-invasive and long-erm storage is easy (Bencko, 1995; Slotnick and Nriagu, 2006).owever, hair is prone to contamination following the use of Se-ontaining antidandruff shampoo (Morris et al., 1983; Noisel et al.,010), making it a poor reflection of Se dietary intake in this case.
Results of Se biomonitoring studies aiming at documenting theeterminants of Se concentrations in blood suggest that, apart from
few minor exceptions (Kim et al., 2009; Wasowicz and Zachara,987), the range of Se concentrations measured in blood are similar
n men and women, irrespective of countries and intakes (Letsiout al., 2009; Lymbury et al., 2008; Navarro-Alarcon et al., 1998;hortt et al., 1997; Swanson et al., 1990). According to some authors,ge does not appear to influence the distribution of blood Se con-entrations in the general population (Bocca et al., 2011; Burri et al.,008; Kim et al., 2009; Navarro-Alarcon et al., 1998; Niskar et al.,003; Pourmand et al., 2008; Swanson et al., 1990), while othersound either an increase in Se concentrations with age (Rasmussent al., 2009; Ravoori et al., 2010; Sanchez et al., 2010) or a decreaseLetsiou et al., 2009; Wasowicz and Zachara, 1987). Smoking sta-us is associated with lower Se concentrations in smokers (Cernat al., 2007; Ellingsen et al., 2009; Niskar et al., 2003; Sanchez et al.,
010; Swanson et al., 1990; Thomson, 2004), but this trend was notystematically observed (Bocca et al., 2011; Shortt et al., 1997).Generally, published biomonitoring studies looked at one or twoiological matrices (Bocca et al., 2011; Burri et al., 2008; Hoeflich
d Environmental Health 217 (2014) 796–804 797
et al., 2010; Kim et al., 2009; Komaromy-Hiller et al., 2000). Othersfocused on estimating only daily intake of Se (Anttolainen et al.,1996; Klapec et al., 1998; Mahapatra et al., 2001), or on relat-ing daily intake to Se concentrations in only one matrix such asblood (Sunde et al., 2008), urine (Palmer et al., 1983) or toenail(Ovaskainen et al., 1993). Such data sets make the interpretation ofexisting results difficult due to the lack of multiple data availabilityand the use of various matrices to assess Se exposure. Moreover, itdoes not allow generalizing results to other non-sampled biologicalmatrices, given that between matrix relationship and intake-biomonitoring relationship have not yet been fully documented.Therefore, a reliable and integrative tool is needed to enable theestablishment of conversion factors for matrix-to-matrix compar-ison of Se levels and intake reconstruction from biological data.This would facilitate comparison of results from the various stud-ies, which use different biological matrices and units. The aimof this study was to (i) pool the various available Se biologicaland intake data, (ii) derive mathematical algorithms for matrix-to-matrix correlations of Se levels and reverse dosimetry, and (iii)apply the algorithms to independent Se data sets to reconstruct Seintakes.
Methods
Selection of Se exposure assessment studies and applied criteria
Relevant data on Se exposure assessment and biomonitoringwere gathered by conducting an extensive literature screening ofseveral databases (Medline, Biological Abstracts, CAB Abstracts,Embase and Toxline) from 1966 to 2011, with a limitation to theEnglish language and human studies. For this purpose, the follow-ing keywords and various combinations were used: selenium/Se,biological monitoring/biomonitoring/biomarker, biologicalmatrices/biological measurements/biological compartments,controlled study/randomized trial, levels/status/concentration,intake/dietary record/food consumption, blood/wholeblood/plasma/serum/erythrocyte, urine/urinary excretion, hair,nail/toenail.
Several inclusion and exclusion criteria were considered in orderto reduce the effect of potential confounders, such as age or healthstatus, and provide results with limited uncertainties. In particu-lar, the studies had to provide original data on at least two of thefollowing total Se (no specific chemical form) variables of inter-est: intake (ISe), whole blood (BSe), plasma or serum (PSe), urine(USe), hair (HSe) or toenails (TSe). Given the paucity of data, com-bined with the lack of harmonization of the units of expressionof results, matrices such as Se in erythrocytes, Se in fingernail orglutathione peroxidase activity were not retained in the analysis.Large ranges of Se exposure (low, medium or high) without associ-ated symptoms of toxicity (deficiency or excess) were considered.However, intakes exceeding the level of 400 �g/d were excluded(Janghorbani et al., 1999; Longnecker et al., 1991; Yang et al., 1983)since this value is the upper tolerable intake level for Se (NRC,2000).
Furthermore, as several authors reported that food question-naires are not reliable tools to assess Se intake properly (Hawkeset al., 2008; Ravn-Haren et al., 2008; Serra-Majem et al., 2009), weconsidered only studies relying on accurate methods to estimateintakes, such as weighted dietary records, 24-h recall or duplicatediets. We did not include factors such as tobacco use, amalgamfillings, body mass index and vegetarian diet, because their effect
remains unclear and poorly documented in the literature. In thecase of Se supplementation trials in healthy subjects, only baselinedata prior to the onset of an exposure scenario were considered. Forrandomized trials or epidemiological studies aiming at assessing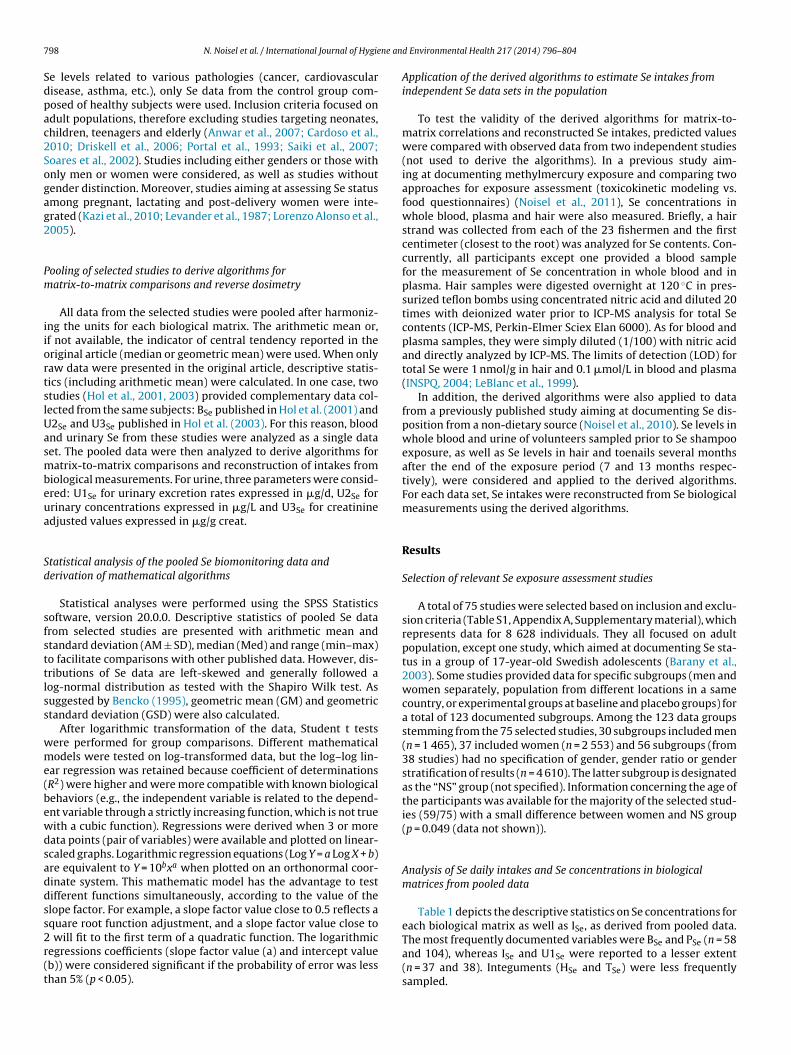
7 ne an
Sdpac2Sogag2
Pm
iiortslUasmbeua
Sd
sfsttlss
wme(bewdsaddss2r(t
98 N. Noisel et al. / International Journal of Hygie
e levels related to various pathologies (cancer, cardiovascularisease, asthma, etc.), only Se data from the control group com-osed of healthy subjects were used. Inclusion criteria focused ondult populations, therefore excluding studies targeting neonates,hildren, teenagers and elderly (Anwar et al., 2007; Cardoso et al.,010; Driskell et al., 2006; Portal et al., 1993; Saiki et al., 2007;oares et al., 2002). Studies including either genders or those withnly men or women were considered, as well as studies withoutender distinction. Moreover, studies aiming at assessing Se statusmong pregnant, lactating and post-delivery women were inte-rated (Kazi et al., 2010; Levander et al., 1987; Lorenzo Alonso et al.,005).
ooling of selected studies to derive algorithms foratrix-to-matrix comparisons and reverse dosimetry
All data from the selected studies were pooled after harmoniz-ng the units for each biological matrix. The arithmetic mean or,f not available, the indicator of central tendency reported in theriginal article (median or geometric mean) were used. When onlyaw data were presented in the original article, descriptive statis-ics (including arithmetic mean) were calculated. In one case, twotudies (Hol et al., 2001, 2003) provided complementary data col-ected from the same subjects: BSe published in Hol et al. (2001) and2Se and U3Se published in Hol et al. (2003). For this reason, bloodnd urinary Se from these studies were analyzed as a single dataet. The pooled data were then analyzed to derive algorithms foratrix-to-matrix comparisons and reconstruction of intakes from
iological measurements. For urine, three parameters were consid-red: U1Se for urinary excretion rates expressed in �g/d, U2Se forrinary concentrations expressed in �g/L and U3Se for creatininedjusted values expressed in �g/g creat.
tatistical analysis of the pooled Se biomonitoring data anderivation of mathematical algorithms
Statistical analyses were performed using the SPSS Statisticsoftware, version 20.0.0. Descriptive statistics of pooled Se datarom selected studies are presented with arithmetic mean andtandard deviation (AM ± SD), median (Med) and range (min–max)o facilitate comparisons with other published data. However, dis-ributions of Se data are left-skewed and generally followed aog-normal distribution as tested with the Shapiro Wilk test. Asuggested by Bencko (1995), geometric mean (GM) and geometrictandard deviation (GSD) were also calculated.
After logarithmic transformation of the data, Student t testsere performed for group comparisons. Different mathematicalodels were tested on log-transformed data, but the log–log lin-
ar regression was retained because coefficient of determinationsR2) were higher and were more compatible with known biologicalehaviors (e.g., the independent variable is related to the depend-nt variable through a strictly increasing function, which is not trueith a cubic function). Regressions were derived when 3 or moreata points (pair of variables) were available and plotted on linear-caled graphs. Logarithmic regression equations (Log Y = a Log X + b)re equivalent to Y = 10bxa when plotted on an orthonormal coor-inate system. This mathematic model has the advantage to testifferent functions simultaneously, according to the value of thelope factor. For example, a slope factor value close to 0.5 reflects aquare root function adjustment, and a slope factor value close to
will fit to the first term of a quadratic function. The logarithmicegressions coefficients (slope factor value (a) and intercept valueb)) were considered significant if the probability of error was lesshan 5% (p < 0.05).
d Environmental Health 217 (2014) 796–804
Application of the derived algorithms to estimate Se intakes fromindependent Se data sets in the population
To test the validity of the derived algorithms for matrix-to-matrix correlations and reconstructed Se intakes, predicted valueswere compared with observed data from two independent studies(not used to derive the algorithms). In a previous study aim-ing at documenting methylmercury exposure and comparing twoapproaches for exposure assessment (toxicokinetic modeling vs.food questionnaires) (Noisel et al., 2011), Se concentrations inwhole blood, plasma and hair were also measured. Briefly, a hairstrand was collected from each of the 23 fishermen and the firstcentimeter (closest to the root) was analyzed for Se contents. Con-currently, all participants except one provided a blood samplefor the measurement of Se concentration in whole blood and inplasma. Hair samples were digested overnight at 120 ◦C in pres-surized teflon bombs using concentrated nitric acid and diluted 20times with deionized water prior to ICP-MS analysis for total Secontents (ICP-MS, Perkin-Elmer Sciex Elan 6000). As for blood andplasma samples, they were simply diluted (1/100) with nitric acidand directly analyzed by ICP-MS. The limits of detection (LOD) fortotal Se were 1 nmol/g in hair and 0.1 �mol/L in blood and plasma(INSPQ, 2004; LeBlanc et al., 1999).
In addition, the derived algorithms were also applied to datafrom a previously published study aiming at documenting Se dis-position from a non-dietary source (Noisel et al., 2010). Se levels inwhole blood and urine of volunteers sampled prior to Se shampooexposure, as well as Se levels in hair and toenails several monthsafter the end of the exposure period (7 and 13 months respec-tively), were considered and applied to the derived algorithms.For each data set, Se intakes were reconstructed from Se biologicalmeasurements using the derived algorithms.
Results
Selection of relevant Se exposure assessment studies
A total of 75 studies were selected based on inclusion and exclu-sion criteria (Table S1, Appendix A, Supplementary material), whichrepresents data for 8 628 individuals. They all focused on adultpopulation, except one study, which aimed at documenting Se sta-tus in a group of 17-year-old Swedish adolescents (Barany et al.,2003). Some studies provided data for specific subgroups (men andwomen separately, population from different locations in a samecountry, or experimental groups at baseline and placebo groups) fora total of 123 documented subgroups. Among the 123 data groupsstemming from the 75 selected studies, 30 subgroups included men(n = 1 465), 37 included women (n = 2 553) and 56 subgroups (from38 studies) had no specification of gender, gender ratio or genderstratification of results (n = 4 610). The latter subgroup is designatedas the “NS” group (not specified). Information concerning the age ofthe participants was available for the majority of the selected stud-ies (59/75) with a small difference between women and NS group(p = 0.049 (data not shown)).
Analysis of Se daily intakes and Se concentrations in biologicalmatrices from pooled data
Table 1 depicts the descriptive statistics on Se concentrations foreach biological matrix as well as ISe, as derived from pooled data.
The most frequently documented variables were BSe and PSe (n = 58and 104), whereas ISe and U1Se were reported to a lesser extent(n = 37 and 38). Integuments (HSe and TSe) were less frequentlysampled.
N. Noisel et al. / International Journal of Hygiene and Environmental Health 217 (2014) 796–804 799
Table 1Se intake levels and biological concentrations calculated from pooled data of 75 studies.
ISe (�g/d) BSe (�g/L) PSe (�g/L) HSe (�g/g) U1Se (�g/d) U2Se (�g/L) U3Se (�g/g creat.) TSe (�g/g)
N group 36 58 104 27 37 30 20 20AM± SD 83.8 ± 67.1 141.3 ± 85.8 98.1 ± 37.8 0.8 ± 1.1 49.8 ± 44.5 44.7 ± 43.3 21.3 ± 16.3 0.9 ± 0.6GM± GSD 60.8 ± 2.3 120.7 ± 1.7 91.0 ± 1.5 0.5 ± 2.3 34.6 ± 2.4 30.3 ± 2.5 16.7 ± 2.0 0.7 ± 2.5Med 63.5 107.7 89.2 0.5 41.0 25.3 12.7 0.8Range 8.1–248.9 27.0–394.0 23.9–198.3 0.08–5.37 3.9–188.0 5.2–220.0 5.6–62.9 0.09–2.72
ISe represents Se intake expressed in �g/d from objective measurements.BSe represents Se concentration in whole blood expressed in �g/L.PSe represents Se concentration indistinctly in plasma or serum expressed in �g/L.HSe represents Se concentration in hair expressed in �g/g.U1Se represents daily excretion of urinary Se expressed in �g/d.UU in �gT
pdi4lb
Mi
aatscOtc
TLb
2Se represents Se concentration in urine expressed in �g/L.3Se represents Se concentration in urine adjusted to the creatinine level expressedSe represents Se concentration in toenails expressed in �g/g.
Values of central tendencies for Se intake show that selectedopulations had average ISe slightly above the recommendedietary allowance (RDA) of 55 �g/d (considered as an optimal
ntake) but largely inferior to the upper tolerable intake level of00 �g/d (NRC, 2000). Overall, women exhibited slightly lower Se
evels than men but there were no significant statistical differencesetween the three groups (men, women and NS (data not shown)).
athematical algorithms relating Se intake and Se concentrationsn accessible biological matrices derived from pooled data
Linear regressions were calculated on each set of pooled datafter log-transformation in order to establish the matrix-to-matrixnd intake-biomonitoring relationships. Among the sets of equa-ions presented in Table 2, the majority of dependent variables wereignificantly correlated with independent variables: the correlation
oefficients were comprised between 0.690 and 0.9997 (Figs. 1–3).nly a small number were not significant, that is PSe and USe failedo predict adequately HSe. Similarly, ISe or U1Se were not statisti-ally related to Se concentrations in urine (U2Se and U3Se).
able 2ogarithmic regression parameters for the variables of Se intake (�g/d) and the Se coniomonitoring data of the 75 selected studies.
Dependentvariable
Independentvariable
n r Pearson Slope Lower limitof CIa
Upof
Log BSe Log ISe 18 0.940 0.643 0.520 0.7Log PSe Log ISe 30 0.929 0.523 0.443 0.6Log HSe Log ISe 8 0.775 1.059 0.195 1.9Log U1Se Log ISe 17 0.979 1.047 0.926 1.1Log U2Se Log ISe 4 0.807 1.539 −1.894 4.9Log TSe Log ISe 9 0.841 1.682 0.717 2.6
Log PSe Log BSe 42 0.935 0.749 0.658 0.8Log HSe Log BSe 11 0.825 0.803 0.388 1.2Log U1Se Log BSe 14 0.976 1.717 1.475 1.9Log U2Se Log BSe 11 0.868 1.813 1.031 2.5Log U3Se Log BSe 8 0.910 1.792 0.978 2.6Log TSe Log BSe 12 0.850 0.820 0.463 1.1
Log HSe Log PSe 14 0.222 0.416 −0.730 1.5Log U1Se Log PSe 35 0.957 1.800 1.608 1.9Log U2Se Log PSe 22 0.690 2.039 1.043 3.0Log U3Se Log PSe 14 0.952 2.789 2.228 3.3Log TSe Log PSe 12 0.960 1.124 0.894 1.3
Log HSe Log U1Se 5 0.106 0.188 −3.064 3.4Log HSe Log U2Se 7 0.749 0.295 −0.005 0.5Log HSe Log U3Se 3 1.000 2.278 1.605 2.9Log TSe Log U1Se 7 0.958 0.352 0.231 0.4Log HSe Log TSe 8 0.719 0.596 0.021 1.1Log U2Se Log U1Se 3 0.987 1.066 −1.174 3.3Log U2Se Log U3Se 13 0.943 0.908 0.695 1.1
a CI represents the confidence interval.
/g creat.
For gender-specific analysis, less regressions have been deter-mined due to the small number of available data (13 regressionsfor men and 11 regressions for women), with 8 significant modelsin each case. These results show that correlations were not dif-ferent for men and women since confidence intervals of slopesoverlapped (data not shown).
When looking at the intake-biological concentration relation-ship, Fig. 1A shows that BSe concentrations increase very quicklywith increasing ISe in the low intake range, but they increase moreslowly when ISe reach approximately 50 �g/d. In parallel, PSe seemsto follow a similar pattern with a marked increase at low ISe fol-lowed by a plateau given that plasma slope factor is inferior towhole blood slope factor (0.523 vs. 0.643). In terms of elimination(Figs. 1B and 1 C), U1Se and HSe were proportional to ISe (slope fac-tor = 1.047 and 1.059, respectively), whereas slope factor value forTSe was higher (1.682). Low values of intercepts for hair and toenails(respectively −2.275 and −3.685) reflect the order of magnitude
of HSe and TSe concentrations (from 0.1 to 5 �g/g). When blood isconsidered as an independent variable, associations with PSe, HSeand TSe vary according to a quasi linear model (slope factor valuescomprised between 0.749 and 0.820) while Se in urine show a morecentrations in biological matrices (�g/L, �g/g or �g/d) determined from pooled
per limitCI
P Intercept Lower limitof CI
Upper limitof CI
P
67 <0.001 0.947 0.721 1.173 <0.00104 <0.001 1.048 0.902 1.195 <0.00123 0.024 −2.275 −3.955 −0.594 0.01668 <0.001 −0.318 −0.538 −0.098 0.00873 0.193 −1.794 −8.149 4.561 0.34848 0.004 −3.685 −5.736 −1.634 0.004
39 <0.001 0.387 0.200 0.573 <0.00118 0.002 −1.962 −2.884 −1.040 0.00160 <0.001 −2.095 −2.620 −1.571 <0.00195 0.001 −2.426 −4.155 −0.697 0.01107 0.002 −2.401 −4.143 −0.659 0.01578 <0.001 −1.860 −2.682 −1.038 0.001
62 0.445 −1.144 −3.426 1.138 0.29693 <0.001 −2.024 −2.409 −1.638 <0.00136 <0.001 −2.567 −4.537 −0.597 0.01351 <0.001 −4.163 −5.243 −3.082 <0.00154 <0.001 −2.413 −2.901 −1.924 <0.001
41 0.865 −0.406 −5.265 4.453 0.80794 0.053 −0.738 −1.213 −0.263 0.01051 0.015 −2.497 −3.118 −1.876 0.01273 0.001 −0.638 −0.880 −0.396 0.00170 0.044 −0.039 −0.412 0.333 0.80507 0.104 −0.287 −4.139 3.565 0.51822 <0.001 0.202 −0.072 0.475 0.133

800
N.
Noisel
et al.
/ International
Journal of
Hygiene
and Environm
ental H
ealth 217
(2014) 796–804
Fig. 1.
(A)
Regression
equation
s betw
een Se
intakes
(ISe ) in
�g/d
and
Se con
centra-
tions
in w
hole
blood (B
Se ) an
d p
lasma
(PSe )
in �
g/L. Filled
squares
(�,
n =
18) an
dcon
tinu
ous
line
(—)
represen
t exp
erimen
tal d
ata an
d regression
equation
for B
Se ;U
nfi
lled circles
(©,
n =
30) an
d d
ashed
line
(- -
-) rep
resent
experim
ental
data
and
regression equ
ation for
PSe .
(B)
Regression
equation
s betw
een Se
intakes
(ISe ) in
�g/d
and
Se con
centration
s in
hair
(HSe )
and
toenail
(TSe )
in �
g/g. Filled
squares
(�,
n =
8) an
d con
tinu
ous
line
(—)
represen
t exp
erimen
tal d
ata an
d regression
equation
for H
Se ; u
nfi
lled circles
(©,
n =
9) an
d d
ashed
line
(- -
-) rep
resent
experim
ental
data
and
regression equ
ation for
TSe .
(C)
Regression
equation
s betw
een Se
intakes
(ISe )in
�g/d
and
Se u
rinary
excretion rates
U1
Sein
�g/d
. Filled
squares
(�,
n =
17) an
dcon
tinu
ous
line
(—)
represen
t exp
erimen
tal d
ata an
d regression
equation
for U
1Se .
imp
ortant
rate of
increase
at h
igh blood
levels (Figs.
2A–C
). Sim
i-lar
relationsh
ips
were
observed betw
een P
Se , T
Sean
d U
Se , w
heth
erexp
ressed in
�g/d
, �
g/L or
�g/g
creat (Figs.
3A an
d 3B
).
Application
of the
regression equations
to independent
Se data
sets
Table 3
and
Fig. 2
presen
t tw
o in
dep
end
ent
sets of
biologicald
ata th
at w
ere n
ot in
clud
ed for
the
derivation
of m
athem
aticalalgorith
ms.
Usin
g th
e d
erived algorith
ms,
ISew
ere recon
structed
from d
ifferent
biological m
atrix m
easurem
ents.
In on
e case,
in
Table 3Se intake reconstructed using Se biological monitoring data from independent data sets and the derived algorithms.
Fishermen study in Noisel et al. (2011) Volunteers study in Noisel et al. (2010) a
n AM ± SD GM ± GSD Med Range n AM± SD GM± GSD Med Range
Characteristics of theparticipants
Age (y) 23 43.2 ± 7.68 42.4 ± 1.22 44 24–56 10 27.3 ± 3.40 27.1 ± 1.13 26 23–34Gender (n, % men) 23 83% 10 20%Height (m) 23 1.75 ± 0.08 1.75 ± 1.05 1.78 1.60–1.92 10 1.68 ± 0.07 1.68 ± 1.04 1.69 1.57–1.75Weight (kg) 23 79.1 ± 13.3 78.0 ± 1.19 79.2 56.6–104 10 71.9 ± 19.7 69.8 ± 1.29 69.6 47.7–117
Biological data BSe (�g/L) 22 198.1 ± 14.2 197.6 ± 1.07 197.4 173.7–221.1 10 177.2 ± 22.4 176.0 ± 1.13 173.2 150.8–215.5PSe (�g/L) 22 125.6 ± 10.9 125.2 ± 1.09 126.3 110.5–142.1HSe (�g/g)b 23 0.5 ± 0.1 0.5 ± 1.1 0.5 0.4–0.7 8 5.63 ± 11.3 1.86 ± 3.93 0.94 0.69–33.35U1Se (�g/d) 10 76.3 ± 28.9 70.4 ± 1.57 84.5 30.2–128.2U2Se (�g/L)c 10 56.9 ± 14.4 54.7 ± 1.37 56.0 25.3–72.1TSe (�g/g) 6 1.12 ± 0.15 1.11 ± 1.14 1.17 0.93–1.27
Reconstructed Se intake(�g/d) from biologicalmeasurements
BSe 22 126. 0 ± 14.0 125.2 ± 1.12 125.0 102.5–149.1 10 106.4 ± 21.3 104.6 ± 1.21 102.0 82.2–143.3PSe 22 102.9 ± 16.9 101.5 ± 1.18 103.4 80.1–129.5HSe 23 79.1 ± 9.10 78.6 ± 1.12 73.1 59.2–100.5 8 678.7 ± 1299 253.0 ± 3.6 132.1 99.0–3858U1Se 10 126.3 ± 46.1 117.3 ± 1.54 139.7 52.2–208.0U2Se 10 200.7 ± 35.5 197.3 ± 1.23 200.3 119.5–236.0TSe 6 165.6 ± 13.0 165.2 ± 1.08 170.6 148.6–178.6
a Data correspond to background Se level prior to intervention, with the exception of hair samples.b Hair concentrations represent the values for the centimeter closest to the root, i.e. the most recent month prior to sampling.c Based on 12-h urinary samples.

N. Noisel et al. / International Journal of Hygiene and Environmental Health 217 (2014) 796–804 801
Fig. 2. (A) Regression equations between Se in whole blood (BSe) and Se in plasma(PSe) in �g/L. Filled squares (�, n = 42) and continuous line (—) represent exper-imental data and regression equation for all groups. Crosses (X, n = 22) representindependent Se data from fishermen (Noisel et al., 2011). (B) Regression equa-tions between Se in whole blood (BSe) in �g/L and Se concentrations in hair (HSe)and toenails (TSe) in �g/g. Filled squares (�, n = 11) and continuous line (—) repre-sent experimental data and regression equation for HSe; unfilled circles (©, n = 12)and dashed line (- - -) represent experimental data and regression equation for TSe.Crosses (X, n = 22) represent Se data from fishermen (Noisel et al., 2011). White dia-monds (♦, n = 7) and black triangles (�, n = 5) represent Se data for hair and toenailsrespectively from volunteers exposed to Se-containing shampoo (Noisel et al., 2010).One outsider (TSe = 33 �g/g) was not included. (C) Regression equations between Sein whole blood (BSe) in �g/L and Se in urine (U1Se in �g/d and U2Se in �g/L). Filledsquares (�, n = 14) and continuous line (—) represent experimental data and regres-sion equation for U1Se; unfilled circles (©, n = 11) and dashed line (- - -) representexperimental data and regression equation for U2Se. Crosses (X, n = 10) represent Sed(
filfiwt
Fig. 3. (A) Regression equations between Se in plasma (PSe) in �g/L and Se in toenail(TSe) in �g/g. Filled squares (�, n = 12) and continuous line (—) represent experimen-tal data and regression equation for all groups. (B) Regression equations betweenSe in plasma (PSe) in �g/L and Se in urine (U1Se in �g/d and U2Se in �g/L). Filled
physiological function and homeostasis. Plasma concentrations
ata for urinary excretion rates from volunteers exposed to Se-containing shampooNoisel et al., 2010).
shermen, ISe calculated from the hair matrix levels appear to beower than from whole blood or plasma matrices. However, good
ts were obtained between predicted and observed BSe and PSe dataithin the observed range (Fig. 2A). In the other case, in volunteersreated with Se containing shampoo, ISe calculated from hair levels
squares (�, n = 35) and continuous line (—) represent experimental data and regres-sion equation for U1Se; unfilled circles (©, n = 22) and dashed line (- - -) representexperimental data and regression equation for U2Se.
seem to be overestimated by 3- to 6-fold compared to back cal-culated intakes from BSe, USe and TSe Se levels, indicating externalcontamination of hair (Noisel et al., 2010).
Discussion
This study provided tools to enhance Se biomonitoring inter-pretation and to estimate Se intakes from biomonitoring data.The derived mathematical algorithms provided matrix-to-matrixequivalents of Se levels. The algorithms were established frompooled biological data published in 75 studies, thus covering alarge range of Se values in various populations around the world.Given that arithmetic means were not available for some of theselected studies (n = 6), the use of other indicators of central ten-dency (geometric mean or median) could have had a mild effecton the presented results. Ideally, such approach deserves to beperformed on original raw data which were not available.
The mathematical algorithms derived from pooled biologicaldata help to assess Se kinetics in the human body. First, the resultsshow no evidence of gender differences in Se distribution as itwas reported in previous studies with smaller sample size mea-suring PSe (n comprised between 44 and 506) (Letsiou et al., 2009;Lymbury et al., 2008; Navarro-Alarcon et al., 1998; Shortt et al.,1997; Swanson et al., 1990)). Blood and plasma profiles indicatethat Se is primarily retained in the blood compartment, to insure
reach a plateau at lower intake than blood concentrations (around150 �g/L), reducing its sensitivity as a biomarker of exposure. Thisplateau reflects the saturation of the carrier capacity of plasma

8 ne an
(cban
tShF(tewnTiu
Btaanbmb2oSeuUvpnvp
TP
02 N. Noisel et al. / International Journal of Hygie
Barceloux, 1999). Furthermore, the difference between PSe and BSean be explained by the role of erythrocytes and their capacity toind Se (Se scavengers). At low ISe (below 50 �g/d), BSe and PSere not statistically different. In these cases, intakes hardly satisfyutritional requirements and are insufficient for Se to be stored.
In general, the slope factor values close to 1 derived from matrix-o-matrix correlation analysis support the idea of a proportionale distribution among matrices. This proportionality phenomenonas been observed for HSe and TSe in relation to ISe or BSe (Table 2,igs. 1B, 2B, and 3A), and was also reported in the study of Hac et al.2002). However, some experimental points are located outside ofhe confidence intervals (Figs. 1B and 2B) suggesting either a differ-nt distribution relationship between blood and integuments thatas not apparent within the assessed value range or concomitanton-dietary source of Se as previously reported (Noisel et al., 2010).hese outlier data come from Chinese peasants with medium Sentakes (Yang et al., 1989) and the actual source of Se exposure isnclear.
Urinary profiles also helped to illustrate Se distribution. At lowSe or PSe levels, Se elimination seems to be restrained to main-ain a pool responding to physiological and functional needs. Above
threshold that can be considered as an optimal level (probablyround 200–250 �g/L for blood and 100–150 �g/L for plasma), uri-ary Se is enhanced and tends to show a high correlation withlood and plasma levels (Robberecht and Deelstra, 1984a). Thisay explain the lack of significant linear correlation between
lood/plasma and urine observed in another study (Chen et al.,006). Urinary Se excretion mainly reflects the unbound fractionf Se in plasma originating from the regulated pathway. At highe levels, unbound fraction exceeds bound-Se and facilitates Sexcretion. Similar correlation results were obtained whatever thenits of expression of urinary results (U1Se in �g/d, U2Se in �g/L or3Se in �g/g creat.). However, the last two indicators show moreariability than the first one (greater dispersion of experimentaloints, wider confidence interval of the slope factor values) or do
ot provide significant regression parameters (U2Se and ISe). Thisariability can be explained by the diuresis variation during a 24-heriod as well as the notable effect of water intake and hydrationable 4ublished algorithms on Se disposition in biological compartments and daily intakes.
Study n Gender Rangea
Chen et al. (1980) 200 NSb 0.02–0.9Hac et al. (2002)d 34 NS 0.1–0.6
Haldimann et al. (1996) 17 NS 20–120
Hawkes et al. (2008)d 42 M 50–550
Jenny-Burri et al. (2010) ∼33 NS 10–100
Longnecker et al. (1996)d 77 NS 0.32–6.0Raghunath et al. (2002)d 69 NS 15–190
Schrauzer and White (1978) N/A NS 100–600Valentine et al. (1978)d 30 NS 21.5–20Valentine et al. (1978)d 34 NS 21.5–20Valentine et al. (1978)d 37 NS 133–240Wasowicz and Zachara (1987)d 62 NS 56.4–14Wasowicz and Zachara (1987)d 62 NS 42.2–11Yang and Xia (1995) (adapted from Yang et al. (1989)) N/A NS N/A
Yang et al. (1989)d N/A NS 4–3000
Yang et al. (1989)d 167 M 5–4000
Yang et al. (1989)d 44 NS 40–1700Yang et al. (1989)d 219 M 20–3000Yang et al. (1989)d 81 NS 10–3000Yang et al. (1989)d 80 M 5–1500
Yang et al. (1989)d N/A NS N/A
Yang et al. (1989)d N/A NS N/A
a Based on the independent variable (x).b NS means not specified.c N/A means not available.d Studies included in the meta-analysis.e SSe is considered to be equivalent to PSe.
d Environmental Health 217 (2014) 796–804
rates on Se concentrations in spot urine samples. By combining alarge number of experimental data in the current work, one mayassume that the effect of diuresis or hydration tends to fade out.However, since urinary concentrations, corrected or not for creati-nine, are still influenced by the diuresis or hydration level, theyare more prone to variability than daily excretion. For this rea-son, Se urinary excretion rates (12-h or 24-h) would provide moreaccurate data, as other authors already recommended (Ohira et al.,2008; Robberecht and Deelstra, 1984a). Since Se urinary excretions(U1Se) are more frequently reported than other Se urinary indica-tors (U2Se and U3Se), the use of 12-h or 24-h urinary excretion inbiomonitoring studies would contribute to a better harmonizationof Se data.
Graphical representation of two independent sets of datashowed that the studied subgroups of Quebec populations had val-ues falling within the mean range of exposure reported worldwide(Fig. 2). For the fishermen study, the BSe/PSe concentration ratiowas similar to the value of 1.5 reported by Dumont et al. (2006). Inaddition, in the volunteers study, the ISe/USe ratio reached approx-imately 0.5 as reported by other authors (Dumont et al., 2006;Griffiths et al., 1976; Longnecker et al., 1996; Navarro-Alarcon andCabrera-Vique, 2008; Robinson et al., 1973; Thomson, 1998). Inter-estingly, similar ISe were reconstructed from Se concentrations indifferent biological matrices, except those derived from HSe. Theseresults confirm the need to carefully document and control sourcesof exposure when using hair as a biomarker of exposure.
Some authors have previously published regression equationslinking Se levels in different matrices with Se intakes (Table 4).These regressions relied on a small number of data, generallyincluded a limited number of biological matrices and were validover a narrow range of values. Some of the proposed equationsare linear and fit well with our algorithms over a restricted range(Haldimann et al., 1996; Jenny-Burri et al., 2010; Raghunath et al.,2002; Schrauzer and White, 1978; Wasowicz and Zachara, 1987).Other linear equations are very far from our results and this can be
due to different data sets used to derive equations, especially whenthe study was not included in our analysis (Chen et al., 1980). How-ever, several authors proposed log-log regressions with parametersMathematic algorithm r or r2 p
Log BSe (ppm) = 1.243 HSe (ppm) − 1.219 N/Ac N/APSe (�g/L) = 64.164 HSe (�g/g) + 52.515 r = 0.39 p < 0.05SSe (�g/L)e = 1.12 ISe (�g/d) + 23 N/A N/AU1Se (�g/d) = 0.152 ISe (�g/d) + 37.3 r2 = 0.14 <0.001SSe (�g/L) = 1.04 ISe (�g/d) + 30.34 N/A N/A
9 Ln ISe (�mol/d) = 0.67 Ln U1Se (�mol/d) + 0.532 r2 = 0.74 N/ASSe (ng/mL) = 0.6275 ISe (�g/d) + 59.85 r = 0.89 N/A
BSe(mg/L) = 9.057 × 10⁻⁴ ISe (�g/d) + 0.0595 r = 0.995 p < 0.0013 HSe (�g/g) = 0.07 + 0.0045 U2Se (�g/L) r = 0.65 p < 0.0013 BSe (�g/100 mL) = 15.5 + 0.02 U2Se (�g/L) r = 0.40 p < 0.05
HSe (�g/g) = -0.25 + 0.04 BSe (�g/100 mL) r = 0.28 p > 0.059.6 U3Se (�g/g creat.) = 0.16 BSe (�g/L) − 2.89 r = 0.492 p < 0.0013.8 U3Se (�g/g creat.) = 0.21 PSe (�g/L) − 3.64 r = 0.516 p < 0.001
Log ISe (�g/d) = 1.624 Log PSe (mg/L) + 3.389 N/A N/ABSe (mg/L) = 8.230 × 10⁻⁴ ISe (�g/d) + 0.176 r = 0.862 p < 0.001Log BSe (mg/L) = 0.767 Log ISe (�g/d) − 2.248 r = 0.962 p < 0.001
Log U1Se (�g/d) = 1.021 Log ISe (�g/d) − 0.418 r = 0.886 p < 0.001 Log HSe (mg/kg) = 1.143 Log BSe (mg/L) + 0.844 r = 0.952 p < 0.001 Log TSe (mg/kg) = 1.077 Log BSe (mg/L) + 0.9 r = 0.849 p < 0.001
Log U1Se (�g/d) = 1.658 Log PSe (mg/L) + 3.042 r = 0.968 p < 0.001Log ISe (�d/d) = 0.840 Log HSe (mg/kg) − 1.552 N/A N/ALog HSe (mg/kg) = 0.795 Log TSe (mg/kg) + 0.045 N/A N/A

ne an
vi(01bdeoOwdrs
ea2isatdrtBrhbaan
csiosc
C
wotawatd
A
f2
R
A
A
A
N. Noisel et al. / International Journal of Hygie
ery similar to ours. After unit harmonization, slope factor andntercept values related to Se intakes as published by Yang et al.1989) were respectively 0.767 and 0.752 for blood and 0.616 and.932 for plasma as compared to 0.643 and 0.947, and 0.523 and.048 for our results. Interestingly, these equations cover a veryroad range of Se exposure values (until 3000 and 4000 �g/d). Weid not include such extreme values to avoid influencing the math-matical algorithms with data located in a toxic range. However,ur algorithms probably remain valid outside the studied range.ur intake-urinary excretion regression results also compare wellith those of Longnecker et al. (1996). Conversely, there were someiscrepancies between our Se intake-hair concentration regressionesults and the regression equation of Yang et al. (1989), most plau-ibly due to the afore-mentioned concomitant non dietary sources.
Bioavailability of Se varies significantly according to the differ-nt chemical forms in food. Thus, Se concentrations in plasma varyccording to the diet (omnivorous or vegetarian) (Hoeflich et al.,010; Srikumar et al., 1992). Unlike organic forms, inorganic Se
s not incorporated into plasma or erythrocytes through a non-pecific pathway (Elsom et al., 2006). Thus, variations in Se statusnd distribution can be explained by the type, origin and composi-ion of the consumed food (Barceloux, 1999). In a similar manner,ose and speciation of Se are also critical determinants of biologicalesponse at the cellular level. This is important when consideringhe antioxidant role of Se and its protective effect against cancer (El-ayoumy, 2001), given the growing evidence that over a certainange, Se intakes above the normal nutritional range may conferealth benefits (Elsom et al., 2006). For this reason, it would haveeen interesting to carry out the analysis on Se speciation data. Thisttempt would have helped deriving recommended dietary intakesdapted to different ranges of the functional Se status. Unfortu-ately, such data are not currently available.
The broad range of application of the derived algorithms mayontribute to establish harmonized biological reference valuesince no “normal” reference range exists to date, due to elevatednter-country variability. Finally, one should note the importancef pursuing Se biomonitoring in multiple matrices in relation topecific aspects of Se status. Each matrix contributes partially to aomprehensive understanding of Se disposition.
onclusion
Overall, this study shows the potential of a novel approach,hich consists in pooling biological data of Se monitoring in
rder to derive mathematical algorithms (i) relating Se intakeso biological concentrations and (ii) establishing matrix-to-matrixssociations. This approach considers total Se exposure through aide range of Se levels and is easily applicable to population-based
s well as individual-based level. More data are needed to applyhis approach to specific Se compounds and better understand theirisposition according to dietary sources.
ppendix A. Supplementary data
Supplementary data associated with this article can beound, in the online version, at http://dx.doi.org/10.1016/j.ijheh.014.04.005.
eferences
l-Saleh, I., Billedo, G., 2006. Determination of selenium concentration in serumand toenail as an indicator of selenium status. Bull. Environ. Contam. Toxicol.77, 155–163.
ngerer, J., Ewers, U., Wilhelm, M., 2007. Human biomonitoring: state of the art. Int.J. Hyg. Environ. Health 210, 201–228.
nttolainen, M., Valsta, L.M., Alfthan, G., Kleemola, P., Salminen, I., Tamminen, M.,1996. Effect of extreme fish consumption on dietary and plasma antioxidantlevels and fatty acid composition. Eur. J. Clin. Nutr. 50, 741–746.
d Environmental Health 217 (2014) 796–804 803
Anwar, M., Ando, T., Maaz, A., Ghani, S., Munir, M., Qureshi, I.U., Naeem, S., Tsuji, M.,Wakamiya, J., Nakano, A., Akiba, S., 2007. Scalp hair mercury concentrations inPakistan. Environ. Sci. 14, 167–175.
Barany, E., Bergdahl, I.A., Bratteby, L.E., Lundh, T., Samuelson, G., Skerfving, S., Oskars-son, A., 2003. Mercury and selenium in whole blood and serum in relation to fishconsumption and amalgam fillings in adolescents. J. Trace Elem. Med. Biol. 17,165–170.
Barceloux, D.G., 1999. Selenium. J. Toxicol. Clin. Toxicol. 37, 145–172.Bencko, V., 1995. Use of human hair as a biomarker in the assessment of exposure to
pollutants in occupational and environmental settings. Toxicology 101, 29–39.Bocca, B., Madeddu, R., Asara, Y., Tolu, P., Marchal, J.A., Forte, G., 2011. Assessment
of reference ranges for blood Cu, Mn, Se and Zn in a selected Italian population.J. Trace Elem. Med. Biol. 25, 19–26.
Brown, K.M., Arthur, J.R., 2001. Selenium, selenoproteins and human health: areview. Public Health Nutr. 4, 593–599.
Burri, J., Haldimann, M., Dudler, V., 2008. Selenium status of the Swiss popu-lation: assessment and change over a decade. J. Trace Elem. Med. Biol. 22,112–119.
Cardoso, B.R., Ong, T.P., Jacob-Filho, W., Jaluul, O., Freitas, M.I. d.Á., Cozzolino, S.M.F.,2010. Nutritional status of selenium in Alzheimer’s disease patients. Br. J. Nutr.103, 803–806.
Cerna, M., Krskova, A., Cejchanova, M., Spevackova, V., 2012. Human biomonitoringin the Czech Republic: an overview. Int. J. Hyg. Environ. Health 215, 109–119.
Cerna, M., Spevackova, V., Batariova, A., Smid, J., Cejchanova, M., Ocadlikova, D.,Bavorova, H., Benes, B., Kubinova, R., 2007. Human biomonitoring system in theCzech Republic. Int. J. Hyg. Environ. Health 210, 495–499.
Chen, C., Qu, L., Zhao, J., Liu, S., Deng, G., Li, B., Zhang, P., Chai, Z., 2006. Accumulationof mercury, selenium and their binding proteins in porcine kidney and liverfrom mercury-exposed areas with the investigation of their redox responses.Sci. Total Environ. 366, 627–637.
Chen, X., Yang, G., Chen, J., Chen, X., Wen, Z., Ge, K., 1980. Studies on the relations ofselenium and Keshan disease. Biol. Trace Elem. Res. 2, 91–107.
Driskell, J.A., Giraud, D.W., Drewel, B.T., Davy, S.R., 2006. Dietary intakes and plasmaconcentrations of vitamin C, selenium, and carotenoids of a group of preschoolchildren. Nutr. Res. 26, 23–26.
Duffield, A.J., Thomson, C.D., 1999. A comparison of methods of assessment of dietaryselenium intakes in Otago, New Zealand. Br. J. Nutr. 82, 131–138.
Dumont, E., Vanhaecke, F., Cornelis, R., 2006. Selenium speciation from food sourceto metabolites: a critical review. Anal. Bioanal. Chem. 385, 1304–1323.
El-Bayoumy, K., 2001. The protective role of selenium on genetic damage and oncancer. Mutat. Res. 475, 123–139.
Ellingsen, D.G., Thomassen, Y., Rustad, P., Molander, P., Aaseth, J., 2009. Thetime-trend and the relation between smoking and circulating selenium con-centrations in Norway. J. Trace Elem. Med. Biol. 23, 107–115.
Elsom, R., Sanderson, P., Hesketh, J.E., Jackson, M.J., Fairweather-Tait, S.J., Akesson,B., Handy, J., Arthur, J.R., 2006. Functional markers of selenium status: UK FoodStandards Agency workshop report. Br. J. Nutr. 96, 980–984.
Fan, A.M., Kizer, K.W., 1990. Selenium. Nutritional, toxicologic, and clinical aspects.West. J. Med. 153, 160–167.
Francesconi, K.A., Pannier, F., 2004. Selenium metabolites in urine: a criticaloverview of past work and current status. Clin. Chem. 50, 2240–2253.
Griffiths, N.M., Stewart, R.D., Robinson, M.F., 1976. The metabolism of[75Se]selenomethionine in four women. Br. J. Nutr. 35, 373–382.
Hac, E., Krechniak, J., Szyszko, M., 2002. Selenium levels in human plasma and hairin northern Poland. Biol. Trace Elem. Res. 85, 277–285.
Haldimann, M., Venner, T.Y., Zimmerli, B., 1996. Determination of selenium in theserum of healthy Swiss adults and correlation to dietary intake. J. Trace Elem.Med. Biol. 10, 31–45.
Hambidge, M., 2003. Biomarkers of trace mineral intake and status. J. Nutr. 133,948S–955S.
Hawkes, W.C., Richter, B.D., Alkan, Z., Souza, E.C., Derricote, M., Mackey, B.E., Bon-nel, E.L., 2008. Response of selenium status indicators to supplementation ofhealthy North American men with high-selenium yeast. Biol. Trace Elem. Res.122, 107–121.
Herbette, S., Roeckel-Drevet, P., Drevet, J.R., 2007. Seleno-independent glutathioneperoxidases. More than simple antioxidant scavengers. FEBS J. 274, 2163–2180.
Hoeflich, J., Hollenbach, B., Behrends, T., Hoeg, A., Stosnach, H., Schomburg, L., 2010.The choice of biomarkers determines the selenium status in young Germanvegans and vegetarians. Br. J. Nutr. 104, 1601–1604.
Hol, P.J., Vamnes, J.S., Gjerdet, N.R., Eide, R., Isrenn, R., 2001. Dental amalgam andselenium in blood. Environ. Res. 87, 141–146.
Hol, P.J., Vamnes, J.S., Gjerdet, N.R., Eide, R., Isrenn, R., 2003. Copper, zinc,and selenium in human blood and urine after injection of sodium 2,3-dimercaptopropane-1-sulfonate: a study on subjects with dental amalgam. Biol.Trace Elem. Res. 91, 19–31.
Holben, D.H., Smith, A.M., 1999. The diverse role of selenium within selenoproteins:a review. J. Am. Diet. Assoc. 99, 836–843.
INSPQ, 2004. Étude sur l’établissement de valeurs de référence d’éléments traces etde métaux dans le sang, le sérum et l’urine de la population de la grande régionde Québec, Institut national de santé publique du Québec, 38 p. + annexes.
Janghorbani, M., Xia, Y., Ha, P., Whanger, P.D., Butler, J.A., Olesik, J.W., Daniels, L.,
1999. Metabolism of selenite in men with widely varying selenium status. J.Am. Coll. Nutr. 18, 462–469.Jenny-Burri, J., Haldimann, M., Dudler, V., 2010. Estimation of selenium intake inSwitzerland in relation to selected food groups. Food Addit. Contam. A Chem.Anal. Control Expo. Risk Assess. 27, 1516–1531.

8 ne an
K
K
K
K
L
L
L
L
L
L
L
L
L
M
M
M
M
M
M
N
N
N
N
N
N
O
O
Yang, G.Q., Wang, S.Z., Zhou, R.H., Sun, S.Z., 1983. Endemic selenium intoxication of
04 N. Noisel et al. / International Journal of Hygie
azi, T.G., Kandhro, G.A., Sirajuddin, Afridi, H.I., Baig, J.A., Shah, A.Q., Wadhwa, S.K.,Khan, S., Kolachi, N.F., Shaikh, H.U., 2010. Evaluation of iodine, iron, and seleniumin biological samples of thyroid mother and their newly born babies. Early Hum.Dev. 86, 649–655.
im, Y.J., Galindev, O., Sei, J.H., Bae, S.M., Im, H., Wen, L., Seo, Y.R., Ahn, W.S., 2009.Serum selenium level in healthy Koreans. Biol. Trace Elem. Res. 131, 103–109.
lapec, T., Mandic, M.L., Grgic, J., Primorac, L., Ikic, M., Lovric, T., Grgic, Z., Herceg, Z.,1998. Daily dietary intake of selenium in eastern Croatia. Sci. Total Environ. 217,127–136.
omaromy-Hiller, G., Ash, K.O., Costa, R., Howerton, K., 2000. Comparison of rep-resentative ranges based on U.S. patient population and literature referenceintervals for urinary trace elements. Clin. Chim. Acta 296, 71–90.
eBlanc, A., Dumas, P., Lefebvre, L., 1999. Trace element content of commercial sham-poos: impact on trace element levels in hair. Sci. Total Environ. 229, 121–124.
etsiou, S., Nomikos, T., Panagiotakos, D., Pergantis, S.A., Fragopoulou, E.,Antonopoulou, S., Pitsavos, C., Stefanadis, C., 2009. Serum total selenium sta-tus in Greek adults and its relation to age. The ATTICA study cohort. Biol. TraceElem. Res. 128, 8–17.
evander, O.A., Moser, P.B., Morris, V.C., 1987. Dietary selenium intake and sele-nium concentrations of plasma, erythrocytes, and breast milk in pregnant andpostpartum lactating and nonlactating women. Am. J. Clin. Nutr. 46, 694–698.
ongnecker, M.P., Stampfer, M.J., Morris, J.S., Spate, V., Baskett, C., Mason, M., Wil-lett, W.C., 1993. A 1-y trial of the effect of high-selenium bread on seleniumconcentrations in blood and toenails. Am. J. Clin. Nutr. 57, 408–413.
ongnecker, M.P., Stram, D.O., Taylor, P.R., Levander, O.A., Howe, M., Veillon, C.,McAdam, P.A., Patterson, K.Y., Holden, J.M., Morris, J.S., Swanson, C.A., Willett,W.C., 1996. Use of selenium concentration in whole blood, serum, toenails, orurine as a surrogate measure of selenium intake. Epidemiology 7, 384–390.
ongnecker, M.P., Taylor, P.R., Levander, O.A., Howe, M., Veillon, C., McAdam, P.A.,Patterson, K.Y., Holden, J.M., Stampfer, M.J., Morris, J.S., et al., 1991. Selenium indiet, blood, and toenails in relation to human health in a seleniferous area. Am.J. Clin. Nutr. 53, 1288–1294.
opez, R.E., Knable Jr., A.L., Burruss, J.B., 2010. Ingestion of a dietary supplementresulting in selenium toxicity. J. Am. Acad. Dermatol. 63, 168–169.
orenzo Alonso, M.J., Bermejo Barrera, A., Cocho de Juan, J.A., Fraga Bermudez, J.M.,Bermejo Barrera, P., 2005. Selenium levels in related biological samples: humanplacenta, maternal and umbilical cord blood, hair and nails. J. Trace Elem. Med.Biol. 19, 49–54.
ymbury, R., Tinggi, U., Griffiths, L., Rosenfeldt, F., Perkins, A.V., 2008. Selenium statusof the Australian population: effect of age, gender and cardiovascular disease.Biol. Trace Elem. Res. 126 Suppl (1), S1–S10.
acFarquhar, J.K., Broussard, D.L., Melstrom, P., Hutchinson, R., Wolkin, A., Martin,C., Burk, R.F., Dunn, J.R., Green, A.L., Hammond, R., Schaffner, W., Jones, T.F., 2010.Acute selenium toxicity associated with a dietary supplement. Arch. Intern. Med.170, 256–261.
ahapatra, S., Tripathi, R.M., Raghunath, R., Sadasivan, S., 2001. Daily intake of Seby adult population of Mumbai, India. Sci. Total Environ. 277, 217–223.
annisto, S., Alfthan, G., Virtanen, M., Kataja, V., Uusitupa, M., Pietinen, P., 2000.Toenail selenium and breast cancer – a case–control study in Finland. Eur. J.Clin. Nutr. 54, 98–103.
ayne, S.T., Wright, M.E., Cartmel, B., 2004. Assessment of antioxidant nutrientintake and status for epidemiologic research. J. Nutr. 134, 3199S–3200S.
orris, J.S., Stampfer, M.J., Willett, W., 1983. Dietary selenium in humans toenailsas an indicator. Biol. Trace Elem. Res. 5, 529–537.
ozaffarian, D., 2009. Fish, mercury, selenium and cardiovascular risk: current evi-dence and unanswered questions. Int. J. Env. Res. Public Health 6, 1894–1916.
avarro-Alarcon, M., Cabrera-Vique, C., 2008. Selenium in food and the human body:a review. Sci. Total Environ. 400, 115–141.
avarro-Alarcon, M., de la Serrana, H.L., Perez-Valero, V., Lopez-Martinez, C., 1998.Serum selenium levels as indicators of body status in cancer patients and theirrelationship with other nutritional and biochemical markers. Sci. Total Environ.212, 195–202.
iskar, A.S., Paschal, D.C., Kieszak, S.M., Flegal, K.M., Bowman, B., Gunter, E.W.,Pirkle, J.L., Rubin, C., Sampson, E.J., McGeehin, M., 2003. Serum selenium levelsin the US population: third National Health and Nutrition Examination Survey,1988–1994. Biol. Trace Elem. Res. 91, 1–10.
oisel, N., Bouchard, M., Carrier, G., 2010. Disposition kinetics of selenium in healthyvolunteers following therapeutic shampoo treatment. Environ. Toxicol. Pharma-col. 29, 252–259.
oisel, N., Bouchard, M., Carrier, G., Plante, M., 2011. Comparison of a toxicokineticand a questionnaire-based approach to assess methylmercury intake in exposedindividuals. J. Expo. Sci. Environ. Epidemiol. 21, 328–335.
RC, 2000. Dietary Reference Intakes for Vitamin C, Vitamin E, Selenium, andCarotenoids. National Academy Press, Washington, DC.
hira, S., Kirk, A.B., Dyke, J.V., Dasgupta, P.K., 2008. Creatinine adjustment of spoturine samples and 24 h excretion of iodine, selenium, perchlorate, and thio-
cyanate. Environ. Sci. Technol. 42, 9419–9423.vaskainen, M.L., Virtamo, J., Alfthan, G., Haukka, J., Pietinen, P., Taylor, P.R., Hut-tunen, J.K., 1993. Toenail selenium as an indicator of selenium intake amongmiddle-aged men in an area with low soil selenium. Am. J. Clin. Nutr. 57,662–665.
d Environmental Health 217 (2014) 796–804
Palmer, I.S., Olson, O.E., Ketterling, L.M., Shank, C.E., 1983. Selenium intake and uri-nary excretion in persons living near a high selenium area. J. Am. Diet. Assoc. 82,511–515.
Papp, L.V., Lu, J., Holmgren, A., Khanna, K.K., 2007. From selenium to selenoproteins:synthesis, identity, and their role in human health. Antioxid. Redox Signal. 9,775–806.
Portal, B., Richard, M.J., Ducros, V., Aguilaniu, B., Brunel, F., Faure, H., Gout, J.P., Bost,M., Favier, A., 1993. Effect of double-blind crossover selenium supplementationon biological indices of selenium status in cystic fibrosis patients. Clin. Chem.39, 1023–1028.
Pourmand, G., Salem, S., Moradi, K., Nikoobakht, M.R., Tajik, P., Mehrsai, A., 2008.Serum selenium level and prostate cancer: a case–control study. Nutr. Cancer60, 171–176.
Raghunath, R., Tripathi, R.M., Mahapatra, S., Sadasivan, S., 2002. Selenium levels inbiological matrices in adult population of Mumbai, India. Sci. Total Environ. 285,21–27.
Rasmussen, L.B., Hollenbach, B., Laurberg, P., Carlé, A., Hög, A., Jørgensen, T., Vejbjerg,P., Ovesen, L., Schomburg, L., 2009. Serum selenium and selenoprotein P statusin adult Danes – 8-year followup. J. Trace Elem. Med. Biol. 23, 265–271.
Ravn-Haren, G., Bugel, S., Krath, B.N., Hoac, T., Stagsted, J., Jorgensen, K., Bresson,J.R., Larsen, E.H., Dragsted, L.O., 2008. A short-term intervention trial with sele-nate, selenium-enriched yeast and selenium-enriched milk: effects on oxidativedefence regulation. Br. J. Nutr. 99, 883–892.
Ravoori, S., Srinivasan, C., Pereg, D., Robertson, L.W., Ayotte, P., Gupta, R.C., 2010.Protective effects of selenium against DNA adduct formation in Inuit environ-mentally exposed to PCBs. Environ. Int. 36, 980–986.
Robberecht, H.J., Deelstra, H.A., 1984a. Selenium in human urine: concentrationlevels and medical implications. Clin. Chim. Acta 136, 107–120.
Robinson, M.F., McKenzie, J.M., Tomson, C.D., van Rij, A.L., 1973. Metabolic balance ofzinc, copper, cadmium, iron, molybdenum and selenium in young New Zealandwomen. Br. J. Nutr. 30, 195–205.
Saiki, M., Jaluul, O., Sumita, N.M., Vasconcellos, M.B., Jacob Filho, W., 2007. Traceelement contents in serum of healthy elderly population of metropolitan SaoPaulo area in Brazil. J. Trace Elem. Med. Biol. 21 (Suppl. 1), 70–73.
Sanchez, C., Lopez-Jurado, M., Aranda, P., Llopis, J., 2010. Plasma levels of copper,manganese and selenium in an adult population in southern Spain: influence ofage, obesity and lifestyle factors. Sci. Total Environ. 408, 1014–1020.
Schrauzer, G.N., White, D.A., 1978. Selenium in human nutrition: dietary intakes andeffects of supplementation. Bioinorg. Chem. 8, 303–318.
Serra-Majem, L., Pfrimer, K., Doreste-Alonso, J., Ribas-Barba, L., Sanchez-Villegas, A.,Ortiz-Andrellucchi, A., Henriquez-Sanchez, P., 2009. Dietary assessment meth-ods for intakes of iron, calcium, selenium, zinc and iodine. Br. J. Nutr. 102 (Suppl.1), S38–S55.
Shortt, C.T., Duthie, G.G., Robertson, J.D., Morrice, P.C., Nicol, F., Arthur, J.R., 1997.Selenium status of a group of Scottish adults. Eur. J. Clin. Nutr. 51, 400–404.
Slotnick, M.J., Nriagu, J.O., 2006. Validity of human nails as a biomarker of arsenicand selenium exposure: a review. Environ. Res. 102, 125–139.
Soares, M.C., Sarkis, J.E., Muller, R.C., Brabo, E.S., Santos, E.O., 2002. Correlationbetween mercury and selenium concentrations in Indian hair from RondjniaState, Amazon region, Brazil. Sci. Total Environ. 287, 155–161.
Srikumar, T.S., Johansson, G.K., Ockerman, P.A., Gustafsson, J.A., Akesson, B., 1992.Trace element status in healthy subjects switching from a mixed to a lactoveg-etarian diet for 12 mo. Am. J. Clin. Nutr. 55, 885–890.
Sunde, R.A., Paterson, E., Evenson, J.K., Barnes, K.M., Lovegrove, J.A., Gordon, M.H.,2008. Longitudinal selenium status in healthy British adults: assessment usingbiochemical and molecular biomarkers. Br. J. Nutr. 99 (Suppl. 3), S37L 47.
Swanson, C., Longnecker, M., Veillon, C., Howe, M., Levander, O., Taylor, P., McAdam,P., Brown, C., Stampfer, M., Willett, W., 1990. Selenium intake, age, gender,and smoking in relation to indices of selenium status of adults residing in aseleniferous area. Am. J. Clin. Nutr. 52, 858–862.
Thomson, C.D., 1998. Selenium speciation in human body fluids. Analyst 123,827–831.
Thomson, C.D., 2004. Assessment of requirements for selenium and adequacy ofselenium status: a review. Eur. J. Clin. Nutr. 58, 391–402.
Valentine, J.L., Kang, H.K., Spivey, G.H., 1978. Selenium levels in human blood, urine,and hair in response to exposure via drinking water. Environ. Res. 17, 347–355.
Wasowicz, W., Zachara, B.A., 1987. Selenium concentrations in the blood and urineof a healthy Polish sub-population. J. Clin. Chem. Clin. Biochem. 25, 409–412.
Wilhelm, M., Ewers, U., Schulz, C., 2004. Revised and new reference values for sometrace elements in blood and urine for human biomonitoring in environmentalmedicine. Int. J. Hyg. Environ. Health 207, 69–73.
Yang, G., Zhou, R., Yin, S., Gu, L., Yan, B., Liu, Y., Li, X., 1989. Studies of safe maximaldaily dietary selenium intake in a seleniferous area in China. I. Selenium intakeand tissue selenium levels of the inhabitants. J. Trace Elem. Electrol. Health Dis.3, 77–87.
humans in China. Am. J. Clin. Nutr. 37, 872–881.Yang, G.Q., Xia, Y.M., 1995. Studies on human dietary requirements and safe range
of dietary intakes of selenium in China and their application in the preventionof related endemic diseases. Biomed. Environ. Sci. 8, 187–201.