S.E. Semester III B.E. (Mechanical Engineering) S.E. SEM ...

Case Studies in Nondestructive Testing and Evaluation 3 (2015) 27–33
Contents lists available at ScienceDirect
Case Studies in Nondestructive Testing and
Evaluationwww.elsevier.com/locate/csndt
Evaluating asphalt concrete air void variation via GPR antenna
array data
Kyle Hoegh a,∗, Lev Khazanovich a, Shongtao Dai b, Thomas Yu c
a University of Minnesota, Department of Civil, Environmental, and Geo-Engineering, 500 Pillsbury Drive S.E. | Minneapolis, MN 55455-0116, United Statesb Minnesota Department of Transportation Office of Materials and Road Research, 1400 Gervais Avenue | Maplewood, MN 55109, United Statesc Federal Highway Administration Office of Pavement Technology, 1200 New Jersey Avenue, SE | Washington, DC 20590, United States
a r t i c l e i n f o a b s t r a c t
Article history:Available online 27 March 2015
Air void content is one of the most important characteristics of in-place asphalt concrete, substantially affecting early deterioration and long term performance. Destructive measures at limited locations, such as coring, are typically conducted as part of the air-void content evaluation after the pavement has been fully constructed. In this paper, use of an air coupled step-frequency array system for nondestructive assessment of air-void variability is explored. The dielectric properties of the asphalt were determined from the asphalt surface reflection amplitude of all 21 adjacent transmitting and receiving pairs of the array and related to air void content through plotting of dielectric changes with core measured air void content. This approach is an extension of the procedure developed for a single bistatic antenna pair determining properties within top millimeters of the asphalt surface. While cores provide information concerning bulk properties across the depth, the proposed method with an array system provides an opportunity for increased lateral coverage. The case study demonstrated good repeatability and correspondence with core measured air void content. The array-based method improves the coverage and productivity of the measurements, making it an attractive alternative to current state-of-the-practice procedures.© 2015 The Authors. Published by Elsevier Ltd. This is an open access article under the CC
BY license (http://creativecommons.org/licenses/by/4.0/).
1. Introduction
The focus of this case study is nondestructive evaluation of air void content in newly constructed asphalt pavement. Air void content deviation from the specified range is a major factor in early pavement deterioration [1–3]. Many road owners specify destructively cutting cores in the pavement to determine density at randomly chosen locations, such as the current Minnesota Department of Transportation (MnDOT) specifications [4]. This process is expensive, destructive, labor consuming, and does not provide immediate feedback to the construction inspector or the contractor. Further, cores only represent a small portion of the total paved surface [4].
Ground penetrating radar (GPR) has been used for many construction material related applications [5–7]. This includes asphalt layer thickness determination if the approximate dielectric constant is known [1,8]. Use of air coupled GPR for de-tecting asphalt pavement air void content variation has been proposed as a nondestructive alternative to cores [1–3,9]. This
* Corresponding author. Tel.: +1 612 626 4098.E-mail addresses: [email protected] (K. Hoegh), [email protected] (L. Khazanovich), [email protected] (S. Dai), [email protected] (T. Yu).
http://dx.doi.org/10.1016/j.csndt.2015.03.0022214-6571/© 2015 The Authors. Published by Elsevier Ltd. This is an open access article under the CC BY license (http://creativecommons.org/licenses/by/4.0/).

28 K. Hoegh et al. / Case Studies in Nondestructive Testing and Evaluation 3 (2015) 27–33
Fig. 1. Illustration of the vehicle mounted step frequency array system.
includes determination of dielectric properties through either surface reflection or round trip travel time to reflection at the depth of the AC layer and relating to core measured porosity using calibration curves. The travel time approach cov-ers a greater depth, but relies on a known thickness. Since the asphalt thickness is often unknown and spatially variable, the surface reflection method was chosen for this study. Recent research conducted under a National Academies of Science sponsored Strategic Highway Research Program (SHRP-2) developed guidelines for potential implementation of this proce-dure with air coupled bistatic impulse radar systems using the surface reflection approach [2]. A single bistatic antenna pair setup provides information only along a single line. In many cases greater transverse coverage is desirable so multiple parallel measurements would be required. The process of harmonizing multiple passes complicates the testing and analysis procedure.
This case study utilizes a step-frequency array system shown in Fig. 1. The system allows for measurements using 21 antenna pairs. This provides coverage of a 1.5 meter-wide area at 75 mm spacing in the transverse direction, which improved data collection productivity and coverage. However, unlike impulse-radar, each antenna collects data in the fre-quency domain which is converted to the impulse time-histories used for analysis [10–12]. The air-void content analysis method developed for single bistatic systems is adopted for use in this case study with the step-frequency array system, and validated on a newly constructed asphalt concrete pavement.
2. Method
2.1. Dielectric constant determination
To calculate the dielectric constant of the tested asphalt, a VX1821 antenna was used to collect data at a frequency step of 20 MHz ranging from 50 MHz to 3050 MHz with a dwell time of 7.52 μs using a GeoScope Mk IV control unit. The procedure for calculating dielectric values for comparison with cores followed the surface reflection method with an air coupled bistatic antenna [1]. The basic principle is that the amplitude of the reflection from air to the asphalt surface, A0, as compared to the incident amplitude (represented by the reflection from the metal plate), Ai , can be used to determine the bulk dielectric constant of the asphalt, er . In this case, the impulse response shown in Fig. 2 is unfiltered after being obtained from a selective inverse discrete Fourier transform developed by Sala et al. [10]. The amplitude is measured by the peak minus the trough at the surface reflection (see Fig. 2). The dielectric constant of the surface is determined using the following equation (1):
er =(1 + (
A0Ai
)
1 − (A0Ai
)
)2
(1)
This can be empirically related to the relative ratio of pore volume to the total volume of each specific asphalt mix since air has a higher dielectric constant than the surrounding asphalt material [2,3]. In this study, the procedure was applied to each antenna pair of the array system independently, with a unique incident amplitude determination for each antenna pair.
It should be noted that the equation used to determine the dielectric constant of the asphalt assumes only the electrical impedance mismatch at the interface between the air and asphalt surface governs the amplitude. This implies that the method does not account for variation in density with depth of the asphalt layer. Previous studies suspect properties beyond

K. Hoegh et al. / Case Studies in Nondestructive Testing and Evaluation 3 (2015) 27–33 29
Fig. 2. Metal and asphalt amplitude calculation example from the equipment and conditions in this case study.
the first 25 mm do not influence the surface dielectric readings [2]. While the actual depth of asphalt influence is not clearly defined and dependent on each individual antenna and site conditions, the wavelet response electromagnetic wavelength provides insight into the depth of influence. The wavelength calculated by using half-width of the response-envelope of the asphalt surface reflections in this study, show that the wavelength is of the same order of magnitude of the evaluated asphalt layer depth (∼50 mm). This suggests that the majority of the influence on the amplitude is caused by the evaluated top layer. The maximum difference in amplitude of 50 successive scans divided by the average amplitude of all scans resulted in a maximum 0.96% difference when analyzing all antenna pairs.
2.2. Air void content determination
Many road owners specify destructively cutting cores in the pavement to determine density at randomly chosen loca-tions, following standard protocols [4,15,16]. The core extracted measurements are typically treated as “ground truth” for comparisons, but there is uncertainty in determining air void content, even from the same core, due to overheating dis-tortion, oven dry variability, and other factors [15,16]. It can also be difficult to extract a statistically significant number of cores for comparison without affecting the pavement condition. The method used by MnDOT in this study follows the American Association of State Highway and Transportation Officials recommended procedure AASHTO T166. The test method determines the bulk specific gravity (Gmb), the density at 25 ◦C (77 F), and the percent of absorbed water in compacted bituminous specimens. The air void content was determined for the top AC layer in this study. This involves drying the specimen in an oven to constant mass, cooling the specimen to room temperature, recording the dry mass (A), immersing the specimen in water, recording the immersed weight (C), and removing the specimen and recording the saturated surface-dry weight (B). The bulk specific gravity is calculated by dividing A by the difference in B and C to the nearest 0.001. This method is similar to that presented in [16] showing a difference in air void content determination up to 0.7%. While this value accounts for the repeatability of the measurement result, the actual error of the measurement may be higher due to other factors including potential for propagation of uncertainty when combining uncertainty of the multiple measurements described above.
2.3. Field test information
In this case study, data was collected over a longitudinal joint in an asphalt pavement, since joints often experience durability problems due to higher air void content [2]. A 180 m long section of a 100-mm thick asphalt overlay in White Bear, MN was made available for exploratory air void content variation measurements using the GPR array system. The section included a traffic lane and a shoulder which was paved using separate passes to create the tested longitudinal joint area. The array was targeted to be centered at the longitudinal joint location (i.e. between the 10th and 11th antenna pairs). A 1.2 m by 2.4 m metal plate was placed at the beginning of the section to determine the incident amplitude for each antenna pair (see Fig. 1). Thin metal strips were placed at the longitudinal joint location every 50 m as well as the ending longitudinal position to assist in longitudinal position determination during data analysis. Data were collected in distance controlled mode every 75 mm longitudinally. Two replicate passes of GPR measurements were made within 15 min under the same environmental conditions approximately 24 h after paving on a dry asphalt surface.
30 K. Hoegh et al. / Case Studies in Nondestructive Testing and Evaluation 3 (2015) 27–33
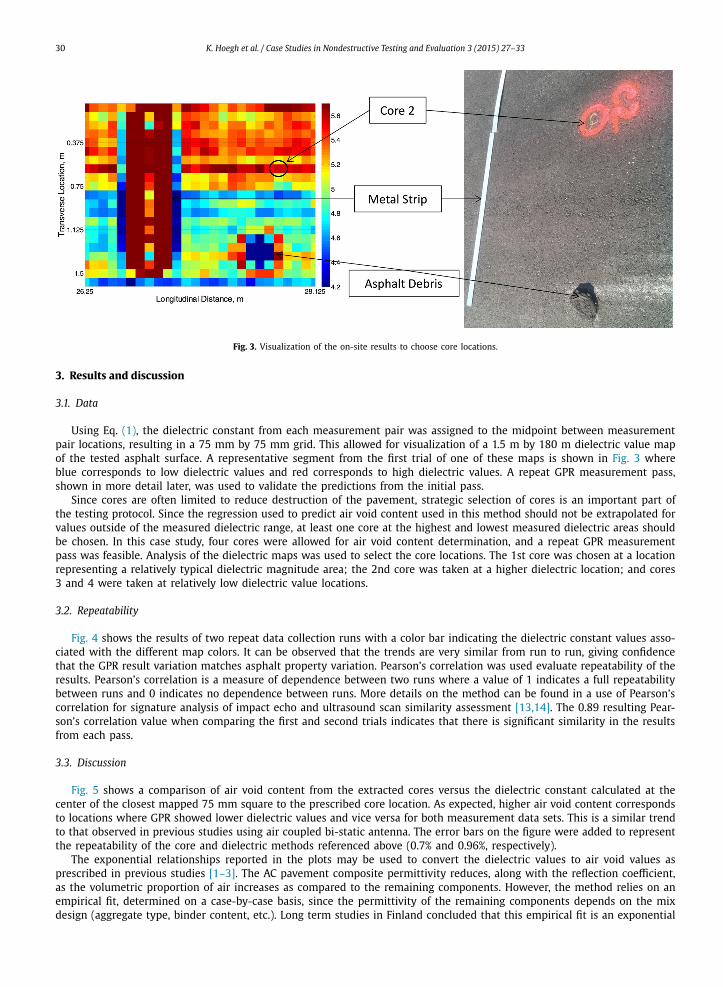
Fig. 3. Visualization of the on-site results to choose core locations.
3. Results and discussion
3.1. Data
Using Eq. (1), the dielectric constant from each measurement pair was assigned to the midpoint between measurement pair locations, resulting in a 75 mm by 75 mm grid. This allowed for visualization of a 1.5 m by 180 m dielectric value map of the tested asphalt surface. A representative segment from the first trial of one of these maps is shown in Fig. 3 where blue corresponds to low dielectric values and red corresponds to high dielectric values. A repeat GPR measurement pass, shown in more detail later, was used to validate the predictions from the initial pass.
Since cores are often limited to reduce destruction of the pavement, strategic selection of cores is an important part of the testing protocol. Since the regression used to predict air void content used in this method should not be extrapolated for values outside of the measured dielectric range, at least one core at the highest and lowest measured dielectric areas should be chosen. In this case study, four cores were allowed for air void content determination, and a repeat GPR measurement pass was feasible. Analysis of the dielectric maps was used to select the core locations. The 1st core was chosen at a location representing a relatively typical dielectric magnitude area; the 2nd core was taken at a higher dielectric location; and cores 3 and 4 were taken at relatively low dielectric value locations.
3.2. Repeatability
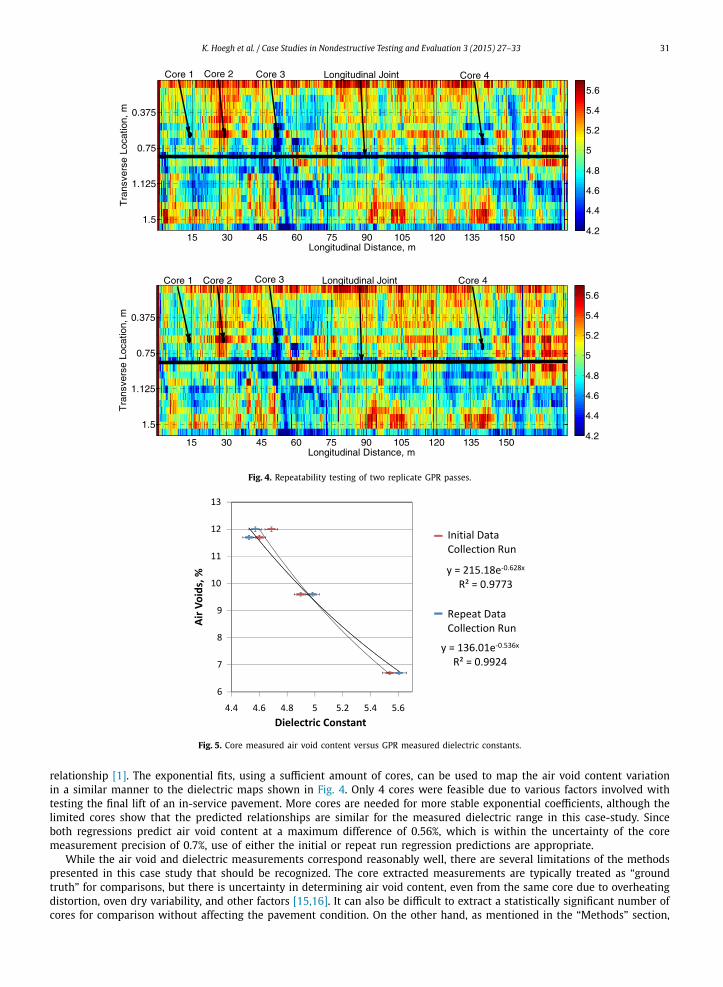
Fig. 4 shows the results of two repeat data collection runs with a color bar indicating the dielectric constant values asso-ciated with the different map colors. It can be observed that the trends are very similar from run to run, giving confidence that the GPR result variation matches asphalt property variation. Pearson’s correlation was used evaluate repeatability of the results. Pearson’s correlation is a measure of dependence between two runs where a value of 1 indicates a full repeatability between runs and 0 indicates no dependence between runs. More details on the method can be found in a use of Pearson’s correlation for signature analysis of impact echo and ultrasound scan similarity assessment [13,14]. The 0.89 resulting Pear-son’s correlation value when comparing the first and second trials indicates that there is significant similarity in the results from each pass.
3.3. Discussion
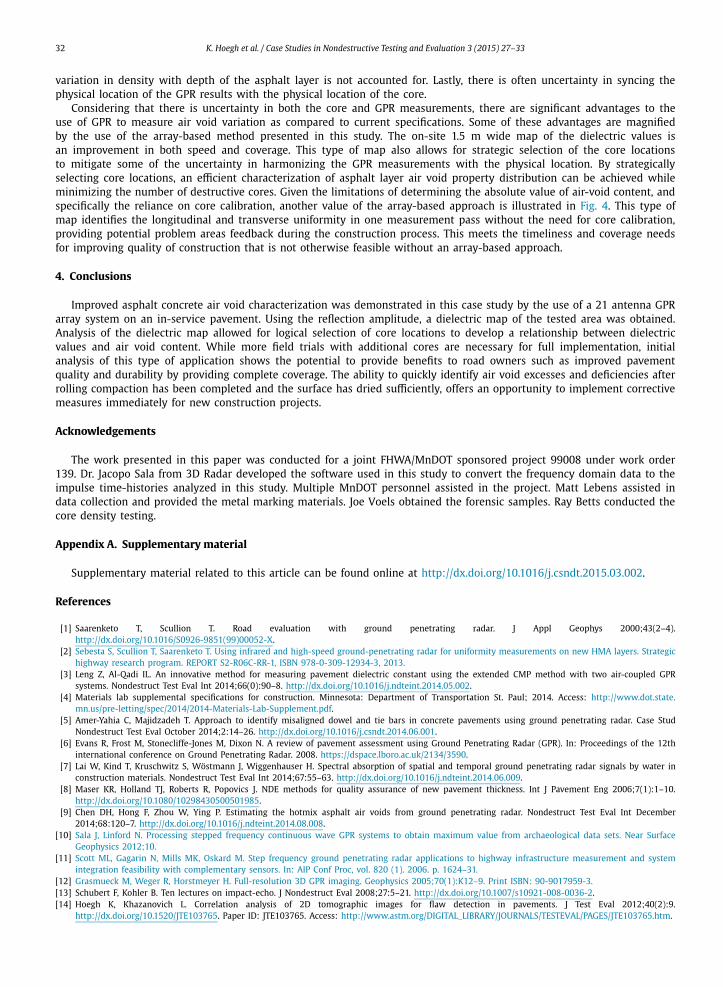
Fig. 5 shows a comparison of air void content from the extracted cores versus the dielectric constant calculated at the center of the closest mapped 75 mm square to the prescribed core location. As expected, higher air void content corresponds to locations where GPR showed lower dielectric values and vice versa for both measurement data sets. This is a similar trend to that observed in previous studies using air coupled bi-static antenna. The error bars on the figure were added to represent the repeatability of the core and dielectric methods referenced above (0.7% and 0.96%, respectively).
The exponential relationships reported in the plots may be used to convert the dielectric values to air void values as prescribed in previous studies [1–3]. The AC pavement composite permittivity reduces, along with the reflection coefficient, as the volumetric proportion of air increases as compared to the remaining components. However, the method relies on an empirical fit, determined on a case-by-case basis, since the permittivity of the remaining components depends on the mix design (aggregate type, binder content, etc.). Long term studies in Finland concluded that this empirical fit is an exponential
K. Hoegh et al. / Case Studies in Nondestructive Testing and Evaluation 3 (2015) 27–33 31
Fig. 4. Repeatability testing of two replicate GPR passes.
Fig. 5. Core measured air void content versus GPR measured dielectric constants.
relationship [1]. The exponential fits, using a sufficient amount of cores, can be used to map the air void content variation in a similar manner to the dielectric maps shown in Fig. 4. Only 4 cores were feasible due to various factors involved with testing the final lift of an in-service pavement. More cores are needed for more stable exponential coefficients, although the limited cores show that the predicted relationships are similar for the measured dielectric range in this case-study. Since both regressions predict air void content at a maximum difference of 0.56%, which is within the uncertainty of the core measurement precision of 0.7%, use of either the initial or repeat run regression predictions are appropriate.
While the air void and dielectric measurements correspond reasonably well, there are several limitations of the methods presented in this case study that should be recognized. The core extracted measurements are typically treated as “ground truth” for comparisons, but there is uncertainty in determining air void content, even from the same core due to overheating distortion, oven dry variability, and other factors [15,16]. It can also be difficult to extract a statistically significant number of cores for comparison without affecting the pavement condition. On the other hand, as mentioned in the “Methods” section,
32 K. Hoegh et al. / Case Studies in Nondestructive Testing and Evaluation 3 (2015) 27–33
variation in density with depth of the asphalt layer is not accounted for. Lastly, there is often uncertainty in syncing the physical location of the GPR results with the physical location of the core.
Considering that there is uncertainty in both the core and GPR measurements, there are significant advantages to the use of GPR to measure air void variation as compared to current specifications. Some of these advantages are magnified by the use of the array-based method presented in this study. The on-site 1.5 m wide map of the dielectric values is an improvement in both speed and coverage. This type of map also allows for strategic selection of the core locations to mitigate some of the uncertainty in harmonizing the GPR measurements with the physical location. By strategically selecting core locations, an efficient characterization of asphalt layer air void property distribution can be achieved while minimizing the number of destructive cores. Given the limitations of determining the absolute value of air-void content, and specifically the reliance on core calibration, another value of the array-based approach is illustrated in Fig. 4. This type of map identifies the longitudinal and transverse uniformity in one measurement pass without the need for core calibration, providing potential problem areas feedback during the construction process. This meets the timeliness and coverage needs for improving quality of construction that is not otherwise feasible without an array-based approach.
4. Conclusions
Improved asphalt concrete air void characterization was demonstrated in this case study by the use of a 21 antenna GPR array system on an in-service pavement. Using the reflection amplitude, a dielectric map of the tested area was obtained. Analysis of the dielectric map allowed for logical selection of core locations to develop a relationship between dielectric values and air void content. While more field trials with additional cores are necessary for full implementation, initial analysis of this type of application shows the potential to provide benefits to road owners such as improved pavement quality and durability by providing complete coverage. The ability to quickly identify air void excesses and deficiencies after rolling compaction has been completed and the surface has dried sufficiently, offers an opportunity to implement corrective measures immediately for new construction projects.
Acknowledgements
The work presented in this paper was conducted for a joint FHWA/MnDOT sponsored project 99008 under work order 139. Dr. Jacopo Sala from 3D Radar developed the software used in this study to convert the frequency domain data to the impulse time-histories analyzed in this study. Multiple MnDOT personnel assisted in the project. Matt Lebens assisted in data collection and provided the metal marking materials. Joe Voels obtained the forensic samples. Ray Betts conducted the core density testing.
Appendix A. Supplementary material
Supplementary material related to this article can be found online at http://dx.doi.org/10.1016/j.csndt.2015.03.002.
References
[1] Saarenketo T, Scullion T. Road evaluation with ground penetrating radar. J Appl Geophys 2000;43(2–4).http://dx.doi.org/10.1016/S0926-9851(99)00052-X.
[2] Sebesta S, Scullion T, Saarenketo T. Using infrared and high-speed ground-penetrating radar for uniformity measurements on new HMA layers. Strategic highway research program. REPORT S2-R06C-RR-1, ISBN 978-0-309-12934-3, 2013.
[3] Leng Z, Al-Qadi IL. An innovative method for measuring pavement dielectric constant using the extended CMP method with two air-coupled GPR systems. Nondestruct Test Eval Int 2014;66(0):90–8. http://dx.doi.org/10.1016/j.ndteint.2014.05.002.
[4] Materials lab supplemental specifications for construction. Minnesota: Department of Transportation St. Paul; 2014. Access: http://www.dot.state.mn.us/pre-letting/spec/2014/2014-Materials-Lab-Supplement.pdf.
[5] Amer-Yahia C, Majidzadeh T. Approach to identify misaligned dowel and tie bars in concrete pavements using ground penetrating radar. Case Stud Nondestruct Test Eval October 2014;2:14–26. http://dx.doi.org/10.1016/j.csndt.2014.06.001.
[6] Evans R, Frost M, Stonecliffe-Jones M, Dixon N. A review of pavement assessment using Ground Penetrating Radar (GPR). In: Proceedings of the 12th international conference on Ground Penetrating Radar. 2008. https://dspace.lboro.ac.uk/2134/3590.
[7] Lai W, Kind T, Kruschwitz S, Wöstmann J, Wiggenhauser H. Spectral absorption of spatial and temporal ground penetrating radar signals by water in construction materials. Nondestruct Test Eval Int 2014;67:55–63. http://dx.doi.org/10.1016/j.ndteint.2014.06.009.
[8] Maser KR, Holland TJ, Roberts R, Popovics J. NDE methods for quality assurance of new pavement thickness. Int J Pavement Eng 2006;7(1):1–10. http://dx.doi.org/10.1080/10298430500501985.
[9] Chen DH, Hong F, Zhou W, Ying P. Estimating the hotmix asphalt air voids from ground penetrating radar. Nondestruct Test Eval Int December 2014;68:120–7. http://dx.doi.org/10.1016/j.ndteint.2014.08.008.
[10] Sala J, Linford N. Processing stepped frequency continuous wave GPR systems to obtain maximum value from archaeological data sets. Near Surface Geophysics 2012;10.
[11] Scott ML, Gagarin N, Mills MK, Oskard M. Step frequency ground penetrating radar applications to highway infrastructure measurement and system integration feasibility with complementary sensors. In: AIP Conf Proc, vol. 820 (1). 2006. p. 1624–31.
[12] Grasmueck M, Weger R, Horstmeyer H. Full-resolution 3D GPR imaging. Geophysics 2005;70(1):K12–9. Print ISBN: 90-9017959-3.[13] Schubert F, Kohler B. Ten lectures on impact-echo. J Nondestruct Eval 2008;27:5–21. http://dx.doi.org/10.1007/s10921-008-0036-2.[14] Hoegh K, Khazanovich L. Correlation analysis of 2D tomographic images for flaw detection in pavements. J Test Eval 2012;40(2):9.
http://dx.doi.org/10.1520/JTE103765. Paper ID: JTE103765. Access: http://www.astm.org/DIGITAL_LIBRARY/JOURNALS/TESTEVAL/PAGES/JTE103765.htm.

K. Hoegh et al. / Case Studies in Nondestructive Testing and Evaluation 3 (2015) 27–33 33
[15] Ray Brown E. Density of asphalt concrete – how much is needed? Presented at the 69th annual meeting of the transportation research board. Wash-ington, DC, January 1990, 1990. Access: https://schwartz.eng.auburn.edu/research/centers/ncat/files/reports/1990/rep90-03.pdf.
[16] Choubane B, Upshaw PB, Sholar GA, Page GC, Musselman JA. Nuclear density readings and core densities: a comparative study. Transp Res Rec 1999;1654(1):70–8. Access: http://trb.metapress.com/content/xn7716501l37m244/.


![ScienceDirect cienceirect ScienceDirect · and. {[,], , , : . , / ...](https://static.fdocuments.us/doc/165x107/608077a6d3af4a2358487f59/-sciencedirect-cienceirect-sciencedirect-and-.jpg)