COntents KsB PUMPs LIMIteD€¦ · Nagpur & Pune South - Chennai Offices - Bengaluru & Secunderabad...
92
Transcript of COntents KsB PUMPs LIMIteD€¦ · Nagpur & Pune South - Chennai Offices - Bengaluru & Secunderabad...
1
COntents KsB PUMPs LIMIteD
Page Nos.
General Information ................................................................................2
Board’s Report ......................................................................................3-5
Annexures
i. Management Discussion & Analysis Report ..........................6-10
ii. Report on Corporate Governance ........................................11-19
iii. Other Annexures ..................................................................20-22
Auditors’ Report ...............................................................................23-27
Balance Sheet .........................................................................................28
Statement of Profit & Loss ..................................................................29
Cash Flow .........................................................................................30-31
Notes 1 to 43 ...................................................................................32-53
Consolidated Financial Statements ...................................................54-84
Summary of Financial Information of Subsidiary Company .................85
AnnuAl GenerAl MeetinG
Date : 11th April, 2014
Day : Friday
Time : 2.00 p.m.
Venue : Bajaj Bhavan, Ground Floor, (Kamalnayan Bajaj Hall), 226, Nariman Point, Mumbai 400 021.
COMMuniCAtiOn DetAilS
Tel No. : 022-66588787
Fax No. : 022-66588788
Shareholders’ Grievance Cell : [email protected]
Website : www.ksbindia.co.in
2
GeneraL InfOrMatIOn
Board Of Directors
G. Swarup (Chairman)A.R. BroachaD.N. DamaniaN.N. KampaniDr. Stephan BrossDr. W. SchmittPradip ShahW. Spiegel (Managing Director)
Registered Office
126, Maker Chambers III, Nariman Point, Mumbai 400 021
Zonal Offices
North - NOIDAOffices - Chandigarh, Jaipur & Lucknow
East - KolkataOffices - Bhubaneswar, Jamshedpur & Raipur
West - MumbaiOffices - Ahmedabad, Aurangabad, Vadodara, Indore, Nagpur & Pune
South - ChennaiOffices - Bengaluru & Secunderabad
Factories
Maharashtra -
Pimpri, Pune
Chinchwad, Pune
Vambori, Dist. Ahmednagar
Sinnar, Dist. Nashik
tamil nadu -
NSN Palayam, Coimbatore
Collaborators
KSB Aktiengesellschaft, Germany
Bankers
Central Bank of India Deutsche Bank AG Standard Chartered Bank
Auditors
Deloitte Haskins & Sells LLP
Cost Auditors
Dhananjay V. Joshi & Associates
Registrar & Transfer Agent
Link Intime India Pvt. Ltd. Tel. No.: 022-25946970 E-mail: [email protected]
3
BOarD’s rePOrt
To
The Shareholders,
The Board of Directors have pleasure to submit the report and audited Balance Sheet and Statement of Profit and Loss of the Company for the year ended 31st December, 2013.
FinAnCiAl reSultS AnD DiViDenD
(i) Financial Results:
` in Million
Year ended 31.12.2013
Year ended 31.12.2012
Revenue from operations (net) & Other Income 7474.98 7318.82Profit before taxation 876.05 806.58Less: Tax expense Current 278.00 265.10 Deferred (3.17) (22.25)Adjustment of tax of earlier years 3.63 (16.43)
278.46 226.42Profit after tax 597.59 580.16Balance brought forward 2949.26 2651.61Profit for appropriation 3546.85 3231.77
Appropriation:First Interim Dividend 34.81 34.81Second Interim Dividend - 156.64Final Dividend 156.64 -Tax on Dividend 32.54 31.06General Reserve 61.00 60.00Balance carried to Balance Sheet 3261.86 2949.26
3546.85 3231.77
note: Previous year figures have been regrouped/reclassified, wherever necessary to correspond with the current year classification/disclosure.
(ii) Dividend:
An interim dividend of ` 1 per share of ` 10 each (10%) was paid during the year. The Board of Directors propose a final dividend of ` 4.50 per share of ` 10 each
(45%) making a total of ` 5.50 per share of ` 10 each (55%) for the year.
GenerAl reVieW
(i) Working:
During the year under review, the Company has earned higher profit before tax compared to the previous year due to various cost reduction and efficiency improvement measures. The overall economic slowdown and delay in project execution continued in 2013. Hence, situation of heavy pressure on margin continued in the year.
Export increased by ` 34 Million from ` 1034 Million last year to ` 1068 Million.
The Company continues with its efforts to maintain growth even during the economic downturn and face new challenges.
(ii) Unclaimed Bonus Shares:
Total 19,918 bonus shares held by 146 shareholders were unclaimed in the year 2013. During the year no shareholder had approached/ claimed for such shares. The total number of shares outstanding at the end of the year 2013 is 19,918 held by 146 shareholders.
(iii) Fixed Deposits:
The Company has no unclaimed deposits.
(iv) Transfer to Investor Education & Protection Fund:
During the year, in accordance with section 205C of the Companies Act, 1956, an amount of ` 31,000 being unclaimed fixed deposits and an amount of ` 295,595 being unclaimed dividends up to the year 31st December, 2006 were transferred to the Investor Education & Protection Fund established by the Central Government.
4
BOarD’s rePOrt (Contd.)
(v) Subsidiary & Associate:
The Ministry of Corporate Affairs, the Government of India has vide Circular No. 2/2011 dated 8th February, 2011 granted general exemption subject to fulfillment of certain conditions from attaching the Balance Sheet of the Subsidiary to the Balance Sheet of the Company without making an application for exemption. Accordingly, the Balance Sheet, the Statement of Profit and Loss and other documents of the Subsidiary Company is not being attached with the Balance Sheet of the Company. Financial information of the Subsidiary Company is disclosed in the Annual Report. The Audited Annual Accounts of this Subsidiary and related detailed information will be made available to any member of the Company/its Subsidiary seeking such information at any point of time and are also available for inspection by any member of the Company/its Subsidiary at the Registered Office of the Company. The Audited Annual Accounts of the said Subsidiary will also be available for inspection, as above, at the Head Office of the Subsidiary Company.
The Associate Company, MIL Controls Limited has made a profit before tax of ` 317.41 Million for the year ended 31st December, 2013 (previous year ` 337.68 Million).
(vi) Management Discussion and Analysis Report:
Annexed to this Report
(vii) Corporate Governance:
Annexed to this Report
(viii) Consolidated Accounts:
As per the requirement of SEBI, consolidated accounts in accordance with Accounting Standard - 21 have been annexed to this Annual Report.
DireCtOrS
Mr. A. R. Broacha, Mr. Pradip Shah, and Mr. G. Swarup retire by rotation and are eligible for re-appointment.
Dr. Augus Lee expressed his inability to continue as director and resigned from the Board on 30th December, 2013. The Board expresses its sincere appreciation for the valuable services provided by him during his tenure as a Director. Dr. Stephan Bross was appointed as a Director on 11th February, 2014 to fill the casual vacancy caused by the resignation of Dr. Augus Lee. Dr. Stephan Bross holds office as such, upto the ensuing annual general meeting under Article 112 of the Articles of Association of the Company.
The Company has received a notice in writing from a member proposing his candidature for appointment as Director under section 257 of the Companies Act, 1956.
DireCtOrS’ reSPOnSiBilitY StAteMent
The Board of Directors confirm that
i. in the preparation of annual accounts, the applicable accounting standards have been followed and there is no material departures;
ii. the Directors have selected such accounting policies and applied them consistently and made judgments and estimates that are reasonable and prudent so as to give a true and fair view of the state of affairs of the Company at the end of the financial year and of the profit or loss of the Company for the year under review;
iii. the Directors have taken proper and sufficient care for the maintenance of adequate accounting records in accordance with the provisions of the Companies Act, 1956, for safeguarding the assets of the Company and for preventing and detecting fraud and other irregularities;
5
BOarD’s rePOrt (Contd.)
iv. the Directors have prepared the annual accounts on a going concern basis.
PArtiCulArS OF eMPlOYeeS
The particulars prescribed under section 217(2A) of the Companies Act, 1956 are furnished in the annexure to this report.
C O n S e rVAt i O n O F e n e r G Y, teCHnOlOGY ABSOrPtiOn AnD FOreiGn eXCHAnGe eArninGS AnD OutGO
The particulars prescribed by the Companies (Disclosure of Particulars in the Report of Board of Directors) Rules, 1988 are furnished in the annexure to this report.
SAFetY AnD enVirOnMent
The Company has a focus on safety and environment at work place and is committed towards improving environment, organizational health and safety standards on a continuous basis.
During the year under review two plants having ISO 9001 & 14001 certification were audited for OHSAS 18001 standard, for systems and environment respectively. In the second phase, two more plants will be audited for OHSAS certification for organizational health and safety. Extensive training programs are held to train our core team members who would be responsible to implement the requirements of this standard across all plants.
The Company took sustainability measures at different locations to improve environment and save energy. These were in the area of solar street lights, replacing asbestos, rain water harvesting, compressed air management, ladder management and implementation of energy saving devices in plants.
We have initiated dialogue with our supplier’s through correspondence and one-to-one meeting to begin the EHS activities at their end, this will be closely monitored in future to bring in desired result.
COrPOrAte SOCiAl reSPOnSiBilitY
KSB Care Charitable Trust has initiated a project of supporting a school near Company’s foundry at Vambori. Proposed support is to construct a primary school building. The proposal is awaiting regulatory approval.
AuDitOrS
You are requested to appoint auditors for the current year and to fix their remuneration. The retiring auditors M/s. Deloitte Haskins & Sells LLP, Chartered Accountants, Pune are eligible and offer themselves for re-appointment. The Company has received a certificate from M/s. Deloitte Haskins & Sells LLP to the effect that their re-appointment, if made, will be within the prescribed limits specified in section 224(1B) of the Companies Act, 1956.
COSt AuDitOrS
The Company has appointed M/s. Dhananjay V. Joshi and Associates, Cost Accountants, Pune as Cost Auditors to carry out the audit of Cost Accounts relating to Engineering machinery (including electrical & electronic product) of the Company for the year 2013. The Cost Audit Report for year 2012 which was due to be filed with the Ministry of Corporate Affairs on 29th June, 2013, was filed on 7th June, 2013.
ACKnOWleDGeMentS
The Board of Directors are grateful to Canadian Kay Pump Ltd., the main shareholder, and to KSB AG, Germany, the Company’s collaborators, for their valuable assistance and support. They wish to record their appreciation for the co-operation and support of the Company’s shareholders, bankers and other lending institutions, all employees including the workers, staff and middle management and all others concerned with the Company’s business.
On behalf of the Board of Directors
G. SWARUPChairman
Mumbai, 11th February, 2014
6
ManageMent Discussion & analysis RepoRt
ANNEXURE TO BOARD’S REPORT
1.0 INTRODUcTION
The Company is engaged in the business of manufacture of power driven pumps and industrial valves. Castings are mainly produced for captive consumption.
2.0 I N D U S T RY S T R U c T U R E A N D DEVELOPMENT
2.1 General
In the year 2013, the global growth continued to remain moderate, with an uneven recovery across industrial countries. Activity in major emerging market economies barring China has decelerated on account of weak domestic demand, notwithstanding some improvement in export performance.
In India, the increase in real GDP growth in mid of 2013, though modest, was driven largely by robust growth of agricultural activity, supported by an improvement in net exports. However, the weakness in industrial activity persisting into end of 2013, lackluster lead indicators of services and subdued domestic consumption demand suggest continuing headwinds to growth. The manufacturing sector, where your Company is operating, in fact, contracted during 2013. Tightening government spending in early 2014 to meet budget projections will add to these headwinds. In this context, the revival of investment, especially in the infrastructure projects cleared by the government, will be critical.
Retail inflation has risen unrelentingly during the year, pushed up by the upturn in vegetable prices, housing inflation and increased levels of inflation in the
non-food and non-fuel categories. High inflation at both wholesale and retail levels risks entrenching inflation expectations at unacceptably elevated levels, posing a threat to growth, financial stability and exchange rate stability.
The narrowing of the trade deficit since June through November, due to positive export growth and contraction in both oil and non-oil imports, should bring the current account deficit down to a more sustainable level for the fiscal year as a whole.
2.2 Pumps & Valves Industries
Global revenue growth in the machinery sector declined in 2013. The backdrop to this was underutilization of production capacities in many countries limiting the need for investments in new plants. Due to subdued domestic demand, the project business of pumps and valves therefore remained difficult, while the general business with standard products for building services and industrial segment offered comparatively better prospects.
3.0 OPPORTUNITIES AND THREATS
With India’s ever growing requirements of energy and capacity addition planned by the government, though demand is subdued at the moment, there exists substantial opportunity for future growth as the Company’s products are geared up for this sector.
With the globalisation, new international players are making a thrust in the Indian market by creation of additional manufacturing capacities. This would result in further intensification of competition leading to price pressures.
7
ManageMent Discussion & analysis RepoRt (contd.)
4.0 SEGMENTWISE PERFORMANcE
During the year under review, pumps worth ` 5082 Million (previous year ` 4797 Million) and valves worth ` 1182 Million (previous year ` 1415 Million) were sold.
Out of the above, export of pumps and valves in terms of value were ` 1068 Million (previous year ` 1034 Million).
5.0 OUTLOOK
The Company expects the market for pumps and services to grow moderately. The market for valves is expected to be sluggish, primarily due to poor demand from the power sector. Company is taking effective steps to improve earning before income tax in current year.
6.0 R I S K S & c O N c E R N S T H E MANAGEMENT PERcEIVE
The competition is expected to be more aggressive leading to price pressures. Uncertainty in global economic growth coupled with inflationary pressures is expected to impact the growth rate in India and consequently the Company’s operations.
The growth in the industrial sector depends on government policies, better infrastructure, removal of labour market rigidities and growth in agricultural sector.
7.0 INTERNAL cONTROL SYSTEM & THEIR ADEQUAcY
Internal Control Systems are implemented:-
• To safeguard the Company’s assets from loss or damage;
• To keep constant check on cost structure;
• To provide adequate financial and accounting controls and implement accounting standards.
The system is improved and modified continuously to meet with changes in business condition, statutory and accounting requirements.
Internal controls are adequately supported by Internal Audit and periodic review by the management.
The Audit Committee meets periodically to review -
• Financial statements, with the management and statutory auditors;
• Adequacy/ scope of internal audit function, significant findings and follow up thereon and findings of any abnormal nature, with the internal auditors.
8.0 D I S c U S S I O N O N F I N A N c I A L PERFORMANcE WITH RESPEcT TO OPERATIONAL EFFIcIENcY
Due to better working capital management, utilization of short-term borrowings has reduced resulting in reduction of finance cost.
The following statements cover financial performance review, which are attached to this report.
a) Distribution of Income
b) Financial Position at a glance
c) Financial Summary
9.0 MATERIAL DEVELOPMENTS IN HUMAN RESOURcES, INDUSTRIAL RELATIONS
In 2013, even though the business sentiment was low throughout the year, attracting and retaining talent continued to be a challenge for us. We continued our efforts for People Development Initiatives with more focused approach on Leadership Development and Capability Development Programmes. Other
8
ManageMent Discussion & analysis RepoRt (contd.)
HR Initiatives like Succession Planning, Performance Management, Employee Communication Meeting and E-learning were executed as planned. On boarding process for new employees was strengthened by implementing the new initiative on International Qualification Standards.
As a part of implementation of Occupational Health and Safety Standards, Health and Safety programmes are being conducted for all employees in phases. Industrial relation at all the plants were cordial and healthy.
10.0 cAUTION
This report is based on the experience and information available to the Company
in the pump and valve business and assumption with regard to domestic and global economic conditions, government and regulation policies etc. The performance of the Company is dependent on these factors. It may be materially influenced by the changes therein beyond the Company’s control, affecting the views expressed in or perceived from this report.
On behalf of the Board of Directors,
G SWARUPChairman
Mumbai, 11th February, 2014
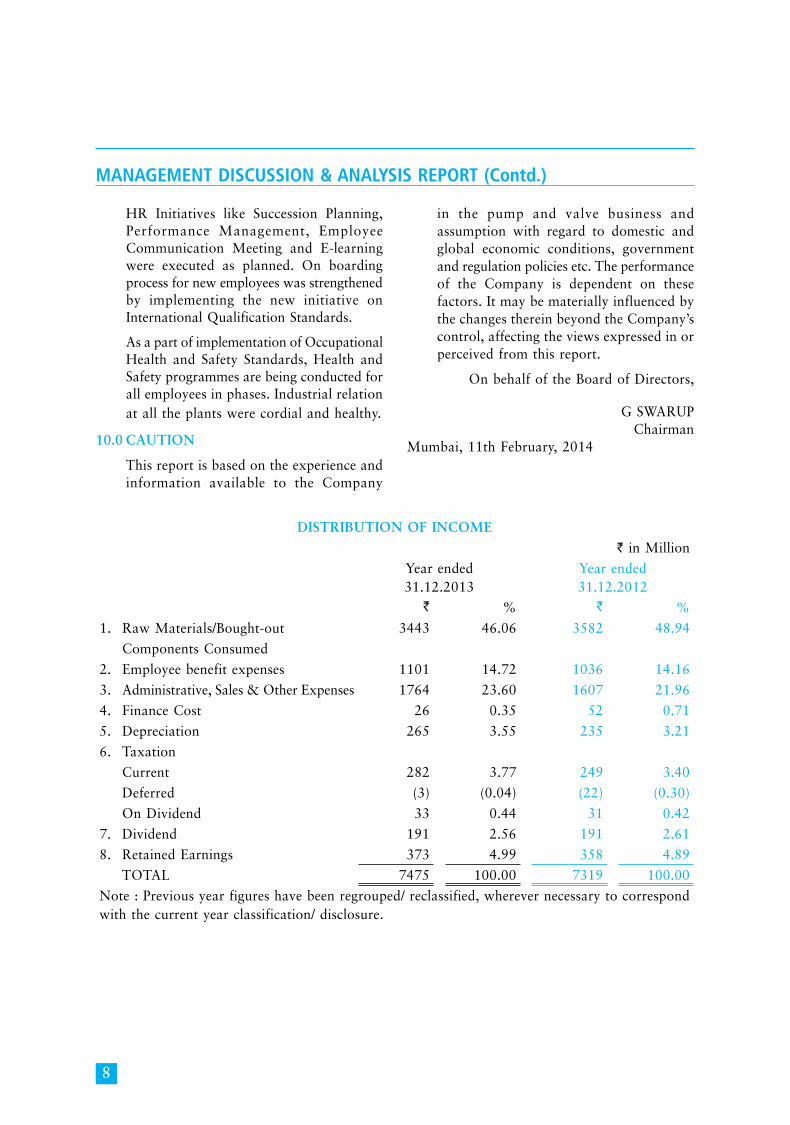
DISTRIBUTION OF INcOME
` in Million
Year ended31.12.2013
Year ended31.12.2012
` % ` %
1. Raw Materials/Bought-out 3443 46.06 3582 48.94
Components Consumed
2. Employee benefit expenses 1101 14.72 1036 14.16
3. Administrative, Sales & Other Expenses 1764 23.60 1607 21.96
4. Finance Cost 26 0.35 52 0.71
5. Depreciation 265 3.55 235 3.21
6. Taxation
Current 282 3.77 249 3.40
Deferred (3) (0.04) (22) (0.30)
On Dividend 33 0.44 31 0.42
7. Dividend 191 2.56 191 2.61
8. Retained Earnings 373 4.99 358 4.89
TOTAL 7475 100.00 7319 100.00
Note : Previous year figures have been regrouped/ reclassified, wherever necessary to correspond with the current year classification/ disclosure.
9
ManageMent Discussion & analysis RepoRt (contd.)
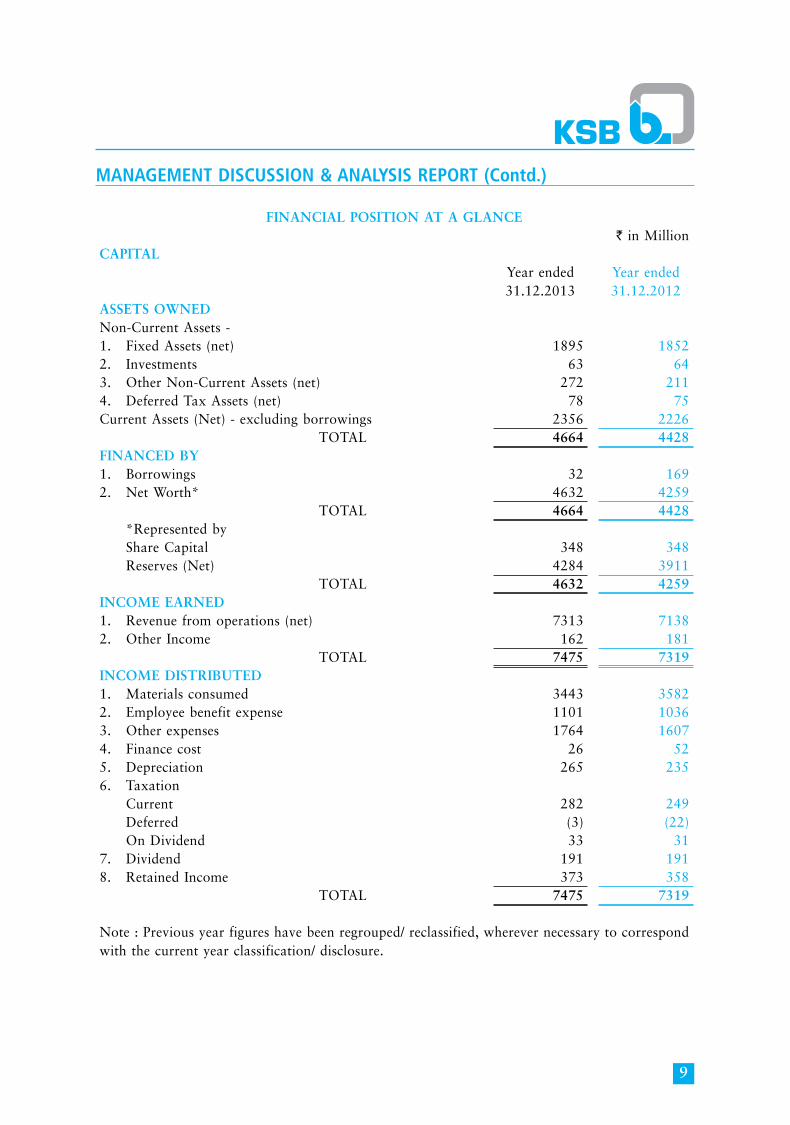
FINANcIAL POSITION AT A GLANcE` in Million
cAPITAL Year ended
31.12.2013Year ended31.12.2012
ASSETS OWNEDNon-Current Assets -1. Fixed Assets (net) 1895 18522. Investments 63 643. Other Non-Current Assets (net) 272 2114. Deferred Tax Assets (net) 78 75Current Assets (Net) - excluding borrowings 2356 2226 TOTAL 4664 4428FINANcED BY1. Borrowings 32 1692. Net Worth* 4632 4259 TOTAL 4664 4428 *Represented by Share Capital 348 348 Reserves (Net) 4284 3911 TOTAL 4632 4259INcOME EARNED1. Revenue from operations (net) 7313 71382. Other Income 162 181 TOTAL 7475 7319INcOME DISTRIBUTED1. Materials consumed 3443 35822. Employee benefit expense 1101 10363. Other expenses 1764 16074. Finance cost 26 525. Depreciation 265 2356. Taxation Current 282 249 Deferred (3) (22) On Dividend 33 317. Dividend 191 1918. Retained Income 373 358 TOTAL 7475 7319
Note : Previous year figures have been regrouped/ reclassified, wherever necessary to correspond with the current year classification/ disclosure.
10
ManageMent Discussion & analysis RepoRt (contd.)
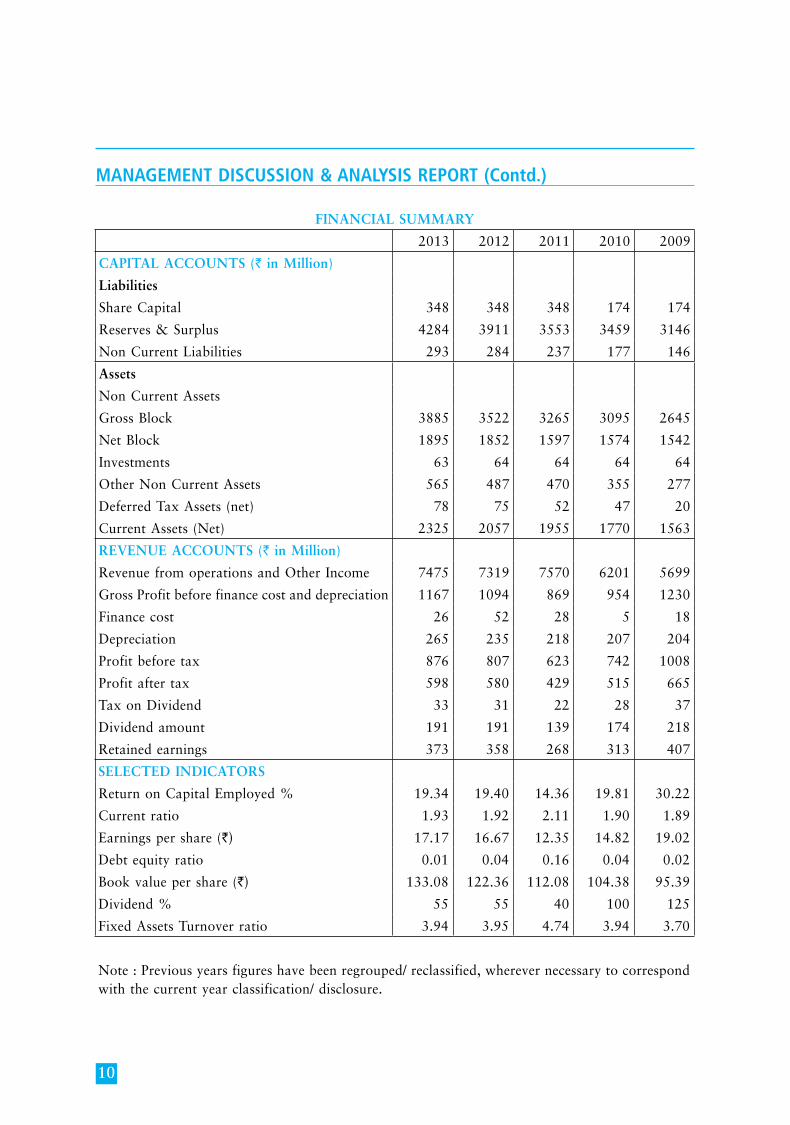
FINANcIAL SUMMARY
2013 2012 2011 2010 2009
cAPITAL AccOUNTS (` in Million)
Liabilities
Share Capital 348 348 348 174 174
Reserves & Surplus 4284 3911 3553 3459 3146
Non Current Liabilities 293 284 237 177 146
Assets
Non Current Assets
Gross Block 3885 3522 3265 3095 2645
Net Block 1895 1852 1597 1574 1542
Investments 63 64 64 64 64
Other Non Current Assets 565 487 470 355 277
Deferred Tax Assets (net) 78 75 52 47 20
Current Assets (Net) 2325 2057 1955 1770 1563
REVENUE AccOUNTS (` in Million)
Revenue from operations and Other Income 7475 7319 7570 6201 5699
Gross Profit before finance cost and depreciation 1167 1094 869 954 1230
Finance cost 26 52 28 5 18
Depreciation 265 235 218 207 204
Profit before tax 876 807 623 742 1008
Profit after tax 598 580 429 515 665
Tax on Dividend 33 31 22 28 37
Dividend amount 191 191 139 174 218
Retained earnings 373 358 268 313 407
SELEcTED INDIcATORS
Return on Capital Employed % 19.34 19.40 14.36 19.81 30.22
Current ratio 1.93 1.92 2.11 1.90 1.89
Earnings per share (`) 17.17 16.67 12.35 14.82 19.02
Debt equity ratio 0.01 0.04 0.16 0.04 0.02
Book value per share (`) 133.08 122.36 112.08 104.38 95.39
Dividend % 55 55 40 100 125
Fixed Assets Turnover ratio 3.94 3.95 4.74 3.94 3.70
Note : Previous years figures have been regrouped/ reclassified, wherever necessary to correspond with the current year classification/ disclosure.
11
RepoRt on CoRpoRate GoveRnanCe
ANNEXURE TO BOARD’S REPORT
A. MANDATORY REQUIREMENTS
1. Company’s philosophy of Corporate Governance
The Company aims at conducting its business efficiently, by following professionally acknowledged good governance policies, thus meeting its obligations to all stakeholders in a balanced and accountable manner.
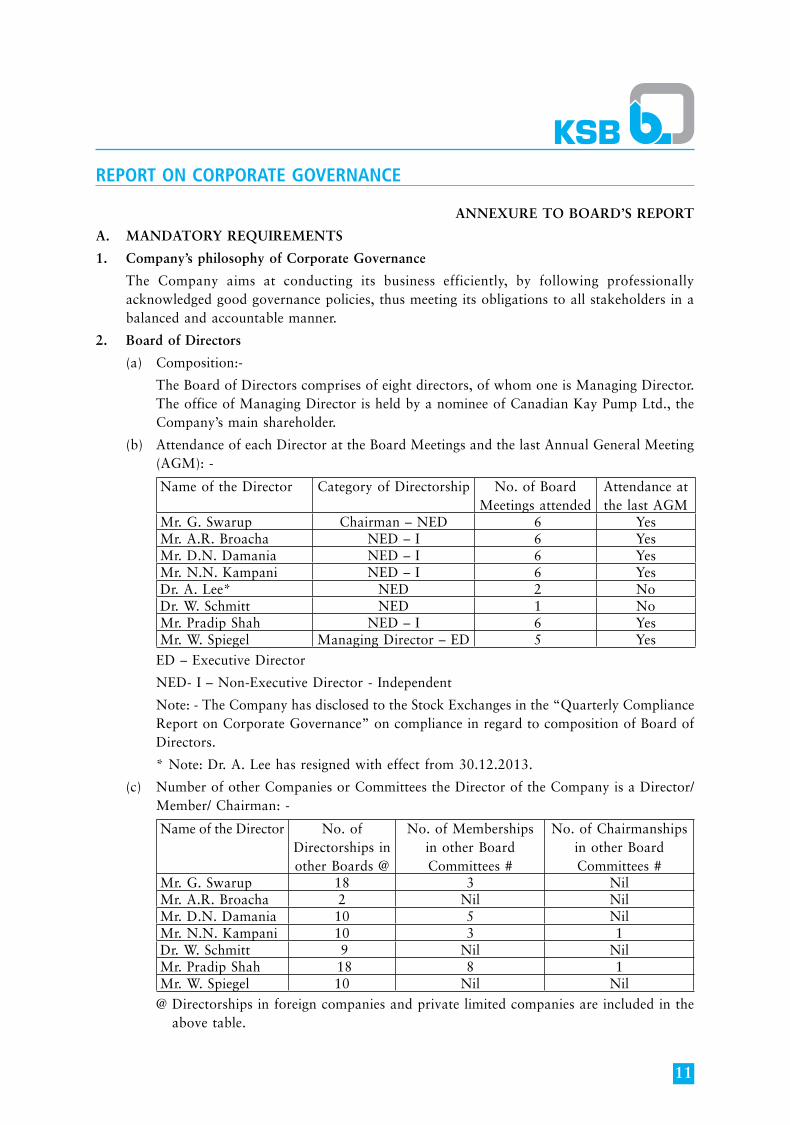
2. Board of Directors
(a) Composition:-
The Board of Directors comprises of eight directors, of whom one is Managing Director. The office of Managing Director is held by a nominee of Canadian Kay Pump Ltd., the Company’s main shareholder.
(b) Attendance of each Director at the Board Meetings and the last Annual General Meeting (AGM): -
Name of the Director Category of Directorship No. of Board Meetings attended
Attendance at the last AGM
Mr. G. Swarup Chairman – NED 6 YesMr. A.R. Broacha NED – I 6 YesMr. D.N. Damania NED – I 6 YesMr. N.N. Kampani NED – I 6 YesDr. A. Lee* NED 2 NoDr. W. Schmitt NED 1 NoMr. Pradip Shah NED – I 6 YesMr. W. Spiegel Managing Director – ED 5 Yes
ED – Executive Director
NED- I – Non-Executive Director - Independent
Note: - The Company has disclosed to the Stock Exchanges in the “Quarterly Compliance Report on Corporate Governance” on compliance in regard to composition of Board of Directors.
* Note: Dr. A. Lee has resigned with effect from 30.12.2013.
(c) Number of other Companies or Committees the Director of the Company is a Director/Member/ Chairman: -
Name of the Director No. of Directorships in other Boards @
No. of Memberships in other Board Committees #
No. of Chairmanships in other Board Committees #
Mr. G. Swarup 18 3 NilMr. A.R. Broacha 2 Nil NilMr. D.N. Damania 10 5 NilMr. N.N. Kampani 10 3 1Dr. W. Schmitt 9 Nil NilMr. Pradip Shah 18 8 1Mr. W. Spiegel 10 Nil Nil
@ Directorships in foreign companies and private limited companies are included in the above table.
12
RepoRt on CoRpoRate GoveRnanCe (Contd.)
# Memberships in Committees other than Audit Committee/ Shareholder Grievance Committee of public limited companies and all Committees of private limited/ foreign companies are excluded in the above table.
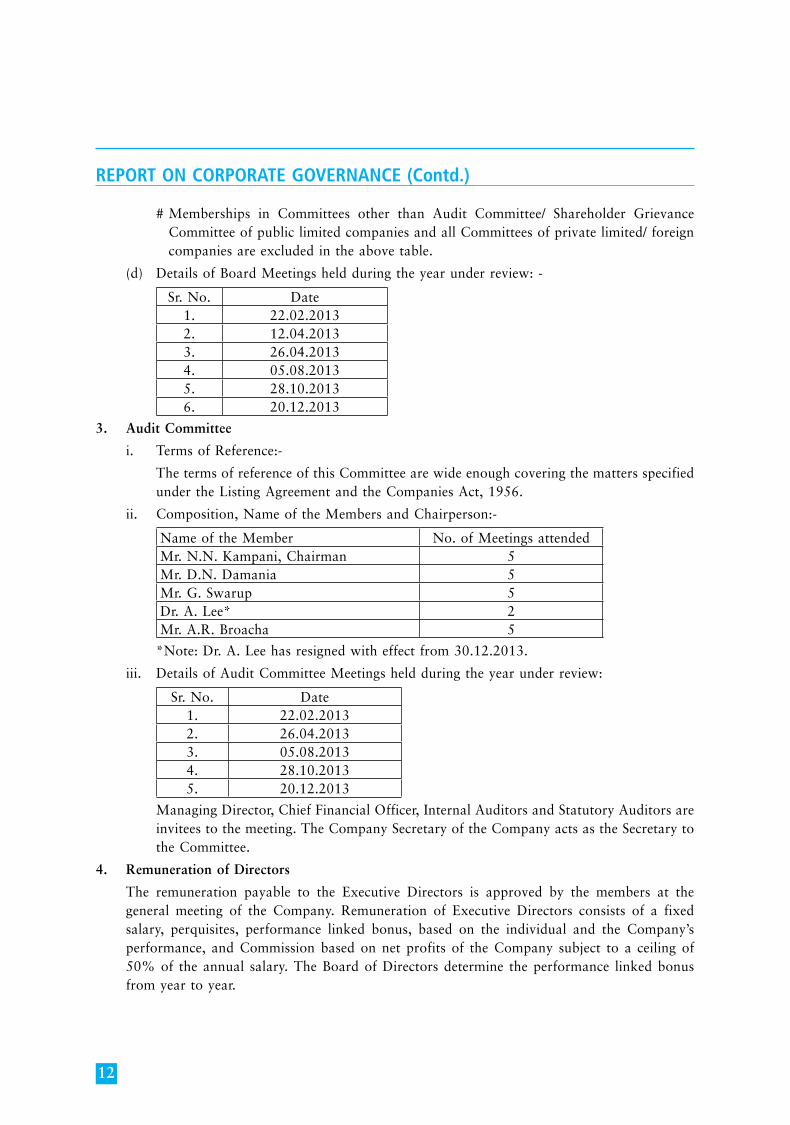
(d) Details of Board Meetings held during the year under review: -
Sr. No. Date1. 22.02.20132. 12.04.20133. 26.04.20134. 05.08.20135. 28.10.20136. 20.12.2013
3. Audit Committee
i. Terms of Reference:-
The terms of reference of this Committee are wide enough covering the matters specified under the Listing Agreement and the Companies Act, 1956.
ii. Composition, Name of the Members and Chairperson:-
Name of the Member No. of Meetings attendedMr. N.N. Kampani, Chairman 5Mr. D.N. Damania 5Mr. G. Swarup 5Dr. A. Lee* 2Mr. A.R. Broacha 5
*Note: Dr. A. Lee has resigned with effect from 30.12.2013.
iii. Details of Audit Committee Meetings held during the year under review:
Sr. No. Date1. 22.02.20132. 26.04.20133. 05.08.20134. 28.10.20135. 20.12.2013
Managing Director, Chief Financial Officer, Internal Auditors and Statutory Auditors are invitees to the meeting. The Company Secretary of the Company acts as the Secretary to the Committee.
4. Remuneration of Directors
The remuneration payable to the Executive Directors is approved by the members at the general meeting of the Company. Remuneration of Executive Directors consists of a fixed salary, perquisites, performance linked bonus, based on the individual and the Company’s performance, and Commission based on net profits of the Company subject to a ceiling of 50% of the annual salary. The Board of Directors determine the performance linked bonus from year to year.
13
RepoRt on CoRpoRate GoveRnanCe (Contd.)
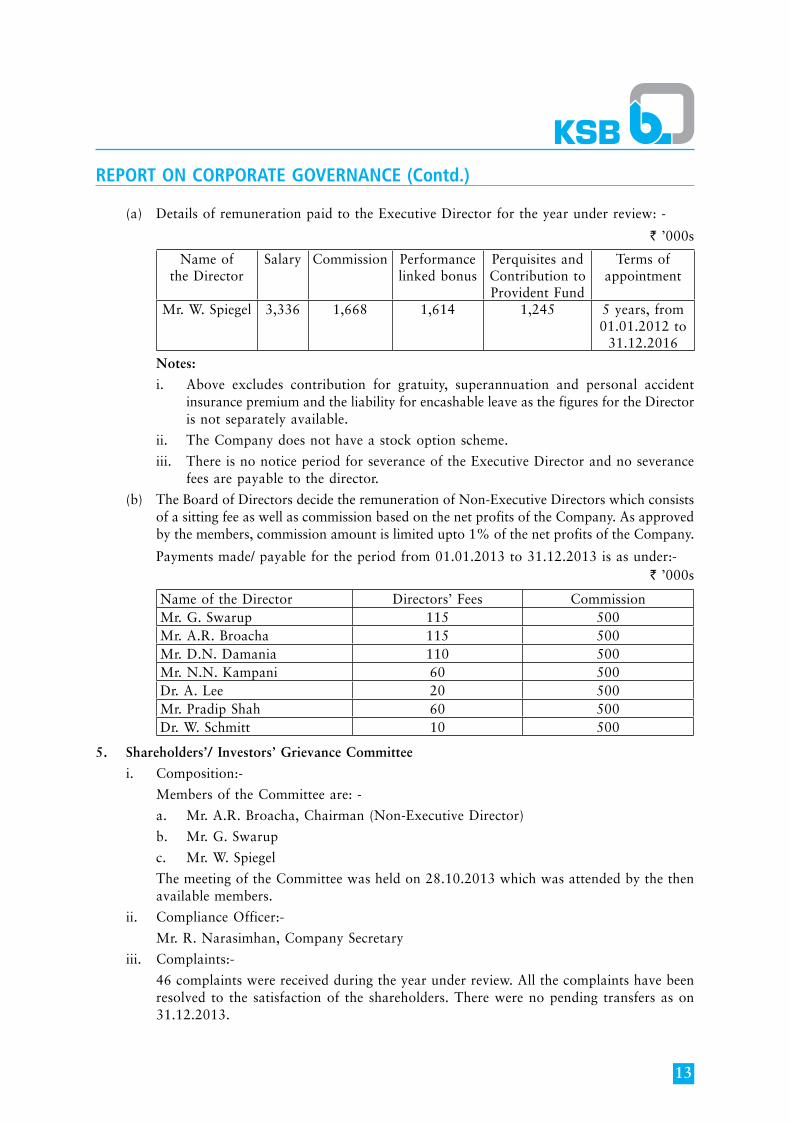
(a) Details of remuneration paid to the Executive Director for the year under review: -
` ’000s
Name ofthe Director
Salary Commission Performance linked bonus
Perquisites and Contribution to Provident Fund
Terms of appointment
Mr. W. Spiegel 3,336 1,668 1,614 1,245 5 years, from 01.01.2012 to
31.12.2016 Notes:
i. Above excludes contribution for gratuity, superannuation and personal accident insurance premium and the liability for encashable leave as the figures for the Director is not separately available.
ii. The Company does not have a stock option scheme.
iii. There is no notice period for severance of the Executive Director and no severance fees are payable to the director.
(b) The Board of Directors decide the remuneration of Non-Executive Directors which consists of a sitting fee as well as commission based on the net profits of the Company. As approved by the members, commission amount is limited upto 1% of the net profits of the Company.
Payments made/ payable for the period from 01.01.2013 to 31.12.2013 is as under:- ` ’000s
Name of the Director Directors’ Fees CommissionMr. G. Swarup 115 500Mr. A.R. Broacha 115 500Mr. D.N. Damania 110 500Mr. N.N. Kampani 60 500Dr. A. Lee 20 500Mr. Pradip Shah 60 500Dr. W. Schmitt 10 500
5. Shareholders’/ Investors’ Grievance Committee
i. Composition:-
Members of the Committee are: -
a. Mr. A.R. Broacha, Chairman (Non-Executive Director)
b. Mr. G. Swarup
c. Mr. W. Spiegel
The meeting of the Committee was held on 28.10.2013 which was attended by the then available members.
ii. Compliance Officer:-
Mr. R. Narasimhan, Company Secretary
iii. Complaints:-
46 complaints were received during the year under review. All the complaints have been resolved to the satisfaction of the shareholders. There were no pending transfers as on 31.12.2013.
14
RepoRt on CoRpoRate GoveRnanCe (Contd.)
6. General Body Meetings
(i) Location and time where last three Annual General Meetings were held:-
Financial Year Date Time Venue2010 07.04.2011 2.00 p.m. Bajaj Bhavan, Mumbai2011 12.04.2012 2.00 p.m. Bajaj Bhavan, Mumbai2012 12.04.2013 2.00 p.m. Bajaj Bhavan, Mumbai
(ii) Special Resolution passed in the previous three Annual General Meetings:-
Financial Year Special Resolution Passed2010 Yes2011 Yes2012 Yes
(iii) Postal Ballot:-
No resolution was required to be passed by means of a postal ballot during the last year.
7. Disclosures
A. Basis of Related Party Transactions
i. Disclosures on materially significant related party transactions that may have potential conflict with the interests of the Company at large:-
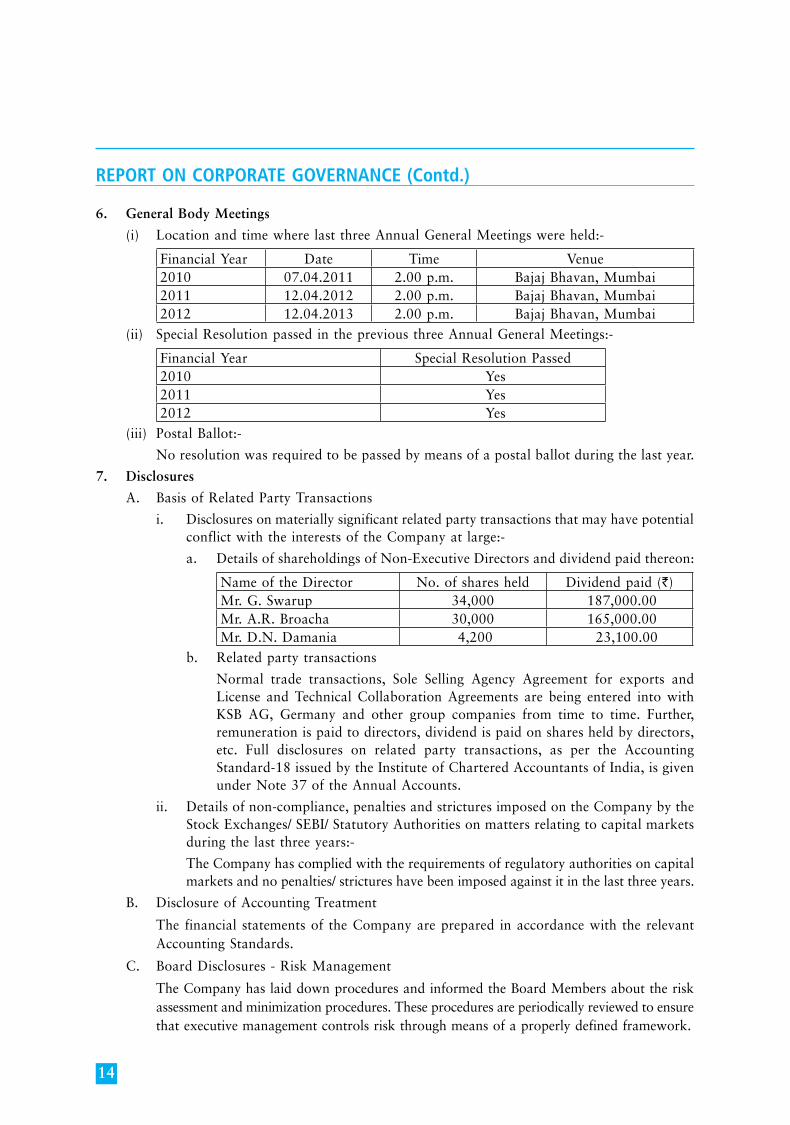
a. Details of shareholdings of Non-Executive Directors and dividend paid thereon:
Name of the Director No. of shares held Dividend paid (`)Mr. G. Swarup 34,000 187,000.00Mr. A.R. Broacha 30,000 165,000.00Mr. D.N. Damania 4,200 23,100.00
b. Related party transactions
Normal trade transactions, Sole Selling Agency Agreement for exports and License and Technical Collaboration Agreements are being entered into with KSB AG, Germany and other group companies from time to time. Further, remuneration is paid to directors, dividend is paid on shares held by directors, etc. Full disclosures on related party transactions, as per the Accounting Standard-18 issued by the Institute of Chartered Accountants of India, is given under Note 37 of the Annual Accounts.
ii. Details of non-compliance, penalties and strictures imposed on the Company by the Stock Exchanges/ SEBI/ Statutory Authorities on matters relating to capital markets during the last three years:-
The Company has complied with the requirements of regulatory authorities on capital markets and no penalties/ strictures have been imposed against it in the last three years.
B. Disclosure of Accounting Treatment
The financial statements of the Company are prepared in accordance with the relevant Accounting Standards.
C. Board Disclosures - Risk Management
The Company has laid down procedures and informed the Board Members about the risk assessment and minimization procedures. These procedures are periodically reviewed to ensure that executive management controls risk through means of a properly defined framework.
15
RepoRt on CoRpoRate GoveRnanCe (Contd.)
8. Means of Communication
i. Quarterly results Published in the newspapers every quarter ii. Newspapers wherein results normally
publishedi. The Economic Timesii. Maharashtra Times
iii. Website, where results are displayed www.ksbindia.co.iniv. Whether website also displays official news
releasesYes
v. The presentations made to Institutional Investors or to the Analysts
No presentation has been made to Institutional Investors or to the Analysts
9. General Shareholder Information
AGM: Date, Time and Venue 11th April, 2014 at 2.00 p.m. at Bajaj Bhavan, Ground Floor (Kamalnayan Bajaj Hall), 226, Nariman Point, Mumbai 400 021.
Financial Year The financial year under review covers the period 1st January, 2013 to 31st December, 2013.
Date of Book Closure 24th March, 2014 to 11th April, 2014 (both days inclusive).
Dividend Payment date 5th May, 2014 onwards.Listing on Stock Exchanges 1. BSE Limited (BSE)
2. National Stock Exchange of India Limited (NSE)The Company has paid the listing fees for the period 1st April, 2013 to 31st March, 2014.
Stock Code and ISIN 1. BSE : 5002492. NSE : KSBPUMPS3. ISIN : INE999A01015
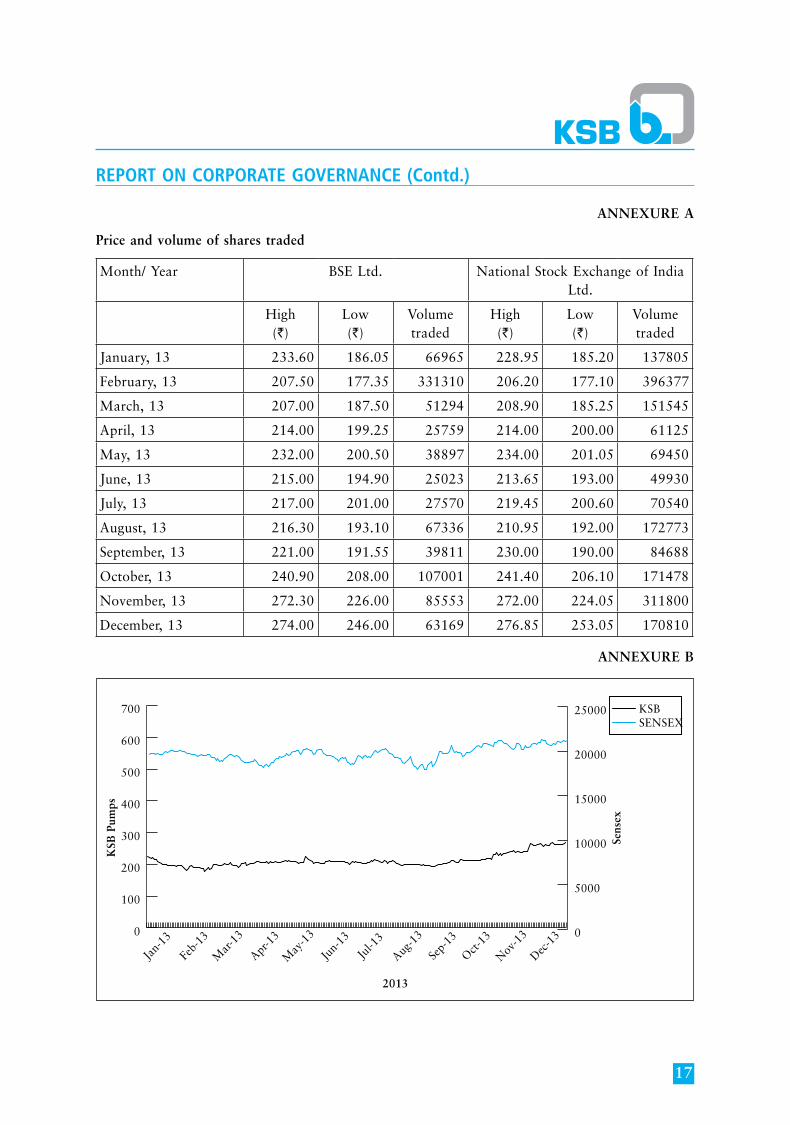
Market Price Data: High, Low during each month in last financial year
Please see Annexure ‘A’
Performance in comparison to broad-based indices such as BSE Sensex, CRISIL index etc.
The performance of the Company’s share relative to the BSE sensitive index is given in Annexure ‘B’.
Registrar and Transfer Agent Link Intime India Pvt. Ltd.Share Transfer System All the transfers received are processed by the Registrar
and Transfer Agent. To facilitate prompt services to the shareholders, the Company Secretary is authorised to approve transfers not exceeding 300 shares per folio per occasion. These are processed on a fortnightly basis. Transmission, consolidation, sub-division of shares and issue of duplicate share certificates are approved by the Share Transfer Committee/ Board of Directors.
Distribution of Shareholding and Shareholding pattern as on 31.12.2013
Please see Annexure ‘C’.
Dematerialisation of shares and liquidity
98.72% of the Paid-up Capital has been dematerialised as on 31st December, 2013
16
RepoRt on CoRpoRate GoveRnanCe (Contd.)
Outstanding GDRs/ ADRs/ Warrants or any Convertible instruments conversion date and likely impact on equity
Not issued.
Plant Locations The Company’s plants are located at Pimpri, Chinchwad, Vambori, Nashik and Coimbatore.
Address for correspondence Shareholders should address correspondence to:Link Intime India Pvt. Ltd.C-13, Pannalal Silk Mills CompoundL.B.S. Marg, Bhandup (W)Mumbai 400 078Tel. No. 022-25946970E-mail: [email protected]
B. NON-MANDATORY REQUIREMENTS
a. Audit Qualifications
The financial statements of the Company are unqualified.
b. Whistle Blower Policy
Our Whistle Blower policy encourages disclosure in good faith of any wrongful conduct on a matter of general concern and protects the whistle blower from any adverse personnel action.
On behalf of the Board of Directors
G. SWARUPChairman
Mumbai, 11th February, 2014
17
RepoRt on CoRpoRate GoveRnanCe (Contd.)
0
100
200
300
400
500
600
700
Dec-1
3
Nov
-13
Oct-
13
Sep-
13
Aug-1
3
Jul-1
3
Jun-
13
May
-13
Apr-1
3
Mar
-13
Feb-
13
Jan-
130
5000
10000
15000
20000
25000
KSB
Pum
ps
Sens
ex
2013
KSBSENSEX
ANNEXURE A
Price and volume of shares traded
Month/ Year BSE Ltd. National Stock Exchange of India Ltd.
High(`)
Low(`)
Volume traded
High(`)
Low(`)
Volumetraded
January, 13 233.60 186.05 66965 228.95 185.20 137805
February, 13 207.50 177.35 331310 206.20 177.10 396377
March, 13 207.00 187.50 51294 208.90 185.25 151545
April, 13 214.00 199.25 25759 214.00 200.00 61125
May, 13 232.00 200.50 38897 234.00 201.05 69450
June, 13 215.00 194.90 25023 213.65 193.00 49930
July, 13 217.00 201.00 27570 219.45 200.60 70540
August, 13 216.30 193.10 67336 210.95 192.00 172773
September, 13 221.00 191.55 39811 230.00 190.00 84688
October, 13 240.90 208.00 107001 241.40 206.10 171478
November, 13 272.30 226.00 85553 272.00 224.05 311800
December, 13 274.00 246.00 63169 276.85 253.05 170810
ANNEXURE B
18
RepoRt on CoRpoRate GoveRnanCe (Contd.)
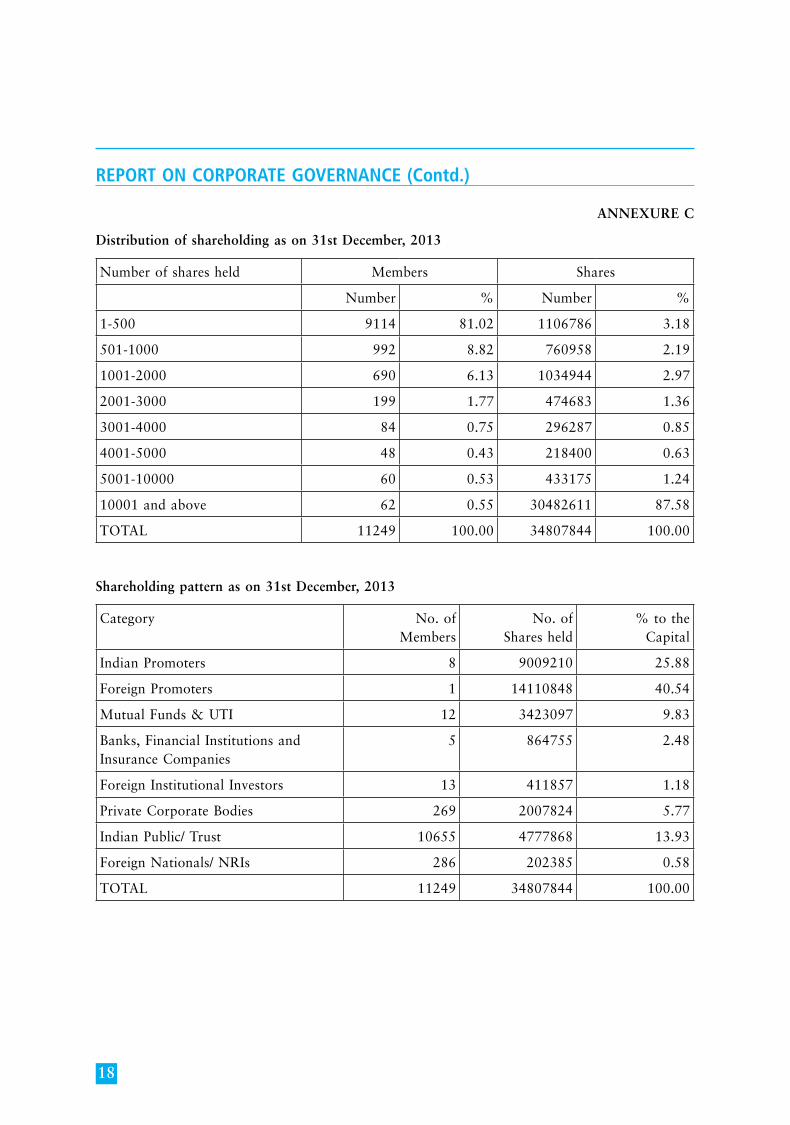
ANNEXURE C
Distribution of shareholding as on 31st December, 2013
Number of shares held Members Shares
Number % Number %
1-500 9114 81.02 1106786 3.18
501-1000 992 8.82 760958 2.19
1001-2000 690 6.13 1034944 2.97
2001-3000 199 1.77 474683 1.36
3001-4000 84 0.75 296287 0.85
4001-5000 48 0.43 218400 0.63
5001-10000 60 0.53 433175 1.24
10001 and above 62 0.55 30482611 87.58
TOTAL 11249 100.00 34807844 100.00
Shareholding pattern as on 31st December, 2013
Category No. ofMembers
No. ofShares held
% to theCapital
Indian Promoters 8 9009210 25.88
Foreign Promoters 1 14110848 40.54
Mutual Funds & UTI 12 3423097 9.83
Banks, Financial Institutions and Insurance Companies
5 864755 2.48
Foreign Institutional Investors 13 411857 1.18
Private Corporate Bodies 269 2007824 5.77
Indian Public/ Trust 10655 4777868 13.93
Foreign Nationals/ NRIs 286 202385 0.58
TOTAL 11249 34807844 100.00
19
RepoRt on CoRpoRate GoveRnanCe (Contd.)
CERTIFICATE ON CORPORATE GOVERNANCE
To the Members of KSB Pumps Limited
We have examined the compliance with conditions of Corporate Governance by KSB Pumps Ltd., for the year ended on 31st December, 2013, as stipulated in clause 49 of the Listing Agreement of the said Company with the stock exchanges.
The compliance with conditions of Corporate Governance is the responsibility of the management. Our examination was limited to the procedures and implementation thereof adopted by the Company for ensuring the compliance of the conditions of the Corporate Governance. It is neither an audit nor an expression of opinion on the financial statements of the Company.
In our opinion and to the best of our information and according to the explanations given to us and the representations made by the management, we certify that the Company has complied with the conditions of Corporate Governance as stipulated in the above mentioned Listing Agreement.
Based on the representation received from the Company and certified by the Registrars and Transfer Agent, no investor grievance is pending for a period exceeding one month as on 31st December, 2013 against the Company and the Registrars and Transfer Agents have reported to the Shareholders/ Investors Grievances Committee on the status of the grievances.
We further state that such compliance is neither an assurance as to the future viability of the Company nor the efficiency or effectiveness with which the management has conducted the affairs of the Company.
For Nilesh Shah & AssociatesCompany Secretaries
(Nilesh Shah)Partner
Mumbai, 11th February, 2014 (FCS-4554) C.P. No.: 2631
20
annexuRe to BoaRd’s RepoRt
A. DISCLOSURE UNDER CLAUSE 32
Sr. No.
Disclosure of loans/ advances/ investments/ Outstanding during the year
As at31st December,
2013`
Maximumamount during
the year`
1. Loans and advances in the nature of loans to subsidiary NIL NIL
2. Loans and advances in the nature of loans to associate NIL NIL
3. Loans and advances in the nature of loans where there is a. No repayment schedule or repayment beyond seven
years of the Companies Act, 1956b. No interest or interest below section 372A of the
Companies Act, 1956
NIL NIL
4. Loans and advances in the nature of loans to firms/ companies in which directors are interested
NIL NIL
B. DECLARATION UNDER CLAUSE 49
All Board members and senior management personnel have affirmed compliance with the Code of Conduct for the year 2013.
W. SpiegelMumbai, 11th February, 2014 Managing Director
21
annexuRe to BoaRd’s RepoRt
Information pursuant to Section 217 (2A)(b)(ii) of the Companies Act, 1956 read with the Companies (Particulars of Employees) Rules, 1975
Name Age(Years)
Qualifications Designation/ Nature of Duties/Commencement of Employment
and Experience (Years)
RemunerationReceived
(`)
Name of Previous Employer, Post held
(a) Employed throughout the year
Spiegel W. + 62 Graduate MechanicalEngineer
Managing Director (Board Member)
01.01.2002 48 7,863,000 KSB AG, Germany -Head of Division (Industry, Water & Sewage)
Verghese Oommen
61 B.Com., A.C.A.
Director - Finance
18.11.1996 39 7,376,749 The Tata Engg. & Locomotive Co. Ltd.Div. Manager (Finance)
(b) Employed for part of the year
Putarjunan P 64 B.E. (Mech) General Manager - Operations(Valves)
05.05.1997 40 1,124,437 ITW Signode India Ltd.Dy. General Manager
Notes:
1) Remuneration as shown above includes salary, H.R.A., Company’s contribution to Provident Fund, Leave Travel Assistance and expenditure incurred by the Company on accommodation and other facilities.
2) Perquisites have been valued on the basis of Income-tax Act, 1961 and rules thereof.3) The above employees are not relative of any Director of the Company.4) +The appointment is governed by the terms approved by members/ Government of India. All other appointments are
contractual.
On behalf of the Board of Directors
G. SWARUPMumbai, 11th February, 2014 Chairman
Statement pursuant to section 212 of the Companies Act, 1956 relating to Subsidiary CompanyPofran Sales & Agency Ltd.
(A) The financial year of the Subsidiary Company Year ended 31st December, 2013
(B) (a) Number of shares held by KSB Pumps Limited in Subsidiary Company 5,000 Equity shares of ` 100 each
(b) Extent of holding 100.00%(C) The net aggregate of Profits/ (Losses) of the Subsidiary Company so far it
concerns the members of KSB Pumps Limited:(a) not dealt with in the accounts of KSB Pumps Limited for the year
ended 31st December, 2013 amounted to -(i) for the Subsidiary’s financial year ended as in (A) above `12.60 Million(ii) for the previous financial years of the Subsidiary since it became
Subsidiary `50.47 Million(b) dealt with in the accounts of KSB Pumps Limited for the year ended
31st December, 2013 amounted to -(i) for the Subsidiary’s financial year ended as in (A) above NIL(ii) for the previous financial years of the Subsidiary since it became
Subsidiary `18.00 Million
G. Swarup Chairman A.R. Broacha N.N. Kampani Dr. Stephan Bross Directors Pradip Shah Dr. W. Schmitt R. Narasimhan W. Spiegel Managing DirectorMumbai, 11th February, 2014 Company Secretary
22
annexuRe to BoaRd’s RepoRt
A. CONSERVATION OF ENERGY
Improvements for conservation of energy are ongoing. Some of the measures recently implemented towards conservation of energy include installation of wind mill and solar panels for street lights, bio gas plant for utilizing waste food from canteen and solar panels for generating hot water in the canteen.
B. TECHNOLOGY ABSOPRTION
1. P e r f o r m a n c e a n d P r o d u c t Improvements
New hydraulics were introduced in 4” Submersible products thereby increasing the available range.
2. Research and Development
Optimization of submersible motors has been completed. Development of submersible pumps with high head per stage has also been completed.
3. Benefits of Research and Development
4” Submersible products now have better performance and are also cost effective.
4. Future Plans
Introduction of additional hydraulics in 6” submersible products is planned.
5. Expenditure on Research and Development
(` in Million)
Year ended 31.12.2013
Year ended 31.12.2012
(a) Capital - -(b) Recurring 2.43 2.06(c) Total 2.43 2.06(d) Total R&D
Expenditure asPercentage of total Turnover
0.03% 0.03%
6. Technology Absorption, Adaptation and Innovation
Worldwide rationalization of end suction pumps is under progress. The Company is playing major role in this project.
C. FOREIGN EXCHANGE EARNINGS AND OUTGO
Exports during the year were ` 1068 Million. Total foreign exchange earned during the year was ` 1137 Million. Export orders outstanding for execution are ` 611 Million. Total foreign exchange used during the year was ` 574 Million.
On behalf of the Board of Directors
G SWARUPChairman
Mumbai, 11th February, 2014
23
INDEPENDENT AUDITORS’ REPORT
TO THE MEMBERS OFKSB PUMPS LIMITED
Report on the Financial Statements
We have audited the accompanying financial statements of KSB PUMPS LIMITED (“the Company”), which comprise the Balance Sheet as at 31st December, 2013, the Statement of Profit and Loss and the Cash Flow Statement for the year then ended, and a summary of the significant accounting policies and other explanatory information.
Management’s Responsibility for the Financial Statements
The Company’s Management is responsible for the preparation of these financial statements that give a true and fair view of the financial position, financial performance and cash flows of the Company in accordance with the Accounting Standards notified under the Companies Act, 1956 (“the Act”) (which continue to be applicable in respect of Section 133 of the Companies Act, 2013 in terms of General Circular 15/2013 dated 13th September, 2013 of the Ministry of Corporate Affairs) and in accordance with the accounting principles generally accepted in India. This responsibility includes the design, implementation and maintenance of internal control relevant to the preparation and presentation of the financial statements that give a true and fair view and are free from material misstatement, whether due to fraud or error.
Auditors’ Responsibility
Our responsibility is to express an opinion on these financial statements based on our audit. We conducted our audit in accordance with the Standards on Auditing issued by the Institute of Chartered Accountants of India. Those Standards require that we comply with ethical requirements and plan and perform the audit to obtain reasonable assurance about whether the financial statements are free from material misstatement.
An audit involves performing procedures to obtain audit evidence about the amounts and the disclosures in the financial statements. The procedures selected depend on the auditor’s judgment, including the assessment of the risks of material misstatement of the financial statements, whether due to fraud or error. In making those risk assessments, the auditor considers internal control relevant to the Company’s preparation and fair presentation of the financial statements in order to design audit procedures that are appropriate in the circumstances, but not for the purpose of expressing an opinion on the effectiveness of the Company’s internal control. An audit also includes evaluating the appropriateness of the accounting policies used and the reasonableness of the accounting estimates made by the Management, as well as evaluating the overall presentation of the financial statements.
We believe that the audit evidence we have obtained is sufficient and appropriate to provide a basis for our audit opinion.
Opinion
In our opinion and to the best of our information and according to the explanations given to us, the aforesaid financial statements give the information required by the Act in the manner so required and give a true and fair view in conformity with the accounting principles generally accepted in India:
(a) in the case of the Balance Sheet, of the state of affairs of the Company as at 31st December, 2013;
(b) in the case of the Statement of Profit and Loss, of the profit of the Company for the year ended on that date; and
(c) in the case of the Cash Flow Statement, of the cash flows of the Company for the year ended on that date.
24
INDEPENDENT AUDITORS’ REPORT (Contd.)
Report on Other Legal and Regulatory Requirements
1. As required by the Companies (Auditor’s Report) Order, 2003 (“the Order”) issued by the Central Government in terms of Section 227(4A) of the Act, we give in the Annexure a statement on the matters specified in paragraphs 4 and 5 of the Order.
2. As required by Section 227(3) of the Act, we report that:
(a) We have obtained all the information and explanations which to the best of our knowledge and belief were necessary for the purposes of our audit,
(b) In our opinion, proper books of account as required by law have been kept by the Company so far as it appears from our examination of those books,
(c) The Balance Sheet, the Statement of Profit and Loss, and the Cash Flow Statement dealt with by this Report are in agreement with the books of account,
(d) In our opinion, the Balance Sheet, the Statement of Profit and Loss, and the Cash Flow Statement comply with the Accounting Standards notified under the Act (which continue to be applicable in respect of Section 133 of the Companies Act, 2013 in terms of General Circular 15/2013 dated 13th September, 2013 of the Ministry of Corporate Affairs).
(e) On the basis of the written representations received from the directors as on 31st December, 2013 taken on record by the Board of Directors, none of the directors is disqualified as on 31st December, 2013, from being appointed as a director in terms of Section 274(1)(g) of the Act.
For Deloitte Haskins & Sells LLPChartered Accountants
(Registration No. 117366W/ W-100018)
Hemant M. JoshiPartner
Membership No. 038019
Pune, 11th February, 2014
25
ANNEXURE TO THE INDEPENDENT AUDITORS’ REPORT
(Referred to in paragraph 1 under ‘Report on Other Legal and Regulatory Requirements’ section of our report of even date)
i) (a) The Company has maintained proper records showing full particulars including quantitative details and situation of fixed assets.
(b) As explained to us, the management has physically verified most of the fixed assets during the year, other than patterns lying with third parties for which confirmations have been obtained from parties in most of the cases, and no material discrepancies were noticed on such verification. In our opinion, the frequency of physical verification of fixed assets is reasonable having regard to the size of the Company and the nature of the assets.
(c) The fixed assets disposed off during the year, in our opinion, do not constitute substantial part of the fixed assets of the Company and such disposal has, in our opinion, not affected the going concern status of the Company.
ii) (a) Inventories have been physically verified during the period by the management. In respect of inventories lying with third parties confirmation have been obtained for a major portion of inventories. In our opinion, the frequency of verification is reasonable.
(b) In our opinion, the procedures of physical verification of inventory followed by the management are reasonable and adequate in relation to the size of the Company and the nature of its business.
(c) In our opinion and according to the information and explanations given to us, the Company has maintained proper records of its inventories. The discrepancies noticed on verification between physical stocks and book stocks were not material having regard to the size of operations of the Company and have been properly dealt with in the books of accounts.
iii) According to the information and explanations given to us, the Company has not granted or taken any loans, secured or unsecured, to or from companies, firms or other parties covered in the register maintained under Section 301 of the Companies Act, 1956. Accordingly clauses (iii)(a) to (iii)(g) of paragraph 4 of the Companies (Auditor’s Report) Order, 2003 are not applicable.
iv) In our opinion and according to the information and explanations given to us and having regard to the explanation that some of the items purchased/ sold are of a special nature and comparable alternative quotations/ prices are not available, there is an adequate internal control system commensurate with the size of the Company and the nature of its business, with regard to purchase of inventory and fixed assets and for the sale of goods and services. There is no continuing failure to correct major weaknesses, if any, in internal controls system.
v) (a) Based upon the audit procedures applied by us and according to the information and explanations given to us, contracts or arrangements that need to be entered into the register maintained in pursuance of Section 301 of the Companies Act, 1956 have been so entered.
(b) The transactions made in pursuance of such contracts or arrangements have been made at prices which are reasonable having regard to the prevailing market prices at the relevant time.
vi) The Company has not accepted any deposits from the public to which the provisions of Sections 58A, 58AA or any other relevant provisions of the Companies Act, 1956 and the rules framed there under apply.
vii) In our opinion, the Company has an internal audit system commensurate with its size and nature of its business.
viii) We have broadly reviewed the books of account maintained by the Company pursuant to the notification of the Central
26
ANNEXURE TO THE INDEPENDENT AUDITORS’ REPORT (Contd.)
Government for the maintenance of cost records under Section 209(1)(d) of the Companies Act, 1956 and, on the basis of the information received, are of the opinion that prima facie the prescribed accounts and records have been maintained/ are being made up. We have not, however, made a detailed examination of the records with a view to determining whether they are accurate or complete.
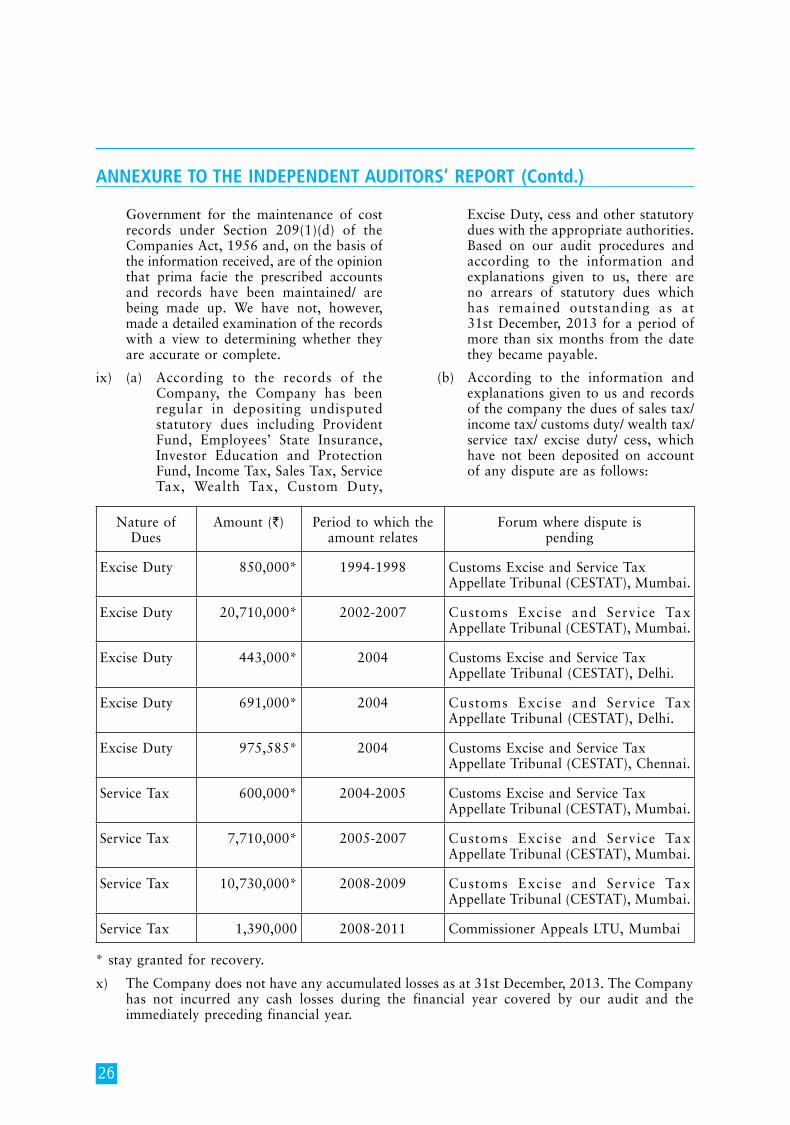
ix) (a) According to the records of the Company, the Company has been regular in depositing undisputed statutory dues including Provident Fund, Employees’ State Insurance, Investor Education and Protection Fund, Income Tax, Sales Tax, Service Tax, Wealth Tax, Custom Duty,
Excise Duty, cess and other statutory dues with the appropriate authorities. Based on our audit procedures and according to the information and explanations given to us, there are no arrears of statutory dues which has remained outstanding as at 31st December, 2013 for a period of more than six months from the date they became payable.
(b) According to the information and explanations given to us and records of the company the dues of sales tax/ income tax/ customs duty/ wealth tax/ service tax/ excise duty/ cess, which have not been deposited on account of any dispute are as follows:
Nature ofDues
Amount (`) Period to which theamount relates
Forum where dispute is pending
Excise Duty 850,000* 1994-1998 Customs Excise and Service TaxAppellate Tribunal (CESTAT), Mumbai.
Excise Duty 20,710,000* 2002-2007 Customs Excise and Service Tax Appellate Tribunal (CESTAT), Mumbai.
Excise Duty 443,000* 2004 Customs Excise and Service TaxAppellate Tribunal (CESTAT), Delhi.
Excise Duty 691,000* 2004 Customs Excise and Service Tax Appellate Tribunal (CESTAT), Delhi.
Excise Duty 975,585* 2004 Customs Excise and Service TaxAppellate Tribunal (CESTAT), Chennai.
Service Tax 600,000* 2004-2005 Customs Excise and Service TaxAppellate Tribunal (CESTAT), Mumbai.
Service Tax 7,710,000* 2005-2007 Customs Excise and Service Tax Appellate Tribunal (CESTAT), Mumbai.
Service Tax 10,730,000* 2008-2009 Customs Excise and Service Tax Appellate Tribunal (CESTAT), Mumbai.
Service Tax 1,390,000 2008-2011 Commissioner Appeals LTU, Mumbai
* stay granted for recovery.
x) The Company does not have any accumulated losses as at 31st December, 2013. The Company has not incurred any cash losses during the financial year covered by our audit and the immediately preceding financial year.
27
xi) Based on our audit procedures and according to the information and explanations given to us, the Company has not defaulted in repayment of dues to financial institution/ bank/ debenture holders.
xii) According to the information and explanations given to us, the Company has not granted any loans and advances on the basis of security by way of pledge of shares, debentures and other securities.
xiii) The Company is not a chit fund, nidhi/ mutual benefit fund and therefore the requirements pertaining to such class of companies is not applicable.
xiv) The Company is not dealing or trading in shares, securities, debentures and other investments.
xv) According to the information and explanations given to us, the Company has not given any guarantee for loans taken by others from banks or financial institutions.
xvi) To the best of our knowledge and belief and according to the information and explanations given to us, in our opinion, the Company has not availed any term loans during the year.
xvii) According to the information and explanations given to us, and on an overall examination of the Balance Sheet of the Company, funds raised on short term basis have not been used during the year for long term investments.
ANNEXURE TO THE INDEPENDENT AUDITORS’ REPORT (Contd.)
xviii) The Company has not made any preferential allotment of shares during the year to parties and companies covered in the Register maintained under Section 301 of the Companies Act, 1956.
xix) The Company has not issued any debentures during the year and therefore the question of creating security or charge in respect thereof does not arise.
xx) The Company has not made any public issue during the year and therefore the question of disclosing the end use of money does not arise.
xxi) Based upon the audit procedures performed and according to the information and explanations given and representations made by the management, we report that no fraud on or by the Company has been noticed or reported during the year.
For Deloitte Haskins & Sells LLPChartered Accountants
(Registration No. 117366W/ W-100018)
Hemant M. JoshiPartner
Membership No. 038019
Pune, 11th February, 2014
28
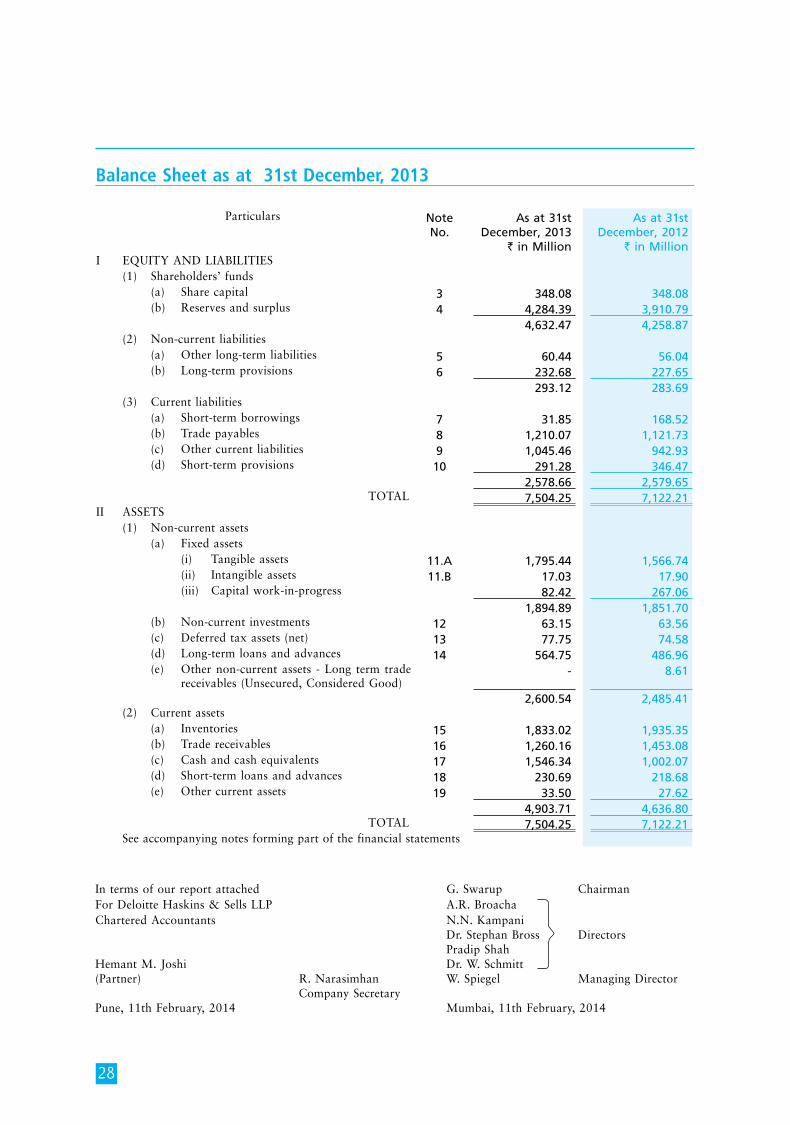
Balance Sheet as at 31st December, 2013
In terms of our report attached G. Swarup ChairmanFor Deloitte Haskins & Sells LLP A.R. Broacha Chartered Accountants N.N. Kampani Dr. Stephan Bross Directors Pradip Shah Hemant M. Joshi Dr. W. Schmitt (Partner) R. Narasimhan W. Spiegel Managing Director Company Secretary Pune, 11th February, 2014 Mumbai, 11th February, 2014
Particulars Note No.
As at 31st December, 2013
` in Million
As at 31st December, 2012
` in Million I EQUITY AND LIABILITIES (1) Shareholders’ funds
(a) Share capital 3 348.08 348.08 (b) Reserves and surplus 4 4,284.39 3,910.79
4,632.47 4,258.87 (2) Non-current liabilities
(a) Other long-term liabilities 5 60.44 56.04 (b) Long-term provisions 6 232.68 227.65
293.12 283.69 (3) Current liabilities
(a) Short-term borrowings 7 31.85 168.52 (b) Trade payables 8 1,210.07 1,121.73 (c) Other current liabilities 9 1,045.46 942.93 (d) Short-term provisions 10 291.28 346.47
2,578.66 2,579.65 TOTAL 7,504.25 7,122.21
II ASSETS (1) Non-current assets
(a) Fixed assets (i) Tangible assets 11.A 1,795.44 1,566.74 (ii) Intangible assets 11.B 17.03 17.90 (iii) Capital work-in-progress 82.42 267.06
1,894.89 1,851.70 (b) Non-current investments 12 63.15 63.56 (c) Deferred tax assets (net) 13 77.75 74.58 (d) Long-term loans and advances 14 564.75 486.96 (e) Other non-current assets - Long term trade
receivables (Unsecured, Considered Good) - 8.61
2,600.54 2,485.41 (2) Current assets
(a) Inventories 15 1,833.02 1,935.35 (b) Trade receivables 16 1,260.16 1,453.08 (c) Cash and cash equivalents 17 1,546.34 1,002.07 (d) Short-term loans and advances 18 230.69 218.68 (e) Other current assets 19 33.50 27.62
4,903.71 4,636.80TOTAL 7,504.25 7,122.21
See accompanying notes forming part of the financial statements
29
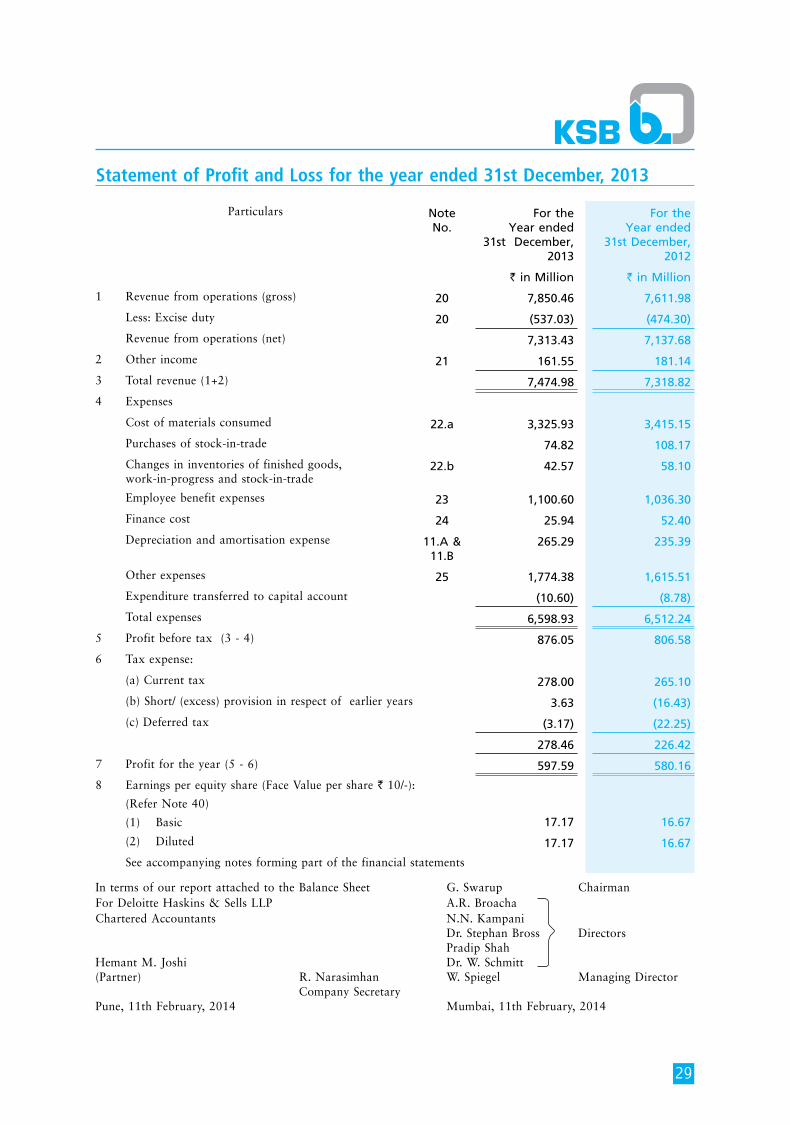
Statement of Profit and Loss for the year ended 31st December, 2013
Particulars Note No.
For the Year ended
31st December, 2013
For the Year ended
31st December, 2012
` in Million ` in Million
1 Revenue from operations (gross) 20 7,850.46 7,611.98
Less: Excise duty 20 (537.03) (474.30)
Revenue from operations (net) 7,313.43 7,137.68
2 Other income 21 161.55 181.14
3 Total revenue (1+2) 7,474.98 7,318.82
4 Expenses
Cost of materials consumed 22.a 3,325.93 3,415.15
Purchases of stock-in-trade 74.82 108.17
Changes in inventories of finished goods, work-in-progress and stock-in-trade
22.b 42.57 58.10
Employee benefit expenses 23 1,100.60 1,036.30
Finance cost 24 25.94 52.40
Depreciation and amortisation expense 11.A & 11.B
265.29 235.39
Other expenses 25 1,774.38 1,615.51
Expenditure transferred to capital account (10.60) (8.78)
Total expenses 6,598.93 6,512.24
5 Profit before tax (3 - 4) 876.05 806.58
6 Tax expense:
(a) Current tax 278.00 265.10
(b) Short/ (excess) provision in respect of earlier years 3.63 (16.43)
(c) Deferred tax (3.17) (22.25)
278.46 226.42
7 Profit for the year (5 - 6) 597.59 580.16
8 Earnings per equity share (Face Value per share ` 10/-):
(Refer Note 40)
(1) Basic 17.17 16.67
(2) Diluted 17.17 16.67
See accompanying notes forming part of the financial statements
In terms of our report attached to the Balance Sheet G. Swarup ChairmanFor Deloitte Haskins & Sells LLP A.R. Broacha Chartered Accountants N.N. Kampani Dr. Stephan Bross Directors Pradip Shah Hemant M. Joshi Dr. W. Schmitt (Partner) R. Narasimhan W. Spiegel Managing Director Company Secretary Pune, 11th February, 2014 Mumbai, 11th February, 2014
30
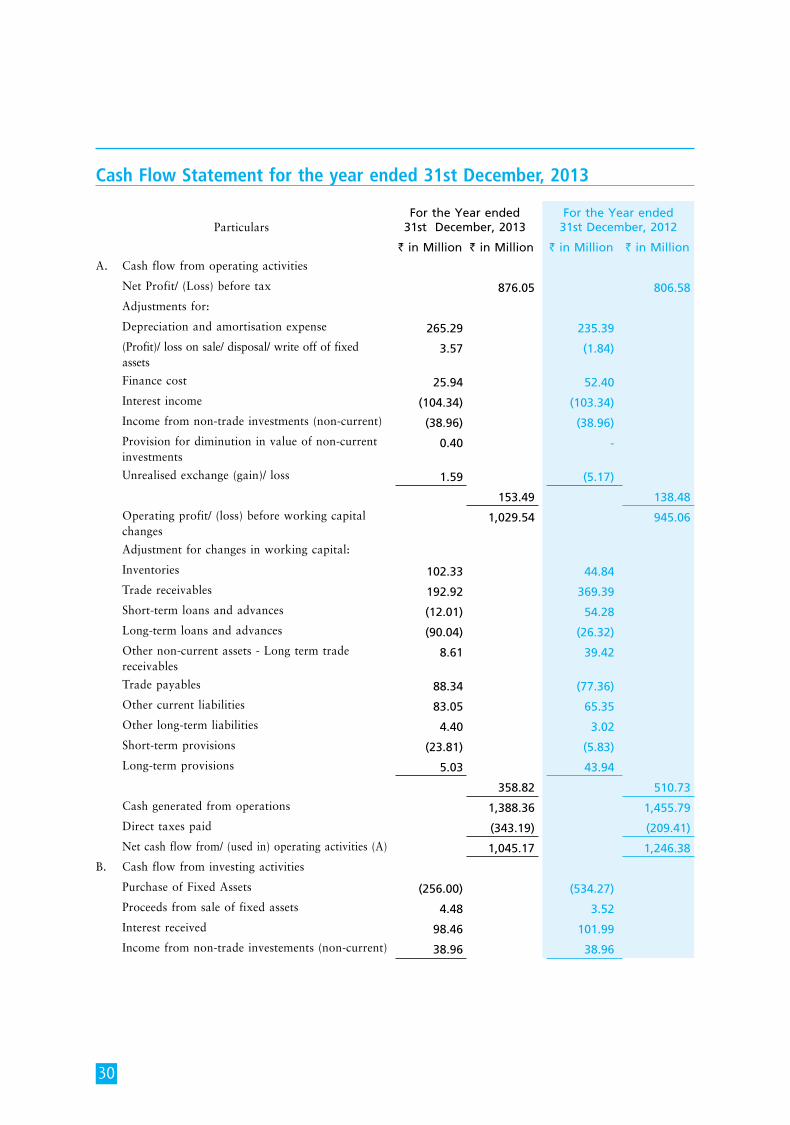
Cash Flow Statement for the year ended 31st December, 2013
ParticularsFor the Year ended
31st December, 2013For the Year ended
31st December, 2012
` in Million ` in Million ` in Million ` in Million
A. Cash flow from operating activities
Net Profit/ (Loss) before tax 876.05 806.58
Adjustments for:
Depreciation and amortisation expense 265.29 235.39
(Profit)/ loss on sale/ disposal/ write off of fixed assets
3.57 (1.84)
Finance cost 25.94 52.40
Interest income (104.34) (103.34)
Income from non-trade investments (non-current) (38.96) (38.96)
Provision for diminution in value of non-current investments
0.40 -
Unrealised exchange (gain)/ loss 1.59 (5.17)
153.49 138.48
Operating profit/ (loss) before working capital changes
1,029.54 945.06
Adjustment for changes in working capital:
Inventories 102.33 44.84
Trade receivables 192.92 369.39
Short-term loans and advances (12.01) 54.28
Long-term loans and advances (90.04) (26.32)
Other non-current assets - Long term trade receivables
8.61 39.42
Trade payables 88.34 (77.36)
Other current liabilities 83.05 65.35
Other long-term liabilities 4.40 3.02
Short-term provisions (23.81) (5.83)
Long-term provisions 5.03 43.94
358.82 510.73
Cash generated from operations 1,388.36 1,455.79
Direct taxes paid (343.19) (209.41)
Net cash flow from/ (used in) operating activities (A) 1,045.17 1,246.38
B. Cash flow from investing activities
Purchase of Fixed Assets (256.00) (534.27)
Proceeds from sale of fixed assets 4.48 3.52
Interest received 98.46 101.99
Income from non-trade investements (non-current) 38.96 38.96
31
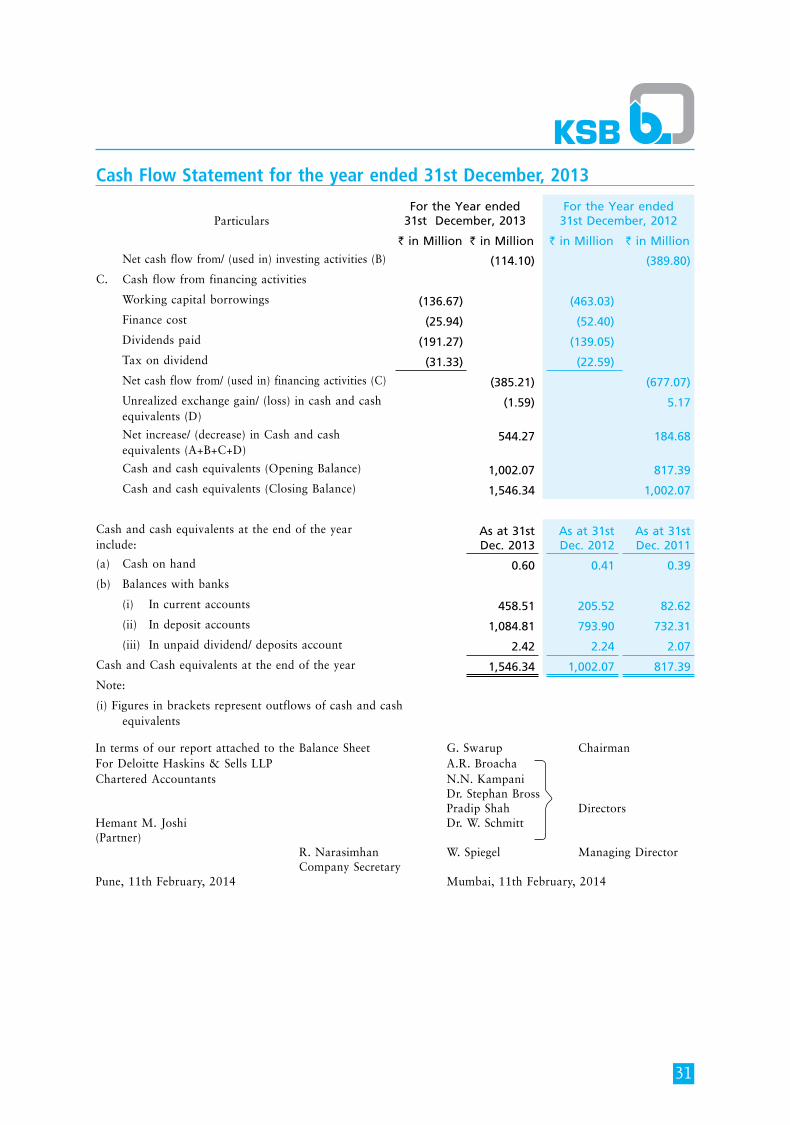
Cash Flow Statement for the year ended 31st December, 2013
ParticularsFor the Year ended
31st December, 2013For the Year ended
31st December, 2012
` in Million ` in Million ` in Million ` in Million
Net cash flow from/ (used in) investing activities (B) (114.10) (389.80)
C. Cash flow from financing activities
Working capital borrowings (136.67) (463.03)
Finance cost (25.94) (52.40)
Dividends paid (191.27) (139.05)
Tax on dividend (31.33) (22.59)
Net cash flow from/ (used in) financing activities (C) (385.21) (677.07)
Unrealized exchange gain/ (loss) in cash and cash equivalents (D)
(1.59) 5.17
Net increase/ (decrease) in Cash and cash equivalents (A+B+C+D)
544.27 184.68
Cash and cash equivalents (Opening Balance) 1,002.07 817.39
Cash and cash equivalents (Closing Balance) 1,546.34 1,002.07
Cash and cash equivalents at the end of the year include:
As at 31st Dec. 2013
As at 31st Dec. 2012
As at 31st Dec. 2011
(a) Cash on hand 0.60 0.41 0.39
(b) Balances with banks
(i) In current accounts 458.51 205.52 82.62
(ii) In deposit accounts 1,084.81 793.90 732.31
(iii) In unpaid dividend/ deposits account 2.42 2.24 2.07
Cash and Cash equivalents at the end of the year 1,546.34 1,002.07 817.39
Note:
(i) Figures in brackets represent outflows of cash and cash equivalents
In terms of our report attached to the Balance Sheet G. Swarup ChairmanFor Deloitte Haskins & Sells LLP A.R. Broacha Chartered Accountants N.N. Kampani Dr. Stephan Bross Pradip Shah DirectorsHemant M. Joshi Dr. W. Schmitt (Partner) R. Narasimhan W. Spiegel Managing Director Company Secretary Pune, 11th February, 2014 Mumbai, 11th February, 2014
32
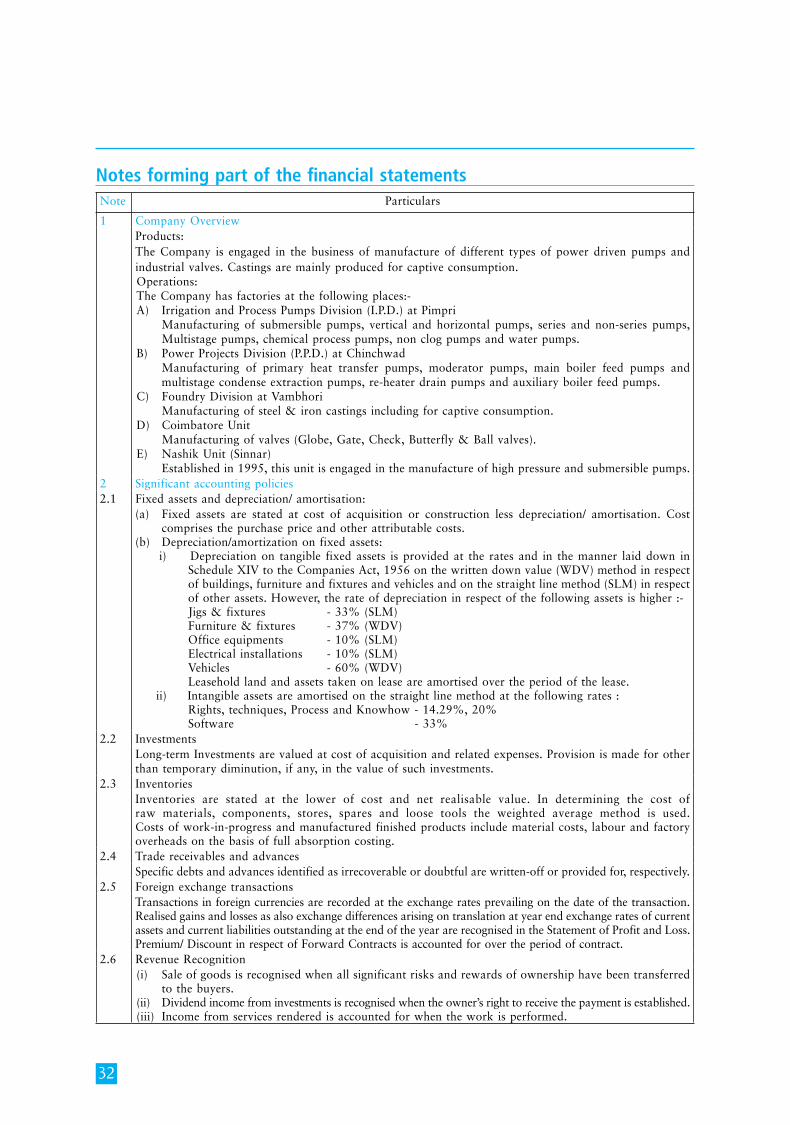
Notes forming part of the financial statementsNote Particulars
1 Company OverviewProducts:The Company is engaged in the business of manufacture of different types of power driven pumps and industrial valves. Castings are mainly produced for captive consumption. Operations:The Company has factories at the following places:-A) Irrigation and Process Pumps Division (I.P.D.) at Pimpri Manufacturing of submersible pumps, vertical and horizontal pumps, series and non-series pumps,
Multistage pumps, chemical process pumps, non clog pumps and water pumps.B) Power Projects Division (P.P.D.) at Chinchwad Manufacturing of primary heat transfer pumps, moderator pumps, main boiler feed pumps and
multistage condense extraction pumps, re-heater drain pumps and auxiliary boiler feed pumps. C) Foundry Division at Vambhori Manufacturing of steel & iron castings including for captive consumption. D) Coimbatore Unit Manufacturing of valves (Globe, Gate, Check, Butterfly & Ball valves).E) Nashik Unit (Sinnar) Established in 1995, this unit is engaged in the manufacture of high pressure and submersible pumps.
2 Significant accounting policies2.1 Fixed assets and depreciation/ amortisation:
(a) Fixed assets are stated at cost of acquisition or construction less depreciation/ amortisation. Cost comprises the purchase price and other attributable costs.
(b) Depreciation/amortization on fixed assets: i) Depreciation on tangible fixed assets is provided at the rates and in the manner laid down in
Schedule XIV to the Companies Act, 1956 on the written down value (WDV) method in respect of buildings, furniture and fixtures and vehicles and on the straight line method (SLM) in respect of other assets. However, the rate of depreciation in respect of the following assets is higher :-
Jigs & fixtures - 33% (SLM) Furniture & fixtures - 37% (WDV) Office equipments - 10% (SLM) Electrical installations - 10% (SLM) Vehicles - 60% (WDV) Leasehold land and assets taken on lease are amortised over the period of the lease. ii) Intangible assets are amortised on the straight line method at the following rates :
Rights, techniques, Process and Knowhow - 14.29%, 20% Software - 33%
2.2 InvestmentsLong-term Investments are valued at cost of acquisition and related expenses. Provision is made for other than temporary diminution, if any, in the value of such investments.
2.3 InventoriesInventories are stated at the lower of cost and net realisable value. In determining the cost of raw materials, components, stores, spares and loose tools the weighted average method is used. Costs of work-in-progress and manufactured finished products include material costs, labour and factory overheads on the basis of full absorption costing.
2.4 Trade receivables and advancesSpecific debts and advances identified as irrecoverable or doubtful are written-off or provided for, respectively.
2.5 Foreign exchange transactionsTransactions in foreign currencies are recorded at the exchange rates prevailing on the date of the transaction. Realised gains and losses as also exchange differences arising on translation at year end exchange rates of current assets and current liabilities outstanding at the end of the year are recognised in the Statement of Profit and Loss. Premium/ Discount in respect of Forward Contracts is accounted for over the period of contract.
2.6 Revenue Recognition(i) Sale of goods is recognised when all significant risks and rewards of ownership have been transferred
to the buyers.(ii) Dividend income from investments is recognised when the owner’s right to receive the payment is established. (iii) Income from services rendered is accounted for when the work is performed.
33
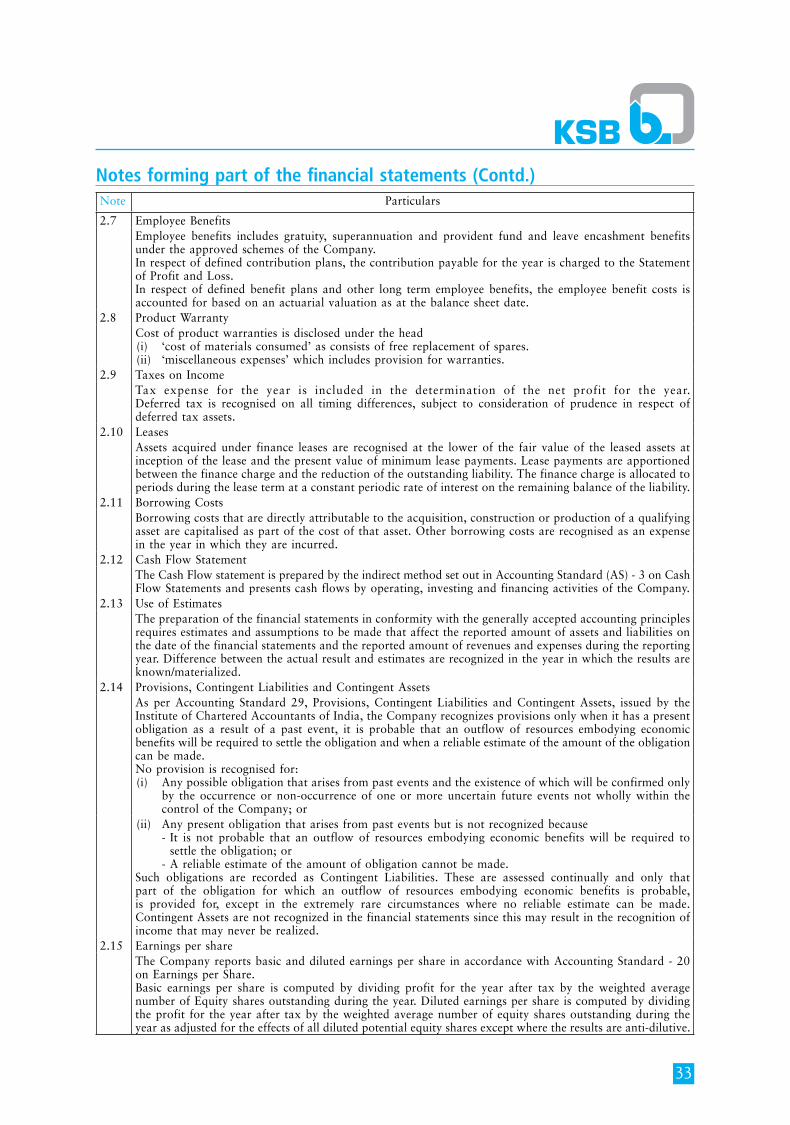
Notes forming part of the financial statements (Contd.)Note Particulars
2.7 Employee BenefitsEmployee benefits includes gratuity, superannuation and provident fund and leave encashment benefits under the approved schemes of the Company. In respect of defined contribution plans, the contribution payable for the year is charged to the Statement of Profit and Loss.In respect of defined benefit plans and other long term employee benefits, the employee benefit costs is accounted for based on an actuarial valuation as at the balance sheet date.
2.8 Product WarrantyCost of product warranties is disclosed under the head(i) ‘cost of materials consumed’ as consists of free replacement of spares.(ii) ‘miscellaneous expenses’ which includes provision for warranties.
2.9 Taxes on Income Tax expense for the year is included in the determination of the net profit for the year. Deferred tax is recognised on all timing differences, subject to consideration of prudence in respect of deferred tax assets.
2.10 LeasesAssets acquired under finance leases are recognised at the lower of the fair value of the leased assets at inception of the lease and the present value of minimum lease payments. Lease payments are apportioned between the finance charge and the reduction of the outstanding liability. The finance charge is allocated to periods during the lease term at a constant periodic rate of interest on the remaining balance of the liability.
2.11 Borrowing CostsBorrowing costs that are directly attributable to the acquisition, construction or production of a qualifying asset are capitalised as part of the cost of that asset. Other borrowing costs are recognised as an expense in the year in which they are incurred.
2.12 Cash Flow StatementThe Cash Flow statement is prepared by the indirect method set out in Accounting Standard (AS) - 3 on Cash Flow Statements and presents cash flows by operating, investing and financing activities of the Company.
2.13 Use of EstimatesThe preparation of the financial statements in conformity with the generally accepted accounting principles requires estimates and assumptions to be made that affect the reported amount of assets and liabilities on the date of the financial statements and the reported amount of revenues and expenses during the reporting year. Difference between the actual result and estimates are recognized in the year in which the results are known/materialized.
2.14 Provisions, Contingent Liabilities and Contingent AssetsAs per Accounting Standard 29, Provisions, Contingent Liabilities and Contingent Assets, issued by the Institute of Chartered Accountants of India, the Company recognizes provisions only when it has a present obligation as a result of a past event, it is probable that an outflow of resources embodying economic benefits will be required to settle the obligation and when a reliable estimate of the amount of the obligation can be made. No provision is recognised for: (i) Any possible obligation that arises from past events and the existence of which will be confirmed only
by the occurrence or non-occurrence of one or more uncertain future events not wholly within the control of the Company; or
(ii) Any present obligation that arises from past events but is not recognized because - It is not probable that an outflow of resources embodying economic benefits will be required to
settle the obligation; or - A reliable estimate of the amount of obligation cannot be made. Such obligations are recorded as Contingent Liabilities. These are assessed continually and only that part of the obligation for which an outflow of resources embodying economic benefits is probable, is provided for, except in the extremely rare circumstances where no reliable estimate can be made. Contingent Assets are not recognized in the financial statements since this may result in the recognition of income that may never be realized.
2.15 Earnings per shareThe Company reports basic and diluted earnings per share in accordance with Accounting Standard - 20 on Earnings per Share.Basic earnings per share is computed by dividing profit for the year after tax by the weighted average number of Equity shares outstanding during the year. Diluted earnings per share is computed by dividing the profit for the year after tax by the weighted average number of equity shares outstanding during the year as adjusted for the effects of all diluted potential equity shares except where the results are anti-dilutive.
34
Notes forming part of the financial statements (Contd.)
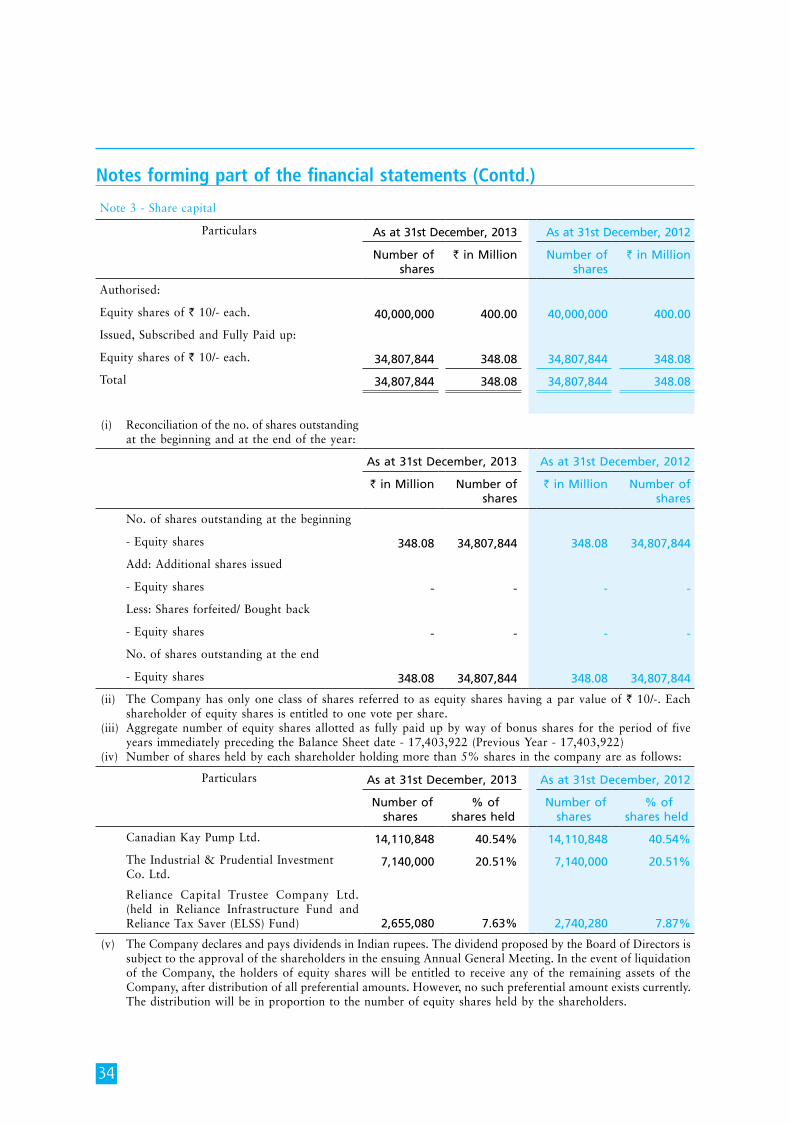
Note 3 - Share capital
Particulars As at 31st December, 2013 As at 31st December, 2012
Number of shares
` in Million Number of shares
` in Million
Authorised:
Equity shares of ` 10/- each. 40,000,000 400.00 40,000,000 400.00
Issued, Subscribed and Fully Paid up:
Equity shares of ` 10/- each. 34,807,844 348.08 34,807,844 348.08
Total 34,807,844 348.08 34,807,844 348.08
(i) Reconciliation of the no. of shares outstanding at the beginning and at the end of the year:
As at 31st December, 2013 As at 31st December, 2012
` in Million Number of shares
` in Million Number of shares
No. of shares outstanding at the beginning
- Equity shares 348.08 34,807,844 348.08 34,807,844
Add: Additional shares issued
- Equity shares - - - -
Less: Shares forfeited/ Bought back
- Equity shares - - - -
No. of shares outstanding at the end
- Equity shares 348.08 34,807,844 348.08 34,807,844
(ii) The Company has only one class of shares referred to as equity shares having a par value of ` 10/-. Each shareholder of equity shares is entitled to one vote per share.
(iii) Aggregate number of equity shares allotted as fully paid up by way of bonus shares for the period of five years immediately preceding the Balance Sheet date - 17,403,922 (Previous Year - 17,403,922)
(iv) Number of shares held by each shareholder holding more than 5% shares in the company are as follows:
Particulars As at 31st December, 2013 As at 31st December, 2012
Number of shares
% of shares held
Number of shares
% of shares held
Canadian Kay Pump Ltd. 14,110,848 40.54% 14,110,848 40.54%
The Industrial & Prudential Investment Co. Ltd.
7,140,000 20.51% 7,140,000 20.51%
Reliance Capital Trustee Company Ltd. (held in Reliance Infrastructure Fund and Reliance Tax Saver (ELSS) Fund) 2,655,080 7.63% 2,740,280 7.87%
(v) The Company declares and pays dividends in Indian rupees. The dividend proposed by the Board of Directors is subject to the approval of the shareholders in the ensuing Annual General Meeting. In the event of liquidation of the Company, the holders of equity shares will be entitled to receive any of the remaining assets of the Company, after distribution of all preferential amounts. However, no such preferential amount exists currently. The distribution will be in proportion to the number of equity shares held by the shareholders.
35
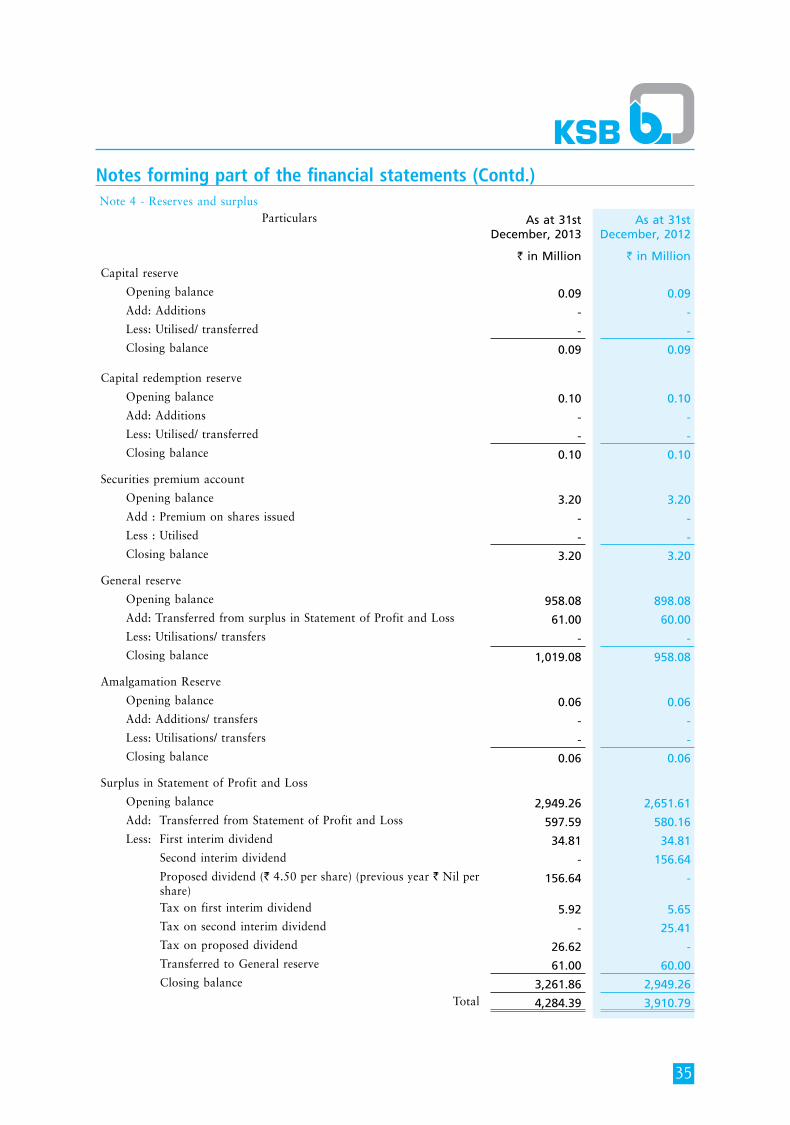
Notes forming part of the financial statements (Contd.)Note 4 - Reserves and surplus
Particulars As at 31st December, 2013
` in Million
As at 31st December, 2012
` in MillionCapital reserve
Opening balance 0.09 0.09 Add: Additions - - Less: Utilised/ transferred - - Closing balance 0.09 0.09
Capital redemption reserve
Opening balance 0.10 0.10 Add: Additions - - Less: Utilised/ transferred - - Closing balance 0.10 0.10
Securities premium account
Opening balance 3.20 3.20 Add : Premium on shares issued - - Less : Utilised - - Closing balance 3.20 3.20
General reserve
Opening balance 958.08 898.08 Add: Transferred from surplus in Statement of Profit and Loss 61.00 60.00 Less: Utilisations/ transfers - - Closing balance 1,019.08 958.08
Amalgamation Reserve
Opening balance 0.06 0.06 Add: Additions/ transfers - - Less: Utilisations/ transfers - - Closing balance 0.06 0.06
Surplus in Statement of Profit and Loss
Opening balance 2,949.26 2,651.61 Add: Transferred from Statement of Profit and Loss 597.59 580.16 Less: First interim dividend 34.81 34.81 Second interim dividend - 156.64 Proposed dividend (` 4.50 per share) (previous year ` Nil per
share) 156.64 -
Tax on first interim dividend 5.92 5.65 Tax on second interim dividend - 25.41 Tax on proposed dividend 26.62 - Transferred to General reserve 61.00 60.00 Closing balance 3,261.86 2,949.26
Total 4,284.39 3,910.79
36
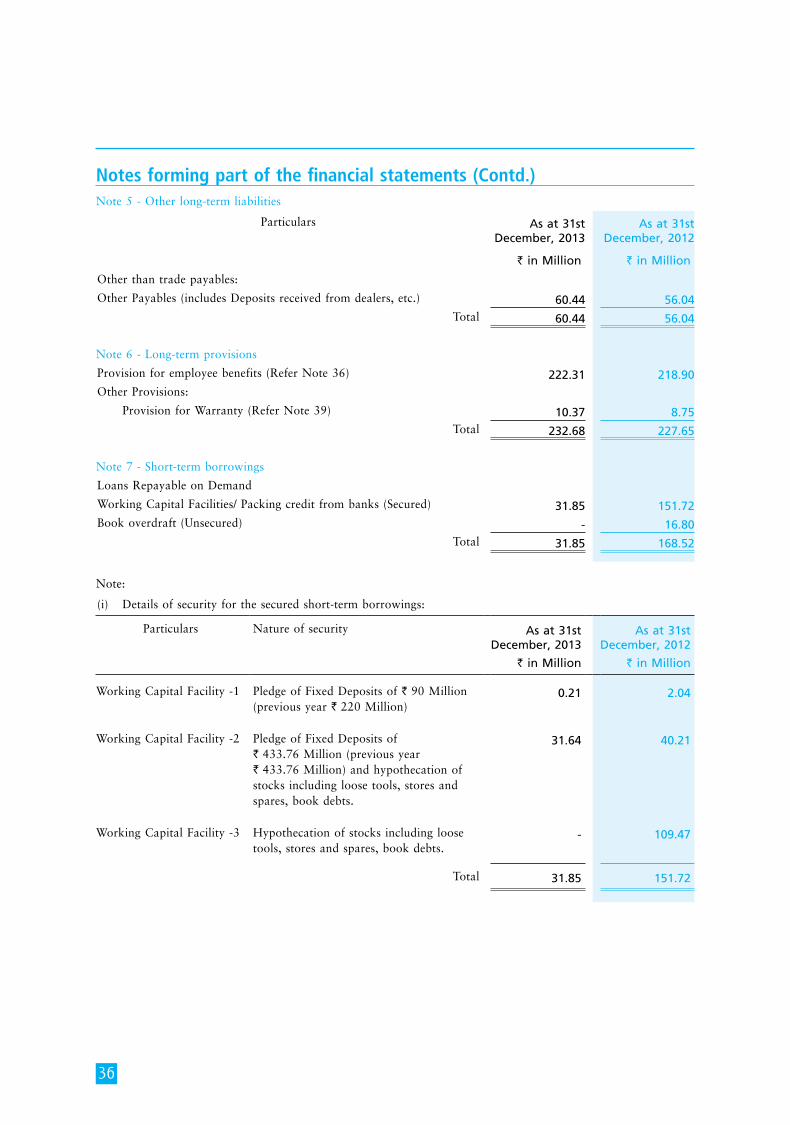
Notes forming part of the financial statements (Contd.)Note 5 - Other long-term liabilities
Particulars As at 31st December, 2013
As at 31st December, 2012
` in Million ` in Million
Other than trade payables:
Other Payables (includes Deposits received from dealers, etc.) 60.44 56.04Total 60.44 56.04
Note 6 - Long-term provisions
Provision for employee benefits (Refer Note 36) 222.31 218.90Other Provisions:
Provision for Warranty (Refer Note 39) 10.37 8.75Total 232.68 227.65
Note 7 - Short-term borrowings
Loans Repayable on Demand
Working Capital Facilities/ Packing credit from banks (Secured) 31.85 151.72Book overdraft (Unsecured) - 16.80
Total 31.85 168.52
Note:
(i) Details of security for the secured short-term borrowings:
Particulars Nature of security As at 31st December, 2013
` in Million
As at 31st December, 2012
` in Million
Working Capital Facility -1 Pledge of Fixed Deposits of ` 90 Million (previous year ` 220 Million)
0.21 2.04
Working Capital Facility -2 Pledge of Fixed Deposits of ` 433.76 Million (previous year ` 433.76 Million) and hypothecation of stocks including loose tools, stores and spares, book debts.
31.64 40.21
Working Capital Facility -3 Hypothecation of stocks including loose tools, stores and spares, book debts.
- 109.47
Total 31.85 151.72
37
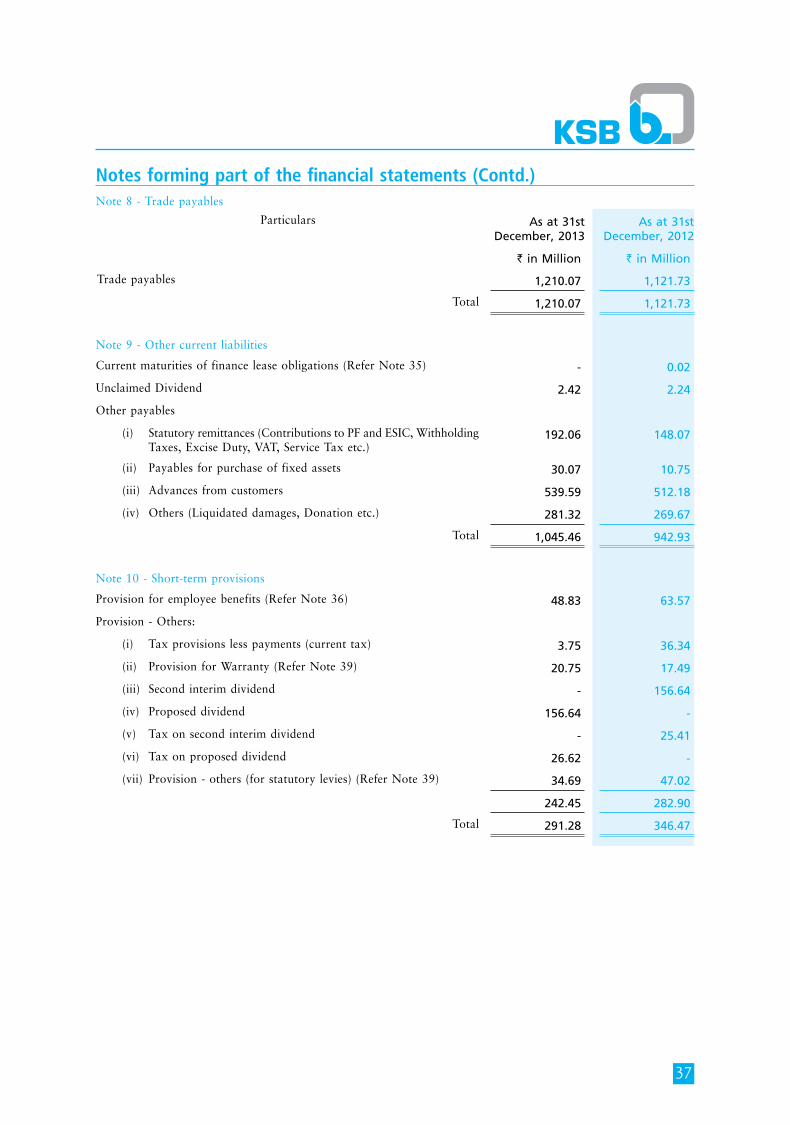
Notes forming part of the financial statements (Contd.)Note 8 - Trade payables
Particulars As at 31st December, 2013
As at 31st December, 2012
` in Million ` in Million
Trade payables 1,210.07 1,121.73
Total 1,210.07 1,121.73
Note 9 - Other current liabilities
Current maturities of finance lease obligations (Refer Note 35) - 0.02
Unclaimed Dividend 2.42 2.24
Other payables
(i) Statutory remittances (Contributions to PF and ESIC, Withholding Taxes, Excise Duty, VAT, Service Tax etc.)
192.06 148.07
(ii) Payables for purchase of fixed assets 30.07 10.75
(iii) Advances from customers 539.59 512.18
(iv) Others (Liquidated damages, Donation etc.) 281.32 269.67
Total 1,045.46 942.93
Note 10 - Short-term provisions
Provision for employee benefits (Refer Note 36) 48.83 63.57
Provision - Others:
(i) Tax provisions less payments (current tax) 3.75 36.34
(ii) Provision for Warranty (Refer Note 39) 20.75 17.49
(iii) Second interim dividend - 156.64
(iv) Proposed dividend 156.64 -
(v) Tax on second interim dividend - 25.41
(vi) Tax on proposed dividend 26.62 -
(vii) Provision - others (for statutory levies) (Refer Note 39) 34.69 47.02
242.45 282.90
Total 291.28 346.47
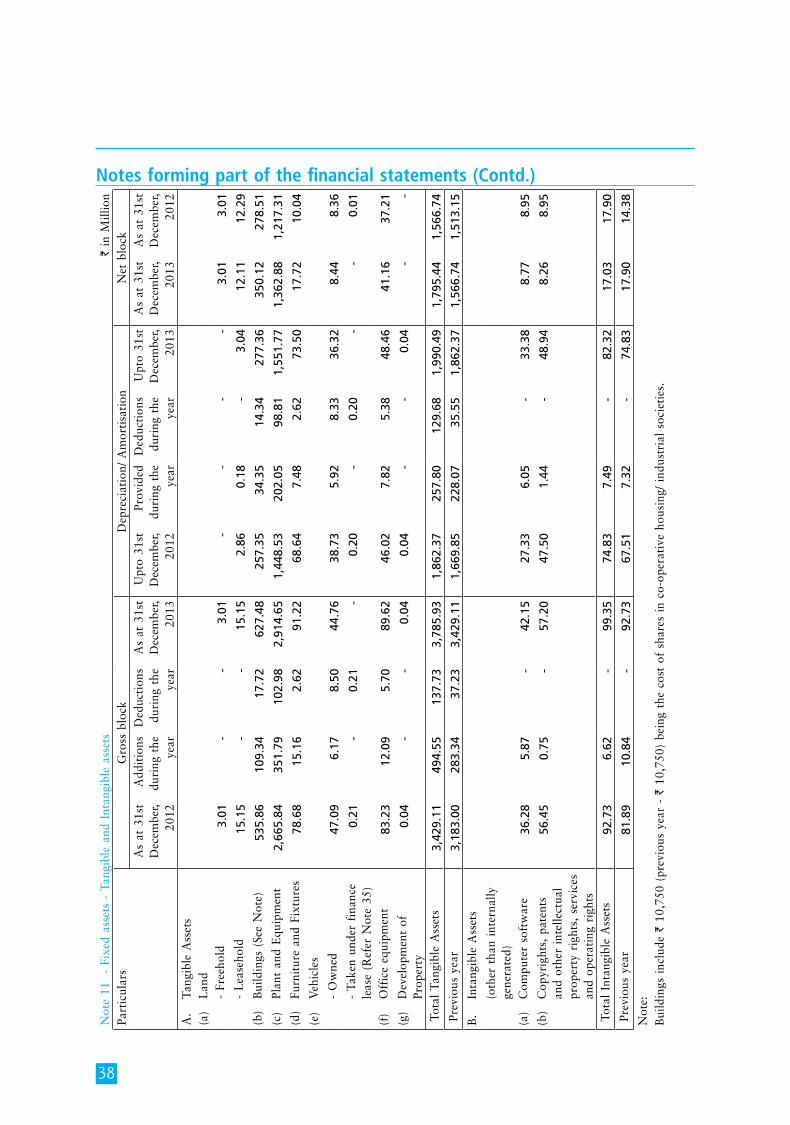
38
Notes forming part of the financial statements (Contd.)
Not
e 11
-
Fixe
d as
sets
- T
angi
ble
and
Inta
ngib
le a
sset
s
` in
Mill
ion
Part
icul
ars
Gro
ss b
lock
Dep
reci
atio
n/ A
mor
tisa
tion
Net
blo
ckA
s at
31s
t D
ecem
ber,
2012
Add
itio
ns
duri
ng t
he
year
Ded
ucti
ons
duri
ng t
he
year
As
at 3
1st
Dec
embe
r, 20
13
Upt
o 31
st
Dec
embe
r, 20
12
Prov
ided
du
ring
the
ye
ar
Ded
ucti
ons
duri
ng t
he
year
Upt
o 31
st
Dec
embe
r, 20
13
As
at 3
1st
Dec
embe
r, 20
13
As
at 3
1st
Dec
embe
r, 20
12A
. Ta
ngib
le A
sset
s(a
) L
and
-
Free
hold
3.0
1 -
-
3
.01
-
-
-
-
3.0
1 3
.01
-
Lea
seho
ld 1
5.15
-
-
1
5.15
2
.86
0.1
8 -
3
.04
12.
11
12.
29
(b)
B
uild
ings
(Se
e N
ote)
535
.86
109
.34
17.
72
627
.48
257
.35
34.
35
14.
34
277
.36
350
.12
278
.51
(c)
Pl
ant
and
Equ
ipm
ent
2,6
65.8
4 3
51.7
9 1
02.9
8 2
,914
.65
1,4
48.5
3 2
02.0
5 9
8.81
1
,551
.77
1,3
62.8
8 1
,217
.31
(d)
Fu
rnit
ure
and
Fixt
ures
78.
68
15.
16
2.6
2 9
1.22
6
8.64
7
.48
2.6
2 7
3.50
1
7.72
1
0.04
(e
)
Veh
icle
s
-
Ow
ned
47.
09
6.1
7 8
.50
44.
76
38.
73
5.9
2 8
.33
36.
32
8.4
4 8
.36
-
Take
n un
der
fina
nce
leas
e (R
efer
Not
e 35
) 0
.21
-
0.2
1 -
0
.20
-
0.2
0 -
-
0
.01
(f)
O
ffic
e eq
uipm
ent
83.
23
12.
09
5.7
0 8
9.62
4
6.02
7
.82
5.3
8 4
8.46
4
1.16
3
7.21
(g
)
Dev
elop
men
t of
Pr
oper
ty 0
.04
-
-
0.0
4 0
.04
-
-
0.0
4 -
-
Tot
al T
angi
ble
Ass
ets
3,4
29.1
1 4
94.5
5 1
37.7
3 3
,785
.93
1,8
62.3
7 2
57.8
0 1
29.6
8 1
,990
.49
1,7
95.4
4 1
,566
.74
Pre
viou
s ye
ar
3,1
83.0
0 2
83.3
4 3
7.23
3
,429
.11
1,6
69.8
5 2
28.0
7 3
5.55
1
,862
.37
1,5
66.7
4 1,
513.
15B
. In
tang
ible
Ass
ets
(o
ther
tha
n in
tern
ally
ge
nera
ted)
(a)
Com
pute
r so
ftw
are
36.
28
5.8
7 -
4
2.15
2
7.33
6
.05
-
33.
38
8.7
7 8
.95
(b)
Cop
yrig
hts,
pat
ents
an
d ot
her
inte
llect
ual
prop
erty
rig
hts,
ser
vice
s an
d op
erat
ing
righ
ts
56.
45
0.7
5 -
5
7.20
4
7.50
1
.44
-
48.
94
8.2
6 8
.95
Tot
al I
ntan
gibl
e A
sset
s 9
2.73
6
.62
-
99.
35
74.
83
7.4
9 -
8
2.32
1
7.03
1
7.90
P
revi
ous
year
8
1.89
1
0.84
-
9
2.73
6
7.51
7
.32
-
74.
83
17.
90
14.
38
Not
e:B
uild
ings
inc
lude
` 1
0,75
0 (p
revi
ous
year
- `
10,
750)
bei
ng t
he c
ost
of s
hare
s in
co-
oper
ativ
e ho
usin
g/ i
ndus
tria
l so
ciet
ies.
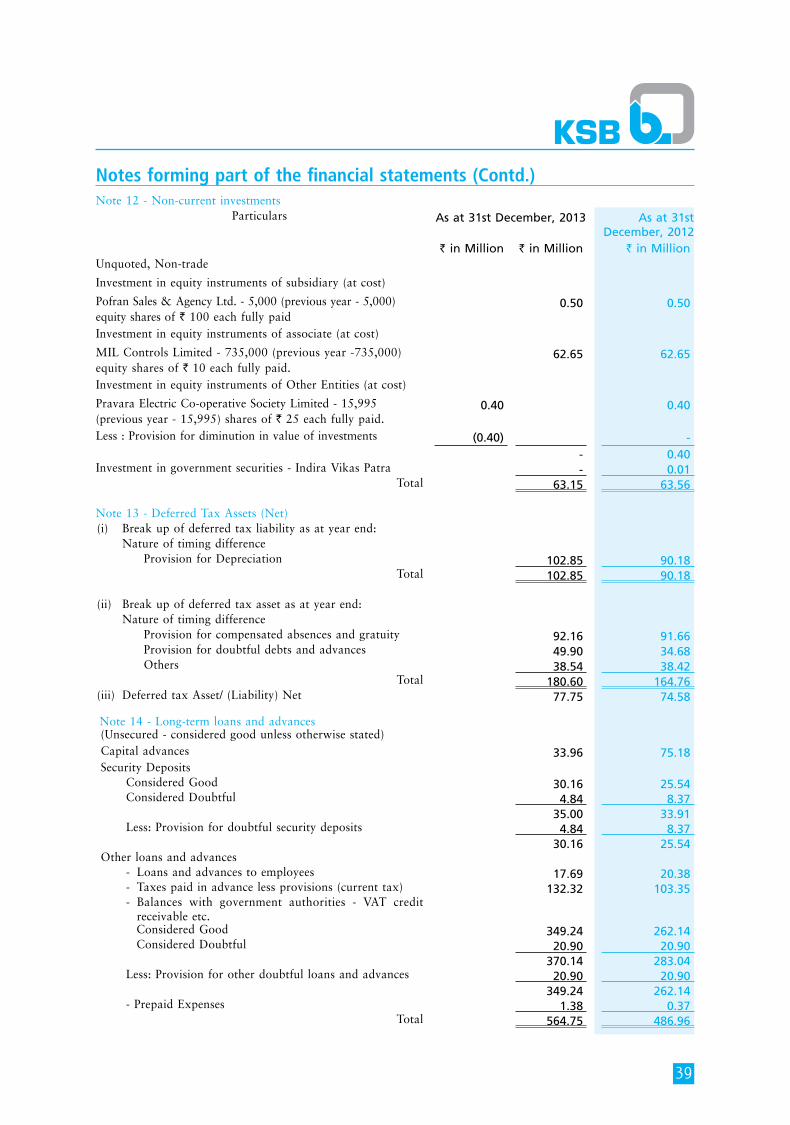
39
Notes forming part of the financial statements (Contd.)Note 12 - Non-current investments
Particulars As at 31st December, 2013 As at 31st December, 2012
` in Million ` in Million ` in MillionUnquoted, Non-trade
Investment in equity instruments of subsidiary (at cost)
Pofran Sales & Agency Ltd. - 5,000 (previous year - 5,000) equity shares of ` 100 each fully paid
0.50 0.50
Investment in equity instruments of associate (at cost)
MIL Controls Limited - 735,000 (previous year -735,000) equity shares of ` 10 each fully paid.
62.65 62.65
Investment in equity instruments of Other Entities (at cost)
Pravara Electric Co-operative Society Limited - 15,995 (previous year - 15,995) shares of ` 25 each fully paid.
0.40 0.40
Less : Provision for diminution in value of investments (0.40) -- 0.40
Investment in government securities - Indira Vikas Patra - 0.01 Total 63.15 63.56
Note 13 - Deferred Tax Assets (Net)(i) Break up of deferred tax liability as at year end: Nature of timing difference Provision for Depreciation 102.85 90.18
Total 102.85 90.18
(ii) Break up of deferred tax asset as at year end: Nature of timing difference Provision for compensated absences and gratuity 92.16 91.66 Provision for doubtful debts and advances 49.90 34.68 Others 38.54 38.42
Total 180.60 164.76 (iii) Deferred tax Asset/ (Liability) Net 77.75 74.58
Note 14 - Long-term loans and advances(Unsecured - considered good unless otherwise stated)Capital advances 33.96 75.18 Security Deposits Considered Good 30.16 25.54 Considered Doubtful 4.84 8.37
35.00 33.91 Less: Provision for doubtful security deposits 4.84 8.37
30.16 25.54 Other loans and advances - Loans and advances to employees 17.69 20.38 - Taxes paid in advance less provisions (current tax) 132.32 103.35 - Balances with government authorities - VAT credit
receivable etc. Considered Good 349.24 262.14 Considered Doubtful 20.90 20.90
370.14 283.04 Less: Provision for other doubtful loans and advances 20.90 20.90
349.24 262.14 - Prepaid Expenses 1.38 0.37
Total 564.75 486.96
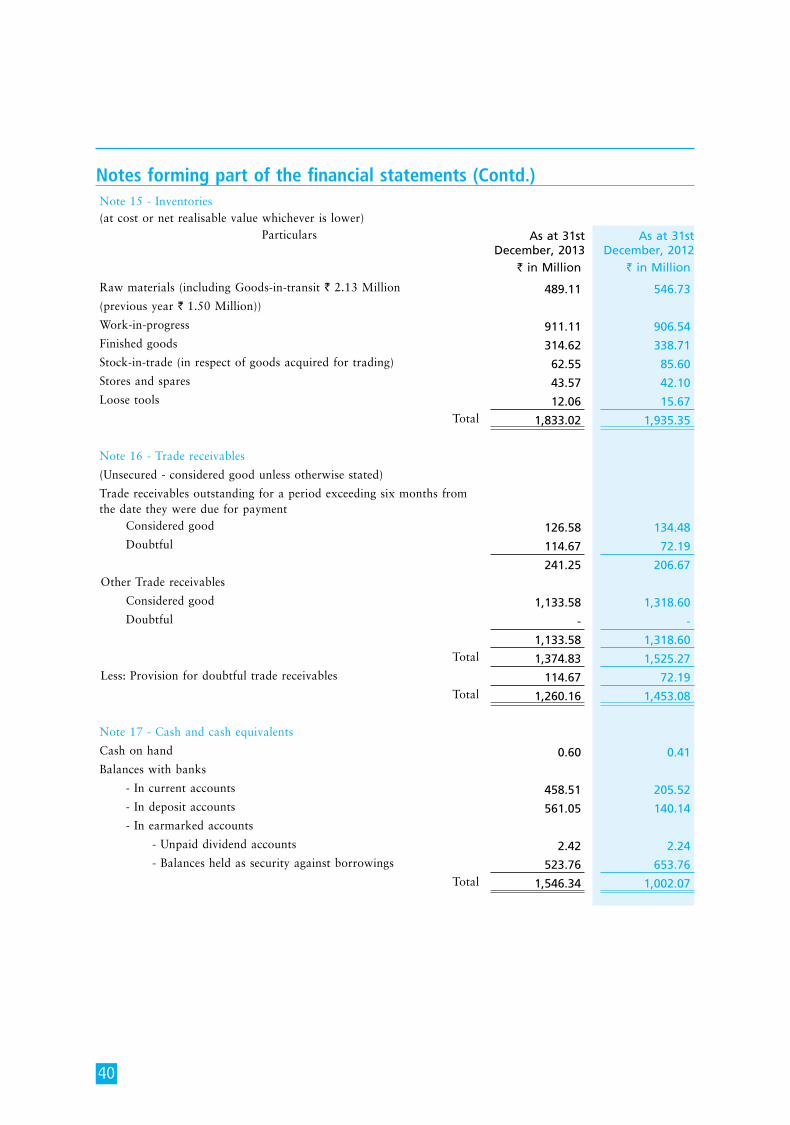
40
Note 15 - Inventories(at cost or net realisable value whichever is lower)
Particulars As at 31st December, 2013
As at 31st December, 2012
` in Million ` in Million
Raw materials (including Goods-in-transit ` 2.13 Million 489.11 546.73 (previous year ` 1.50 Million))
Work-in-progress 911.11 906.54 Finished goods 314.62 338.71 Stock-in-trade (in respect of goods acquired for trading) 62.55 85.60 Stores and spares 43.57 42.10 Loose tools 12.06 15.67
Total 1,833.02 1,935.35
Note 16 - Trade receivables
(Unsecured - considered good unless otherwise stated)
Trade receivables outstanding for a period exceeding six months from the date they were due for payment Considered good 126.58 134.48 Doubtful 114.67 72.19
241.25 206.67 Other Trade receivables
Considered good 1,133.58 1,318.60 Doubtful - -
1,133.58 1,318.60 Total 1,374.83 1,525.27
Less: Provision for doubtful trade receivables 114.67 72.19 Total 1,260.16 1,453.08
Note 17 - Cash and cash equivalents
Cash on hand 0.60 0.41 Balances with banks
- In current accounts 458.51 205.52 - In deposit accounts 561.05 140.14 - In earmarked accounts
- Unpaid dividend accounts 2.42 2.24 - Balances held as security against borrowings 523.76 653.76
Total 1,546.34 1,002.07
Notes forming part of the financial statements (Contd.)
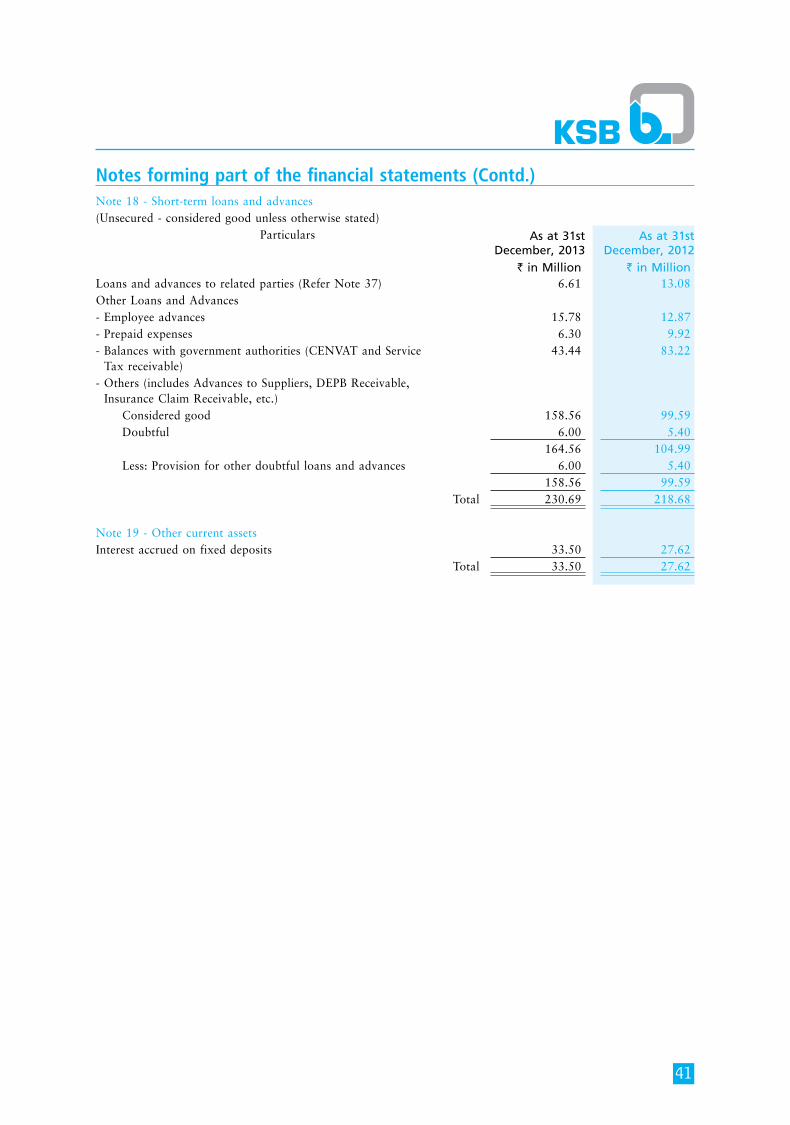
41
Notes forming part of the financial statements (Contd.)Note 18 - Short-term loans and advances(Unsecured - considered good unless otherwise stated)
Particulars As at 31st December, 2013
As at 31st December, 2012
` in Million ` in MillionLoans and advances to related parties (Refer Note 37) 6.61 13.08 Other Loans and Advances- Employee advances 15.78 12.87 - Prepaid expenses 6.30 9.92 - Balances with government authorities (CENVAT and Service Tax receivable)
43.44 83.22
- Others (includes Advances to Suppliers, DEPB Receivable, Insurance Claim Receivable, etc.) Considered good 158.56 99.59 Doubtful 6.00 5.40
164.56 104.99 Less: Provision for other doubtful loans and advances 6.00 5.40
158.56 99.59 Total 230.69 218.68
Note 19 - Other current assetsInterest accrued on fixed deposits 33.50 27.62
Total 33.50 27.62
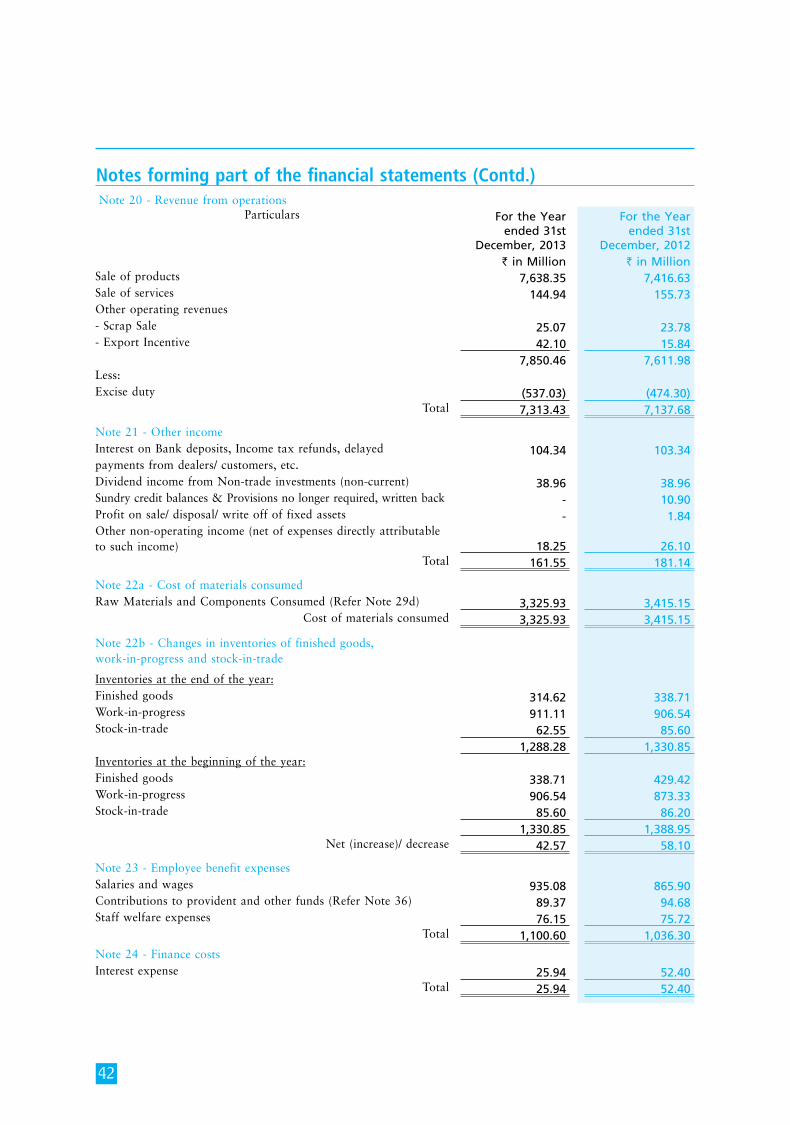
42
Notes forming part of the financial statements (Contd.)Note 20 - Revenue from operations
Particulars For the Year ended 31st
December, 2013
For the Year ended 31st
December, 2012` in Million ` in Million
Sale of products 7,638.35 7,416.63 Sale of services 144.94 155.73 Other operating revenues - Scrap Sale 25.07 23.78 - Export Incentive 42.10 15.84
7,850.46 7,611.98 Less:Excise duty (537.03) (474.30)
Total 7,313.43 7,137.68
Note 21 - Other incomeInterest on Bank deposits, Income tax refunds, delayed 104.34 103.34 payments from dealers/ customers, etc.Dividend income from Non-trade investments (non-current) 38.96 38.96 Sundry credit balances & Provisions no longer required, written back - 10.90 Profit on sale/ disposal/ write off of fixed assets - 1.84 Other non-operating income (net of expenses directly attributable to such income) 18.25 26.10
Total 161.55 181.14
Note 22a - Cost of materials consumed Raw Materials and Components Consumed (Refer Note 29d) 3,325.93 3,415.15
Cost of materials consumed 3,325.93 3,415.15
Note 22b - Changes in inventories of finished goods, work-in-progress and stock-in-trade
Inventories at the end of the year:Finished goods 314.62 338.71 Work-in-progress 911.11 906.54 Stock-in-trade 62.55 85.60
1,288.28 1,330.85 Inventories at the beginning of the year:Finished goods 338.71 429.42 Work-in-progress 906.54 873.33 Stock-in-trade 85.60 86.20
1,330.85 1,388.95 Net (increase)/ decrease 42.57 58.10
Note 23 - Employee benefit expensesSalaries and wages 935.08 865.90 Contributions to provident and other funds (Refer Note 36) 89.37 94.68 Staff welfare expenses 76.15 75.72
Total 1,100.60 1,036.30
Note 24 - Finance costsInterest expense 25.94 52.40
Total 25.94 52.40
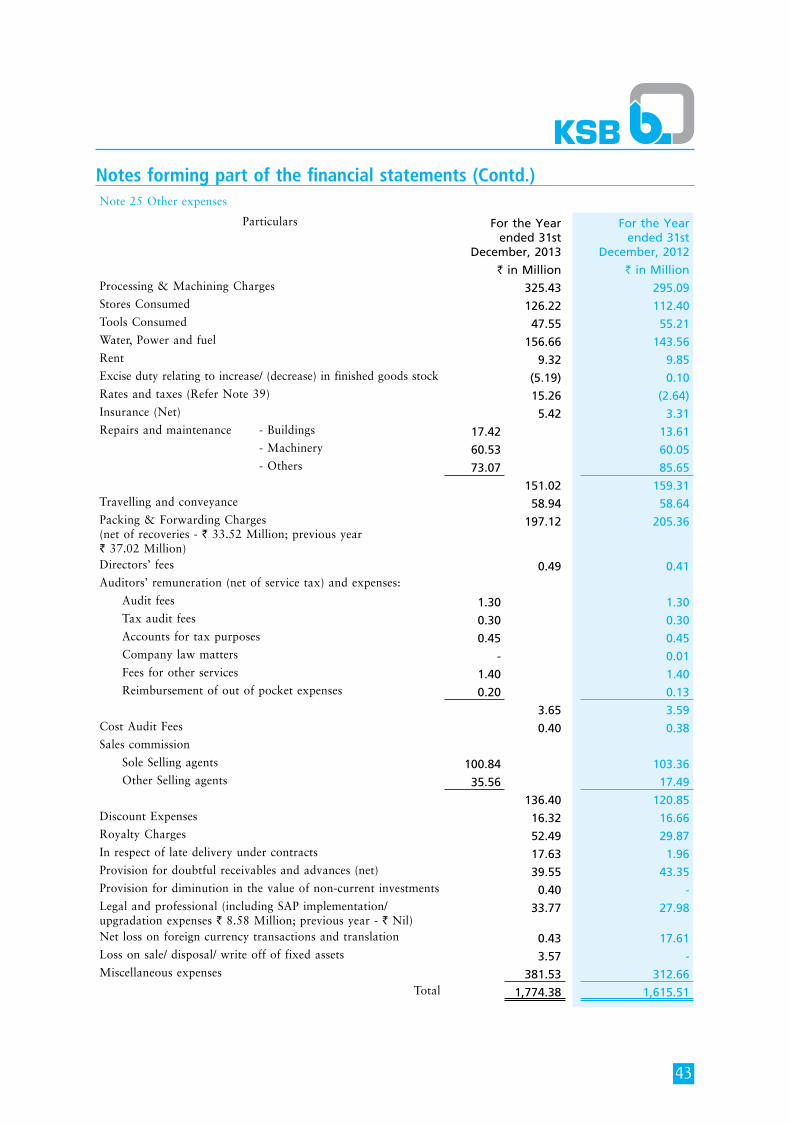
43
Notes forming part of the financial statements (Contd.)Note 25 Other expenses
Particulars For the Year ended 31st
December, 2013
For the Year ended 31st
December, 2012
` in Million ` in Million Processing & Machining Charges 325.43 295.09 Stores Consumed 126.22 112.40 Tools Consumed 47.55 55.21 Water, Power and fuel 156.66 143.56 Rent 9.32 9.85 Excise duty relating to increase/ (decrease) in finished goods stock (5.19) 0.10 Rates and taxes (Refer Note 39) 15.26 (2.64)Insurance (Net) 5.42 3.31 Repairs and maintenance - Buildings 17.42 13.61 - Machinery 60.53 60.05 - Others 73.07 85.65
151.02 159.31 Travelling and conveyance 58.94 58.64 Packing & Forwarding Charges (net of recoveries - ` 33.52 Million; previous year ` 37.02 Million)
197.12 205.36
Directors’ fees 0.49 0.41 Auditors’ remuneration (net of service tax) and expenses:
Audit fees 1.30 1.30 Tax audit fees 0.30 0.30 Accounts for tax purposes 0.45 0.45 Company law matters - 0.01 Fees for other services 1.40 1.40 Reimbursement of out of pocket expenses 0.20 0.13
3.65 3.59 Cost Audit Fees 0.40 0.38 Sales commission
Sole Selling agents 100.84 103.36 Other Selling agents 35.56 17.49
136.40 120.85 Discount Expenses 16.32 16.66 Royalty Charges 52.49 29.87 In respect of late delivery under contracts 17.63 1.96 Provision for doubtful receivables and advances (net) 39.55 43.35 Provision for diminution in the value of non-current investments 0.40 - Legal and professional (including SAP implementation/ upgradation expenses ` 8.58 Million; previous year - ` Nil)
33.77 27.98
Net loss on foreign currency transactions and translation 0.43 17.61 Loss on sale/ disposal/ write off of fixed assets 3.57 - Miscellaneous expenses 381.53 312.66
Total 1,774.38 1,615.51
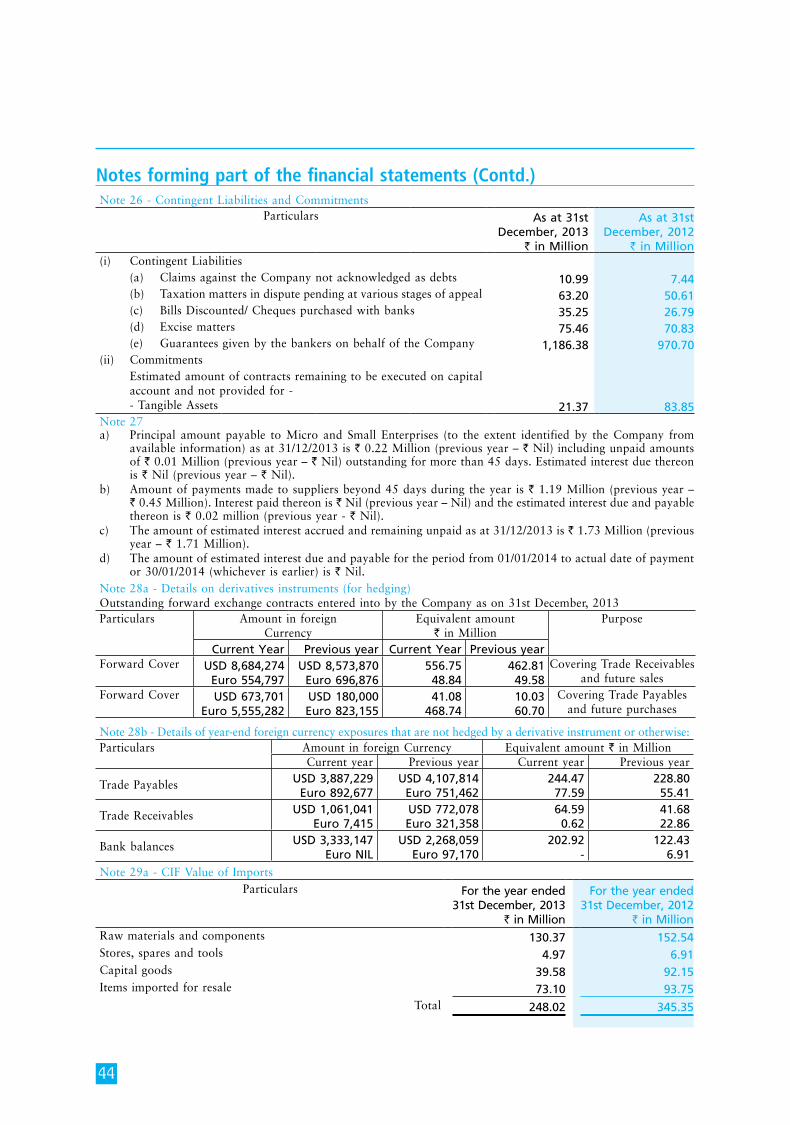
44
Notes forming part of the financial statements (Contd.)Note 26 - Contingent Liabilities and Commitments
Particulars As at 31st December, 2013
` in Million
As at 31st December, 2012
` in Million(i) Contingent Liabilities (a) Claims against the Company not acknowledged as debts 10.99 7.44 (b) Taxation matters in dispute pending at various stages of appeal 63.20 50.61 (c) Bills Discounted/ Cheques purchased with banks 35.25 26.79 (d) Excise matters 75.46 70.83 (e) Guarantees given by the bankers on behalf of the Company 1,186.38 970.70 (ii) Commitments
Estimated amount of contracts remaining to be executed on capital account and not provided for -- Tangible Assets 21.37 83.85
Note 27a) Principal amount payable to Micro and Small Enterprises (to the extent identified by the Company from
available information) as at 31/12/2013 is ` 0.22 Million (previous year – ` Nil) including unpaid amounts of ` 0.01 Million (previous year – ` Nil) outstanding for more than 45 days. Estimated interest due thereon is ` Nil (previous year – ` Nil).
b) Amount of payments made to suppliers beyond 45 days during the year is ` 1.19 Million (previous year – ` 0.45 Million). Interest paid thereon is ` Nil (previous year – Nil) and the estimated interest due and payable thereon is ` 0.02 million (previous year - ` Nil).
c) The amount of estimated interest accrued and remaining unpaid as at 31/12/2013 is ` 1.73 Million (previous year – ` 1.71 Million).
d) The amount of estimated interest due and payable for the period from 01/01/2014 to actual date of payment or 30/01/2014 (whichever is earlier) is ` Nil.
Note 28a - Details on derivatives instruments (for hedging)Outstanding forward exchange contracts entered into by the Company as on 31st December, 2013Particulars Amount in foreign
CurrencyEquivalent amount
` in MillionPurpose
Current Year Previous year Current Year Previous year Forward Cover USD 8,684,274
Euro 554,797 USD 8,573,870
Euro 696,876 556.75 48.84
462.81 49.58
Covering Trade Receivables and future sales
Forward Cover USD 673,701 Euro 5,555,282
USD 180,000 Euro 823,155
41.08 468.74
10.03 60.70
Covering Trade Payables and future purchases
Note 28b - Details of year-end foreign currency exposures that are not hedged by a derivative instrument or otherwise:Particulars Amount in foreign Currency Equivalent amount ` in Million
Current year Previous year Current year Previous year
Trade Payables USD 3,887,229 Euro 892,677
USD 4,107,814 Euro 751,462
244.47 77.59
228.80 55.41
Trade Receivables USD 1,061,041 Euro 7,415
USD 772,078 Euro 321,358
64.59 0.62
41.68 22.86
Bank balances USD 3,333,147 Euro NIL
USD 2,268,059 Euro 97,170
202.92 -
122.43 6.91
Note 29a - CIF Value of ImportsParticulars For the year ended
31st December, 2013 ` in Million
For the year ended 31st December, 2012
` in Million Raw materials and components 130.37 152.54 Stores, spares and tools 4.97 6.91 Capital goods 39.58 92.15 Items imported for resale 73.10 93.75
Total 248.02 345.35
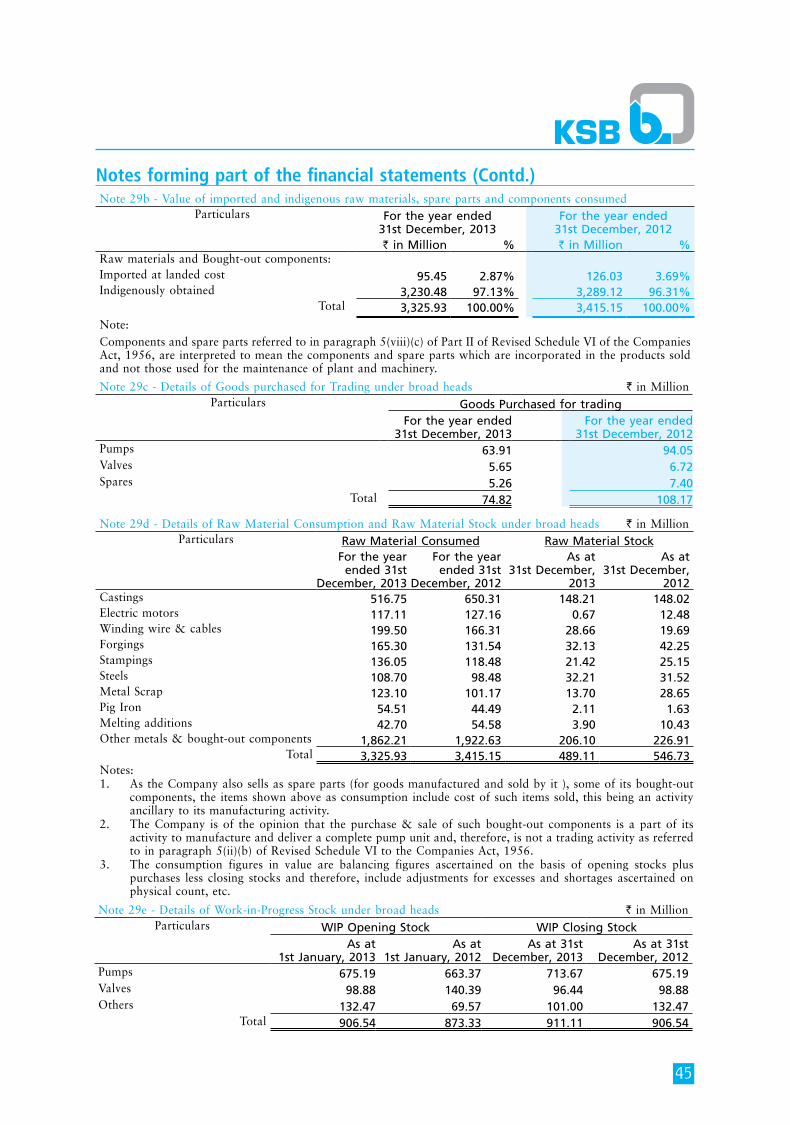
45
Notes forming part of the financial statements (Contd.)
Note 29e - Details of Work-in-Progress Stock under broad heads ` in MillionParticulars WIP Opening Stock WIP Closing Stock
As at1st January, 2013
As at1st January, 2012
As at 31st December, 2013
As at 31st December, 2012
Pumps 675.19 663.37 713.67 675.19 Valves 98.88 140.39 96.44 98.88 Others 132.47 69.57 101.00 132.47
Total 906.54 873.33 911.11 906.54
Note 29b - Value of imported and indigenous raw materials, spare parts and components consumedParticulars For the year ended
31st December, 2013For the year ended
31st December, 2012 ` in Million % ` in Million %
Raw materials and Bought-out components:Imported at landed cost 95.45 2.87% 126.03 3.69%Indigenously obtained 3,230.48 97.13% 3,289.12 96.31%
Total 3,325.93 100.00% 3,415.15 100.00%Note:Components and spare parts referred to in paragraph 5(viii)(c) of Part II of Revised Schedule VI of the Companies Act, 1956, are interpreted to mean the components and spare parts which are incorporated in the products sold and not those used for the maintenance of plant and machinery.
Note 29c - Details of Goods purchased for Trading under broad heads ` in MillionParticulars Goods Purchased for trading
For the year ended 31st December, 2013
For the year ended 31st December, 2012
Pumps 63.91 94.05 Valves 5.65 6.72 Spares 5.26 7.40
Total 74.82 108.17
Note 29d - Details of Raw Material Consumption and Raw Material Stock under broad heads ` in MillionParticulars Raw Material Consumed Raw Material Stock
For the year ended 31st
December, 2013
For the year ended 31st
December, 2012
As at 31st December,
2013
As at 31st December,
2012Castings 516.75 650.31 148.21 148.02Electric motors 117.11 127.16 0.67 12.48Winding wire & cables 199.50 166.31 28.66 19.69Forgings 165.30 131.54 32.13 42.25Stampings 136.05 118.48 21.42 25.15Steels 108.70 98.48 32.21 31.52Metal Scrap 123.10 101.17 13.70 28.65Pig Iron 54.51 44.49 2.11 1.63Melting additions 42.70 54.58 3.90 10.43Other metals & bought-out components 1,862.21 1,922.63 206.10 226.91
Total 3,325.93 3,415.15 489.11 546.73Notes:1. As the Company also sells as spare parts (for goods manufactured and sold by it ), some of its bought-out
components, the items shown above as consumption include cost of such items sold, this being an activity ancillary to its manufacturing activity.
2. The Company is of the opinion that the purchase & sale of such bought-out components is a part of its activity to manufacture and deliver a complete pump unit and, therefore, is not a trading activity as referred to in paragraph 5(ii)(b) of Revised Schedule VI to the Companies Act, 1956.
3. The consumption figures in value are balancing figures ascertained on the basis of opening stocks plus purchases less closing stocks and therefore, include adjustments for excesses and shortages ascertained on physical count, etc.
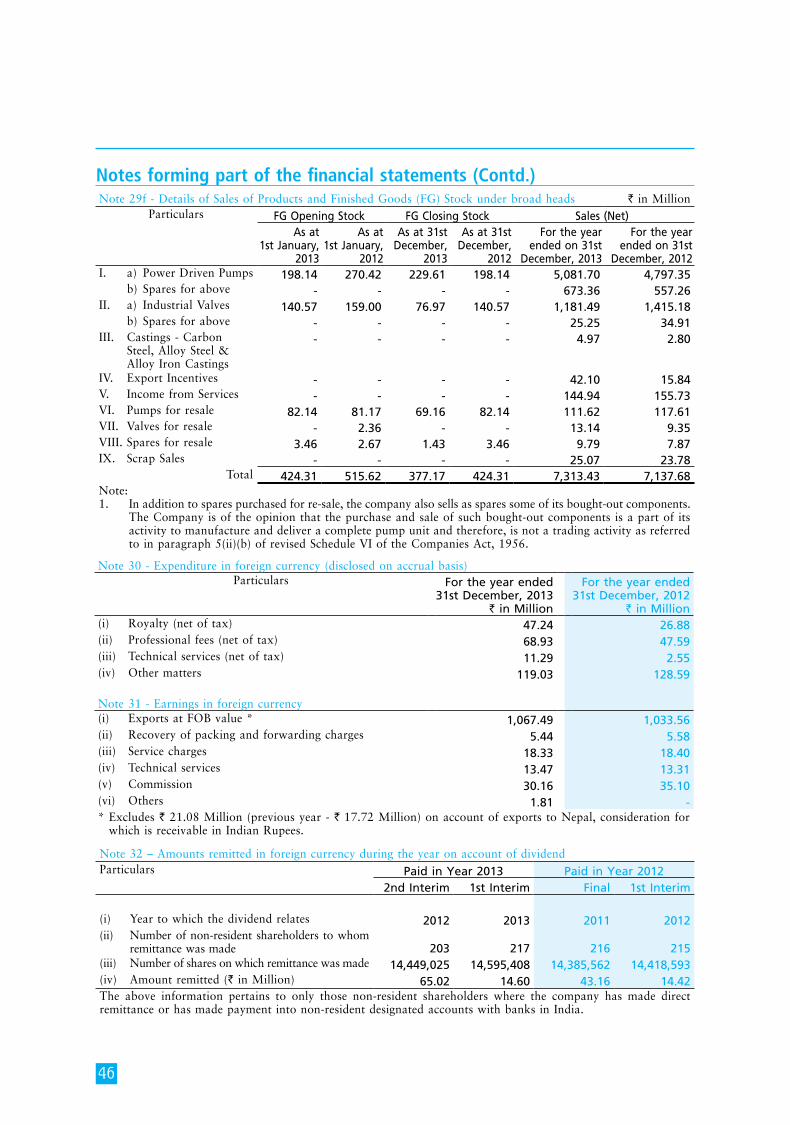
46
Notes forming part of the financial statements (Contd.)Note 29f - Details of Sales of Products and Finished Goods (FG) Stock under broad heads ` in Million
Particulars FG Opening Stock FG Closing Stock Sales (Net)As at
1st January, 2013
As at 1st January,
2012
As at 31st December,
2013
As at 31st December,
2012
For the year ended on 31st
December, 2013
For the year ended on 31st
December, 2012I. a) Power Driven Pumps 198.14 270.42 229.61 198.14 5,081.70 4,797.35 b) Spares for above - - - - 673.36 557.26 II. a) Industrial Valves 140.57 159.00 76.97 140.57 1,181.49 1,415.18 b) Spares for above - - - - 25.25 34.91 III. Castings - Carbon
Steel, Alloy Steel & Alloy Iron Castings
- - - - 4.97 2.80
IV. Export Incentives - - - - 42.10 15.84 V. Income from Services - - - - 144.94 155.73 VI. Pumps for resale 82.14 81.17 69.16 82.14 111.62 117.61 VII. Valves for resale - 2.36 - - 13.14 9.35 VIII. Spares for resale 3.46 2.67 1.43 3.46 9.79 7.87 IX. Scrap Sales - - - - 25.07 23.78
Total 424.31 515.62 377.17 424.31 7,313.43 7,137.68 Note:1. In addition to spares purchased for re-sale, the company also sells as spares some of its bought-out components.
The Company is of the opinion that the purchase and sale of such bought-out components is a part of its activity to manufacture and deliver a complete pump unit and therefore, is not a trading activity as referred to in paragraph 5(ii)(b) of revised Schedule VI of the Companies Act, 1956.
Note 30 - Expenditure in foreign currency (disclosed on accrual basis)Particulars For the year ended
31st December, 2013` in Million
For the year ended 31st December, 2012
` in Million (i) Royalty (net of tax) 47.24 26.88 (ii) Professional fees (net of tax) 68.93 47.59 (iii) Technical services (net of tax) 11.29 2.55 (iv) Other matters 119.03 128.59
Note 31 - Earnings in foreign currency(i) Exports at FOB value * 1,067.49 1,033.56 (ii) Recovery of packing and forwarding charges 5.44 5.58 (iii) Service charges 18.33 18.40 (iv) Technical services 13.47 13.31 (v) Commission 30.16 35.10 (vi) Others 1.81 - * Excludes ` 21.08 Million (previous year - ` 17.72 Million) on account of exports to Nepal, consideration for
which is receivable in Indian Rupees.
Note 32 – Amounts remitted in foreign currency during the year on account of dividend Particulars Paid in Year 2013 Paid in Year 2012
2nd Interim 1st Interim Final 1st Interim
(i) Year to which the dividend relates 2012 2013 2011 2012(ii) Number of non-resident shareholders to whom
remittance was made 203 217 216 215(iii) Number of shares on which remittance was made 14,449,025 14,595,408 14,385,562 14,418,593 (iv) Amount remitted (` in Million) 65.02 14.60 43.16 14.42 The above information pertains to only those non-resident shareholders where the company has made direct remittance or has made payment into non-resident designated accounts with banks in India.
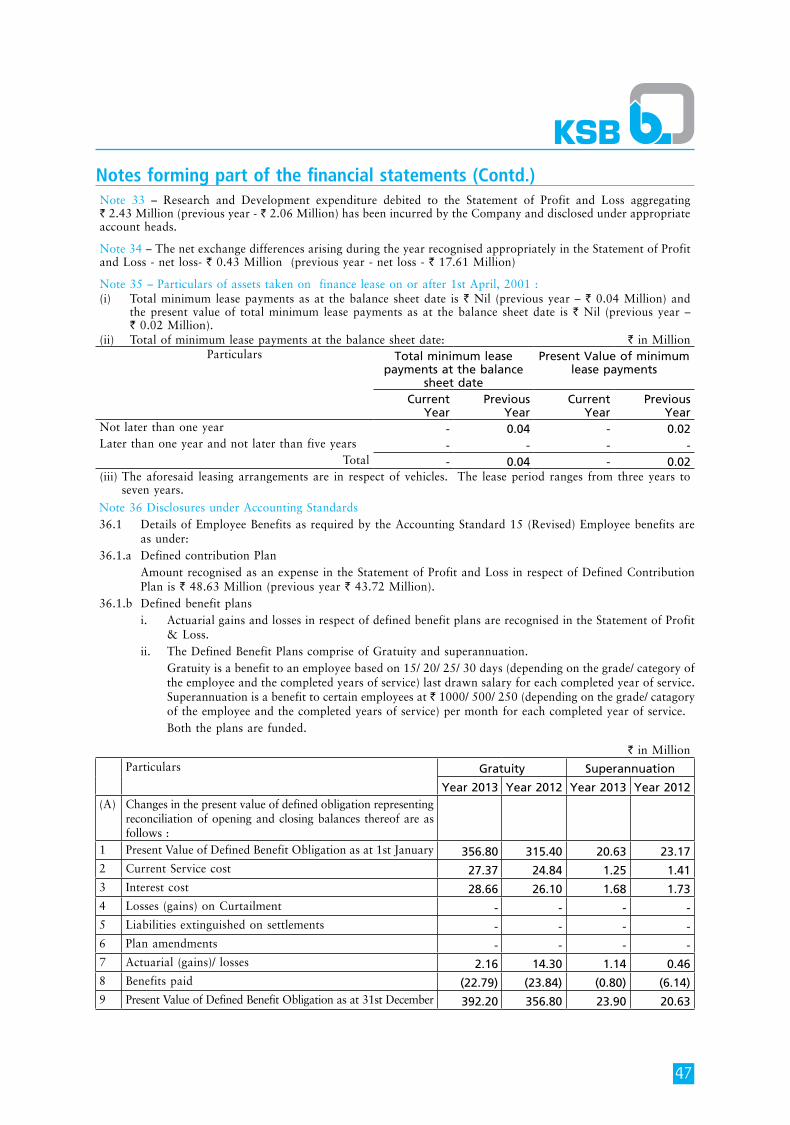
47
Notes forming part of the financial statements (Contd.)Note 33 – Research and Development expenditure debited to the Statement of Profit and Loss aggregating ` 2.43 Million (previous year - ` 2.06 Million) has been incurred by the Company and disclosed under appropriate account heads.
Note 34 – The net exchange differences arising during the year recognised appropriately in the Statement of Profit and Loss - net loss- ` 0.43 Million (previous year - net loss - ` 17.61 Million)
Note 35 – Particulars of assets taken on finance lease on or after 1st April, 2001 :(i) Total minimum lease payments as at the balance sheet date is ` Nil (previous year – ` 0.04 Million) and
the present value of total minimum lease payments as at the balance sheet date is ` Nil (previous year – ` 0.02 Million).
(ii) Total of minimum lease payments at the balance sheet date: ` in MillionParticulars Total minimum lease
payments at the balance sheet date
Present Value of minimum lease payments
Current Year
Previous Year
Current Year
Previous Year
Not later than one year - 0.04 - 0.02 Later than one year and not later than five years - - - -
Total - 0.04 - 0.02 (iii) The aforesaid leasing arrangements are in respect of vehicles. The lease period ranges from three years to
seven years.
Note 36 Disclosures under Accounting Standards36.1 Details of Employee Benefits as required by the Accounting Standard 15 (Revised) Employee benefits are
as under:36.1.a Defined contribution Plan
Amount recognised as an expense in the Statement of Profit and Loss in respect of Defined Contribution Plan is ` 48.63 Million (previous year ` 43.72 Million).
36.1.b Defined benefit plansi. Actuarial gains and losses in respect of defined benefit plans are recognised in the Statement of Profit
& Loss.ii. The Defined Benefit Plans comprise of Gratuity and superannuation.
Gratuity is a benefit to an employee based on 15/ 20/ 25/ 30 days (depending on the grade/ category of the employee and the completed years of service) last drawn salary for each completed year of service.Superannuation is a benefit to certain employees at ` 1000/ 500/ 250 (depending on the grade/ catagory of the employee and the completed years of service) per month for each completed year of service.Both the plans are funded.
` in MillionParticulars Gratuity Superannuation
Year 2013 Year 2012 Year 2013 Year 2012(A) Changes in the present value of defined obligation representing
reconciliation of opening and closing balances thereof are as follows :
1 Present Value of Defined Benefit Obligation as at 1st January 356.80 315.40 20.63 23.17 2 Current Service cost 27.37 24.84 1.25 1.41 3 Interest cost 28.66 26.10 1.68 1.73 4 Losses (gains) on Curtailment - - - - 5 Liabilities extinguished on settlements - - - - 6 Plan amendments - - - - 7 Actuarial (gains)/ losses 2.16 14.30 1.14 0.46 8 Benefits paid (22.79) (23.84) (0.80) (6.14)9 Present Value of Defined Benefit Obligation as at 31st December 392.20 356.80 23.90 20.63
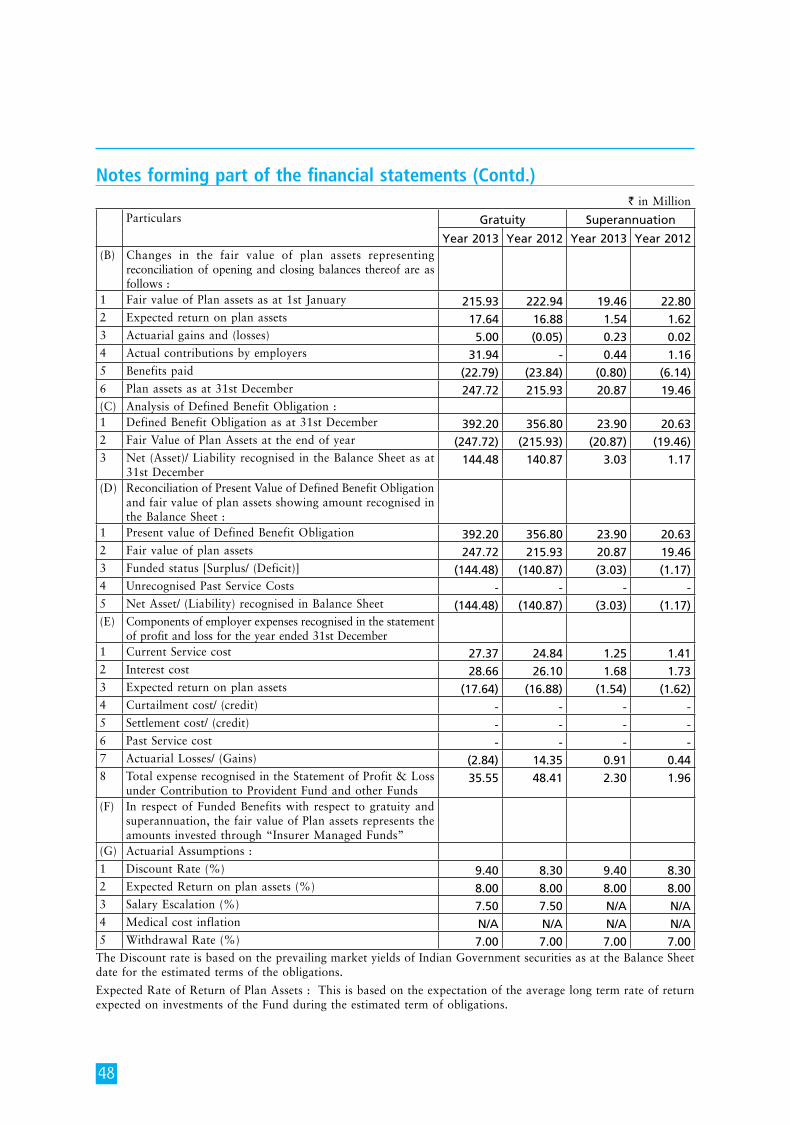
48
Notes forming part of the financial statements (Contd.)` in Million
Particulars Gratuity Superannuation
Year 2013 Year 2012 Year 2013 Year 2012(B) Changes in the fair value of plan assets representing
reconciliation of opening and closing balances thereof are as follows :
1 Fair value of Plan assets as at 1st January 215.93 222.94 19.46 22.80 2 Expected return on plan assets 17.64 16.88 1.54 1.62 3 Actuarial gains and (losses) 5.00 (0.05) 0.23 0.02 4 Actual contributions by employers 31.94 - 0.44 1.16 5 Benefits paid (22.79) (23.84) (0.80) (6.14)6 Plan assets as at 31st December 247.72 215.93 20.87 19.46 (C) Analysis of Defined Benefit Obligation :1 Defined Benefit Obligation as at 31st December 392.20 356.80 23.90 20.63 2 Fair Value of Plan Assets at the end of year (247.72) (215.93) (20.87) (19.46)3 Net (Asset)/ Liability recognised in the Balance Sheet as at
31st December 144.48 140.87 3.03 1.17
(D) Reconciliation of Present Value of Defined Benefit Obligation and fair value of plan assets showing amount recognised in the Balance Sheet :
1 Present value of Defined Benefit Obligation 392.20 356.80 23.90 20.63 2 Fair value of plan assets 247.72 215.93 20.87 19.46 3 Funded status [Surplus/ (Deficit)] (144.48) (140.87) (3.03) (1.17)4 Unrecognised Past Service Costs - - - - 5 Net Asset/ (Liability) recognised in Balance Sheet (144.48) (140.87) (3.03) (1.17)(E) Components of employer expenses recognised in the statement
of profit and loss for the year ended 31st December1 Current Service cost 27.37 24.84 1.25 1.41 2 Interest cost 28.66 26.10 1.68 1.73 3 Expected return on plan assets (17.64) (16.88) (1.54) (1.62)4 Curtailment cost/ (credit) - - - - 5 Settlement cost/ (credit) - - - - 6 Past Service cost - - - - 7 Actuarial Losses/ (Gains) (2.84) 14.35 0.91 0.44 8 Total expense recognised in the Statement of Profit & Loss
under Contribution to Provident Fund and other Funds35.55 48.41 2.30 1.96
(F) In respect of Funded Benefits with respect to gratuity and superannuation, the fair value of Plan assets represents the amounts invested through “Insurer Managed Funds”
(G) Actuarial Assumptions :
1 Discount Rate (%) 9.40 8.30 9.40 8.302 Expected Return on plan assets (%) 8.00 8.00 8.00 8.003 Salary Escalation (%) 7.50 7.50 N/A N/A4 Medical cost inflation N/A N/A N/A N/A5 Withdrawal Rate (%) 7.00 7.00 7.00 7.00
The Discount rate is based on the prevailing market yields of Indian Government securities as at the Balance Sheet date for the estimated terms of the obligations.
Expected Rate of Return of Plan Assets : This is based on the expectation of the average long term rate of return expected on investments of the Fund during the estimated term of obligations.
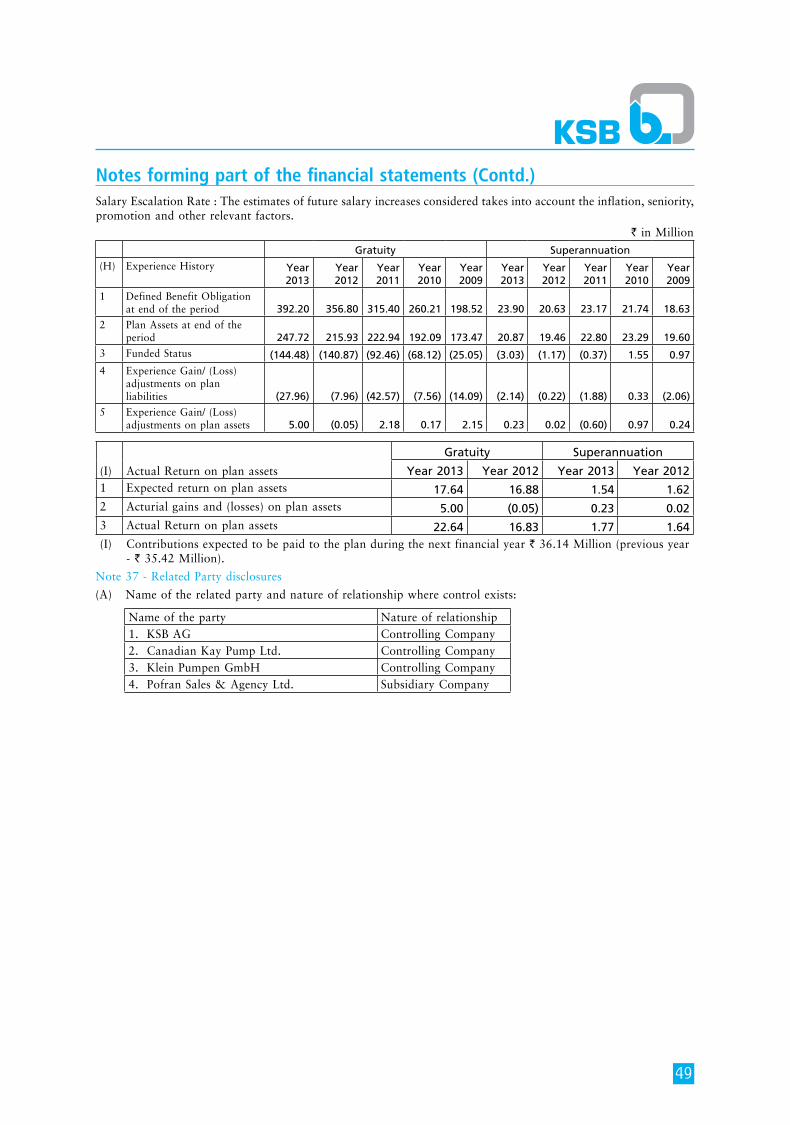
49
Notes forming part of the financial statements (Contd.)Salary Escalation Rate : The estimates of future salary increases considered takes into account the inflation, seniority, promotion and other relevant factors.
` in MillionGratuity Superannuation
(H) Experience History Year 2013
Year 2012
Year 2011
Year 2010
Year 2009
Year 2013
Year 2012
Year 2011
Year 2010
Year 2009
1 Defined Benefit Obligation at end of the period 392.20 356.80 315.40 260.21 198.52 23.90 20.63 23.17 21.74 18.63
2 Plan Assets at end of the period 247.72 215.93 222.94 192.09 173.47 20.87 19.46 22.80 23.29 19.60
3 Funded Status (144.48) (140.87) (92.46) (68.12) (25.05) (3.03) (1.17) (0.37) 1.55 0.97
4 Experience Gain/ (Loss) adjustments on plan liabilities (27.96) (7.96) (42.57) (7.56) (14.09) (2.14) (0.22) (1.88) 0.33 (2.06)
5 Experience Gain/ (Loss) adjustments on plan assets 5.00 (0.05) 2.18 0.17 2.15 0.23 0.02 (0.60) 0.97 0.24
(I) Actual Return on plan assets
Gratuity Superannuation
Year 2013 Year 2012 Year 2013 Year 20121 Expected return on plan assets 17.64 16.88 1.54 1.62 2 Acturial gains and (losses) on plan assets 5.00 (0.05) 0.23 0.02 3 Actual Return on plan assets 22.64 16.83 1.77 1.64 (I) Contributions expected to be paid to the plan during the next financial year ` 36.14 Million (previous year
- ` 35.42 Million).
Name of the party Nature of relationship1. KSB AG Controlling Company2. Canadian Kay Pump Ltd. Controlling Company3. Klein Pumpen GmbH Controlling Company4. Pofran Sales & Agency Ltd. Subsidiary Company
Note 37 - Related Party disclosures
(A) Name of the related party and nature of relationship where control exists:

50
Notes forming part of the financial statements (Contd.)
(B)
Rel
ated
Par
ty T
rans
actio
nsN
atur
e of
tra
nsac
tions
Con
trol
ling
Com
pani
esSu
bsid
iary
Com
pany
Ass
ocia
teC
ompa
nyC
omm
onC
ontr
olK
eyM
anag
emen
tPe
rson
nel
Rel
ativ
esof
Key
Man
agem
ent
Pers
onne
l
Indi
vidu
als
havi
ng
sign
ifica
nt
influ
ence
over
the
rep
ortin
gen
terp
rise
Rel
ativ
es o
f in
divi
dual
s ha
ving
si
gnifi
cant
in
fluen
ce o
ver
the
ente
rpri
se
Ente
rpri
ses
over
whi
ch
indi
vidu
als
havi
ng s
igni
fican
t in
fluen
ce o
ver
the
repo
rtin
gen
terp
rise
exe
rcis
e si
gnifi
cant
in
fluen
ce
Tota
l
` in
Mill
ion
` in
Mill
ion
` in
Mill
ion
` in
M
illio
n`
in M
illio
n`
in M
illio
n`
in M
illio
n`
in M
illio
n`
in M
illio
n`
in
Mill
ion
Purc
hase
of
good
s 6
4.41
-
1
.25
39.
65
-
-
-
-
-
105
.31
(53
.37)
(
- )
(0.
59)
(53
.04)
(
- )
(
- )
(
- )
(
- )
(
- )
(10
7.00
)Pu
rcha
se o
f Fi
xed
Ass
ets
0.5
1 -
-
0
.02
-
-
-
-
-
0.5
3
( -
)
( -
)
( -
)
( -
)
( -
)
( -
)
( -
)
( -
)
( -
)
( -
) Sa
le o
f go
ods
296
.92
-
-
644
.28
-
-
-
-
11.
20
952
.40
(44
5.02
)
( -
)
( -
) (
456.
87)
(
- )
(
- )
(
- )
(
- )
(6.
17)
(90
8.06
)In
com
e fr
om s
ervi
ces
18.
83
-
-
17.
79
-
-
-
-
-
36.
62
(23
.84)
(0.
03)
(
- )
(12
.15)
(
- )
(
- )
(
- )
(
- )
(0.
02)
(36
.04)
Ord
er C
ance
llatio
n C
harg
es r
ecei
ved
1.1
6 -
-
0
.65
-
-
-
-
-
1.8
1
( -
)
( -
)
( -
)
( -
)
( -
)
( -
)
( -
)
( -
) (
- )
( -
)Si
te e
xpen
ses
paid
2.5
4 -
-
4
.51
-
-
-
-
-
7.0
5 (
0.10
)
( -
)
( -
) (
0.82
)
( -
)
( -
)
( -
)
( -
)
( -
) (
0.92
)C
omm
issi
on in
com
e 2
5.60
-
-
4
.56
-
-
-
-
-
30.
16
(29
.99)
(
- )
(
- )
(5.
11)
(
- )
(
- )
(
- )
(
- )
(
- )
(35
.10)
Com
mis
sion
pai
d -
-
-
1
00.8
4 -
-
-
-
-
1
00.8
4
( -
)
( -
)
( -
) (
103.
36)
(
- )
(
- )
(
- )
(
- )
(
- )
(10
3.36
)D
ivid
end
rece
ived
-
-
38.
96
-
-
-
-
-
-
38.
96
(
- )
(
- )
(38
.96)
(
- )
(
- )
(
- )
(
- )
(
- )
(
- )
(38
.96)
Liqu
idat
ed D
amag
es P
aid
-
-
-
-
-
-
-
-
-
-
(
- )
(
- )
(
- )
(1.
27)
(
- )
(
- )
(
- )
(
- )
(
- )
(1.
27)
Cha
rges
pai
d fo
r te
chni
cal/
88.
38
-
-
7.5
9 -
-
-
-
-
9
5.97
Pr
ofes
sion
al s
ervi
ces
(52
.88)
(
- )
(
- )
(5.
64)
(
- )
(
- )
(
- )
(
- )
(
- )
(58
.52)
Roy
alty
pai
d 5
2.11
-
-
0
.37
-
-
-
-
-
52.
48
(29
.41)
(
- )
(
- )
(0.
46)
(
- )
(
- )
(
- )
(
- )
(
- )
(29
.87)
War
rant
y c
harg
es p
aid
-
-
-
5.0
0 -
-
-
-
-
5
.00
(13
.33)
(
- )
(
- )
(0.
81)
(
- )
(
- )
(
- )
(
- )
(
- )
(14
.14)
Ren
t re
ceiv
ed
-
0.0
6 1
.61
-
-
-
-
-
-
1.6
7
( -
) (
0.06
) (
1.61
)
( -
)
( -
)
( -
)
( -
)
( -
)
( -
) (
1.67
)R
ecov
ery
of e
xpen
ses
3.3
3 0
.33
10.
30
5.3
0 -
-
-
-
-
1
9.26
(
0.32
) (
0.33
) (
10.8
9) (
4.17
)
( -
)
( -
)
( -
)
( -
) (
0.03
) (
15.7
4)R
eim
burs
emen
t of
exp
ense
s 0
.27
-
-
0.0
8 -
-
-
-
-
0
.35
(4.
49)
(
- )
(
- )
(0.
16)
(
- )
(
- )
(
- )
(
- )
(
- )
(4.
65)
Tech
nica
l kno
who
w 0
.76
-
-
-
-
-
-
-
-
0.7
6 (
2.83
)
( -
)
( -
)
( -
)
( -
)
( -
)
( -
)
( -
)
( -
) (
2.83
)R
emun
erat
ion
-
-
-
-
7.8
6 -
-
-
-
7
.86
(
- )
(
- )
(
- )
(
- )
(6.
22)
(
- )
(
- )
(
- )
(
- )
(6.
22)
Sitt
ing
fees
pai
d -
-
-
-
-
-
0
.12
-
-
0.1
2
( -
)
( -
)
( -
)
( -
)
( -
)
( -
) (
0.09
)
( -
)
( -
) (
0.09
)
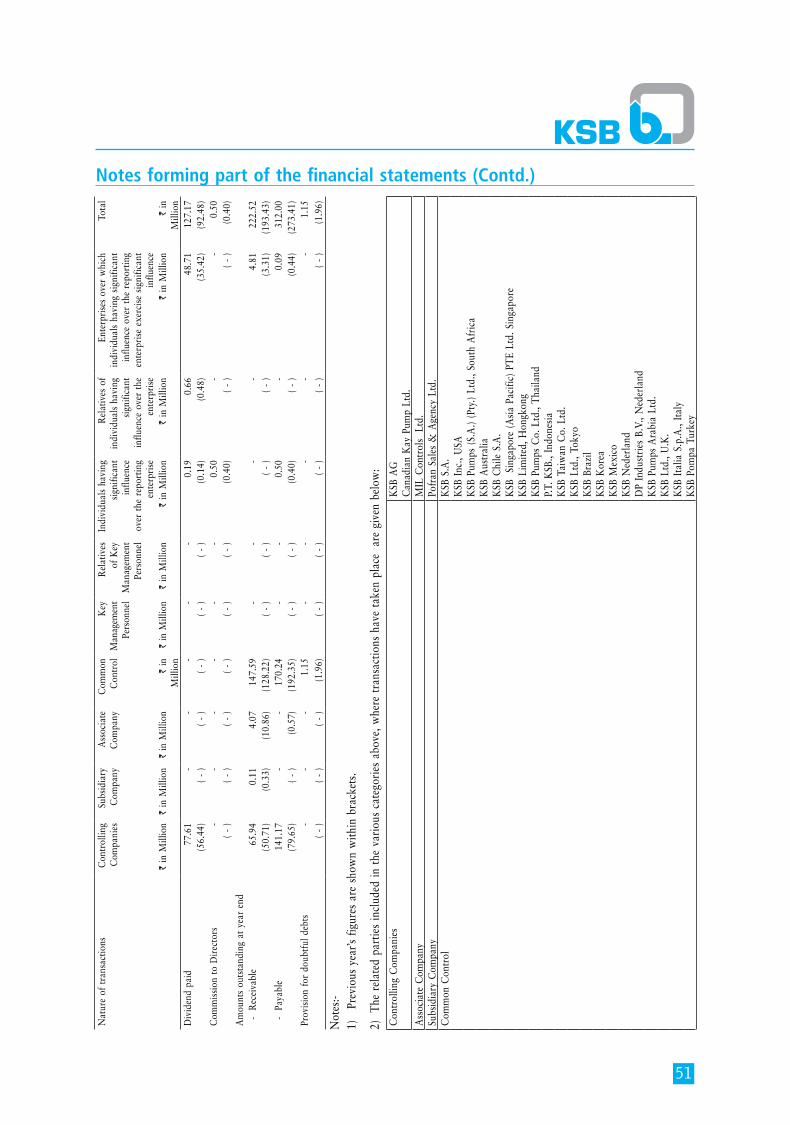
51
Notes forming part of the financial statements (Contd.)
2)
The
rel
ated
par
ties
incl
uded
in t
he v
ario
us c
ateg
orie
s ab
ove,
whe
re t
rans
actio
ns h
ave
take
n pl
ace
are
giv
en b
elow
:
Con
trol
ling
Com
pani
esK
SB A
GC
anad
ian
Kay
Pum
p Lt
d.A
ssoc
iate
Com
pany
MIL
Con
trol
s L
td.
Subs
idia
ry C
ompa
nyPo
fran
Sal
es &
Age
ncy
Ltd.
Com
mon
Con
trol
KSB
S.A
.K
SB I
nc.,
USA
KSB
Pum
ps (
S.A
.) (P
ty.)
Ltd.
, Sou
th A
fric
aK
SB A
ustr
alia
KSB
Chi
le S
.A.
KSB
Si
ngap
ore
(Asi
a Pa
cific
) PT
E Lt
d. S
inga
pore
KSB
Lim
ited,
Hon
gkon
gK
SB P
umps
Co.
Ltd
., T
haila
ndP.
T. K
SB.,
Indo
nesi
aK
SB T
aiw
an C
o. L
td.
KSB
Ltd
., To
kyo
KSB
Bra
zil
KSB
Kor
ea
KSB
Mex
ico
KSB
Ned
erla
ndD
P In
dust
ries
B.V
., N
eder
land
KSB
Pum
ps A
rabi
a Lt
d.K
SB L
td.,
U.K
.K
SB I
talia
S.p
.A.,
Ital
yK
SB P
ompa
Tur
key
Nat
ure
of t
rans
actio
nsC
ontr
ollin
gC
ompa
nies
Subs
idia
ryC
ompa
nyA
ssoc
iate
Com
pany
Com
mon
Con
trol
Key
Man
agem
ent
Pers
onne
l
Rel
ativ
esof
Key
Man
agem
ent
Pers
onne
l
Indi
vidu
als
havi
ng
sign
ifica
nt
influ
ence
over
the
rep
ortin
gen
terp
rise
Rel
ativ
es o
f in
divi
dual
s ha
ving
si
gnifi
cant
in
fluen
ce o
ver
the
ente
rpri
se
Ente
rpri
ses
over
whi
ch
indi
vidu
als
havi
ng s
igni
fican
t in
fluen
ce o
ver
the
repo
rtin
gen
terp
rise
exe
rcis
e si
gnifi
cant
in
fluen
ce
Tota
l
` in
Mill
ion
` in
Mill
ion
` in
Mill
ion
` in
M
illio
n`
in M
illio
n`
in M
illio
n`
in M
illio
n`
in M
illio
n`
in M
illio
n`
in
Mill
ion
Div
iden
d pa
id 7
7.61
-
-
-
-
-
0
.19
0.6
6 4
8.71
1
27.1
7 (
56.4
4)
( -
)
( -
)
( -
)
( -
)
( -
) (
0.14
) (
0.48
) (
35.4
2) (
92.4
8)C
omm
issi
on t
o D
irec
tors
-
-
-
-
-
-
0.5
0 -
-
0
.50
(
- )
(
- )
(
- )
(
- )
(
- )
(
- )
(0.
40)
(
- )
(
- )
(0.
40)
Am
ount
s ou
tsta
ndin
g at
yea
r en
d
- R
ecei
vabl
e 6
5.94
0
.11
4.0
7 1
47.5
9 -
-
-
-
4
.81
222
.52
(50
.71)
(0.
33)
(10
.86)
(12
8.22
)
( -
)
( -
)
( -
)
( -
) (
3.31
) (
193.
43)
-
Pay
able
141
.17
-
-
170
.24
-
-
0.5
0 -
0
.09
312
.00
(79
.65)
(
- )
(0.
57)
(19
2.35
)
( -
)
( -
) (
0.40
)
( -
) (
0.44
) (
273.
41)
Prov
isio
n fo
r do
ubtf
ul d
ebts
-
-
-
1.1
5 -
-
-
-
-
1
.15
(
- )
(
- )
(
- )
(1.
96)
(
- )
(
- )
(
- )
(
- )
(
- )
(1.
96)
Not
es:-
1)
Pre
viou
s ye
ar’s
figur
es a
re s
how
n w
ithin
bra
cket
s.
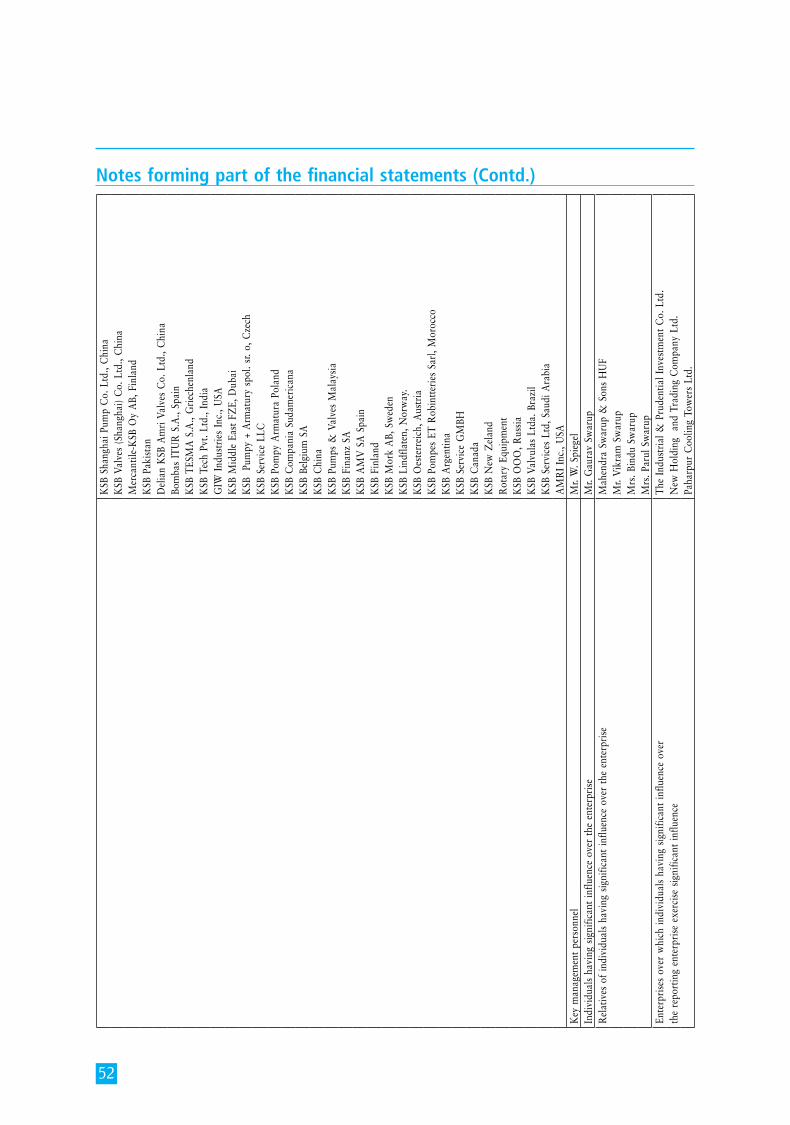
52
Notes forming part of the financial statements (Contd.)
KSB
Sha
ngha
i Pum
p C
o. L
td.,
Chi
naK
SB V
alve
s (S
hang
hai)
Co.
Ltd
., C
hina
Mer
cant
ile-K
SB O
y A
B, F
inla
ndK
SB P
akis
tan
Del
ian
KSB
Am
ri V
alve
s C
o. L
td.,
Chi
naBo
mba
s IT
UR
S.A
., Sp
ain
KSB
TES
MA
S.A
., G
riec
henl
and
KSB
Tec
h Pv
t. Lt
d., I
ndia
GIW
Ind
ustr
ies
Inc.
, USA
KSB
Mid
dle
East
FZ
E, D
ubai
KSB
Pu
mpy
+ A
rmat
ury
spol
. sr.
o, C
zech
KSB
Ser
vice
LLC
KSB
Pom
py A
rmat
ura
Pola
ndK
SB C
ompa
nia
Suda
mer
ican
aK
SB B
elgi
um S
AK
SB C
hina
KSB
Pum
ps &
Val
ves
Mal
aysi
a K
SB F
inan
z SA
KSB
AM
V S
A S
pain
KSB
Fin
land
KSB
Mor
k A
B, S
wed
enK
SB L
indf
late
n, N
orw
ay.
KSB
Oes
terr
eich
, Aus
tria
KSB
Pom
pes
ET R
obin
tter
ies
Sarl
, Mor
occo
KSB
Arg
entin
aK
SB S
ervi
ce G
MBH
KSB
Can
ada
KSB
New
Zel
and
Rot
ary
Equi
pmen
tK
SB O
OO
, Rus
sia
KSB
Val
vula
s Lt
da. B
razi
lK
SB S
ervi
ces
Ltd,
Sau
di A
rabi
aA
MR
I In
c., U
SAK
ey m
anag
emen
t pe
rson
nel
Mr.
W. S
pieg
elIn
divi
dual
s ha
ving
sig
nific
ant
influ
ence
ove
r th
e en
terp
rise
Mr.
Gau
rav
Swar
upR
elat
ives
of
indi
vidu
als
havi
ng s
igni
fican
t in
fluen
ce o
ver
the
ente
rpri
seM
ahen
dra
Swar
up &
Son
s H
UF
Mr.
Vik
ram
Sw
arup
Mrs
. Bin
du S
war
upM
rs. P
arul
Sw
arup
Ente
rpri
ses
over
whi
ch in
divi
dual
s ha
ving
sig
nific
ant
influ
ence
ove
r T
he I
ndus
tria
l & P
rude
ntia
l Inv
estm
ent
Co.
Ltd
.th
e re
port
ing
ente
rpri
se e
xerc
ise
sign
ifica
nt in
fluen
ce
New
Hol
ding
an
d Tr
adin
g C
ompa
ny L
td.
Paha
rpur
Coo
ling
Tow
ers
Ltd.
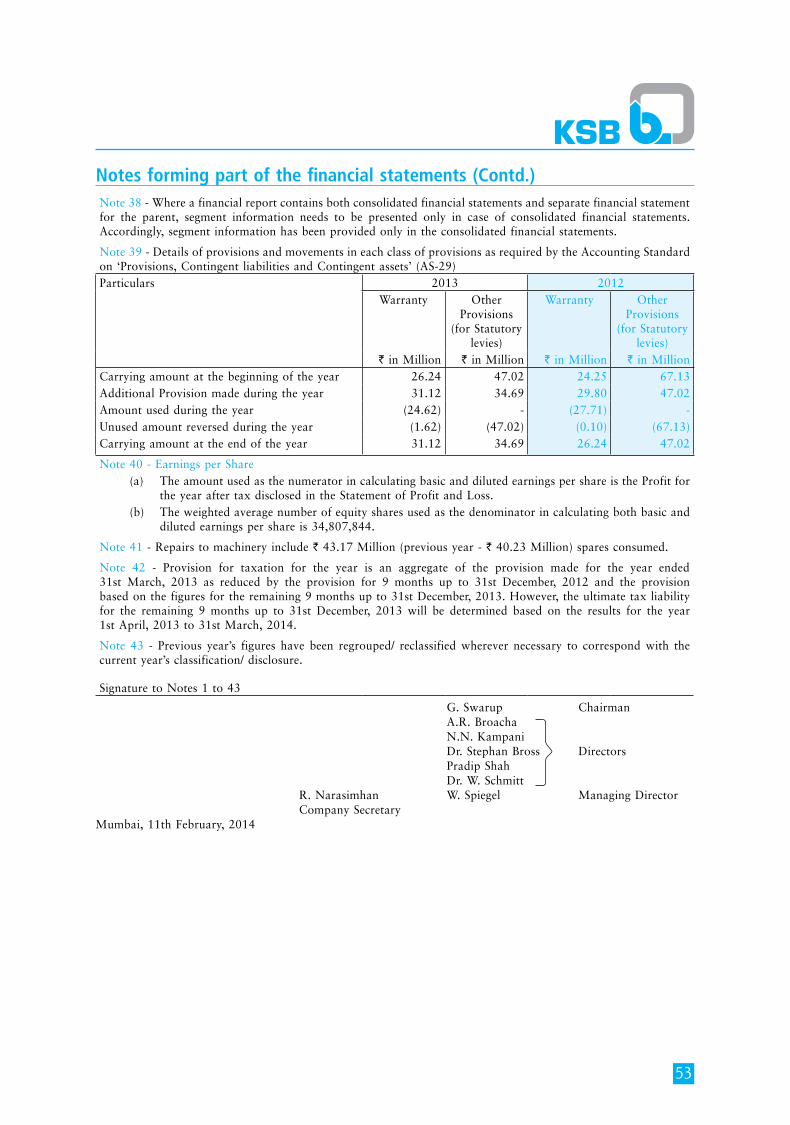
53
Notes forming part of the financial statements (Contd.)Note 38 - Where a financial report contains both consolidated financial statements and separate financial statement for the parent, segment information needs to be presented only in case of consolidated financial statements. Accordingly, segment information has been provided only in the consolidated financial statements.
Note 39 - Details of provisions and movements in each class of provisions as required by the Accounting Standard on ‘Provisions, Contingent liabilities and Contingent assets’ (AS-29)Particulars 2013 2012
Warranty Other Provisions
(for Statutory levies)
Warranty Other Provisions
(for Statutory levies)
` in Million ` in Million ` in Million ` in MillionCarrying amount at the beginning of the year 26.24 47.02 24.25 67.13 Additional Provision made during the year 31.12 34.69 29.80 47.02 Amount used during the year (24.62) - (27.71) - Unused amount reversed during the year (1.62) (47.02) (0.10) (67.13)Carrying amount at the end of the year 31.12 34.69 26.24 47.02
Note 40 - Earnings per Share (a) The amount used as the numerator in calculating basic and diluted earnings per share is the Profit for
the year after tax disclosed in the Statement of Profit and Loss. (b) The weighted average number of equity shares used as the denominator in calculating both basic and
diluted earnings per share is 34,807,844.
Note 41 - Repairs to machinery include ` 43.17 Million (previous year - ` 40.23 Million) spares consumed.
Note 42 - Provision for taxation for the year is an aggregate of the provision made for the year ended 31st March, 2013 as reduced by the provision for 9 months up to 31st December, 2012 and the provision based on the figures for the remaining 9 months up to 31st December, 2013. However, the ultimate tax liability for the remaining 9 months up to 31st December, 2013 will be determined based on the results for the year 1st April, 2013 to 31st March, 2014.
Note 43 - Previous year’s figures have been regrouped/ reclassified wherever necessary to correspond with the current year’s classification/ disclosure.
Signature to Notes 1 to 43
G. Swarup Chairman A.R. Broacha N.N. Kampani Dr. Stephan Bross Directors Pradip Shah Dr. W. Schmitt R. Narasimhan W. Spiegel Managing Director Company Secretary Mumbai, 11th February, 2014
54
INDEPENDENT AUDITORS’ REPORT CONSOLIDATED
To The Board of Directors ofKSB Pumps Limited
RePoRT on The ConSoLiDaTeD FinanCiaL STaTemenTS
We have audited the accompanying consolidated financial statements of KSB PUmPS LimiTeD (the “Company”), and its subsidiary (the Company and its subsidiary constitute “the Group”), which comprise the Consolidated Balance Sheet as at 31st December, 2013, the Consolidated Statement of Profit and Loss and the Consolidated Cash Flow Statement for the year then ended, and a summary of the significant accounting policies and other explanatory information. The Consolidated Financial Statements include investment in an associate accounted on the equity method in accordance with accounting Standard 23 (accounting for investments in associates in Consolidated Financial Statements) as notified under the Companies (accounting Standards) Rules, 2006.
manaGemenT’S ReSPonSiBiLiTy FoR The ConSoLiDaTeD FinanCiaL STaTemenTS
The Company’s management is responsible for the preparation of these consolidated financial statements that give a true and fair view of the consolidated financial position, consolidated financial performance and consolidated cash flows of the Group in accordance with the accounting principles generally accepted in india. This responsibility includes the design, implementation and maintenance of internal control relevant to the preparation and presentation of the consolidated financial statements that give a true and fair view and are free from material misstatement, whether due to fraud or error.
aUDiToRS’ ReSPonSiBiLiTy
our responsibility is to express an opinion on these consolidated financial statements based on
our audit. We conducted our audit in accordance with the Standards on auditing issued by the institute of Chartered accountants of india. Those Standards require that we comply with ethical requirements and plan and perform the audit to obtain reasonable assurance about whether the consolidated financial statements are free from material misstatement.
an audit involves performing procedures to obtain audit evidence about the amounts and the disclosures in the consolidated financial statements. The procedures selected depend on the auditor’s judgement, including the assessment of the risks of material misstatement of the consolidated financial statements, whether due to fraud or error. in making those risk assessments, the auditor considers internal control relevant to the Company’s preparation and presentation of the consolidated financial statements that give a true and fair view in order to design audit procedures that are appropriate in the circumstances, but not for the purpose of expressing an opinion on the effectiveness of the Company’s internal control. an audit also includes evaluating the appropriateness of the accounting policies used and the reasonableness of the accounting estimates made by the management, as well as evaluating the overall presentation of the consolidated financial statements.
We believe that the audit evidence we have obtained is sufficient and appropriate to provide a basis for our audit opinion.
oPinion
in our opinion and to the best of our information and according to the explanations given to us, and based on the consideration of the reports of the other auditors on the financial statements of the subsidiary referred to below in the other matter paragraph, the aforesaid consolidated financial statements give a true and fair view in conformity with the accounting principles generally accepted in india:
55
INDEPENDENT AUDITORS’ REPORT CONSOLIDATED (Contd.)(a) in the case of the Consolidated Balance
Sheet, of the state of affairs of the Group as at 31st December, 2013;
(b) in the case of the Consolidated Statement of Profit and Loss, of the profit of the Group for the year ended on that date; and
(c) in the case of the Consolidated Cash Flow Statement, of the cash flows of the Group for the year ended on that date.
oTheR maTTeR
We did not audit the financial statements of Pofran Sales and agency Limited, a subsidiary, whose financial statements reflect total assets of ` 63,690,280 as at 31st December, 2013, total revenues of ` 19,175,890 and cash outflows amounting to ` 9,764,160 for the year ended
on that date, as considered in the consolidated financial statements. These financial statements have been audited by other auditors whose report have been furnished to us by the management and our opinion, in so far as it relates to the amounts and disclosures included in respect of this subsidiary is based solely on the report of the other auditors.
our opinion is not qualified in respect of this matter.
For Deloitte haskins & Sells LLPChartered accountants
(Registration no. 117366W/ W-100018)
hemant m. JoshiPartner
membership no. 038019Pune, 11th February, 2014
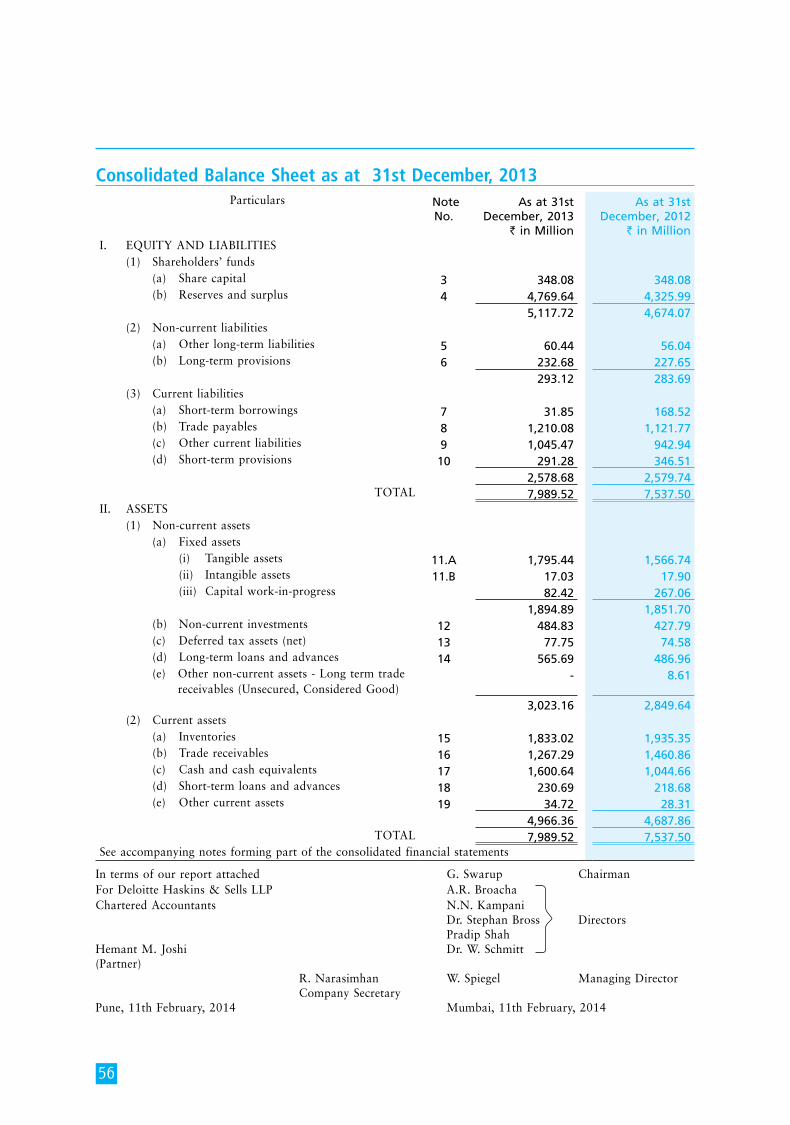
56
Consolidated Balance Sheet as at 31st December, 2013
in terms of our report attached G. Swarup ChairmanFor Deloitte haskins & Sells LLP a.R. Broacha Chartered accountants n.n. Kampani Dr. Stephan Bross Directors Pradip Shah hemant m. Joshi Dr. W. Schmitt (Partner) R. narasimhan W. Spiegel managing Director Company Secretary Pune, 11th February, 2014 mumbai, 11th February, 2014
Particulars Note No.
As at 31st December, 2013
` in Million
As at 31st December, 2012
` in Million i. eQUiTy anD LiaBiLiTieS (1) Shareholders’ funds
(a) Share capital 3 348.08 348.08 (b) Reserves and surplus 4 4,769.64 4,325.99
5,117.72 4,674.07 (2) non-current liabilities (a) other long-term liabilities 5 60.44 56.04 (b) Long-term provisions 6 232.68 227.65
293.12 283.69 (3) Current liabilities (a) Short-term borrowings 7 31.85 168.52 (b) Trade payables 8 1,210.08 1,121.77 (c) other current liabilities 9 1,045.47 942.94 (d) Short-term provisions 10 291.28 346.51
2,578.68 2,579.74 ToTaL 7,989.52 7,537.50
ii. aSSeTS(1) non-current assets (a) Fixed assets (i) Tangible assets 11.A 1,795.44 1,566.74 (ii) intangible assets 11.B 17.03 17.90 (iii) Capital work-in-progress 82.42 267.06
1,894.89 1,851.70 (b) non-current investments 12 484.83 427.79 (c) Deferred tax assets (net) 13 77.75 74.58 (d) Long-term loans and advances 14 565.69 486.96 (e) other non-current assets - Long term trade
receivables (Unsecured, Considered Good) - 8.61
3,023.16 2,849.64 (2) Current assets (a) inventories 15 1,833.02 1,935.35 (b) Trade receivables 16 1,267.29 1,460.86 (c) Cash and cash equivalents 17 1,600.64 1,044.66 (d) Short-term loans and advances 18 230.69 218.68 (e) other current assets 19 34.72 28.31
4,966.36 4,687.86ToTaL 7,989.52 7,537.50
See accompanying notes forming part of the consolidated financial statements
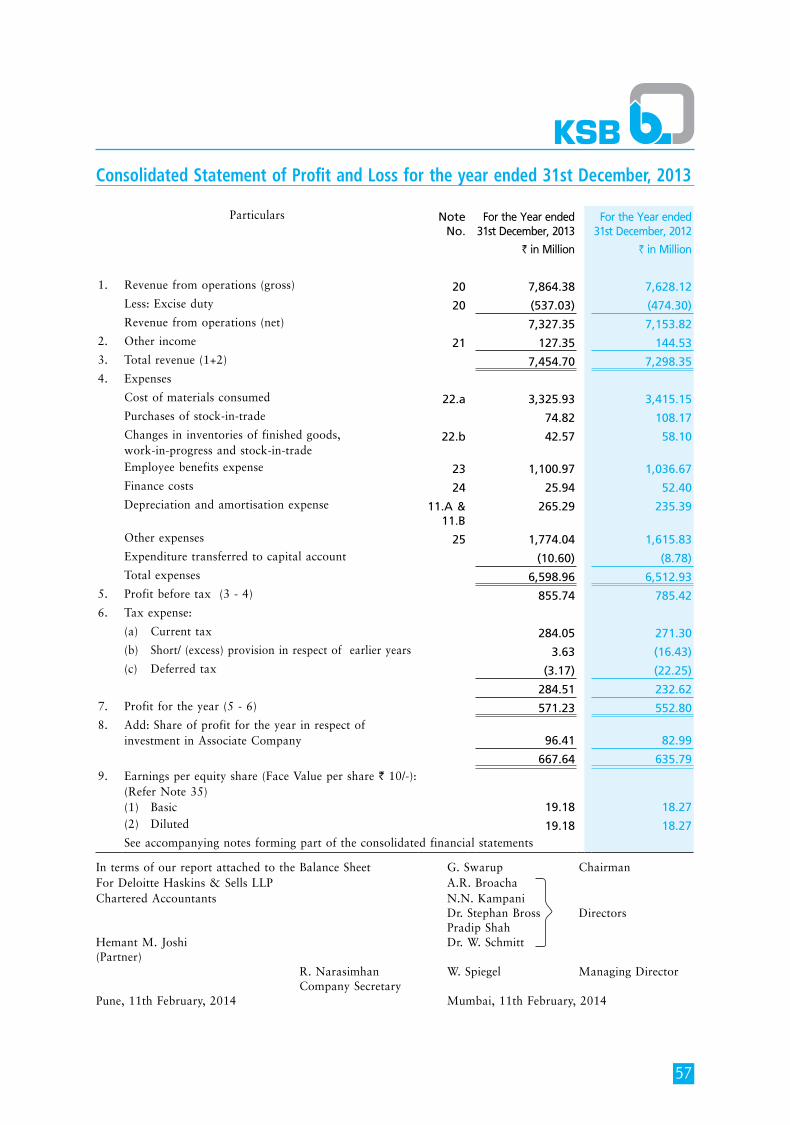
57
Consolidated Statement of Profit and Loss for the year ended 31st December, 2013
in terms of our report attached to the Balance Sheet G. Swarup ChairmanFor Deloitte haskins & Sells LLP a.R. Broacha Chartered accountants n.n. Kampani Dr. Stephan Bross Directors Pradip Shah hemant m. Joshi Dr. W. Schmitt (Partner) R. narasimhan W. Spiegel managing Director Company Secretary Pune, 11th February, 2014 mumbai, 11th February, 2014
Particulars Note No.
For the Year ended 31st December, 2013
` in Million
For the Year ended 31st December, 2012
` in Million
1. Revenue from operations (gross) 20 7,864.38 7,628.12 Less: excise duty 20 (537.03) (474.30)Revenue from operations (net) 7,327.35 7,153.82
2. other income 21 127.35 144.53 3. Total revenue (1+2) 7,454.70 7,298.35 4. expenses
Cost of materials consumed 22.a 3,325.93 3,415.15 Purchases of stock-in-trade 74.82 108.17 Changes in inventories of finished goods, work-in-progress and stock-in-trade
22.b 42.57 58.10
employee benefits expense 23 1,100.97 1,036.67 Finance costs 24 25.94 52.40 Depreciation and amortisation expense 11.A &
11.B 265.29 235.39
other expenses 25 1,774.04 1,615.83 expenditure transferred to capital account (10.60) (8.78)Total expenses 6,598.96 6,512.93
5. Profit before tax (3 - 4) 855.74 785.42 6. Tax expense:
(a) Current tax 284.05 271.30 (b) Short/ (excess) provision in respect of earlier years 3.63 (16.43)(c) Deferred tax (3.17) (22.25)
284.51 232.62 7. Profit for the year (5 - 6) 571.23 552.80 8. add: Share of profit for the year in respect of
investment in associate Company 96.41 82.99
667.64 635.79 9. earnings per equity share (Face Value per share ` 10/-):
(Refer note 35) (1) Basic 19.18 18.27 (2) Diluted 19.18 18.27 See accompanying notes forming part of the consolidated financial statements
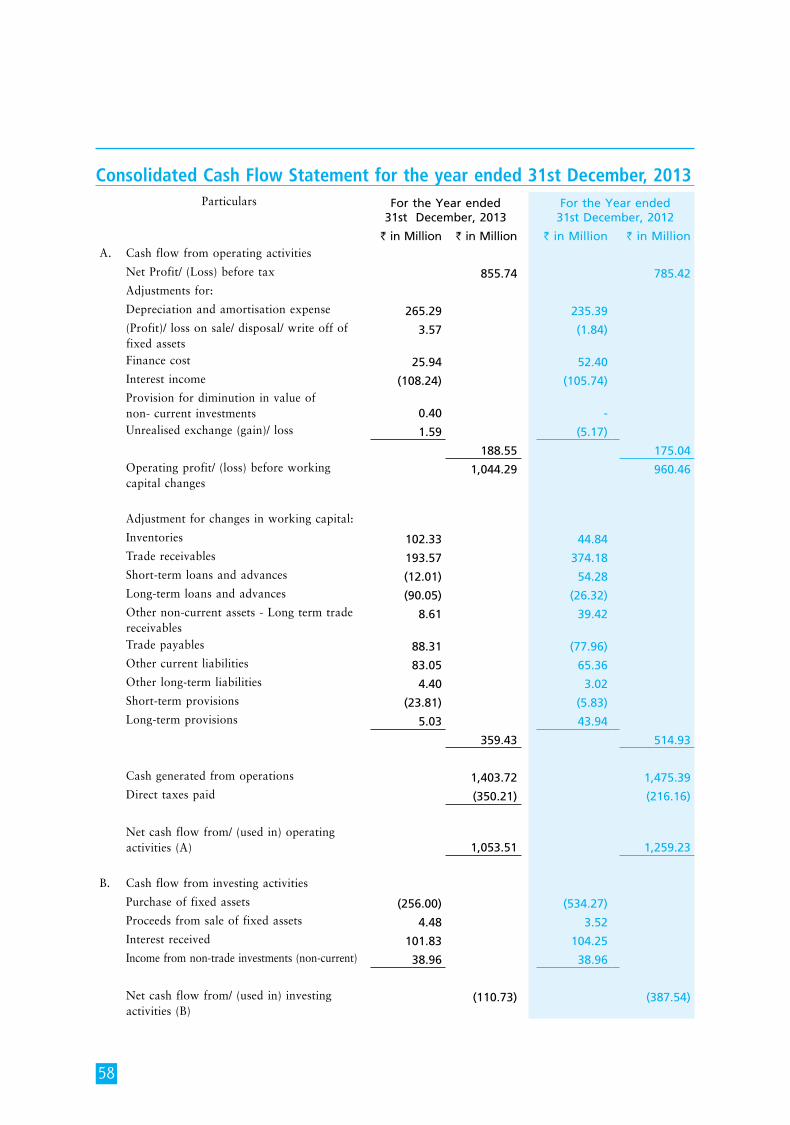
58
Consolidated Cash Flow Statement for the year ended 31st December, 2013Particulars For the Year ended
31st December, 2013For the Year ended
31st December, 2012
` in Million ` in Million ` in Million ` in Million a. Cash flow from operating activities
net Profit/ (Loss) before tax 855.74 785.42 adjustments for:
Depreciation and amortisation expense 265.29 235.39 (Profit)/ loss on sale/ disposal/ write off of
fixed assets3.57 (1.84)
Finance cost 25.94 52.40 interest income (108.24) (105.74) Provision for diminution in value of
non- current investments 0.40 - Unrealised exchange (gain)/ loss 1.59 (5.17)
188.55 175.04 operating profit/ (loss) before working
capital changes 1,044.29 960.46
adjustment for changes in working capital:
inventories 102.33 44.84 Trade receivables 193.57 374.18 Short-term loans and advances (12.01) 54.28 Long-term loans and advances (90.05) (26.32) other non-current assets - Long term trade
receivables8.61 39.42
Trade payables 88.31 (77.96) other current liabilities 83.05 65.36 other long-term liabilities 4.40 3.02 Short-term provisions (23.81) (5.83) Long-term provisions 5.03 43.94
359.43 514.93
Cash generated from operations 1,403.72 1,475.39 Direct taxes paid (350.21) (216.16)
net cash flow from/ (used in) operating activities (a) 1,053.51 1,259.23
B. Cash flow from investing activities
Purchase of fixed assets (256.00) (534.27) Proceeds from sale of fixed assets 4.48 3.52 interest received 101.83 104.25 income from non-trade investments (non-current) 38.96 38.96
net cash flow from/ (used in) investing activities (B)
(110.73) (387.54)
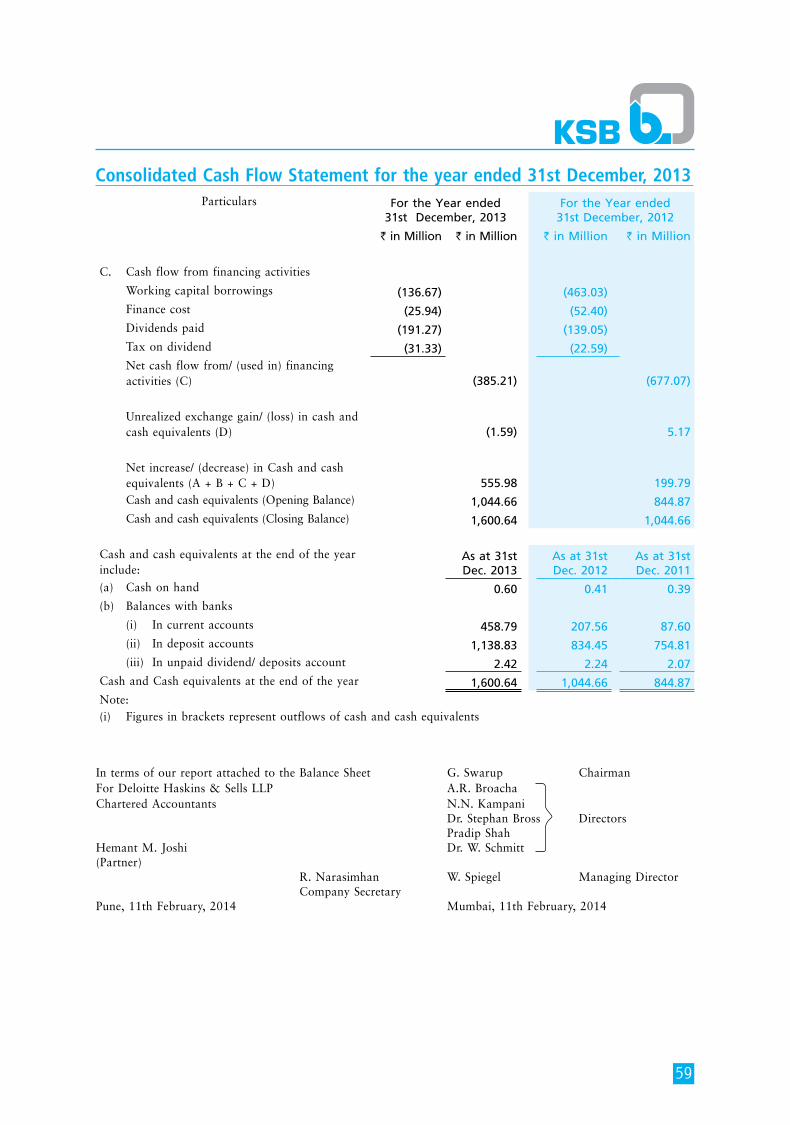
59
Consolidated Cash Flow Statement for the year ended 31st December, 2013Particulars For the Year ended
31st December, 2013For the Year ended
31st December, 2012
` in Million ` in Million ` in Million ` in Million
C. Cash flow from financing activities
Working capital borrowings (136.67) (463.03) Finance cost (25.94) (52.40) Dividends paid (191.27) (139.05) Tax on dividend (31.33) (22.59) net cash flow from/ (used in) financing
activities (C) (385.21) (677.07)
Unrealized exchange gain/ (loss) in cash and cash equivalents (D) (1.59) 5.17
net increase/ (decrease) in Cash and cash equivalents (a + B + C + D) 555.98 199.79
Cash and cash equivalents (opening Balance) 1,044.66 844.87 Cash and cash equivalents (Closing Balance) 1,600.64 1,044.66
Cash and cash equivalents at the end of the year include:
As at 31st Dec. 2013
As at 31st Dec. 2012
As at 31st Dec. 2011
(a) Cash on hand 0.60 0.41 0.39 (b) Balances with banks
(i) in current accounts 458.79 207.56 87.60 (ii) in deposit accounts 1,138.83 834.45 754.81 (iii) in unpaid dividend/ deposits account 2.42 2.24 2.07 Cash and Cash equivalents at the end of the year 1,600.64 1,044.66 844.87 note: (i) Figures in brackets represent outflows of cash and cash equivalents
in terms of our report attached to the Balance Sheet G. Swarup ChairmanFor Deloitte haskins & Sells LLP a.R. Broacha Chartered accountants n.n. Kampani Dr. Stephan Bross Directors Pradip Shah hemant m. Joshi Dr. W. Schmitt (Partner) R. narasimhan W. Spiegel managing Director Company Secretary Pune, 11th February, 2014 mumbai, 11th February, 2014

60
Notes forming part of the consolidated financial statementsnote Particulars1 Company overview
Products:The Company is engaged in the business of manufacture of different types of power driven pumps and industrial valves. Castings are mainly produced for captive consumption. operations:The Company has factories at the following places:-a) irrigation and Process Pumps Division (i.P.D.) at Pimpri manufacturing of submersible pumps, vertical and horizontal pumps, series and non-series pumps,
multistage pumps, chemical process pumps, non clog pumps and water pumps.B) Power Projects Division (P.P.D.) at Chinchwad manufacturing of primary heat transfer pumps, moderator pumps, main boiler feed pumps and
multistage condense extraction pumps, re-heater drain pumps and auxiliary boiler feed pumps. C) Foundry Division at Vambhori manufacturing of steel & iron castings including for captive consumption. D) Coimbatore Unit manufacturing of valves (Globe, Gate, Check, Butterfly & Ball valves).e) nashik Unit (Sinnar) established in 1995, this unit is engaged in the manufacture of high pressure and submersible pumps.
2 Significant accounting policies2.1 Fixed assets and depreciation/ amortisation:
(a) Fixed assets are stated at cost of acquisition or construction less depreciation/ amortisation. Cost comprises the purchase price and other attributable costs.
(b) Depreciation/amortization on fixed assets: i) Depreciation on tangible fixed assets is provided at the rates and in the manner laid down in
Schedule XiV to the Companies act, 1956 on the written down value (WDV) method in respect of buildings, furniture and fixtures and vehicles and on the straight line method (SLm) in respect of other assets. however, the rate of depreciation in respect of the following assets is higher :-
Jigs & fixtures - 33% (SLm) Furniture & fixtures - 37% (WDV) office equipments - 10% (SLm) electrical installations - 10% (SLm) Vehicles - 60% (WDV) Leasehold land and assets taken on lease are amortised over the period of the lease. ii) intangible assets are amortised on the straight line method at the following rates : Rights, techniques, Process and Know-how - 14.29%, 20% Software - 33%
2.2 investmentsLong-term investments are valued at cost of acquisition and related expenses. Provision is made for other than temporary diminution, if any, in the value of such investments.
2.3 inventoriesinventories are stated at the lower of cost and net realisable value. in determining the cost of raw materials, components, stores, spares and loose tools the weighted average method is used.Costs of work-in-progress and manufactured finished products include material costs, labour and factory overheads on the basis of full absorption costing.
2.4 Trade receivables and advancesSpecific debts and advances identified as irrecoverable or doubtful are written-off or provided for, respectively.
2.5 Foreign exchange transactionsTransactions in foreign currencies are recorded at the exchange rates prevailing on the date of the transaction. Realised gains and losses as also exchange differences arising on translation at year end exchange rates of current assets and current liabilities outstanding at the end of the year are recognised in the Statement of Profit and Loss. Premium/ Discount in respect of Forward Contracts is accounted for over the period of contract.
2.6 Revenue Recognition(i) Sale of goods is recognised when all significant risks and rewards of ownership have been transferred
to the buyers. (ii) Dividend income from investments is recognised when the owner’s right to receive the payment is
established. (iii) income from services rendered is accounted for when the work is performed.
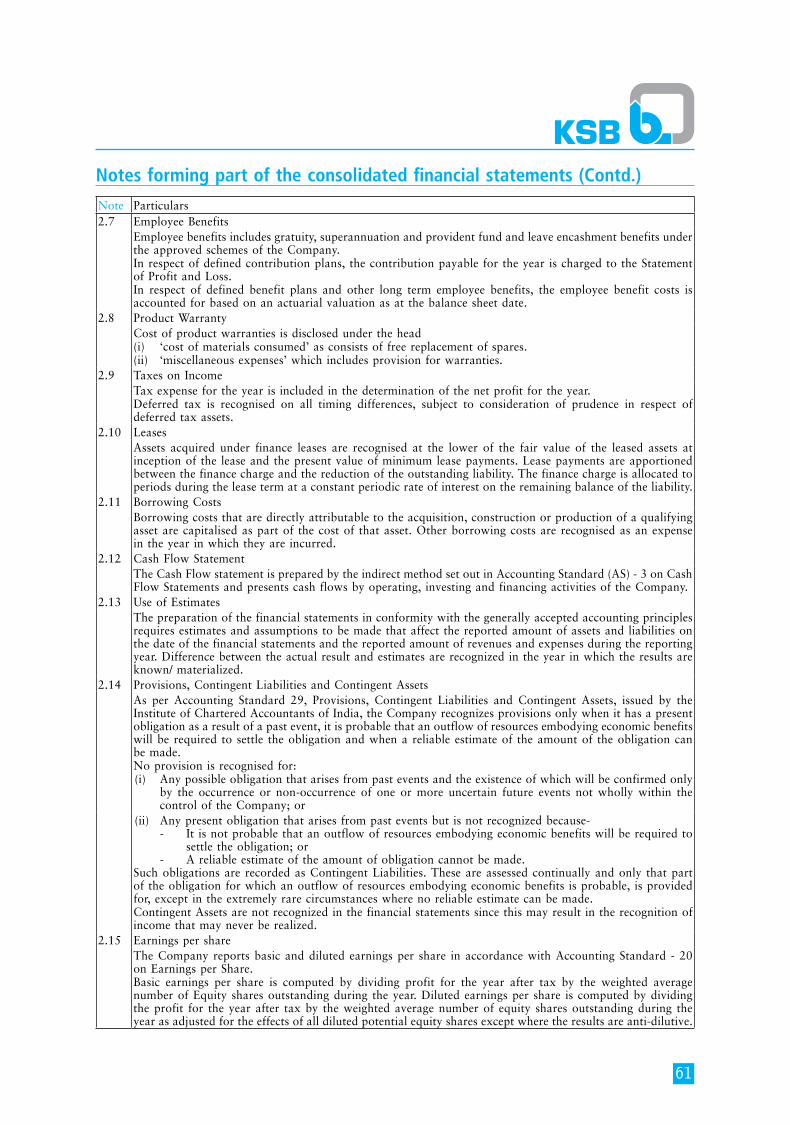
61
Notes forming part of the consolidated financial statements (Contd.)
note Particulars2.7 employee Benefits
employee benefits includes gratuity, superannuation and provident fund and leave encashment benefits under the approved schemes of the Company. in respect of defined contribution plans, the contribution payable for the year is charged to the Statement of Profit and Loss.in respect of defined benefit plans and other long term employee benefits, the employee benefit costs is accounted for based on an actuarial valuation as at the balance sheet date.
2.8 Product WarrantyCost of product warranties is disclosed under the head(i) ‘cost of materials consumed’ as consists of free replacement of spares.(ii) ‘miscellaneous expenses’ which includes provision for warranties.
2.9 Taxes on income Tax expense for the year is included in the determination of the net profit for the year.Deferred tax is recognised on all timing differences, subject to consideration of prudence in respect of deferred tax assets.
2.10 Leasesassets acquired under finance leases are recognised at the lower of the fair value of the leased assets at inception of the lease and the present value of minimum lease payments. Lease payments are apportioned between the finance charge and the reduction of the outstanding liability. The finance charge is allocated to periods during the lease term at a constant periodic rate of interest on the remaining balance of the liability.
2.11 Borrowing CostsBorrowing costs that are directly attributable to the acquisition, construction or production of a qualifying asset are capitalised as part of the cost of that asset. other borrowing costs are recognised as an expense in the year in which they are incurred.
2.12 Cash Flow StatementThe Cash Flow statement is prepared by the indirect method set out in accounting Standard (aS) - 3 on Cash Flow Statements and presents cash flows by operating, investing and financing activities of the Company.
2.13 Use of estimatesThe preparation of the financial statements in conformity with the generally accepted accounting principles requires estimates and assumptions to be made that affect the reported amount of assets and liabilities on the date of the financial statements and the reported amount of revenues and expenses during the reporting year. Difference between the actual result and estimates are recognized in the year in which the results are known/ materialized.
2.14 Provisions, Contingent Liabilities and Contingent assetsas per accounting Standard 29, Provisions, Contingent Liabilities and Contingent assets, issued by the institute of Chartered accountants of india, the Company recognizes provisions only when it has a present obligation as a result of a past event, it is probable that an outflow of resources embodying economic benefits will be required to settle the obligation and when a reliable estimate of the amount of the obligation can be made. no provision is recognised for: (i) any possible obligation that arises from past events and the existence of which will be confirmed only
by the occurrence or non-occurrence of one or more uncertain future events not wholly within the control of the Company; or
(ii) any present obligation that arises from past events but is not recognized because- - it is not probable that an outflow of resources embodying economic benefits will be required to
settle the obligation; or - a reliable estimate of the amount of obligation cannot be made. Such obligations are recorded as Contingent Liabilities. These are assessed continually and only that part of the obligation for which an outflow of resources embodying economic benefits is probable, is provided for, except in the extremely rare circumstances where no reliable estimate can be made.Contingent assets are not recognized in the financial statements since this may result in the recognition of income that may never be realized.
2.15 earnings per shareThe Company reports basic and diluted earnings per share in accordance with accounting Standard - 20 on earnings per Share.Basic earnings per share is computed by dividing profit for the year after tax by the weighted average number of equity shares outstanding during the year. Diluted earnings per share is computed by dividing the profit for the year after tax by the weighted average number of equity shares outstanding during the year as adjusted for the effects of all diluted potential equity shares except where the results are anti-dilutive.
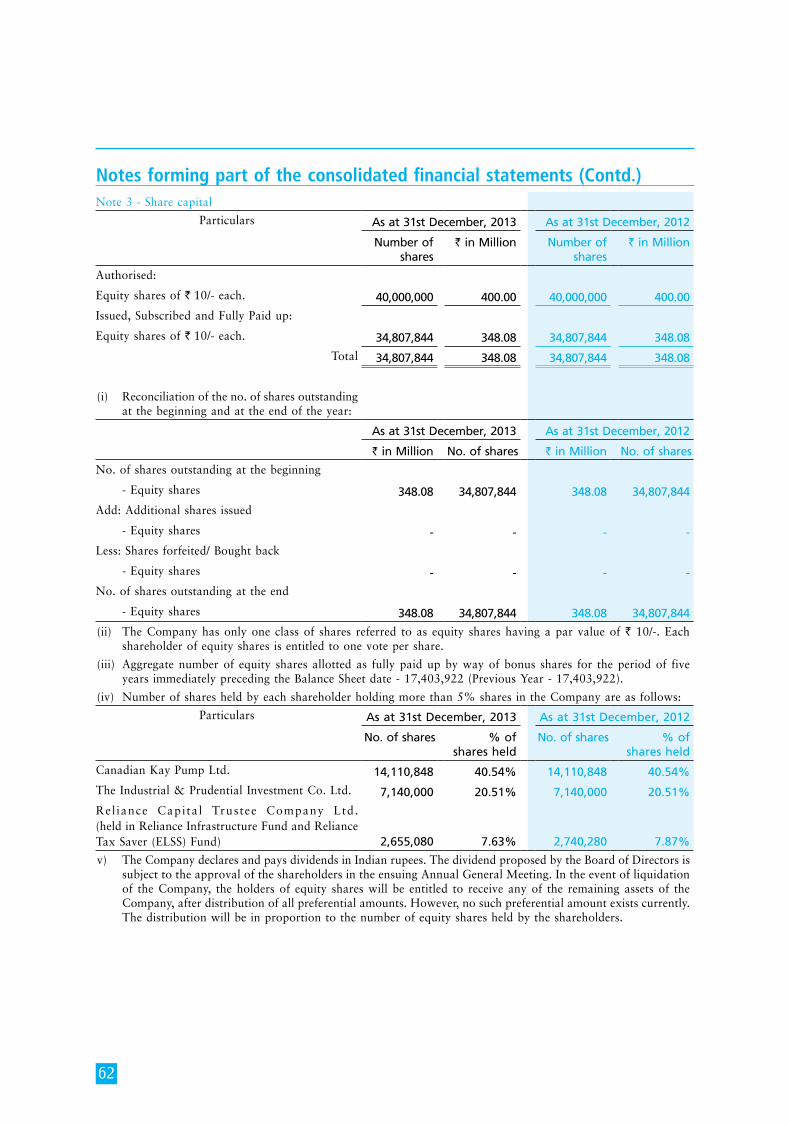
62
Notes forming part of the consolidated financial statements (Contd.)note 3 - Share capital
Particulars As at 31st December, 2013 As at 31st December, 2012
Number of shares
` in Million Number of shares
` in Million
authorised:
equity shares of ` 10/- each. 40,000,000 400.00 40,000,000 400.00
issued, Subscribed and Fully Paid up:
equity shares of ` 10/- each. 34,807,844 348.08 34,807,844 348.08
Total 34,807,844 348.08 34,807,844 348.08
(i) Reconciliation of the no. of shares outstanding at the beginning and at the end of the year:
As at 31st December, 2013 As at 31st December, 2012
` in Million No. of shares ` in Million No. of shares
no. of shares outstanding at the beginning
- equity shares 348.08 34,807,844 348.08 34,807,844
add: additional shares issued
- equity shares - - - -
Less: Shares forfeited/ Bought back
- equity shares - - - -
no. of shares outstanding at the end
- equity shares 348.08 34,807,844 348.08 34,807,844
(ii) The Company has only one class of shares referred to as equity shares having a par value of ` 10/-. each shareholder of equity shares is entitled to one vote per share.
(iii) aggregate number of equity shares allotted as fully paid up by way of bonus shares for the period of five years immediately preceding the Balance Sheet date - 17,403,922 (Previous year - 17,403,922).
(iv) number of shares held by each shareholder holding more than 5% shares in the Company are as follows:
Particulars As at 31st December, 2013 As at 31st December, 2012
No. of shares % of shares held
No. of shares % of shares held
Canadian Kay Pump Ltd. 14,110,848 40.54% 14,110,848 40.54%
The industrial & Prudential investment Co. Ltd. 7,140,000 20.51% 7,140,000 20.51%
Reliance Capital Trustee Company Ltd. (held in Reliance infrastructure Fund and Reliance Tax Saver (eLSS) Fund) 2,655,080 7.63% 2,740,280 7.87%
v) The Company declares and pays dividends in indian rupees. The dividend proposed by the Board of Directors is subject to the approval of the shareholders in the ensuing annual General meeting. in the event of liquidation of the Company, the holders of equity shares will be entitled to receive any of the remaining assets of the Company, after distribution of all preferential amounts. however, no such preferential amount exists currently. The distribution will be in proportion to the number of equity shares held by the shareholders.
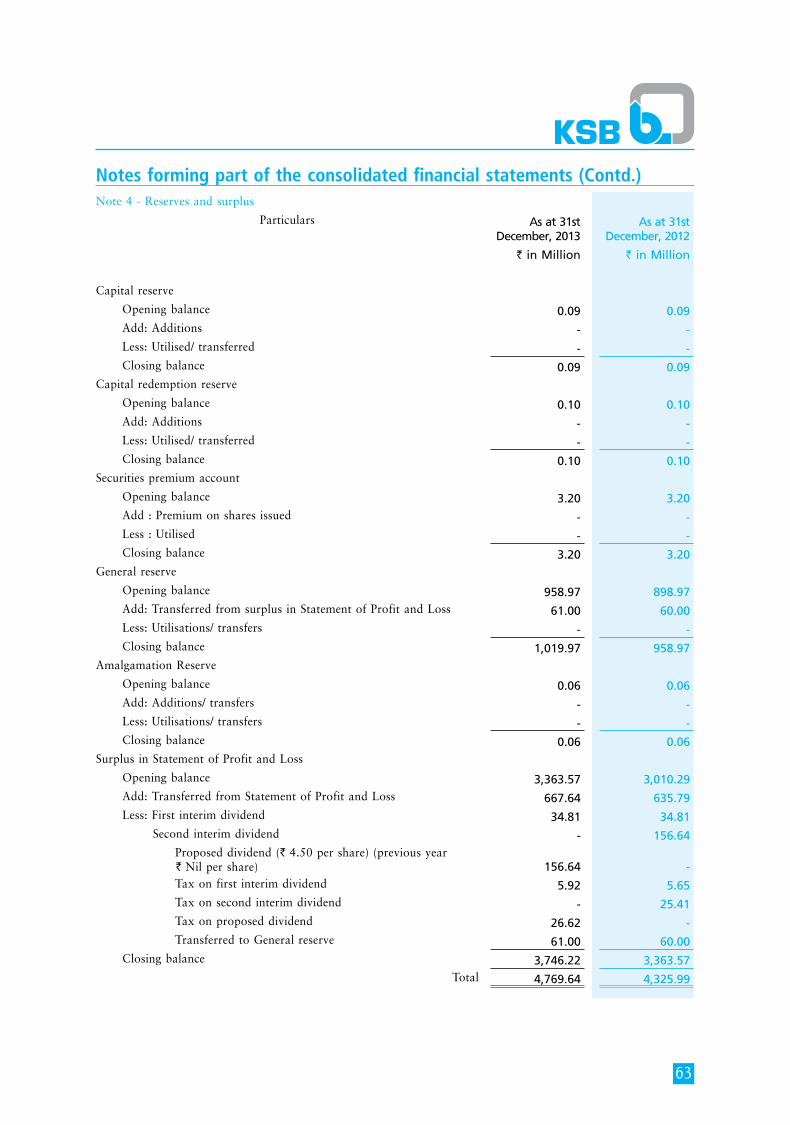
63
Notes forming part of the consolidated financial statements (Contd.)note 4 - Reserves and surplus
Particulars As at 31st December, 2013
As at 31st December, 2012
` in Million ` in Million
Capital reserve
opening balance 0.09 0.09 add: additions - - Less: Utilised/ transferred - - Closing balance 0.09 0.09 Capital redemption reserve
opening balance 0.10 0.10 add: additions - - Less: Utilised/ transferred - - Closing balance 0.10 0.10 Securities premium account
opening balance 3.20 3.20 add : Premium on shares issued - - Less : Utilised - - Closing balance 3.20 3.20 General reserve
opening balance 958.97 898.97 add: Transferred from surplus in Statement of Profit and Loss 61.00 60.00 Less: Utilisations/ transfers - - Closing balance 1,019.97 958.97 amalgamation Reserve
opening balance 0.06 0.06 add: additions/ transfers - - Less: Utilisations/ transfers - - Closing balance 0.06 0.06 Surplus in Statement of Profit and Loss
opening balance 3,363.57 3,010.29 add: Transferred from Statement of Profit and Loss 667.64 635.79 Less: First interim dividend 34.81 34.81 Second interim dividend - 156.64 Proposed dividend (` 4.50 per share) (previous year
` nil per share) 156.64 - Tax on first interim dividend 5.92 5.65 Tax on second interim dividend - 25.41 Tax on proposed dividend 26.62 - Transferred to General reserve 61.00 60.00 Closing balance 3,746.22 3,363.57
Total 4,769.64 4,325.99
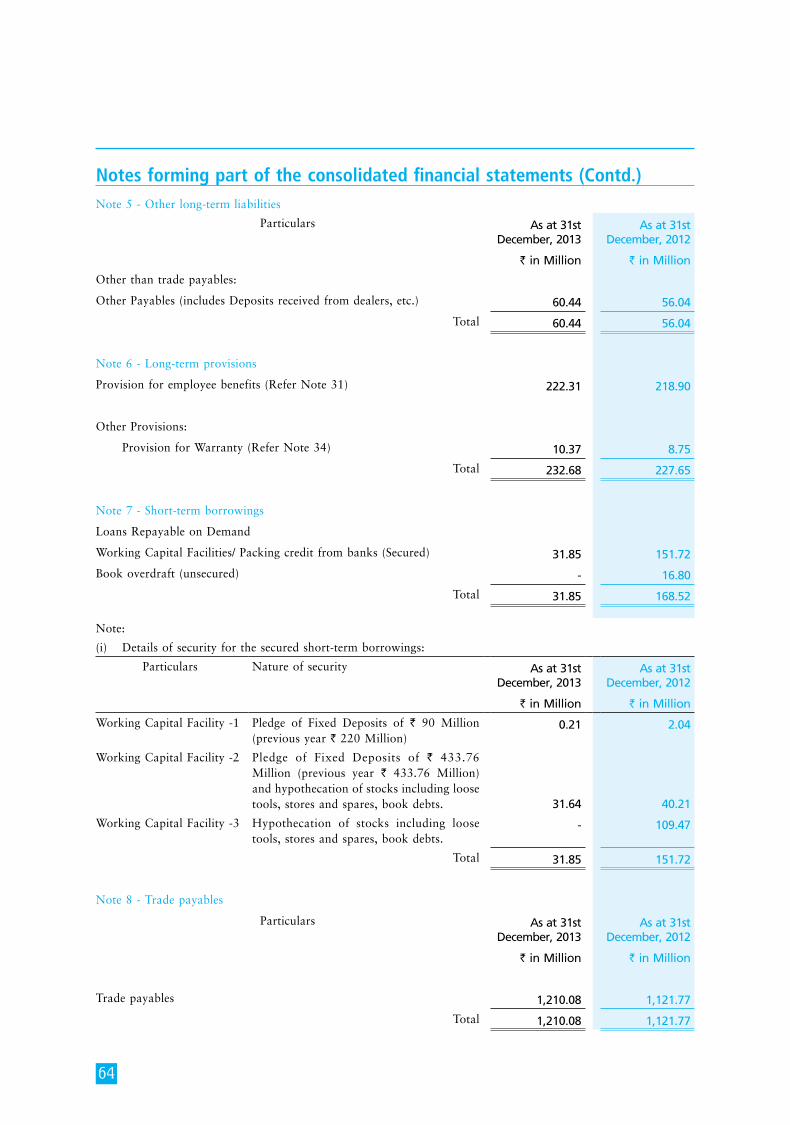
64
Notes forming part of the consolidated financial statements (Contd.)note 5 - other long-term liabilities
Particulars As at 31st December, 2013
As at 31st December, 2012
` in Million ` in Million
other than trade payables:
other Payables (includes Deposits received from dealers, etc.) 60.44 56.04
Total 60.44 56.04
note 6 - Long-term provisions
Provision for employee benefits (Refer note 31) 222.31 218.90
other Provisions:
Provision for Warranty (Refer note 34) 10.37 8.75
Total 232.68 227.65
note 7 - Short-term borrowings
Loans Repayable on Demand
Working Capital Facilities/ Packing credit from banks (Secured) 31.85 151.72
Book overdraft (unsecured) - 16.80
Total 31.85 168.52
note:
(i) Details of security for the secured short-term borrowings:
Particulars nature of security As at 31st December, 2013
As at 31st December, 2012
` in Million ` in Million
Working Capital Facility -1 Pledge of Fixed Deposits of ` 90 million (previous year ` 220 million)
0.21 2.04
Working Capital Facility -2 Pledge of Fixed Deposits of ` 433.76 million (previous year ` 433.76 million) and hypothecation of stocks including loose tools, stores and spares, book debts. 31.64 40.21
Working Capital Facility -3 hypothecation of stocks including loose tools, stores and spares, book debts.
- 109.47
Total 31.85 151.72
note 8 - Trade payables
Particulars As at 31st December, 2013
As at 31st December, 2012
` in Million ` in Million
Trade payables 1,210.08 1,121.77
Total 1,210.08 1,121.77
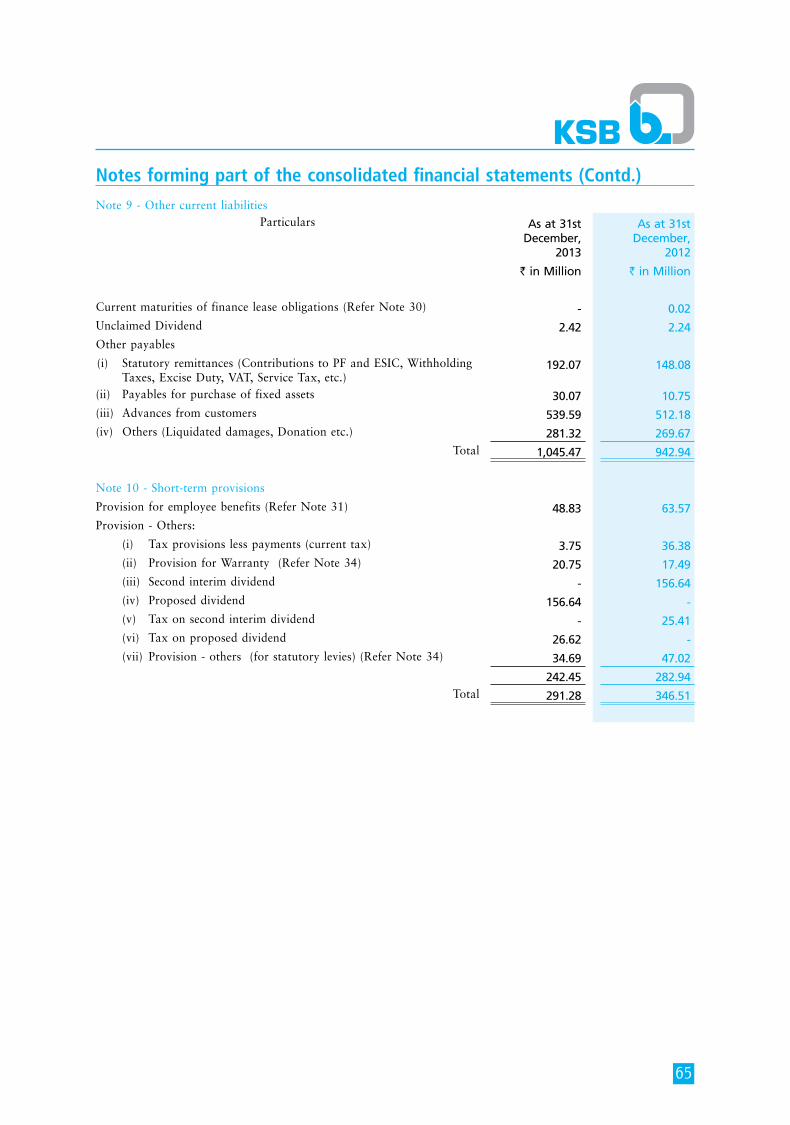
65
Notes forming part of the consolidated financial statements (Contd.)
note 9 - other current liabilities Particulars As at 31st
December, 2013
As at 31st December,
2012
` in Million ` in Million
Current maturities of finance lease obligations (Refer note 30) - 0.02 Unclaimed Dividend 2.42 2.24 other payables
(i) Statutory remittances (Contributions to PF and eSiC, Withholding Taxes, excise Duty, VaT, Service Tax, etc.)
192.07 148.08
(ii) Payables for purchase of fixed assets 30.07 10.75 (iii) advances from customers 539.59 512.18 (iv) others (Liquidated damages, Donation etc.) 281.32 269.67
Total 1,045.47 942.94
note 10 - Short-term provisions
Provision for employee benefits (Refer note 31) 48.83 63.57 Provision - others:
(i) Tax provisions less payments (current tax) 3.75 36.38 (ii) Provision for Warranty (Refer note 34) 20.75 17.49 (iii) Second interim dividend - 156.64 (iv) Proposed dividend 156.64 - (v) Tax on second interim dividend - 25.41 (vi) Tax on proposed dividend 26.62 - (vii) Provision - others (for statutory levies) (Refer note 34) 34.69 47.02
242.45 282.94 Total 291.28 346.51
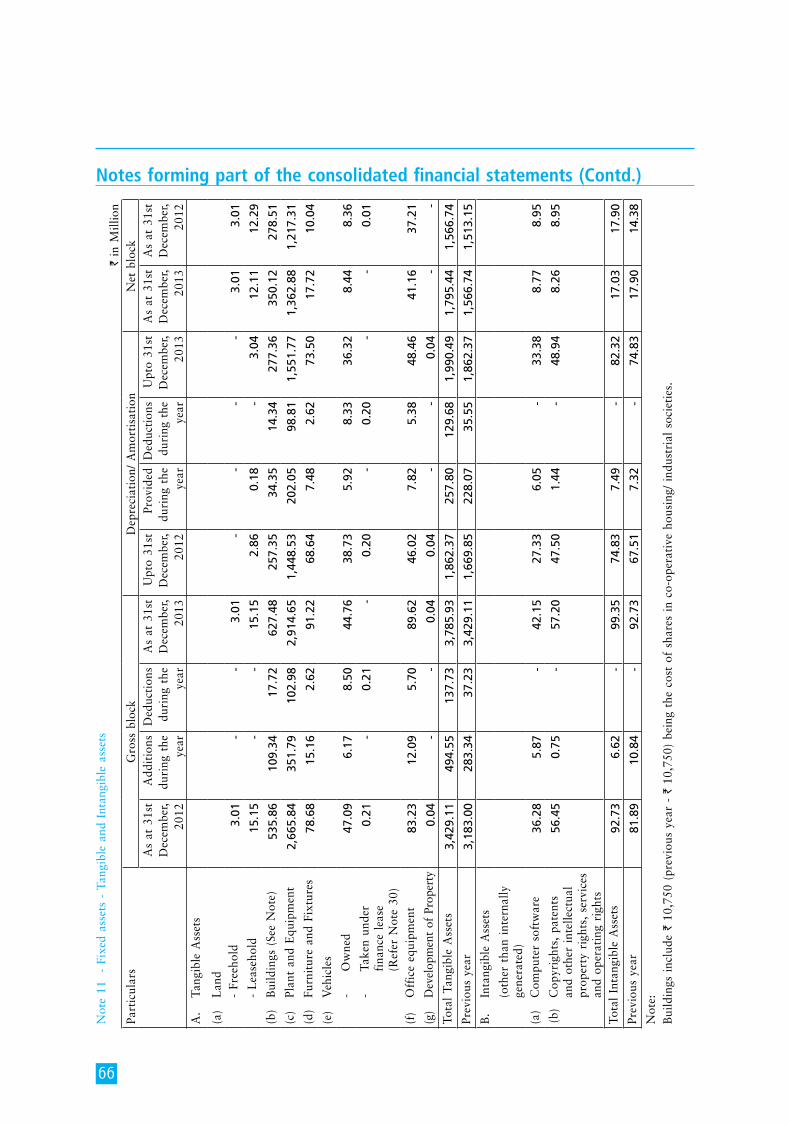
66
Notes forming part of the consolidated financial statements (Contd.)
not
e 11
-
Fixe
d as
sets
- T
angi
ble
and
inta
ngib
le a
sset
s `
in
mill
ion
Part
icul
ars
Gro
ss b
lock
Dep
reci
atio
n/ a
mor
tisa
tion
net
blo
cka
s at
31s
t D
ecem
ber,
2012
add
itio
ns
duri
ng t
he
year
Ded
ucti
ons
duri
ng t
he
year
as
at 3
1st
Dec
embe
r, 20
13
Upt
o 31
st
Dec
embe
r, 20
12
Prov
ided
du
ring
the
ye
ar
Ded
ucti
ons
duri
ng t
he
year
Upt
o 31
st
Dec
embe
r, 20
13
as
at 3
1st
Dec
embe
r, 20
13
as
at 3
1st
Dec
embe
r, 20
12a
. Ta
ngib
le a
sset
s
(a)
L
and
-
Free
hold
3.0
1 -
-
3
.01
-
-
-
-
3.0
1 3
.01
-
Lea
seho
ld 1
5.15
-
-
1
5.15
2
.86
0.1
8 -
3
.04
12.
11
12.
29
(b)
B
uild
ings
(Se
e n
ote)
535
.86
109
.34
17.
72
627
.48
257
.35
34.
35
14.
34
277
.36
350
.12
278
.51
(c)
Pl
ant
and
equ
ipm
ent
2,6
65.8
4 3
51.7
9 1
02.9
8 2
,914
.65
1,4
48.5
3 2
02.0
5 9
8.81
1
,551
.77
1,3
62.8
8 1
,217
.31
(d)
Fu
rnit
ure
and
Fixt
ures
78.
68
15.
16
2.6
2 9
1.22
6
8.64
7
.48
2.6
2 7
3.50
1
7.72
1
0.04
(e
) V
ehic
les
-
o
wne
d 4
7.09
6
.17
8.5
0 4
4.76
3
8.73
5
.92
8.3
3 3
6.32
8
.44
8.3
6
- Ta
ken
unde
r fi
nanc
e le
ase
(Ref
er n
ote
30)
0.2
1 -
0
.21
-
0.2
0 -
0
.20
-
-
0.0
1
(f)
o
ffic
e eq
uipm
ent
83.
23
12.
09
5.7
0 8
9.62
4
6.02
7
.82
5.3
8 4
8.46
4
1.16
3
7.21
(g
)
Dev
elop
men
t of
Pro
pert
y 0
.04
-
-
0.0
4 0
.04
-
-
0.0
4 -
-
To
tal
Tang
ible
ass
ets
3,4
29.1
1 4
94.5
5 1
37.7
3 3
,785
.93
1,8
62.3
7 2
57.8
0 1
29.6
8 1
,990
.49
1,7
95.4
4 1
,566
.74
Prev
ious
yea
r 3
,183
.00
283
.34
37.
23
3,4
29.1
1 1
,669
.85
228
.07
35.
55
1,8
62.3
7 1
,566
.74
1,51
3.15
B.
in
tang
ible
ass
ets
(o
ther
tha
n in
tern
ally
ge
nera
ted)
(a)
C
ompu
ter
soft
war
e 3
6.28
5
.87
-
42.
15
27.
33
6.0
5 -
3
3.38
8
.77
8.9
5 (b
) C
opyr
ight
s, p
aten
ts
and
othe
r in
telle
ctua
l pr
oper
ty r
ight
s, s
ervi
ces
and
oper
atin
g ri
ghts
56.
45
0.7
5 -
5
7.20
4
7.50
1
.44
-
48.
94
8.2
6 8
.95
Tota
l in
tang
ible
ass
ets
92.
73
6.6
2 -
9
9.35
7
4.83
7
.49
-
82.
32
17.
03
17.
90
Prev
ious
yea
r 8
1.89
1
0.84
-
9
2.73
6
7.51
7
.32
-
74.
83
17.
90
14.
38
not
e:B
uild
ings
inc
lude
` 1
0,75
0 (p
revi
ous
year
- `
10,
750)
bei
ng t
he c
ost
of s
hare
s in
co-
oper
ativ
e ho
usin
g/ i
ndus
tria
l so
ciet
ies.
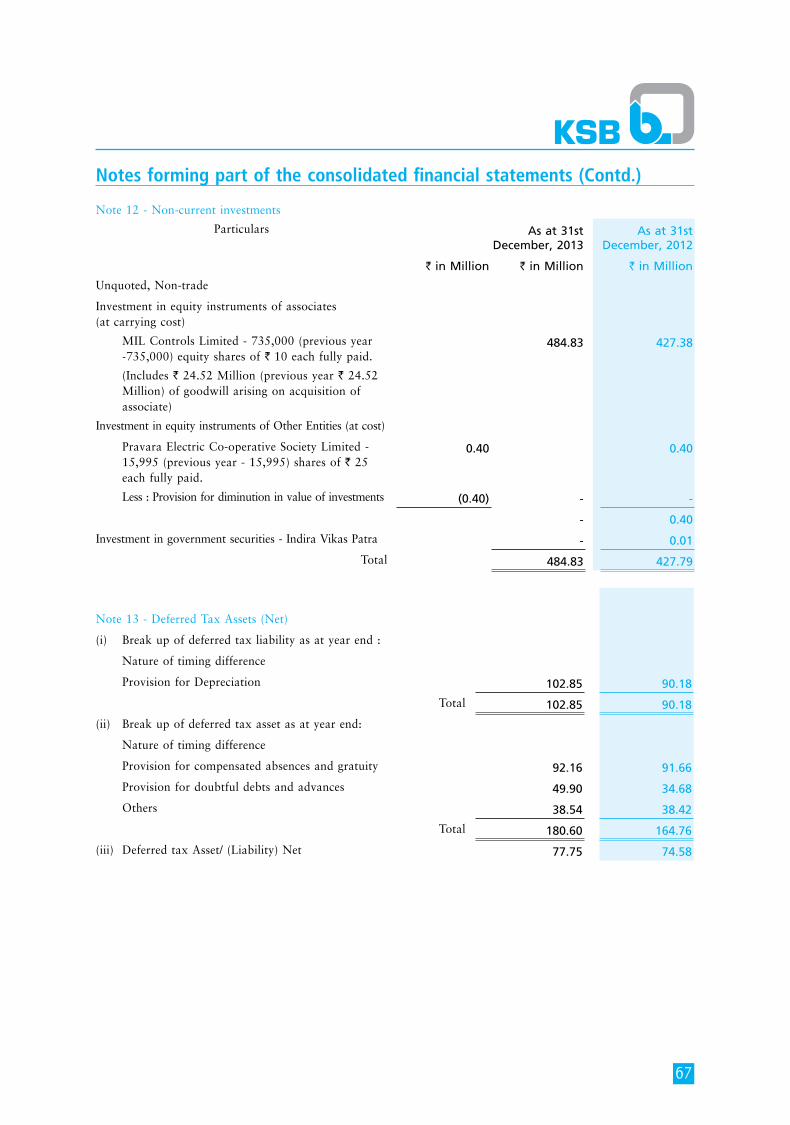
67
Notes forming part of the consolidated financial statements (Contd.)
note 13 - Deferred Tax assets (net)
(i) Break up of deferred tax liability as at year end :
nature of timing difference
Provision for Depreciation 102.85 90.18
Total 102.85 90.18
(ii) Break up of deferred tax asset as at year end:
nature of timing difference
Provision for compensated absences and gratuity 92.16 91.66
Provision for doubtful debts and advances 49.90 34.68
others 38.54 38.42
Total 180.60 164.76
(iii) Deferred tax asset/ (Liability) net 77.75 74.58
note 12 - non-current investments
Particulars As at 31st December, 2013
As at 31st December, 2012
` in Million ` in Million ` in Million
Unquoted, non-trade
investment in equity instruments of associates (at carrying cost)
miL Controls Limited - 735,000 (previous year -735,000) equity shares of ` 10 each fully paid.
484.83 427.38
(includes ` 24.52 million (previous year ` 24.52 million) of goodwill arising on acquisition of associate)
investment in equity instruments of other entities (at cost)
Pravara electric Co-operative Society Limited - 15,995 (previous year - 15,995) shares of ` 25 each fully paid.
0.40 0.40
Less : Provision for diminution in value of investments (0.40) - -
- 0.40
investment in government securities - indira Vikas Patra - 0.01
Total 484.83 427.79
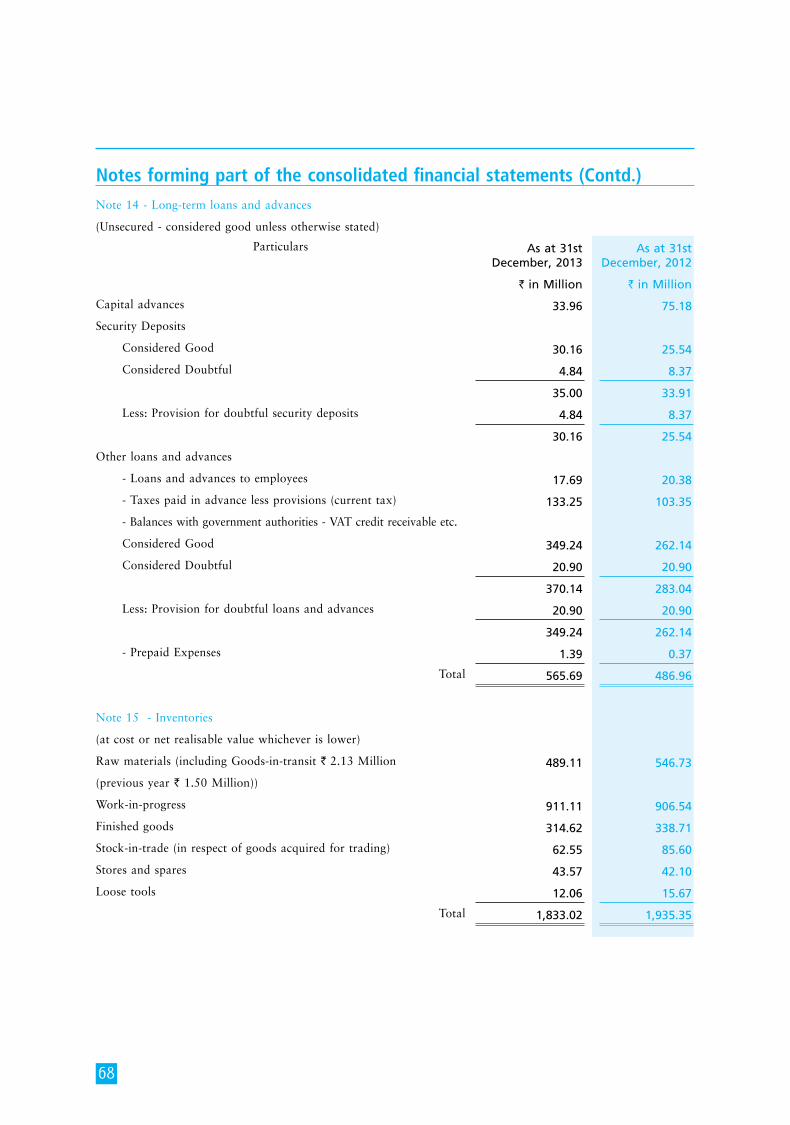
68
Notes forming part of the consolidated financial statements (Contd.)note 14 - Long-term loans and advances
(Unsecured - considered good unless otherwise stated)
Particulars As at 31st December, 2013
As at 31st December, 2012
` in Million ` in Million
Capital advances 33.96 75.18
Security Deposits
Considered Good 30.16 25.54
Considered Doubtful 4.84 8.37
35.00 33.91
Less: Provision for doubtful security deposits 4.84 8.37
30.16 25.54
other loans and advances
- Loans and advances to employees 17.69 20.38
- Taxes paid in advance less provisions (current tax) 133.25 103.35
- Balances with government authorities - VaT credit receivable etc.
Considered Good 349.24 262.14
Considered Doubtful 20.90 20.90
370.14 283.04
Less: Provision for doubtful loans and advances 20.90 20.90
349.24 262.14
- Prepaid expenses 1.39 0.37
Total 565.69 486.96
note 15 - inventories
(at cost or net realisable value whichever is lower)
Raw materials (including Goods-in-transit ` 2.13 million 489.11 546.73
(previous year ` 1.50 million))
Work-in-progress 911.11 906.54
Finished goods 314.62 338.71
Stock-in-trade (in respect of goods acquired for trading) 62.55 85.60
Stores and spares 43.57 42.10
Loose tools 12.06 15.67
Total 1,833.02 1,935.35
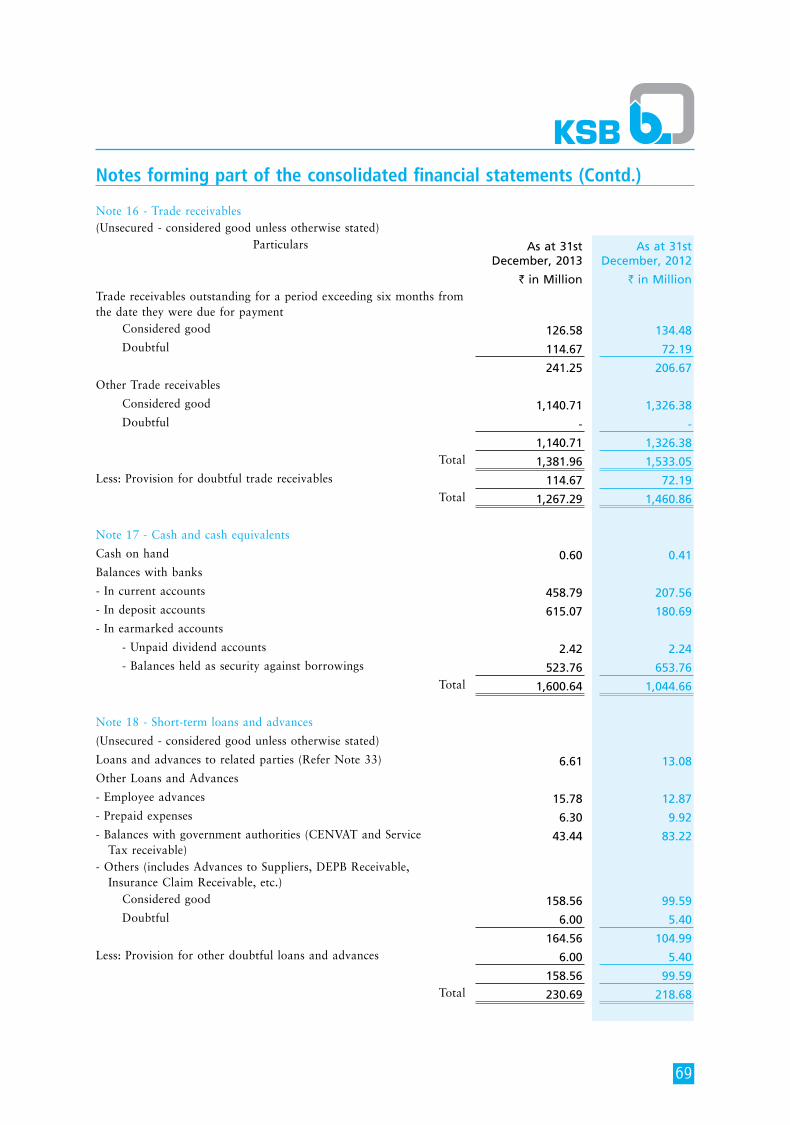
69
Notes forming part of the consolidated financial statements (Contd.)
note 16 - Trade receivables (Unsecured - considered good unless otherwise stated)
Particulars As at 31st December, 2013
As at 31st December, 2012
` in Million ` in Million Trade receivables outstanding for a period exceeding six months from the date they were due for payment Considered good 126.58 134.48 Doubtful 114.67 72.19
241.25 206.67 other Trade receivables
Considered good 1,140.71 1,326.38 Doubtful - -
1,140.71 1,326.38 Total 1,381.96 1,533.05
Less: Provision for doubtful trade receivables 114.67 72.19 Total 1,267.29 1,460.86
note 17 - Cash and cash equivalents
Cash on hand 0.60 0.41Balances with banks
- in current accounts 458.79 207.56- in deposit accounts 615.07 180.69- in earmarked accounts
- Unpaid dividend accounts 2.42 2.24 - Balances held as security against borrowings 523.76 653.76
Total 1,600.64 1,044.66
note 18 - Short-term loans and advances
(Unsecured - considered good unless otherwise stated)
Loans and advances to related parties (Refer note 33) 6.61 13.08 other Loans and advances
- employee advances 15.78 12.87 - Prepaid expenses 6.30 9.92 - Balances with government authorities (CenVaT and Service Tax receivable)
43.44 83.22
- others (includes advances to Suppliers, DePB Receivable, insurance Claim Receivable, etc.) Considered good 158.56 99.59 Doubtful 6.00 5.40
164.56 104.99 Less: Provision for other doubtful loans and advances 6.00 5.40
158.56 99.59 Total 230.69 218.68
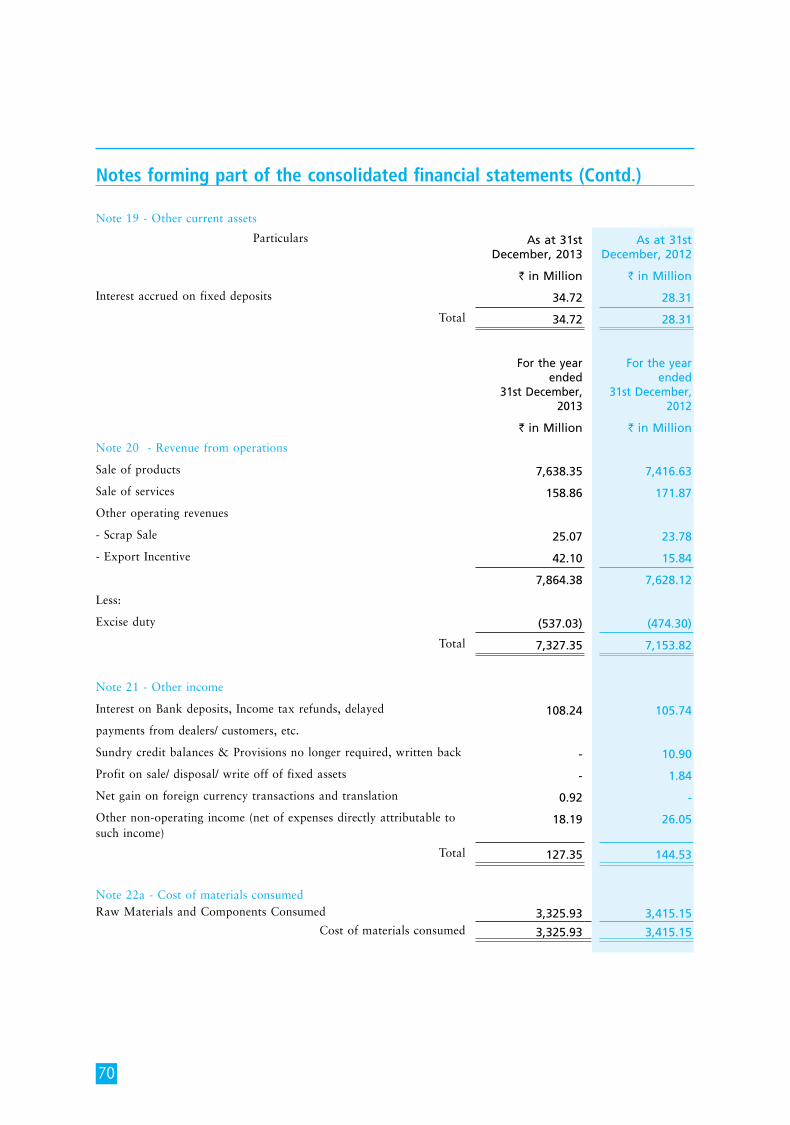
70
Notes forming part of the consolidated financial statements (Contd.)
note 19 - other current assets
Particulars As at 31st December, 2013
As at 31st December, 2012
` in Million ` in Million
interest accrued on fixed deposits 34.72 28.31
Total 34.72 28.31
For the yearended
31st December, 2013
For the year ended
31st December, 2012
` in Million ` in Million
note 20 - Revenue from operations
Sale of products 7,638.35 7,416.63
Sale of services 158.86 171.87
other operating revenues
- Scrap Sale 25.07 23.78
- export incentive 42.10 15.84
7,864.38 7,628.12
Less:
excise duty (537.03) (474.30)
Total 7,327.35 7,153.82
note 21 - other income
interest on Bank deposits, income tax refunds, delayed 108.24 105.74
payments from dealers/ customers, etc.
Sundry credit balances & Provisions no longer required, written back - 10.90
Profit on sale/ disposal/ write off of fixed assets - 1.84
net gain on foreign currency transactions and translation 0.92 -
other non-operating income (net of expenses directly attributable to such income)
18.19 26.05
Total 127.35 144.53
note 22a - Cost of materials consumed Raw materials and Components Consumed 3,325.93 3,415.15
Cost of materials consumed 3,325.93 3,415.15
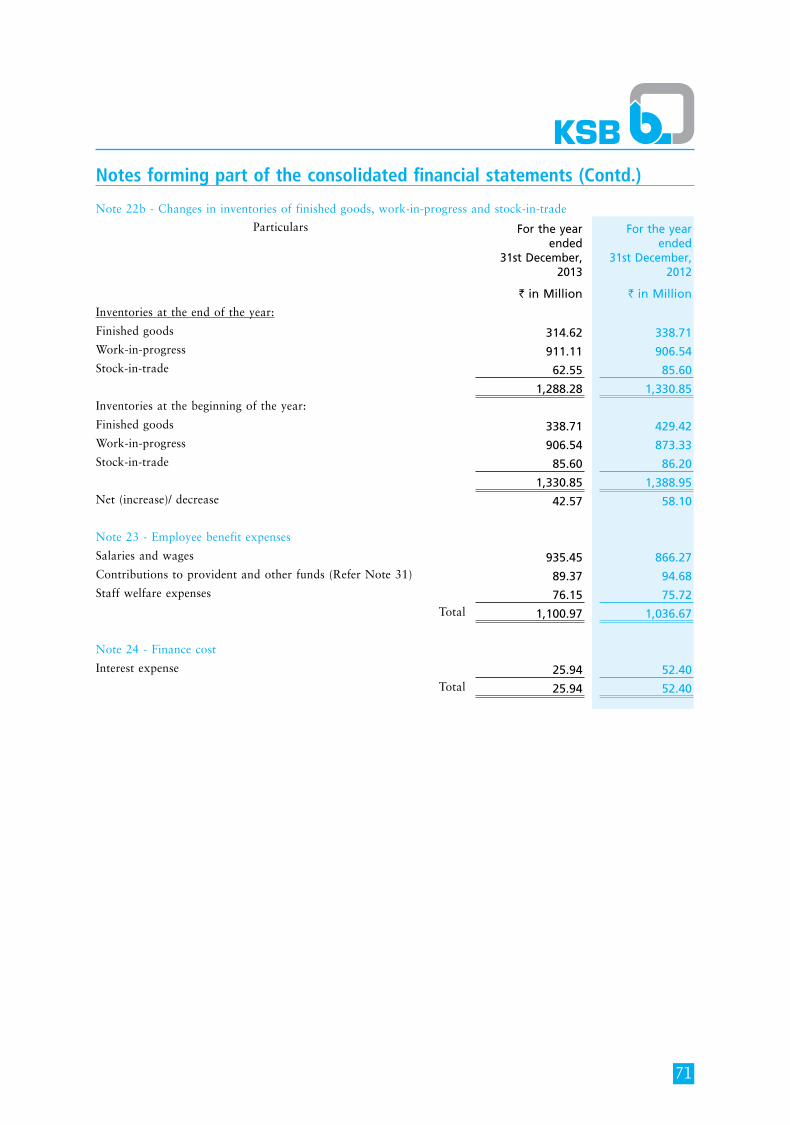
71
Notes forming part of the consolidated financial statements (Contd.)
note 22b - Changes in inventories of finished goods, work-in-progress and stock-in-trade
Particulars For the yearended
31st December, 2013
For the year ended
31st December, 2012
` in Million ` in Million
inventories at the end of the year:
Finished goods 314.62 338.71 Work-in-progress 911.11 906.54 Stock-in-trade 62.55 85.60
1,288.28 1,330.85 inventories at the beginning of the year:
Finished goods 338.71 429.42 Work-in-progress 906.54 873.33 Stock-in-trade 85.60 86.20
1,330.85 1,388.95 net (increase)/ decrease 42.57 58.10
note 23 - employee benefit expenses
Salaries and wages 935.45 866.27 Contributions to provident and other funds (Refer note 31) 89.37 94.68 Staff welfare expenses 76.15 75.72
Total 1,100.97 1,036.67
note 24 - Finance cost
interest expense 25.94 52.40 Total 25.94 52.40
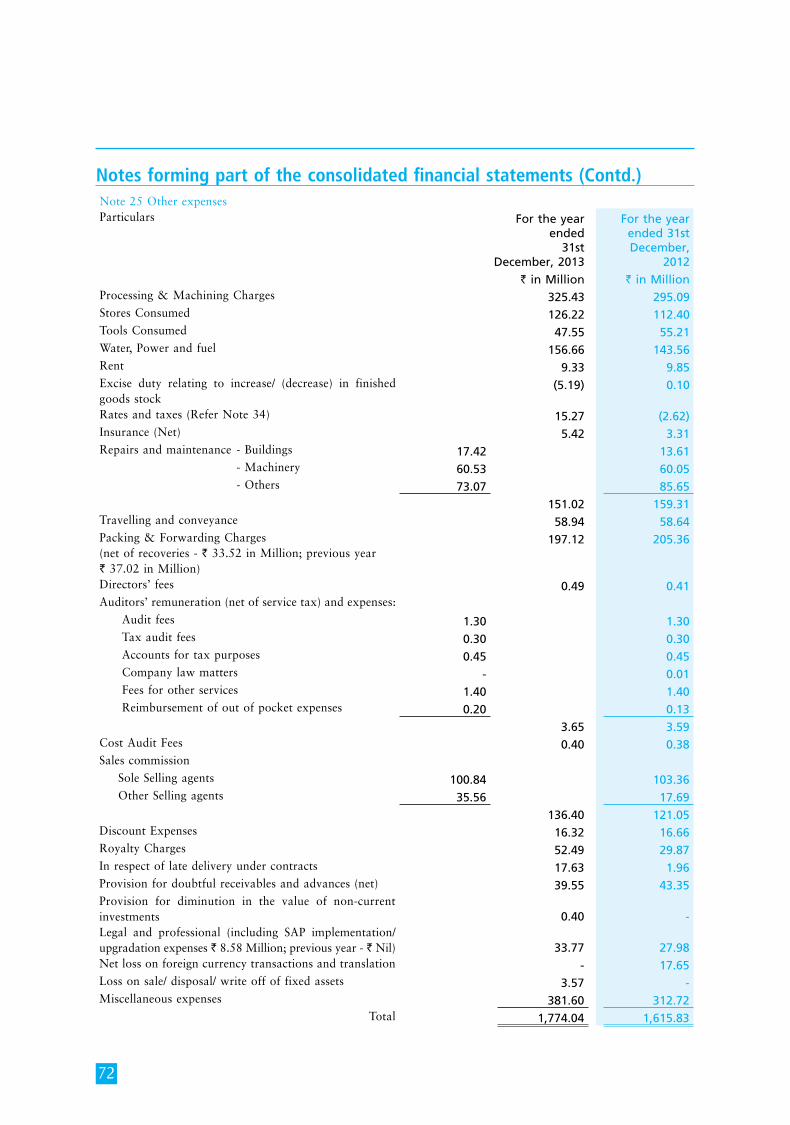
72
Notes forming part of the consolidated financial statements (Contd.)note 25 other expensesParticulars For the year
ended 31st
December, 2013
For the year ended 31st December,
2012
` in Million ` in Million Processing & machining Charges 325.43 295.09 Stores Consumed 126.22 112.40 Tools Consumed 47.55 55.21 Water, Power and fuel 156.66 143.56 Rent 9.33 9.85 excise duty relating to increase/ (decrease) in finished goods stock
(5.19) 0.10
Rates and taxes (Refer note 34) 15.27 (2.62)insurance (net) 5.42 3.31 Repairs and maintenance - Buildings 17.42 13.61 - machinery 60.53 60.05 - others 73.07 85.65
151.02 159.31 Travelling and conveyance 58.94 58.64 Packing & Forwarding Charges (net of recoveries - ` 33.52 in million; previous year ` 37.02 in million)
197.12 205.36
Directors’ fees 0.49 0.41 auditors’ remuneration (net of service tax) and expenses:
audit fees 1.30 1.30 Tax audit fees 0.30 0.30 accounts for tax purposes 0.45 0.45 Company law matters - 0.01 Fees for other services 1.40 1.40 Reimbursement of out of pocket expenses 0.20 0.13
3.65 3.59 Cost audit Fees 0.40 0.38 Sales commission
Sole Selling agents 100.84 103.36 other Selling agents 35.56 17.69
136.40 121.05 Discount expenses 16.32 16.66 Royalty Charges 52.49 29.87 in respect of late delivery under contracts 17.63 1.96 Provision for doubtful receivables and advances (net) 39.55 43.35 Provision for diminution in the value of non-current investments 0.40 - Legal and professional (including SaP implementation/ upgradation expenses ` 8.58 million; previous year - ` nil) 33.77 27.98 net loss on foreign currency transactions and translation - 17.65 Loss on sale/ disposal/ write off of fixed assets 3.57 - miscellaneous expenses 381.60 312.72
Total 1,774.04 1,615.83
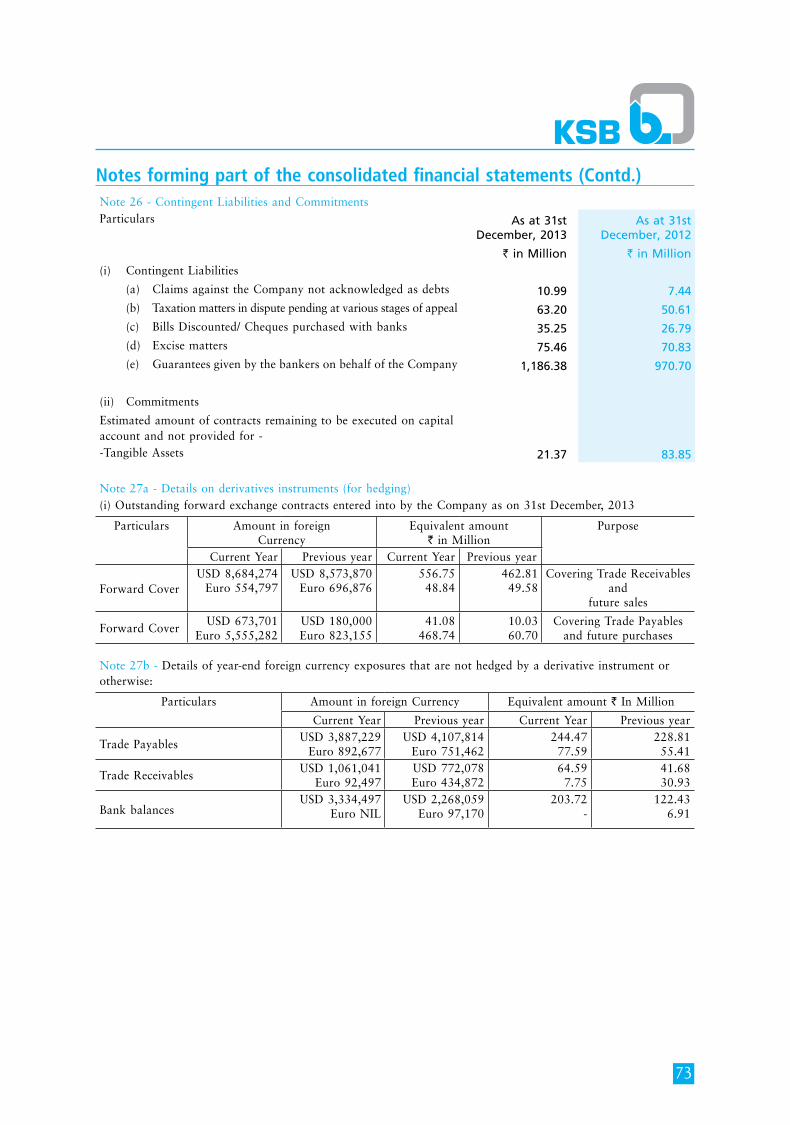
73
Notes forming part of the consolidated financial statements (Contd.)
note 27a - Details on derivatives instruments (for hedging)(i) outstanding forward exchange contracts entered into by the Company as on 31st December, 2013
Particulars amount in foreignCurrency
equivalent amount ` in million
Purpose
Current year Previous year Current year Previous year
Forward Cover USD 8,684,274
euro 554,797 USD 8,573,870
euro 696,876 556.75
48.84 462.81
49.58Covering Trade Receivables
andfuture sales
Forward Cover USD 673,701
euro 5,555,282 USD 180,000 euro 823,155
41.08 468.74
10.03 60.70
Covering Trade Payables and future purchases
note 27b - Details of year-end foreign currency exposures that are not hedged by a derivative instrument or otherwise:
Particulars amount in foreign Currency equivalent amount ` in million
Current year Previous year Current year Previous year
Trade Payables USD 3,887,229
euro 892,677 USD 4,107,814
euro 751,462 244.47 77.59
228.81 55.41
Trade Receivables USD 1,061,041
euro 92,497 USD 772,078 euro 434,872
64.59 7.75
41.68 30.93
Bank balances USD 3,334,497
euro niL USD 2,268,059
euro 97,170 203.72
- 122.43
6.91
note 26 - Contingent Liabilities and CommitmentsParticulars As at 31st
December, 2013As at 31st
December, 2012
` in Million ` in Million (i) Contingent Liabilities
(a) Claims against the Company not acknowledged as debts 10.99 7.44 (b) Taxation matters in dispute pending at various stages of appeal 63.20 50.61 (c) Bills Discounted/ Cheques purchased with banks 35.25 26.79 (d) excise matters 75.46 70.83 (e) Guarantees given by the bankers on behalf of the Company 1,186.38 970.70
(ii) Commitments
estimated amount of contracts remaining to be executed on capital account and not provided for --Tangible assets 21.37 83.85
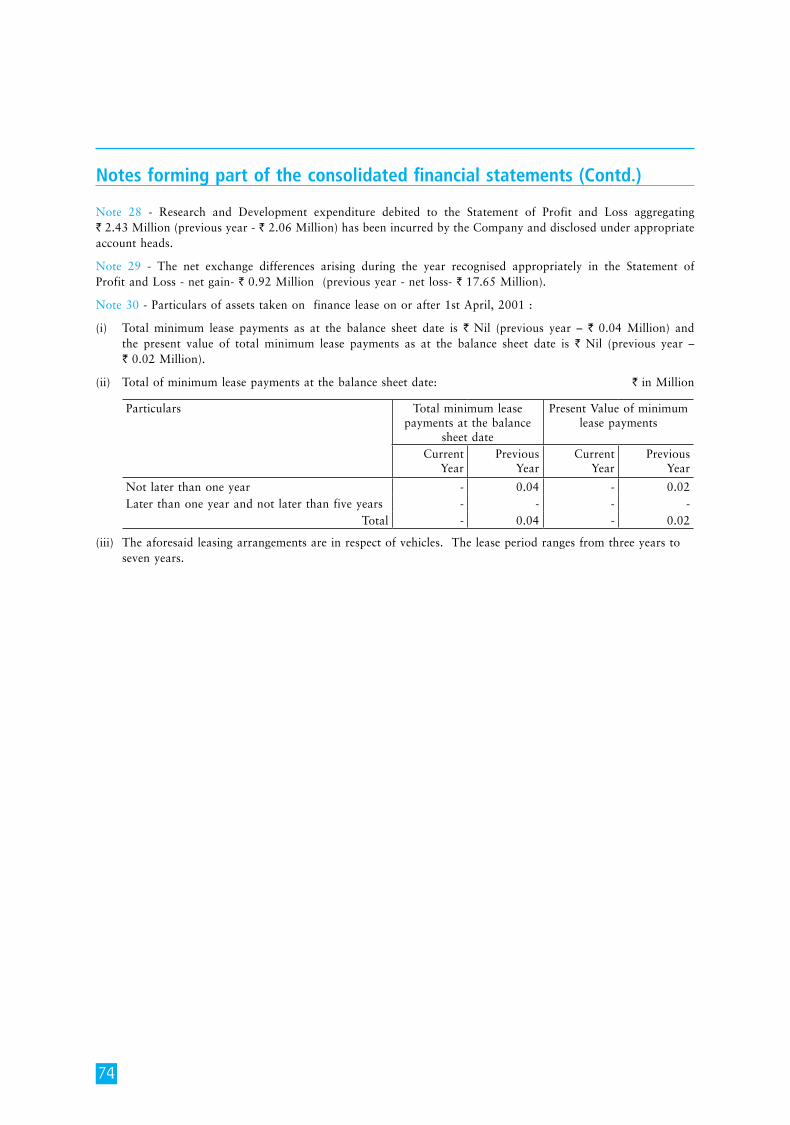
74
Notes forming part of the consolidated financial statements (Contd.)
note 28 - Research and Development expenditure debited to the Statement of Profit and Loss aggregating ` 2.43 million (previous year - ` 2.06 million) has been incurred by the Company and disclosed under appropriate account heads.
note 29 - The net exchange differences arising during the year recognised appropriately in the Statement of Profit and Loss - net gain- ` 0.92 million (previous year - net loss- ` 17.65 million).
note 30 - Particulars of assets taken on finance lease on or after 1st april, 2001 :
(i) Total minimum lease payments as at the balance sheet date is ` nil (previous year – ` 0.04 million) and the present value of total minimum lease payments as at the balance sheet date is ` nil (previous year – ` 0.02 million).
(ii) Total of minimum lease payments at the balance sheet date: ` in million
Particulars Total minimum lease payments at the balance
sheet date
Present Value of minimum lease payments
Current year
Previous year
Current year
Previous year
not later than one year - 0.04 - 0.02 Later than one year and not later than five years - - - -
Total - 0.04 - 0.02
(iii) The aforesaid leasing arrangements are in respect of vehicles. The lease period ranges from three years to seven years.
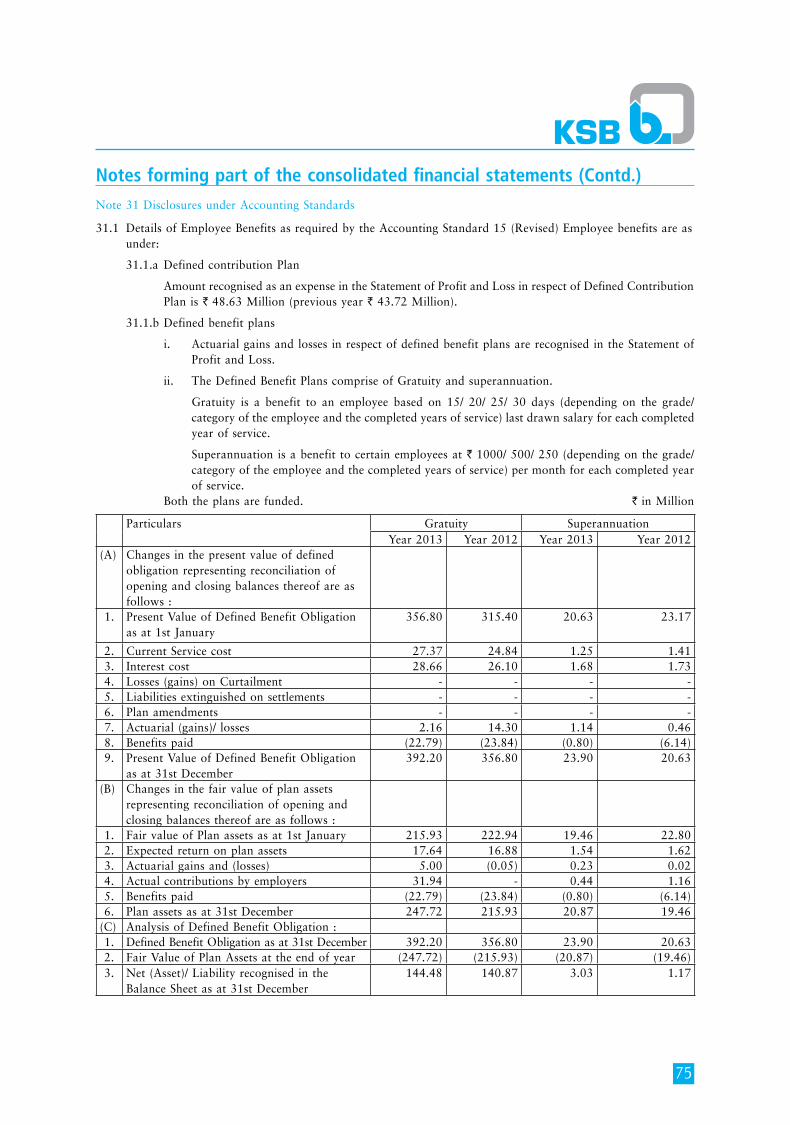
75
Notes forming part of the consolidated financial statements (Contd.)note 31 Disclosures under accounting Standards
31.1 Details of employee Benefits as required by the accounting Standard 15 (Revised) employee benefits are as under:
31.1.a Defined contribution Plan
amount recognised as an expense in the Statement of Profit and Loss in respect of Defined Contribution Plan is ` 48.63 million (previous year ` 43.72 million).
31.1.b Defined benefit plans
i. actuarial gains and losses in respect of defined benefit plans are recognised in the Statement of Profit and Loss.
ii. The Defined Benefit Plans comprise of Gratuity and superannuation.
Gratuity is a benefit to an employee based on 15/ 20/ 25/ 30 days (depending on the grade/ category of the employee and the completed years of service) last drawn salary for each completed year of service.
Superannuation is a benefit to certain employees at ` 1000/ 500/ 250 (depending on the grade/category of the employee and the completed years of service) per month for each completed year of service.
Both the plans are funded. ` in million
Particulars Gratuity Superannuationyear 2013 year 2012 year 2013 year 2012
(a) Changes in the present value of defined obligation representing reconciliation of opening and closing balances thereof are as follows :
1. Present Value of Defined Benefit obligation as at 1st January
356.80 315.40 20.63 23.17
2. Current Service cost 27.37 24.84 1.25 1.41 3. interest cost 28.66 26.10 1.68 1.73 4. Losses (gains) on Curtailment - - - - 5. Liabilities extinguished on settlements - - - - 6. Plan amendments - - - - 7. actuarial (gains)/ losses 2.16 14.30 1.14 0.46 8. Benefits paid (22.79) (23.84) (0.80) (6.14)9. Present Value of Defined Benefit obligation
as at 31st December 392.20 356.80 23.90 20.63
(B) Changes in the fair value of plan assets representing reconciliation of opening and closing balances thereof are as follows :
1. Fair value of Plan assets as at 1st January 215.93 222.94 19.46 22.80 2. expected return on plan assets 17.64 16.88 1.54 1.62 3. actuarial gains and (losses) 5.00 (0.05) 0.23 0.02 4. actual contributions by employers 31.94 - 0.44 1.16 5. Benefits paid (22.79) (23.84) (0.80) (6.14)6. Plan assets as at 31st December 247.72 215.93 20.87 19.46
(C) analysis of Defined Benefit obligation :1. Defined Benefit obligation as at 31st December 392.20 356.80 23.90 20.63 2. Fair Value of Plan assets at the end of year (247.72) (215.93) (20.87) (19.46)3. net (asset)/ Liability recognised in the
Balance Sheet as at 31st December 144.48 140.87 3.03 1.17
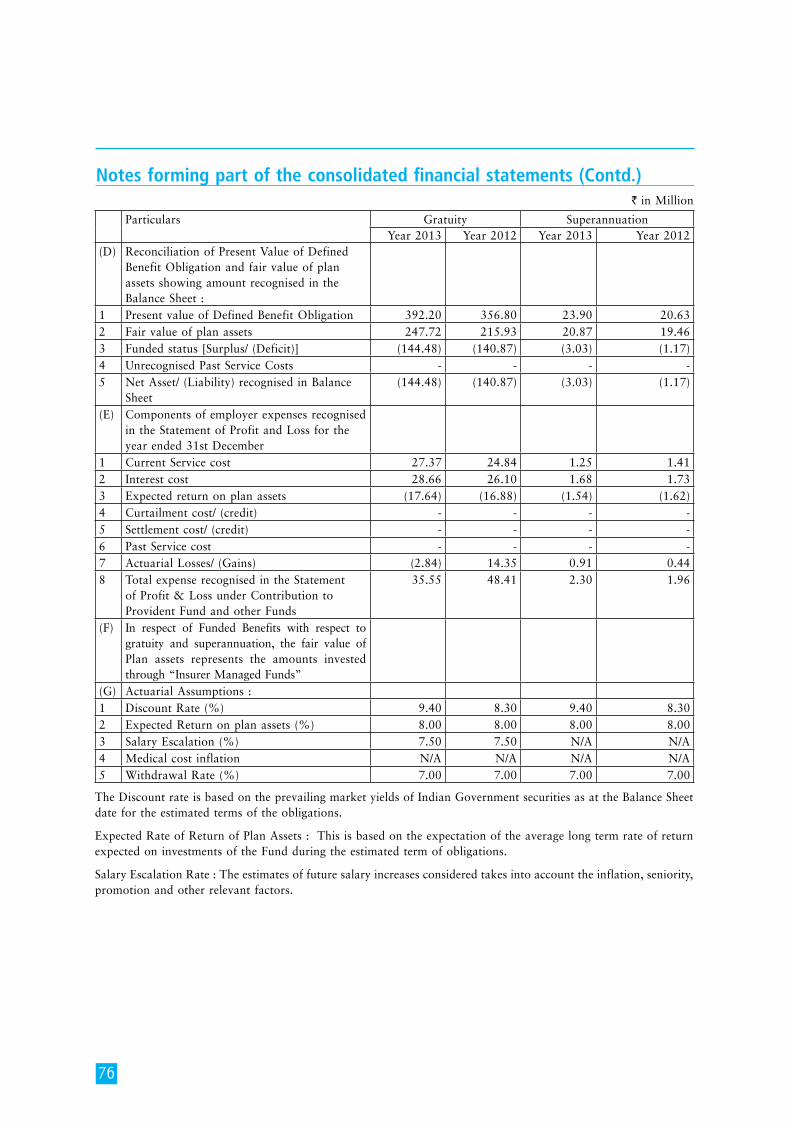
76
Notes forming part of the consolidated financial statements (Contd.)
Particulars Gratuity Superannuationyear 2013 year 2012 year 2013 year 2012
(D) Reconciliation of Present Value of Defined Benefit obligation and fair value of plan assets showing amount recognised in the Balance Sheet :
1 Present value of Defined Benefit obligation 392.20 356.80 23.90 20.63 2 Fair value of plan assets 247.72 215.93 20.87 19.46 3 Funded status [Surplus/ (Deficit)] (144.48) (140.87) (3.03) (1.17)4 Unrecognised Past Service Costs - - - - 5 net asset/ (Liability) recognised in Balance
Sheet(144.48) (140.87) (3.03) (1.17)
(e) Components of employer expenses recognised in the Statement of Profit and Loss for the year ended 31st December
1 Current Service cost 27.37 24.84 1.25 1.41 2 interest cost 28.66 26.10 1.68 1.73 3 expected return on plan assets (17.64) (16.88) (1.54) (1.62)4 Curtailment cost/ (credit) - - - - 5 Settlement cost/ (credit) - - - - 6 Past Service cost - - - - 7 actuarial Losses/ (Gains) (2.84) 14.35 0.91 0.44 8 Total expense recognised in the Statement
of Profit & Loss under Contribution to Provident Fund and other Funds
35.55 48.41 2.30 1.96
(F) in respect of Funded Benefits with respect to gratuity and superannuation, the fair value of Plan assets represents the amounts invested through “insurer managed Funds”
(G) actuarial assumptions :1 Discount Rate (%) 9.40 8.30 9.40 8.302 expected Return on plan assets (%) 8.00 8.00 8.00 8.003 Salary escalation (%) 7.50 7.50 n/a n/a4 medical cost inflation n/a n/a n/a n/a5 Withdrawal Rate (%) 7.00 7.00 7.00 7.00
The Discount rate is based on the prevailing market yields of indian Government securities as at the Balance Sheet date for the estimated terms of the obligations.
expected Rate of Return of Plan assets : This is based on the expectation of the average long term rate of return expected on investments of the Fund during the estimated term of obligations.
Salary escalation Rate : The estimates of future salary increases considered takes into account the inflation, seniority, promotion and other relevant factors.
` in million
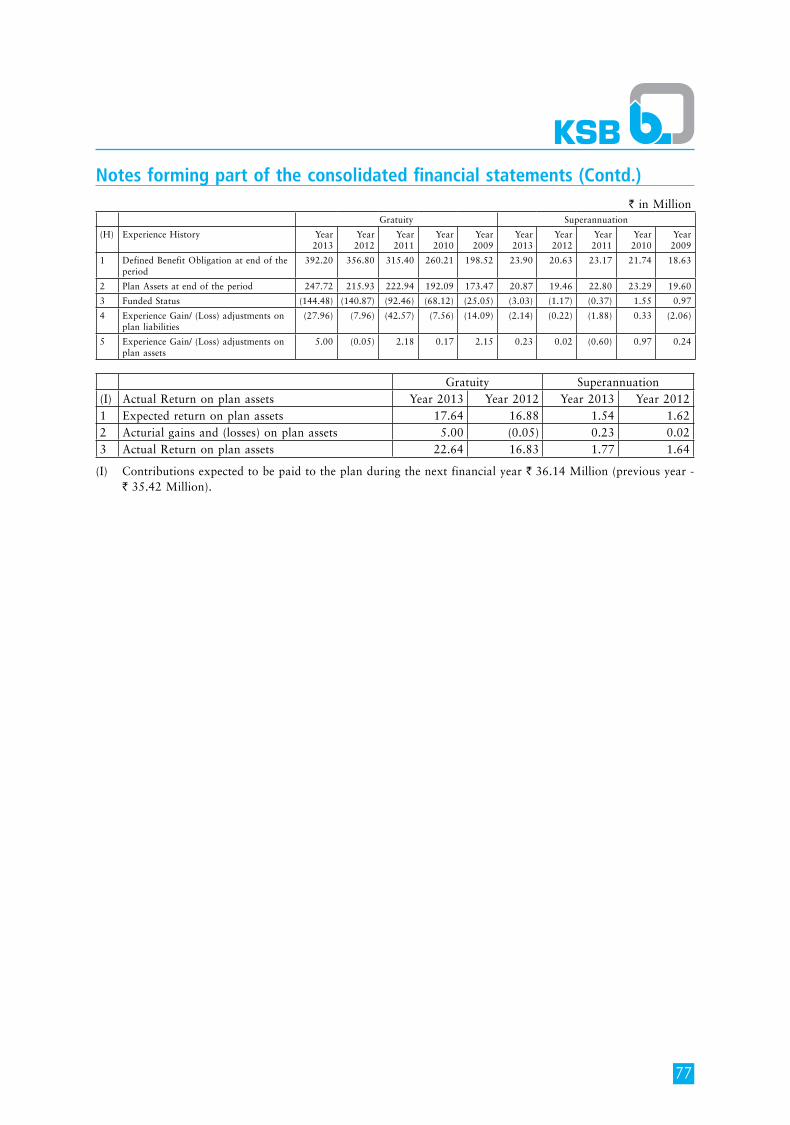
77
Notes forming part of the consolidated financial statements (Contd.)` in million
Gratuity Superannuation
(h) experience history year 2013
year 2012
year 2011
year 2010
year 2009
year 2013
year 2012
year 2011
year 2010
year 2009
1 Defined Benefit obligation at end of the period
392.20 356.80 315.40 260.21 198.52 23.90 20.63 23.17 21.74 18.63
2 Plan assets at end of the period 247.72 215.93 222.94 192.09 173.47 20.87 19.46 22.80 23.29 19.60
3 Funded Status (144.48) (140.87) (92.46) (68.12) (25.05) (3.03) (1.17) (0.37) 1.55 0.97
4 experience Gain/ (Loss) adjustments on plan liabilities
(27.96) (7.96) (42.57) (7.56) (14.09) (2.14) (0.22) (1.88) 0.33 (2.06)
5 experience Gain/ (Loss) adjustments on plan assets
5.00 (0.05) 2.18 0.17 2.15 0.23 0.02 (0.60) 0.97 0.24
Gratuity Superannuation(i) actual Return on plan assets year 2013 year 2012 year 2013 year 20121 expected return on plan assets 17.64 16.88 1.54 1.62 2 acturial gains and (losses) on plan assets 5.00 (0.05) 0.23 0.02 3 actual Return on plan assets 22.64 16.83 1.77 1.64
(i) Contributions expected to be paid to the plan during the next financial year ` 36.14 million (previous year - ` 35.42 million).
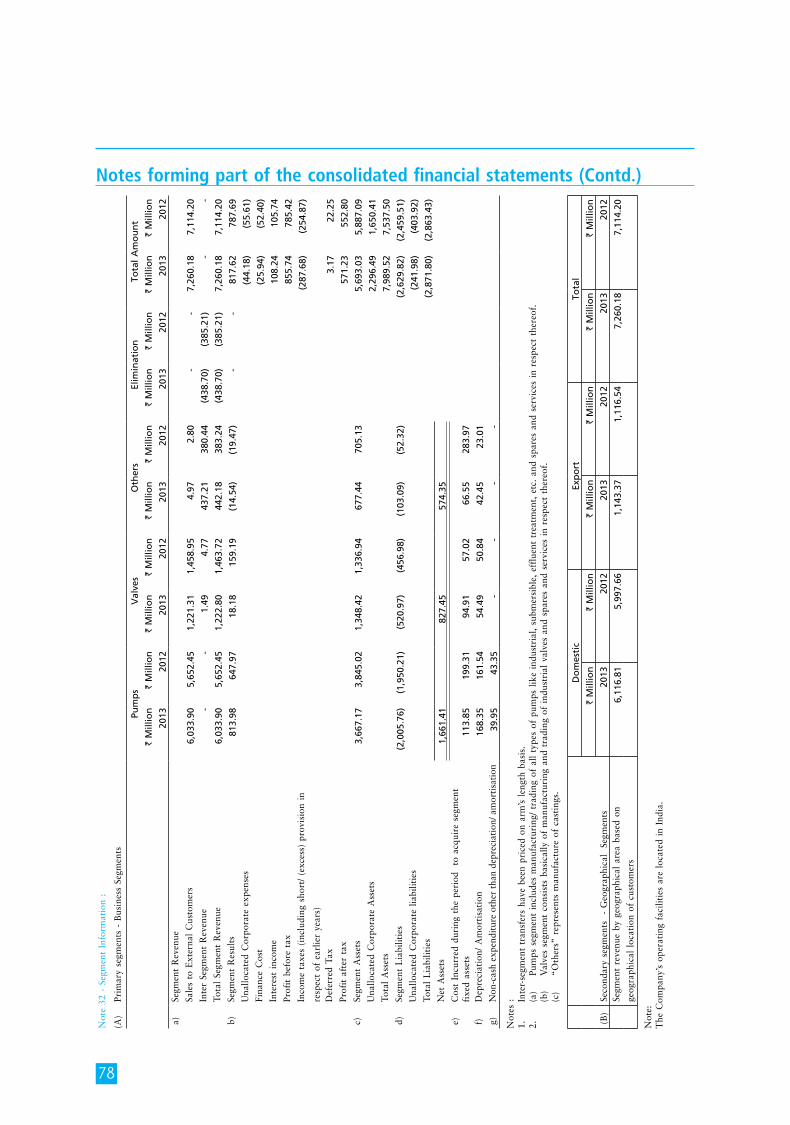
78
Notes forming part of the consolidated financial statements (Contd.)
not
e 32
- S
egm
ent
info
rmat
ion
:
(a)
Prim
ary
segm
ents
- B
usin
ess
Segm
ents
Pum
ps
Val
ves
Oth
ers
Elim
inat
ion
Tota
l A
mo
un
t
` M
illio
n`
Mill
ion
` M
illio
n`
Mill
ion
` M
illio
n`
Mill
ion
` M
illio
n`
Mill
ion
` M
illio
n`
Mill
ion
2013
2012
2013
2012
2013
2012
2013
2012
2013
2012
a)Se
gmen
t R
even
ue
Sale
s to
ext
erna
l C
usto
mer
s 6
,033
.90
5,6
52.4
5 1
,221
.31
1,4
58.9
5 4
.97
2.8
0 -
-
7
,260
.18
7,1
14.2
0 in
ter
Segm
ent
Rev
enue
-
-
1.4
9 4
.77
437
.21
380
.44
(43
8.70
)(3
85.2
1) -
-
To
tal
Segm
ent
Rev
enue
6,0
33.9
0 5
,652
.45
1,2
22.8
0 1
,463
.72
442
.18
383
.24
(43
8.70
) (
385.
21)
7,2
60.1
8 7
,114
.20
b)Se
gmen
t R
esul
ts 8
13.9
8 6
47.9
7 1
8.18
1
59.1
9 (
14.5
4) (
19.4
7) -
-
817
.62
787
.69
Una
lloca
ted
Cor
pora
te e
xpen
ses
(44
.18)
(55
.61)
Fina
nce
Cos
t (
25.9
4) (
52.4
0)in
tere
st i
ncom
e 1
08.2
4 1
05.7
4 Pr
ofit
bef
ore
tax
855
.74
785
.42
inco
me
taxe
s (i
nclu
ding
sho
rt/
(exc
ess)
pro
visi
on i
n
resp
ect
of e
arlie
r ye
ars)
(28
7.68
) (
254.
87)
Def
erre
d Ta
x 3
.17
22.
25
Prof
it a
fter
tax
571
.23
552
.80
c)Se
gmen
t a
sset
s 3
,667
.17
3,8
45.0
2 1
,348
.42
1,3
36.9
4 6
77.4
4 7
05.1
3 5
,693
.03
5,8
87.0
9 U
nallo
cate
d C
orpo
rate
ass
ets
2,2
96.4
9 1
,650
.41
Tota
l a
sset
s 7
,989
.52
7,5
37.5
0 d)
Segm
ent
Lia
bilit
ies
(2,
005.
76)
(1,
950.
21)
(52
0.97
) (
456.
98)
(10
3.09
) (
52.3
2) (
2,62
9.82
) (
2,45
9.51
)U
nallo
cate
d C
orpo
rate
lia
bilit
ies
(24
1.98
) (
403.
92)
Tota
l L
iabi
litie
s (
2,87
1.80
) (
2,86
3.43
)n
et a
sset
s 1
,661
.41
827
.45
574
.35
e)C
ost
incu
rred
dur
ing
the
peri
od
to a
cqui
re s
egm
ent
fixe
d as
sets
113
.85
199
.31
94.
91
57.
02
66.
55
283
.97
f)D
epre
ciat
ion/
am
orti
sati
on 1
68.3
5 1
61.5
4 5
4.49
5
0.84
4
2.45
2
3.01
g)
non
-cas
h ex
pend
itur
e ot
her
than
dep
reci
atio
n/ a
mor
tisa
tion
39.
95
43.
35
-
-
-
-
not
es :
1.
in
ter-
segm
ent
tran
sfer
s ha
ve b
een
pric
ed o
n ar
m’s
len
gth
basi
s.2.
(a
) Pu
mps
seg
men
t in
clud
es m
anuf
actu
ring
/ tr
adin
g of
all
type
s of
pum
ps l
ike
indu
stri
al,
subm
ersi
ble,
eff
luen
t tr
eatm
ent,
etc
. an
d sp
ares
and
ser
vice
s in
res
pect
the
reof
.
(b)
Val
ves
segm
ent
cons
ists
bas
ical
ly o
f m
anuf
actu
ring
and
tra
ding
of
indu
stri
al v
alve
s an
d sp
ares
and
ser
vice
s in
res
pect
the
reof
.
(c)
“oth
ers”
rep
rese
nts
man
ufac
ture
of
cast
ings
.
(B)
Seco
ndar
y se
gmen
ts
- G
eogr
aphi
cal
Seg
men
ts
Do
mes
tic
Exp
ort
Tota
l
` M
illio
n`
Mill
ion
` M
illio
n`
Mill
ion
` M
illio
n`
Mill
ion
2013
2012
2013
2012
2013
2012
Segm
ent
reve
nue
by g
eogr
aphi
cal
area
bas
ed o
n 6,
116.
815,
997.
661,
143.
371,
116.
547,
260.
187,
114.
20ge
ogra
phic
al l
ocat
ion
of c
usto
mer
s
not
e:
The
Com
pany
’s o
pera
ting
fac
iliti
es a
re l
ocat
ed i
n in
dia.
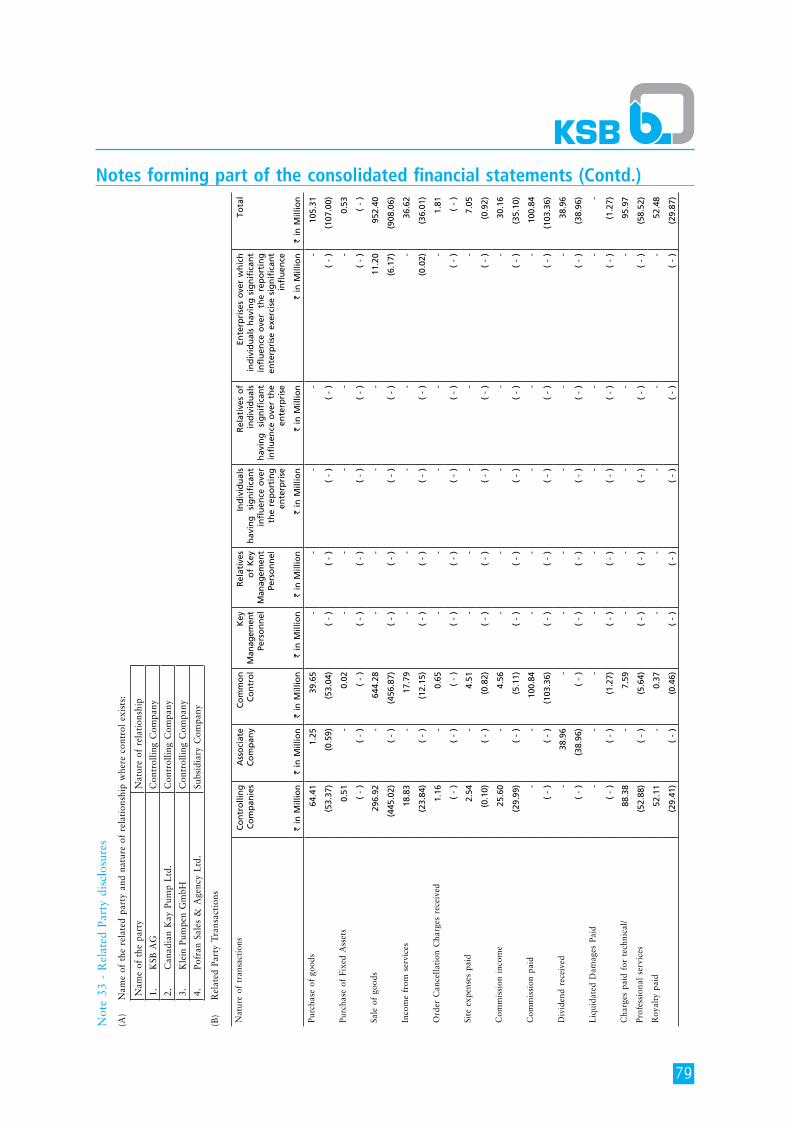
79
Notes forming part of the consolidated financial statements (Contd.)
not
e 33
- R
elat
ed P
arty
dis
clos
ures
(a)
nam
e of
the
rel
ated
par
ty a
nd n
atur
e of
rel
atio
nshi
p w
here
con
trol
exi
sts:
nam
e of
the
par
tyn
atur
e of
rel
atio
nshi
p
1.
KSB
aG
Con
trol
ling
Com
pany
2.
Can
adia
n K
ay P
ump
Ltd
.C
ontr
ollin
g C
ompa
ny
3.
Kle
in P
umpe
n G
mbh
Con
trol
ling
Com
pany
4.
Pofr
an S
ales
& a
genc
y L
td.
Subs
idia
ry C
ompa
ny
(B)
Rel
ated
Par
ty T
rans
acti
ons
nat
ure
of t
rans
acti
ons
Co
ntr
olli
ng
Co
mp
anie
sA
sso
ciat
eC
om
pan
yC
om
mo
nC
on
tro
lK
eyM
anag
emen
tPe
rso
nn
el
Rel
ativ
eso
f K
eyM
anag
emen
tPe
rso
nn
el
Ind
ivid
ual
s h
avin
g
sig
nif
ican
t in
flu
ence
ove
r th
e re
po
rtin
g
ente
rpri
se
Rel
ativ
es o
f in
div
idu
als
hav
ing
si
gn
ific
ant
infl
uen
ce o
ver
the
ente
rpri
se
Ente
rpri
ses
ove
r w
hic
h
ind
ivid
ual
s h
avin
g s
ign
ific
ant
infl
uen
ce o
ver
th
e re
po
rtin
g
ente
rpri
se e
xerc
ise
sig
nif
ican
t in
flu
ence
Tota
l
` in
Mill
ion
` in
Mill
ion
` in
Mill
ion
` in
Mill
ion
` in
Mill
ion
` in
Mill
ion
` in
Mill
ion
` in
Mill
ion
` in
Mill
ion
Purc
hase
of
good
s 6
4.41
1
.25
39.
65
-
-
-
-
-
105
.31
(53
.37)
(0.
59)
(53
.04)
(
- )
(
- )
(
- )
(
- )
(
- )
(10
7.00
)
Purc
hase
of
Fixe
d a
sset
s 0
.51
-
0.0
2 -
-
-
-
-
0
.53
(
- )
(
- )
(
- )
(
- )
(
- )
(
- )
(
- )
(
- )
(
- )
Sale
of
good
s 2
96.9
2 -
6
44.2
8 -
-
-
-
1
1.20
9
52.4
0
(44
5.02
)
( -
) (
456.
87)
(
- )
(
- )
(
- )
(
- )
(6.
17)
(90
8.06
)
inco
me
from
ser
vice
s 1
8.83
-
1
7.79
-
-
-
-
-
3
6.62
(23
.84)
(
- )
(12
.15)
(
- )
(
- )
(
- )
(
- )
(0.
02)
(36
.01)
ord
er C
ance
llati
on C
harg
es r
ecei
ved
1.1
6 -
0
.65
-
-
-
-
-
1.8
1
(
- )
(
- )
(
- )
(
- )
(
- )
(
- )
(
- )
( -
)
( -
)
Site
exp
ense
s pa
id 2
.54
-
4.5
1 -
-
-
-
-
7
.05
(0.
10)
(
- )
(0.
82)
(
- )
(
- )
(
- )
(
- )
(
- )
(0.
92)
Com
mis
sion
inc
ome
25.
60
-
4.5
6 -
-
-
-
-
3
0.16
(29
.99)
(
- )
(5.
11)
(
- )
(
- )
(
- )
(
- )
(
- )
(35
.10)
Com
mis
sion
pai
d -
-
1
00.8
4 -
-
-
-
-
1
00.8
4
(
- )
(
- )
(10
3.36
)
( -
)
( -
)
( -
)
( -
)
( -
) (
103.
36)
Div
iden
d re
ceiv
ed -
3
8.96
-
-
-
-
-
-
3
8.96
(
- )
(38
.96)
(
- )
(
- )
(
- )
(
- )
(
- )
(
- )
(38
.96)
Liq
uida
ted
Dam
ages
Pai
d -
-
-
-
-
-
-
-
-
(
- )
(
- )
(1.
27)
(
- )
(
- )
(
- )
(
- )
(
- )
(1.
27)
Cha
rges
pai
d fo
r te
chni
cal/
88.
38
-
7.5
9 -
-
-
-
-
9
5.97
Prof
essi
onal
ser
vice
s (
52.8
8)
( -
) (
5.64
)
( -
)
( -
)
( -
)
( -
)
( -
) (
58.5
2)
Roy
alty
pai
d 5
2.11
-
0
.37
-
-
-
-
-
52.
48
(29
.41)
(
- )
(0.
46)
(
- )
(
- )
(
- )
(
- )
(
- )
(29
.87)
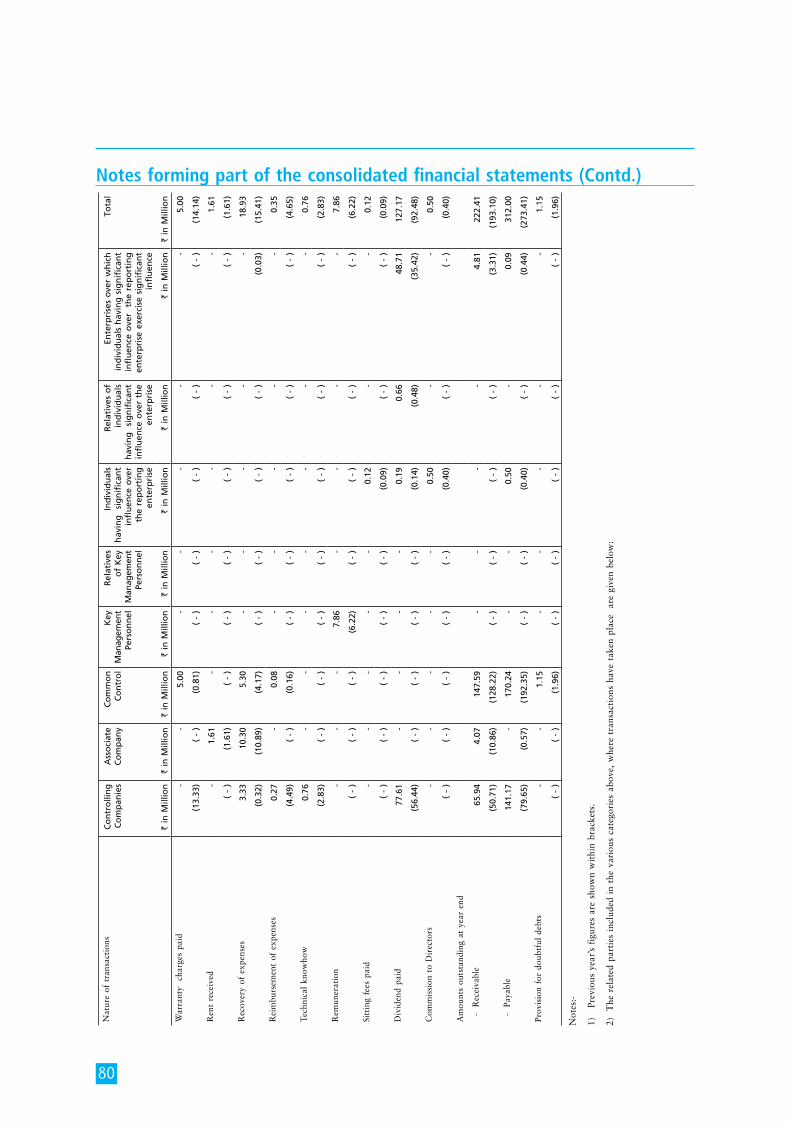
80
Notes forming part of the consolidated financial statements (Contd.)
nat
ure
of t
rans
acti
ons
Co
ntr
olli
ng
Co
mp
anie
sA
sso
ciat
eC
om
pan
yC
om
mo
nC
on
tro
lK
eyM
anag
emen
tPe
rso
nn
el
Rel
ativ
eso
f K
eyM
anag
emen
tPe
rso
nn
el
Ind
ivid
ual
s h
avin
g
sig
nif
ican
t in
flu
ence
ove
r th
e re
po
rtin
g
ente
rpri
se
Rel
ativ
es o
f in
div
idu
als
hav
ing
si
gn
ific
ant
infl
uen
ce o
ver
the
ente
rpri
se
Ente
rpri
ses
ove
r w
hic
h
ind
ivid
ual
s h
avin
g s
ign
ific
ant
infl
uen
ce o
ver
th
e re
po
rtin
g
ente
rpri
se e
xerc
ise
sig
nif
ican
t in
flu
ence
Tota
l
` in
Mill
ion
` in
Mill
ion
` in
Mill
ion
` in
Mill
ion
` in
Mill
ion
` in
Mill
ion
` in
Mill
ion
` in
Mill
ion
` in
Mill
ion
War
rant
y c
harg
es p
aid
-
-
5.0
0 -
-
-
-
-
5
.00
(13
.33)
(
- )
(0.
81)
(
- )
(
- )
(
- )
(
- )
(
- )
(14
.14)
Ren
t re
ceiv
ed
-
1.6
1 -
-
-
-
-
-
1
.61
(
- )
(1.
61)
(
- )
(
- )
(
- )
(
- )
(
- )
(
- )
(1.
61)
Rec
over
y of
exp
ense
s 3
.33
10.
30
5.3
0 -
-
-
-
-
1
8.93
(0.
32)
(10
.89)
(4.
17)
(
- )
(
- )
(
- )
(
- )
(0.
03)
(15
.41)
Rei
mbu
rsem
ent
of e
xpen
ses
0.2
7 -
0
.08
-
-
-
-
-
0.3
5
(4.
49)
(
- )
(0.
16)
(
- )
(
- )
(
- )
(
- )
(
- )
(4.
65)
Tech
nica
l kn
owho
w 0
.76
-
-
-
-
-
-
-
0.7
6
(2.
83)
(
- )
(
- )
(
- )
(
- )
(
- )
(
- )
(
- )
(2.
83)
Rem
uner
atio
n -
-
-
7
.86
-
-
-
-
7.8
6
(
- )
(
- )
(
- )
(6.
22)
(
- )
(
- )
(
- )
(
- )
(6.
22)
Sitt
ing
fees
pai
d -
-
-
-
-
0
.12
-
-
0.1
2
(
- )
(
- )
(
- )
(
- )
(
- )
(0.
09)
(
- )
(
- )
(0.
09)
Div
iden
d pa
id 7
7.61
-
-
-
-
0
.19
0.6
6 4
8.71
1
27.1
7
(56
.44)
(
- )
(
- )
(
- )
(
- )
(0.
14)
(0.
48)
(35
.42)
(92
.48)
Com
mis
sion
to
Dir
ecto
rs -
-
-
-
-
0
.50
-
-
0.5
0
(
- )
(
- )
(
- )
(
- )
(
- )
(0.
40)
(
- )
(
- )
(0.
40)
am
ount
s ou
tsta
ndin
g at
yea
r en
d
-
Rec
eiva
ble
65.
94
4.0
7 1
47.5
9 -
-
-
-
4
.81
222
.41
(50
.71)
(10
.86)
(12
8.22
)
( -
)
( -
)
( -
)
( -
) (
3.31
) (
193.
10)
-
Pay
able
141
.17
-
170
.24
-
-
0.5
0 -
0
.09
312
.00
(79
.65)
(0.
57)
(19
2.35
)
( -
)
( -
) (
0.40
)
( -
) (
0.44
) (
273.
41)
Prov
isio
n fo
r do
ubtf
ul d
ebts
-
-
1.1
5 -
-
-
-
-
1
.15
(
- )
(
- )
(1.
96)
(
- )
(
- )
(
- )
(
- )
(
- )
(1.
96)
not
es:-
1)
Pre
viou
s ye
ar’s
fig
ures
are
sho
wn
wit
hin
brac
kets
.
2)
The
rel
ated
par
ties
inc
lude
d in
the
var
ious
cat
egor
ies
abov
e, w
here
tra
nsac
tion
s ha
ve t
aken
pla
ce
are
give
n be
low
:
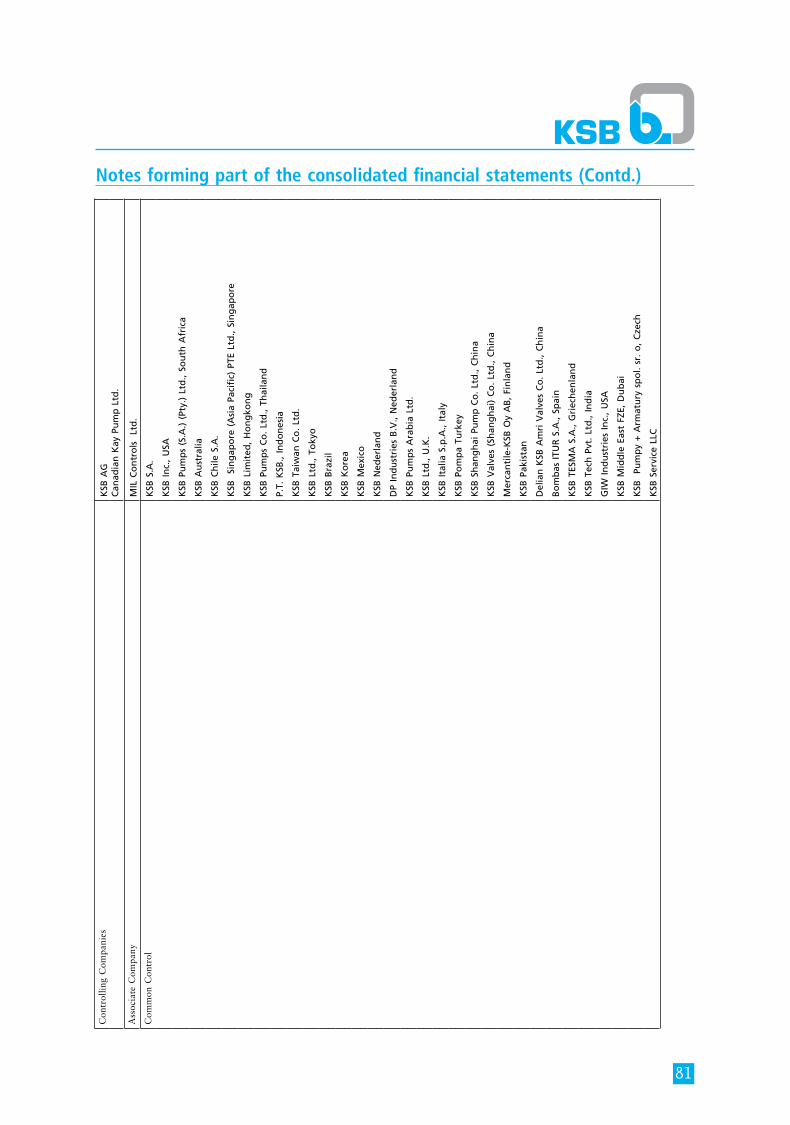
81
Notes forming part of the consolidated financial statements (Contd.)
Con
trol
ling
Com
pani
esK
SB A
GC
anad
ian
Kay
Pu
mp
Ltd
.
ass
ocia
te C
ompa
nyM
IL C
on
tro
ls
Ltd
.
Com
mon
Con
trol
KSB
S.A
.
KSB
In
c.,
USA
KSB
Pu
mp
s (S
.A.)
(Pt
y.)
Ltd
., So
uth
Afr
ica
KSB
Au
stra
lia
KSB
Ch
ile S
.A.
KSB
Si
ng
apo
re (
Asi
a Pa
cifi
c) P
TE L
td.,
Sin
gap
ore
KSB
Lim
ited
, H
on
gko
ng
KSB
Pu
mp
s C
o.
Ltd
., Th
aila
nd
P.T.
KSB
., In
do
nes
ia
KSB
Tai
wan
Co
. Lt
d.
KSB
Ltd
., To
kyo
KSB
Bra
zil
KSB
Ko
rea
KSB
Mex
ico
KSB
Ned
erla
nd
DP
Ind
ust
ries
B.V
., N
eder
lan
d
KSB
Pu
mp
s A
rab
ia L
td.
KSB
Ltd
., U
.K.
KSB
Ita
lia S
.p.A
., It
aly
KSB
Po
mp
a Tu
rkey
KSB
Sh
ang
hai
Pu
mp
Co
. Lt
d.,
Ch
ina
KSB
Val
ves
(Sh
ang
hai
) C
o.
Ltd
., C
hin
a
Mer
can
tile
-KSB
Oy
AB
, Fi
nla
nd
KSB
Pak
ista
n
Del
ian
KSB
Am
ri V
alve
s C
o.
Ltd
., C
hin
a
Bo
mb
as I
TUR
S.A
., Sp
ain
KSB
TES
MA
S.A
., G
riec
hen
lan
d
KSB
Tec
h P
vt.
Ltd
., In
dia
GIW
In
du
stri
es I
nc.
, U
SA
KSB
Mid
dle
Eas
t FZ
E, D
ub
ai
KSB
Pu
mp
y +
Arm
atu
ry s
po
l. sr
. o
, C
zech
KSB
Ser
vice
LLC
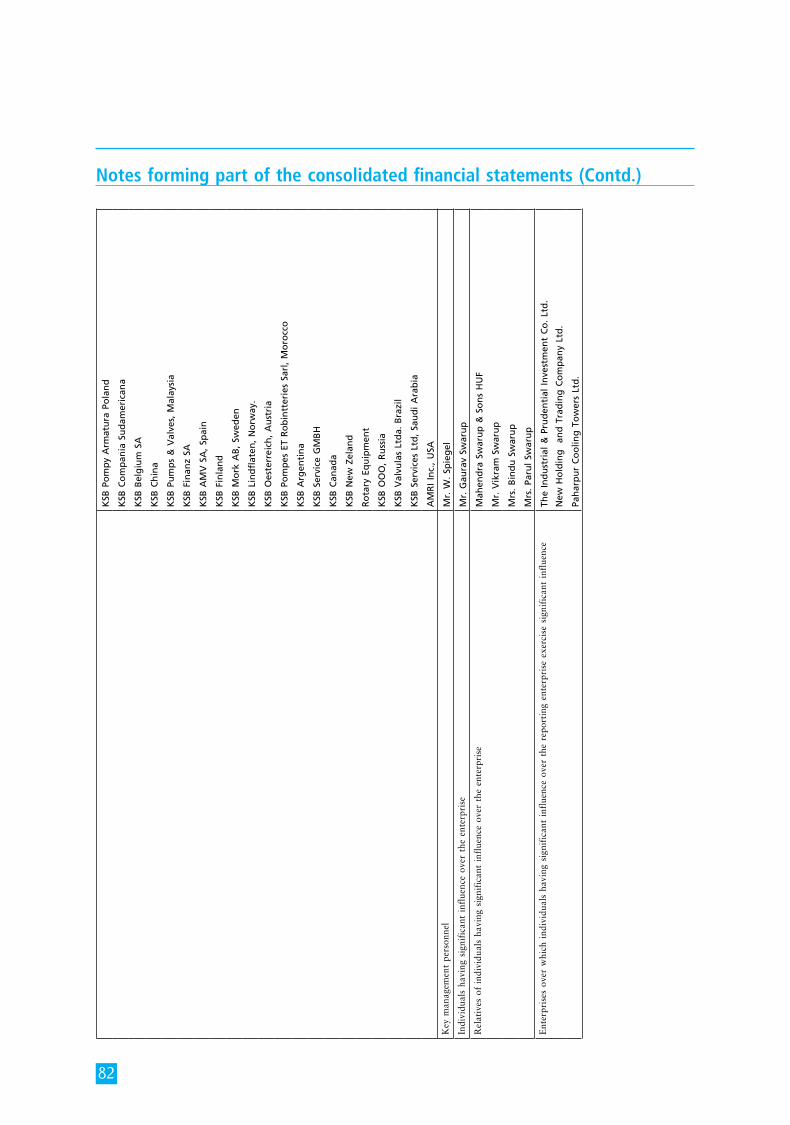
82
KSB
Po
mp
y A
rmat
ura
Po
lan
d
KSB
Co
mp
ania
Su
dam
eric
ana
KSB
Bel
giu
m S
A
KSB
Ch
ina
KSB
Pu
mp
s &
Val
ves,
Mal
aysi
a
KSB
Fin
anz
SA
KSB
AM
V S
A,
Spai
n
KSB
Fin
lan
d
KSB
Mo
rk A
B,
Swed
en
KSB
Lin
dfl
aten
, N
orw
ay.
KSB
Oes
terr
eich
, A
ust
ria
KSB
Po
mp
es E
T R
ob
intt
erie
s Sa
rl,
Mo
rocc
o
KSB
Arg
enti
na
KSB
Ser
vice
GM
BH
KSB
Can
ada
KSB
New
Zel
and
Ro
tary
Eq
uip
men
t
KSB
OO
O,
Ru
ssia
KSB
Val
vula
s Lt
da.
Bra
zil
KSB
Ser
vice
s Lt
d,
Sau
di
Ara
bia
AM
RI
Inc.
, U
SA
Key
man
agem
ent
pers
onne
lM
r. W
. Sp
ieg
el
indi
vidu
als
havi
ng s
igni
fica
nt i
nflu
ence
ove
r th
e en
terp
rise
Mr.
Gau
rav
Swar
up
Rel
ativ
es o
f in
divi
dual
s ha
ving
sig
nifi
cant
inf
luen
ce o
ver
the
ente
rpri
seM
ahen
dra
Sw
aru
p &
So
ns
HU
F
Mr.
Vik
ram
Sw
aru
p
Mrs
. B
ind
u S
war
up
Mrs
. Pa
rul
Swar
up
ent
erpr
ises
ove
r w
hich
ind
ivid
uals
hav
ing
sign
ific
ant
infl
uenc
e ov
er t
he r
epor
ting
ent
erpr
ise
exer
cise
sig
nifi
cant
inf
luen
ce
The
Ind
ust
rial
& P
rud
enti
al I
nve
stm
ent
Co
. Lt
d.
New
Ho
ldin
g
and
Tra
din
g C
om
pan
y Lt
d.
Pah
arp
ur
Co
olin
g T
ow
ers
Ltd
.
Notes forming part of the consolidated financial statements (Contd.)
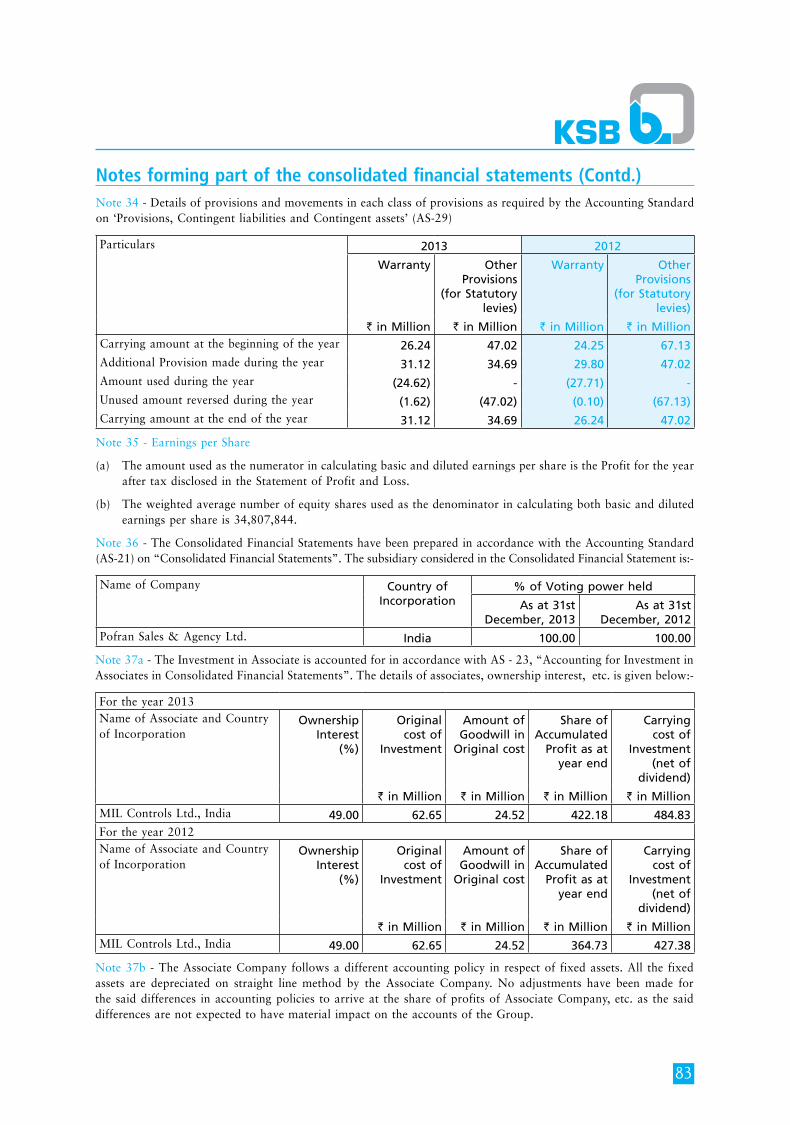
83
Notes forming part of the consolidated financial statements (Contd.)note 34 - Details of provisions and movements in each class of provisions as required by the accounting Standard on ‘Provisions, Contingent liabilities and Contingent assets’ (aS-29)
Particulars 2013 2012
Warranty Other Provisions
(for Statutory levies)
Warranty Other Provisions
(for Statutory levies)
` in Million ` in Million ` in Million ` in MillionCarrying amount at the beginning of the year 26.24 47.02 24.25 67.13 additional Provision made during the year 31.12 34.69 29.80 47.02 amount used during the year (24.62) - (27.71) - Unused amount reversed during the year (1.62) (47.02) (0.10) (67.13)Carrying amount at the end of the year 31.12 34.69 26.24 47.02
note 35 - earnings per Share
(a) The amount used as the numerator in calculating basic and diluted earnings per share is the Profit for the year after tax disclosed in the Statement of Profit and Loss.
(b) The weighted average number of equity shares used as the denominator in calculating both basic and diluted earnings per share is 34,807,844.
note 36 - The Consolidated Financial Statements have been prepared in accordance with the accounting Standard (aS-21) on “Consolidated Financial Statements”. The subsidiary considered in the Consolidated Financial Statement is:-
name of Company Country of Incorporation
% of Voting power held
As at 31st December, 2013
As at 31st December, 2012
Pofran Sales & agency Ltd. India 100.00 100.00
note 37a - The investment in associate is accounted for in accordance with aS - 23, “accounting for investment in associates in Consolidated Financial Statements”. The details of associates, ownership interest, etc. is given below:-
For the year 2013name of associate and Country of incorporation
Ownership Interest
(%)
Original cost of
Investment
Amount of Goodwill in
Original cost
Share of Accumulated
Profit as at year end
Carrying cost of
Investment (net of
dividend)
` in Million ` in Million ` in Million ` in MillionmiL Controls Ltd., india 49.00 62.65 24.52 422.18 484.83 For the year 2012name of associate and Country of incorporation
Ownership Interest
(%)
Original cost of
Investment
Amount of Goodwill in
Original cost
Share of Accumulated
Profit as at year end
Carrying cost of
Investment (net of
dividend)
` in Million ` in Million ` in Million ` in MillionmiL Controls Ltd., india 49.00 62.65 24.52 364.73 427.38
note 37b - The associate Company follows a different accounting policy in respect of fixed assets. all the fixed assets are depreciated on straight line method by the associate Company. no adjustments have been made for the said differences in accounting policies to arrive at the share of profits of associate Company, etc. as the said differences are not expected to have material impact on the accounts of the Group.
84
Notes forming part of the consolidated financial statements (Contd.)
G. Swarup Chairman a.R. Broacha n.n. Kampani Dr. Stephan Bross Directors Pradip Shah Dr. W. Schmitt
R. narasimhan W. Spiegel managing Director Company Secretarymumbai, 11th February, 2014
note 38 - Repairs to machinery include ` 43.17 million (previous year - ` 40.23 million) spares consumed.
note 39 - Provision for taxation for the year is an aggregate of the provision made for the year ended 31st march, 2013 as reduced by the provision for 9 months up to 31st December, 2012 and the provision based on the figures for the remaining 9 months up to 31st December, 2013. however, the ultimate tax liability for the remaining 9 months up to 31st December, 2013 will be determined based on the results for the year 1st april, 2013 to 31st march, 2014.
note 40 - Previous year’s figures have been regrouped/ reclassified wherever necessary to correspond with the current year’s classification/ disclosure.
Signature to notes 1 to 40
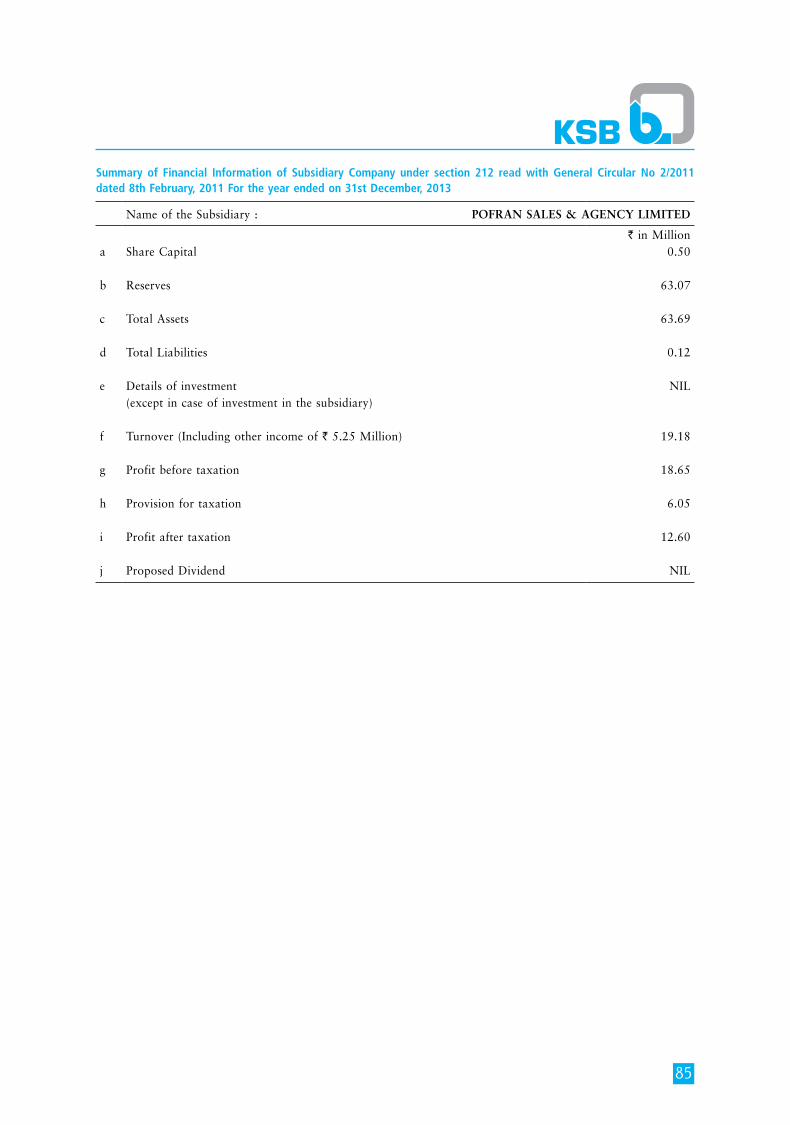
85
Summary of Financial Information of Subsidiary Company under section 212 read with General Circular No 2/2011 dated 8th February, 2011 For the year ended on 31st December, 2013
name of the Subsidiary : POFRAN SALES & AGENCY LIMITED
` in milliona Share Capital 0.50
b Reserves 63.07
c Total assets 63.69
d Total Liabilities 0.12
e Details of investment niL(except in case of investment in the subsidiary)
f Turnover (including other income of ` 5.25 million) 19.18
g Profit before taxation 18.65
h Provision for taxation 6.05
i Profit after taxation 12.60
j Proposed Dividend niL

86
NOTES

87
NOTES

88
NOTES