CONTENTS - Fort Collins, Colorado · 1 . CONTENTS EXECUTIVE SUMMARY 2 PILOT PROJECT...
26
Transcript of CONTENTS - Fort Collins, Colorado · 1 . CONTENTS EXECUTIVE SUMMARY 2 PILOT PROJECT...

1
CONTENTS
EXECUTIVE SUMMARY 2
PILOT PROJECT OVERVIEW/BACKGROUND 4
2014 Bicycle Master Plan 4 Protected Bike Lane Pilot Program 4 Kaiser Permanente Walk and Wheel Grant 5 Laurel Street Project Site Selection and Goals 5 Project Design 6 Project Implementation and Outreach 7 Evaluation Program 7 Overall Project Cost 7 Timeline 7
EVALUATION PROCESS AND METHODS 8
KEY FINDINGS 10
Bicycle Ridership 10 Bicycle Safety 13 Bicycle Comfort 15 Business Impacts 17 Other Corridor Users 18 Pilot Project Design 19 Maintenance 19 Process 20
RECOMMENDATIONS: LAUREL STREET 21
Laurel Street Pilot Project: Near-Term Recommendations [2017-18] 22 Laurel Street Pilot Project: Longer-Term Recommendations 23
RECOMMENDATIONS: BEST PRACTICES 23
Planning and Design 23 Outreach 23 Implementation 24 Education 24 Maintenance 24 Evaluation 24
2
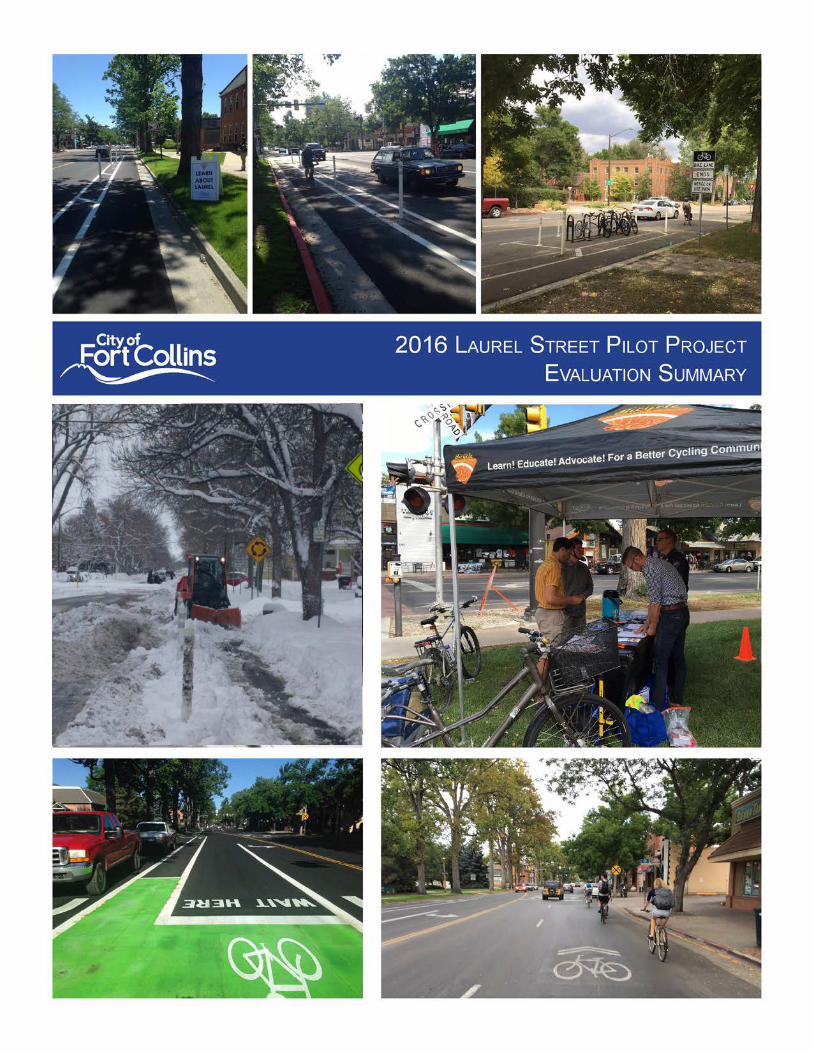
EXECUTIVE SUMMARY
The 2014 Fort Collins Bicycle Master Plan (Bike Plan) envisions Fort Collins as a city where people of all ages and abilities have access to a comfortable, safe and connected network of low-stress bicycle facilities. The Bike Plan recommends implementation of a low-stress bicycle network by 2020 to achieve a 20 percent bicycle ridership goal and fewer bicycle-related crashes. This low-stress network leverages existing low-volume and low-speed streets where possible, while also recommending the implementation of protected bike lanes along higher volume or higher speed streets. The Bike Plan proposed initial implementation of protected bike lanes through a Pilot Program, allowing the city to develop best practices for the design, implementation, and maintenance of this new type of infrastructure in Fort Collins through a series of pilot projects.
In 2014, funding for the first protected bike lane pilot project, as well as technical design assistance, was awarded through Kaiser Permanente’s Walk and Wheel grant program. The Bike Plan identified several candidate locations for protected bike lane pilot projects. Following an extensive project review process, Laurel Street between Howes and Remington streets was selected as the location for the first pilot project. In addition to deficient bicycle facilities, this section of Laurel Street had a history of bicycle crashes, and serves as an important connection to key destinations and bike routes, such as the Remington Greenway and Mason Corridor. The project was installed in two phases: College Avenue to Howes Street in June 2015 and College Avenue to Remington Street in September 2015. Through an extensive evaluation process, City staff documented successes, challenges, and formulated recommendations related to the Laurel Street Pilot Project and best-practices in moving the Pilot Program forward.
Successes
As the first pilot project in what is intended to be a series of protected bike lane pilot projects, the process and findings were invaluable. The lessons learned through the Laurel Street Pilot Project will be instrumental to future protected bike lane projects in Fort Collins and to the Laurel Street project itself.
The Laurel Street Pilot Project (Pilot Project) was designed to address existing challenges and safety concerns in the corridor, while testing different types of bicycle infrastructure in a variety of contexts. Various bicycle facilities were included in the project: protected bike lanes, parking protected bike lanes, shared lane markings, green paint denoting a merge zone, and a bike box. The aim of selecting different types of bicycle facilities was to determine if and where such treatments might be appropriate in other situations to address similar safety and comfort concerns, while also creating a context-appropriate and balanced design for Laurel Street.
• Overall, the project accomplished the goals of the Pilot Program – testing new bicycle facility designs, collecting feedback from stakeholders and the general public about these new types of facilities, and creating an important connection between two high-use bikeways: the Mason Corridor and Remington Greenway.
• The overall process for the Laurel Street Pilot Project generated valuable knowledge around the planning, design, outreach, implementation, maintenance and evaluation of bicycle facilities. This information will be useful for future projects.
• Of six block faces in the project scope, four now feature dedicated bicycle facilities, compared to just one and a half block faces prior to the project completion.
• Compared to surveys collected prior to the Pilot Project installation, perceptions of bicycle safety and comfort increased after installation.
• Compared to surveys collected prior to the Pilot Project installation, a higher percentage of people prefer Laurel Street to other routes after installation.

3
• Data suggest that helmet use and the proportion of women cycling in the corridor increased following the project installation.
• In the four and a half years prior to project completion, nine bicycle-related crashes had been documented at the intersection of College Avenue and Laurel Street (average of two per year), one of the city’s highest bicycle crash locations. In the year and a half following installation of the Pilot Project, zero bicycle-related crashes were reported at this intersection.
• Video analysis indicates that sidewalk riding, a particularly unsafe behavior, has decreased following the project’s installation.
• Public input regarded the protected bike lanes was largely positive and recommendations for design refinements were helpful.
Challenges
• The tradeoffs associated with managing limited public right of way to serve multiple uses were integral to this project. The design approach sought to create a balanced solution while still serving the primary project goals. Ultimately, on-street parking was retained in certain sections of the corridor (where shared lane markings were installed) and removed along two half-blocks to provide a dedicated bike facility. Some area businesses expressed concerns about the loss of on-street parking spaces associated with the Pilot Project installation (both prior to installation and during the evaluation). City staff conducted pre- and post-parking capacity and utilization snapshots around the project to understand the potential impacts as a result of parking loss, which informed the project design. The follow-up analysis showed that, although there are peak times/locations where parking utilization reaches high demand levels, the average parking utilization in the area remains lower than optimal occupancy (as established in the parking plan), particularly in the customer-only parking lots available to many of the businesses.
• Due to concerns over parking loss, two block faces still include shared lane markings, a design treatment that may not be perceived as comfortable or safe for Interested but Concerned cyclists, which comprise a large percentage of the population.
• City staff aimed to evaluate the economic impact of the project on area business, but evaluation methods yielded little useful data. Additional research should be conducted to develop an effective approach to evaluate the economic impact of protected bike lane projects in Fort Collins.
• One goal of the project was to positively impact ridership along Laurel Street, but evaluation methods did not conclusively demonstrate increased ridership. It should be noted, however, that weather during pre- and post-data collection periods varied which could explain these findings. Best practices for collecting comprehensive ridership data was also an important lesson learned through this process.
• Concerns have been documented related to possible conflicts with vehicles and bicycles along the parking protected bike lane alley intersection, and merging into the roundabout at Remington and Laurel Streets, although no crashes have been reported in these areas.
• While the Pilot Project was valuable for developing an approach to maintaining the protected bike lanes, challenges remain over the cost and labor-intensiveness of this process.
Recommendations
The comprehensive evaluation process provided a substantial amount of data and also served as a learning experience for evaluating future projects more efficiently. Overall, the Pilot Project approach was effective in achieving the goals established in the Bike Plan; City staff now has a better understanding of protected bike lane design and implementation, as well as additional local knowledge regarding public perception of the different bicycle facility designs represented in the Laurel Street Pilot Project. Further, the data surrounding the project itself generally reflected positive trends in terms of bicycle safety and comfort. The evaluation process also highlighted opportunities to improve as the City approaches future
4
projects, specifically in addressing the maintenance of protected bike lanes and the potential tradeoffs associated with implementing projects in constrained corridors.
• The Protected Bike Lane Pilot Program should continue with the implementation of additional pilot projects in other areas of the City as identified in the Bike Plan.
• The Laurel Street Pilot Project is recommended to remain (and be extended in the future) with additional short-term and long-term modifications to improve overall usability and comfort for people wanting to access the corridor and area business on bikes.
• It is important to continue to work the community and key stakeholders to understand what the priority uses and functions of a given corridor are particularly given constrained corridors like Laurel Street. In the case of the Laurel Street Pilot Project, the three-block segment was identified as a key missing connection between existing bike corridors and perceived as an unsafe and challenging section for all users.
• Some modifications are recommended to the original design of the Laurel Street project, including: installing elements that facilitate left turns from the protected bike lanes; adjusting bollard placement to increase the rideable area of protected bike lanes; investigating options to add bike lanes (traditional or buffered) between College Avenue and Remington Street, including converting the parking protected bike lane to a standard bike lane.
• Additional bike racks were identified as a need by some area businesses, which have since been installed. • Continue to explore maintenance solutions, including possibly removing bollards during the winter to facilitate plowing. • Replicate the outreach process for future projects. • Modify evaluation methods in order to ascertain project impacts on ridership over time.
The Laurel Street Pilot Project served as the first of what is intended to be a series of pilot projects, and the evaluation of the overall process of implementing this project offers valuable insight to the planning, design, implementation and maintenance of future projects. The remainder of this document details the evaluation process, specific results, and recommendations for the Pilot Project as well as future projects in more detail.
PILOT PROJECT OVERVIEW/BACKGROUND
2014 BICYCLE MASTER PLAN
The City of Fort Collins’ 2014 Bicycle Master Plan (Bike Plan) envisions a world-class network of bicycling facilities with the goal of achieving 20 percent bicycle mode share by 2020 and fewer bicycle crashes. The Bike Plan recommends a 2020 low-stress bicycling network, in addition to other programs, to achieve this vision. The low-stress network leverages existing low-volume and low-speed streets, and proposes protected bike lanes on higher-volume, higher-speed streets in order to complete key connections. Protected bike lanes have shown positive safety and ridership results in other communities, and are commonly identified as a preferred facility type for the Interested but Concerned rider1. These cyclists (estimated to be ~50-60% of an average population) are more likely to adopt regular cycling routines when facilities exist that they perceive as safe, comfortable and offer increased separation between bicycle facilities and the vehicle travel lane. Encouraging Interested but Concerned riders is a key strategy to increase overall bicycle ridership for the City of Fort Collins.
PROTECTED BIKE LANE PILOT PROGRAM 1 http://trec.pdx.edu/research/project/583/Lessons_from_the_Green_Lanes:_Evaluating_Protected_Bike_Lanes_in_the_U.S._

5
The Bike Plan recommended initial implementation of protected bike lanes through a strategic Pilot Program. The Protected Bike Lane Pilot Program was proposed to allow a phased implementation of protected bicycle facilities throughout Fort Collins, and to create a Best Practice approach for the planning, outreach, design, implementation, maintenance, and evaluation of this unique facility in Fort Collins. The Bike Plan proposed implementation of several protected bike lane pilot projects to evaluate different designs in different contexts, with the goal of creating an updated protected bike lane network plan in 2020 based on experience through this Pilot Program.
KAISER PERMANENTE WALK AND WHEEL GRANT
In 2015, the City was awarded a grant from Kaiser Permanente’s Walk and Wheel program to support the implementation of the City’s first protected bike lane pilot project. Technical assistance from a Denver-based consulting firm was also included in the award, which was utilized during the design and evaluation phases of the Pilot Project. Additional public funds were also utilized in the implementation and maintenance of the project.
LAUREL STREET PROJECT SITE SELECTION AND GOALS
Prior to applying for an award from the Walk and Wheel program, several possible sites for the City’s first protected bike lane pilot project were reviewed and project-specific goals were set. Based on several criteria, Laurel Street between Howes and Remington streets was selected as the project location. This stretch of Laurel Street represented a key gap in the city’s bikeway network, and the intersection of Laurel Street and S College Ave represented a high bicycle crash location, with nine bicycle-related crashes occurring between 2011 and June 2015. In addition, the corridor serves as a key connection between two popular bike routes: the recently completed Remington Greenway and the Mason Trail/Mason St. These routes parallel College Ave and connect riders to important destinations, directly and indirectly, such as Old Town, Colorado State University (CSU), and Campus West/W Elizabeth Street via CSU.
Why Laurel Street?
• The three-block stretch was identified as a priority location for improvements in the Bike Plan. • Laurel Street is a high-use bicycle corridor. • Laurel St, between Howes and Remington streets, lacked dedicated, connected bicycle infrastructure. • Segments of Laurel Street were rated as “high-stress” for bicycling due to high traffic volumes and no bicycle
facilities as measured by the Bike Plan Level of Traffic Stress analysis. • A relatively high number of bicycle-related crashes had been documented along the corridor. • The corridor is an important connection to CSU, MAX bus rapid transit system, Mason Trail, Remington
Greenway and local businesses.
Laurel Street Pilot Project Goals:
• Improve safety and comfort for people bicycling along Laurel St. • Complete a key gap in the city’s bikeway network. • Increase bicycle ridership along the Laurel Street corridor. • Demonstrate and evaluate new bicycle infrastructure. • Evaluate new maintenance strategies. • Evaluate impacts of the project to all corridor users and area businesses. • Contribute to the development of a Best Practice model for implementation and evaluation of future protected
bike lane projects in Fort Collins.

6
PROJECT DESIGN
Protected bicycling facilities can be important additions to Fort Collins’ bicycling network and have been implemented in communities across the world. National best practices, including guidelines from Federal Highway Administration (FHWA) and National Association of City Transportation Officials (NACTO), along with local guidelines and standards (Fort Collins Street Standards, Bike Plan, Colorado Department of Transportation), have endorsed the use of protected bike lanes. The Laurel Street Pilot Project served as the first of several protected bike lane pilot projects intended to develop a context-appropriate approach to this new-to-Fort Collins type of infrastructure.
The Laurel Street Pilot Project was designed to address the following challenges:
• Lacking bike lanes or bike lanes that started mid-block. • High percentage of people bicycling on the sidewalk. • Level of bicycle stress (3-5) on a 1-5 (5=high stress) range (measured by Bike Plan Level of Traffic Stress
analysis). • Relatively high bicycle crash location at College Ave and Laurel Street. • Insufficient curb-to-curb width to maintain all parking and travel lanes with the addition of dedicated bicycle
infrastructure
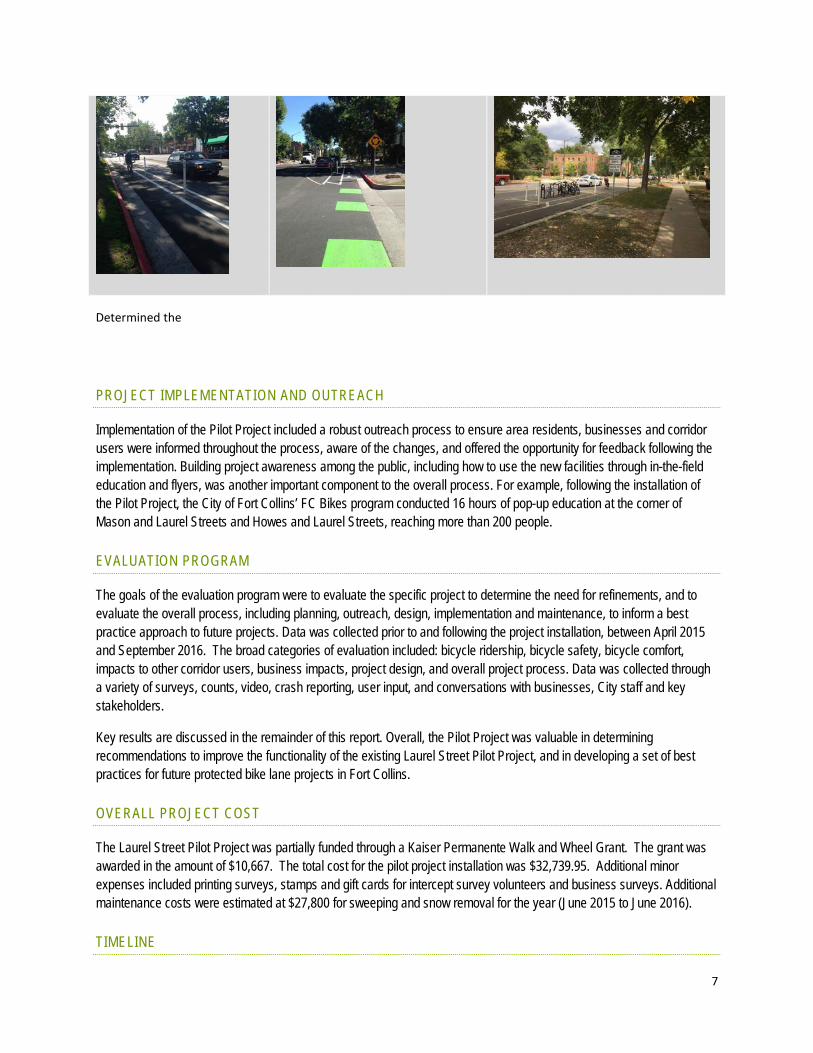
The three-block Pilot Project design incorporated bollard-protected bike lanes, parking-protected bike lanes, a bike box, and “sharrows” to fit the context and constraints of the corridor.
Table 1: Pilot Project Design Treatments Shared Lane Markings: WB Laurel between Remington Street and Mason St.
Bike Box: EB Laurel at the intersection of College Ave.
Parking Protected Bike Lane: EB Laurel between College Avenue and Remington Street.
Bollard-protected Bike Lane: WB Laurel between Mason Street and Howes Street. EB Laurel between Howes and College Avenue.
Green paint: Conflict zones – right turn merge, EB Laurel at College Ave, and EB Laurel between College Ave and Remington at the alley.
On-street Bike Corral EB Laurel, parking protected bike lane near roundabout.
7
Determined the
PROJECT IMPLEMENTATION AND OUTREACH
Implementation of the Pilot Project included a robust outreach process to ensure area residents, businesses and corridor users were informed throughout the process, aware of the changes, and offered the opportunity for feedback following the implementation. Building project awareness among the public, including how to use the new facilities through in-the-field education and flyers, was another important component to the overall process. For example, following the installation of the Pilot Project, the City of Fort Collins’ FC Bikes program conducted 16 hours of pop-up education at the corner of Mason and Laurel Streets and Howes and Laurel Streets, reaching more than 200 people.
EVALUATION PROGRAM
The goals of the evaluation program were to evaluate the specific project to determine the need for refinements, and to evaluate the overall process, including planning, outreach, design, implementation and maintenance, to inform a best practice approach to future projects. Data was collected prior to and following the project installation, between April 2015 and September 2016. The broad categories of evaluation included: bicycle ridership, bicycle safety, bicycle comfort, impacts to other corridor users, business impacts, project design, and overall project process. Data was collected through a variety of surveys, counts, video, crash reporting, user input, and conversations with businesses, City staff and key stakeholders.
Key results are discussed in the remainder of this report. Overall, the Pilot Project was valuable in determining recommendations to improve the functionality of the existing Laurel Street Pilot Project, and in developing a set of best practices for future protected bike lane projects in Fort Collins.
OVERALL PROJECT COST
The Laurel Street Pilot Project was partially funded through a Kaiser Permanente Walk and Wheel Grant. The grant was awarded in the amount of $10,667. The total cost for the pilot project installation was $32,739.95. Additional minor expenses included printing surveys, stamps and gift cards for intercept survey volunteers and business surveys. Additional maintenance costs were estimated at $27,800 for sweeping and snow removal for the year (June 2015 to June 2016).
TIMELINE
8
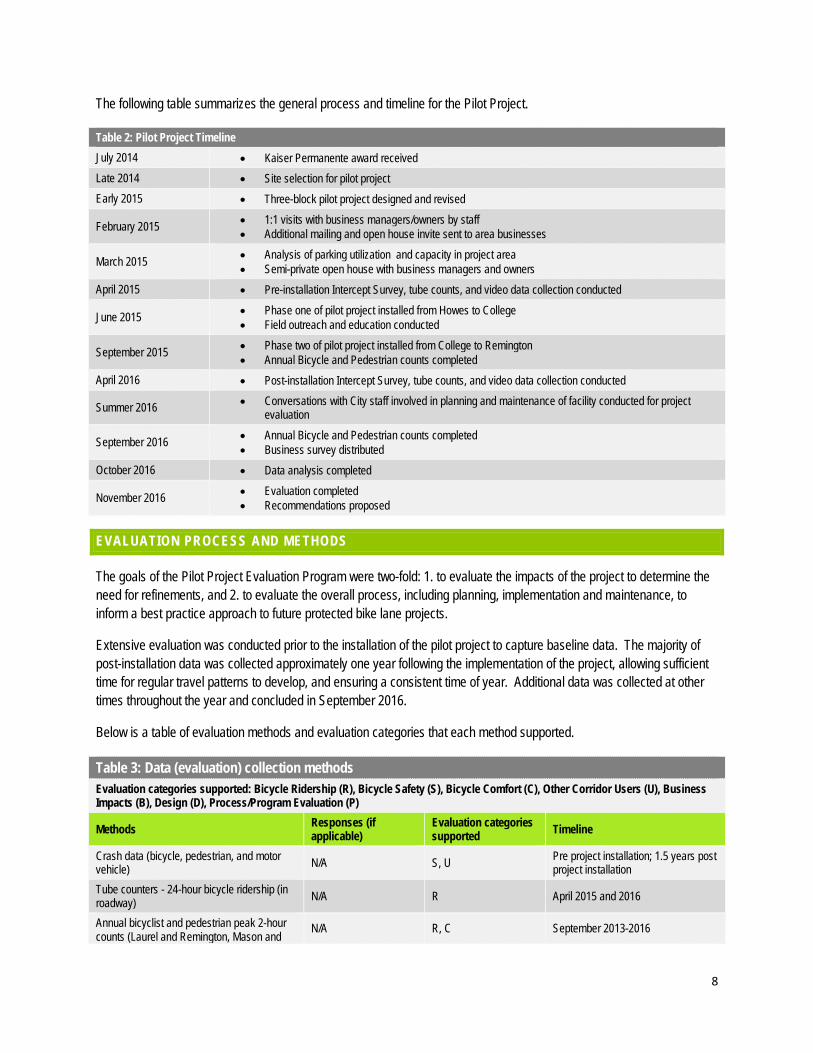
The following table summarizes the general process and timeline for the Pilot Project.
Table 2: Pilot Project Timeline July 2014 • Kaiser Permanente award received Late 2014 • Site selection for pilot project Early 2015 • Three-block pilot project designed and revised
February 2015 • 1:1 visits with business managers/owners by staff • Additional mailing and open house invite sent to area businesses
March 2015 • Analysis of parking utilization and capacity in project area • Semi-private open house with business managers and owners
April 2015 • Pre-installation Intercept Survey, tube counts, and video data collection conducted
June 2015 • Phase one of pilot project installed from Howes to College • Field outreach and education conducted
September 2015 • Phase two of pilot project installed from College to Remington • Annual Bicycle and Pedestrian counts completed
April 2016 • Post-installation Intercept Survey, tube counts, and video data collection conducted
Summer 2016 • Conversations with City staff involved in planning and maintenance of facility conducted for project evaluation
September 2016 • Annual Bicycle and Pedestrian counts completed • Business survey distributed
October 2016 • Data analysis completed
November 2016 • Evaluation completed • Recommendations proposed
EVALUATION PROCESS AND METHODS
The goals of the Pilot Project Evaluation Program were two-fold: 1. to evaluate the impacts of the project to determine the need for refinements, and 2. to evaluate the overall process, including planning, implementation and maintenance, to inform a best practice approach to future protected bike lane projects.
Extensive evaluation was conducted prior to the installation of the pilot project to capture baseline data. The majority of post-installation data was collected approximately one year following the implementation of the project, allowing sufficient time for regular travel patterns to develop, and ensuring a consistent time of year. Additional data was collected at other times throughout the year and concluded in September 2016.
Below is a table of evaluation methods and evaluation categories that each method supported.
Table 3: Data (evaluation) collection methods Evaluation categories supported: Bicycle Ridership (R), Bicycle Safety (S), Bicycle Comfort (C), Other Corridor Users (U), Business Impacts (B), Design (D), Process/Program Evaluation (P)
Methods Responses (if applicable)
Evaluation categories supported Timeline
Crash data (bicycle, pedestrian, and motor vehicle) N/A S, U Pre project installation; 1.5 years post
project installation Tube counters - 24-hour bicycle ridership (in roadway) N/A R April 2015 and 2016
Annual bicyclist and pedestrian peak 2-hour counts (Laurel and Remington, Mason and
N/A R, C September 2013-2016

9
Laurel) – captures direction of travel, gender, mode, helmet use) Traffic Operations Signalized Intersection Counts (peak hour, mode, sidewalk use) N/A S, C, R Various
Pre and Post Intercept Survey Pre – 165 Post - 148 R, S, C, U April 2015 and 2016
Online User Survey 55 D, R, S, C June 2015-Sept. 2016 Field education user survey 111 R, S, C June 2016 Video data (captured east of College Ave) N/A R, S, C, D April 2015 and 2016 Business input survey 2 B, D, P September 2016 Parking utilization snapshots N/A B, D, P March 2014 and February 2017 City staff input N/A D, P September 2016 Level of Traffic Stress analysis N/A C Pre and Post analysis Staff observations N/A S, D, P Throughout
The table below describes each measure of the Evaluation Program and how they relate to overall evaluation categories and goals.
Table 4: Evaluation methods and goals Goal Measure Method(s)
Bicycle ridership
Total Ridership
• Tube counters • Annual bicyclist and pedestrian counts • Traffic Operations Signalized Intersection Counts • Business input survey • Video data
Gender • Annual bicyclist and pedestrian counts Helmet Use • Annual bicyclist and pedestrian counts
Route preference • Intercept Surveys • Online User Survey
Observations • Business input survey
Bicycle safety
Sidewalk use • Video data • Traffic Operations Signalized Intersection Counts • Intercept Survey
Crash data • Traffic operations data (Howes to Remington)
Perception of safety • Intercept Survey • Field outreach input • Online User Survey
Bicycle network completion • Completion of infrastructure gaps
Observations • City staff input • Business input survey
Bicycle comfort
Level of Traffic Stress (LTS) analysis • Bicycle Master Plan LTS tool
Perception of comfort • Intercept Survey • Field outreach input • Online user survey
Sidewalk Use • Video data • Traffic Operations Signalized Intersection Counts • Intercept Survey
Business Business feedback • Business input survey & conversations

10
impacts Change in corridor businesses • Observations Parking utilization & capacity • Utilization and capacity snapshots through direct observation
Other corridor users
Perceptions/ease of access
• • Intercept surveys
Sidewalk use (bicyclists) • Video data • Traffic Operations Signalized Intersection Counts • Intercept Survey
Process Evaluation
Planning & Design
• City staff input/observations • Business input survey • Intercept Survey • Online User Survey
Outreach • City staff input Implementation • City staff input Education • City staff input
Maintenance • City staff input • Observations • Cost recordkeeping
Evaluation program • City staff input
KEY FINDINGS
The following section summarizes the primary results from the evaluation program. It should be noted that, particularly with the ridership data, pre and post data collection conditions varied, and therefore data should be considered within this context. Additional data collection is recommended to continue to track trends especially in terms of ridership and safety.
BICYCLE RIDERSHIP
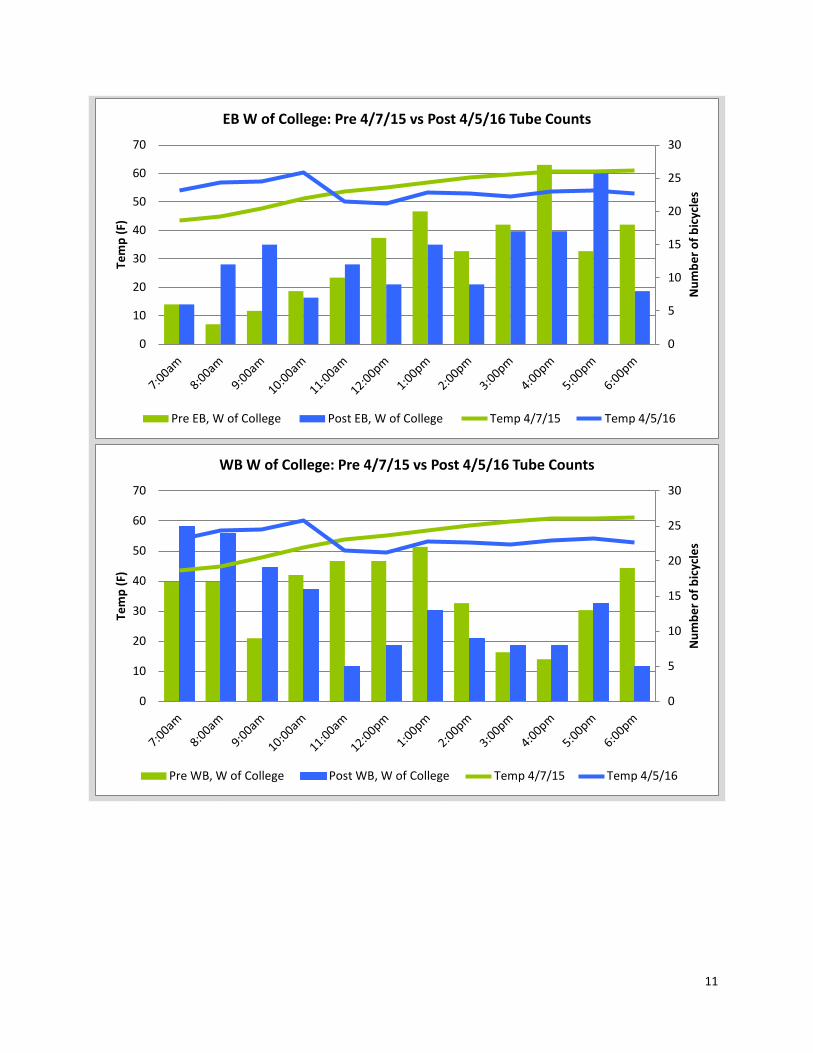
Table 5: Total Ridership
• City goal to increase overall ridership through implementation of low-stress bicycling corridors. • Data collected through tube counts, validated through video data, annual bicyclist and pedestrian counts, and Traffic
Operations Signalized Intersection Counts. • Summary: Results varied significantly – in some cases the data showed an increase in ridership; in other cases it showed
a decrease. Given the wide variation in these numbers and inconsistent weather patterns, it’s difficult to draw definitive conclusions about the impact of the project on bicycle ridership.
• Recommendation: continue to monitor ridership trends over the next couple years and increase frequency of data collection to temper the effect that weather or events may have on daily ridership.
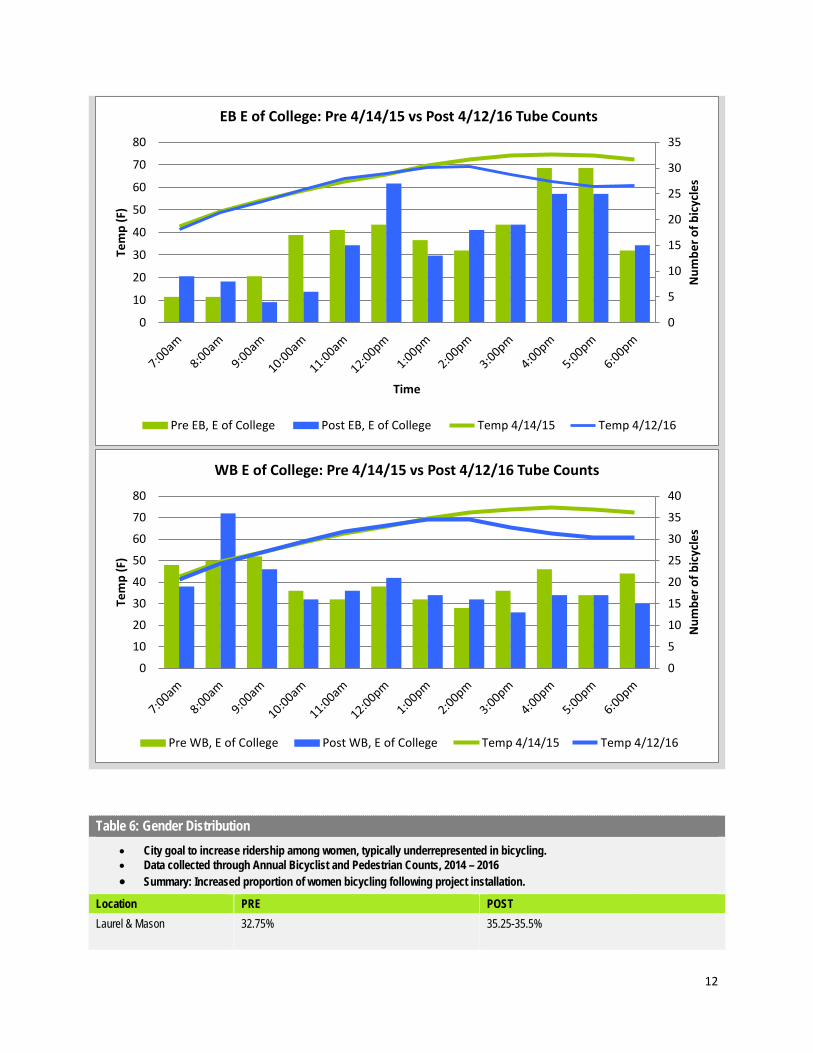
• The following charts provides a snapshot of the tube count results.
11
0
5
10
15
20
25
30
0
10
20
30
40
50
60
70
Num
ber o
f bic
ycle
s
Tem
p (F
) EB W of College: Pre 4/7/15 vs Post 4/5/16 Tube Counts
Pre EB, W of College Post EB, W of College Temp 4/7/15 Temp 4/5/16
0
5
10
15
20
25
30
0
10
20
30
40
50
60
70
Num
ber o
f bic
ycle
s
Tem
p (F
)
WB W of College: Pre 4/7/15 vs Post 4/5/16 Tube Counts
Pre WB, W of College Post WB, W of College Temp 4/7/15 Temp 4/5/16
12
Table 6: Gender Distribution • City goal to increase ridership among women, typically underrepresented in bicycling. • Data collected through Annual Bicyclist and Pedestrian Counts, 2014 – 2016 • Summary: Increased proportion of women bicycling following project installation.
Location PRE POST Laurel & Mason
32.75%
35.25-35.5%
0
5
10
15
20
25
30
35
0
10
20
30
40
50
60
70
80
Num
ber o
f bic
ycle
s
Tem
p (F
)
Time
EB E of College: Pre 4/14/15 vs Post 4/12/16 Tube Counts
Pre EB, E of College Post EB, E of College Temp 4/14/15 Temp 4/12/16
0
5
10
15
20
25
30
35
40
0
10
20
30
40
50
60
70
80
Num
ber o
f bic
ycle
s
Tem
p (F
)
WB E of College: Pre 4/14/15 vs Post 4/12/16 Tube Counts
Pre WB, E of College Post WB, E of College Temp 4/14/15 Temp 4/12/16
13
Laurel & Remington 36.25%
41.25%
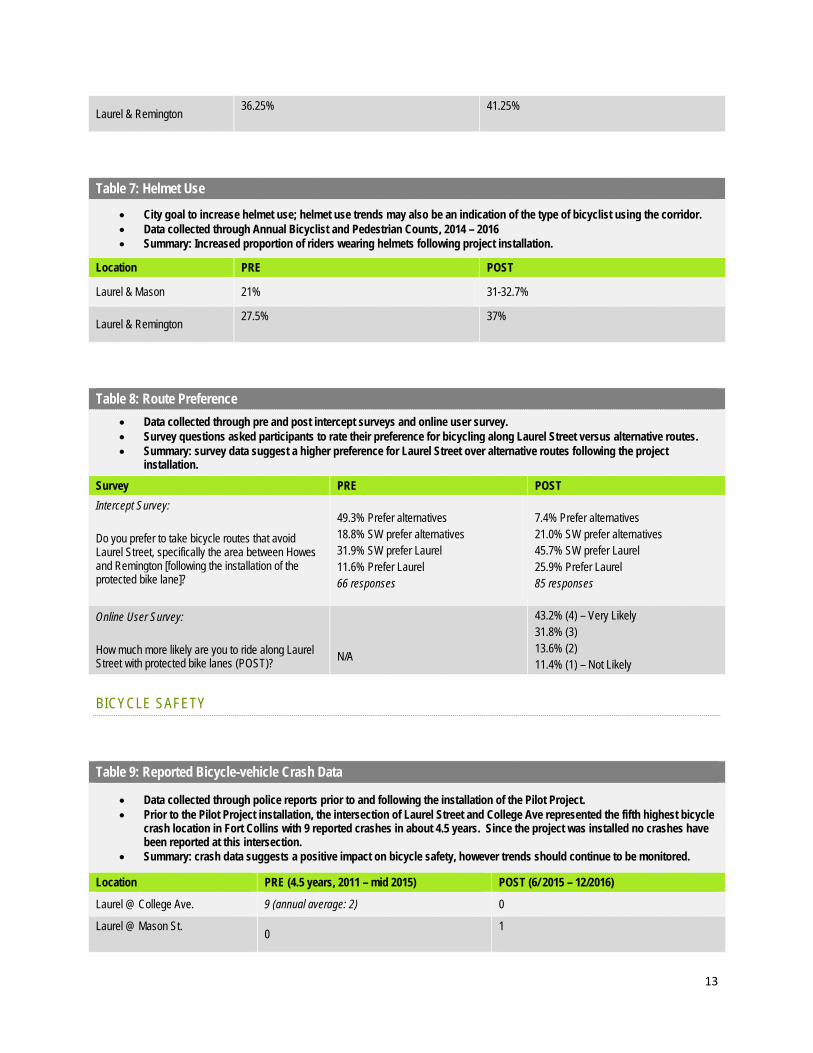
Table 7: Helmet Use
• City goal to increase helmet use; helmet use trends may also be an indication of the type of bicyclist using the corridor. • Data collected through Annual Bicyclist and Pedestrian Counts, 2014 – 2016 • Summary: Increased proportion of riders wearing helmets following project installation.
Location PRE POST
Laurel & Mason 21% 31-32.7%
Laurel & Remington 27.5%
37%
Table 8: Route Preference • Data collected through pre and post intercept surveys and online user survey. • Survey questions asked participants to rate their preference for bicycling along Laurel Street versus alternative routes. • Summary: survey data suggest a higher preference for Laurel Street over alternative routes following the project
installation. Survey PRE POST Intercept Survey: Do you prefer to take bicycle routes that avoid Laurel Street, specifically the area between Howes and Remington [following the installation of the protected bike lane]?
49.3% Prefer alternatives 18.8% SW prefer alternatives 31.9% SW prefer Laurel 11.6% Prefer Laurel 66 responses
7.4% Prefer alternatives 21.0% SW prefer alternatives 45.7% SW prefer Laurel 25.9% Prefer Laurel 85 responses
Online User Survey: How much more likely are you to ride along Laurel Street with protected bike lanes (POST)?
N/A
43.2% (4) – Very Likely 31.8% (3) 13.6% (2) 11.4% (1) – Not Likely
BICYCLE SAFETY
Table 9: Reported Bicycle-vehicle Crash Data
• Data collected through police reports prior to and following the installation of the Pilot Project. • Prior to the Pilot Project installation, the intersection of Laurel Street and College Ave represented the fifth highest bicycle
crash location in Fort Collins with 9 reported crashes in about 4.5 years. Since the project was installed no crashes have been reported at this intersection.
• Summary: crash data suggests a positive impact on bicycle safety, however trends should continue to be monitored.
Location PRE (4.5 years, 2011 – mid 2015) POST (6/ 2015 – 12/2016)
Laurel @ College Ave. 9 (annual average: 2) 0
Laurel @ Mason St. 0 1

14
Laurel @ Howes St. 4 (annual average: .9) 2 (annual average: 1.3)
Mid-block: Howes to College 0 0
Laurel @ Remington 0 0
Mid-block: College to Remington 0 0
Table 10: Bicycling on the Sidewalk • Data collected through Traffic Operations Signalized Intersection Counts, video data, and intercept surveys. • Sidewalk riding is one of the top bicycle crash factors in Fort Collins; the percentage of bicyclists using the sidewalk
versus the street was used as a metric for evaluating the safety of the Pilot Project. • Summary: data suggest a reduction in the percentage of people bicycling on the sidewalk versus the street or bicycling
facilities. Method PRE POST Video data collected pre and post, east of College Ave, % of bicyclists on sidewalk.
WB: 22.3% EB: 32.4%
WB: 11.4% EB: 10.6%
Traffic Operations Signalized Intersection Counts, % of bicyclists using crosswalks (indicator of sidewalk use).
Laurel & College: 5/1/2012-61.3% 9/5/13-57% Laurel & Mason: 4/23/14-31.1%
Laurel & College: 1/26/16-28% Laurel & Mason: 1/28/2016-21%
Intercept Survey: When riding along Laurel Street, specifically between Howes and Remington, where do you typically ride?
64.9% in the street w/traffic/bike lane 20.8% mix of street and sidewalk 10.4% on sidewalk 3.9% I don’t ride on Laurel Street
92.8% in the street w/traffic/bike lane 4.8% mix of street and sidewalk 1.2% on sidewalk 1.2% I don’t ride on Laurel Street
Table 11: Perception of Safety • Data collected through intercept surveys, online user survey (post project), and field outreach input survey (post project). • Summary: perceptions of safety among people bicycling in the corridor increased following the project installation across
all surveys.
Method PRE POST

15
Intercept Survey
When riding in the street with traffic along Laurel Street, specifically between Howes and Remington, how safe do you feel? 4.5% Very safe 43.9% Somewhat safe 40.9% Somewhat unsafe 10.6% very unsafe
Pertaining to Protected Bike Lane: When riding in the bike lane (not including sharing the lane with traffic), specifically between Howes and Remington, how safe do you feel? 42.2% Very safe 45.8% Somewhat safe 6% somewhat unsafe 6% very unsafe Pertaining to Sharrows: When riding in the street (not including the bike lane) sharing the lane with traffic on Laurel Street, specifically between Howes and Remington, how safe do you feel? 9.5% Very safe 46.4% Somewhat safe 34.5% somewhat unsafe 9.5% very unsafe
Online User Survey NA
When riding along the protected bike lanes, how safe do you feel? 4-point Likert scale used, where 4=Very safe 1=Not safe 52.2% (4) 30.4% (3) 10.9% (2) 6.5% (1)
Field Outreach Input Survey
Before [the project], how safe did you feel?
4% Very safe 44% Somewhat safe 41% Somewhat unsafe 11% Very unsafe
How safe do you feel using the protected bike lane [after the project]?
58% Most safe 40% Safe 2% Unsafe 0% Most unsafe
Table 12: Bicycle Network Completion
• Providing dedicated bicycle infrastructure, particularly in areas with higher traffic volumes, has been shown to increase safety (actual and perceived), and the lack of infrastructure is often identified as the primary impediment to bicycling.
• Summary: the Pilot Project partially completed a critical gap in the City’s low-stress bicycle network along Laurel Street.
Method PRE POST
Completion of bicycle network Pre: 1.5 block faces out of 6 Post: 4 block faces (+2 with shared lane markings) out of 6
BICYCLE COMFORT
16
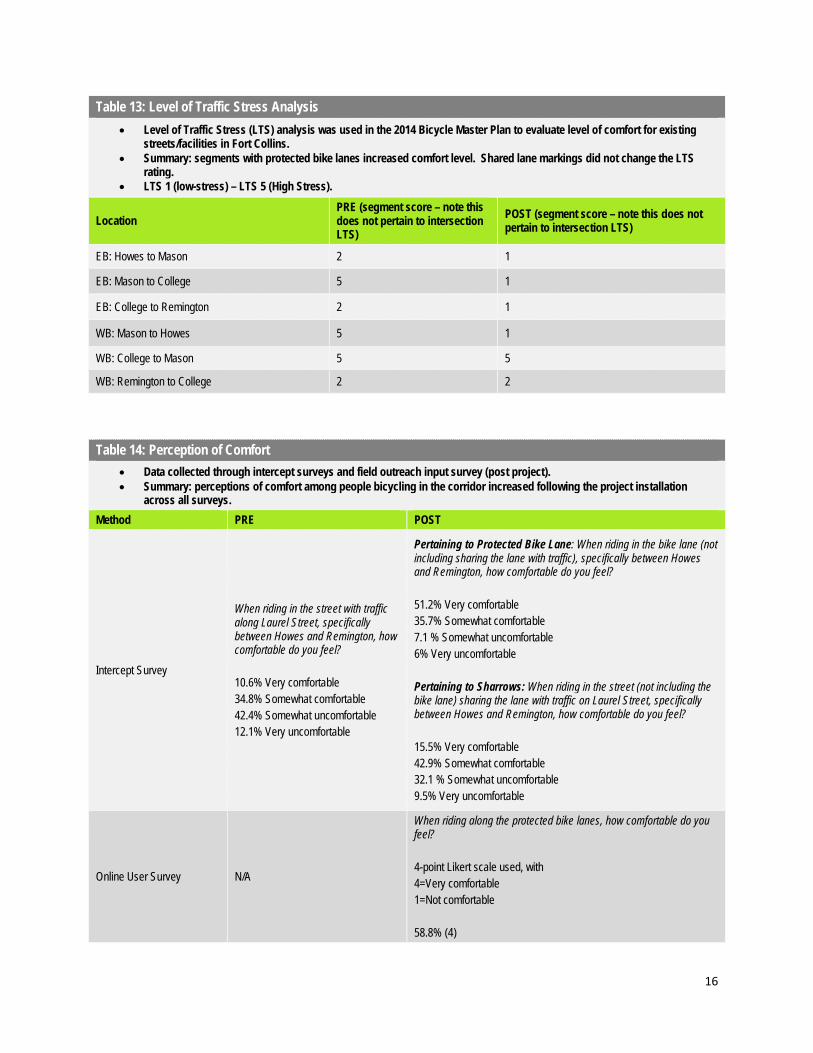
Table 13: Level of Traffic Stress Analysis • Level of Traffic Stress (LTS) analysis was used in the 2014 Bicycle Master Plan to evaluate level of comfort for existing
streets/facilities in Fort Collins. • Summary: segments with protected bike lanes increased comfort level. Shared lane markings did not change the LTS
rating. • LTS 1 (low-stress) – LTS 5 (High Stress).
Location PRE (segment score – note this does not pertain to intersection LTS)
POST (segment score – note this does not pertain to intersection LTS)
EB: Howes to Mason 2 1
EB: Mason to College 5 1
EB: College to Remington 2 1
WB: Mason to Howes 5 1
WB: College to Mason 5 5
WB: Remington to College 2 2
Table 14: Perception of Comfort • Data collected through intercept surveys and field outreach input survey (post project). • Summary: perceptions of comfort among people bicycling in the corridor increased following the project installation
across all surveys. Method PRE POST
Intercept Survey
When riding in the street with traffic along Laurel Street, specifically between Howes and Remington, how comfortable do you feel? 10.6% Very comfortable 34.8% Somewhat comfortable 42.4% Somewhat uncomfortable 12.1% Very uncomfortable
Pertaining to Protected Bike Lane: When riding in the bike lane (not including sharing the lane with traffic), specifically between Howes and Remington, how comfortable do you feel? 51.2% Very comfortable 35.7% Somewhat comfortable 7.1 % Somewhat uncomfortable 6% Very uncomfortable Pertaining to Sharrows: When riding in the street (not including the bike lane) sharing the lane with traffic on Laurel Street, specifically between Howes and Remington, how comfortable do you feel? 15.5% Very comfortable 42.9% Somewhat comfortable 32.1 % Somewhat uncomfortable 9.5% Very uncomfortable
Online User Survey N/A
When riding along the protected bike lanes, how comfortable do you feel? 4-point Likert scale used, with 4=Very comfortable 1=Not comfortable 58.8% (4)

17
17.6% (3) 11.8% (2) 11.8% (1)
Field Outreach Input Survey
Before [the project], how comfortable did you feel? 11% Very comfortable 34% Somewhat comfortable 43% Somewhat uncomfortable 12% Very uncomfortable
How comfortable do you feel using the protected bike lane [after the project]? 68% Most Comfortable 32% Comfortable 0% Uncomfortable 0% Very uncomfortable
BUSINESS IMPACTS
Table 15: Business Feedback • Information collected through conversations and surveys, as well as general observations. • Mixed feedback among businesses; parking impacts was the primary concern identified.
Method POST
Online/Paper Survey
• 2 survey responses were returned despite door-to-door outreach with a pre-stamped survey. • Survey responses indicated concerns over parking loss and impacts to businesses. One response
identified concerns over safety with the parking protected bike lane design.
In-person conversations • Concerns over parking impacts • Safety concerns specific to the parking protected bike lane (EB between College and Remington) • Some indicated support for changes and that the corridor functions better than before.
Change in Corridor Businesses:
• Used as a measure after confirming sales tax information was not available for the geographic scale of the project. • It does not appear any businesses have closed since the installation of the project.
Table 16: Parking Utilization Snapshots
• Percent of parking spaces utilized was conducted by direct observation by staff. Various days and times were selected to provide a thorough sampling of parking conditions.
• While some types of parking can approach near full utilization during peak times, the overall utilization of parking remains below congested thresholds.
• Open public parking is consistently the highest utilized parking spaces, while customer only parking spaces remain the least utilized when excluding CSU permitted spaces.
• The overall capacity of parking in the area has increased slightly with more customer only spaces available. • Average utilization still remains below what is considered congested thresholds. Peak periods generally reflect high
usage. Method PRE POST* Parking Snapshots, percent utilization of type-specific capacity averaged across multiple time periods.
• Public parking: 255/350=73% • On-street parking on Laurel, between
Howes and Remington: 28/46=62% • Customer only parking: 164/275=60% • CSU A permit parking: 35/59=60%
• Public parking: 258/328=78% • On-street parking on Laurel, between
Howes and Remington: 17/24=71% • Customer only parking: 189/301=63% • CSU A permit parking: 41/62=65%
*NOTE: The methodology for post-project parking utilization snapshots included substantially more data points, including peak times. Average utilization calculated to compare directly to pre-project parking utilization follows: Public parking: 81%; On-street on Laurel between Howes and Remington: 72%; Customer only parking: 68%; CSU A permit parking: 68%.

18
OTHER CORRIDOR USERS
Table 17: Impact to Other Corridor Users • Project goal to evaluate the impact of the Pilot Project to other corridor users. Data collected through intercept surveys,
crash data, and sidewalk use data. • Intercept survey sample size was relatively low for non-bicyclists. • Summary: Of survey respondents, a higher proportion of drivers indicated feeling safe and that driving was convenient
following the installation of the project. A higher proportion of pedestrians indicated crossing at crosswalks (vs. mid-block) more frequently following the project installation, and feeling very safe or somewhat safe walking along Laurel. A higher proportion of survey respondents indicated preferring Laurel St. (over alternatives) prior to the project installation.
Method PRE POST
Intercept Survey-Driving When you are driving along Laurel Street, specifically between Howes and Remington, how convenient is the experience? Do you prefer to drive along routes that avoid Laurel Street, specifically the area between Howes and Remington? When you are driving along Laurel, specifically between Howes and Remington, how safe do you feel?
3.8% very convenient 38.5% convenient enough 38.5% not convenient enough 19.2% Not at all convenient 26 Responses 15.4% Prefer alternatives 38.5% SW prefer alternatives 30.8% SW prefer Laurel 15.4% Prefer Laurel 26 responses 11.5% very safe 53.8% SW safe 30.8% SW unsafe 3.8% unsafe 26 responses
15% very convenient 62.5% convenient enough 17.5% not convenient enough 5% Not at all convenient 40 Responses 23.1% Prefer alternatives 30.8% SW prefer alternatives 30.8% SW prefer Laurel 15.4% Prefer Laurel 39 responses 35% very safe 47.5% SW safe 15% SW unsafe 2.5% unsafe 40 responses
Intercept Survey-Walking Do you prefer to walk along routes that avoid Laurel Street, specifically the area between Howes and Remington? I feel safe when walking on the sidewalk along Laurel. I feel safe crossing Laurel
2% Prefer alternatives 20.4% SW prefer alternatives 55% SW prefer Laurel 22.4% prefer Laurel 49 responses 28.6% strongly agree 67.3% agree 4.1% disagree 0% strongly disagree 49 responses
10% Prefer alternatives 15% SW prefer alternatives 65% SW prefer Laurel 10% prefer Laurel 20 responses 30% strongly agree 70% agree 0% disagree 0% strongly disagree 20 responses

19
Street. When you walk along Laurel Street, specifically between Howes and Remington, where do you typically cross the street? There is no right or wrong answer.
22.4% strongly agree 65.3% agree 12.2% disagree 0% strongly disagree 49 responses 61.2% I always cross at crosswalks, it's safer 4.1% I usually cross mid-block, it's most convenient 34.7% Sometimes I cross at crosswalks, but I'll cross mid-block on occasion, too 49 responses
15% strongly agree 70% agree 15% disagree 0% strongly disagree 20 responses 80% I always cross at crosswalks, it's safer 5% I usually cross mid-block, it's most convenient 15% Sometimes I cross at crosswalks, but I'll cross mid-block on occasion, too 20 responses
Sidewalk use (bicyclists) • Rates of bicyclists riding on the sidewalk appear to have decreased, which could be an indicator of improved
pedestrian safety. See data presented in “Bicycle Safety” Table.
PILOT PROJECT DESIGN
Table 18: Pilot Project Design • Bikeway Design - Safety and Function: In addition to the quantitative data collected and described in previous sections,
the Pilot Project design was evaluated through public comments and input from key City staff.
Staff Input
• Parking protected bike lane presents visibility challenges for all users. The concept of a parking protected bike lane is good, however the location between College and Remington may not be the preferred context for this type of facility given the length of the block, roundabout merge, and relatively high-traffic alley. In addition, this section of Laurel Street is relatively low traffic volume, so a buffered bike lane may be a preferred facility, which could also alleviate maintenance costs.
• The location of the bollards in the middle of the buffer could offer additional functional bike lane space if installed toward the outside buffer stripe.
• Left-turn movements from the protected bike lanes appear to be challenging – solutions, such as 2-stage turn boxes, should be considered to alleviate this.
Summary of public comments (open-ended answers, online survey – 55 responses) related to design
• Right-turn merge at College still challenging • Parking protected bike lane has visibility issues, pedestrian conflicts, and is challenging to merge at the
roundabout (many suggested remove/redesign this section) • Bollards make it challenging to turn left, particularly at Mason and Laurel • Concerns with roundabout • Protected bike lanes are too narrow • Westbound at College/Laurel, difficult to merge with traffic (into sharrow condition) from red light. • Paint and bollards is not protecting cyclists • Poles blend in with striping • Would like to see protected bike lanes the whole way (removal of parking); sharrows are not as good as
protected facilities. • Would like something more aesthetic than posts, like concrete median. • Debris collecting in bike lane. • Poles could catch the handlebar of a cyclists, different type of protection.
MAINTENANCE
20
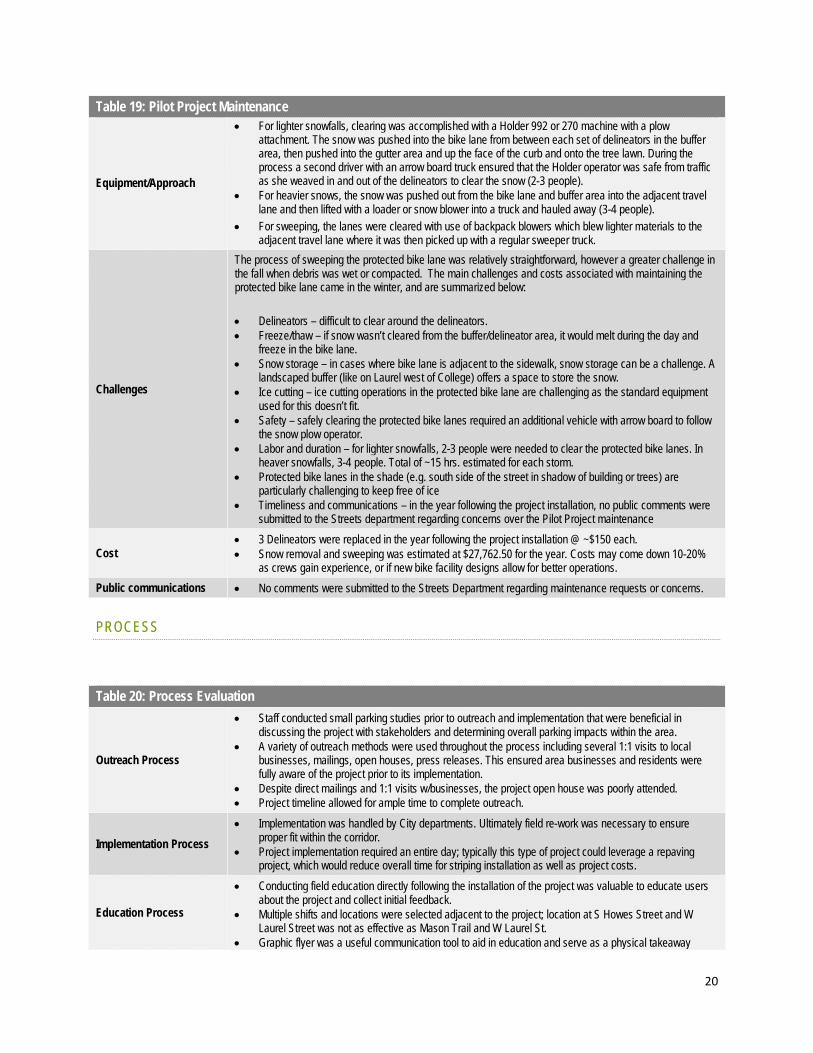
Table 19: Pilot Project Maintenance
Equipment/Approach
• For lighter snowfalls, clearing was accomplished with a Holder 992 or 270 machine with a plow attachment. The snow was pushed into the bike lane from between each set of delineators in the buffer area, then pushed into the gutter area and up the face of the curb and onto the tree lawn. During the process a second driver with an arrow board truck ensured that the Holder operator was safe from traffic as she weaved in and out of the delineators to clear the snow (2-3 people).
• For heavier snows, the snow was pushed out from the bike lane and buffer area into the adjacent travel lane and then lifted with a loader or snow blower into a truck and hauled away (3-4 people).
• For sweeping, the lanes were cleared with use of backpack blowers which blew lighter materials to the adjacent travel lane where it was then picked up with a regular sweeper truck.
Challenges
The process of sweeping the protected bike lane was relatively straightforward, however a greater challenge in the fall when debris was wet or compacted. The main challenges and costs associated with maintaining the protected bike lane came in the winter, and are summarized below: • Delineators – difficult to clear around the delineators. • Freeze/thaw – if snow wasn’t cleared from the buffer/delineator area, it would melt during the day and
freeze in the bike lane. • Snow storage – in cases where bike lane is adjacent to the sidewalk, snow storage can be a challenge. A
landscaped buffer (like on Laurel west of College) offers a space to store the snow. • Ice cutting – ice cutting operations in the protected bike lane are challenging as the standard equipment
used for this doesn’t fit. • Safety – safely clearing the protected bike lanes required an additional vehicle with arrow board to follow
the snow plow operator. • Labor and duration – for lighter snowfalls, 2-3 people were needed to clear the protected bike lanes. In
heaver snowfalls, 3-4 people. Total of ~15 hrs. estimated for each storm. • Protected bike lanes in the shade (e.g. south side of the street in shadow of building or trees) are
particularly challenging to keep free of ice • Timeliness and communications – in the year following the project installation, no public comments were
submitted to the Streets department regarding concerns over the Pilot Project maintenance
Cost • 3 Delineators were replaced in the year following the project installation @ ~$150 each. • Snow removal and sweeping was estimated at $27,762.50 for the year. Costs may come down 10-20%
as crews gain experience, or if new bike facility designs allow for better operations. Public communications • No comments were submitted to the Streets Department regarding maintenance requests or concerns.
PROCESS
Table 20: Process Evaluation
Outreach Process
• Staff conducted small parking studies prior to outreach and implementation that were beneficial in discussing the project with stakeholders and determining overall parking impacts within the area.
• A variety of outreach methods were used throughout the process including several 1:1 visits to local businesses, mailings, open houses, press releases. This ensured area businesses and residents were fully aware of the project prior to its implementation.
• Despite direct mailings and 1:1 visits w/businesses, the project open house was poorly attended. • Project timeline allowed for ample time to complete outreach.
Implementation Process • Implementation was handled by City departments. Ultimately field re-work was necessary to ensure
proper fit within the corridor. • Project implementation required an entire day; typically this type of project could leverage a repaving
project, which would reduce overall time for striping installation as well as project costs.
Education Process
• Conducting field education directly following the installation of the project was valuable to educate users about the project and collect initial feedback.
• Multiple shifts and locations were selected adjacent to the project; location at S Howes Street and W Laurel Street was not as effective as Mason Trail and W Laurel St.
• Graphic flyer was a useful communication tool to aid in education and serve as a physical takeaway

21
during outreach events. • An educational video was also developed to provide information about how to navigate this new
infrastructure. Link: https://www.youtube.com/watch?v=x1RBnvTlMm0
Evaluation Process
• Year-long data collection process was important to allow time to survey/collect data around multiple aspects of the project, for people to become accustom to the changes, and for behaviors to actually change. This however may not be enough time to draw conclusions about safety.
• Year-long evaluation process also delays reporting and implementation of recommendations/project refinements. Stakeholders may also prefer reporting in a more timely fashion.
• For the initial Pilot Project, a robust evaluation program allowed staff to determine which methods were most valuable and adapt the evaluation process to be more focused for future projects.
• Utilizing methods that collect just one day of data, regardless of type, may be impacted by changes in weather.
• Collecting comprehensive feedback from businesses and economic data proved challenging. Other approaches should be researched for future evaluation programs.
RECOMMENDATIONS: LAUREL STREET
Overall, the input received following the Laurel Street Pilot Project was positive. Data regarding safety and comfort, and other metrics related to sidewalk riding and gender of bicyclists using the corridor, indicate positive trends associated with the project.
Recommendations for design changes from the public and stakeholders offer important insight into opportunities to improve this project and the design of future projects.
Several business owners expressed concerns over parking loss prior to the project and following its implementation, and in one case, asked for the removal of the project where it impacted on-street parking. The City is not recommending removal of the bike lanes for following reasons: Laurel Street represents a key connection in the City’s adopted low-stress bicycle network and it is a priority for the City to address deficiencies in this network and improve safety for corridor users; the feedback regarding the project was largely positive; and, the parking analysis showed that, although there are peak times/locations where parking utilization reaches high demand levels, the average parking utilization in the area remains lower than optimal occupancy (as established in the parking plan), particularly in the customer-only parking lots available to many of the businesses The importance of on-street parking, especially near the downtown core, should continue to be a key consideration and component to the evaluation when projects like Laurel Street are being implemented. The City’s capacity and utilization snapshots did not show significant change pre and post; however, it is clear that on-street parking directly in the project area remains in high demand during peak periods. Future project refinements may offer the opportunity to revisit the Laurel St corridor design and explore other solutions to creating a complete street that could open up additional parking possibilities.
Feedback and data regarding the maintenance of the bikeway offer lessons for future projects and opportunities for additional research to determine how costs can be reduced and the process can be more efficient. Maintenance of protected bike lanes remains an area for improvement in particular to bring the costs down, although significant progress has been made over the course of winters 2015 and 2016.
The following section provides recommendations based on the results of this comprehensive evaluation process. These recommendations are divided into the following categories: Laurel Street Pilot Project – near- and longer-term suggestions, and Best Practices for future protected bike lane projects and processes.

22
LAUREL STREET PILOT PROJECT: NEAR-TERM RECOMMENDATIONS [2017-18]
Overall
• Explore opportunities to extend protected bike lane to the west, towards Shields, as recommended in the 2014 Bicycle Master Plan.
Howes to Mason Street
• Facilitate left-turning movements from protected bike lane: o Option: two-stage left turn boxes at Mason and Laurel, and
Howes and Laurel o Option: bike box at top of intersection of NB Mason Street to
avoid conflict with SB bicyclists navigating to Mason Trail. Bike box would support NB Mason Trail users as well as left turning movements from EB Laurel Street to NB Mason St.
o Option: evaluate bollard proximity to intersection – remove additional bollard if appropriate to improve left-turn movements.
• Adjust bollard location to outside line of buffer to increase rideable area, particularly in the WB lane.
• Mason and Laurel intersection: o Provide pavement markings (bike dots) and/or sign to guide NB cyclists into shared lane/bus loading zone
from Mason Trail. o Consider the use of a pedestrian leading interval to facilitate NB cyclists accessing Mason Street from the
trail.
Mason Street to College Avenue
• Continue to monitor EB bike lane merge to assess compliance and functionality. Utilize video data if possible. • Adjust bollard location to outside line of buffer to increase rideable area.
College Avenue to Remington Street
• Convert EB parking protected bike lane to traditional bike lane (or buffered bike lane depending on space availability). • Evaluate space availability to provide WB bike lane in conjunction with bike box at intersection of College and Laurel.
Maintenance
• Pilot the removal of bollards during the winter in one section of the corridor to evaluate pros and cons in terms of cost, timeliness of snow removal, and impacts to ridership.
Evaluation
• Continue to evaluate ridership through automated and manual counts to measure ridership trends over time.
Figure 1: example of a two-stage turn box
23
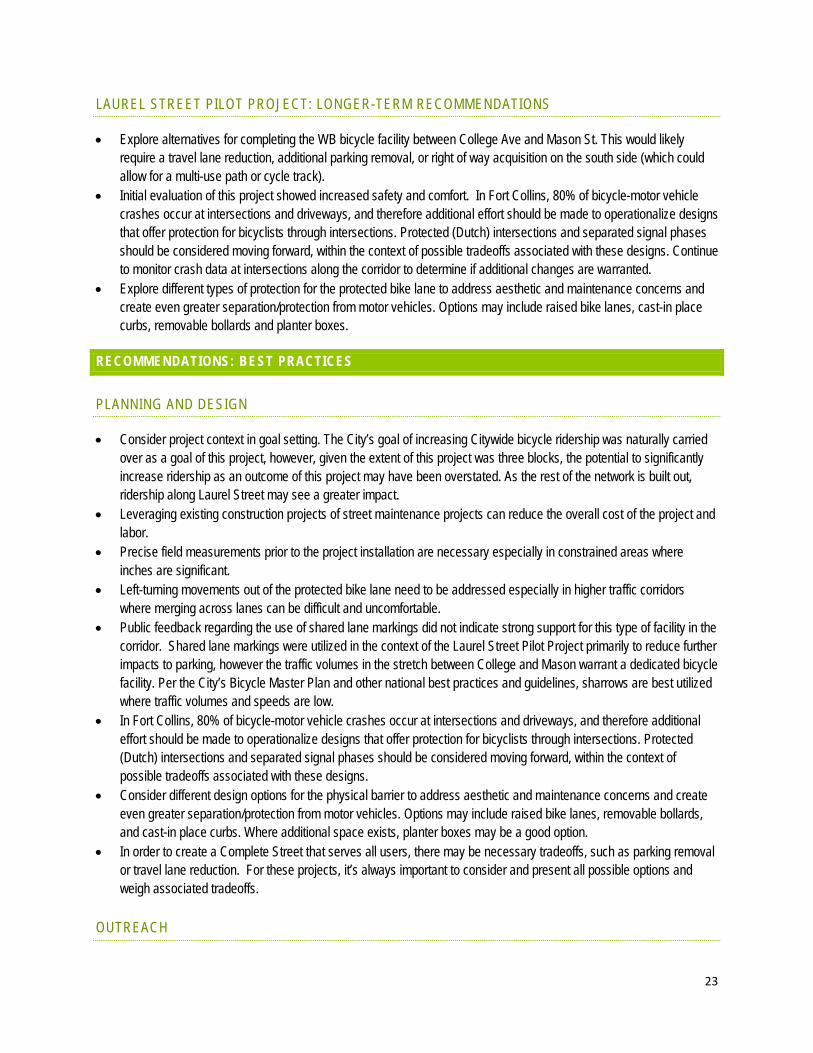
LAUREL STREET PILOT PROJECT: LONGER-TERM RECOMMENDATIONS
• Explore alternatives for completing the WB bicycle facility between College Ave and Mason St. This would likely require a travel lane reduction, additional parking removal, or right of way acquisition on the south side (which could allow for a multi-use path or cycle track).
• Initial evaluation of this project showed increased safety and comfort. In Fort Collins, 80% of bicycle-motor vehicle crashes occur at intersections and driveways, and therefore additional effort should be made to operationalize designs that offer protection for bicyclists through intersections. Protected (Dutch) intersections and separated signal phases should be considered moving forward, within the context of possible tradeoffs associated with these designs. Continue to monitor crash data at intersections along the corridor to determine if additional changes are warranted.
• Explore different types of protection for the protected bike lane to address aesthetic and maintenance concerns and create even greater separation/protection from motor vehicles. Options may include raised bike lanes, cast-in place curbs, removable bollards and planter boxes.
RECOMMENDATIONS: BEST PRACTICES
PLANNING AND DESIGN
• Consider project context in goal setting. The City’s goal of increasing Citywide bicycle ridership was naturally carried over as a goal of this project, however, given the extent of this project was three blocks, the potential to significantly increase ridership as an outcome of this project may have been overstated. As the rest of the network is built out, ridership along Laurel Street may see a greater impact.
• Leveraging existing construction projects of street maintenance projects can reduce the overall cost of the project and labor.
• Precise field measurements prior to the project installation are necessary especially in constrained areas where inches are significant.
• Left-turning movements out of the protected bike lane need to be addressed especially in higher traffic corridors where merging across lanes can be difficult and uncomfortable.
• Public feedback regarding the use of shared lane markings did not indicate strong support for this type of facility in the corridor. Shared lane markings were utilized in the context of the Laurel Street Pilot Project primarily to reduce further impacts to parking, however the traffic volumes in the stretch between College and Mason warrant a dedicated bicycle facility. Per the City’s Bicycle Master Plan and other national best practices and guidelines, sharrows are best utilized where traffic volumes and speeds are low.
• In Fort Collins, 80% of bicycle-motor vehicle crashes occur at intersections and driveways, and therefore additional effort should be made to operationalize designs that offer protection for bicyclists through intersections. Protected (Dutch) intersections and separated signal phases should be considered moving forward, within the context of possible tradeoffs associated with these designs.
• Consider different design options for the physical barrier to address aesthetic and maintenance concerns and create even greater separation/protection from motor vehicles. Options may include raised bike lanes, removable bollards, and cast-in place curbs. Where additional space exists, planter boxes may be a good option.
• In order to create a Complete Street that serves all users, there may be necessary tradeoffs, such as parking removal or travel lane reduction. For these projects, it’s always important to consider and present all possible options and weigh associated tradeoffs.
OUTREACH
24
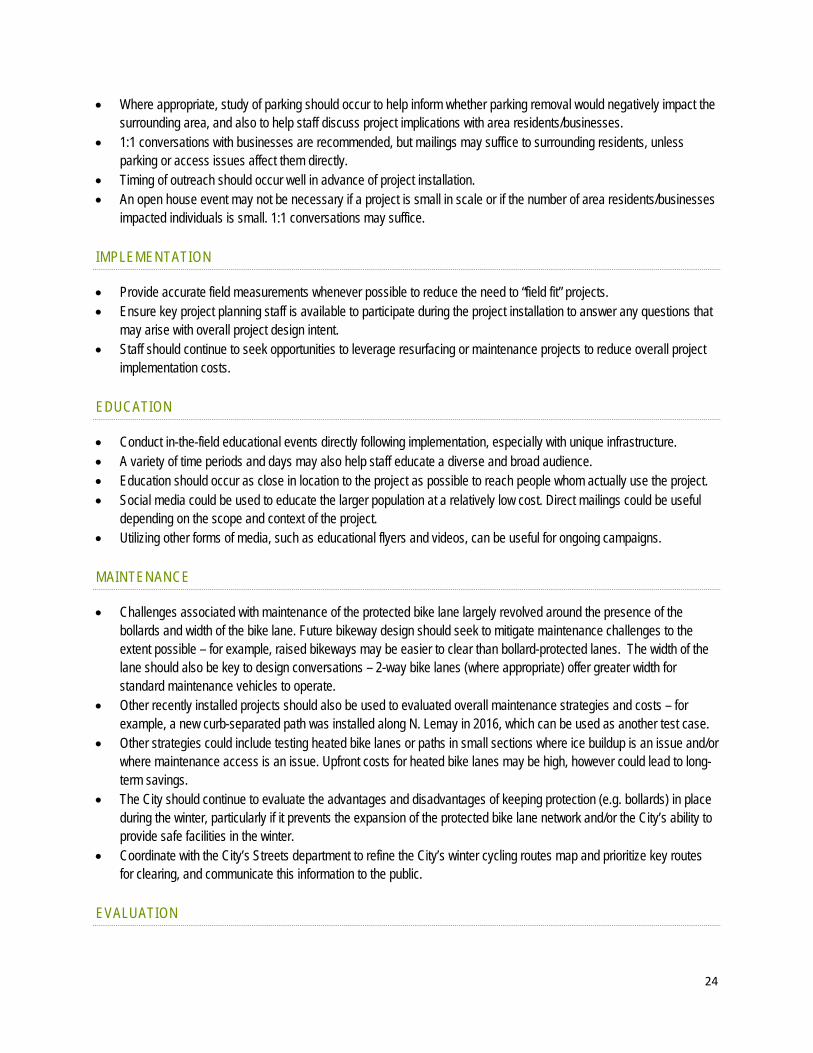
• Where appropriate, study of parking should occur to help inform whether parking removal would negatively impact the surrounding area, and also to help staff discuss project implications with area residents/businesses.
• 1:1 conversations with businesses are recommended, but mailings may suffice to surrounding residents, unless parking or access issues affect them directly.
• Timing of outreach should occur well in advance of project installation. • An open house event may not be necessary if a project is small in scale or if the number of area residents/businesses
impacted individuals is small. 1:1 conversations may suffice.
IMPLEMENTATION
• Provide accurate field measurements whenever possible to reduce the need to “field fit” projects. • Ensure key project planning staff is available to participate during the project installation to answer any questions that
may arise with overall project design intent. • Staff should continue to seek opportunities to leverage resurfacing or maintenance projects to reduce overall project
implementation costs.
EDUCATION
• Conduct in-the-field educational events directly following implementation, especially with unique infrastructure. • A variety of time periods and days may also help staff educate a diverse and broad audience. • Education should occur as close in location to the project as possible to reach people whom actually use the project. • Social media could be used to educate the larger population at a relatively low cost. Direct mailings could be useful
depending on the scope and context of the project. • Utilizing other forms of media, such as educational flyers and videos, can be useful for ongoing campaigns.
MAINTENANCE
• Challenges associated with maintenance of the protected bike lane largely revolved around the presence of the bollards and width of the bike lane. Future bikeway design should seek to mitigate maintenance challenges to the extent possible – for example, raised bikeways may be easier to clear than bollard-protected lanes. The width of the lane should also be key to design conversations – 2-way bike lanes (where appropriate) offer greater width for standard maintenance vehicles to operate.
• Other recently installed projects should also be used to evaluated overall maintenance strategies and costs – for example, a new curb-separated path was installed along N. Lemay in 2016, which can be used as another test case.
• Other strategies could include testing heated bike lanes or paths in small sections where ice buildup is an issue and/or where maintenance access is an issue. Upfront costs for heated bike lanes may be high, however could lead to long-term savings.
• The City should continue to evaluate the advantages and disadvantages of keeping protection (e.g. bollards) in place during the winter, particularly if it prevents the expansion of the protected bike lane network and/or the City’s ability to provide safe facilities in the winter.
• Coordinate with the City’s Streets department to refine the City’s winter cycling routes map and prioritize key routes for clearing, and communicate this information to the public.
EVALUATION
25
• Future Pilot Project evaluation could occur in a shorter timeframe, depending on the scope of the evaluation needs. Three months is a recommended minimum time frame to draw conclusions on impacts to ridership and perceptions of safety and comfort, however this would likely not be sufficient to draw conclusions around actual safety impacts.
• Methods employed should be scheduled over a variety of days and/or weeks to mitigate the issue of seasonal variation.
• While “one-time” surveys can provide useful information following the completion of a project especially as it pertains to design feedback, ensuring pre and post surveys are conducted as well can provide a more accurate comparison of behavior and perception changes.
• Quantitative measures should be used, including: pneumatic tube counters, annual bicycle and pedestrian counts, and video data. If possible, these should be implemented more frequently throughout the year to adjust for seasonable variation.
• When using video data, cameras should be positioned to see as much of the roadway as possible in as many directions as possible.
• Crash data should be compiled and should include several years prior to implementation. Crash data will need to be monitored for several years after installation to fully determine the project impact.
• The scope of the Laurel Street Pilot Project Evaluation and reporting was valuable as the City’s first pilot project, however future pilot project evaluations can be scaled back to focus on key measures.
• Depending on the scope of the project, other measures (e.g., traffic speeds, travel times etc.) that were not part of the Laurel Pilot Project scope may be necessary.
• For the Laurel Street Pilot Project, as well as other initiatives, different approaches have been utilized to collect input from businesses and to evaluate the economic impact of a given project or event. While 1:1 conversations with businesses have offered useful feedback, additional research is necessary to determine the most effective strategies for evaluating economic impact of a given project/program (particularly on a smaller scale).