
Contents · Contents Annual Report 2005 CONTENTS FINANCIAL HIGHLIGHTS (Consolidated) 3 ... success...
66
Transcript of Contents · Contents Annual Report 2005 CONTENTS FINANCIAL HIGHLIGHTS (Consolidated) 3 ... success...


2
A n n u a l R e p o r t 2 0 0 5Contents
CONTENTS
FINANCIAL HIGHLIGHTS (Consolidated) 3
LETTER TO SHAREHOLDERS 4
SUPERVISORY BOARD AND MANAGEMENT BOARD 6
ORGANISATIONAL CHART 6
STANDARD & POOR’S CREDIT RATING 6
BULGARIAN ECONOMY 7
WORLD ECONOMY 10
BULBANK ACTIVITY REVIEW 12
Financial results 12
Balance sheet 13
Risk management 14
Commercial banking 15
Leasing 19
Money market and capital market operations 19
Development 20
Human resources 20
Corporate social responsibility 21
Outlook 21
CONSOLIDATED FINANCIAL STATEMENT 23
Report of independent auditor 24
Consolidated income statement 25
Consolidated balance sheet 26
Consolidated statement of changes in shareholders’ equity 27
Consolidated cash flow statement 28
Notes of the consolidated financial statement for the ended 31 december 2005 29
UNCONSOLIDATED FINANCIAL STATEMENT 53
Report of independent auditor 54
Income statement 55
Balance sheet 56
Statement of changes in shareholders’ equity 57
Cash flow statement 58
GENERAL INFORMATION 59
Basic information for Bulbank 59
Financial highlights for the period 2001 – 2005 60
UniCredit Group 61
Network addresses 62

3
A n n u a l R e p o r t 2 0 0 5 Financia l H ighl ights
FINANCIAL HIGHLIGHTS (Consolidated)
(Thousands of BGN, unless otherwise stated)
2005 2004 Growth
Key figures
Net profit 96,116 86,279 11.4%
Shareholders' equity (eop) 609,609 574,112 6.2%
Total assets (eop) 3,474,829 3,614,696 –3.9%
Bank customer deposits (eop) 2,618,771 2,917,169 –10.2%
Bank customer deposits (av.) 2,469,957 2,340,521 5.5%
Bank customer loans (eop) 1,706,858 1,393,968 22.4%
Bank customer loans (av.) 1,595,642 1,068,020 49.4%
Leasing Portfolio (eop) 80,729 25,342 218.6%
Earnings per share (in BGN) 0.58 0.52 11.4%
Income
Net interest income 162,850 134,502 21.1%
Net fee and commission income 44,657 39,758 12.3%
Net trading income 11,615 4,318 169.0%
Gains less losses from investment securities 3,090 7,042 –56.1%
Gross operating income 228,589 198,470 15.2%
Net operating Income 138,808 114,384 21.4%
Expenses
Operating expenses 89,781 84,086 6.8%
Staff costs 33,266 30,319 9.7%
Non-staff costs 39,742 40,460 –2.0%
Depreciation 16,773 13,307 26.0%
Impairment losses and provisions 25,443 7,719 229.6%
Income tax expense 17,249 20,386 –15.4%
Ratios (%)
Return on average assets (ROA) 2.9 2.8 0.1pp
Return on average equity (ROE) 16.3 15.7 0.6pp
Capital/Asset ratio (eop) 17.5 15.9 1.7pp
Total capital ratio (eop) 21.6 23.3 –1.7pp
Tier 1 capital ratio (eop) 18.8 20.4 –1.6pp
Risk weighted assets/Total assets ratio (eop) 61.5 53.0 8.5pp
Non-performing loans/Gross loans 1.6 2.4 –0.8pp
Loan/Deposit ratio 65.2 47.8 17.4pp
Cost/Income ratio 39.3 42.4 –3.1pp
Resources (number) – (eop)
Bank Operating outlets 105 94 11
Leasing Outlets 4 1 3
Employees 1,897 1,760 137
Sales-force 462 426 36
Foreign exchange rate at period-end (BGN/USD) 1.6579 1.4359 15.5%
Average annual exchange rate over the period (USD/BGN) 1.5741 1.5751 –0.1%

4
A n n u a l R e p o r t 2 0 0 5Letter to Shareholders
LETTER TO SHAREHOLDERS
Ladies and Gentlemen,
It is our pleasure to present our 2005 annual accounts and development plans.
We proudly report a very successful year with earnings pershare reaching a five-year-high of BGN 0.58, up 11.4%compared to 2004. Even more important, all the focusedefforts and investments over the past few years havedelivered solid risk-adjusted revenue generation capacity,thus creating sustainable value to the shareholders.
The Bulgarian economy expanded in 2005 by an estima-ted 5.5% in real terms. The banking sector experiencedanother year of rapid growth, reporting some 30%increase in volumes. Aiming at limiting the current accountdeficit, the Central Bank introduced a series of lendingrestrictions, which had a tangible negative effect on mostbanks but a marginal impact on Bulbank. The risks inher-ent to the booming lending activity over the last 5 years
started to materialize, reflected in the increase of the non-performing loan ratio of the sector, particularly in loansto individuals. Personal loans grew by 63% in nominal terms during the year. Overall the banking system remainedstable, despite the effects of the fierce competition leading to another significant drop in spreads. USD appreciatedby 11.2% versus EUR and all major base interest rates went up, which influenced the banks and the market.
Bulbank posted a net profit of BGN 96.1 million on a consolidated basis, up 11.4% compared to last year. Gross ope-rating income went up 15.2%, including 46.1% in retail and 15.5% in corporate banking. Average loans grew by49.4%, including 109% growth in retail and 39% in corporate. Average deposits increased by 5.5% only, due to thewithdrawal of large tickets of institutional customers. Bulbank sustained its unique mix of high profitability, finan-cial strength and superb efficiency. ROE grew to 16.3% from 15.7%; ROA to 2.9% from 2.8%; tier 1 capital adequacyremained solid with 18.8%; NPL ratio went down to 1.6% from 2.4%; Cost/Income ratio improved even further from42.4% to 39.3%.
Bulbank had a busy business development programme during the year. The branch network expanded by 11 newoutlets, including 3 specialised credit centres. The first small business centre opened its doors as a special vehicleto promote and sell services to small businesses. UniCredit Leasing Bulgaria almost tripled its revenues and net profit during the year. The leasing company leveraged powerfully with the bank’s branch network as its main deliv-ery channel. It opened 3 outlets of its own in order to foster car leasing operations in the country. ATM and POS net-works substantially expanded. Mortgage loans, a strategic product, grew 2.2 times and reached 13% market share.Small business banking was another focal point, where revenues increased by 36% compared to the previous year,boosted by 74% growth in loans and 33% growth in deposits. The product spectrum of assets under managementbecame broader and volumes more than doubled. New credit card products were launched, including Gold and Plat-inum cards for VIP customers. Bulbank was the first bank in Bulgaria to launch factoring operations. Two brand-newto the market cash management products were offered to support large and mid-size corporations. The bank madeanother significant step in developing its credit underwriting and risk management system. A work-out unit wasestablished to take charge of bad loan collection and repossession of collateral, as a proactive response to the fastgrowing loan portfolio and the increasing credit risk in the banking system. The automated credit underwriting appli-cations specialised by segment were modified in line with the evolving market, business and credit risk manage-ment requirements. Significant investments were made in infrastructure and system development. Activespecialisttraining was delivered with the focus on sales and management skills. A two-year leadership training programmewas initiated for first-line managers, based on the concept of emotional intelligence.

5
A n n u a l R e p o r t 2 0 0 5 Letter to Shareholders
2005 was marked by the business combination of UniCredit Group and HVB Group, giving birth to a stronger pan-European financial group, holding a leading position in Central and Eastern Europe. As a result, it is planned to mergeBulbank with HVB Biochim and Hebros Bank, two other important players on the local market. This will create abanking institution with more than 20% market share in all main financial and commercial indicators and more than1.1 million customers. The preliminary studies of the integration process began in 2006. The process will gainmomentum over the course of the current year and the legal merger into a single entity is envisaged to be com-plete in 2007. The main objectives are to consolidate the leading position in all strategic segments and to reachexcellence in business model, service quality, risk management and processes. This will be achieved by leveragingthe unique positioning of the three institutions and the pool of expertise available in Bulgaria, Italy, Austria and Ger-many. The merger process will be the prevailing context of the bank’s business development, as it steadily conti-nues. New mortgage centres will be opened, spreading the success of those in Sofia, Burgas, Varna and Plovdiv. Aspecialised consumer lending company will be established as a joint venture with Clarima, the UniCredit consumerlending vehicle. Another wave of growth in ATM and POS networks will follow. New products, brand reinforcementand active infrastructure development is planned to sustain our growth. As a responsible corporate citizen, the bankwill continue to pursue its long-term charity programme.
We would like to thank our customers, partners and shareholders for their trust. We want to express our excitementat experiencing our joint development journey with our colleagues, who have demonstrated high commitment toour corporate values and goals. Finally, we would like to express our heartfelt gratitude to Mr. Alessandro Decio, whowas promoted to a new position in the Holding Company, for his contribution to the development and the continuoussuccess of Bulbank.
Andrea Moneta Levon HampartzoumianChairman of the Supervisory Board Chairman of the Management Board and CEO
23 February 2006Sofia

61 As of 31 December 2005.2 As of 31 December 2005.
3 Equal to the S&P sovereign rating of Bulgaria in foreign currency.
A n n u a l R e p o r t 2 0 0 5Supervisory Board and Management Board
SUPERVISORY BOARD AND MANAGEMENT BOARD1
Supervisory Board Starting date of mandate
Andrea Moneta Chairman 3 November 2004
Fausto Alberto Galmarini Deputy Chairman 3 October 2000
Dimitar Zhelev Member 3 October 2000
Ivan Stancioff Member 19 October 2001
Jan Beliecki Member 25 September 2003
Marcello Arlotto Member 19 May 2004
Massimiliano Moi Member 8 January 2003
Management Board Starting date of mandate
Levon Hampartzoumian Chairman and Chief Executive Officer 31 August 2001
Alessandro Decio Deputy Chairman and Chief Operating Officer 22 October 2003
Ljubomir Punchev Member 7 January 2005
Kalinka Kirova Member 4 February 2003
Stanislav Georgiev Member 3 October 2000
Changes in the management bodies that took place between 1 January 2006 and the publication date of this annu-al report:⁄ In the Supervisory Board, Mr. Alessandro Decio replaced Mr. Marcello Arlotto.
⁄ In the Management Board, Mr. Andrea Casini replaced Mr. Alessandro Decio.
ORGANISATIONAL CHART2
STANDARD & POOR’S CREDIT RATINGCounterparty credit rating BBB/Positive/A-23, upgraded on 19 December 2005 from BBB/Stable/A-2Certificate of deposit rating BBB/A-2
Supervisory Board
Chairman and Chief Executive Officer
Deputy Chairman and Chief Operating OfficerManagement board
Public RelationsInternal Audit
Credit and RiskManagement
CorporateBanking
RetailBanking
HumanResources
Organization,Processes &Technologies
Planning &control
Treasury &Capital markets
Administration &Logistics
InternalBanking
Legal
RegionsRetail
Banking
RegionsCorporateBanking

7
A n n u a l R e p o r t 2 0 0 5 Bulgar ian Economy
BULGARIAN ECONOMY
2005 Overview of economy
Despite the temporary easing of growth momentum in the third quarter, GDP grew robustly by 5.5% in 2005,against revised 5.7% real growth in 2004. Investments and household consumption expenditures were the key GDPgrowth drivers, while the negative contribution of net exports to growth increased.
At the end of the year the current account shortfallwidened to 11.8%, from a revised 5.8% deficit in 2004.The key economic fundamentals behind current accountdeterioration in 2005 were higher energy prices, accele-ration in investment demand and a slide in export salesvolumes in the third quarter of the year. Despite thewidening of the current account deficit to levels far fromthose generally believed as risk free, there is no immedi-ate danger for the macroeconomic stability. A large cur-rent account deficit in Bulgaria is part of the transitioncontext. It is driven by surges in investment activities andforeign capital inflows, and does not necessarily signalweakening of macroeconomic fundamentals. Moreover,the current account deficit is financed in a sustainablemanner, also reflecting strengthened foreign investors’confidence, as green-field FDI is expected to haveincreased to a record high of 10.3% of GDP in 2005. Central Bank foreign reserves kept on rising, despite the earlyretirement of Brady bonds amounting to approximately EUR 1 billion, which allowed public external debt to drop tobelow 20% of GDP in early 2006. Still, the current account mismatch remains a key source of vulnerability in theBulgarian economy. Indeed, fixed exchange rates under the currency board constrain manoeuvreability of economicpolicy if faced with adverse changes in external conditions.
In the period under review industrial outputgrew robustly by 6.7% annually, still belowthe 17.7% growth posted in 2004. Circum-stances in the labour market improved mo-derately, with newly created jobs almostequally divided between manufacturing andservices sectors, mostly in the fast growingconstruction and wholesale and retail trades.Thus, the number of unemployed declined,relative to the size of the labour force, to10.7% at the end of 2005, against 12.2% in2004.
Economic development continued to exhibitrelatively broadly based regional disparities.Some 7, out of 28 districts from the view-point of the administrative division of thecountry, were at the forefront of economic
expansion, also featuring high concentrations of FDI and new job creation.

8
A n n u a l R e p o r t 2 0 0 5Bulgar ian Economy
Improvements in economic fundamentals and tangible progress in reaching standards of industrialised marketswere highly appreciated by the financial markets. All three leading credit agencies upgraded Bulgaria in 2005, whilethe narrowing of spreads over EUR yield curve reached the 39bp level in January 2006. Further rating upgrades arecontingent upon the completion of EU membership-required reforms and the progress in policy measures aimed atreducing the remaining structural rigidities in Bulgarian economy.
Selected economic indicators 2005 2004 2003 2002 2001 Growth
05/04
Official exchange rate at the end of the period (BGN/USD) 1.66 1.44 1.55 1.88 2.22 15.5%
Average Official exchange rate (BGN/USD) 1.57 1.58 1.73 2.08 2.18 –0.4%
Avg. Basic Interest Rate 2.04 2.61 2.68 3.96 4.48 –57 bp
Inflation at the end of the period (%) 6.5 4 5.6 3.8 4.82 250 bp
Average Inflation (%) 5.0 6.2 2.4 5.8 7.36 –120 bp
Nominal GDP (EUR millions) 21,448p 19,570 17,663 16,553 15,190 9.6%
Real GDP growth (%) 5.5p 5.7 4.5 4.9 4.1 –20 bp
GDP per capita (EUR) 2,779p 2,522 2,264 2,107 1,925 10.2%
Balance of payments final balance (EUR millions) 569 1,400 630 717 425 –59.3%
Current account balance (EUR millions) –2,531 –1,131 –1,630 –926 –1,102 123.7%
Current account balance /GDP (%) –11.8 –5.8 –9.2 –5.6 –7.3 –600 bp
Foreign trade turnover (EUR millions) 23,277 18,923 15,536 13,818 13,207 23.0%
Trade balance (EUR millions) –4,369 –2,953 –2,200 –1,692 –1,778 47.9%
Foreign direct investments (EUR millions) 1,789 2,727 1,851 980 903 –34.4%
Gross foreign debt at the end of the period (EUR millions) 14,325 12,522 10,641 10,769 11,935 14.4%
Gross foreign debt/GDP at the end of the period (%) 66.8 64.0 60.2 65.1 78.60 280 bp
Total Public debt/GDP (%) 30.8 39.8 46.4 54.7 70.13 –907 bp
Gross internal public debt at the end of the period (EUR millions) 1,453 1,371 1,154 1,087 955 6.0%
BNB FX reserves (EUR millions) 7,370 6,770 5,309 4,575 4,061 8.9%
Budget deficit/GDP (%) 2.3 1.7 0.0 –0.6 –0.6 60 bp
Unemployment rate at the end of the period (%) 10.7 12.2 13.5 16.3 17.3 –147 bp
Acting commercial banks at the end of the period 34 34 35 35 35 –
Source:BNB, NSI and Ministry of Financep preliminary data
The regular European Commission monitoring report from October 2005 highlighted several “problematic” areas,namely the ability to absorb EU funds, ensuring high level of food safety, and fighting organised crime and corrup-tion, where immediate corrective actions were recommended to ensure timely accession in 2007. EU accession datedecision, expected to be made in May 2006, will have significant implications on the economy and business activityin the country during 2006.

9
A n n u a l R e p o r t 2 0 0 5 Bulgar ian Economy
2005 Overview of banking sector
In 2005, financial intermediation continuedto expand rapidly approaching Central Euro-pean levels. Fundamentals of the bankingsector improved further; ROE was 18.9% (upfrom 17.3% in 2004) as profitability drewsupport from expanding economy and risingdemand for banking services. Cost efficiency(measured by the cost-to-income ratio)improved to 54.7% from 57.8% in 2004. Thenon-performing loans ratio increased slightlyto 3.65% at the end of the year, includingmore than doubling of the NPL ratio of per-sonal loans cancelled out by the drop for thatof business loans. Loan loss provisions were12% of total operating income, up from 9%reported in the previous year.
In early 2005, in order to bring lending growth down to a more sustainable level, BNB introduced temporaryadministrative control measures on the pace of credit expansion using minimum reserve requirement as a tool. Asa result the credit growth cooled down to 32% at the end of the year and is expected to slow down further toaround 20% in 2006. Although the spending appetite of both households and corporate sector in 2005 was prettystrong, customer deposits attracted by banks posted a steep 26% annual increase. The rise was facilitated byimproving financials and rising external capital inflows in the corporate sector. Similarly, higher incomes in thehousehold sector, remittances from abroad and rising property prices contributed to the growth of retail deposits.On the demand side, lending restrictions of the BNB were built in a way to provide strong stimuli for banks to growdeposits from local residents. Importantly, the robust increase in customer deposits enabling the lending growthin 2005 was entirely funded by savings attracted locally, thus also reducing banking sector external indebtednessin relative terms.
Outlook for 2006
No major changes in economic policy in 2006 are expected. Fiscal policy will keep its role as a key intervention instru-ment preventing the economy from overheating. Such policies will also draw support from BNB measures to driverapid credit growth down to more sustainable levels. Progress on the agenda of real sector reforms will be funda-mental for the success of the overall policy framework in 2006. Key areas to watch will be removing remaining rigidi-ties in the labour market and progress on education and health care reforms. The latter will have far reaching impli-cations, not only for competitiveness and fiscal sustainability, but also on reaching the challenging Maastricht infla-tion criterion.
In 2006, financial intermediation is expected to grow fast on both assets and liabilities sides. Still, penetration onthe lending side will continue to be constrained by the temporary administrative control on the lending growth,introduced by BNB in early 2006. Deceleration of lending growth rates is expected to bring some stabilization ofapplicable interest rates on newly extended loans. This will be also underpinned by some funding costs increase, asbenchmark rates go up globally and competition for local savings intensifies. We are also likely to witness a mo-dest deterioration of loan quality. Indeed, rivalry for building market share has lead to fast easing of borrowers’ credit-worthiness standards, which appears to have been accompanied by some accumulation of bad loans. The role ofnon-banks in financial intermediation will increase, especially in the context of rising preferences of households forhigher yield and deeper diversification. Retail lending, and especially mortgage lending, will continue to draw support from increased inclinations of households for acquisition of real assets (mostly real estate), as a preferredmethod of wealth accumulation. Approaching EU membership is likely to have only a limited impact on the bank-ing sector, as it was already restructured indirectly, via the entry of foreign banks and privatization.

101 IMF World Economic Outlook, Sep. 2005 2 UniCredit Group database & forecast
3 IMF World Economic Outlook, Sep. 20054 World Bank Prospects for the Global Economy 2006
A n n u a l R e p o r t 2 0 0 5World Economy
WORLD ECONOMY
2005 Overview
The global economy grew by an estimated 4.3%in 2005, down from 5.1% a year earlier1.Growth softening was worldwide, reaching vir-tually every economic region. The major deter-minants of the slower global growth were ener-gy and commodity prices, the constrainedcapacity building in resource sectors and thetightened monetary policy. In the USA, high oilprices, rising short-term interest rates and thesevere hurricane season were the major cata-lysts for GDP growth dampening to the forecasted3.6%2 from 4.2% in 2004. Still, USA and Chinaremained in the forefront of the expansion ofglobal economic activities, while in Europe theeconomy continued its very slow recovery risingby an estimated 1.5% in 2005. In Japan, risingdomestic demand and household incomes, offset by tighter labour market conditions and the decreasing pace ofindustrial restructuring, resulted in an estimated 2.0% GDP growth.3
Widening global current account imbalances remained a main worry worldwide in 2005. In the US, the foreign tradedeficit expanded further under the pressure of rising domestic demand and soaring crude oil prices. Still, capitalinflows remained just strong enough to ensure that the current account deficit is financed in a sustainable manner.The pickup in oil prices had the opposite effect for oil exporters, putting them in surplus. As a result, differences ingrowth structure and pace across regions widened in the course of the year. Monetary policy stances are thereforebecoming more differentiated: US, Canada and EU have raised interest rates, in Japan they have remained on hold,and in the UK interest rates were reduced in the 3rd quarter.
The significant dynamics of international exchange rates over the past few years abated in 2005. In particular, thetrend of USD decline against major currencies came to an end, notwithstanding the persistence of the US currentaccount deficit.
Oil prices have continued their ascent, hitting a new nominal high of some $65 a barrel in late August, before fallingback somewhat later in the year. CPI increased slightly in advanced economies to an estimated 2.2% in 2005 from2.0% in 2004. Likewise, inflation dynamics in emerging markets and developing countries inched up to an anticipat-ed 5.9% in 2005, from 5.8% a year earlier, with higher energy and commodity prices being the most relevant infla-tion drivers. World trade growth dynamics lost momentum in 2005 to 7% from 10.3% posted in 2004, mainly thanksto the deceleration recorded in the industrial production and the exports of the high-income economies. The volumesof the latter grew by less than 4% annually in early 2005, before strengthening somewhat in the second half of theyear. Merchandise export volumes of developing coun-tries (excluding China) were relatively strong, growing atan estimated 12% annually towards the middle of 2005.Chinese exports, boosted by the liberalization of tradewith textiles grew by an impressive 24% in 2005.4
Financial market conditions remained benign in 2005.Despite the rising volatility, long-term interest rates con-tinued to be exceptionally supportive for investmentsaround the globe. In the context of monetary policy tight-ening in the US, the 1-month USD LIBOR grew steadily to4.4% at the end of 2005 from 2.1% an year earlier. Incontrast, the 1-month EURIBOR increased only marginallyto 2.44% at the end of 2005 from 2.20% at end-2004.
In foreign exchange markets, rising expectations of higherUS interest rates and resilient economic growth in the US

11 1 IMF World Economic Outlook, Sept. 2005
A n n u a l R e p o r t 2 0 0 5 World Economy
resulted in a moderate appreciation of the USD. In the firstquarter of 2005, strong net private-sector capital inflowsmade the dollar much less reliant on the accumulation ofreserves by foreign central banks (foreign official assetpurchases) than in 2004. Through the rest of the year,growing interest rate differentials increased the financialincentive to hold dollar versus euro denominated assets.Thus, at the end of 2005, the US dollar appreciated by11.2% against the Euro to 1.19 USD/EUR.
Global equity markets sustained their resilience on theback of improving profitability and healthier balancesheets in the corporate sector.
Outlook for 2006
Global economic growth is expected to stay at 4.3% in 20061. Global GDP growth is forecasted to ease further inearly 2006, but to regain momentum afterwards as the adverse impact of higher oil prices will be balanced by still-accommodative macroeconomic policies (with only moderate tightening expected in most countries), benign finan-cial market conditions (in particular low long-term interest rates), and increasingly stable corporate financials.

121 As per 4Q 2005 BNB data of the banking system.2 Net interest income/Average Assets
A n n u a l R e p o r t 2 0 0 5Bulbank Act iv i ty Rewiew
BULBANK ACTIVITY REVIEW
Financial results
Bulbank reports a consolidated net profit of BGN 96.1 million in 2005 (up from BGN 86.3 million in 2004). This incor-porates a net profit of the bank of BGN 94.2 million (representing 16% of the preliminary profit of the banking sys-tem1) and a net profit of UniCredit Leasing Bulgaria of BGN 1.9 million. Total gross operating income is up 15.2% toBGN 229 million and net operating income increases by 21.4% reaching BGN 139 million.
Thousands of BGN
Summary consolidated operating 2005 2004 Growth (%) Growth
income statement (amount)
Net interest income 162,850 134,502 21.1 28,348
Fees and commissions income 44,657 39,758 12.3 4,899
Net trading income 11,615 4,318 169.0 7,297
Gains from investment securities 3,090 7,042 (56.1) (3,952)
Other operating income 6,377 12,850 (50.4) (6,473)
GROSS OPERATING INCOME 228,589 198,470 15.2 30,119
Operating Expenses (89,781) (84,086) 6.8 (5,695)
NET OPERATING INCOME 138,808 114,384 21.4 24,424
Profitability is strong, with return on assets of 2.9% and return on average equity of 16.3%. Earnings per share areBGN 0.58, an increase of 11.4% compared to 2004. Efficiency improved even more, with Cost/Income ratio of only39.3% due to steady revenue growth and strict cost control.
Net interest income was the main earnings contributor with 71% of grossoperating income. It grew 21.1% year on year to BGN 163 million. Netinterest income generation was further supported by the optimization ofthe asset structure; as of the end of the year, interest-earning assets were87.7% and interest-bearing liabilities were 82.5% of the balance sheettotal respectively. Lending interest income, representing 69% of total inter-est income, grew by 41% due to the 49% increase in the bank’s averageannual loan portfolio and the high contribution of leasing operations. Inter-est income from securities accounted for 25% of interest income, andexhibited a decline of 8% due to lower spreads and volumes. Interestexpense on customer deposits went up by 15% due to increase in pricesand ave-rage volumes. Interest income was supported by the increase in
base rates. The average 1-month USD LIBOR rose by113% and the average 1-month EURIBOR was up by4%. Nevertheless, interestincome from inter-bank placements was almost unchanged, due tolower volumes, and accounted for 6% of total interest income. Lendingspread for the year went down by 85 basis points. The effect on netinterest income was offset by the 39 basis points increase in the depositspread. Overall, net interest margin2 improved from 4.72% to 5.35%compared to a 26 basis points deterioration for the banking system.
Fee income was up 12.3% to BGN 44.7 million, accounting for 20% ofgross operating income. The growth is mainly attributable to the 76%increase in loan related fees, 55% increase in fee income from packagesand 14% from cards. Clean payment-related fees grew by 13%, cashoperations fees were up 11%.
Net securities operations gains were BGN 3.1 million, down by 56% year

13 1 The value of the consolidated assets is not an exact sum of the assets of the bank and theleasing company due to inter-company transactions.
A n n u a l R e p o r t 2 0 0 5 Bulbank Act iv i ty Rewiew
on year mainly due to less favourable market conditions and the smaller portfolio size compared to 2004. Net foreigncurrency operations gains were BGN 6.9 million, four times those in 2004, largely due to USD hedging effects, mitiga-ted by a corresponding increase in provisions on USD-denominated instruments.
Other operating net income was down 50% to BGN 6.4 million. The declineis explained by large one-offs in this category in 2004.
Operating costs reached BGN 89.8 million. The increase of 6.8% is mainlyattributed to the 26% increase in depreciation after implementation of thenew IT system. Personnel costs grew by 9.7%, directly due to the geographi-cal expansion. Non-personnel costs were down 2% in 2005, mostly as a resultof a decrease in IT maintenance costs.
Net impairment losses and provisions amounted to BGN 25.4 million, com-pared to BGN 7.7 million in 2004. The increase was due to the tightening ofthe provisioning policy, growth of the loan portfolio and the appreciation of theUSD. A large proportion of the impairment was offset by the receipt of morethan BGN 24 million from active collection and work-out activity. Bulbankcontinues to pursue a strict, conservative and prudent risk assessment and pro-visioning policy, thus covering properly potential risks in the rapidly expandinglending market. As a result, the bank’s NPL ratio of 1.6% is well below the3.6% of the banking system.
Income tax was BGN 17.2 million, down 15% year on year due to the cut incorporate income tax rate from 19.5% in 2004 to 15% in 2005.
Balance sheet
The value of the consolidated balance sheet reached BGN 3,475 million, down by 3.9% compared with the end of2004 in nominal terms. However, there was a 12.5% growth ignoring the short-term one-offs at the end of 2004.This incorporates the balance sheet numbers of BGN 3,409 million for the bank and BGN 64 million of UniCreditLeasing Bulgaria. Interest-earning assets accounted for 88.7% of total assets, up by 119 basis points.
Millions of BGN
Summary Consolidated Balance Sheet1 2005 2004 Growth (%) Growth
(amount)
Assets
Cash and balances with Central Bank 239 292 (18.1) (53)
Due from Banks (net)2 372 709 (47.6) (338)
Securities 979 1,079 (9.2) (99)
Loans and Advances to customers (net)3 1,707 1,354 26.1 353
Property and equipment 154 161 (3.9) (6)
Other assets, net 24 21 15.1 3
Total assets 3,475 3,615 (3.9) (140)
Liabilities and shareholders’ equity
Customer deposits 2,619 2,917 (10.2) (298)
Other liabilities 246 123 99.7 123
Total liabilities 2,865 3,041 (5.8) (175)
Shareholders’ equity 610 574 6.2 35
Total liabilities and shareholders’ equity 3,475 3,615 (3.9) (140)
(1) Balance Sheet from the financial statements is adjusted for analytical purpose.
(2) Excluding loans to financial institutions, added to this item in financial statements.
(3) Including loans to financial institutions, classified as Due from banks in financial statements.

14
A n n u a l R e p o r t 2 0 0 5Bulbank Act iv i ty Rewiew
The asset currency structure changed, with the EUR share falling by 6.7 percentage points to 41% of the total, infavour of BGN due to one-offs as of 31 December 2004.
The shift from treasury components tothose related to commercial bankingcontinued in 2005. The loan portfolioweight rose to 49% of total assetsagainst 37% previous year, reaching BGN 1,707 million in net terms (up 26.1%year on year). The securities portfoliodecreased by 9.2% to BGN 979 million, itsshare in total assets declining from 30%to 28%. Interbank placements at the endof 2005 were 47.6% lower than in theprevious year, registering another dropin their share of total assets from 20% to11%. Property and equipment declinedby 3.9% for the depreciation effect ofthe new IT system.
The bank continued to finance its operations through customer deposits and internal funds. Nonetheless during 2005it attracted external long-term borrowings amounting to BGN 93 million, mainly for financing UniCredit Leasing Bul-garia activities and while complying with the statutory regulations regarding related party transactions. Due tostrong one-off effects at the end of 2004, customer deposits declined by 10.2% to BGN 2,619 million.
Shareholders’ equity amounts to BGN 609 million, up 6.2% for the year (BGN 574 million in 2004) due to reinvest-ment of some of the net profit of 2004 and higher net profit in 2005. The equity ratio increased to 17.5%, up from15.9% in 2004. Total capital adequacy ratio is 21.6% (23.3% in 2004), and Tier 1 ratio is 18.8%, down from 20.4%in 2004. Risk-weighted assets to total assets ratio is up by 8.5 percentage points to 61.4%, reflecting the growth ofloan portfolio. This affords complete compliance with BNB Regulation 8 on Capital Adequacy.
Risk management
In the context of fast lending growth and the increasing level of complexity of most loan products, Bulbank hasdemonstrated continued focus on risk management and control. The sound risk profile of the bank and the qualityof its risk management system was recognised by the rating agencies, reflected in the consecutive upgrades ofBulbank’s credit rating over the past two years.
Credit risk was the centrepiece of risk management. Additional functionali-ties were implemented in the existing tools for corporate, small business,consumer and mortgage lending. The retail lending scoring system intro-duced in 2004 was further improved. The lending underwriting process pro-cedures have been refined. Additional efforts were made in the area of clas-sified loans. The bank signed framework agreements with two collectionagencies to improve collection of retail loans. A separate workout unit wasestablished during the year, in charge of loan loss collection, as a response tothe increasing risk of the system and as a pre-emptive measure against pro-bable increase in doubtful debts of the bank coincident with the growth ofthe loan portfolio.
The strong emphasis on asset quality is reflected in the NPL ratio of Bulbank,which improved even further in 2005 compared to a slight deterioration ofthat for the whole banking sector. Bulbank continued to pursue a strict andprudent policy of credit risk assessment and provisioning. Total loan provisioncoverage is 3.3%.
Market risk monitoring was enhanced through the newly introduced requirements of the Central Bank, enforcedvia the Capital Adequacy Regulation, which took into account the EU and Basel II guidelines. The bank is runninga balanced foreign currency position. The total net open FX position of 9.7% of the capital base at the end of the

15 1 Liquidity ratios as per BNB Regulation 11. Liquid assets are adjusted with the amount of over-due or pledged assets.2 Data as of 31 December 2005.3 New net customers, including gross new less gross left customers and closed dormant accounts.
A n n u a l R e p o r t 2 0 0 5 Bulbank Act iv i ty Rewiew
year meets the requirements of BNB. The open position in EUR is also not considered at risk by the regulator, giventhe prevailing Currency Board arrangement. With the high volatility of the EUR/USD exchange rate in mind, thebank continued to hedge the FX risk of its USD-denominated, uncollateralized off-balance sheet exposures. Theinterest rate risk was closely scrutinised, due to the continuing upward trend of the USD base interest rates, theuncertainty around Euro-zone base rates and the highly competitive pricing environment. The interest rate posi-tions were carefully monitored and managed. The bank hedged partially its securities’ interest rate risks throughinterest rate swaps. It also used other standard derivative instruments to manage market risks. VaR tools wereapplied to determine the potential maximum loss. Bulbank remains comfortably liquid. Despite active lending, theexpected cash receipts exceeded outflows. Liquid asset-to-deposit ratios1 are at a satisfactory level: 29.6% in totaland 29.1% for those denominated in foreign currency. Stress test analyses with different scenarios on expectedcash flows have been performed regularly for monitoring and managing liquidity risks. The developments in themarket risk analysis and control area during the year continued the process towards full Basel II compliance forstatutory purposes from 2007.
For a second year in a row, continuing efforts were put into the maintenance and improvement of the operationalrisk management infrastructure, aiming at meeting Basel II standards also in this area. This comprised of an inter-nal operational risk regulatory framework, collection and assessment of operational risk data, a system for regularreporting to the top management on risk exposures and tools for operational risk mitigation and hedging. Closemonitoring of risky areas was established and further steps were taken for separating and analysing the potentialrisk-bearing processes. As a result the sustained losses and the estimated losses against the gross operating incomeof the bank dropped significantly and their gross increase during the year was marginal.
Bulbank continued to maintain healthy geographical distribution of its assets. It invests 73%2 of its assets in Bulgaria (BGN 221 million increase in 2005), 24% in OECD countries (mainly Italy, Germany and USA) and 6% onlyin other countries, fully in accordance with the approved investment policy.
Commercial banking
Commercial banking reinforced its position as the main revenue growth driver.It generated BGN 185 million revenues in 2005, up 27% year-on-year. Thisrepresents 82% of total revenues of the bank, compared to 74% a year earli-er. This growth was achieved through strong growth in the loan portfolio, anincreased number of customers and the improved product offer. During theyear, the number of customers grew by a net thirty-one thousand3 across allsegments, thus increasing the customer base by 8% to 435,000.
The loan portfolio increased by 22.4% at the end of the year compared to theend of 2004, bringing the loan to deposit ratio to 65.2%, up by 17.4 percen-tage points. The average annual loan portfolio, however, grew by more than49% compared to 43% for the whole banking sector. Loans to individualsincreased by 81% in 2005. Mortgages were the fastest growing instrument,up by 114%, followed by the small business loans, up 74%.
In 2005, Corporate banking revenues amounted to BGN 104 million, a 15.5%growth year-on-year. The main revenue contributor was lending. Corporate loanportfolio grew by 10.4% reaching BGN 1,270 million as of 31 December 2005(38.9% on an average annual basis to BGN 1,261 million). The significance of this growth is reinforced by both thequality of the portfolio, which remained superb in 2005 (an NPL ratio of only 1.1%), and also by the 15% growthof net interest income revenues from lending, despite the constant drop of the lending spreads.
2005 was a year of continued focused efforts in transactional services, new corporate products launch and customerretention. These were aimed not only at increased revenues but also at a wider recognition of Bulbank as an inno-vative solution provider in the Bulgarian Corporate market and at improving the quality of client portfolio. As aresult, fee income increased by 17% annually to BGN 33 million in line with the strategy for sustaining a balancedstructure of the income statement.
Due to the strong evidence of customer demand, factoring convergence in Central and Eastern European countrieswith Western Europe and the virtual non-existence of the product on the local market, Bulbank grasped the oppor-tunity to develop factoring ahead of the competition. Leveraging on Bulbank’s core strengths of network, brand and

161 Including all segments of individuals (private, affluent and family) and small businesses.2 Companies with annual turnover of up to BGN 1 million.
A n n u a l R e p o r t 2 0 0 5Bulbank Act iv i ty Rewiew
size, domestic factoring with recourse was launched in 2005. Being a demand-driven product introduction, factor-ing is considered essential both on revenue and on customer service sides. In 2005, a new Structured Finance unitwas established to support advisory services to corporate and institutional customers. By providing specialisedinvestment and structured financing services (mergers/acquisitions, green field and expansion investment projects,projects involving international investors, etc), it is intended thereby to prove its potential as a major player in allsignificant segments of the market.
Within the concept of cash management products and services (the foundation of which was established in 2004),Bulbank pioneered the market by introducing Bulcollect and Buldirect. Bulcollect is a unique cash management offerfor suppliers with a large network of buyers for effective cash collection, reconciliation of suppliers’ cash receivablesand optimization of suppliers’ liquidity management and costs and ensures an increased deposit base, risk-free feeincome, cross-selling opportunities and easier client acquisition. Buldirect is a response to a growing need amonglocal and multinational companies for streamlining their cash flow process and improving their cash management.The product represents an automated direct debit system with extra features. Another pillar of the cash manage-ment concept was the usage of electronic channels (being the platform of any cash management enhanced solu-tion). As a result of a structured effort that was ongoing for more than a year, e-penetration in terms of paymentsamong Bulbank corporate customers is among the highest on the domestic market. At the end of 2005 over 56%of the medium-sized and almost all large corporate clients used Telebank or Bulbank Online (or both). In 2005 e-payments accounted for 55% of all BGN payments and 65% of all foreign currency payments.
Retail banking revenues increased by 46% compared to 2004, reach-ing BGN 81 million. This incorporates 71% growth of net interestincome and 23% in fee income. The loan portfolio of the segmentmore than doubled (79% growth), reaching BGN 437 million at theend of the year. At the same time, the lending spread dropped bymore than 1.5 percentage points due to strong competition andimproved offers. Retail banking1 was subject to active developmentduring the year, presupposed by the fast market development, thebank’s positions and its longer-term plans. The bank substantiallyimproved its service model and value proposition for the small busi-ness segment2 as evidenced by growth of 74% in loan portfolio and33% in deposits. Offer and service was further differentiatedbetween small companies (with annual turnover of between BGN 50 thousand and BGN 1 million) and micro companies (with annual turnover below BGN 50 thousand).
Another strategic area was mortgage lending, where Bulbank is already one of the leaders with a loan portfolio ofBGN 266 million at the end of the year and 13% market share. The mortgage growth was strongly supported bythree newly-established specialised personal lending centres. Cash loans rose by 37%, extended on a safe under-writing basis.
Sales of asset management products sustained momentum: mutual funds rose by 90% to BGN 29 million and struc-tured term deposits increased by 71% to BGN 71 million. 26% more packages were sold, almost reaching twentyseven thousand. The number of cards issued increased by 14% to 282,000. The number of POS terminals went upby almost 50% to 1,902 and the number of ATMs increased by 76% to 267.
Bulbank markedly improved its commercial campaign-running and marketing competence during the year. Adver-tising focused on specific products was strengthened to support commercial campaigns and simultaneously to reju-venate the bank’s image and to establish Bulbank as a strong retail brand, in addition to its powerful positions incorporate banking. A geographical expansion and branch design enhancement project was successfully carried out.

17 1 The rounding to 100% falls to other foreign currency.2 Including BGN 28 million loans to financial institutions. 3 As per the definition of the BNB.4 Including overdrafts.
A n n u a l R e p o r t 2 0 0 5 Bulbank Act iv i ty Rewiew
Customer deposits
Customer deposits decreased by 10.2% or BGN 298 million to BGN 2,619 million in nominal terms. This does notinclude the large ticket transfers during the year related to institutional accounts, which on one side limits the depositbase, but on the other significantly reduces the risk of concentration, strengthens sustainability and improves theyield on deposits. The nomalised growth in deposits adjusted for the above one-offs ammounts to 9.2%.
BGN component is up by 10 percentage points to 35% of the total. EUR and USD components are respectively downto 40% (compared to 53% last year) and up to 24% of the total (compared to 21% in 2004)1.
Corporate deposits (without small business) dropped to BGN 1,229 million at the end of 2005 due to the strong one-offs at end 2004. Retail deposits (including Small Business) are up to 18.4% to BGN 1,490 million. Thus, the shareof deposits of companies is down to 52% of the total. The currency structure of deposits is dominated by foreigncurrency with 57% of total, mainly in EUR. Term deposits increased their share from 44% to 48% of the total.
Loan Portfolio
The bank loan portfolio posted a 22.4% growth in 2005 toBGN 1,707 million2 on a gross basis, up from BGN 1,394 milliona year earlier. The average annual loan portfolio is BGN 1,596 million in 2005, up 49% compared to 2004. Theloan to deposit ratio increased to 65% (compared to 84% forthe banking sector) from 48% in 2004. This represents anexcellent growth opportunity.
The structure of the loan portfolio changed, reflecting thecommercial activities during the year. The share of loans toindividuals increased to 20% (14% in 2004) driven by thesteep growth in mortgages, which reached 16% (9% in 2004)of total portfolio. The share of foreign currency loans declinedslightly from 58% to 55%. Working capital loans increased by29% reaching 47% of total loan portfolio.
Loans to companies grew by 13.2% to BGN 1,362 million,accounting for 80% of the total. The average annual growth is 39%, but reduces at the end of the year due to repay-ment of a couple of large items. The predominant part is to medium-sized companies. Concentration risk is downwith the 25 largest exposures to total loans at 34% from 44% in 2004 (and at 129% from 141% to own capital3).The share of working capital loans4 is 58.8% of total company loans (56.4% in 2004). Bulbank holds 11% marketshare of company loans at the end of 2005.
Loans to individuals grew by 80.5% (63% growth for the market) to BGN 345 million, and account for 20% of totalloans. Thus the bank increased its market share in loans to individuals by 50 basis points to 5.6%. Given the grow-ing property market, high demand, credit history and profitability of all other markets, the main focus during the

181 Non-performing loans to total gross loans. Non-performing are all those loans classifiedas sub-standard and loss as per the ruling BNB Regulation 9 as of the end of 2005.
A n n u a l R e p o r t 2 0 0 5Bulbank Act iv i ty Rewiew
year was again mortgage lending. The bank increased its mortgage portfolio by 114% (101% growth for the mar-ket) to BGN 266 million or 13.1% market share. Despite strong demand, consumer loans were not a priority for riskconsiderations. They were nonetheless up by 37% to BGN 63 million. Loans on charge and revolving cards wereextended on a limited basis for similar reasons. Personal loans were almost entirely denominated in BGN.
The industry structure did not change dramatically during the year, although the share of top two industries exhibiteda slight decline. The main areas of concentration are still manufacturing, commerce and tourism, overall 63% of total.
Millions BGN
Industry structure of the bank portfolio 2005 2004
Amount Share Amount Share
Processing and manufacturing 614 35% 509 37%
Commerce 323 19% 339 24%
Tourism 148 9% 160 11%
Households and individuals 345 20% 191 14%
Agriculture 44 3% 37 3%
Services 148 9% 124 9%
Transport 49 3% 14 1%
Construction 36 2% 20 1%
1,707 100% 1,394 100%
Loan quality remains excellent. Non-performing loan ratio1 improved further to 1.6% from 2.4% a year ago. The shareof standard loans increased to 97.5% of total. Despite the growth of the loan portfolio, non-performing loans declinedby 19% (from BGN 34 million to BGN 27 million) due to active work outand collection activity. The overallamount of write-offs is BGN 4.9 million.
During the year, the bank amendedits provisioning rules in line with thechanging BNB requirements and alsoto reflect its conservative and pru-dent practices with respect to creditrisk. As a result, total provision cover-age increased from 3% to 3.3%.Standard loans provision coveragewas 1.6% (up from 0.9%), watchloans coverage increased to 26.5%and NPL ones to 93.8%.

19
A n n u a l R e p o r t 2 0 0 5 Bulbank Act iv i ty Rewiew
Leasing
The leasing business of Bulbank, started up in 2004, is a success. UniCreditLeasing Bulgaria (UCL) reports more than 3 times growth in leasing portfolioin 2005 to BGN 81 million, also improving market share amongst the bankinggroup leasing companies – being the main player on the local market with10% at the end of the year from 6% in 2004. The consolidated net profit
reported by UniCreditLeasing Bulgaria(including UniCreditAuto Leasing BulgariaEOOD) for 2005 morethan quadrupled to BGN 1.9 million andgross operatingincome increased byfour times to BGN 4.4 million.
UCL has been using the bank’s branch network as its main distribution channel, making 75% of the business. How-ever, in order to strengthen the business locally, 3 leasing offices were opened in other large cities outside Sofiaand there are plans to cover all 8 regional outlets of the bank in 2006. The company business model, strategy andinternal rules are aligned with those of Bulbank. In terms of segments, corporate and small business segments arethe main focus, although the company started offering leasing to individuals in 2005, mainly car leasing. Vehiclesrepresent the main portion of UCL portfolio with 52% of total, followed by industrial equipment with 39%.
Money market and capital market operations
In 2005, Bulbank continued its active investment policy, fully complying with the existing rules regarding market risk.The sought after balance between risk and return was achieved within the framework of the investment policy of thebank by investing mostly in Government bonds issued by Bulgaria, G7 countries and countries about to join the EU.Such investments account for 75% of total portfolio. The decline in the volume of Bulgarian Government Securities ismainly a result of the retirement of Brady bonds by the Bulgarian Government.
Bulbank made further steps in the optimization of its asset structure, by reducing the deposits with first-class foreignbanks from BGN 705 million to BGN 361 million and by reducing the securities portfolio by 7% to BGN 974 million.The released resource was used to finance the growth in loan portfolio.

201 The steep drop in number of staff in 2004 compared to 2003 is due to outsourcing of security staff.
A n n u a l R e p o r t 2 0 0 5Bulbank Act iv i ty Rewiew
The average rating of the portfolio under Standard & Poor’s is “A-“ and the average duration is 3 years, up 0.4 yearscompared to 2004.
Interbank operations on domestic and international money markets were geared towards providing optimal liqui-dity. Money market operations comprised mainly of short-term deposits, ensuring a flexible approach for liquiditymanagement. Credit lines for EUR 70 million were acquired for small business financing from international financialinstitutions. In 2005, Bulbank was an active player in the fast growing Bulgarian corporate bonds market.
Bulbank possessed shares in 9 companies at the end of the year at a total amount of BGN 5.4 million, down fromBGN 5.8 million in 2004.
Development
2005 was marked by extensive development activities in many aspects, particularly in the areas of new businessand product development, distribution channels enhancement, and credit risk management. These are described indetail in the respective sections of this document.
Particular emphasis was placed again on systems and IT development. One of the largest and high priority projectsduring the year was the one for reengineering of the reporting data warehouse of the bank. As a result, a unifiedreporting data base was built up using state-of-the-art technology to support business and senior management deci-sion making, planning and monitoring, but also to control operations and significantly optimise report generation.A large number of developments were made in the areas of hardware optimisation, communications and security.A lot of efforts were exerted for strengthening further the control systems responding to the changing regulations,market environment and overall development of the bank. The implementation of a specialised leasing operationalapplication for the leasing company was completed. A specialised operational system development for the factor-ing company was initiated. A specialist application for calculation and accounting of amortised costs was designed,developed and implemented. A specialist project management application was initiated and implemented to sup-port and intensify the change management and development activity of the bank. Basel II standards implementa-tion was another area of attention within the context of the significant impact on financials and business that it has,complexity of the project and central bank requirement for compliance by 1 January 2007.
Human resources
Management of human resources received special attention due to its strategic importance and contribution to thebank’s development and fulfilment of its business goals.
2005 was a year of active organizational development of the branchnetwork as well as the Head Office. Nine new outlets, three new lend-ing centres and one small business centre have been established withover 70 new employees altogether. Three new units were created atHead Office: loan work-out, factoring, and consumer finance, the last
two being instrumental for theestablishment of the respec-tive stand-alone companies.
The total number of Bulbankgroup employees increased by137 from 1,760 to 1,897. Atthe end of the year, the totalnumber of employees of thebank only reached 1,869, anincrease of 122.1 10 The geo-graphical expansion andincrease of sales force are the main reasons for growth. The total number ofcommercial positions reached 578, 31% of total bank and 46% of branch net-work staff. Sales force (people directly engaged with commercial activities inall market segments) increased by 9% to 455, 24% of total staff and 36% ofnetwork staff. The weight of front office staff (people servicing customers)reached 58% of total. The number of staff at Head Office increased to 612,
21
A n n u a l R e p o r t 2 0 0 5 Bulbank Act iv i ty Rewiew
33% of total, mainly due to newly opened business lines and credit risk management units, described above.
Compensation policy was actively enhanced, driven by performance, market dynamics watch and group principles.The variable part of compensation, strictly linked to contribution, was developed further. The principles of personaltarget allocation, performance related bonus range, pre-advice and team solidarity factors, ruling for the MBO cov-ered positions, were cascaded to the whole bank. The MBO system (Management by Objectives), applying previ-ously mainly to managers, was enhanced by enlarging the scope of eligible staff. For the first time, sales force posi-tions were assigned semi-annual targets, thus qualifying for a semi-annual MBO too.
As a result of the employee satisfaction survey done at the end of 2004, an intensive action plan was done for deve-lopment targeting enhancement in the following areas: leadership, client focus, training and development and pay.
People development was a main priority in 2005. More than 150 newcomers visited induction training. Specialisttraining in sales skills and products continued with great intensity aligned with the business plans of retail and cor-porate divisions. Special Corporate and Small business events were organised, where the bank’s strategy and plansfor development were presented along with discussion panels and training. IT specialist training continued aimedat introducing new technologies in support of business and services, increased processing capacity and upgrade ofinfrastructure. Soft skills and management workshops were organised for a focused group of managers and experts,including presentation skills, negotiation skills, process management and time management. A two-year leadershipdevelopment programme was initiated for first line managers based on the emotional Intelligence concept. A fourthconsecutive group of young people with high potential joined the “Young Talents” managerial programme, a jointventure of UniCredit Group and Bocconi University.
The assessment centre of the bank supported the active recruitment process and was involved in evaluation ofemployees’ potential. This supported the career planning process. A new initiative named “Know Your People” waslaunched, bringing together people from various areas and locations in the bank and the top executives in an atmos-phere of informal discussion, aiming at improvement of internal communication and ideas generation.
Corporate social responsibility
Being a member of UniCredit Group and Global Compact initiative of the United Nations, Bulbank places a specialemphasis on corporate social responsibility. The total amount given to charity in 2005 grew by 35% compared tothe previous year.
In 2005, the joint project with Unidea, UniCredit Foundation, for repair and renovation of premises and dormitory ofthe School for Visually Impaired Children in Sofia was completed. The bank started its biggest and best structuredjoint bank-employee donation campaign targeting fund raising for the reconstruction of the orphanage house in thetown of Roman, which suffered badly from the summer floods.
One of the first joint initiatives of Bulbank, HVB Bank Biochim and Hebros Bank after the announced mergerbetween UniCredit and HVB was the support to the municipality authorities in creating a friendly and safe urbanenvironment in one of the central public parks in Sofia. The bank supported the construction of a new cathedral inSofia. A number of other carefully selected, projects was also backed.
Outlook
2006 will be marked by the process of integration of Bulbank, HVB-Biochim and Hebros Bank. The integration pro-ject planned to start in the first quarter of 2006 aims to ensure sustainable growth building upon the strengths ofthe three banks in a timely and well-organised manner. The main objectives will be to reinforce the combined enti-ty’s market positioning and provide for excellence in services and processes to the best interest of customers, share-holders, employees and other stakeholders. The potential to make this happen is great, given the limited overlap-ping of business and branches and the strong franchise in virtually all segments of the market. The direct connec-tion to markets in Italy, Germany and Austria, one of the main trade partners of Bulgaria, is an unparalleled advan-tage for business customers, and which will be leveraged. In the fast growing retail segment, the combined entitywill have access to a large customer base of more than one million customers, which will be exploited throughshared product proliferation and marketing. In order to make use of this enormous potential and reach the goals,the integration project plans legal merger of all three banks in 2007 with a joint sales force and back office support-ed by a state-of-the-art centralised banking IT system.
Apart from integration, Bulbank will continue its development programme on a selective basis. The factoring business

22
A n n u a l R e p o r t 2 0 0 5Bulbank Act iv i ty Rewiew
will be split into a stand-alone company, aimed at creating and capturing an optimum stake in this new market with-in Bulgaria. Clarima Bulgaria, a specialised consumer lending company in a joint-venture with Clarima Italy, will beregistered and will open doors in the first half of the year, targeting POS consumer lending with a well-designed businessand processing model. The distribution network will be developed selectively only through opening new specialisedcredit centres and leasing offices outside Sofia. The ATM and POS networks will be further expanded to support the fast-growing card business. Electronic banking development will continue. The bank is already well advanced in the mostimportant regulatory-related projects for 2006, including IBAN standards implementation and Basel II. People develop-ment, targeting high performance and excellence, will be a central aspect of HR policy for the year.

BULBANK AD
CONSOLIDATED FINANCIAL STATEMENTS
FOR THE YEAR ENDED 31 DECEMBER 2005PREPARED IN ACCORDANCE WITH
INTERNATIONAL FINANCIAL REPORTING STANDARDSWITH INDEPENDENT AUDITOR`S REPORT THEREON

REPORTOF THE INDEPENDENT AUDITOR
TO THE SHAREHOLDERS OF BULBANK AD
Sofia, 23 February 2006
We have audited the accompanying consolidated balance sheet of Bulbank AD(“the Bank”) as of 31 December 2005 and the related consolidated statements ofincome, changes in equity and cash flows for the year then ended. These consoli-dated financial statements are the responsibility of the directors. Our responsibilityis to express an opinion on these consolidated financial statements based on ouraudit.
We conducted our audit in accordance with International Standards on Auditing.Those Standards require that we plan and perform the audit to obtain reasonableassurance about whether the consolidated financial statements are free of materi-al misstatement. An audit includes examining, on a test basis, evidence supportingthe amounts and disclosures in the consolidated financial statements. An audit alsoincludes assessing the accounting principles used and significant estimates madeby the directors, as well as evaluating the overall financial statement presentation.We believe that our audit provides a reasonable basis for our opinion.
In our opinion, the consolidated financial statements give a true and fair view of thefinancial position of the Bank as of 31 December 2005, and of the results of its oper-ations and its cash flows for the year then ended in accordance with InternationalFinancial Reporting Standards.
KPMG Bulgaria OOD37, Fridtjof Nansen Str.SofiaBulgaria

25
A n n u a l R e p o r t 2 0 0 5 Consol idated F inancia l Statements
Consolidated income statement
In thousands of BGN
Notes Year ended 31 December
2005 2004
Interest income 193,063 158,823
Interest expense (30,213) (24,321)
Net interest income 3 162,850 134,502
Fee and commission income 48,505 43,112
Fee and commission expense (3,848) (3,354)
Net fee and commission income 4 44,657 39,758
Net trading income 5 11,615 4,318
Gains less losses from investment securities 6 3,090 7,042
Other operating income, net 10 6,377 12,850
TOTAL OPERATING INCOME 228,589 198,470
Operating expenses 7, 8 (89,781) (84,086)
Impairment losses and provisions 9 (25,443) (7,719)
PROFIT BEFORE TAX 113,365 106,665
Income tax expense 11 (17,249) (20,386)
NET PROFIT FOR THE PERIOD 96,116 86,279
The accompanying Notes 1 to 32 are an integral part of these financial statements.

26
A n n u a l R e p o r t 2 0 0 5Consol idated F inancia l Statements
Consolidated balance sheet
In thousands of BGN
Notes As at 31 December
2005 2004
ASSETS
Cash and balances with central bank 12 238,764 291,587
Due from other banks 13 405,352 737,438
Trading securities 14 115,495 242,801
Derivative financial instruments 15 14,383 12,655
Loans and advances to customers 16 1,673,358 1,325,754
Investment securities 17 863,638 835,768
Goodwill 416 416
Other assets 18 9,010 7,609
Property and equipment 19 154,413 160,668
TOTAL ASSETS 3,474,829 3,614,696
LIABILITIES
Due to other banks 20 50,290 21,607
Derivative financial instruments 15 10,654 8,296
Due to customers 21 2,618,771 2,917,169
Long-term borrowings 22 92,927 –
Other liabilities 23 28,942 37,542
Deferred tax liability 24 13,798 12,382
Provisions 25 49,838 43,588
TOTAL LIABILITIES 2,865,220 3,040,584
SHAREHOLDERS’ EQUITY
Share capital 27 166,370 166,370
Statutory reserves 51,155 51,155
Retained earnings 332,377 295,418
Revaluation reserves 59,707 61,169
TOTAL SHAREHOLDERS’ EQUITY 609,609 574,112
TOTAL EQUITY AND LIABILITIES 3,474,829 3,614,696
———————————————— ————————————————Levon Hampartzoumian, Stanislav Georgiev,
Chairman of the Management Board Member of the Management Boardand Chief Executive Officer
23 February 2006
The accompanying Notes 1 to 32 are an integral part of these financial statements.

27
A n n u a l R e p o r t 2 0 0 5 Consol idated F inancia l Statements
Consolidated statement of changes in shareholders’ equity
In thousands of BGN
Share Statutory Retained Property and Investment Total
capital reserve earnings equipment securities
revaluation revaluation
reserve reserve
Balance as of 1 January 2004 166,370 36,684 287,184 60,165 (377) 550,026
Available-for-sale investments
– Net fair value losses – – – – (280) (280)
Transfer to statutory reserves – 14,471 (14,471) – – –
Transfer of revaluation reserves
on realised surplus – – 1,578 (1,578) – –
Net profit for the year – – 86,279 – – 86,279
Dividend distribution – – (65,118) – – (65,118)
Lower tax rate effect – – – 3,239 – 3,239
Other distribution – – (34) – – (34)
Balance as of 31 December 2004 166,370 51,155 295,418 61,826 (657) 574,112
Balance as of 1 January 2005 166,370 51,155 295,418 61,826 (657) 574,112
Available-for-sale investments
– Net fair value losses – – – – (1,060) (1,060)
Transfer of revaluation reserves
on realised surplus – – 402 (402) – –
Net profit for the year – – 96,116 – – 96,116
Dividend distribution – – (59,177) – – (59,177)
Other distribution – – (382) – – (382)
Balance as of 31 December 2005 166,370 51,155 332,377 61,424 (1,717) 609,609
The accompanying Notes 1 to 32 are an integral part of these financial statements.

28
A n n u a l R e p o r t 2 0 0 5Consol idated F inancia l Statements
Consolidated cash flow statement
In thousands of BGN
Notes Year ended 31 December
2005 2004
Profit/(loss) after taxation 96,116 86,279
(Decrease)/Increase in impairment losses for bad 9 19,193 11,972
and doubtful debts and other assets
Increase/decrease other accruals (33,259) 55,876
Increase/decrease in provisions 9 6,250 (4,253)
Depreciation 7 16,773 13,307
Foreign exchange (gains)/losses 1,669 (6,686)
Unrealised (gains)/losses on securities 6,359 (5,269)
Deferred tax 11 1,719 4,333
Tax expense 11 15,530 16,053
Loss/(Profit) on disposal of fixed assets (585) (994)
Other non-cash movements – 6,600
129,765 177,218
Change in operating assets
(Increase)/decrease in obligatory reserve with the National Bank 12 38,077 (81,898)
(Increase)/decrease in Trading securities 125,040 (167,317)
(Increase)/decrease in loans and advances to banks 45,722 (2,860)
(repayment beyond 3 months)
(Increase)/decrease in loans to customers (347,191) (472,321)
(Increase)/decrease in other assets (1,839) (3,998)
(140,191) (728,394)
Change in operating liabilities
Net increase/(decrease) in deposits from banks 120,419 8,632
Net increase/(decrease) in amounts owed to other depositors (393,757) 782,589
Net decrease in accrued other liabilities – (59,565)
Income tax paid (12,316) (16,488)
Dividend paid (56,005) (65,099)
(341,659) 650,069
Net cash flow from operating activities (352,085) 98,893
Cash flow from investing activities
Acquisition of subsidiary net of cash acquired – (93)
(Purchase) of tangible fixed assets 19 (14,010) (7,199)
Proceeds from the sale of non-current assets 4,077 2,813
Acquisition of investments – 15,238
Sale of investments 28,550 –
Net cash flows from investing activities 18,617 10,759
NET CHANGE IN CASH AND CASH EQUIVALENTS (333,468) 109,652
CASH AT THE BEGINNING OF THE PERIOD 29 748,711 639,059
CASH AT THE END OF THE PERIOD 29 415,243 748,711
The accompanying Notes 1 to 32 are an integral part of these financial statements.
29
A n n u a l R e p o r t 2 0 0 5 Consol idated F inancia l Statements
NOTES TO THE CONSOLIDATED FINANCIAL STATEMENTSFOR THE YEAR ENDED 31 DECEMBER 2005
BackgroundBulbank AD (hereinafter, “Bulbank” or the “Bank”) was incorporated in 1964 under the name of Bulgarian ForeignTrade Bank as a joint-stock company under the requirements of the Bulgarian Trade Act. The Bank possesses fullbanking service licence issued by the BNB.
1. Accounting PoliciesThe principal accounting policies adopted in the preparation of these consolidated financial statements are set out below:
A. Basis of PresentationThe financial statements have been prepared in accordance with the International Financial Reporting Standards(IFRS) issued by the International Accounting Standards Board (“IASB”), and interpretations issued by the StandingInterpretations Committee of the IASB.The preparation of financial statements in conformity with IFRS requires the use of certain critical accounting esti-mates. It also requires management to exercise its judgement in the process of applying the Bank’s’s accountingpolicies. The areas involving a higher degree of judgement or complexity, or areas where assumptions and estimatesare significant to the consolidated financial statements, are disclosed in Note 2 (O).
B. Basis of consolidation of subsidiariesSubsidiaries are entities controlled by the Bank. Control exists when the Bank has the right, directly or indirectly, togovern the financial and operating policies of an entity so as to obtain benefits from its activities. The financial state-ments of subsidiearies are included in the consolidated fiancial statements from the date that control commencesuntil the date that control ceases.
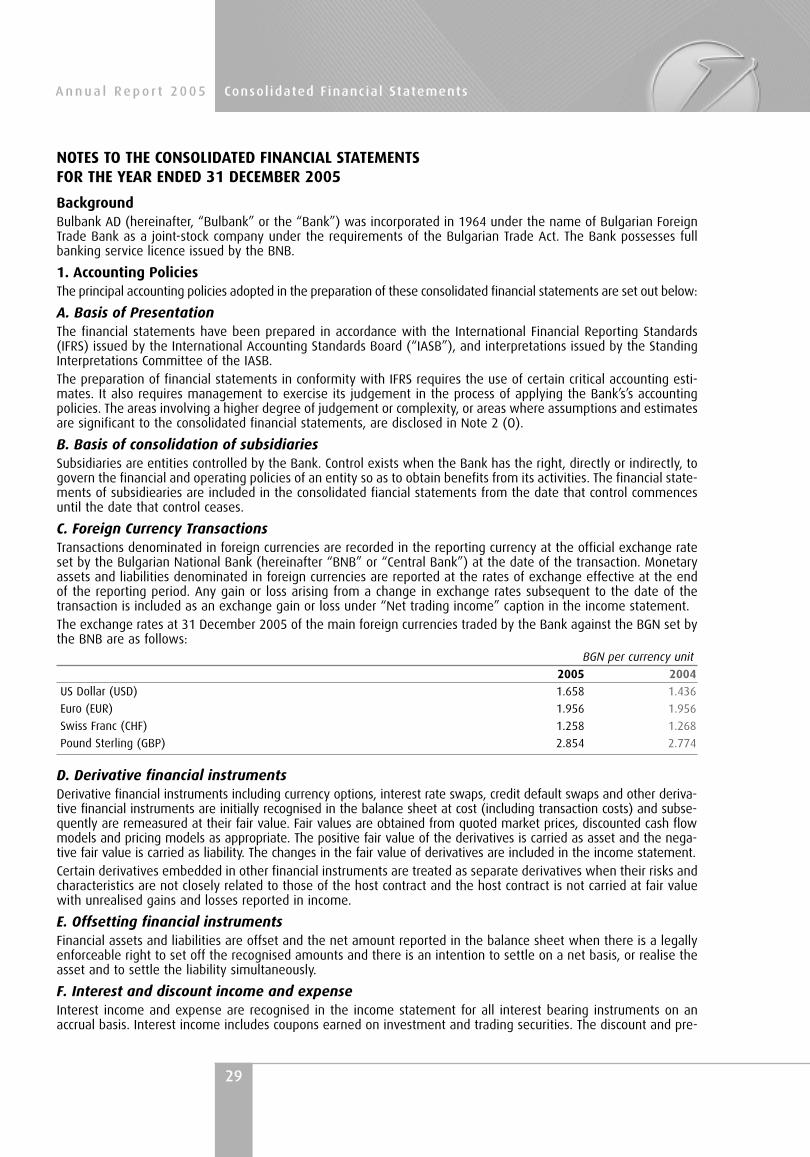
C. Foreign Currency TransactionsTransactions denominated in foreign currencies are recorded in the reporting currency at the official exchange rateset by the Bulgarian National Bank (hereinafter “BNB” or “Central Bank”) at the date of the transaction. Monetaryassets and liabilities denominated in foreign currencies are reported at the rates of exchange effective at the endof the reporting period. Any gain or loss arising from a change in exchange rates subsequent to the date of thetransaction is included as an exchange gain or loss under “Net trading income” caption in the income statement.The exchange rates at 31 December 2005 of the main foreign currencies traded by the Bank against the BGN set bythe BNB are as follows:
BGN per currency unit
2005 2004
US Dollar (USD) 1.658 1.436
Euro (EUR) 1.956 1.956
Swiss Franc (CHF) 1.258 1.268
Pound Sterling (GBP) 2.854 2.774
D. Derivative financial instrumentsDerivative financial instruments including currency options, interest rate swaps, credit default swaps and other deriva-tive financial instruments are initially recognised in the balance sheet at cost (including transaction costs) and subse-quently are remeasured at their fair value. Fair values are obtained from quoted market prices, discounted cash flowmodels and pricing models as appropriate. The positive fair value of the derivatives is carried as asset and the nega-tive fair value is carried as liability. The changes in the fair value of derivatives are included in the income statement.Certain derivatives embedded in other financial instruments are treated as separate derivatives when their risks andcharacteristics are not closely related to those of the host contract and the host contract is not carried at fair valuewith unrealised gains and losses reported in income.
E. Offsetting financial instrumentsFinancial assets and liabilities are offset and the net amount reported in the balance sheet when there is a legallyenforceable right to set off the recognised amounts and there is an intention to settle on a net basis, or realise theasset and to settle the liability simultaneously.
F. Interest and discount income and expenseInterest income and expense are recognised in the income statement for all interest bearing instruments on anaccrual basis. Interest income includes coupons earned on investment and trading securities. The discount and pre-

30
A n n u a l R e p o r t 2 0 0 5Consol idated F inancia l Statements
mium on Investment securities, Held-to-maturity are recognized as interest income and expense.
G. Fees and commissionsFees and commissions on the financial services, provided by the Bank are generally recognised on an accrual basiswhen the service has been provided. Fees and commissions arising from negotiating, or participating in the nego-tiation of a transaction for a third party, such as the acquisition of loans, shares or other securities, are recognisedon completion of the underlying transaction.
H. Trading securitiesTrading securities are securities which were acquired for generating profit from short term fluctuations. These secu-rities are classified as financial assets at fair value through profit and loss. Trading securities are initially recognisedat cost on a settlement date basis and subsequently re-measured at fair value based on quoted bid prices. All relat-ed realised and unrealised gains and losses are included in net trading income. Interest earned whilst holding trad-ing securities is reported as interest income.However, in a developing capital market, the prices with which transactions are realised can be different from quot-ed prices. While management has used available market information in estimating fair value, the market informa-tion may not be fully reflective of the value that could be realised in the current circumstances.
I. Sale and repurchase agreementsSecurities sold subject to a linked repurchase agreements (‘repos’) are retained in the financial statements as trad-ing securities and the counterparty liability is included in amounts due to other banks, or due to customers, as appro-priate. Securities purchased under agreements to resell (‘reverse repos’) are recorded as loans and advances toother banks or customers as appropriate. The difference between sale and repurchase price is treated as interestand accrued over the life of repo agreements using the effective yield method.
J. Investment securitiesThe Bank classified its investment securities into the following two categories: held-to-maturity and available-for-sale assets. Investment securities with fixed maturity where management has both the intent and the ability to holdto maturity are classified as held-to-maturity. Investment securities intended to be held for an indefinite period oftime, which may be sold in response to needs for liquidity or changes in interest rates, exchange rates or equityprices are classified as available-for-sale.Management determines the appropriate classification of its investments at the time of the purchase.Investment securities are initially recognised at cost (which includes transaction costs). Debt securities, available-for-sale are subsequently re-measured at fair value based on quoted bid prices or amounts derived from cash flowmodels. Unrealised gains and losses arising from changes in the fair value of securities classified as available-for-sale are recognised in equity. Equity securities classified as available-for-sale investments comprise unlisted shares,for which fair values cannot be measured reliably and are recognised at cost less impairment. When the securitiesare disposed of or impaired, the related accumulated fair value adjustments are included in the income statementas gains less losses from investment securities.Held-to-maturity investments are carried at amortised cost using the effective yield method, less any provision forimpairmentA financial asset is impaired if its carrying value is greater than its estimated recoverable amount. The amount ofthe impairment loss for assets carried at amortised cost is calculated as the difference between the asset’s carryingamount and the present value of expected future cash flows discounted at the financial instrument’s original effec-tive interest rate. By comparison, the recoverable amount of an instrument measured at fair value is the presentvalue of expected future cash flows discounted at the current market rate of interest for a similar financial asset.Interest earned whilst holding investment securities is reported as interest income.
K. Loans and impairment lossesLoans originated by the Bank by providing money directly to the borrower or to a sub-participation agent at drawdown, other than those that are originated with the intent of being sold immediately or in the short term whichare recoded as trading assets, are categorised as loans originated by the Bank and are carried at amortised cost,which is defined as the fair value of cash consideration given to originate those loans as is determinable by refer-ence to market prices at origination date. Debt securities acquired at the primary market which are not traded onan active market are classified as loans. Third party expenses, such as legal fees, incurred in securing a loan aretreated as part of the cost of the transaction.All loans and advances are recognised when cash is advanced to borrowers.Impairment for loan losses is established if there is objective evidence that the Bank will not be able to collect allamounts due according to the original contractual terms of loans, in line with IFRS. The amount of the impairment

31
A n n u a l R e p o r t 2 0 0 5 Consol idated F inancia l Statements
is the difference between the carrying amount and the recoverable amount, being the present value of expectedcash flows, including amounts recoverable from guarantees and collateral, discounted at the original effective inter-est rate of loans.The impairment for loan losses also covers losses where there is objective evidence that probable losses are presentin components of the loan portfolio at the balance sheet date. These have been estimated based upon historical pat-terns of losses in each component, the credit ratings allocated to the borrowers and reflecting the current economicclimate in which the borrowers operate. When a loan is uncollectable, it is written off against the related provisionfor impairments. Subsequent recoveries are credited to the provision for loan losses in the income statement.
L. Property and equipmentAll property and equipment is stated at historical cost less depreciation except land and buildings which are carriedat fair value. The last revaluation of land and buildings has been made at the end of 2003 and the appraisal hasbeen performed by a qualified independent valuer.Depreciation is calculated on the straight line method to write off the cost of each asset to their residual values overtheir estimated useful life. Construction in progress is not depreciated until it is transferred into use. Land is also notdepreciated.The estimated useful life of assets is as follows:
Years of useful life
2005 2004
Tangible fixed assets
Buildings for own use 33 33
Furniture and installations 5 – 7 5 – 7
Office and data processing equipment 5 – 9 5 – 9
Motor vehicles 4 4
Intangible fixed assets 5 – 7 5 – 7
Where the carrying amount of an asset is greater than its estimated recoverable amount, it is written down imme-diately to its recoverable amount. Gains and losses on disposal of property and equipment are determined by re-ference to their carrying amount and are taken into account in determining net operating income.Repairs and maintenance are charged to the income statement when the expenditure is incurred.In accordance with decision taken by the MB the implemented new information system in 2004 has 7 years useful life.
M. Operating leasesPayments made under operating leases are charged against income in equal instalments over the period of the lease.
N. ProvisionsProvisions are recognised when the Bank has a present legal or constructive obligation as a result of past events, itis probable that an outflow of resources embodying economic benefits will be required to settle the obligation, anda reliable estimate of the amount of the obligation can be made.In accordance with IAS 19 “Employee benefits” the bank has accrued expenses for unused annual leave and duepayments for post – employment benefits.
O. Critical accounting estimates, and judgements in applying accounting policiesThe Bank makes estimates and assumptions that affect the reported amounts of assets and liabilities within thenext financial year. Estimates and judgements are continually evaluated and are based on historical experience andother factors, including expectations of future events that are believed to be reasonable under the circumstances.
(i) Impairment losses on loans and advancesThe Bank reviews its loan portfolios to assess impairment on a monthly basis. In determining whether an impair-ment loss should be recorded in the income statement, the Bank makes judgements as to whether there is anyobservable data indicating that there is a measurable decrease in the estimated future cash flows from a portfolioof loans before the decrease can be identified with an individual loan in that portfolio. These evidences may includeobservable data indicating that there has been an adverse change in the payment status of borrowers in a group,or national or local economic conditions that correlate with defaults on assets in the group. Management uses esti-mates based on historical loss experience for assets with credit risk characteristics and objective evidence of impair-ment similar to those in the portfolio when scheduling its future cash flows. The methodology and assumptions used

32
A n n u a l R e p o r t 2 0 0 5Consol idated F inancia l Statements
for estimating both the amount and timing of future cash flows are reviewed regularly to reduce any differencesbetween loss estimates and actual loss experience.
ii). Income taxesTaxation has been provided for in the financial statements in accordance with Bulgarian legislation currently in force.The charge for taxation in the income statement for the year comprises current tax and changes in deferred tax.Current tax is calculated on the basis of the taxable profit for the year, using the tax rates enacted at the balancesheet date. Taxes other than those related to income are recorded within operating expenses.Deferred income tax is provided in full, using the liability method, on temporary differences arising between the taxbases of assets and liabilities and their carrying amounts in the financial statements. The tax rate applicable for 2006is applied in the calculation of of deferred income tax amount.The principal temporary differences arise from depreciation of property and equipment, provisions and other accruals.Deferred tax assets are recognised to the extent that it is probable that future taxable profit will be available againstwhich the temporary differences can be utilised.
P. Standards, Interpretations and amendments to published International Financial ReportingStandards that are not yet effective and might be relevant to the Bank’s activities
⁄ IFRS 7 Financial Instruments: Disclosures (effective from 1 January 2007)The Standard will require increased disclosure in respect of the Bank’s financial instruments. It supersedes IAS 30Disclosures in the Financial Statements of Banks and Similar Financial Institutions and is applicable to all entities thatprepare financial statements in accordance with IFRSs.
The Bank considers that the significant additional disclosures required will relate to its financial risk managementobjectives, policies and processes.
⁄ Amendment to IAS 1 Presentation of Financial Statements – Capital Disclosures (effectivefrom 1 January 2007)
As a complimentary amendment arising from IFRS 7 (see above), the Standard will require increased disclosure inrespect of the Bank’s capital.
This amendment will require significantly more disclosures regarding the capital structure of the Bank.
⁄ Amendment to IAS 39 Financial Instruments: Recognition and Measurement – Cash FlowHedge Accounting of Forecast Intragroup Transactions (effective from 1 January 2006)
The amendment allows the foreign currency risk of a highly probable forecast intragroup transaction to qualify as ahedged item if certain criteria are met.
This amendment is not relevant to the Bank’s operations, as the Bank does not have any intragroup transactionsthat would qualify as a hedged item in the consolidated financial statements.
⁄ Amendment to IAS 39 Financial Instruments: Recognition and Measurement – The Fair ValueOption (effective from 1 January 2006)The amendment restricts the designation of financial instruments as “at fair value through profit or loss”.
The Bank believes that this amendment should not have a significant impact on the classification of financial instru-ments, as the Bank should be able to comply with the amended criteria for the designation of financial instrumentsat fair value through profit or loss.
⁄ Amendment to IAS 39 Financial Instruments: Recognition and Measurement and IFRS 4Insurance Contracts – Financial Guarantee Contracts (effective from 1 January 2006)
The amendment requires guarantees that are not insurance contracts to be measured at fair value upon initial recog-nition.
The Bank has not yet completed its analysis of the impact of the amendment.

33
A n n u a l R e p o r t 2 0 0 5 Consol idated F inancia l Statements
2. Financial Risk Management
A. Strategy in using financial instrumentsBy its nature the Bank’s activities are principally related to the use of financial instruments including derivatives. TheBank accepts deposits from customers at fixed rates and for various periods and seeks to earn above average inter-est margins by investing these funds in high quality assets. The Bank seeks to increase these margins by consoli-dating short-term funds and lending for longer periods at higher rates whilst maintaining sufficient liquidity to meetall claims that might fall due.The Bank also seeks to raise its interest margins by obtaining above average margins, net of provisions, throughlending to commercial borrowers with a range of credit standing. Such exposures involve not just on-balance sheetloans and advances but the Bank also enters into guarantees and other commitments such as letters of credit andbonds of performance.The Bank also trades in financial instruments where it takes positions in traded and over the counter instrumentsincluding derivatives to take advantage of short-term market movements in currency and interest rate prices. TheManagement places trading limits on the level of exposure that can be taken in relation to both overnight and intra-day market positions. With the exception of specific hedging arrangements, foreign exchange and interest rateexposures associated with these derivatives are normally offset by entering into counterbalancing positions, there-by controlling the variability in the net cash amounts required to liquidate market positions.
B. Credit riskThe Bank assumes exposure to credit risk which is the risk that a counterparty will be unable to pay amounts in fullwhen due. The Bank structures the levels of credit risk it undertakes by placing limits on the amount of risk acceptedin relation to one borrower, or groups of borrowers, and the geographical and industry segments. Such risks aremonitored on a revolving basis and subject to an annual or more frequent review.The exposure to any one borrower including banks and brokers is further restricted by sub-limits covering on andoff-balance sheet exposures and daily delivery risk limits in relation to trading items such as forward foreignexchange contracts. Actual exposures against limits are monitored regularly.Exposure to credit risk is managed through regular analysis of the ability of borrowers and potential borrowers tomeet interest and capital repayment obligations and reviewing these lending limits where appropriate. Exposure tocredit risk is also managed in part by obtaining collateral and corporate and personal guarantees.
DerivativesThe Bank maintains strict control limits on net open derivative positions, i.e. the difference between purchase andsale contracts, by both amount and term. At any time the amount subject to credit risk is limited to the current fairvalue of instruments that are favourable to the Bank (i.e. assets), which in relation to derivatives is only a smallfraction of the contract or notional values used to express the volume of instruments outstanding. This credit riskexposure is managed as part of the overall lending limits with customers, together with potential exposures frommarket movements. Collateral or other security is not usually obtained for credit risk exposures on these instru-ments, except where the Bank requires margin deposits from counterparties.
Credit related commitmentsThe primary purpose of these instruments is to ensure that funds are available to a customer as required. Guaran-tees and standby letters of credit, which represent irrevocable assurance that the Bank will make the payments inthe event that a customer cannot meet its obligations to third parties, carry the same credit risk as loans. Documen-tary and commercial letters of credit, which are written undertakings by the Bank on behalf of a customer autho-rising a third party to draw drafts on the Bank up to a stipulated amount under specific terms and conditions, arecollateralised mainly by cash or other form of collateral by the underlying shipments of goods to which they relateand therefore carry less risk than a direct borrowing.Commitments to extend credit represent unused approved credit in the form of loans, guarantees or letters of credit.With respect to credit risk on commitments to extend credit, the Bank is potentially exposed to loss in an amountequal to the total unused commitments. However, the likely amount of loss is less than the total commitments sincemost commitments to extend credit are contingent upon customers maintaining specific credit standards. The Bankmonitors the term to maturity of credit commitments because longer-term commitments generally have a greaterdegree of credit risk than shorter-term commitments.

34
A n n u a l R e p o r t 2 0 0 5Consol idated F inancia l Statements
Geographical concentration of assets and liabilitiesThe Bank’s exposure to credit risk is concentrated in the areas specified in the table below. Operations connected toBulgaria include all primary business segments. The predominant activity in Italy, Germany, USA and other OECDcountries is related to corporate and treasury operations. The loan customers of the Bank are mainly Bulgarian, andall placements and current accounts with foreign banks are domiciled in OECD countries.
In thousands of BGN
As at 31 December 2005 Total assets Total liabilities Commitments
Bulgaria 2,548,426 2,573,597 454,404
Italy 181,343 92,026 6,409
Germany 185,439 22,806 11,656
USA 114,203 3,301 2,993
Other OECD countries 361,138 145,301 41,678
Other countries 84,280 28,189 65,826
3,474,829 2,865,220 582,966
Unallocated assets/liabilities – – –
3,474,829 2,865,220 582,966
As at 31 December 2004
Bulgaria 2,325,961 2,968,993 405,210
Italy 506,157 16 794 7,488
Germany 82,440 2,515 15,720
USA 134,703 25,750 5,600
Other OECD countries 353,675 16,255 72,697
Other countries 211,760 10,277 76,345
3,614,696 3,040,584 583,060
Unallocated assets/liabilities – – –
3,614,696 3,040,584 583,060
The Bank’s loan portfolio is exposed to different sectors of the Bulgarian economy. However, credit risk is well spreadover a diversity of individual and commercial customers.
C. Market riskThe Bank assumes in a prudent manner exposures to market risks, arising from open positions in interest rate, cur-rency and equity products, all of which are exposed to general and specific market movements. The Bank estimatesthe market risk of positions held and the maximum losses expected, based upon a number of assumptions for various changes in market conditions. The Bank applies limits on the value of risk that may be accepted, which ismonitored on a regular basis.
D. Currency riskThe Bank assumes exposures to effects of fluctuations in the prevailing foreign currency exchange rates on its finan-cial position and cash flows. The Bank applies limits on the level of exposure by currency which are monitored regularly.The table below summarises the Bank’s exposure to foreign currency exchange rate risk at 31 December 2005.Included in the table are the Bank’s assets and liabilities at carrying amounts, categorized by currency.As a result of the Currency Board in place in Bulgaria, the Bulgarian currency is pegged to the Euro. As the currencyin which the Bank presents it financial statements is the Bulgarian lev, the Bank`s financial statements are effectedby movements in the exchange rates between the Bulgarian lev and currencies other than the Euro.

35
A n n u a l R e p o r t 2 0 0 5 Consol idated F inancia l Statements
In thousands of BGN
As at 31 December 2005 BGN USD EUR Other Total
currencies (net)
Assets
Cash and balances with Central bank 122,228 5,209 108,677 2,650 238,764
Due from other banks 18,885 198,878 174,147 13,442 405,352
Trading securities 94,337 – 21,158 – 115,495
Derivative financial instruments – 5,489 8,894 – 14,383
Loans and advances to customers 724,214 60,454 888,396 294 1,673,358
Investment securities 312,915 315,058 227,098 8,567 863,638
Goodwill 416 – – – 416
Other assets 8,963 47 – – 9,010
Property and equipment 154,413 – – – 154,413
Total Assets 1,436,371 585,135 1,428,370 24,953 3,474,829
Liabilities
Due to other banks 14,592 19,042 16,046 610 50,290
Derivative financial instruments – 7,568 2,727 359 10,654
Due to customers 907,558 621,830 1,038,019 51,364 2,618,771
Long-term borrowings – – 92,927 – 92,927
Other liabilities 24,129 1,193 2,488 1,132 28,942
Deferred tax 13,798 – – – 13,798
Provisions 4,295 26,715 3,546 15,282 49,838
Total Liabilities 964,372 676,348 1,155,753 68,747 2,865,220
Net Position 471,999 (91,213) 272,617 (43,794) 609,609
Commitments 281,195 77,437 193,040 31,294 582,966
As at 31 December 2004
Total Assets 1,264,559 609,601 1,693,402 47,134 3,614,696
Total Liabilities 766,836 644,394 1,570,710 58,644 3,040,584
Net Position 497,723 (34,793) 122,692 (11,510) 574,112
Commitments 222,356 115,727 196,655 48,322 583,060
E. Interest rate riskThe Bank applies limits on the overall interest rate exposure that may be undertaken, which is monitored regularly.The Management is satisfied that the Bank’s position is such that exposure to movements in interest rates is minimised.The table below summarises the Bank’s exposure to interest rate risks. Included in the table are the Bank’s assetsand liabilities at carrying amounts, categorised by the earlier of contractual reprising or maturity dates. The carry-ing amounts of derivative financial instruments which are principally used to reduce the Bank’s exposure to inter-est rate movements are included in ‘Other assets’ and ‘Other liabilities’ under the heading ‘Non-interest bearing’.The off-balance sheet gap represents the net notional amounts of all interest-rate sensitive derivative financialinstruments.

36
A n n u a l R e p o r t 2 0 0 5Consol idated F inancia l Statements
In thousands of BGN
As at 31 December 2005 Up to 1 1-3 3-12 Over Non-interest Total
month months months 1 year bearing
Assets
Cash and balances with Central bank – – – – 238,764 238,764
Due from other banks 400,707 – – – 4,645 405,352
Trading securities 3,716 – 27,120 84,659 – 115,495
Derivatives – – – – 14,383 14,383
Loans and advances to customers 1,663,023 895 5,638 1,863 1,939 1,673,358
Investment securities 95,109 50,280 82,212 630,684 5,353 863,638
Goodwill – – – – 416 416
Other assets – – – – 9,010 9,010
Property and equipment – – – – 154,413 154,413
Total Assets 2,162,555 51,175 114,970 717,206 428,923 3,474,829
Liabilities
Due to other banks 35,547 2,801 – – 11,942 50,290
Derivatives – – – – 10,654 10,654
Due to customers 2,124,055 152,519 179,434 69,564 93,199 2,618,771
Long-term borrowings 39,299 24,205 29,423 – – 92,927
Other liabilities – – – – 28,942 28,942
Deferred tax – – – – 13,798 13,798
Provisions – – – – 49,838 49,838
Total Liabilities 2,198,901 179,525 208,857 69,564 208,373 2,865,220
Total interest sensitivity gap (36,346) (128,350) (93,887) 647,642 220,550 609,609
The table below summarises the interest rate by major currencies for monetary financial instruments for 2005:
2005 BGN EUR USD
Assets
Current accounts – 0.73% 3.26%
Due from other banks 2.22% 2.20% 3.24%
Trading securities 5.81% 7.01% 6.65%
Loans and advances to customers 8.59% 6.22% 5.97%
Investment securities 5.94% 5.12% 3.72%
Liabilities
Time deposits from other banks 2.01% 2.70% 2.78%
Long-term borrowings from banks – 3.01% –
Current accounts of other banks 0.10% 0.10% 0.08%
Time deposits from customers 2.89% 1.61% 0.74%
Current accounts of customers 0.11% 0.81% 0.15%
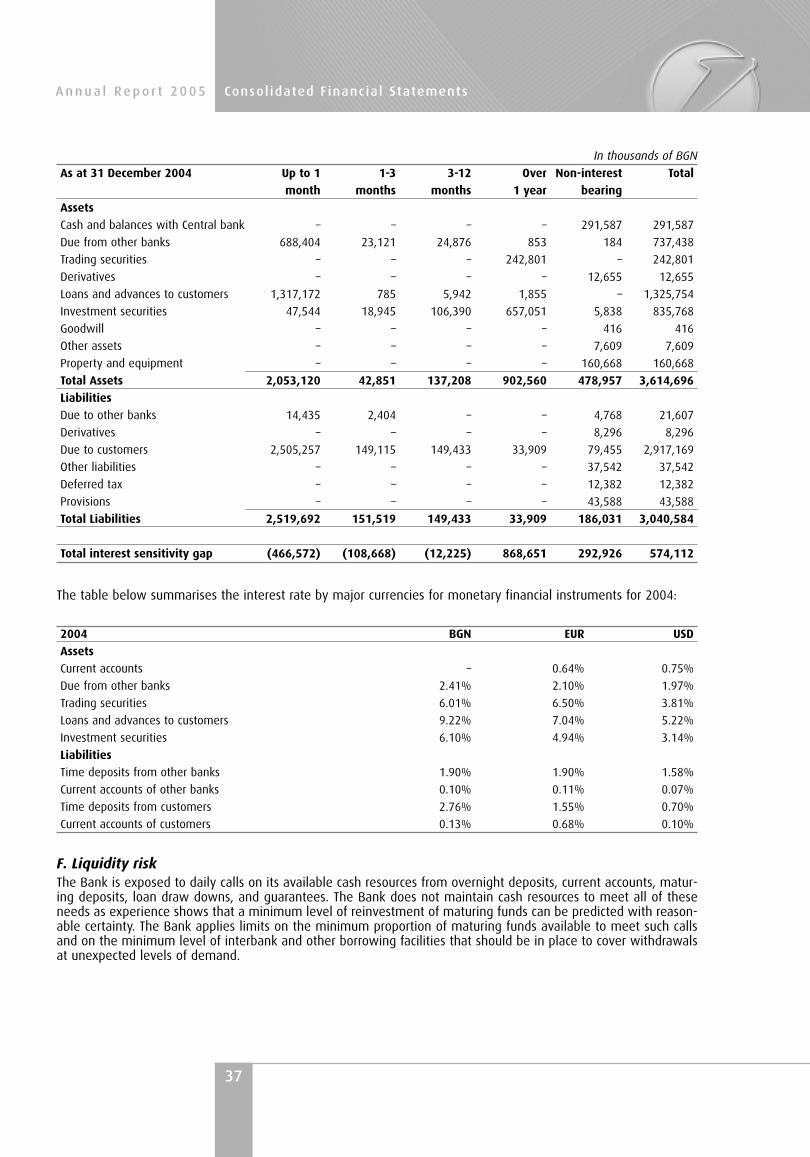
37
A n n u a l R e p o r t 2 0 0 5 Consol idated F inancia l Statements
In thousands of BGN
As at 31 December 2004 Up to 1 1-3 3-12 Over Non-interest Total
month months months 1 year bearing
Assets
Cash and balances with Central bank – – – – 291,587 291,587
Due from other banks 688,404 23,121 24,876 853 184 737,438
Trading securities – – – 242,801 – 242,801
Derivatives – – – – 12,655 12,655
Loans and advances to customers 1,317,172 785 5,942 1,855 – 1,325,754
Investment securities 47,544 18,945 106,390 657,051 5,838 835,768
Goodwill – – – – 416 416
Other assets – – – – 7,609 7,609
Property and equipment – – – – 160,668 160,668
Total Assets 2,053,120 42,851 137,208 902,560 478,957 3,614,696
Liabilities
Due to other banks 14,435 2,404 – – 4,768 21,607
Derivatives – – – – 8,296 8,296
Due to customers 2,505,257 149,115 149,433 33,909 79,455 2,917,169
Other liabilities – – – – 37,542 37,542
Deferred tax – – – – 12,382 12,382
Provisions – – – – 43,588 43,588
Total Liabilities 2,519,692 151,519 149,433 33,909 186,031 3,040,584
Total interest sensitivity gap (466,572) (108,668) (12,225) 868,651 292,926 574,112
The table below summarises the interest rate by major currencies for monetary financial instruments for 2004:
2004 BGN EUR USD
Assets
Current accounts – 0.64% 0.75%
Due from other banks 2.41% 2.10% 1.97%
Trading securities 6.01% 6.50% 3.81%
Loans and advances to customers 9.22% 7.04% 5.22%
Investment securities 6.10% 4.94% 3.14%
Liabilities
Time deposits from other banks 1.90% 1.90% 1.58%
Current accounts of other banks 0.10% 0.11% 0.07%
Time deposits from customers 2.76% 1.55% 0.70%
Current accounts of customers 0.13% 0.68% 0.10%
F. Liquidity riskThe Bank is exposed to daily calls on its available cash resources from overnight deposits, current accounts, matur-ing deposits, loan draw downs, and guarantees. The Bank does not maintain cash resources to meet all of theseneeds as experience shows that a minimum level of reinvestment of maturing funds can be predicted with reason-able certainty. The Bank applies limits on the minimum proportion of maturing funds available to meet such callsand on the minimum level of interbank and other borrowing facilities that should be in place to cover withdrawalsat unexpected levels of demand.

38
A n n u a l R e p o r t 2 0 0 5Consol idated F inancia l Statements
The table analyses assets and liabilities of the Bank into relevant maturity groupings based on the remaining peri-od at balance sheet date to the contractual maturity date.
In thousands of BGN
As at 31 December 2005 Up to 1 1-3 3-12 Over Non-stated Total
month months months 1 year maturity
Assets
Cash and balances with Central bank 238,764 – – – – 238,764
Due from other banks 371,729 – 16,560 17,026 37 405,352
Trading securities 115,495 – – – – 115,495
Derivatives – – – – 14,383 14,383
Loans and advances to customers 92,224 117,465 635,861 827,808 – 1,673,358
Investment securities 76,372 25,023 111,713 645,177 5,353 863,638
Goodwill – – – – 416 416
Other assets – – – – 9,010 9,010
Property and equipment – – – – 154,413 154,413
Total Assets 894,584 142,488 764,134 1,490,011 183,612 3,474,829
Liabilities
Due to other banks 44,890 3,790 284 567 759 50,290
Derivatives – – – – 10,654 10,654
Due to customers 950,162 152,232 176,013 1,340,364 – 2,618,771
Long-term borrowings 382 – 1,956 90,589 – 92,927
Other liabilities – – – – 28,942 28,942
Deferred tax – – – – 13,798 13,798
Provisions – – – – 49,838 49,838
Total Liabilities 995,434 156,022 178,253 1,431,520 103,991 2,865,220
Net Liquidity Gap (100,850) (13,534) 585,881 58,491 79,621 609,609
As at 31 December 2004
Total Assets 1,528,824 103,053 639,174 1,156,438 187,207 3,614,696
Total Liabilities 1,390,653 151,019 145,426 1,251,026 102,460 3,040,584
Net Liquidity Gap 138,171 (47,966) 493,748 (94,588) 84,747 574,112
G. Fair values of financial assets and liabilitiesInternational Accounting Standards 32 “Financial Instruments: Disclosure and Presentation”, requires disclosure ofinformation about fair value of the financial assets and liabilities. In the notes to the financial statements fair valuefor this purpose is defined as the amount for which an asset can be exchanged or a liability settled, between knowl-edgeable, willing parties in an arm length transaction. Sufficient market experience, stability and liquidity do notcurrently exist for certain purchases and sales of loans and other financial assets or liabilities for which publishedmarket information is not readily available. Accordingly, their fair values cannot be readily determined. In the opin-ion of the Management, their reported carrying amounts are the most valid and useful reporting value in the cir-cumstances.
Management has estimated that the fair value of certain balance sheet instruments is not materially different fromtheir recorded values. These balance sheet instruments include cash, nostros and term deposits, placements withbanks and other financial institutions, securities held for trading, debt securities classified as available-for-saleinvestments, deposits from banks and other financial institutions, current accounts and deposits from customers,and other short-term assets and liabilities which are of contractual nature.

39
A n n u a l R e p o r t 2 0 0 5 Consol idated F inancia l Statements
3. Net interest income
In thousands of BGN
Year ended 31 December
2005 2004
Interest incomeInterest income arises from:
Due from banks 10,752 10,724
Loans and advances to customers 133,246 94,587
Investment securities 39,579 41,628
Trading securities 8,336 11,799Other financial instruments 1,150 85
193,063 158,823Interest expenseInterest expense arises from:
Due to other banks (2,325) (334)Due to customers (24,647) (21,453)Other financial instruments (3,241) (2,534)
(30,213) (24,321)
Net interest income 162,850 134,502
4. Net fee and commission income
In thousands of BGN
Year ended 31 December
2005 2004
Fee and commission incomeClean payments 17,235 15,268Card transactions 8,545 7,465Cash operations 5,858 5,287Opening and maintenance of accounts 5,133 5,325Packages 3,208 2,075Documentary operations 3,128 4,029Agency commissions 27 139Other 5,371 3,524
48,505 43,112Fee and commission expense
Card transactions (2,701) (2,202)Maintenance of correspondent accounts (372) (359)Other (775) (793)
(3,848) (3,354)
Net fee and commission income 44,657 39,758
5. Net trading income
In thousands of BGN
Year ended 31 December
2005 2004
Net trading income arises from:
Trading securities 2,402 5,940
Derivative financial instruments 2,361 (3,242)
Foreign exchange fluctuations and related derivatives 6,852 1,620
11,615 4,318

40
A n n u a l R e p o r t 2 0 0 5Consol idated F inancia l Statements
6. Gains less losses from investment securitiesIn thousands of BGN
Year ended 31 December2005 2004
Net gain on disposal 4,111 7,042Market revaluation of securities, net (1,021) –
3,090 7,042
7. Operating expensesIn thousands of BGN
Year ended 31 December2005 2004
Staff costs (33,266) (30,319)Depreciation and amortization (16,773) (13,307)IT maintenance (7,714) (11,836)Deposit Insurance Fund contribution (8,734) (8,262)External services purchased (8,647) (7,256)Post and telephone (2,718) (2,402)Repairs and maintenance of property and equipment (2,172) (1,933)Advertising (1,742) (1,625)Stationery (1,748) (1,517)Non-recoverable levies and taxes (1,296) (1,327)Heating and lighting (1,187) (1,201)Operating lease rentals (1,927) (1,148)Other (1,857) (1,953)
(89,781) (84,086)
8. Staff costsIn thousands of BGN
Year ended 31 December2005 2004
Wages and salaries, including incentive schemes (26,779) (23,858)Social security cost (6,487) (6,461)
(33,266) (30,319)
The average number of persons employed by the bank during the year was 1,917 (1,967 for 2004 г.).
9. Impairment losses and provisions
In thousands of BGNYear ended 31 December2005 2004
Impairment losses:Write downs
Due from other banks – –Loans and advances to customers (30,247) (19,823)Other assets (437) –
(30,684) (19,823)Reversal of write downs
Due from other banks 38 25Loans and advances to customers 11,453 7,711Other assets – 115
11,491 7,851
Net impairment losses (19,193) (11,972)
Net change in provisions (6,250) 4,253Total impairment losses and provisions (25,443) (7,719)

41
A n n u a l R e p o r t 2 0 0 5 Consol idated F inancia l Statements
10. Other operating income, net
In thousands of BGN
Year ended 31 December
2005 2004
Other operating income
Received insurance premiums 765 1,032
Vaults 668 671
Disposal of property and equipment 584 994
Rental services 102 68
Court proceeds 92 21
Armoured car transportation services 70 251
Release of Deposit Insurance Fund accrual – 8,262
Write-off of long-term dormant positions – 48
Other 4,306 1,718
6,587 13,065
Other operating expense
Charities and contributions (90) (110)
Other (120) (105)
(210) (215)
Other operating income, net 6,377 12,850
11. Income tax expenseTaxation is payable at a statutory rate of 15 % on adjusted profits under the annual tax return prepared under theBulgarian tax law. Deferred tax is calculated using a tax rate of 15 %, applicable for 2006.
The breakdown of tax charges in the income statement is as follows:
In thousands of BGN
Year ended 31 December
2005 2004
Current tax 15,530 16,053
Deferred tax 1,719 4,333
17,249 20,386
The tax on the Bank’s profit before tax differs from the theoretical amount that would arise using the basic tax rateas follows:
In thousands of BGN
2005 2004
Profit before tax 113,365 106,665
Tax at tax rate in force 17,004 20,800
Temporary tax difference, transformed into permanent 161 –
Tax on expenses not deductible for tax purposes 84 62
Adjustment due to decreased tax rate from 01.01.2005 – (476)
17,249 20,386

42
A n n u a l R e p o r t 2 0 0 5Consol idated F inancia l Statements
12. Cash and balances with central bankIn thousands of BGN
As at 31 December
2005 2004
Cash in hand 47,088 52,327
Precious metals 3 2
Current account with Central Bank – 9,508
Statutory minimum required reserve with Central bank 191,673 229,750
238,764 291,587
The balances held with the Central Bank are operational, serving inter-bank domestic commercial transactions of theBank in Bulgarian Leva. In accordance with the regulations, those funds maintained with the Central Bank did notearn interest during 2005 and 2004.Commercial banks in Bulgaria are required to maintain a minimum reserve with the Central Bank. The minimumreserve is based on a percentage of Bulgarian Leva and foreign currency funds attracted, excluding deposits due tolocal banks. The minimum reserve was established at 8% of deposits. The obligatory reserves denominated in Euroare held in a special reserve account while the BGN denominated component of the reserves is held on the currentaccount maintained with the Central Bank. The Bank has access to 50% of its BGN reserve held with the CentralBank on a daily basis, but is to pay overdraft interest if the average monthly balance on the current account is lessthan the required reserve, until the required reserve level is restored.
13. Due from other banksIn thousands of BGN
As at 31 December
2005 2004
Time deposits (OECD countries) 343,219 705,377
Time deposits with domestic banks 17,858 –
Current accounts 7,712 3,960
Loans and advances 33,586 28,080
Overdrafts 1,163 195
Repo 1,950 –
Gross Total 405,488 737,612
Less provisions for impairment (136) (174)
405,352 737,438
Due from other banks include interest receivable amounting to BGN 215 thousand as of 31.12.2005 and BGN 746thousand as of 31.12.2004.
14. Trading securitiesIn thousands of BGN
As at 31 December
2005 2004
Government bonds (Bulgaria) 98,552 106,648
Corporate bonds of domestic issuers 16,943 –
Government bonds (Other countries) – 136,153
115,495 242,801
Trading securities include interest receivable amounting to BGN 2,660 thousand as of 31.12.2005 and BGN 8,658thousand as of 31.12.2004.

43
A n n u a l R e p o r t 2 0 0 5 Consol idated F inancia l Statements
15. Derivative financial instrumentsThe Bank utilises interest rate swaps representing commitments to exchange one set of cash flows for another.Swaps result in an economic exchange of interest rates (for example, fixed rate for floating rate) and no exchangeof principal takes place. The Bank’s credit risk represents the potential cost to replace the swap contracts if counter-parties fail to perform their obligation. This risk is monitored on an ongoing basis with reference to the current fairvalue, the notional amount of the contracts and the liquidity of the market.Credit derivatives are agreements where the Bank buys or sells credit protection.Currency forwards represent commitments to purchase or sale foreign and domestic currency, including undeliveredspot transactions.Currency options, are contractual agreements under which the seller (writer) grants the purchaser (holder) the right,but not the obligation, either to buy (a call option) or sell (a put option) at or by a set date, a specific amount of aforeign currency at a predetermined price. In consideration for the assumption of foreign exchange risk, the sellerreceives a premium from the purchaser. Options may be either exchange-traded or negotiated between the bankand a customer (OTC).The notional amounts of certain types of financial instruments provide a basis for comparison with instrumentsrecognised on the balance sheet but do not necessarily indicate the amounts of future cash flows involved or thecurrent fair value of the instruments and, therefore, do not indicate the Bank’s exposure to credit or price risks. Thederivative instruments become favourable (assets) or unfavourable (liabilities) as a result of fluctuations in marketinterest rates or foreign exchange rates relative to their terms. The aggregate contractual or notional amount ofderivative financial instruments on hand, the extent to which instruments are favourable or unfavourable and, thusthe aggregate fair values of derivative financial assets and liabilities can fluctuate significantly from time to time.The fair values of outstanding derivative instruments held are set out in the following table.
In thousands of BGN
Contract /notional amount Fair values
Assets Liabilities
As at 31 December 2005
Currency forwards 94,539 965 399
Currency options, bought 29,842 698 –
Currency options, written – – –
Options on capital securities, bought 34,052 1,653 –
Options on capital securities, written 34,052 – 1,653
Forex swaps 74,268 1,934 1,934
Credit default swaps 91,184 1,251 –
Interest rate swaps 124,414 7,882 6,668
Future contracts – – –
482,351 14,383 10,654
As at 31 December 2004
Currency forwards 10,680 154 134
Currency options, bought 16,861 492 –
Currency options, written 16,464 – 492
Options on capital securities, bought 30,278 1,286 –
Options on capital securities, written 30,278 – 1,286
Forex swaps – – –
Credit default swaps 159,187 2,569 –
Interest rate swaps 165,621 8,154 6,373
Future contracts 3,912 – 11
433,281 12,655 8,296

44
A n n u a l R e p o r t 2 0 0 5Consol idated F inancia l Statements
16. Loans and advances to customers
The detail of the balances of this caption by type of customer is as follows:
In thousands of BGN
As at 31 December
2005 2004
Receivables under repurchase agreements 150 –
Receivables under accepted letters of credit 1,939 –
Loans and advances
Private enterprises 1,337,190 1,086,634
State owned enterprises 45,345 91,857
Private individuals 345,243 189,865
1,727,778 1,368,356
Total loans and advances 1,729,867 1,368,356
Less allowance for impairment (56,509) (42,602)
1,673,358 1,325,754
Loans and advances to customers include interest receivable amounting to BGN 5,569 thousand as of 31.12.2005and BGN 4,419 thousand as of 31.12.2004.
The breakdown, by industry, of the commercial loan portfolio, before provisions, is as follows:
In thousands of BGN
As at 31 December
2005 2004
Processing and manufacturing 591,729 505,509
Commerce 333,994 268,201
Tourism 146,993 155,182
Households 345,243 189,865
Agriculture 45,763 36,214
Transport 48,664 13,997
Construction 41,637 18,054
Services 173,023 179,861
Other 732 1,473
1,727,778 1,368,356
The ten largest loan exposures amount to BGN 301,048 thousand or 18 % of the commercial loan portfolio, (354,839thousand or 26% for 2004).

45
A n n u a l R e p o r t 2 0 0 5 Consol idated F inancia l Statements
17. Investment securities
In thousands of BGN
As at 31 December
2005 2004
Debt and other fixed income instrument available for sale
Bonds and notes issued by:
Bulgarian Government 97,112 144,836
Foreign Governments 113,961 9,880
Other issuers 85,222 33,702
296,295 188,418
Listed 165,592 101,380
Unlisted 130,703 87,038
Debt and other fixed income instrument held to maturity
Bonds and notes issued by:
Bulgarian Government 78,426 105,664
Foreign Governments 137,568 46,797
Other issuers 130,653 92,857
346,647 245,318
Listed 296,489 182,738
Unlisted 50,158 62,580
Debt and other fixed income instrument classified as loans and receivables
Bonds and notes issued by:
Bulgarian Government 202,340 217,480
Foreign Governments – 81,800
Other issuers 13,003 96,914
215,343 396,194
Listed – 178,714
Unlisted 215,343 217,480
Following the adoption of the revised IAS 39, Financiual Instruments: Recognition and Measurement, effective from 1 January
2005, the Bank classifies in this category only Bulgarian Government and Other issuers’securities for which no active market
exists.
Equity investments and other non-fixed income instruments available for sale
Equity investments 5,353 5,838
Other – –
5,353 5,838
Listed – –
Unlisted 5,353 5,838
863,638 835,768

46
A n n u a l R e p o r t 2 0 0 5Consol idated F inancia l Statements
Investment securities include interest receivable amounting to BGN 14,909 thousand as of 31.12.2005 and BGN15,726 thousand as of 31.12.2004.The list of the equity securities as at 31 December 2005 is as follows:
In thousands of BGN
As at 31 December 2005 2004
Carrying value Share in % Carrying value Share in %
Orel-G Holding 4,084 19.3 5,105 19.3
Bankservice 345 6.8 345 6.8
Borika EAD 519 5.3 – –
BZOK Zakrila 200 10 200 10
POK Saglasie 159 4.3 159 4.3
SWIFT 30 – 12 –
Burgas Free Trade Zone 12 5.7 12 5.7
Central Depository 3 3 3 3
Bulgarian Stock Exchange 1 0.4 1 0.4
Bulgarhydroponik – – 1 24.8
5,353 5,838
At 31 December 2005, the equity investment in Orel-G Holding was reassessed for impairment. As a result, animpairment loss of BGN 1,021 thousand was recognized.
18. Other assets
In thousands of BGN
As at 31 December
2005 2004
Settlements 3,248 3,905
Prepayments 2,176 554
Materials 503 2,262
Receivables on overpaid taxes 1,995 1,817
Other 2,912 457
Gross Total 10,834 8,995
Less provisions (1,824) (1,386)
9,010 7,609

47
A n n u a l R e p o r t 2 0 0 5 Consol idated F inancia l Statements
19. Property and equipment
In thousands of BGN
Land and Equipment Software Construction Total
Buildings in progress
Movement, incl. revaluation
Balance at 1 January 2004 107,377 39,080 12,882 52,912 212,251
Additions 150 1,454 3,839 1,756 7,199
Disposals (2,052) (7,810) (955) – (10,817)
Transfers 74 3,028 44,558 (53,339) –
Balance at 31 December 2004 105,549 35,752 60,324 1,329 202,954
Additions – 3,051 195 10,764 14,010
Disposals (2,605) (2,434) (251) (538) (5,828)
Transferred to other categories (1,274) 1,274 – – –
Transfers – 2,203 1,643 (3,846) –
Balance at 31 December 2005 101,670 39,846 61,911 7,709 211,136
Accumulated depreciation
Balance at 1 January 2004 7,339 26,745 3,044 – 37,128
Charge for the year 3,082 4,654 5,488 – 13,224
Disposals (455) (6,920) (691) – (8,066)
Balance at 31 December 2004 9,966 24,479 7,841 – 42,286
Charge for the year 3,024 4,845 8,904 – 16,773
Disposals (106) (2,150) (80) – (2,336)
Transferred to other categories (139) 139 – – –
Balance at 31 December 2005 12,745 27,313 16,665 – 56,723
Net Book Value
Balance at 31 December 2004 95,583 11,273 52,483 1,329 160,668
Balance at 31 December 2005 88,925 12,533 45,246 7,709 154,413
20. Due to other banks
In thousands of BGN
As at 31 December
2005 2004
Current accounts
Foreign banks 3,690 1,702
Local banks 11,544 14,479
15,234 16,181
Time deposits – local banks 26,460 4,774
Settlements 759 652
Acceptances under letters of credit 1,939 –
Liabilities under repurchase agreements 5,898 –
35,056 5,426
50,290 21,607

48
A n n u a l R e p o r t 2 0 0 5Consol idated F inancia l Statements
21. Due to customers
In thousands of BGN
As at 31 December
2005 2004
By type of customer
Private individuals 1,248,298 1,080,689
Companies and other entities 1,370,473 1,836,480
2,618,771 2,917,169
By type of instrument
Current accounts 1,253,219 1,578,587
Time deposits 1,264,246 1,290,068
Cover accounts 77,242 34,388
Transfers under execution 22,062 14,126
Liabilities under repurchase agreements 2,002 –
2,618,771 2,917,169
Due to customers include interest payable amounting to BGN 4,683 thousand as of 31.12.2005 and BGN 2,996 thou-sand as of 31.12.2004.
22. Long-term borrowings
In thousands of BGN
As at 31 December
2005 2004
International financial institutions 4,599 –
Foreign banks 88,328 –
92,927 –
Long-term borrowings include interest payable amounting to BGN 509 thousand as of 31.12.2005.
23. Other liabilities
In thousands of BGN
As at 31 December
2005 2004
Payments under execution 11,562 9,793
Due to personnel 8,772 7,096
Tax payable 1,154 2,428
Dividends payable 3,324 152
Payables to suppliers of products for lease 4,130 18,073
28,942 37,542

49
A n n u a l R e p o r t 2 0 0 5 Consol idated F inancia l Statements
24. Deferred income tax
Deferred income taxes are calculated on all temporary differences under the liability method using statutory tax rateof 15 %.Deferred income tax assets and liabilities are attributable to the following items:
In thousands of BGN
As at 31 December
2005 2004
Deferred income tax liabilities
Property and equipment 16,512 13,711
16,512 13,711
Deferred income tax assets
Other provisions (1,518) (61)
Other liabilities (893) (1,268)
Available-for-sale securities (303) –
(2,714) (1,329)
13,798 12,382
The deferred tax credit in the income statement comprises the following temporary differences:
In thousands of BGN
As at 31 December
2005 2004
Property and equipment 2,801 1,249
Provisions (1,457) 127
Accruals 214 2,957
Other temporary differences 161 –
1,719 4,333
The movement on the deferred income tax account is as follows:
In thousands of BGN
As at 31 December
2005 2004
Balances at 1 January 12,382 11,288
Increase of the net tax liability – in Income Statement 1,719 4,809
Decrease of net diferred tax liability -
negative revaluation reserve of available-for-sale securities (303) –
Decrease of the net tax liability due to change in the tax rate – (3,715)
Balance at 31 December 13,798 12,382

50
A n n u a l R e p o r t 2 0 0 5Consol idated F inancia l Statements
25. ProvisionsProvisions on letters of guarantee and letters of credit relate to claimed financial guarantees and letters of credit,which are in process of dispute with the relevant counterparties. The provisions on outstanding and probable courtproceedings relate to court claims made against the bank, which are also subject to dispute. The timing of utilisingthese provisions is uncertain and depends on the future developments on the relevant cases.
In thousands of BGN
As at 31 December
2005 2004
Provisions on letters of guarantee and letters of credit 34,568 29,960
Provisions on outstanding and probable court proceedings 15,270 13,628
49,838 43,588
26. Contingent liabilities and commitmentsOff-balance sheet commitments. The following table indicates the contractual amounts of the Bank’s off-balancesheet financial instruments before provisions that commit it to extend credit to customers or to cover customer’s lia-bility. Provisions in respect of this disclosure are disclosed in Note 28.
In thousands of BGN
As at 31 December
2005 2004
Letters of credit and letters of guarantee 201,026 234,209
Credit commitments 381,940 348,851
582,966 583,060
Assets pledged. Assets are pledged as collateral related to deposits of budgetary organisations. Mandatory reservedeposits are also held with the Central Bank in accordance with statutory requirements. These deposits are limitedto the Bank’s use in day to day operations.
In thousands of BGN
Asset Related Liability
As at 31 December 2005 2004 2005 2004
Balances with central bank 191,673 229,750 – –
Securities related to deposits of public sector organisations 313,493 427,164 264,334 427,958
505,166 656,914 264,334 427,958
27. Shareholders’ equityShare capitalAs at 31 December 2005, the share capital of Bulbank AD consisted of 166,370,160 fully subscribed and paid regis-tered shares of BGN 1 face value each with the same voting and dividend rights.A summary table with the structure of shareholding at 31 December 2005 is as follows:
As at 31 December 2005 As at 31 December 2004
Shareholder Number Shareholding Number Shareholding
of Shares % of Shares %
UniCredito Italiano SpA 143,294,088 86.1 141,743,445 85.2
International Finance Corporation 8,817,618 5.3 8,817,618 5.3
Allianz AG 8,318,295 5.0 8,318,295 5.0
Simest SpA 4,159,254 2.5 4,159,254 2.5
Financial institutions 18,787 0.0 18,787 0.0
Businesses and non-commercial organisations 1,414,653 0.9 2,952,717 1.8
Private individuals 347,465 0.2 360,044 0.2
166,370,160 100.0 166,370,160 100.0

51
A n n u a l R e p o r t 2 0 0 5 Consol idated F inancia l Statements
28. Movement in impairment losses and provisionsThe table below summarises the allowance for impairment losses and the provisions:
In thousands of BGN
As at 31 December
2005 2004
On-balance sheet
Due from banks 136 174
Loans and advances to customers 56,509 42,602
Other assets 1,824 1,386
58,469 44,162
Off-balance sheet 49,838 43,588
Total Provisions 108,307 87,750
The movement in impairment allowances and provisions is as follows:
In thousands of BGN
As at 31 December
2005 2004
On-balance sheet
Balance at 1 January 44,162 34,869
Increase in impairment allowances 30,684 19,823
Decrease in impairment allowances (11,491) (7,851)
19,193 11,972
Write-offs (4,886) (2,679)
Balances at 31 December 58,469 44,162
Off-balance sheet
Balance at 1 January 43,588 47,878
Provision increase 9,969 409
Provision decrease (3,719) (4,662)
6,250 (4,253)
Write-offs – (37)
Balances at 31 December 49,838 43,588
29. Cash and cash equivalentsFor the purposes of the cash flow statement, cash and cash equivalents comprise balances with less than 90 daysmaturity from the date of acquisition including: cash, balances with the Central Bank excluding the statutory mini-mum required reserve, and amounts due from other banks:
In thousands of BGN
As at 31 December
2005 2004
Cash in hand 47,088 52,327
Demand deposits with banks 7,224 13,158
Time deposits with banks up to 90 days 360,931 683,226
415,243 748,711

52
A n n u a l R e p o r t 2 0 0 5Consol idated F inancia l Statements
30. Related party transactions
Parties are considered to be related if one party has the ability to control the other party or exercise significant influ-ence over the other party in making financial or operational decisions. The Bank is subject to such influence byUniCredito Italiano SpA. A number of banking transactions are entered into with related parties in the normal courseof business. These include loans, deposits, securities purchased and other transactions. These transactions were car-ried out on commercial terms and conditions and at market rates. The volumes of related party transactions withUniCredito Italiano Group members as well as with members of Management Board and Supervisory Board out-standing at the year end are as follows:
In thousands of BGN
UniCredito Italiano Group Management Board and
Supervisory Board
2005 2004 2005 2004
Loans and short term placements 169,616 510,125 499 46
Securities purchased 11,518 – 30 –
Interest income earned 5,898 5,025 23 4
Deposits, long-term borrowing, lease contracts 30,948 259 550 1,119
Interest expense 114 – – –
Operating income 69 32 – –
Operating expenses 1,859 1,795 – –
Commission income 143 38 – –
Commission expenses 254 190 – –
Derivatives at fair value (assets) 4,276 1,366 – –
Derivatives at fair value (liabilities) 10,382 6,339 – –
Letters of Guarantee issued in favour of Bulbank 17,301 2,806 – –
Letters of Guarantee issued by Bulbank 38 373 – –
In 2005, the total remuneration of the members of the Management Board was BGN 1,611 thousand (BGN 1,416thousand for 2004). The remuneration of the members of the Supervisory Board was BGN 24 thousand.
31. Group Entities
The Bank is a subsidiary of UniCredito Italiano SpA, Italy.
The financial statements of Unicredit Leasing Bulgaria EAD with its subsidiary Unicredit Leasing Auto Bulgaria EOODare consolidated into the consolidated fiancial statements of Bulbank.
32. Post balance sheet events
There are no events after the consolidated balance sheet date that would require either adjustments or additionaldisclosures in the consolidated financial statements.

BULBANK AD
UNCONSOLIDATED FINANCIAL STATEMENTS
FOR THE YEAR ENDED 31 DECEMBER 2005PREPARED IN ACCORDANCE WITH
INTERNATIONAL FINANCIAL REPORTING STANDARDSWITH INDEPENDENT AUDITOR`S REPORT THEREON

REPORTOF THE INDEPENDENT AUDITOR
TO THE SHAREHOLDERS OF BULBANK AD
Sofia, 23 February 2006
We have audited the accompanying unconsolidated balance sheet of Bulbank AD (“theBank”) as of 31 December 2005 and the related unconsolidated statements of income,changes in equity and cash flows for the year then ended. These unconsolidated finan-cial statements are the responsibility of the directors. Our responsibility is to expressan opinion on these unconsolidated financial statements based on our audit.
We conducted our audit in accordance with International Standards on Auditing.Those Standards require that we plan and perform the audit to obtain reasonableassurance about whether the consolidated financial statements are free of materi-al misstatement. An audit includes examining, on a test basis, evidence supportingthe amounts and disclosures in the consolidated financial statements. An audit alsoincludes assessing the accounting principles used and significant estimates madeby the directors, as well as evaluating the overall financial statement presentation.We believe that our audit provides a reasonable basis for our opinion.
In our opinion, the unconsolidated financial statements give a true and fair view ofthe unconsolidated financial position of the Bank as of 31 December 2005, and ofthe results of its operations and its cash flows for the year then ended in accor-dance with International Financial Reporting Standards.
Without qualifying our opinion, we draw attention to the fact that the Bank has alsoprepared consolidated financial statements which present the consolidated finan-cial position and the results of its operations, cash flows and changes in equity inaccordance with the International Financial Reporting Standards. As disclosed innote 1(a), the accompanying unconsolidated financial statements are a part of theconsolidated financial statements.
KPMG Bulgaria OOD37, Fridtjof Nansen Str.SofiaBulgaria

55
A n n u a l R e p o r t 2 0 0 5 Unconsol idated F inancia l Statements
Income statement
In thousands of BGN
Year ended 31 December
Notes 2005 2004
Interest income 189,395 157,740
Interest expense (29,834) (24,295)
Net interest income 3 159,561 133,445
Fee and commission income 48,480 43,150
Fee and commission expense (3,848) (3,392)
Net fee and commission income 4 44,632 39,758
Net trading income 5 11,628 4,330
Gains less losses from investment securities 6 3,090 7,042
Other operating income, net 10 6,062 12,836
TOTAL OPERATING INCOME 224,973 197,411
Operating expenses 7,8 (89,015) (83,620)
Impairment losses and provisions 9 (24,835) (7,533)
PROFIT BEFORE TAX 111,123 106,258
Income tax expense 11 (16,913) (20,290)
NET PROFIT FOR THE PERIOD 94,210 85,968

56
A n n u a l R e p o r t 2 0 0 5Unconsol idated F inancia l Statements
Balance sheet
In thousands of BGN
Notes As at 31 December
2005 2004
ASSETS
Cash and balances with central bank 12 238,762 291,584
Due from other banks 13 405,352 737,438
Trading securities 14 115,495 242,801
Derivative financial instruments 15 14,383 12,655
Loans and advances to customers 16 1,613,040 1,311,584
Investment securities 17 865,246 836,376
Other assets 18 3,893 2,251
Property and equipment 19 154,309 160,624
TOTAL ASSETS 3,410,480 3,595,313
LIABILITIES
Due to other banks 20 50,290 21,607
Derivative financial instruments 15 10,654 8,296
Due to customers 21 2,618,897 2,917,428
Long-term borrowings 22 34,022 –
Other liabilities 23 25,590 18,210
Deferred tax liability 24 13,799 12,383
Provisions 25 49,838 43,588
TOTAL LIABILITIES 2,803,090 3,021,512
SHAREHOLDERS’ EQUITY
Share capital 27 166,370 166,370
Statutory reserves 51,155 51,155
Retained earnings 330,158 295,107
Revaluation reserves 59,707 61,169
TOTAL SHAREHOLDERS’ EQUITY 607,390 573,801
TOTAL EQUITY AND LIABILITIES 3,410,480 3,595,313
———————————————— ————————————————Levon Hampartzoumian, Stanislav Georgiev,
Chairman of the Management Board Member of the Management Boardand Chief Executive Officer
23 February 2006

57
A n n u a l R e p o r t 2 0 0 5 Unconsol idated F inancia l Statements
Statement of changes in shareholders’ equity
In thousands of BGN
Share Statutory Retained Property and Investment Total
capital reserve earnings equipment securities
revaluation revaluation
reserve reserve
Balance as of 1 January 2004 166,370 36,684 287,184 60,165 (377) 550,026
Available-for-sale investments
– Net fair value losses – – – – (280) (280)
Transfer to statutory reserves – 14,471 (14,471) – – –
Transfer of revaluation reserves
on realised surplus – – 1,578 (1,578) – –
Net profit for the year – – 85,968 – – 85,968
Dividend distribution – – (65,118) – – (65,118)
Lower tax rate effect – – – 3,239 – 3,239
Other distribution – – (34) – – (34)
Balance as of 31 December 2004 166,370 51,155 295,107 61,826 (657) 573,801
Balance as of 1 January 2005 166,370 51,155 295,107 61,826 (657) 573,801
Available-for-sale investments
– Net fair value losses – – – – (1,060) (1,060)
Transfer of revaluation reserves
on realised surplus – – 402 (402) – –
Net profit for the year – – 94,210 – – 94,210
Dividend distribution – – (59,177) – – (59,177)
Other distribution – – (384) – – (384)
Balance as of 31 December 2005 166,370 51,155 330,158 61,424 (1,717) 607,390

58
A n n u a l R e p o r t 2 0 0 5Unconsol idated F inancia l Statements
Cash flow statement
In thousands of BGN
Notes Year ended 31 December
2005 2004
Profit/(loss) after taxation 94,210 85,968
(Decrease)/Increase in impairment losses for bad
and doubtful debts and other assets 9 18,585 11,786
Increase/decrease other accruals (17,393) 55,876
Increase/decrease in provisions 9 6,250 (4,253)
Depreciation 7 16,754 13,218
Foreign exchange (gains)/losses 1,669 (6,686)
Unrealised (gains)/losses on securities 6,359 (5,269)
Deferred tax 11 1,719 4,334
Tax expense 11 15,194 15,956
Loss/(Profit) on disposal of fixed assets (585) (994)
Other non-cash movements – 6,600
142,762 176,536
Change in operating assets
(Increase)/decrease in obligatory reserve with the National Bank 12 38,077 (81,898)
(Increase)/decrease in Trading securities 125,040 (167,317)
(Increase)/decrease in loans and advances to banks
(repayment beyond 3 months) 45,722 (2,860)
(Increase)/decrease in loans to customers (300,435) (467,504)
(Increase)/decrease in other assets (2,080) 895
(93,676) (718,684)
Change in operating liabilities
Net increase/(decrease) in deposits from banks 61,896 8,632
Net increase/(decrease) in amounts owed to other depositors (393,890) 782,848
Net decrease in accrued other liabilities – (68,367)
Income tax paid (12,250) (16,488)
Dividend paid (56,005) (65,099)
(400,249) 641,526
Net cash flow from operating activities (351,163) 99,378
Cash flow from investing activities
(Purchase) of tangible fixed assets 19 (13,931) (7,149)
Proceeds from the sale of non-current assets 4,077 2,790
Acquisition of investments – 14,630
Sale of investments 27,550 –
Net cash flows from investing activities 17,696 10,271
NET CHANGE IN CASH AND CASH EQUIVALENTS (333,467) 109,649
CASH AT THE BEGINNING OF THE PERIOD 29 748,708 639,059
CASH AT THE END OF THE PERIOD 29 415,241 748,708

59
A n n u a l R e p o r t 2 0 0 5 General Informat ion
GENERAL INFORMATION
Basic information for Bulbank
Establishment – April 1st, 1964
Major shareholdersDecember 31 2005
Shareholder Number of shares Share in %UniCredito Italiano SpA 143,294,088 86.1International Financial Corporation 8,817,618 5.3Alianz AG 8,318,295 5.0Simest SpA 4,159,254 2.5
Scope of activities
The bank holds a full banking license from the Bulgarian National Bank, thereby entitled to conduct all types ofbanking transactions permitted by the laws of Bulgaria. It is an universal bank providing a wide range of servicesto business, private individuals and institutions:
• Loans• Deposits and savings accounts• Clean payments• Documentary payments and trade finance• Foreign exchange operations• Securities trading and custody• Asset management, including sales of mutual funds• Cash management• Derivatives• Bank cards• Mass payments• Electronic and internet-services• Financial advisory• Leasing• Factoring
Operational AddressesBULBANK AD – Head Office1000 Sofia, 7 Sveta Nedelya Sq.Fax: 988 4636; 988 5370Telex: 22031Tel.: 923 2111SWIFT: BFTBBGSFE-mail: [email protected]://www.bulbank.bg
Treasury & Capital Markets Fax: 988 4636; 988 5370; Tel.: 923 2560; REUTERS: BULB
Retail Banking Tel.: 923 2940; 923 2411
Corporate Banking Fax: 923 2877; Tel.: 923 2600
Operations Fax: 923 2449; Tel.: 923 2450
Public Relations Tel.: 923 2300; Fax: 923 2183
IT Fax: 923 2519; Tel.: 923 2380
International Banking Fax: 923 2607; Tel.: 923 2730
Credit & Risk Management Fax: 923 2599; Tel.: 923 2721; 923 2362
Planning & Control Fax: 923 2607; Tel.: 923 2345
Administration & Logistics Fax: 923 2707; 988 5614; Tel.: 923 2620
Internal Audit Fax: 923 3893; Tel.: 923 3492; 923 3351; 923 3359
Human Resources Fax: 923 2468; Tel.: 923 2478
Telephone codes: Bulgaria – (+359…); Sofia – (+359 2...)

Financial Highlights (consolidated) – 5-year retrospective
(Thousands of BGN, unless otherwise stated)
2005 2004 2003 2002 2001
Key figures
Net profit 96,116 86,279 89,752 79,130 68,912
Shareholders' equity* 609,609 574,112 550,026 513,249 490,479
Total assets* 3,474,829 3,614,696 2,825,439 2,721,980 2,731,686
Bank customer deposits* 2,618,771 2,917,169 2,177,781 2,049,957 2,021,634
Bank customer loans* 1,706,519 1,393,968 916,634 563,935 362,353
Earnings per share (in BGN) 0.58 0.52 0.54 0.48 0.41
Income
Net interest income 162,850 134,502 106,081 91,112 99,613
Net fee and commission income 44,657 39,758 32,978 41,059 30,359
Net gains from securities 11,615 4,318 9,129 12,642 8,226
Net gains from foreign currency operations and fluctuations 3,090 7,042 10,387 7,095 5,046
Gross operating income 228,589 198,470 169,977 158,192 145,086
Net operating Income 138,808 114,384 103,690 104,207 87,480
Expenses
Operating expenses 89,781 84,086 66,287 62,988 55,775
HR expenses 33,266 30,319 27,145 26,658 27,722
Non-HR expenses 39,742 40,460 29,568 26,160 28,053
Depreciation 16,773 13,307 9,574 10,170 10,675
Impairment losses and provisions 25,443 7,719 14,706 (9,004) (8,844)
Tax 17,249 20,386 28,644 25,077 18,568
Ratios (%)
Return on average assets (ROA) 2.9% 2.8% 3.4% 2.9% 2.5%
Return on average equity (ROE) 16.3% 15.7% 17.4% 16.2% 13.5%
Capital/Asset ratio* 17.5% 15.9% 19.5% 18.9% 18.0%
Total capital ratio* 21.6% 23.3% 38.0% 38.7% 54.8%
Tier 1 capital ratio* 18.8% 20.4% 20.5% 19.7% 27.8%
Risk weighted assets/Total assets ratio* 61.5% 53.0% 43.9% 32.9% 26.3%
Loan/Deposit ratio* 65.2% 47.8% 42.1% 27.5% 17.9%
Cost/Income ratio1 39.3% 42.4% 39.0% 39.8% 46.0%
Resources (number)*
Operating outlets 105 94 91 91 98
Employees 1,897 1,760 2,026 2,060 2,050
Foreign exchange rate at period-end (BGN/USD) 1.6579 1.4359 1.5486 1.8850 2.2193
Average annual exchange rate over the period (BGN/USD) 1.5741 1.5751 1.8067 2.0770 2.1850
* End of period.1 Depreciation is included in the nominator of cost to income ratio.
60
A n n u a l R e p o r t 2 0 0 5General Informat ion

61 Data as of year end 2004.
A n n u a l R e p o r t 2 0 0 5 General Informat ion
UniCredit Group – The First Truly European Bank
After the merger with HVB Group, UniCredit Group is a strong European banking network which
serves more than 28 million customers via 7,000 offices in 20 countries. By joining forces, the
new Group will significantly strengthen its position in Central and Eastern Europe, increasing the
number of outlets to some 2,800 and the number of clients to around 16 million.
Central and Eastern Europe: No 1 franchise
¢ Countries of presence 16
¢ Customer loans EUR 41 bn
¢ Customer deposits EUR 47 bn
¢ Branches 2,800
¢ Employees 58,000
Italy: No 2 with 10% market share
¢ Customer loans EUR 122 bn
¢ Customer deposits EUR 72 bn
¢ Branches 3,317
¢ Employees 40,000
Austria: No 1 with 18% market share
¢ Customer loans EUR 51 bn
¢ Customer deposits EUR 35 bn
¢ Branches 405
¢ Employees 12,000
Germany: No 2 with 5% market share
¢ Customer loans EUR 153 bn
¢ Customer deposits EUR 61 bn
¢ Branches 681
¢ Employees 26,000

62
A n n u a l R e p o r t 2 0 0 5General Informat ion
Network addresses
І. SOFIA REGION
Sveta Nedelya Sofia, 7 Sveta Nedelya sq. 9232111
Aksakov Sofia 8 Aksakov str. 9233410
Al. Stamboliiski Sofia,108 Al. Stamboliiski blvd. 8102621
BGA Balkan Sofia, 1 Christophore Columb blvd 9268391
Botevgrad Botevgrad 79 3-ti Mart blvd 0723/66872
Boulevard Bulgaria Sofia, 27 Tvardishki prohod str. 8182722
Business Park Sofia Sofia, Mladost 4, Business Park, House N 10 9769183
Cherni Vrah Sofia, 54 Cherni Vrah blvd. 9690025
Credit Centre Sofia, 7 Sveta Nedelya sq. 9232186
Customs Sofia Sofia, 84 Vesletz str. 8105921
Customs Sofia Airport Sofia, 1 Christophore Columb blvd 9268390
Dragoman Dragoman 3 N. Vaptzarov str. 07172/2229
Fantastiko Sofia 12 Anton Naydenov str. 9681997
Kaloyan Sofia 3 Kaloyan str. 9268425
Levski Memorial Sofia, 100 V. Levski blvd. 8145021
Mladost Sofia, Mladost 1, 16 Al. Malinov blvd. floor 1 8174921
Nadezhda Sofia, 2 Lomsko Shousse 9360439
Ruski Pametnik Sofia, 2 Bouzludja str. 9530309
Scorpion Shiping Sofia, 18 Ist Bulgarian Army blvd. 9311846
SMEs Centre Sofia, Mladost 1 16 Al. malinov blvd. floor 2 8174926
Sopharma Sofia, 16 Iliensko shousse str. 9360986
Tzar Samuil Sofia, 1 Tzar Samuil str. 9173040
Yanko Sakazov Sofia 88 Yanko Sakazov str. 9448710
IІ. BLAGOEVGRAD REGION
Blagoevgrad Blagoevgrad, 22 Tzar Shishman str. 073/828633
Dupnitza Dupnitza, 19 Hr. Botev str. 0701/50034
Gotze Delchev Gotza Delchev, 22 Hr. Botev str. 0751/60203
Kustendil Kustendil, 54 Tzar Osvoboditel str. 078/559320
Pernik Pernik, K. Pernishki Building 14 076/603201
Petrich Petrich, 10 Macedonia sq. 0745/61668
ІІІ.BOURGAS REGION
Aitos Aitos, 27 Stantzionna str. 0558/22109
Bourgas Bourgas 22 Alexandrovska str. 056/877262
Bourgas Airport Bourgas - Bourgas Airport 056/870357
Credit Centre Bourgas 22 Alexandrovska str. 056/877104
Customs Malko Tarnovo Border Control Office M. Tarnovo 05952/4235
Karnobat Karnobat 14 Bulgaria blvd. 0559/28821
Malko Tarnovo Malko Tarnovo 2 Malkotarnovska komuna 05952/2214
Nesebar Nesebar 10 Edelvais str. 0554/44082
Port Bourgas Bourgas Port Complex 056/877237
Primorsko Primorsko, 9 Cherno more str. 0550/32051

63
A n n u a l R e p o r t 2 0 0 5 General Informat ion
Slanchev Bryag КК Slanchev Bryag PO Box 123 0554/22554
Sozopol Sozopol 14 Republikanska str. 0550/22436
Sungurlare Sungurlare 15 Hr. Smirnenski str. 05571/2493
Tzarevo Tzarevo 20 Kraimorska str. 0550/52045
IV.PLEVEN REGION
Knezha Knezha, 71 Marin Boev str. 09132/2394
Levski Levski, 57 Al. Stamboliiski str. 0650/83167
Lom Lom, 14 Dunavska str. 0971/66720
Lovech Lovech, 22A D. Pashkov str. 068/601341
Montana Montana, 4 St. Karadja str. 096/390423
Pleven Pleven, 11 Tzar Simen str. 064/890319
Regional Police Department Vidin, 87 Tzar Simeon Veliki str. 094/6947574
SOMAT Vidin Vidin, North Industrial Zone 094/602022
Troyan Troyan, 188 V. Levski str. 0670/62604
Vidin Vidin, 3 Tzar Simeon Veliki str. 094/690214
Vitrade Vidin Vidin, Vitrade Wholesale 094/601298
Vratza Vratza, 10 Loukashov str. 092/668852
V. PLOVDIV REGION
Asenovgrad Asenovgrad 2 Rechna str. 0331/65505
Credit Centre Plovdiv 1A Raiko Daskalov str. 032/646953
Customs Plovdiv 32A Kouklensko shousse blvd. 032/673602
Ivan Vazov Plovdiv, 4 Ivan Vazov blvd 032/601615
Karlovo Karlovo, 2 P. Sabev str. 0335/92048
Karlovsko shousse Plovdiv, 8 Karlovsko shousse str. 032/ 946335
KAT-Pazardjuk Pazardjik KAT 034/441290
Maritza Plovdiv 4 Vasil Levski str. 032/ 945466
Panagiurishte Panagiurishte 24 G. Benkovski str. 0357/4087
Pazardjik Pazardjik, 5 Esperanto str. 034/405717
Peshtera Peshtera 16 Dimitar Gorov str. 0350/2107
Police Department - Pazardjik Police Department Pazardjik 034/440993
Raiko Daskalov Plovdiv 1A Raiko Daskalov str. 032/646961
Rodopi Plovdiv, 1 Asenovgradsko shousse str. 032/623746
Smolian Smolian 51 Bulgaria blvd. Building 14 0301/63198
Trakia Plovdiv, 3 Osvobozhdenie blvd. 032/ 681914
Velingrad Velingrad Svoboda sq. 0359/52318
VI. ROUSSE REGION
Gabrovo Gabrovo, 13 Radetski str. 066/814224
Gorna Oryahovitsa Gorna Oryahovitsa, 1A M. Todorov str. 0618/60159
Rousse Rousse, 5 Sveta Troitza sq. 082/818229
Sevlievo Sevlievo, Svoboda sq. Building 21 0675/34998
Svishtov Svishtov, Aleko sq, Aleko Cinema 0631/60054
Veliko Tarnovo Veliko Tarnovo, 2B Marno Pole str. 062/600154

64
A n n u a l R e p o r t 2 0 0 5General Informat ion
VІІ. STARA ZAGORA REGION
Chirpan Chirpan, 2 Yavorov str. 0416/4037
Dimitrovgrad Dimitrovgrad, 3 D. Blagoev blvd. 0391/61455
Galabovo Galabovo, 8 Dr. Zhekov str. 0418/62224
Haskovo Haskovo, 4 Han Kubrat str. 038/607721
Haskovo Municipality Haskovo Municipality 038/662438
Kardjali Kardjali, 1 Republikanska str. 0361/65460
KAT – Haskovo Haskovo – КАТ 038/662447
Kazanlak Kazanlak, 11 Sevtopolis sq. 0431/64777
Nova Zagora Nova Zagora 49 V. Levski str. 0457/23906
Police Department Dimitrovgrad 0391/61454
Radnevo Radnevo, 6 G. Dimitrov str. 0417/83075
Regional Police Department Haskovo Haskovo, Police Department 038/662439
Sliven Sliven, 23 Rakovski str. 044/622446
Stara Zagora Stara Zagora, 126 Simeon Veliki blvd. 042/696245
Svilengrad Svilengrad, 40 Bulgaria blvd. 0379/71541
Yambol Yambol, 19 Targovska str. 046/661641
VIII. VARNA REGION
Cherno more Varna, 1 P. Karavelov str. 052/662125
Credit Centre Varna 74-76 Knyaz Boris I blvd 052/654405
Dobrich Dobrich, 7 Nezavisimost str. 058/600082
Razgrad Razgrad, 1 Vasil Levski str. 084/660763
Shipka Varna, 39 Maria Luiza str. 052/ 600025
Shumen Shumen, 64 Slavyanski blvd. 054/800599
Silistra Silistra 20 Simeon Veliki str. 086/821556
Targovishte Targovishte, 1 Vasil Levski str. 0601/61225
Zlatni piasatzi КК Zlatni piasatzi, Shipka Hotel Po Box 81 052/355843