Content-Based Tweets Clustering and Analysis · Content-Based Tweets Clustering and Analysis ... In...
11
Content-Based Tweets Clustering and Analysis Jahiruddin Department of Computer Science Jamia Millia Islamia (Central University) New Delhi-110025, India E-mail: [email protected] Abstract— Event-based social network analysis is an important task for monitoring the potential threats to the security of a nation and identifying various trends that are popular among the people. In this paper, we propose content-based tweets clustering and analysis method, which aims to cluster tweets based on the events represented by them. The proposed method starts with modeling tweets into a similarity graph (aka social network), in which each node represent a tweet and an edge connecting a node-pair represents the degree of similarity between the tweets represented by them. For social graph generation, each node is represented as a feature vector which is generated using Latent Dirichlet Allocation (LDA) from the respective tweet and edge weight is determined as the similarity between the nodes. Finally, the generated social graph is partitioned into a number of clusters (sub-graphs) using Markov Clustering (MCL) algorithm, where each sub-graph represent an event. We have generated a data set of 5000 tweets related to four different events – Uri attacks, Delhi assembly election, Union budget 2015, and Israel-Gaza conflict to evaluate the proposed method. The experimental results are encouraging, showing high accuracy in grouping tweets based on their contents. We have also performed a comparative analysis of the Cosine similarity and Euclidean distance based similarity graph generation, and it is found that the Cosine similarity yields better results than the Euclidian distance measure. Keywords- Twitter data analysis; Similarity graph generation; Key term extraction; Graph clustering; Event classification. I. INTRODUCTION The recent advancements in Web technologies has motivated young generations to use online social networks like Facebook, Twitter, Instagram, Tumbler etc. They use the online social network for various purposes, including updating of events and sharing of the new and useful information. As a result, presently online social network becomes a powerful tool among internet users to share their views with other internet users. One of the fastest-growing online social media is Twitter. It is a popular social media website which allows users to share their views in the form of tweets that is a short message up to 140 characters long. Recently the Twitter extended its message length from 140 characters to 280 characters. Besides tweeting a short message, Twitter is also used for marketing, election campaign, and for spreading news. In addition to these, it is also used by the social media users to express their opinions on important social and political issues occurred around their locality or world. Tweet analysis for detecting emerging issues and trends are considerable interest to various stakeholders, including private companies, security agencies, and governments. The tweet analysis is a technically challenging task, due to its unstructured nature and use of the informal natural languages. There are millions of tweets on a number of topics are generated every day by a large number of users. The grouping of the tweets on the basis of topics or events is a ground challenging task in analyzing Twitter data. A real life event may be conceptualized using key terms which are embedded in the tweets. For example, “Uri attacks” event can be conceptualized using the key terms attack, terrorist, solders, uri etc., whereas vote, election, political-party, etc. can be used to conceptualize the “Delhi assembly election” event. In this paper, we use the graph model to analyze Twitter data using the similarity graph generation followed by clustering of these similarity graph. Tweets are cleaned and then tokenized using NLP techniques to generate candidate terms and these candidate keys are ranked using Latent Dirichlet Allocation (LDA) method to get top ranked key terms which are used to convert each tweet into a feature vector. Thereafter, Cosine similarity and Euclidian distance methods are used to generate similarity graph of the underline tweets. Finally, the similarity graph is clustered using MCL algorithm to partition it into a number of sub-graphs (cluster), each sub-graph represent a set of tweets related to a particular event. This paper is a substantially extended version of one of our previous works [1]. In this paper, in addition to presenting the proposed tweets analysis method in a broader perspective, we have presented a comparative analysis of the Cosine similarity and Euclidian distance measures in social graph generation and event identification. e-ISSN : 0975-3397 p-ISSN : 2229-5631 Jahiruddin / International Journal on Computer Science and Engineering (IJCSE) DOI: 10.21817/ijcse/2018/v10i1/181001024 Vol. 10 No.1 Jan 2018 21
Transcript of Content-Based Tweets Clustering and Analysis · Content-Based Tweets Clustering and Analysis ... In...
Content-Based Tweets Clustering and Analysis
Jahiruddin Department of Computer Science
Jamia Millia Islamia (Central University) New Delhi-110025, India
E-mail: [email protected]
Abstract— Event-based social network analysis is an important task for monitoring the potential threats to the security of a nation and identifying various trends that are popular among the people. In this paper, we propose content-based tweets clustering and analysis method, which aims to cluster tweets based on the events represented by them. The proposed method starts with modeling tweets into a similarity graph (aka social network), in which each node represent a tweet and an edge connecting a node-pair represents the degree of similarity between the tweets represented by them. For social graph generation, each node is represented as a feature vector which is generated using Latent Dirichlet Allocation (LDA) from the respective tweet and edge weight is determined as the similarity between the nodes. Finally, the generated social graph is partitioned into a number of clusters (sub-graphs) using Markov Clustering (MCL) algorithm, where each sub-graph represent an event. We have generated a data set of 5000 tweets related to four different events – Uri attacks, Delhi assembly election, Union budget 2015, and Israel-Gaza conflict to evaluate the proposed method. The experimental results are encouraging, showing high accuracy in grouping tweets based on their contents. We have also performed a comparative analysis of the Cosine similarity and Euclidean distance based similarity graph generation, and it is found that the Cosine similarity yields better results than the Euclidian distance measure.
Keywords- Twitter data analysis; Similarity graph generation; Key term extraction; Graph clustering; Event classification.
I. INTRODUCTION
The recent advancements in Web technologies has motivated young generations to use online social networks like Facebook, Twitter, Instagram, Tumbler etc. They use the online social network for various purposes, including updating of events and sharing of the new and useful information. As a result, presently online social network becomes a powerful tool among internet users to share their views with other internet users. One of the fastest-growing online social media is Twitter. It is a popular social media website which allows users to share their views in the form of tweets that is a short message up to 140 characters long. Recently the Twitter extended its message length from 140 characters to 280 characters. Besides tweeting a short message, Twitter is also used for marketing, election campaign, and for spreading news. In addition to these, it is also used by the social media users to express their opinions on important social and political issues occurred around their locality or world. Tweet analysis for detecting emerging issues and trends are considerable interest to various stakeholders, including private companies, security agencies, and governments.
The tweet analysis is a technically challenging task, due to its unstructured nature and use of the informal natural languages. There are millions of tweets on a number of topics are generated every day by a large number of users. The grouping of the tweets on the basis of topics or events is a ground challenging task in analyzing Twitter data. A real life event may be conceptualized using key terms which are embedded in the tweets. For example, “Uri attacks” event can be conceptualized using the key terms attack, terrorist, solders, uri etc., whereas vote, election, political-party, etc. can be used to conceptualize the “Delhi assembly election” event.
In this paper, we use the graph model to analyze Twitter data using the similarity graph generation followed by clustering of these similarity graph. Tweets are cleaned and then tokenized using NLP techniques to generate candidate terms and these candidate keys are ranked using Latent Dirichlet Allocation (LDA) method to get top ranked key terms which are used to convert each tweet into a feature vector. Thereafter, Cosine similarity and Euclidian distance methods are used to generate similarity graph of the underline tweets. Finally, the similarity graph is clustered using MCL algorithm to partition it into a number of sub-graphs (cluster), each sub-graph represent a set of tweets related to a particular event. This paper is a substantially extended version of one of our previous works [1]. In this paper, in addition to presenting the proposed tweets analysis method in a broader perspective, we have presented a comparative analysis of the Cosine similarity and Euclidian distance measures in social graph generation and event identification.
e-ISSN : 0975-3397 p-ISSN : 2229-5631 Jahiruddin / International Journal on Computer Science and Engineering (IJCSE)
DOI: 10.21817/ijcse/2018/v10i1/181001024 Vol. 10 No.1 Jan 2018 21
The remaining part of the paper is organized as follows. Section 2 presents a brief review of the twitter data analysis techniques. In section 3 we presented the basis of mathematics used in similarity graph generation. The proposed tweets clustering method is presented in sections 4. The experimentally evaluation of the proposed method is presented in section 5. Finally, section 6 concludes the paper with future directions of work.
II. RELATED WORKS
Twitter is a popular social media website among Internet users. Millions of messages, on different topics, are posted by a large numbers of users daily on this social media website. In case of Twitter, these message is called tweet. The authors of these tweets share their opinions on real life events and discuss different issues of the society. Recently, a large number of literatures have proposed methods to analyze social network data, especially the Twitter data, for various purposes [2, 3, 4, 5, 6, 7]. In [8], the authors used the predictive power of social media data to identify the conflicting in US election 2010 using sentiment analysis methods. Cheong and Lee [9] used the Self Organizing Map (SOM) to identify interesting pattern in Iran election 2009. Akcora et al. [10] developed a tool for internet users to view the important news stories and search the article of their interest on the Web. In [11], the authors proposed a method that may be used in stock market prediction. In [12], the authors assessed whether there are an association between popular events and sentiment strength.
The influence tracking on the social media is another important task. This may be used in some real applications like marketing of the online products, country election, as influential users may change the mind of large number of users as they play an important role in the society. Cha et al. [13] analyzed the social network graph using structural features like in-degree of vertices, re-tweets, and user mentions. Their method helps in influence tracking dynamically across topic and time. Willis et al. [14] uses ageing factor analysis of the tweets and response types to determine the influence of their individual tweets. They reported that BBC corporate account @BBCSport play important role in key actor analysis that is used in influential tracking.
Another important research area in Twitter data mining is opinion mining and sentiment analysis. In [15] Pak and Paroubek, proposed a system to get the sentiment of a tweet using linguistic analysis. In [16], the authors proposed multi-nominal naive Bayes classifier which assigns positive or negative sentiment class value to tweets. They compared a number of classifiers and reported that their algorithm outperforms the other approaches. Spencer and Uchyigit [17] developed a sentiment analysis tool for tweeter data that classify the tweets into three classes - positive, negative, and objective class. Go et al. [18] proposed a system for sentiment classification on Twitter data. At the place of explicit rating such as star rating, they use the emoticons :) and :( for indentifying the positive and negative tweets. Due to binary classification and non-consideration of objective text this system is highly limited. They reported that the best result classification of tweets is achieved by using unigrams and bigrams in combined.
The event identification is another key research area in the field of Social media data mining. Becker et al. [19] proposed a framework to identify an event in a set of social media documents. They produced high quality clusters of similar social media documents using object similarity metric approach. They reported that their technique, which used similarity metric, gives better performance over traditional document clustering approaches that consider only text-based similarity. In [20], the authors presented a method for real-time events identification. This method used the tweets content like key terms and their context, and number of such key terms for detecting earthquake event. In [21], the authors developed a binary classifier that classifies the tweets into sets of event tweets and non-event tweets. For classification of tweets, they have used social, temporal, and topical features of the tweets along with the some of the Twitter-centric features. In contrast to classification of tweets, in this paper we consider content-based tweets analysis as a clustering problem which partition the set of tweets into a number of clusters based on number of events are described by them. A detailed review of the state-of-the arts in social network mining and its applications is presented in [22].
III. PRELIMINARIES FOR SIMILARITY GRAPH GENERATION
In this section, we present the mathematical basis for similarity graph generation. Started with the basic concept of inner product and vector norm, the cosine similarity and Euclidian distance based similarity is presented in subsequent subsections.
A. Inner Product and Vector Norms
Inner product (aka dot product) of vector u and v is denoted by <u, v> is a scalar quantity. The inner product of n-dimensional vectors u = (u1, u2, …, un)T and v = (v1, v2, …, vn)T in vector space Rn is defined using equation 1 [23].
n
iiinn vuvuvuvuvuvu
12211., (1)
e-ISSN : 0975-3397 p-ISSN : 2229-5631 Jahiruddin / International Journal on Computer Science and Engineering (IJCSE)
DOI: 10.21817/ijcse/2018/v10i1/181001024 Vol. 10 No.1 Jan 2018 22
The vector norm of an n-dimensional vector u in vector space Rn is a function that assign a non negative real number to the vector. The inner product of vector with itself gives square of the vector norm, but every vector norm is not determined using inner product [23]. The vector norm of an n-dimensional vector u = (u1, u2, …,
un)T is denoted by u and can be define using equation 2.
uuu , (2)
There are a number of vector norms but most popular vector norms are L1-norm (aka Manhattan norm) and L2-norm (aka Euclidean norm) [24]. The L1-norm of vector u is obtained by adding the absolute value of its components and defined using equation 3. Whereas, L2-norm of vector u is positive square root of the sum of square of its components and is defined using equation 4. The Euclidian norm of a vector u gives the length of the vector.
n
iiuu
11
(3)
n
iiuu
1
2
2 (4)
B. Cosine Similarity
Let vector u = (u1, u2, …, un)T and v = (v1, v2, …, vn)T are two n-dimensional vectors in vector space Rn, then cosine similarity between these two vectors should be a real number between -1 and 1 is the cosine of angle between these two vectors and calculated using equation 5. Since in our case, the value of each tweet vector components should be either 0 or 1 so the cosine similarity value between each tweet-pair should be in range from 0 to 1.
n
ii
n
ii
n
iii
vu
vu
vu
vuvuinesimilarity
11
1
22
.),(cos (5)
C. Euclidian Distance Similarity
Let vector u = (u1, u2, …, un)T and v = (v1, v2, …, vn)T are two n-dimensional vectors in vector space Rn, then Euclidian distance between these two vectors should be L2-norm of vector (u-v) and is denoted by ),( vu and defined using equation 6. The Euclidian distance between these two vectors should be a real number between 0 and ∞. Since in our case, each tweet vector is a binary vector so the Euclidian distance value between each
tweet-pair should be in range from 0 to n . The smaller the distance shows both vectors are more similar and its larger value shows that both are most dissimilar. Equation 7 may be used get the similarity value between two tweet vectors using Euclidian distance method. Its value should be always between 0 and 1.
n
iii vuvuvu
1
2
2)(),( (6)
n
vuvusimsimilarity
),(1),(
(7)
IV. PROPOSED TWEETS CLUSTERING AND ANALYSIS METHOD
This section presents the functional details of different modules of our proposed tweets clustering and analysis method. The aim of proposed method is to partition the set of tweets into a number of clusters that represents various events. The functional detail of the various working modules of our proposed method is presented in figure 1. It starts by creating data set of tweets at local machine using tweet crawling module. The aim of features
e-ISSN : 0975-3397 p-ISSN : 2229-5631 Jahiruddin / International Journal on Computer Science and Engineering (IJCSE)
DOI: 10.21817/ijcse/2018/v10i1/181001024 Vol. 10 No.1 Jan 2018 23
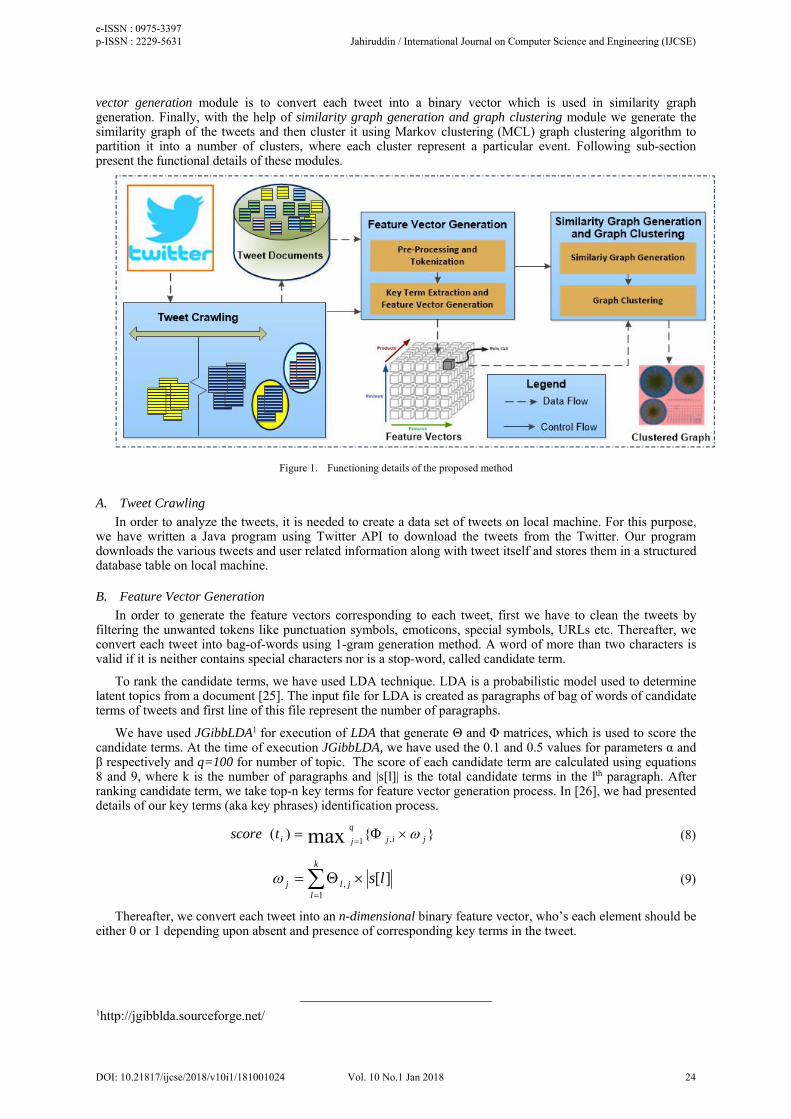
vector generation module is to convert each tweet into a binary vector which is used in similarity graph generation. Finally, with the help of similarity graph generation and graph clustering module we generate the similarity graph of the tweets and then cluster it using Markov clustering (MCL) graph clustering algorithm to partition it into a number of clusters, where each cluster represent a particular event. Following sub-section present the functional details of these modules.
Figure 1. Functioning details of the proposed method
A. Tweet Crawling
In order to analyze the tweets, it is needed to create a data set of tweets on local machine. For this purpose, we have written a Java program using Twitter API to download the tweets from the Twitter. Our program downloads the various tweets and user related information along with tweet itself and stores them in a structured database table on local machine.
B. Feature Vector Generation
In order to generate the feature vectors corresponding to each tweet, first we have to clean the tweets by filtering the unwanted tokens like punctuation symbols, emoticons, special symbols, URLs etc. Thereafter, we convert each tweet into bag-of-words using 1-gram generation method. A word of more than two characters is valid if it is neither contains special characters nor is a stop-word, called candidate term.
To rank the candidate terms, we have used LDA technique. LDA is a probabilistic model used to determine latent topics from a document [25]. The input file for LDA is created as paragraphs of bag of words of candidate terms of tweets and first line of this file represent the number of paragraphs.
We have used JGibbLDA1 for execution of LDA that generate Θ and Φ matrices, which is used to score the candidate terms. At the time of execution JGibbLDA, we have used the 0.1 and 0.5 values for parameters α and β respectively and q=100 for number of topic. The score of each candidate term are calculated using equations 8 and 9, where k is the number of paragraphs and |s[l]| is the total candidate terms in the lth paragraph. After ranking candidate term, we take top-n key terms for feature vector generation process. In [26], we had presented details of our key terms (aka key phrases) identification process.
}{)( ,1max jij
q
jitscore
(8)
k
ljlj ls
1, ][ (9)
Thereafter, we convert each tweet into an n-dimensional binary feature vector, who’s each element should be either 0 or 1 depending upon absent and presence of corresponding key terms in the tweet.
1http://jgibblda.sourceforge.net/
e-ISSN : 0975-3397 p-ISSN : 2229-5631 Jahiruddin / International Journal on Computer Science and Engineering (IJCSE)
DOI: 10.21817/ijcse/2018/v10i1/181001024 Vol. 10 No.1 Jan 2018 24
C. Similarity Graph Generation and Graph Clustering
The feature vectors corresponding to tweets are used to generate similarity graph (aka social network). In this graph each tweets are represent by nodes and weighted undirected edge between each node-pair is generated by calculating the similarity value between them. Between a node-pair an undirected weighted edge exist if corresponding similarity value is a positive quantity. The similarity value between each node-pair is calculated using cosine and Euclidian distance function.
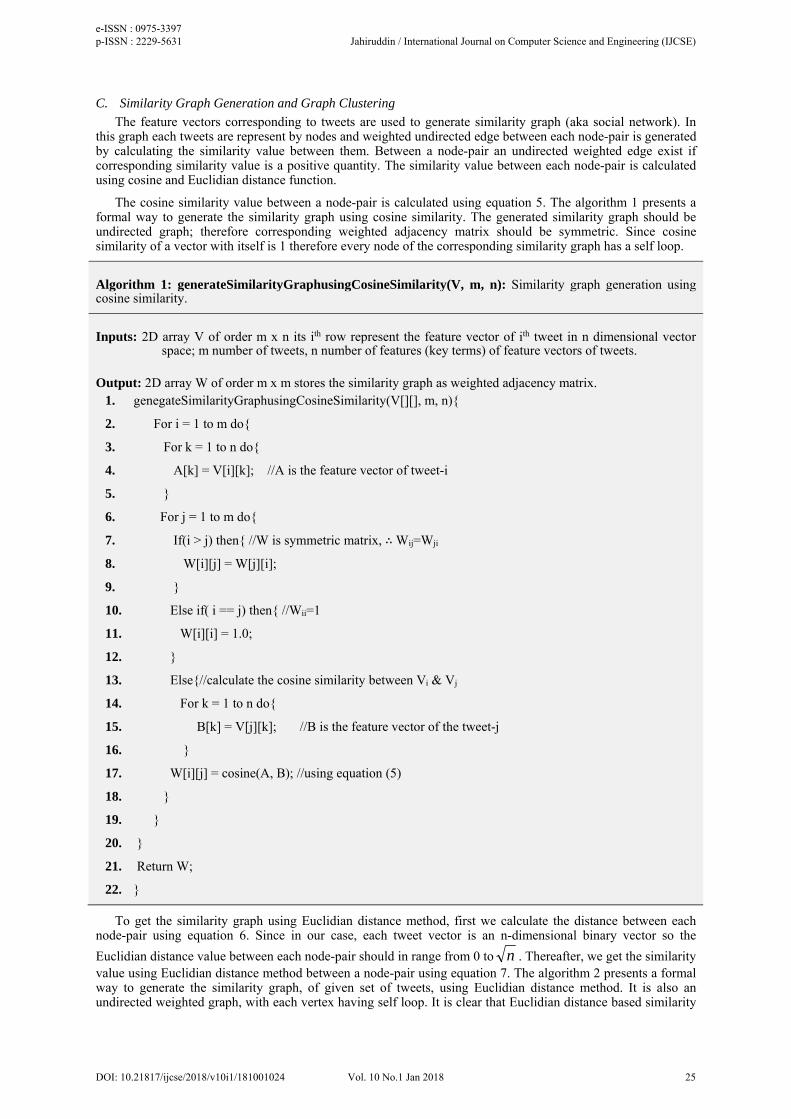
The cosine similarity value between a node-pair is calculated using equation 5. The algorithm 1 presents a formal way to generate the similarity graph using cosine similarity. The generated similarity graph should be undirected graph; therefore corresponding weighted adjacency matrix should be symmetric. Since cosine similarity of a vector with itself is 1 therefore every node of the corresponding similarity graph has a self loop.
Algorithm 1: generateSimilarityGraphusingCosineSimilarity(V, m, n): Similarity graph generation using cosine similarity.
Inputs: 2D array V of order m x n its ith row represent the feature vector of ith tweet in n dimensional vector space; m number of tweets, n number of features (key terms) of feature vectors of tweets.
Output: 2D array W of order m x m stores the similarity graph as weighted adjacency matrix. 1. genegateSimilarityGraphusingCosineSimilarity(V[][], m, n){
2. For i = 1 to m do{
3. For k = 1 to n do{
4. A[k] = V[i][k]; //A is the feature vector of tweet-i
5. }
6. For j = 1 to m do{
7. If(i > j) then{ //W is symmetric matrix, ∴ Wij=Wji
8. W[i][j] = W[j][i];
9. }
10. Else if( i == j) then{ //Wii=1
11. W[i][i] = 1.0;
12. }
13. Else{//calculate the cosine similarity between Vi & Vj
14. For k = 1 to n do{
15. B[k] = V[j][k]; //B is the feature vector of the tweet-j
16. }
17. W[i][j] = cosine(A, B); //using equation (5)
18. }
19. }
20. }
21. Return W;
22. }
To get the similarity graph using Euclidian distance method, first we calculate the distance between each node-pair using equation 6. Since in our case, each tweet vector is an n-dimensional binary vector so the
Euclidian distance value between each node-pair should in range from 0 to n . Thereafter, we get the similarity value using Euclidian distance method between a node-pair using equation 7. The algorithm 2 presents a formal way to generate the similarity graph, of given set of tweets, using Euclidian distance method. It is also an undirected weighted graph, with each vertex having self loop. It is clear that Euclidian distance based similarity
e-ISSN : 0975-3397 p-ISSN : 2229-5631 Jahiruddin / International Journal on Computer Science and Engineering (IJCSE)
DOI: 10.21817/ijcse/2018/v10i1/181001024 Vol. 10 No.1 Jan 2018 25
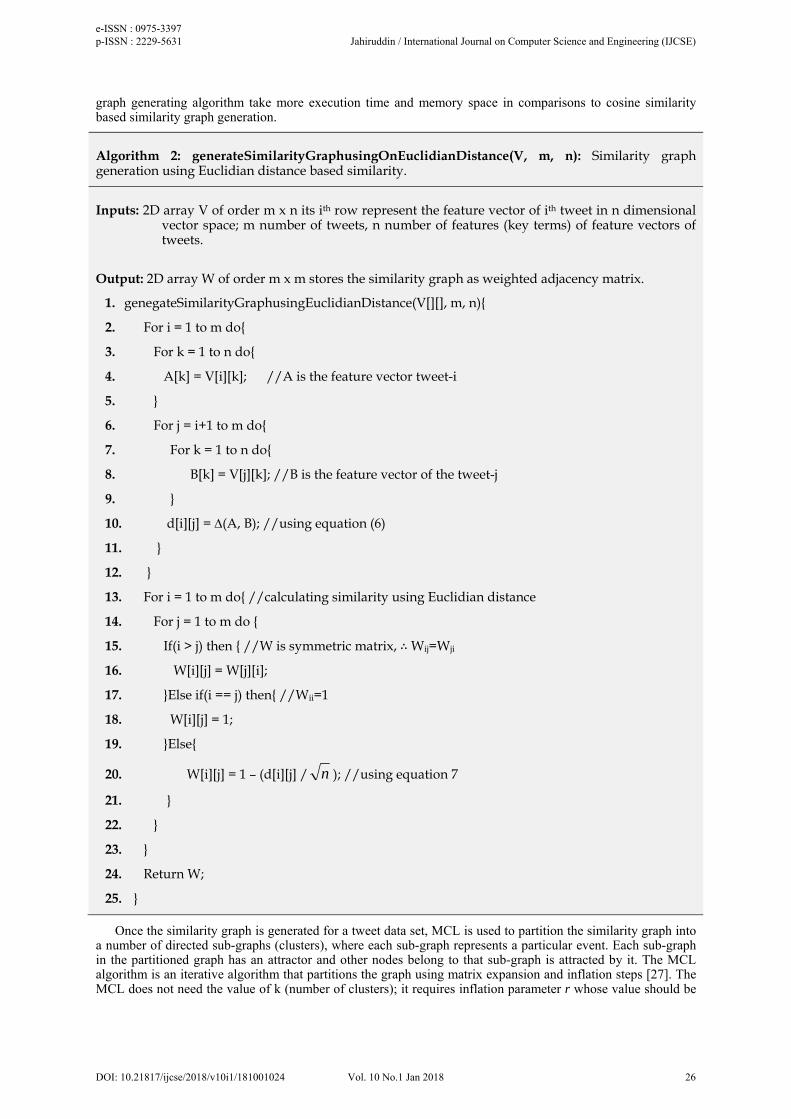
graph generating algorithm take more execution time and memory space in comparisons to cosine similarity based similarity graph generation.
Algorithm 2: generateSimilarityGraphusingOnEuclidianDistance(V, m, n): Similarity graph generation using Euclidian distance based similarity.
Inputs: 2D array V of order m x n its ith row represent the feature vector of ith tweet in n dimensional vector space; m number of tweets, n number of features (key terms) of feature vectors of tweets.
Output: 2D array W of order m x m stores the similarity graph as weighted adjacency matrix.
1. genegateSimilarityGraphusingEuclidianDistance(V[][], m, n){
2. For i = 1 to m do{
3. For k = 1 to n do{
4. A[k] = V[i][k]; //A is the feature vector tweet-i
5. }
6. For j = i+1 to m do{
7. For k = 1 to n do{
8. B[k] = V[j][k]; //B is the feature vector of the tweet-j
9. }
10. d[i][j] = ∆(A, B); //using equation (6)
11. }
12. }
13. For i = 1 to m do{ //calculating similarity using Euclidian distance
14. For j = 1 to m do {
15. If(i > j) then { //W is symmetric matrix, ∴ Wij=Wji
16. W[i][j] = W[j][i];
17. }Else if(i == j) then{ //Wii=1
18. W[i][j] = 1;
19. }Else{
20. W[i][j] = 1 – (d[i][j] / n ); //using equation 7
21. }
22. }
23. }
24. Return W;
25. }
Once the similarity graph is generated for a tweet data set, MCL is used to partition the similarity graph into a number of directed sub-graphs (clusters), where each sub-graph represents a particular event. Each sub-graph in the partitioned graph has an attractor and other nodes belong to that sub-graph is attracted by it. The MCL algorithm is an iterative algorithm that partitions the graph using matrix expansion and inflation steps [27]. The MCL does not need the value of k (number of clusters); it requires inflation parameter r whose value should be
e-ISSN : 0975-3397 p-ISSN : 2229-5631 Jahiruddin / International Journal on Computer Science and Engineering (IJCSE)
DOI: 10.21817/ijcse/2018/v10i1/181001024 Vol. 10 No.1 Jan 2018 26
greater than 1. For less number of sub-graphs of larger size we take small value of r, whereas a large value of r results more sub-graphs of smaller sizes.
V. EXPERIMENTAL SETUP AND RESULTS
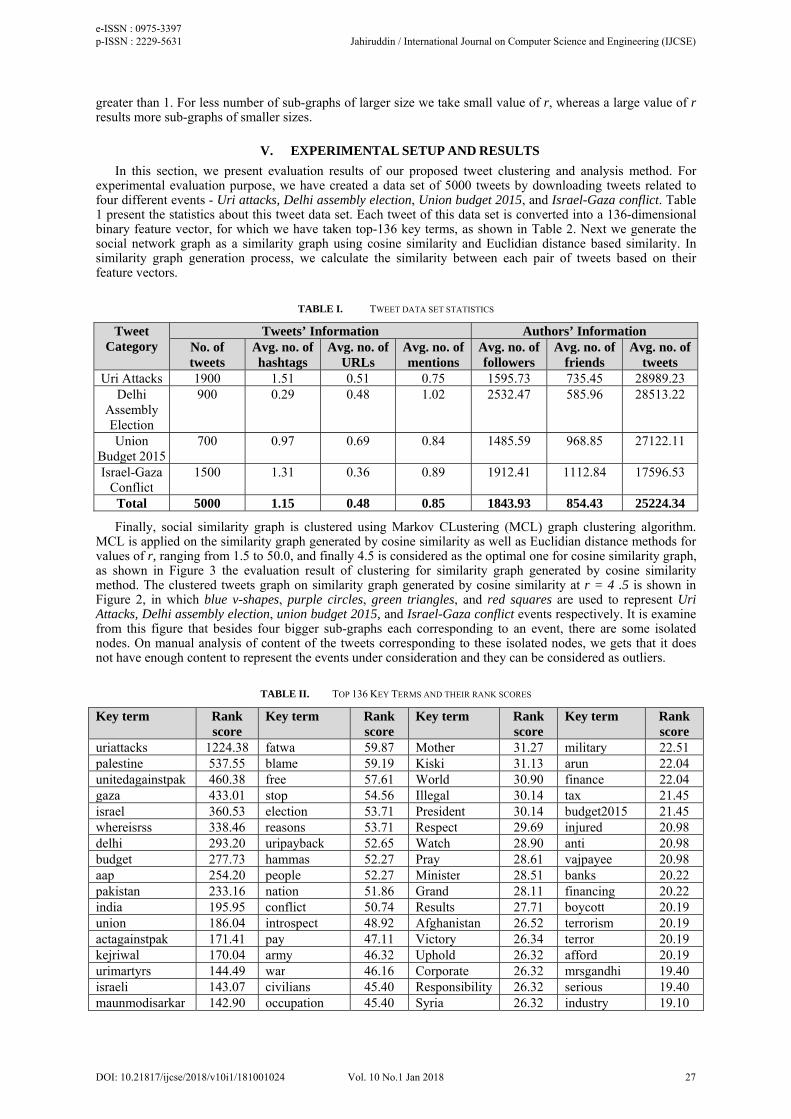
In this section, we present evaluation results of our proposed tweet clustering and analysis method. For experimental evaluation purpose, we have created a data set of 5000 tweets by downloading tweets related to four different events - Uri attacks, Delhi assembly election, Union budget 2015, and Israel-Gaza conflict. Table 1 present the statistics about this tweet data set. Each tweet of this data set is converted into a 136-dimensional binary feature vector, for which we have taken top-136 key terms, as shown in Table 2. Next we generate the social network graph as a similarity graph using cosine similarity and Euclidian distance based similarity. In similarity graph generation process, we calculate the similarity between each pair of tweets based on their feature vectors.
TABLE I. TWEET DATA SET STATISTICS
Tweet Category
Tweets’ Information Authors’ Information No. of tweets
Avg. no. of hashtags
Avg. no. of URLs
Avg. no. of mentions
Avg. no. of followers
Avg. no. of friends
Avg. no. of tweets
Uri Attacks 1900 1.51 0.51 0.75 1595.73 735.45 28989.23Delhi
Assembly Election
900 0.29 0.48 1.02 2532.47 585.96 28513.22
Union Budget 2015
700 0.97 0.69 0.84 1485.59 968.85 27122.11
Israel-Gaza Conflict
1500 1.31 0.36 0.89 1912.41 1112.84 17596.53
Total 5000 1.15 0.48 0.85 1843.93 854.43 25224.34
Finally, social similarity graph is clustered using Markov CLustering (MCL) graph clustering algorithm. MCL is applied on the similarity graph generated by cosine similarity as well as Euclidian distance methods for values of r, ranging from 1.5 to 50.0, and finally 4.5 is considered as the optimal one for cosine similarity graph, as shown in Figure 3 the evaluation result of clustering for similarity graph generated by cosine similarity method. The clustered tweets graph on similarity graph generated by cosine similarity at r = 4 .5 is shown in Figure 2, in which blue v-shapes, purple circles, green triangles, and red squares are used to represent Uri Attacks, Delhi assembly election, union budget 2015, and Israel-Gaza conflict events respectively. It is examine from this figure that besides four bigger sub-graphs each corresponding to an event, there are some isolated nodes. On manual analysis of content of the tweets corresponding to these isolated nodes, we gets that it does not have enough content to represent the events under consideration and they can be considered as outliers.
TABLE II. TOP 136 KEY TERMS AND THEIR RANK SCORES
Key term Rank score
Key term Rank score
Key term Rank score
Key term Rank score
uriattacks 1224.38 fatwa 59.87 Mother 31.27 military 22.51palestine 537.55 blame 59.19 Kiski 31.13 arun 22.04unitedagainstpak 460.38 free 57.61 World 30.90 finance 22.04gaza 433.01 stop 54.56 Illegal 30.14 tax 21.45israel 360.53 election 53.71 President 30.14 budget2015 21.45whereisrss 338.46 reasons 53.71 Respect 29.69 injured 20.98delhi 293.20 uripayback 52.65 Watch 28.90 anti 20.98budget 277.73 hammas 52.27 Pray 28.61 vajpayee 20.98aap 254.20 people 52.27 Minister 28.51 banks 20.22pakistan 233.16 nation 51.86 Grand 28.11 financing 20.22india 195.95 conflict 50.74 Results 27.71 boycott 20.19union 186.04 introspect 48.92 Afghanistan 26.52 terrorism 20.19actagainstpak 171.41 pay 47.11 Victory 26.34 terror 20.19kejriwal 170.04 army 46.32 Uphold 26.32 afford 20.19urimartyrs 144.49 war 46.16 Corporate 26.32 mrsgandhi 19.40israeli 143.07 civilians 45.40 Responsibility 26.32 serious 19.40maunmodisarkar 142.90 occupation 45.40 Syria 26.32 industry 19.10
e-ISSN : 0975-3397 p-ISSN : 2229-5631 Jahiruddin / International Journal on Computer Science and Engineering (IJCSE)
DOI: 10.21817/ijcse/2018/v10i1/181001024 Vol. 10 No.1 Jan 2018 27
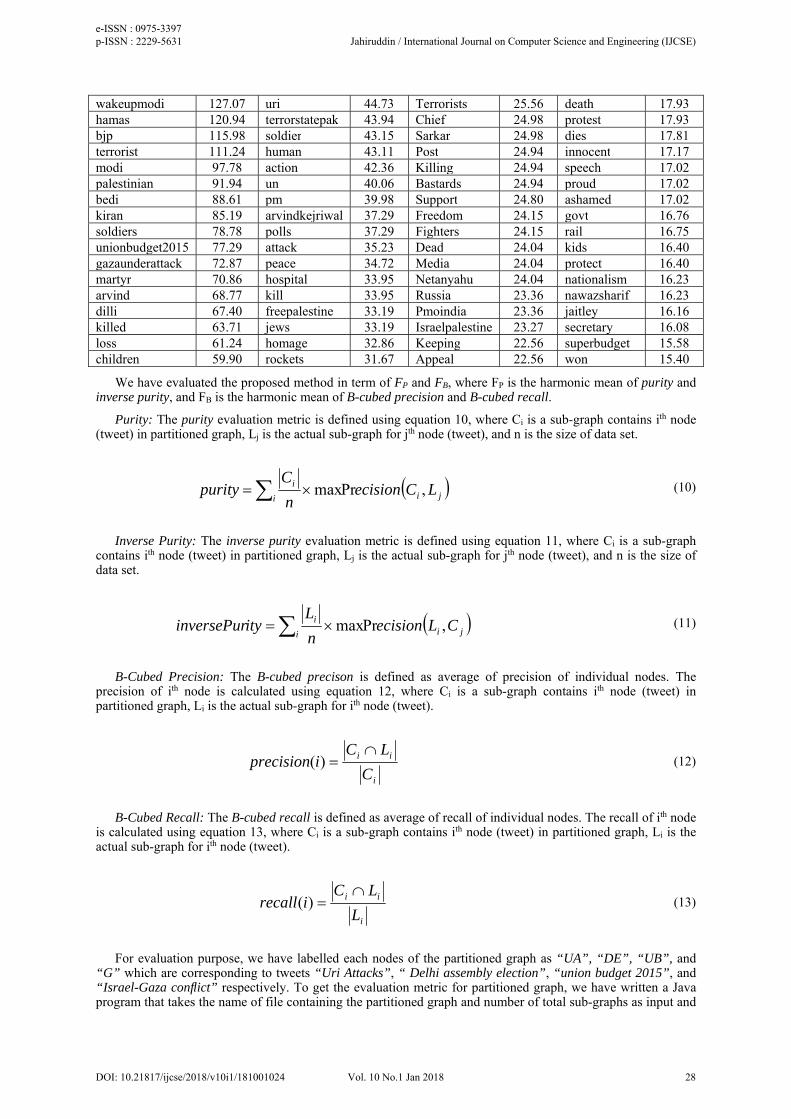
wakeupmodi 127.07 uri 44.73 Terrorists 25.56 death 17.93hamas 120.94 terrorstatepak 43.94 Chief 24.98 protest 17.93bjp 115.98 soldier 43.15 Sarkar 24.98 dies 17.81terrorist 111.24 human 43.11 Post 24.94 innocent 17.17modi 97.78 action 42.36 Killing 24.94 speech 17.02palestinian 91.94 un 40.06 Bastards 24.94 proud 17.02bedi 88.61 pm 39.98 Support 24.80 ashamed 17.02kiran 85.19 arvindkejriwal 37.29 Freedom 24.15 govt 16.76soldiers 78.78 polls 37.29 Fighters 24.15 rail 16.75unionbudget2015 77.29 attack 35.23 Dead 24.04 kids 16.40gazaunderattack 72.87 peace 34.72 Media 24.04 protect 16.40martyr 70.86 hospital 33.95 Netanyahu 24.04 nationalism 16.23arvind 68.77 kill 33.95 Russia 23.36 nawazsharif 16.23dilli 67.40 freepalestine 33.19 Pmoindia 23.36 jaitley 16.16killed 63.71 jews 33.19 Israelpalestine 23.27 secretary 16.08loss 61.24 homage 32.86 Keeping 22.56 superbudget 15.58children 59.90 rockets 31.67 Appeal 22.56 won 15.40
We have evaluated the proposed method in term of FP and FB, where FP is the harmonic mean of purity and inverse purity, and FB is the harmonic mean of B-cubed precision and B-cubed recall.
Purity: The purity evaluation metric is defined using equation 10, where Ci is a sub-graph contains ith node (tweet) in partitioned graph, Lj is the actual sub-graph for jth node (tweet), and n is the size of data set.
jii
i LCecisionn
Cpurity ,Prmax (10)
Inverse Purity: The inverse purity evaluation metric is defined using equation 11, where Ci is a sub-graph contains ith node (tweet) in partitioned graph, Lj is the actual sub-graph for jth node (tweet), and n is the size of data set.
jii
i CLecisionn
LityinversePur ,Prmax (11)
B-Cubed Precision: The B-cubed precison is defined as average of precision of individual nodes. The precision of ith node is calculated using equation 12, where Ci is a sub-graph contains ith node (tweet) in partitioned graph, Li is the actual sub-graph for ith node (tweet).
i
ii
C
LCiprecision
)( (12)
B-Cubed Recall: The B-cubed recall is defined as average of recall of individual nodes. The recall of ith node is calculated using equation 13, where Ci is a sub-graph contains ith node (tweet) in partitioned graph, Li is the actual sub-graph for ith node (tweet).
i
ii
L
LCirecall
)( (13)
For evaluation purpose, we have labelled each nodes of the partitioned graph as “UA”, “DE”, “UB”, and “G” which are corresponding to tweets “Uri Attacks”, “ Delhi assembly election”, “union budget 2015”, and “Israel-Gaza conflict” respectively. To get the evaluation metric for partitioned graph, we have written a Java program that takes the name of file containing the partitioned graph and number of total sub-graphs as input and
e-ISSN : 0975-3397 p-ISSN : 2229-5631 Jahiruddin / International Journal on Computer Science and Engineering (IJCSE)
DOI: 10.21817/ijcse/2018/v10i1/181001024 Vol. 10 No.1 Jan 2018 28
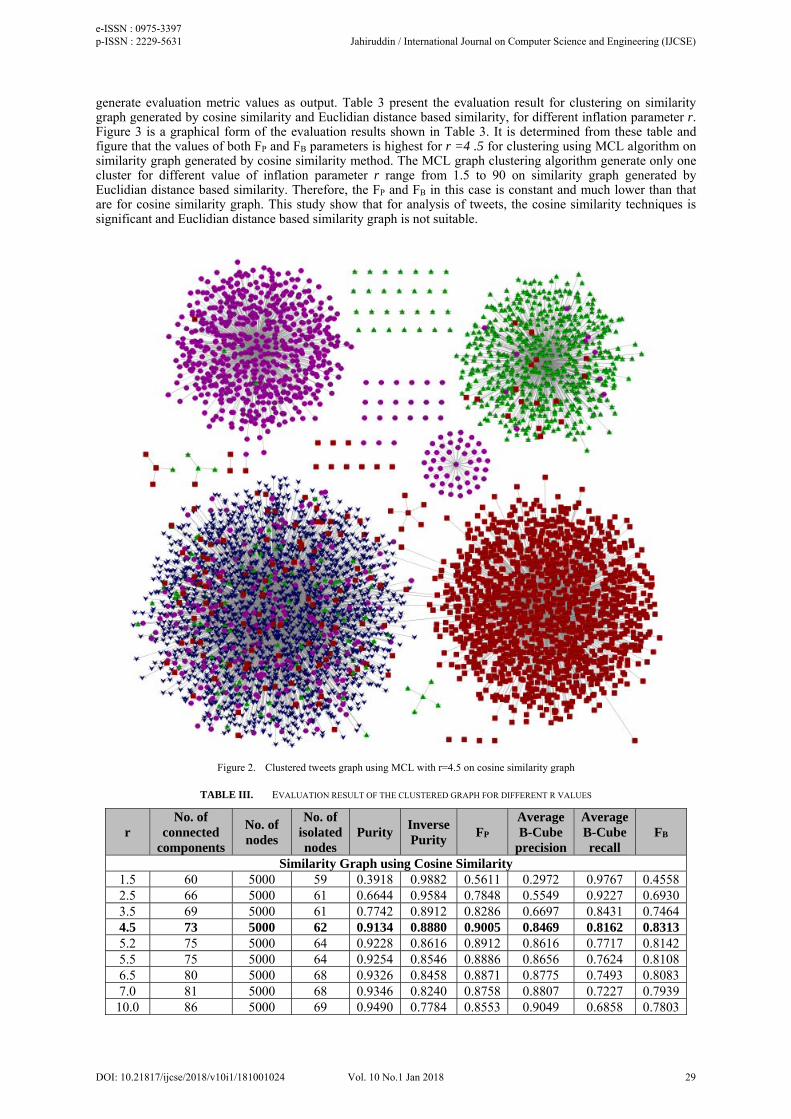
generate evaluation metric values as output. Table 3 present the evaluation result for clustering on similarity graph generated by cosine similarity and Euclidian distance based similarity, for different inflation parameter r. Figure 3 is a graphical form of the evaluation results shown in Table 3. It is determined from these table and figure that the values of both FP and FB parameters is highest for r =4 .5 for clustering using MCL algorithm on similarity graph generated by cosine similarity method. The MCL graph clustering algorithm generate only one cluster for different value of inflation parameter r range from 1.5 to 90 on similarity graph generated by Euclidian distance based similarity. Therefore, the FP and FB in this case is constant and much lower than that are for cosine similarity graph. This study show that for analysis of tweets, the cosine similarity techniques is significant and Euclidian distance based similarity graph is not suitable.
Figure 2. Clustered tweets graph using MCL with r=4.5 on cosine similarity graph
TABLE III. EVALUATION RESULT OF THE CLUSTERED GRAPH FOR DIFFERENT R VALUES
r No. of
connected components
No. of nodes
No. of isolated nodes
Purity Inverse Purity
FP Average B-Cube
precision
Average B-Cube recall
FB
Similarity Graph using Cosine Similarity 1.5 60 5000 59 0.3918 0.9882 0.5611 0.2972 0.9767 0.45582.5 66 5000 61 0.6644 0.9584 0.7848 0.5549 0.9227 0.69303.5 69 5000 61 0.7742 0.8912 0.8286 0.6697 0.8431 0.74644.5 73 5000 62 0.9134 0.8880 0.9005 0.8469 0.8162 0.8313 5.2 75 5000 64 0.9228 0.8616 0.8912 0.8616 0.7717 0.81425.5 75 5000 64 0.9254 0.8546 0.8886 0.8656 0.7624 0.81086.5 80 5000 68 0.9326 0.8458 0.8871 0.8775 0.7493 0.80837.0 81 5000 68 0.9346 0.8240 0.8758 0.8807 0.7227 0.7939
10.0 86 5000 69 0.9490 0.7784 0.8553 0.9049 0.6858 0.7803
e-ISSN : 0975-3397 p-ISSN : 2229-5631 Jahiruddin / International Journal on Computer Science and Engineering (IJCSE)
DOI: 10.21817/ijcse/2018/v10i1/181001024 Vol. 10 No.1 Jan 2018 29
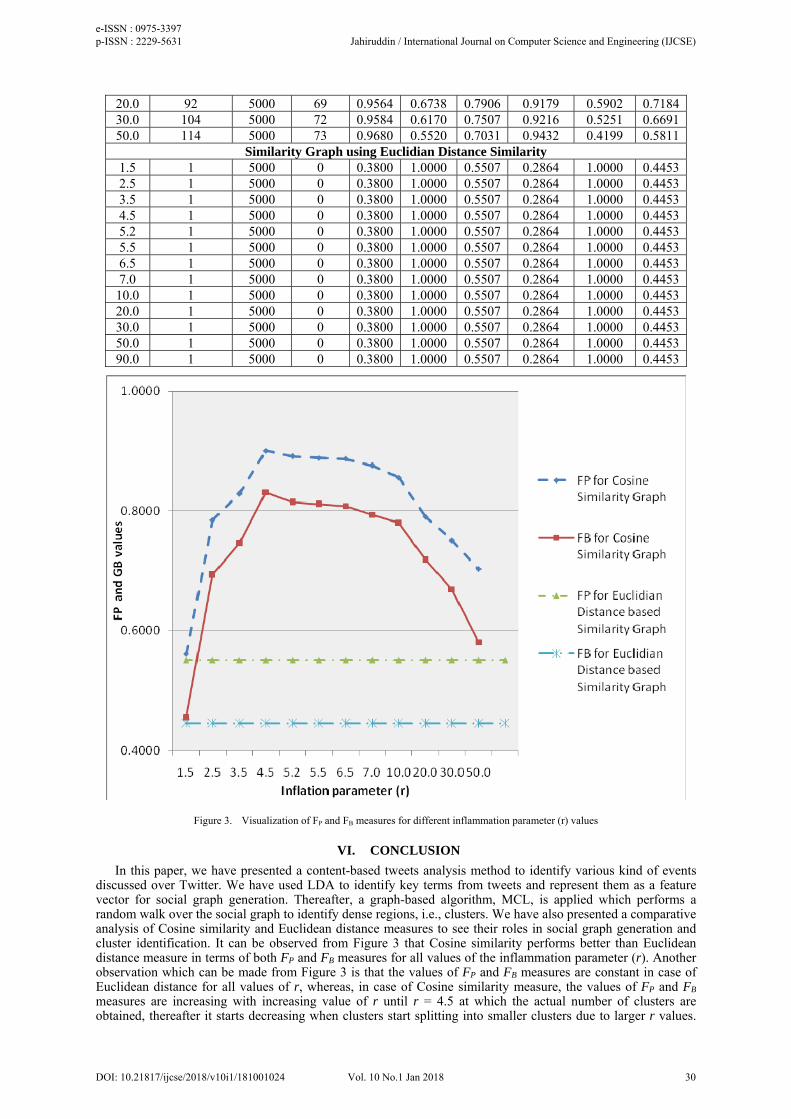
20.0 92 5000 69 0.9564 0.6738 0.7906 0.9179 0.5902 0.718430.0 104 5000 72 0.9584 0.6170 0.7507 0.9216 0.5251 0.669150.0 114 5000 73 0.9680 0.5520 0.7031 0.9432 0.4199 0.5811
Similarity Graph using Euclidian Distance Similarity 1.5 1 5000 0 0.3800 1.0000 0.5507 0.2864 1.0000 0.44532.5 1 5000 0 0.3800 1.0000 0.5507 0.2864 1.0000 0.44533.5 1 5000 0 0.3800 1.0000 0.5507 0.2864 1.0000 0.44534.5 1 5000 0 0.3800 1.0000 0.5507 0.2864 1.0000 0.44535.2 1 5000 0 0.3800 1.0000 0.5507 0.2864 1.0000 0.44535.5 1 5000 0 0.3800 1.0000 0.5507 0.2864 1.0000 0.44536.5 1 5000 0 0.3800 1.0000 0.5507 0.2864 1.0000 0.44537.0 1 5000 0 0.3800 1.0000 0.5507 0.2864 1.0000 0.4453
10.0 1 5000 0 0.3800 1.0000 0.5507 0.2864 1.0000 0.445320.0 1 5000 0 0.3800 1.0000 0.5507 0.2864 1.0000 0.445330.0 1 5000 0 0.3800 1.0000 0.5507 0.2864 1.0000 0.445350.0 1 5000 0 0.3800 1.0000 0.5507 0.2864 1.0000 0.445390.0 1 5000 0 0.3800 1.0000 0.5507 0.2864 1.0000 0.4453
Figure 3. Visualization of FP and FB measures for different inflammation parameter (r) values
VI. CONCLUSION
In this paper, we have presented a content-based tweets analysis method to identify various kind of events discussed over Twitter. We have used LDA to identify key terms from tweets and represent them as a feature vector for social graph generation. Thereafter, a graph-based algorithm, MCL, is applied which performs a random walk over the social graph to identify dense regions, i.e., clusters. We have also presented a comparative analysis of Cosine similarity and Euclidean distance measures to see their roles in social graph generation and cluster identification. It can be observed from Figure 3 that Cosine similarity performs better than Euclidean distance measure in terms of both FP and FB measures for all values of the inflammation parameter (r). Another observation which can be made from Figure 3 is that the values of FP and FB measures are constant in case of Euclidean distance for all values of r, whereas, in case of Cosine similarity measure, the values of FP and FB measures are increasing with increasing value of r until r = 4.5 at which the actual number of clusters are obtained, thereafter it starts decreasing when clusters start splitting into smaller clusters due to larger r values.
e-ISSN : 0975-3397 p-ISSN : 2229-5631 Jahiruddin / International Journal on Computer Science and Engineering (IJCSE)
DOI: 10.21817/ijcse/2018/v10i1/181001024 Vol. 10 No.1 Jan 2018 30
On the other hand, after analyzing the functioning details of the Markov Clustering, it is found that the number of clusters to be identified by the Markov Clustering is determined by the value of the inflation parameter (r), i.e., number of clusters are less for smaller value of r, and more for the larger values of r. Hence, the Cosine similarity measure is able to mimic the true functioning of the Markov Clustering. As a result, it can be concluded that Cosine similarity seems more effective in comparison to the Euclidean distance to capture and model the underlying social structure of the given data set. Working towards a hybrid approach, exploiting both content-based and structural features of data sets for event identification seems one of the promising future directions of research.
REFERENCES
[1] N. Azam, Jahiruddin, M. Abulaish, and N. Al-H. Haldar, “Twitter Data Mining for Events Classification and Analysis”, In
Proceedings of the 2nd International Conference on Soft Computing and Machine Intelligence (ISCMI’15), Hong Kong, IEEE CPS, Nov. 23-24, 2015, pp. 79-83.
[2] Mohd. Fazil, and Muhammad Abulaish, Identifying Active, Reactive, and Inactive Targets of Socialbots in Twitter, In Proceedings of the IEEE/WIC/ACM International Conference on Web Intelligence (WI), ACM, Lepzig, Germany, pp. 573-580, August 23-26, 2017.
[3] Mohd Fazil and Muhammad Abulaish, Why a Socialbot is Effective in Twitter? A Statistical Insight, In Proceedings of the 9th International Conference on Communication Systems and Networks (COMSNETS), Social Networking Workshop, Bengaluru, India, pp. 562-567, January 4-8, 2017.
[4] Muhammad Abulaish and Sajid Y. Bhat, Classifier Ensembles using Structural Features for Spammer Detection in Online Social Networks, Foundations of Computing and Decision Sciences, Vol. 40, Issue 2, Poznan University of Technology, Poland, pp. 89-105, 2015.
[5] Sajid Y. Bhat and Muhammad Abulaish, Communities against Deception in Online Social Networks, Computer Fraud and Security, 2014(2), Elsevier, ISSN: 1361-3723, pp. 8-16, Feb. 2014.
[6] Tarique Anwar and Muhammad Abulaish, A social graph based text mining framework for chat log investigation, Digital Investigation, Vol. 11, Issue 4, Elsevier, pp. 349-362, 2014.
[7] Sajid Y. Bhat, Muhammad Abulaish, and Abdulrahman A. Mirza, Spammer Classification using Ensemble Methods over Structural Social Network Features, In Proceedings of the 14th IEEE/WIC/ACM International Conference on Web Intelligence (WI’14), Warsaw, Poland, pp. 454-458, Aug. 11-14, 2014.
[8] J. Chung and E. Mustafaraj, “Can collective sentiment expressed on twitter predict political elections?” in Proceedings of the Twenty-Fifth AAAI Conference on Artificial Intelligence, 2011, pp. 170–171.
[9] M. Cheong and V. Lee, “A study on detecting patterns in twitter intratopic user and message clustering,” in Proceedings of the 2010 20th International Conference on Pattern Recognition, 2010, pp. 3125–3128.
[10] C. G. Akcora, M. A. Bayir, M. Demirbas, and H. Ferhatosmanoglu, “Identifying breakpoints in public opinion,” in Proceedings of the First Workshop on Social Media Analytics, 2010, pp. 62–66.
[11] J. Bollen, H. Mao, and X.-J. Zeng, “Twitter mood predicts the stock market,” Journal of Computational Science, vol. 2, no. 1, pp. 1–8, 2011.
[12] M. Thelwall, K. Buckley, and G. Paltoglou, “Sentiment in twitter events,” Journal of the American Society for Information Science and Technology, vol. 62, no. 2, pp. 406–418, 2011.
[13] M. Cha, H. Haddadi, F. Benevenuto, and K. P. Gummadi, “Measuring user influence in twitter: The million follower fallacy,” in Proceedings of the Fourth International AAAI Conference on Weblogs and Social Media, 2010, pp. 10–17.
[14] A. Willis, A. Fisher, and I. Lvov, “Mapping networks of influence: Tracking Twitter conversations through time and space,” Journal of Audience and Reception Studies, vol. 12, no. 1, pp. 594-530, 2015.
[15] A. Pak and P. Paroubek, “Twitter as a corpus for sentiment analysis and opinion mining,” in Proceedings of the Seventh conference on International Language Resources and Evaluation (LREC’10), 2010, pp. 1320–1326.
[16] A. Go, L. Huang, and R. Bhayani, “Twitter sentiment analysis,” Stanford University, Stanford, California, USA, CS224N - Final Project Report, 2009.
[17] J. Spencer and G. Uchyigit, “Sentimentor: Sentiment Analysis on Twitter Data,” in Proceedings of the 1st International Workshop on Sentiment Discovery from Affective Data, Bristol, United Kingdom, 2012, pp. 56-66.
[18] A. Go, R. Bhayani, and L. Huang, “Twitter sentiment classification using distant supervision,” Processing 150(12), pp. 1-6, 2009. [19] H. Becker, M. Naaman, and L. Gravano, “Learning similarity metrics for event identification in social media,” in Proceedings of the
third ACM international conference on Web search and data mining, 2010, pp. 291–300. [20] T. Sakaki, M. Okazaki, and Y. Matsuo, “Earthquake shakes twitter users: Real-time event detection by social sensors,” in Proceedings
of the 19th international conference on World wide web, 2010, pp. 851–860. [21] H. Becker, M. Naaman, and L. Gravano, “Beyond trending topics: Real-world event identification on twitter,” in Proceedings of the
Fifth International AAAI Conference on Weblogs and Social Media, 2011, pp. 438–441. [22] Sajid Y. Bhat and Muhammad Abulaish, Analysis and Mining of Online Social Networks - Emerging Trends and Challenges, WIREs
Data Mining and Knowledge Discovery, 3(6), John Wiley and Sons, ISSN: 1942-4787, pp. 408-444, Nov/Dec 2013. [23] Peter J. Olver. 2008. Numerical Analysis Lecture Note. Retrieved on 18.03.2017 from http://www-users.math.umn.edu/ ∼olver/num
/lnn.pdf. [24] E.W. Weisstein. 2002. Vector Norm. Wolfram MathWorld. Retrieved on 18.03.2017 from http://mathworld.wolfram.com/
VectorNorm.html. [25] D. M. Blei, A. Y. Ng, and M. I. Jordan, “Latent dirichlet allocation,” Journal of Machine Learning Research, vol. 3, no. 4-5, pp. 993–
1022, 2003. [26] M. Abulaish, Jahiruddin, and L. Dey, “Deep text mining for automatic keyphrase extraction from text documents,” Journal of
Intelligent Systems, vol. 20, no. 4, pp. 327–351, 2011. [27] S. van Dongen, “Graph clustering by flow simulation,” Ph.D. Thesis, University of Utrecht, Utrecht, Netherlands, 2000.
e-ISSN : 0975-3397 p-ISSN : 2229-5631 Jahiruddin / International Journal on Computer Science and Engineering (IJCSE)
DOI: 10.21817/ijcse/2018/v10i1/181001024 Vol. 10 No.1 Jan 2018 31