Contaminants o f Emerging Co ncern In the Tidal Delaware ...
87
C Contami T Pil Dela A inants o I Tidal De lot Mon 200 ware Rive final rep A. Ronald M J revised of Emerg In the elaware nitoring 07 -2009 er Basin C port prepare MacGillivra uly, 2012 d August, 20 ging Co River Survey 9 Commissio ed by ay, Ph.D. 013 oncern on
Transcript of Contaminants o f Emerging Co ncern In the Tidal Delaware ...

CContami
T
Pil
Dela
A
inants oI
Tidal De
lot Mon200
ware Rive
final rep
A. Ronald M
Jrevised
of EmergIn the elaware
nitoring 07 -2009
er Basin C
port prepare
MacGillivra
uly, 2012 d August, 20
ging Co
River
Survey 9
Commissio
ed by
ay, Ph.D.
013
oncern
on

-2-
Table of Contents 1.0 Abstract ....................................................................................................................... 4 2.0 Introduction ................................................................................................................ 5 3.0 Pharmaceutical Source Map for the Delaware River Basin .................................. 7 4.0 Methods ....................................................................................................................... 9 4.1 Analytical Methods ..................................................................................................... 9 4.2 Supplemental Water Quality Data Methods .......................................................... 11 4.3 Sampling Procedures ................................................................................................ 13 4.4 Hydrology .................................................................................................................. 15 4.5 Prioritization of PPCP .............................................................................................. 15 5.0 Results and Discussion .............................................................................................. 17 5.1 Pharmaceutical and Personal Care Products ......................................................... 18
5.1.1 Aquatic Toxicity………………………………………………….….....…21 5.1.2 Human Health Effects…………………………………………….….…..22 5.1.3 Priority PPCP……………………………………………………………..23 5.2 Hormones and Sterols………………………………………………………………26 5.3 Perfluoroalkyl and polyfluoroalkyl substances ...................................................... 31 5.4 Polybrominated Diphenyl Ethers ............................................................................ 38 5.4.1 Ambient Water……………………………………………………………38 5.4.2 Fish Tissue………………………………………………………………...39 5.5 Nonylphenol and Nonylphenol ethoxylates ............................................................ 42 5.6 Bisphenol A ................................................................................................................ 44 6.0 Conclusions…………………………………………………………………….……44 7.0 References ................................................................................................................. 45 8.0 Acknowledgements……………………………………………………….………..51 Appendix A: PPCP and PBDE Analytes………………………………………………………………………………………...52 Appendix B: Data Tables………………………………………………………………………………………………………….56 Appendix C: Aquatic toxicology Tables ……………………………………………………………………………………...68 Appendix D: Bioassays…………………………………………………………………………………………………………....81 List of Figures Figure 1. Map of Delaware River Basin Land use in 2001 from USGS National Land Cover Data Base…………………………………………………………………...6 Figure 2. Pharmaceutical Source Map for the Delaware River Basin……………….8 Figure 3. Map of Sampling Sites in 2007, 2008, and 2009…………………………...14 Figure 4. Perfluorooctanoate (C8) in ambient water ………………………………..34 Figure 5. Perfluorooctanesulfonate in ambient water……………………………….35 Figure 6. Perfluorononanoate (C9) in ambient water……………………………….36 Figure 7. Perfluoroundecanoate (C11) in water and fish tissue…………………….37 Figure 8. PBDE in ambient waters of the tidal Delaware River………………….…41 Figure 9. Nonylphenol in ambient waters of the tidal Delaware River……………..43
-3-
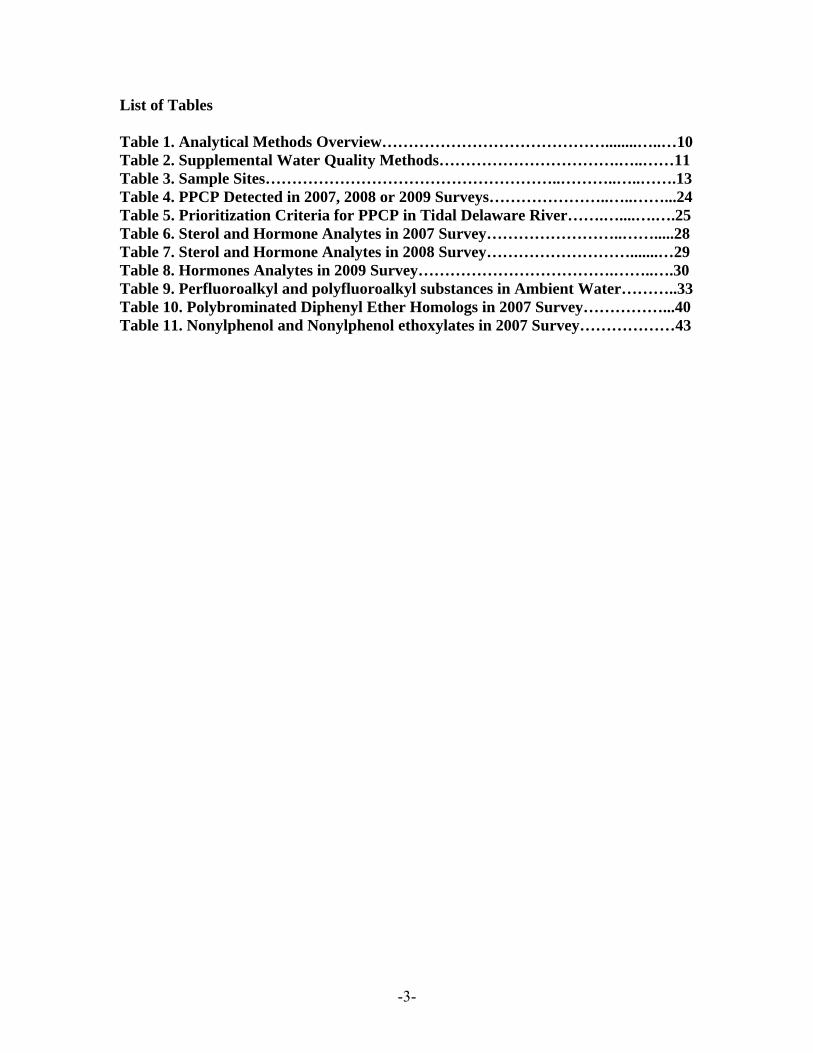
List of Tables Table 1. Analytical Methods Overview……………………………………........…..…10 Table 2. Supplemental Water Quality Methods…………………………….…..……11 Table 3. Sample Sites………………………………………………..………..…..…….13 Table 4. PPCP Detected in 2007, 2008 or 2009 Surveys…………………..…..……...24 Table 5. Prioritization Criteria for PPCP in Tidal Delaware River…….…....….….25 Table 6. Sterol and Hormone Analytes in 2007 Survey……………………..…….....28 Table 7. Sterol and Hormone Analytes in 2008 Survey……………………….......…29 Table 8. Hormones Analytes in 2009 Survey……………………………….……..….30 Table 9. Perfluoroalkyl and polyfluoroalkyl substances in Ambient Water………..33 Table 10. Polybrominated Diphenyl Ether Homologs in 2007 Survey……………...40 Table 11. Nonylphenol and Nonylphenol ethoxylates in 2007 Survey………………43
-4-
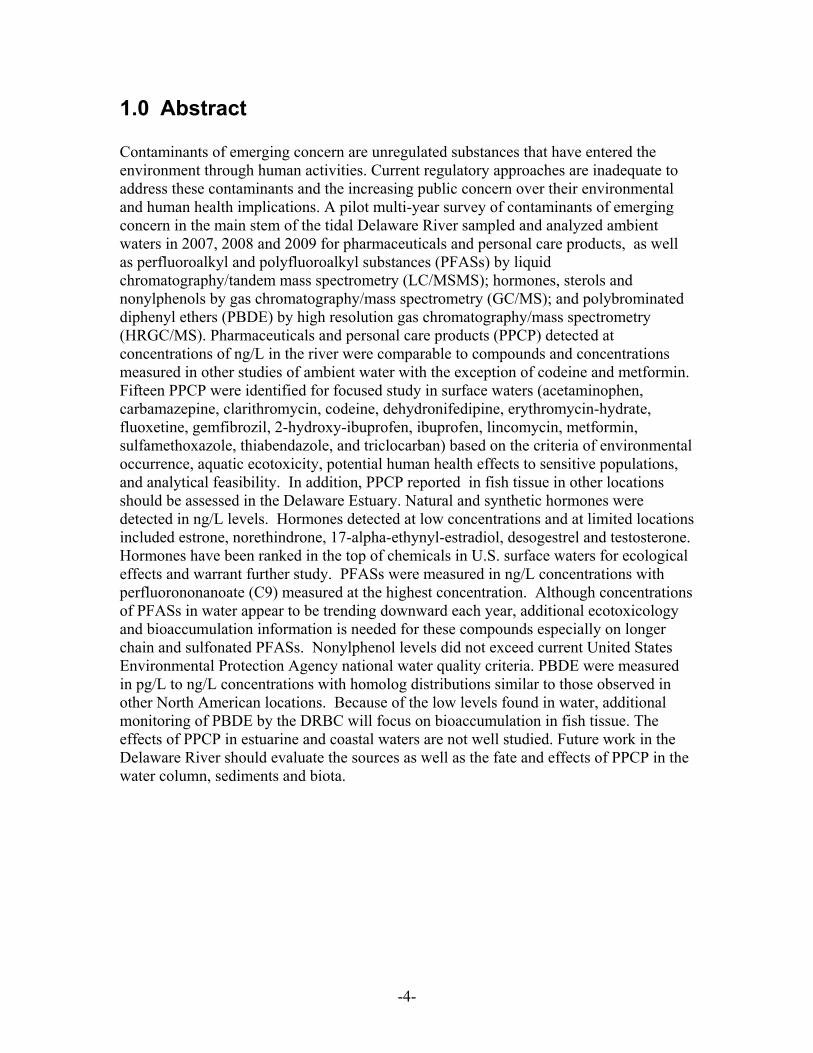
1.0 Abstract Contaminants of emerging concern are unregulated substances that have entered the environment through human activities. Current regulatory approaches are inadequate to address these contaminants and the increasing public concern over their environmental and human health implications. A pilot multi-year survey of contaminants of emerging concern in the main stem of the tidal Delaware River sampled and analyzed ambient waters in 2007, 2008 and 2009 for pharmaceuticals and personal care products, as well as perfluoroalkyl and polyfluoroalkyl substances (PFASs) by liquid chromatography/tandem mass spectrometry (LC/MSMS); hormones, sterols and nonylphenols by gas chromatography/mass spectrometry (GC/MS); and polybrominated diphenyl ethers (PBDE) by high resolution gas chromatography/mass spectrometry (HRGC/MS). Pharmaceuticals and personal care products (PPCP) detected at concentrations of ng/L in the river were comparable to compounds and concentrations measured in other studies of ambient water with the exception of codeine and metformin. Fifteen PPCP were identified for focused study in surface waters (acetaminophen, carbamazepine, clarithromycin, codeine, dehydronifedipine, erythromycin-hydrate, fluoxetine, gemfibrozil, 2-hydroxy-ibuprofen, ibuprofen, lincomycin, metformin, sulfamethoxazole, thiabendazole, and triclocarban) based on the criteria of environmental occurrence, aquatic ecotoxicity, potential human health effects to sensitive populations, and analytical feasibility. In addition, PPCP reported in fish tissue in other locations should be assessed in the Delaware Estuary. Natural and synthetic hormones were detected in ng/L levels. Hormones detected at low concentrations and at limited locations included estrone, norethindrone, 17-alpha-ethynyl-estradiol, desogestrel and testosterone. Hormones have been ranked in the top of chemicals in U.S. surface waters for ecological effects and warrant further study. PFASs were measured in ng/L concentrations with perfluorononanoate (C9) measured at the highest concentration. Although concentrations of PFASs in water appear to be trending downward each year, additional ecotoxicology and bioaccumulation information is needed for these compounds especially on longer chain and sulfonated PFASs. Nonylphenol levels did not exceed current United States Environmental Protection Agency national water quality criteria. PBDE were measured in pg/L to ng/L concentrations with homolog distributions similar to those observed in other North American locations. Because of the low levels found in water, additional monitoring of PBDE by the DRBC will focus on bioaccumulation in fish tissue. The effects of PPCP in estuarine and coastal waters are not well studied. Future work in the Delaware River should evaluate the sources as well as the fate and effects of PPCP in the water column, sediments and biota.

-5-
2.0 Introduction The goal of the survey was to collect ambient water data for use in compiling basin data on contaminants of emerging concern (CEC) identified in the DRBC report titled Emerging Contaminants of Concern in the Delaware River Basin (http://www.state.nj.us/drbc/EmergingContaminantsFeb2007.pdf). Participants included the Delaware River Basin Commission (DRBC), Axys Analytical Services Ltd, and Delaware Department of Natural Resources Environmental Control and Environmental Laboratory Section (DNREC-ELS). More than 84,000 chemicals are listed on the USEPA Toxic Substance Control Act (TSCA) chemical substance inventory. New chemicals are introduced each year and released to the environment while improved analytical methods are available to detect many of these compounds. In addition, there is a growing body of information on adverse effects from some contaminants. Scientists, the public, and regulators have an increased interest in substances and toxic effects not historically monitored or assessed. The compounds included in the multi-year survey are unregulated compounds (pharmaceuticals, hormones and sterols, perfluoroalkyl and polyfluoroalkyl substances, and polybrominated diphenyl ethers) or recently regulated compounds (nonylphenols). The survey was conducted in the tidal Delaware River, the part of the river that has tidal flux from Trenton to the head of the Bay. This is an urbanized and industrialized area as shown in Figure 1 (river segment predominantly surrounded by developed (red) land use). Over 6 million residents live in contributing watersheds to the tidal Delaware River creating an area of concentrated consumer product usage. Two sites (E12 at RM105.4 and E16 at RM 131.1) in the survey are within segments of the river designated for use as public water supplies after reasonable treatment (Table3 and Figure 3). All sites in the survey are within segments of the river designated for fish ingestion as well as water uses such as maintenance of resident fish and other aquatic life and wildlife protection.

FigurLand
re 1. Map od Cover Dat
of Delawaretabase
e River Basi
-6-
in Land Usee in 2001 froom USGS NNational

-7-
3.0 Pharmaceutical Source Map for the Delaware River Basin
As part of an ongoing effort by the DRBC to assess the vulnerability of the Delaware River Basin to contaminants of emerging concern, a pharmaceutical source map was generated by merging information from a National Pollutant Discharge Elimination System Permit Compliance System (NPDES/PCS) retrieval file and a pharmaceutical manufacturing Standard Industrial Classification (SIC) code file. The merged file includes the facility name, address, NPDES number, SIC, SIC description, and coordinates. The pharmaceutical manufacturing SIC code file for the basin contains twenty-nine entries. Several facilities were deleted from the list based on current information from regulators in basin states. The DRBC pharmaceutical manufacturers list was cross-checked with a similar list obtained from Carey A. Johnston of the U.S. EPA, Office of Water. The EPA list consists of facilities likely to be subject to the Pharmaceutical Manufacturing Effluent Guidelines (Part 439). The EPA list is based on 2004 data from Permit Compliance System (PCS) and Toxics Release Inventory (TRI). Facility identification is done based on the primary SIC code reported to TRI or PCS. Facilities in the following SIC codes are regulated by the Pharmaceuticals Manufacturing Effluent Guidelines source category (Part 439): 2833 Medicinals and botanicals; 2834 Pharmaceutical preparations; 2835 Diagnostic substances; and 2836 Biological products, except diagnostics. In addition, the EPA identified several pharmaceutical manufacturing facilities in SIC Code 2048: Prepared Feed and Feed Ingredients for Animals and Fowls, Except Dogs and Cats. After the DRBC and USEPA lists were found to match, the list was used to generate the pharmaceutical source map. Wastewater treatment plants in the basin were added to the list and map as post-consumer use sources of pharmaceuticals. Figure 2 shows numerous potential sources to the Delaware River, from 584 sewage treatment facilities and 18 manufacturing sites, for only one category of contaminants of emerging concern (pharmaceuticals).

-8-
Figure 2. Pharmaceutical Source Map for the Delaware River Basin
-9-
4.0 Methods
4.1 Analytical Methods
Pharmaceuticals and personal care products (PPCP) were analyzed using Axys Method MLA-052 Rev 4 in 2007 and 2008 and MLA-075-Rev4 in 2009. Both methods are suitable for determination of pharmaceutical and personal care compounds in aqueous samples. The analysis required extraction at different pH conditions. Prior to extraction and/or clean-up procedures samples were adjusted to the required pH and spiked with surrogates. Aqueous samples were filtered prior to the analysis to remove solid particulate. Aqueous samples were cleaned up by solid phase extraction (SPE) and analyzed by liquid chromatography / electrospray ionization / tandem mass spectrometry (LC/ESI-MS/MS) in positive and negative ionization modes. The method has four modes that target different pharmaceuticals as follows: 1) acid extraction, positive ESI 2) tetracylines, positive ESI; 3) acid extraction, negative ESI; and 4) base extraction, positive ESI. PPCP analytes and estimated detection limits are listed in Appendix A Table A1. Sterols and hormones were analyzed using Axys Method MLA-055 Rev 2 in 2007 and MLA-068 Rev 1 in 2008. Both methods are suitable for determination of concentration of a suite of steroids in aqueous samples. All samples were spiked with deuterated surrogate standards prior to analysis. Aqueous samples were solvent extracted with extracts cleaned up on a layered alumina Florisil column and derivatized with BSTFA prior to analysis by capillary gas chromatography and low resolution mass spectrometry (LRMS). Hormones were analyzed using Axys MLA-072 Rev 2 in 2009 by LC/MS/MS. The methods used to measure the hormones and sterols in the DRBC study are new analytical methods with few surrogates available and numerous QA/QC qualifiers. Sterol and hormone analytes and estimated detection limits are listed in Tables 6, 7 and 8. Perfluoroalkyl and polyfluoroalkyl substances (PFASs) were analyzed using the Axys Method MLA-060 Rev 3. After spiking with isotopically-labeled surrogate standards and cleanup on SPE cartridges, samples were analyzed by LC-MS/MS. Final sample concentrations were determined by isotope dilution/internal standard quantification against extracted calibration standards in water. PFASs analytes and limits of quantification are listed in Table 9. Polybrominated diphenyl ethers (PBDE) were analyzed using Axys Method MLA-033 Rev 3 to determine concentrations of a suite of brominated diphenyl ethers in aqueous samples as described in USEPA Method 1614. The sample is extracted and cleaned up on a series of chromatographic columns. The final extract is spiked with isotopically-labeled recovery (internal) standards prior to instrumental analysis. Analysis of the extract is performed on a high resolution mass spectrometer (HRMS) coupled to a high-resolution gas chromatograph (HRGC) equipped with a DB-5HT chromatography column. PBDE analytes and estimated detection limits are listed in Appendix A, Table A2.
-10-
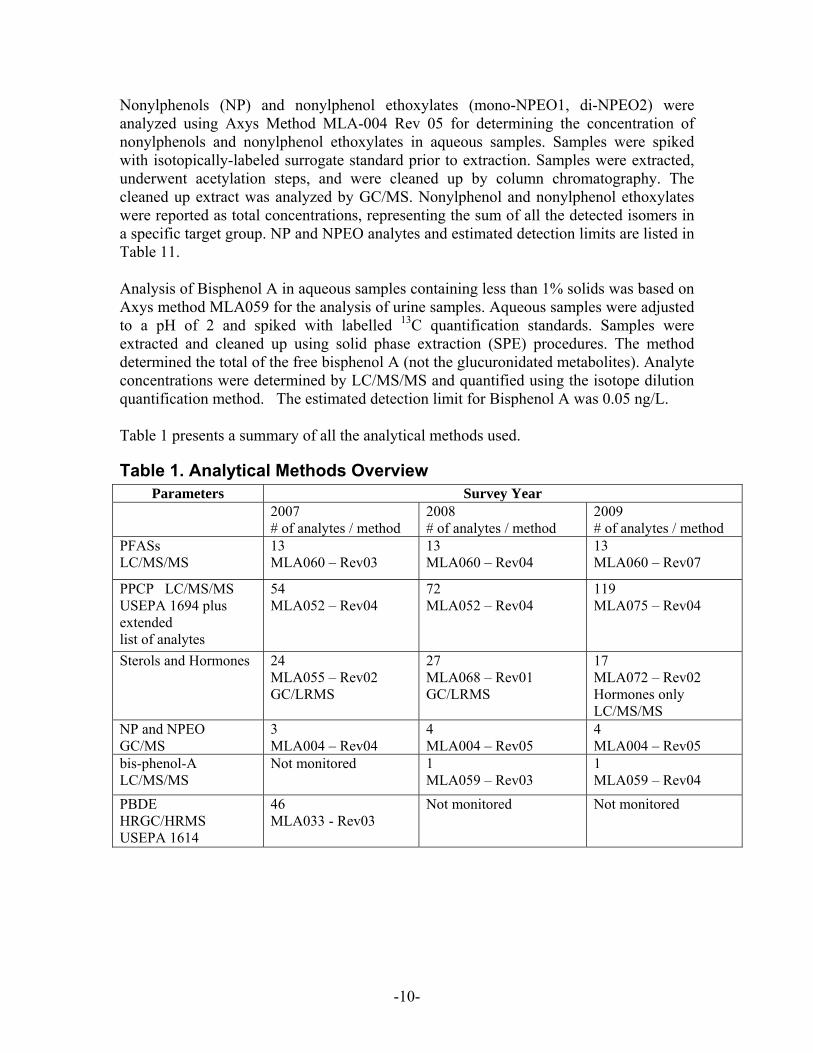
Nonylphenols (NP) and nonylphenol ethoxylates (mono-NPEO1, di-NPEO2) were analyzed using Axys Method MLA-004 Rev 05 for determining the concentration of nonylphenols and nonylphenol ethoxylates in aqueous samples. Samples were spiked with isotopically-labeled surrogate standard prior to extraction. Samples were extracted, underwent acetylation steps, and were cleaned up by column chromatography. The cleaned up extract was analyzed by GC/MS. Nonylphenol and nonylphenol ethoxylates were reported as total concentrations, representing the sum of all the detected isomers in a specific target group. NP and NPEO analytes and estimated detection limits are listed in Table 11. Analysis of Bisphenol A in aqueous samples containing less than 1% solids was based on Axys method MLA059 for the analysis of urine samples. Aqueous samples were adjusted to a pH of 2 and spiked with labelled 13C quantification standards. Samples were extracted and cleaned up using solid phase extraction (SPE) procedures. The method determined the total of the free bisphenol A (not the glucuronidated metabolites). Analyte concentrations were determined by LC/MS/MS and quantified using the isotope dilution quantification method. The estimated detection limit for Bisphenol A was 0.05 ng/L. Table 1 presents a summary of all the analytical methods used.
Table 1. Analytical Methods Overview Parameters Survey Year
2007 # of analytes / method
2008 # of analytes / method
2009 # of analytes / method
PFASs LC/MS/MS
13 MLA060 – Rev03
13 MLA060 – Rev04
13 MLA060 – Rev07
PPCP LC/MS/MS USEPA 1694 plus extended list of analytes
54 MLA052 – Rev04
72 MLA052 – Rev04
119 MLA075 – Rev04
Sterols and Hormones
24 MLA055 – Rev02 GC/LRMS
27 MLA068 – Rev01 GC/LRMS
17 MLA072 – Rev02 Hormones only LC/MS/MS
NP and NPEO GC/MS
3 MLA004 – Rev04
4 MLA004 – Rev05
4 MLA004 – Rev05
bis-phenol-A LC/MS/MS
Not monitored 1 MLA059 – Rev03
1 MLA059 – Rev04
PBDE HRGC/HRMS USEPA 1614
46 MLA033 - Rev03
Not monitored Not monitored

-11-
4.2. Supplemental Water Quality Data Methods
In-field measurements of specific conductivity, salinity, water temperature, dissolved oxygen and pH were performed at all sites on each sample day. Laboratory analysis of transect composite samples from each site was also conducted according to the methods listed in Table 2. Aquatic toxicity tests for short-term chronic toxicity and in vitro tests for estrogenic compounds were also conducted on the ambient water samples. The tests can assess chemical mixtures and possible additive effects as well as assess toxicants with no specific analytical method or chemicals not monitored by the chemical methods utilized (Appendix C). Table 2. Supplemental Water Quality Methods
PARAMETER METHOD REFERENCE MDL1 LOQ2
CHLORIDE EPA 300.0 1 mg/L 3 mg/L
CHROMIUM, HEXAVALENT STD MTH 3500-Cr B 1.4 ug/L 5.0 ug/L
DISSOLVED OXYGEN (field) STDMTD 18th ed. 4500-O N/A 0.1 mg/L
ALKALINITY EPA 2320B 0.9 mg/L 1.0 mg/L
HARDNESS EPA 2340C 0.3 mg/L 1.0 mg/L
pH (field) STDMTD 4500 H+ N/A 0.1 unit SALINITY STDMTD 2520 N/A 0.1 ppt SPECIFIC CONDUCTANCE (field) STDMTD 2510B N/A 2.0 uS/cm
SUSPENDED SOLIDS, TOTAL(TSS) EPA 160.2 NA 5.0 mg/L
TEMPERATURE, AIR/WATER (field) EPA 170.1 N/A N/A
ORTHOPHOSPHATE, DISSOLVED EPA 365.1 Rev 2.0 0.002
mg/L 0.010 mg/L
PHOSPHOROUS, TOTAL EPA 365.4 0.005 mg/L 0.040 mg/L
NH3 – N EPA 350.1 Rev 2.0 0.004 mg/L 0.020 mg/L
NO2 – N EPA 353.2 Rev 2.0 0.003 mg/L 0.008 mg/L
NO3 - N EPA 353.2 Rev 2.0 0.005 mg/L 0.010 mg/L
NO3 – N & NO2 - N EPA 353.2 Rev 2.0 0.005 mg/L 0.010 mg/L
KJELDAHL, TOTAL - N EPA 351.2 Rev 2.0 0.07 mg/L 0.20 mg/L
CADMIUM, TOTAL AND DISSOLVED EPA 200.7 Rev 4.4 0.43
ug/L 5 ug/L
-12-
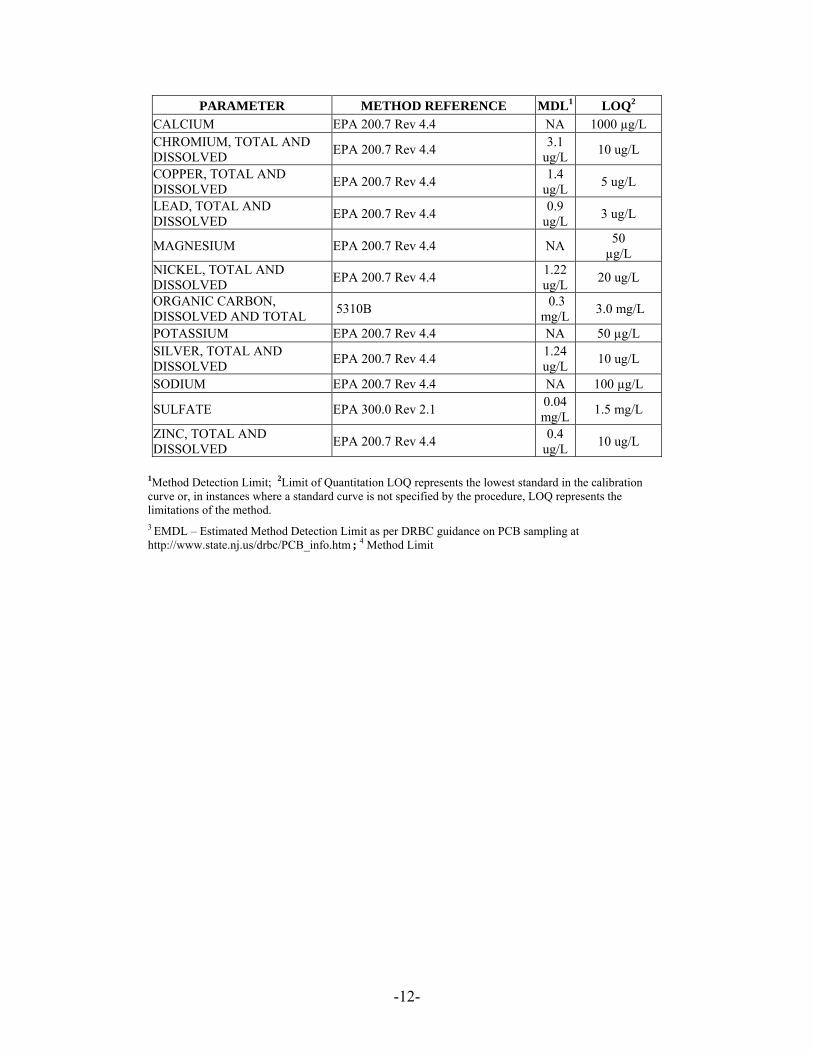
PARAMETER METHOD REFERENCE MDL1 LOQ2 CALCIUM EPA 200.7 Rev 4.4 NA 1000 µg/L CHROMIUM, TOTAL AND DISSOLVED EPA 200.7 Rev 4.4 3.1
ug/L 10 ug/L
COPPER, TOTAL AND DISSOLVED EPA 200.7 Rev 4.4 1.4
ug/L 5 ug/L
LEAD, TOTAL AND DISSOLVED EPA 200.7 Rev 4.4 0.9
ug/L 3 ug/L
MAGNESIUM EPA 200.7 Rev 4.4 NA 50 µg/L
NICKEL, TOTAL AND DISSOLVED EPA 200.7 Rev 4.4 1.22
ug/L 20 ug/L
ORGANIC CARBON, DISSOLVED AND TOTAL 5310B 0.3
mg/L 3.0 mg/L
POTASSIUM EPA 200.7 Rev 4.4 NA 50 µg/L SILVER, TOTAL AND DISSOLVED EPA 200.7 Rev 4.4 1.24
ug/L 10 ug/L
SODIUM EPA 200.7 Rev 4.4 NA 100 µg/L
SULFATE EPA 300.0 Rev 2.1 0.04 mg/L 1.5 mg/L
ZINC, TOTAL AND DISSOLVED EPA 200.7 Rev 4.4 0.4
ug/L 10 ug/L
1Method Detection Limit; 2Limit of Quantitation LOQ represents the lowest standard in the calibration curve or, in instances where a standard curve is not specified by the procedure, LOQ represents the limitations of the method. 3 EMDL – Estimated Method Detection Limit as per DRBC guidance on PCB sampling at http://www.state.nj.us/drbc/PCB_info.htm ; 4 Method Limit

-13-
4.3 Sampling Procedures
Samples were collected from six locations in the tidal Delaware River (Table 3; Figure 3). The tidal portion of the Delaware River, from the head of the tide at Trenton, New Jersey, to the Delaware Bay at Liston Point, Delaware, was the study area. The salinity in the tidal Delaware ranges from <1 to 15 ppt. Sites E12 and E16 are in DRBC Water Quality Zones with designated uses that include public water supplies after reasonable treatment. Sites E1, E4, E6 and E9 are not in Zones designated as sources of drinking water.At mid-channel sampling sites, subsurface ambient water was directly sampled into 2L HDPE (high density polyethylene) bottles for analysis of PFASs. A Niskin bottle was used to collect transect composite ambient water at 0.6 of the water column into HDPE pails to be distributed to five 2.5 L amber glass bottles for analysis of other contaminants of emerging concern. A portion of the composite sample was distributed into 2.5 to 5 gal LDPE (low density polyethylene) cubitainers (VWR Int., Brisbane, CA) for chronic toxicity bioassays and into glass bottles for estrogenic assays. Field blanks were collected. Glass bottles and blank water were obtained from the analytical laboratory. The samples were placed on ice in coolers to maintain a temperature of 4oC ± 2oC and transported to the respective laboratories for bioassays and physical-chemical analyses. Temperature inside the cooler for bioassays was tracked during transport with a temperature logger. Temperature of samples for chemical analysis were checked upon arrival at the laboratory. Table 3. Sampling Sites
Site RIVER MILE
DRBC ZONE
SITE DESCRIPTION
LATITUDE (dd.ddddd)
LONGITUDE (dd.ddddd)
E1 50 5 Liston Point 39.45500 75.5600
E4 68 5 S. of De. Memorial Bridge 39.65472 75.54667
E7 80 4 Opposite Mouth of Marcus Hook Creek 39.81336 75.39058
E9 90 4 South of Schuylkill River 39.875905 75.195988
E12 105 3 Mouth of Pennsauken Creek 39.99478 75.05978
E16 131 2 Biles Channel 40.181560 74.745050
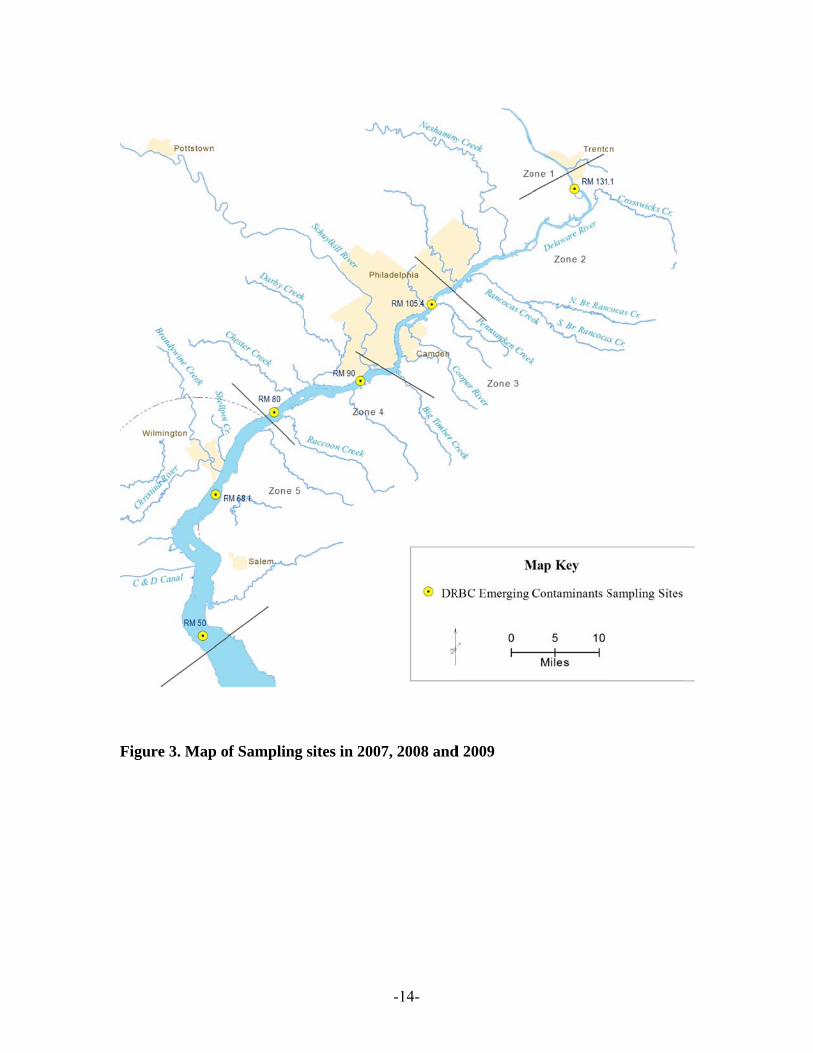
Figur
re 3. Map of Sampling sites in 200
-14-
07, 2008 andd 2009

-15-
4.4 Hydrology
Grab samples of ambient water were collected on October 17, 2007, August 6, 2008 and October 22, 2009 when the mean daily average flows for Delaware River at Trenton, NJ were at 5,390, 4,590 and 5,000 cfs, respectively. The river flows at sampling were below the harmonic mean flow of 6,500 cfs used to calculate protection of human health criteria for carcinogens and above the 30-day flow with a five year recurrence interval (30Q5) of 2,800 cfs used with human health criteria for systemic toxicants. The flows at sampling were also above the minimum flows for aquatic life protection based on a 7Q10 flow of 2,500 cfs. The sampling period is representative of late summer and autumnal river conditions in the tidal Delaware River, but not a worst case scenario.
4.5 Prioritization of PPCP
To evaluate and prioritize individual PPCP on the basis of the risk they pose to the aquatic ecosystem and human health and to add to the knowledge base on the assessment and informed management of the PPCP that pose the greatest risk, a review of the existing knowledge and available data on PPCP exposures and their ecological impacts to the aquatic environment was undertaken using resources listed below. Databases used in the prioritization included: US EPA ECOTOX, which currently includes more than 520,000 test results on the effects of more than 8,500 chemicals, including PPCPs, on over 6,400 terrestrial and aquatic species (http://cfpub.epa.gov/ecotox/); ECOSAR (Ecological Structure Activity Relationship) a computerized predictive system that estimates the aquatic toxicity of chemicals. The program estimates a chemical's acute (short-term) toxicity and chronic (long-term or delayed) toxicity to aquatic organisms such as fish, aquatic invertebrates, and aquatic plants by using Structure Activity Relationships (SARs) (http://www.epa.gov/oppt/newchems/tools/21ecosar.htm); Center for Coastal Environmental Health and Bimolecular Research (CCEHBR) Pharmaceuticals in the Environment, Information for Assessing Risk (PEIAR) website. A site designed to provide available information for assessing risks to aquatic resources from drugs entering waterways from both point and non-point sources (http://www.chbr.noaa.gov/peiar/default.aspx); USEPA PPCP Literature Citation Database includes published literature relevant to the issues surrounding PPCPs as environmental contaminants (http://www.epa.gov/ppcp/lit.html).

-16-
Additional sources for ecotoxicology data were from the following: Bergh, K. 2005 unpublished. Ecological Risk Assessment of Pharmaceuticals and Personal Care Products in Surface Water. (http://ir.lib.sfu.ca/retrieve/2491/etd1839.pdf); Cleuvers, M. 2003. Aquatic ecotoxicity of pharmaceuticals including the assessment of combination effects. Toxicology Letters 142:185-194; Cunningham, V. et al., 2006. Effects of Human Pharmaceuticals on Aquatic Life: Next Steps. Environment Science & Technology. Vol 40.Issue 11 pp 3456-3462; Crane, M; C. Watts and T. Boucard. 2006. Chronic aquatic environmental risks from exposure to human pharmaceuticals. Science of the Total Environment 367:23-41; Fent, K, A Weston and D. Caminanda. 2006. Ecotoxicology of human pharmaceuticals. Aquatic Toxicology 76:122-159; Kuster, A. et al., 2009. Environmental risk assessment of hman pharmaceuticals in the European union: a case study with the β-blocker atenolol. Integr Environ Assess and Manag 6(1)514-523; Oakes, K. D.et al., 2010. Environmental Risk assessment for the serotonin re-uptake inhibitor fluoxetine: case study using the European risk assessment framework. Integr Environ Assess and Manag 6(1)524-539; Schmitt, H et al., 2009. Recommendations on the environmental risk assessment of pharmaceuticals: effect characterization. Integr Environ Assess and Manag 6(1): 588-602; Winter et al 2008. Defining the chronic impacts of atenolol on embryo-larval development and reproduction in the fathead minnow (Pimephales promelas). Aquat. Toxicol. (3) 361-369; Material Safety Data Sheets (MSDS); and TCC Consortium. High Production Volume (HPV) Chemical Challenge Program Data Availablility and Screening Level Assessment for Triclocarban, CAS#:101-20-2. (http://www.epa.gov/hpv/pubs/summaries/tricloca/c14186tc.htm). Using the available data, a risk based procedure was used to prioritize PPCP based on exposure and effects to aquatic organisms that compared measured environmental concentrations from the DRBC multi-year survey to predicted environmental effects levels from published literature or ECOSAR estimates. Predicted no environmental effects concentrations (PNEC) were estimated from acute toxicity (ECx or LCx) divided by an assessment factor of 1,000 or chronic toxicity (NOEC) divided by an assessment factor of 100. The aquatic toxicity data used were from single species tests. Toxicity

-17-
tests with unspecified genus and species were not used. The few available studies on the toxicity of pharmaceutical mixtures also were not included in the assessment (Fent et al., 2006; Kumar et al., 2010). The list of priority PPCP derived in this way were compared to other prioritization and risk assessment approaches that used multiple prioritization criteria such as estimated environmental concentration, ecological and human toxicity, exposure to stream water and fish consumption, physicochemical properties, analytical feasibility, consumption/sales, prescription numbers, loadings, exposures, degradation, and persistence (Bruce, et al., 2010; Collier, 2007; Cooper et al., 2008; Cunningham et al., 2009; de Voogt et al, 2009; Kostich and Lazorchik, 2008; Kumar and Xagoraraki, 2010a, 2010b; Ottmar et al., 2010; and Schwab et al., 2005; Schmitt et al., 2009, Roos et al., 2012). The four key criteria selected for prioritizing PPCP in the tidal Delaware River were the following:
1) environmental occurrence (maximum detected concentration in DRBC surveys), 2) aquatic ecotoxicity (Hazard Quotient of Measured Environmental Concentration
to the Predicted No Effect Concentration (MEC/PNEC) ), 3) human health effects (reported concerns due to possible carcinogenicity,
mutagenicity, reproductive and developmental effects, immunotoxicity, and interactions among drugs when exposed to multiple contaminants especially in sensitive populations),
4) analytical feasibility (USEPA Method 1694 test parameters with validated analytical methods).
Other considerations worth noting in the prioritization include:
1) Occurrence data for some compounds, specifically codeine and metformin, warrant their inclusion for priority study in the Delaware Estuary,
2) A number of compounds such as diclofenac, ethinylestradiol and oxytetracycline that have been identified as priority compounds in other studies were not detected in this study of the tidal Delaware River and were not included in the priority list (Cooper et al., 2008; Collier, 2007),
3) Although aquatic ecotoxicity data were not available for dehydronifedipine, this pharmaceutical has been included in the priority list of pharmaceuticals based on occurrence data and ecological effects (Kumar and Xagoraraki, 2010b).
4) A number of metabolites were detected (benzoylecgonine, desmethyldiltiazem, 1,7-dimethylxanthine, 10-hydroxy amitriptyline and 2-hydroxy-ibuprofen) some at concentrations higher than the parent compound. Although aquatic ecotoxicity data were not available for this compound, 2-hydroxy-ibuprofen was included in the priority list based on occurrence data, toxicity data of the parent compound and the need to further investigate metabolites (Celiz, et al., 2009).
5) The use of physical chemical properties to predict bioaccumulation of PPCP from the water column to fish tissue or aquatic biota is not a key criteria used in this

-18-
prioritization because there is limited information on the environmental fate of ionized compounds the chemical form of many PPCP in the environment (Tarazona et al, 2009). However, PPCP such as diphenylhydramine, norfluoxetine, sertaline, desmethylsertraline, carbamazepine, diltiazem, fluoxetine, and gemfibrozil that have been detected in fish in EPA studies and by other researchers should be further assessed in the Delaware Estuary (http://water.epa.gov/scitech/swguidance/ppcp/fish-tissue.cfm, Brooks et al., 2005).
5.0 Results and Discussion
5.1 Pharmaceutical and Personal Care Products
A wide range of pharmaceutical and personal care products (PPCP) including prescription medicines, over the counter medicines (OTC), antibiotics, and anti-bacterials used in consumer products were targeted in this study. Until recently, the fate and transport of many common PPCP were not of great concern. However, many of these synthetic compounds may ultimately pose a threat to human health and/or the environment. It has been established that some of these substances, i.e., endocrine disruptors, that affect the function of the endocrine system, have the potential to be detrimental to the development of humans and other organisms by adversely affecting physiology and reproduction (Daughton and Ternes 1999). A number of chemicals have been identified as being of environmental concern including lipid regulators (gemfibrozil), analgesics/anti-inflammatories (codeine, acetaminophen, and ibuprofen), antiepileptics (carbamazapine), antidepressants (fluoxetine), oral contraceptives (ethynylestradiol), and antimicrobial disinfectants (triclosan and triclocarban) (Daughton and Ternes, 1999; Fent et al., 2006). The EPA has listed 2-methoxyethanol, erythromycin, mestranol, and nitroglycerin, as well as, the hormones estrone, estriol, estradiol, equilin, equilenin, 17-α estradiol and 17-α ethynyl estrdiol, mestranol and norethindrone as substances that may require regulation under the Safe Drinking Water Act (SDWA) on the Contaminant Candidate List 3 (CCL3) and/or Unregulated Contaminants Monitoring Rule 3 (UCMR3): (http://water.epa.gov/scitech/drinkingwater/dws/ccl/ccl3.cfm) (http://water.epa.gov/lawsregs/rulesregs/sdwa/ucmr/ucmr3/methods.cfm) Most PPCP compounds detected and concentrations found in the tidal Delaware River are comparable to those reported in other occurrence studies of ambient waters for pharmaceuticals and other organic wastewater contaminants. Of the PPCP analyzed in water samples from the tidal Delaware River, 57 compounds were detected in 2007, 2008 or 2009 at concentrations in the ng/L range. Ten PPCP were detected in all three years (azithromycin, caffeine, carbamazepine, clarithromycin, codeine, dehydronifedipine, diltiazem, diphenhydramine, erythromycin-hydrate and fluoxetine) (Appendix B, Table B.4). However, the analytical method used was improved each year increasing the number of PPCP analytes from 54 in 2007 to 72 in 2008 and 119 in 2009 (Table 1).

-19-
Therefore, most of the chemicals are represented by a single measurement but, chemicals with multiple measurements are represented by mean (standard deviation) in Table 4. With the exception of codeine and metformin, the compounds detected and concentrations found in the tidal Delaware River are comparable to those reported in other studies of ambient waters for the occurrence of pharmaceuticals and other organic wastewater contaminants in Pennsylvania streams (Loper et al., 2006); metropolitan Chicago rivers (Mack, unpublished); estuarine environments (Pait et al., 2006); and national reconnaissance studies of surface waters by the USGS (Focazio, 2004, Kolpin et al., 2002). Most of the PPCP in the DRBC study were below detection limits while those chemicals measured were typically at low concentrations (Table 4 and Appendix B, Tables B1 to B4). It should be noted that the results reported from these studies are based on filtered water samples and are therefore biased toward hydrophilic (soluble) compounds that are less likely to sorb to suspended particles or rapidly transported to river sediment. The analgesic codeine, one of the top five most highly prescribed prescription pharmaceuticals, had concentrations peak in the Delaware River at the RM 68.1 with a mean of 89.97 ng/L and a range of 38 to 159 ng/L compared to background concentrations in the river of <10 ng/L. Generally, Loper et al., 2006 found non-detects in a Pennsylvania study except in a few creeks with concentrations between 29 to 56 ng/L. Two pharmaceutical facilities that use codeine in their manufacturing processes have been identified near the RM 68.1 site. Both facilities discharge indirectly to the Delaware River through POTWs. Although codeine is reported to have a high removal rate in POTWs, effluent at the two POTWs receiving the indirect discharges had codeine concentrations of 377 and 2,590 ng/L (three day average). This is in comparison to the occurrence of codeine in effluents measured in a national EPA study where six out of nine POTW facilities were found to have concentrations in the range of ND to 25 ng/L and three facilities had concentrations of 628, 642 and 890 ng/L (USEPA, 2009). A recent study of effluent from wastewater treatment facilities with indirect pharmaceutical discharges found 10 to 1000 times higher pharmaceutical concentrations than those typically found in WWTP effluents. The authors concluded that facilities involved in the manufacture of pharmaceutical products are an under-investigated source of pharmaceuticals to the environment (Phillips et al., 2010). Metformin was detected in the DRBC multi-year survey between RM 80 to 90 in the range of 1,000 to 3,500 ng/L compared to no detection in a study of the Chesapeake Bay (Pait et al., 2006) and in the range of several 100 ng/L in most German rivers (Scheurer et al., 2009). This antidiabetic drug has one of the highest pharmaceutical production levels world-wide. A recent publication on pharmaceutical loadings in wastewater treatment plants concluded that metformin and two other PPCP (valacyclovir and gabapentin) warrant study of fate, transport and occurrence due to the fact that these drugs have high effluent concentrations, significant potential for ecotoxicity and have been included in limited prior research (Ottmar et al., 2010). A Pennsylvania Department of Environmental Protection (PADEP) study in cooperation with United States Geological Survey (USGS) reported analysis of 15 pharmaceuticals
-20-
and 31 antibiotics in water samples from streams with inputs from agricultural areas dominated by animal-feeding operations and wells currently used to supply water for livestock on a farm, in south-central Pennsylvania. The study compared the impact of municipal wastewater and agricultural run-off on the occurrence of the target analytes. In streams receiving municipal wastewater effluent (the scenario in the study that is most similar to the urban tidal Delaware River), 13 phamaceuticals and 11 antibiotics were detected. Maximum concentrations observed for caffeine was 4,750 ng/L, para-xanthine (a degradation product of caffeine) was 853 ng/L, carbamazapine was 516 ng/L, ibuprofen was 277 ng/L and individual antibiotic concentration maxima were in the range of 200 to 1,600 ng/L (Loper et al., 2006). In a study of contaminants of emerging concern in metropolitan Chicago rivers, water column samples from three freshwater streams were sampled at low-flow conditions for twenty-five PPCP, hormones and sterols. Land use in the three streams was reported to be 64 to 78% urban. Not surprisingly, in effluent dominated steams, individual fecal sterols were detected at concentrations between 200 to 5,000 ng/L. However, the hormones equilenin, estriol, progesterone, and testosterone were not detected. PPCP were measured at maximum concentrations of 7.8 ng/L for tylosin, 16 ng/L for triclosan, 170 ng/L for carbamazapine, 200 ng/L for trimethoprim, 210 ng/L for cotinine, 310 ng/L for caffeine and 410 ng/L sulfamethoxazole. Concentrations of PPCP in the three Chicago area streams for the most part were higher than those measured in the Delaware River. It should be noted that both the DRBC and Chicago area studies are grab samples representing a single snap shot in time and space of each river under specific flow conditions and season. Nevertheless, it is noteworthy that similar contaminants of emerging concern are present in surface waters of different urban areas within the United States (Mack, 2008). In national reconnaissance studies of surface waters, the USGS conducted a number of monitoring projects for pharmaceuticals and other organic wastewater contaminants (Focazio, 2004). The USGS criteria for selecting compounds to measure were based on the quantities in use, anticipated environmental behavior, pathways for release, health significance (known and potential), ability to measure the compound, potential as chemical indicators/tracers and stakeholder priorities. The detection of multiple contaminants in surface water was observed in Kolpin et al., 2002. Surface waters were monitored in 1999 through 2000 for 95 organic wastewater contaminants (OWC) in 139 streams including Assunpink Creek in New Jersey. The most commonly detected compounds were coprostranol, cholesterol, N-N-diethyltoluamide (DEET), caffeine, tri(2-chloroethyl)phosphate, triclosan, 4-nonylphenol, nonylphenol monoethoxylate (NPEO1), tris (2-butoxy-ethyl)phosphate, and octylphenol ethoxylate (OPEO1) at low µg/L (ppb) concentrations. In a NOAA National Status and Trends Program study of three estuarine environments (Chesapeake Bay, Biscayne Bay, and Gulf of Fallones), analytes at most of the sites were below quantifiable concentrations. In the Chesapeake Bay sites, 13 of 24 pharmaceutical and related compounds were detected but fewer were quantified. Erythromycin hydrate was detected at many sites but below quantification levels. Compounds measured at

-21-
quantifiable levels were trimethoprim at 1 ng/L, sulfamethoxazole at 11 ng/L, fluoxetine at 3 ng/L, and acetaminophen at 2 μg/L. In Biscayne Bay, two compounds (cotinine and thiabendazole) were above detection limits but below quantification limits. A third compound acetaminophen was quantified at 3 μg/L. In the Gulf of the Farallones, two compounds were above the detection limit but below the quantification limit and no compounds were above the quantification limit. The detection limits and quantification limits (laboratory reporting limits) were not specified in the report (Pait et al., 2006). The authors reviewed the ecotoxicology literature on the compounds detected and concluded that the effects of pharmaceuticals in estuarine and coastal waters is not well studied. They recommended future work to document occurrence of pharmaceuticals in both water column and sediments followed by appropriate laboratory and field studies to assess possible impacts.
5.1.1 Aquatic Toxicity All sites in the survey are within segments of the river with designated uses such as maintenance of resident fish and other aquatic life as well as wildlife protection. A DRBC review of the literature found limited aquatic ecotoxicity data on the detected compounds, primarily on individual compounds using single species tests. Thus, any assessment of risk to aquatic life is preliminary. Nevertheless, a screening level calculation by a risk characterization ratio method which calculates the ratio of the Measured Environmental Concentration to the Predicted No Effect Concentration (MEC/PNEC) indicated a Hazard Quotient of >1.0 for acetaminophen, clarithromycin, fluoxetine, ibuprofen, sulfamethoxazole and triclocarban effects on aquatic organisms. A ratio greater than one estimates that the predicted environmental concentration would be above the no-effects concentration and is generally considered cause for concern (Cunningham et al, 2006). The Hazard Quotient was calculated using maximum concentrations from the DRBC survey and the most sensitive species and endpoints from a limited data set reported in the literature or predicted from an ECOSAR predictive model while using standard adjustment factors for acute and chronic toxicity data as described in the report entitled High Production Volume (HPV) Chemical Challenge Program Data Availability and Screening Level Assessment for Triclocarban CAS #: 101-20-2, Prepared for the HPV Challenge Program by The TCC Consortium on December 27, 2002 (http://www.epa.gov/hpv/pubs/summaries/tricloca/c14186tc.htm). Using the same approach, Hazard Quotients of 0.1 to 1.0 were calculated for effects on aquatic organisms for carbamazepine, codeine, erythromycin-hydrate, gemfibrozil, lincomycin, and thiabendazole. A ratio greater than one tenth but less than one is considered a low risk but not an insignificant risk by some assessors because of the chemical specificity and potency of many PPCP (Ankley et al., 2006, Crane et al., 2007 European Medicines Agency. 2006). For a substance with acute ecotoxicity data only, the combined safety factor used in this assessment is 10,000 (1,000 from the calculation of the PNEC and 10 from the use of a 0.1 hazard quotient). This combined safety factor of 10,000 is equivalent to the safety factor recommended as a default aid to prioritization of human pharmaceuticals in the absence of identified specific environmental concerns.

-22-
This is a factor of 10 greater than the assessment factor applied to non-biologically active industrial chemicals (Crane et al., 2007). A summary of aquatic toxicology data (endpoints, organisms and sources), assessment factors, measured environmental concentrations, estimated PNEC and calculated hazard quotients used in this assessment are tabulated in Appendix C. Aquatic Toxicology Data. If effects data was not available in the published literature, predictions from ecological structure activity relationship (ECOSAR) were used. Some pharmaceutical compounds detected in the DRBC survey did not have readily available aquatic toxicology data in the literature or ECOSAR predictions of aquatic effects (2-hydroxy-ibuprofen, dehydronifedipine, desmethyldiltiazem, fluticasone propionate and norverapamil). A number of compounds only had acute data readily available. PPCP would be better assessed for ecotoxicity if chronic toxicity, bioavailability, bioaccumulation and duration of exposure data were readily available (Jjemba, 2006). It should be restated that this is a preliminary screening assessment of the data. Other approaches for assessment might use species sensitivity distribution to estimate PNECs , threshold concentration action levels or integration of river monitoring data in fate and transport models to estimate distribution and effects of contaminants of emerging concern. Assessment of ecotoxicity from contaminants of emerging concern in the tidal Delaware River would be further informed by estrogenicity screening, biomarker measurements and population (sex ratio) surveys.
5.1.2 Human Health Effects Although the focus of this study was contaminants of emerging concern in surface water and aquatic toxicity, human health effects were considered in the prioritization. Two sites (E12 at RM105.4 and E16 at RM 131.1) in the survey are within segments of the river designated for use as public water supplies after reasonable treatment (Table3 and Figure 3). All sites in the survey are within segments of the river designated for fish ingestion. Numerous studies have concluded that healthy adults are unlikely to be adversely affected at the levels of exposure currently reported for PPCP (Cunningham et al., 2009; Kostich and Lazorchik, 2008; and Schwab et al., 2005). However, potential concerns have been identified for pregnant women, and children from pharmaceutical contaminants in potable water (Collier, 2007). Potential human health effects have also been incorporated in recent risk assessment and prioritization schemes with identified concerns including carcinogenicity, mutagenicity, reproductive and developmental effects, immunotoxicity, allergic reactions, microbial resistance to antibiotics and interactions among drugs when exposured to multiple contaminants (Bruce, et al., 2010; Kumar and Xagoraraki, 2010a, 2010b, and Ottmar et al., 2010) (Table 5). Human health risk assessment methodologies differ from ecological assessments and may identify other pharmaceuticals from those prioritized in this report that may need consideration (Kumar et al. 2010). It is also important to reiterate that the data presented in this report are from
-23-
surface water some of which is source water that will receive additional treatment prior to use as drinking water.
5.1.3 Priority PPCP Based on the criteria used in this assessment of environmental occurrence, aquatic ecotoxicity, potential human health effects and analytical feasibility, the following PPCP should be considered priority pollutants for future monitoring and assessment in surface waters of the tidal Delaware River: acetaminophen, carbamazepine, clarithromycin, codeine, dehydronifedipine, erythromycin-hydrate, fluoxetine, gemfibrozil, 2-hydroxy-ibuprofen, ibuprofen, lincomycin, metformin, sulfamethoxazole, thiabendazole, and triclocarban (Table 4). While hormones were detected at low concentrations and a few location in this study and the analytical feasibility of measuring hormones by EPA Method 1698 or other equivalent methods is limited to a few laboratories, hormones should be considered for future study in surface waters of the Delaware River because of their high potential for ecological effects (Kumar and Xagoraraki, 2010b) In addition, PPCP such as diphenylhydramine, norfluoxetine, sertaline, desmethylsertraline, carbamazepine, diltiazem, fluoxetine, and gemfibrozil that have been detected in fish in EPA studies and by other researchers should be further assessed in the Delaware River (http://water.epa.gov/scitech/swguidance/ppcp/fish-tissue.cfm, Brooks et al., 2005). Although the value of identifying priority pollutants is well established, because of the limited environmental assessment data available on contaminants of emerging concern, monitoring the environmental occurrence and effects of as many parameters as possible in future studies is recommended. It is also important to note that available information on the environmental effects of PPCP is rapidly increasing and any assessment should be updated periodically using current information.

-24-
Table 4. PPCP Detected in 2007, 2008 or 2009 Surveys. Most chemicals represented by a single measurement with multiple measurements represented by the mean (standard deviation).
Concentration (ng/L) by Site / River Mile
Compound E1 / 50 E4 / 68.1 E7 / 80 E9 / 90 E12 / 105.4 E16 / 131.1 Acetaminophen* ND ND ND 105 ND ND
Albuterol ND 0.40 0.83 0.84 0.56 0.34 Alprazolam* 0.42 0.46 0.61 0.58 0.38 ND
Amitriptyline* 0.49 1.01 1.17 1.39 0.83 0.76 Amphetamine* ND ND 3.83 5.53 4.52 ND
Atenolol* 13.80 20.20 53.80 58.80 28.60 11.60 Azithromycin ND ND ND ND ND 9.53(6)
Benzoylecgonine* 6.92 16.20 30.50 39.60 10.60 6.04 Caffeine 18.25(8) 49.53(16) 106.57(15) 158.77(9) 71.50(3) 52.40(8) Carbadox ND ND 7.48 5.89 2.20 ND
Carbamazepine 21.30(8) 47.20(16) 55.63(15) 42.60(9) 23.93(3) 18.50(8) Clarithromycin 4.78* ND 2.20(1) 8.38(5) 6.21(1) 4.24(2)
Cocaine* 0.97 0.34 1.21 1.05 2.33 2.58 Codeine 15.52(11) 89.97(62) 11.67(6) 8.96(5) 5.89(2) 3.40# Cotinine 21.20~ 20.00(2) 36.25(3) 36.75(2) 12.60(3) 7.66(2) DEET* 28.30 32.90 42.80 40.80 17.50 6.34
Dehydronifedipine 0.87(0.3) 1.68(1) 2.19(1) 1.69(1) 0.82(0.2) ND Desmethyldiltiazem* ND 1.31 1.96 3.35 1.38 0.96
Diltiazem 0.47(0.04) 2.57(1) 8.73(3) 10.71(2) 3.67(1) 3.08(1) Dimethylxanthine ND 220 193 239 ND ND Diphenhydramine 0.85(0.24) 0.89(0.2) 1.13(0.5) 3.38(1) 2.44(2) 4.93(2)
Enalapril* ND ND 0.34 ND ND ND Erythromycin-H2O 1.98(1) 5.22(2) 9.15(5) 9.69(5) 4.11(3) 2.87(2)
Fluoxetine 8.02# 4.52(1) ND ND ND ND Fluticasone propionate* ND ND 2.11 2.06 2.31 2.69
Gemfibrozil 5.35(2) 16.24(8) 30.90(12) 41.03(15) 15.44(10) 9.39(3) Hydrocodone* 8.11 16.20 5.49 3.21 2.16 ND
10-hydroxy-amitriptyline* ND ND 0.25 0.38 0.23 0.21 2-Hydroxy-ibuprofen* ND 113 346 286 ND ND
Ibuprofen* ND ND 71.20 76.60 30.00 ND Lincomycin 37.40` 18.40` ND ND ND ND
Meprobamate* 15.00 32.90 38.20 32.80 17.80 6.23 Metformin ND 1036.50(1094) 2194.00(1974) 2355.00(1718) 861.00(157) 459.50(296)
Methylprednisolone ND 0.80 ND ND ND ND Metoprolol* 11.50 23.70 35.40 42.40 21.20 15.10
Naproxen ND 7.93(4) 16.34(6) 46.23(21) 31.37(12) 18.70(1) Norfloxacin ND ND ND ND ND 9.70
Norverapamil* ND ND ND ND ND 0.17 Ofloxacin ND ND ND ND ND 1.60
Oxycodone* 40.70 53.10 20.80 15.30 6.65 1.83 Propoxyphene* 1.02 1.92 2.15 2.96 1.18 1.51
Ranitidine ND ND 1.52 2.16 1.23 1.01 Sertraline ND ND ND 1.16 0.64 0.69
Sulfadiazine ND 2.91 2.36 ND ND ND Sulfadimethoxine 1.64 0.49 0.81 1.42 ND 0.37 Sulfamethoxazole 39.23(18) 107.70(33) 116.93(31) 87.73(11) 37.13(17) 19.80(6)
Sulfanilamide ND ND 24.20 ND ND ND Sulfathiazole 2.35 ND ND ND ND ND
Theophylline* ND ND 118.00 145.00 ND ND
-25-
Concentration (ng/L) by Site / River Mile Compound E1 / 50 E4 / 68.1 E7 / 80 E9 / 90 E12 / 105.4 E16 / 131.1
Thiabendazole* 2.97 3.45 10.50 73.60 25.20 ND Triamterene* 3.80 1.06 3.65 4.47 2.92 2.15 Triclocarban ND ND ND 8.52(2) 4.74(1) 7.95(2) Trimethoprim 4.73# 8.70(2) 16.03(3) 15.13(5) 6.04(2) 5.53(1)
Valsartan* 14.00 38.40 51.10 97.60 91.80 58.50 Verapamil* ND ND ND 0.29 0.24 0.85
# detected in 2007 only a mean and standard deviation cannot be calculated ` detected in 2008 only a mean and standard deviation cannot be calculated ~ detected in 2009 only a mean and standard deviation cannot be calculated * analyzed in 2009 only a mean and standard deviation cannot be calculated Priority PPCP for the tidal Delaware River are in bold. Table 5. Prioritization Criteria for PPCP in Surface Waters of The Tidal Delaware River
Compound Environmental
Occurrence Aquatic
Ecotoxicity
Potential Human Health
Effects
Analytical Feasibility EPA 1694
Acetaminophen X X X X Carbamazepine X X X X Clarithromycin X X X
Codeine X X X X
Dehydronifedipine X NA X X
Erythromycin-hydrate X X X X
Fluoxetine X X X X
Gemfibrozil X X X X
2-Hydroxy-ibuprofen X NA X
Ibuprofen X X X X
Lincomycin X X X X
Metformin X X
Sulfamethoxazole X X X X
Thiabendazole X X X
Triclocarban X X X
X = Data or information was available and used for the prioritization

-26-
5.2 Hormones and Sterols
In the 2007 and 2008 surveys, both sterols and hormones were included in the list of analytes. In those surveys, the fecal sterols (coprostanol, epicoprostanol, cholestanol) and a cholesterol precursor (desmosterol) as well as the plant sterols (campesterol, stigmasterol and beta-sitosterol) were detected (Table 6-7). The fecal sterols indicate the presence of human sewage but are not major contributors to ecotoxicity in the river. In the 2009 survey only hormones were included in the list of analytes. Hormones detected in 2007, 2008 and 2009 at low concentrations and at limited locations include estrone, norethindrone, 17-α-ethynylestradiol, desogestrel and testosterone (Table 8). Concentration for environmental safety such as water quality criteria for aquatic life and human health are not available for hormones however; some information relevant to environmental assessment of these compounds is provided below. Estrone (a natural hormone used in pharmaceuticals) and norethindrone (a synthetic hormone) were also detected in 2007 only at different sample sites and at concentrations of 1.3 and 4.24 ng/L, respectively (Appendix B, Tables B5 to B7). These values are lower than the median and maximum levels of 27 ng/L and 112 ng/L for estrone and 48 ng/L and 872 ng/L for norethindrone reported in the USGS national reconnaissance survey of streams (Koplin et al., 2002). In a study within the Delaware River Basin, Velicu and Suri (2009) report a estrone detection frequency of >90% in 21 surface water locations with concentrations ranging from 0.6 to 2.6 ng/L. Estrone is a steroid estrogen that is generally detected in the greatest quantity in aqueous samples partly because it is a transformation product of 17β-estradiol (Jurgens et al,, 2002). Dilution, sorption and biodegradation in surface waters quickly lowers the concentrations of estrone to the low ng/L levels but higher concentrations of estrone have been reported in sediment (Petrovic et al, 2002). Steroid estrogens have been linked to endocrine disruption in fish and their presence in water is attributed to incomplete removal from sewage during treatment (Hurst et al., 2001). Long-term(>60day) and short-term PNEC for use in risk assessment of aquatic organisms have recently been derived for estrone at 6 and 20 ng/L, respectively (Caldwell et al, 2012). Using the maximum measured concentration of estrone in the Delaware River, hazard quotients of 0.2 (long-term exposure) and 0.07 (short-term exposure) can be calculated. Since estrone was detected in 2007 only at one site, a short-term exposure to 1.3 ng/L estrone at the site seems to be indicated. Estrone has also been reported to have bioaccumulative properties (Gomes, et al, 2004). Neither fish tissue nor other aquatic biota were analyzed for hormones in the DRBC study. Norethindrone (as reported as norethisterone or 19-nor-17-α-ethynyltestosterone) is a progestogen and a constituent of oral contraceptives that has been measured in streams (Koplin et al., 2002) and river sediment (Lόpez de Alda et al., 2002). Limited information is available on the ecotoxicity of norethindrone. It has been identified as a priority pharmaceutical for further study in Europe (The Environmental Side Effects of Medication. European Molecular Biology Organization (EMBO) Report by Alistair B.A. Boxall (http://www.pubmedcentral.nih.gov/articlerender.fcgi?artid=1299201).
-27-
Norethindrone is also on the California Office of Environmental Health Hazard Assessment list of chemicals known to cause cancer and reproductive toxicity (http://www.oehha.org/prop65/prop65_list/files/P65single091208.pdf). Norethindrone levels reported in drinking water may are a potential concern for pregnant women (Collier, 2007) The ovulation inhibiting hormone 17-α-ethynylestradiol was detected in 2008 at four sites with concentrations ranging from 1.97 to 4.01 ng/L. The hormone was not detected in 2009 and had interference in analytical detection in 2007 (Appendix B, Table B7). A 7-year, whole-lake experiment showed that chronic exposure of fathead minnow (Pimephales promelas) to low concentrations (5 to 6 ng/L) of 17-α-ethynylestradiol led to feminization of males, altered oogenesis in females, and near extirpation of the species from the lake (Kidd et al, 2007). Long-term (>60day) and short-term PNEC for use in risk assessment of aquatic organisms have also recently been derived for 17-α-ethynylestradiol at 0.1 and 0.5 ng/L, respectively (Caldwell et al, 2012). Using the maximum measured concentration of estrone in the Delaware River, hazard quotients between 20 to 40 (long-term exposure) and 0.2 to 8 (short-term exposure) can be calculated. In a recent publication, the hormone was also ranked in the top twenty pharmaceuticals, personal care products and endocrine-disrupting chemicals in U.S. surface waters for potential ecological effects (Kumar and Xagoraraki, 2010b). Ethinylestradiol has been identified as a pharmaceutical contaminant in potable water and is of potential concern for pregnant women (Collier, 2007). In 2009, the ovulation inhibitor hormone desogestrel was measured at 242 and 68 ng/L at two sites and the sex hormone testosterone was measured at 1.37 ng/L at one site (Appendix B, Table B8). The MSDS for desogestrel states that the compound may be very toxic to aquatic life without providing specific ecological toxicity data. Concentrations of desogestrel measured in the Delaware River exceed some predicted acute toxicity values (48 to 336 ng/L LC50) and chronic toxicity values (17 to 237 ng/L ChV) in ECOSAR. Testosterone was ranked in the top ten pharmaceuticals, personal care products and endocrine-disrupting chemicals in U.S. surface waters for potential health effects (Kumar and Xagoraraki, 2010b). However, measured concentrations of testosterone in the Delaware River were orders of magnitude lower than ECOSAR predicted aquatic toxicity values (9 to 87 mg/L LC50) and chronic toxicity values (0.4 to 5 mg/L ChV) as well as observed LC50 at 6.2 mg/L and sublethal chronic toxicity endpoints at 0.31 to 2.48 mg/L in Daphnia magna (Barbosa, et al., 2008) The EPA has listed the following hormones which may require regulation under the Safe Drinking Water Act (SDWA) on the Contaminant Candidate List 3 (CCL3) and/or Unregulated Contaminants Monitoring Rule 3 (UCMR3): 17- alpha estradiol, equilenin, equilin, 17-beta estradiol, estriol, estone, 17-alpha ethynylestradiol, mestranol, norethindron, testosterone and 4-androstene-3,17-dione. (http://water.epa.gov/scitech/drinkingwater/dws/ccl/ccl3.cfm) (http://water.epa.gov/lawsregs/rulesregs/sdwa/ucmr/ucmr3/methods.cfm)

-28-
Table 6. Sterol and Hormone Analytes in 2007 survey
Maximum concentration
(ng/L) EDL (ng/l) androsterone ND 5.45 androstenedione ND 6.17 equilenin ND 0.853 estriol ND 3.43 17-α-ethynylestradiol ND 2.74 β-sitosterol ND 12.8 stigmasterol ND 9.59 ergosterol ND 8.12 desmosterol 88.3 5.69 17-α-estradiol ND 1.44 17-β-estradiol ND 1.28 estrone 1.3 0.815 norgestrel ND 13.2 norethindrone 4.24 2.67 equilin ND 0.986 testosterone ND 9 estradiol benzoate ND 0.52 desogestrel ND 6.08 campesterol 150.86 7.06 mestranol ND 2.13 17 α-dihydroequlin ND 2.89 stigmasterol 225 9.59 progesterone ND 24.2
ND - not detected EDL – estimated detection limit 17-α-ethinylestradiol was elevated by the presence of interference in 2007 and is not listed. Hormones and sterols at each sample site are reported in Appendix B.
-29-
Table 7. Sterol and Hormone Analytes in 2008 survey
Maximum concentration
(ng/L) EDL (ng/l)
Androsterone ND 5.49 Desogestrel ND 4.56 17-α-Estradiol ND 1.17 Estrone ND 1.35 Equilin ND 1.5 Androstenedione ND 11.3
17-α-Dihydroequilin 4.01 1.01
17β-Estradiol ND 1.11 Testosterone ND 12.4 Equilenin ND 0.794 Mestranol ND 1.35 Norethindrone ND 2.24
17-α-Ethinylestradiol 4.01 2.66
Progesterone ND 17.4 Norgestrel ND 7.95 Estriol ND
β-Estradiol 3-benzoate ND 0.384
Coprostanol 267 1.75 Epicoprostanol 18.1 2.29 Cholesterol 2120 6.64 Cholestanol 152 5.57 Desmosterol 1250 9.99 Ergosterol 11.4 5.12 Campesterol 546 6.85 Stigmasterol 643 24.4 β-Sitosterol 856 24.5 β-Stigmastanol 856 22.5
ND - not detected EDL – estimated detection limit Hormones and sterols at each sample site are reported in Appendix B.
-30-
Table 8. Hormone Analytes in 2009 survey
Maximum concentration
(ng/L) EDL (ng/l)
17-α-Dihydroequilin ND 4.01
Equilenin ND 0.801 Equilin ND 8.01 17-β-Estradiol ND 4.01 17-α-Estradiol ND 4.01 Estrone ND 4.01
17-α-Ethinylestradiol ND 5.01
Allyl Trenbolone ND 0.801 Androstenedione ND 2 Androsterone ND 81.5 Desogestrel 242 120 Estriol ND 16 Mestranol ND 20 Norethindrone ND 4.01 Norgestrel ND 4.01 Progesterone ND 0.801 Testosterone 1.37 0.801
ND - not detected EDL – estimated detection limit Hormones and sterols at each sample site are reported in Appendix B.

-31-
5.3 Perfluoroalkyl and polyfluoroalkyl substances
Perfluoroalkyl and polyfluoroalkyl substances (PFASs) are found in a variety of industrial and household products such as stain repellant textiles, fire-fighting foams, and paper coatings. PFASs have unique properties to repel both water and oil. They are a diverse group of compounds that have varying degrees of persistence, toxicity and bioaccumulation in the environment. Overall, PFASs with longer fluorinated carbon chains have greater potential to bioaccumulate especially compounds with greater than seven fluorinated carbons. Furthermore, perfluoroalkyl sulfonic acid and sulfonates (e.g., PFOS) are more bioaccumulative than perfluoroalkyl carboxylic acids (e.g., PFOA) with the same number of carbons. (Conder, et al, 2008). Although national water quality criteria have not been derived for PFASs, benchmarks for PFOA and PFOS have been proposed by state agencies and researchers. Although some of the values discussed below are site-specific and have been developed for waters outside of the Delaware River Basin, they are used as relative benchmarks of environmental health and safety in order to prioritize additional studies. Surface water criteria to protect aquatic life, wildlife, and human health are the most appropriate benchmarks for the waters sampled in this survey. Nevertheless, proposed drinking water criteria are included in this summary, when available, with an acknowledgement that different methodologies are used to derive surface water aquatic life criteria and drinking water criteria. PFOA, PFOS, PFNA, PFHxS, PFHpA, and PFBS have been placed on the EPA contaminant candidate list 3 as contaminants known or anticipated to occur in public water systems and which may require regulation under the Safe Drinking Water Act (SDWA). (http://water.epa.gov/scitech/drinkingwater/dws/ccl/ccl3.cfm) (http://water.epa.gov/lawsregs/rulesregs/sdwa/ucmr/ucmr3/methods.cfm) PFASs were detected at ng/L levels in the DRBC survey (Table 9 and Appendix B, Tables B8 to B10). All but two PFASs (perfluorododecanoic acid and perfluorooctane sulfonamides) were detected in this survey. PFASs were detected at every site sampled. Although PFASs are increasingly being detected in the environment, little information is available on the ecotoxicology of many PFASs. Additional information is needed especially on longer chain and sulfonated compounds. The following summary includes available information comparing PFASs concentrations in the Delaware River to concentrations found in other locations and to benchmarks developed for environmental health and safety. Perfluorooctanoate (PFOA) has been described as a ubiquitous contaminant in surface waters and reported as the predominant PFAS in the Hudson River with a median concentration of 35 ng/ L and a range of 22 to 173 ng/L (Sinclair et al, 2006). Similar PFOA concentrations were measured in the Delaware River at 3.54 to 75.40 ng/L in the DRBC survey (Table 9 and Figure 4). At the reported concentrations, PFOA in the Delaware River did not exceed the USEPA Provisional Health Advisory short-term value for drinking water short-term exposure at 400 ng/L (USEPA, 2011). Neither did PFOA
-32-
concentrations, in areas of the Delaware River used as source waters for drinking water (upstream of RM 95), exceed a NJDEP preliminary health-based guidance value for chronic exposure of 40 ng/L for PFOA in drinking water. (Memorandum to Barker Hamill, Assistant Director for Water Supply Operations, http://www.nj.gov/dep/watersupply/pfoa_dwguidance.pdf) Perfluorooctanesulfonate (PFOS) was detected in the Delaware River in the range of 2.7 to 8.42 ng/L (Table 9 and Figure 5). Levels described as background (0 to 30 ng/L PFOS) for surface waters of Georgia, Michigan, and New York (Sinclair et al, 2006, Konwick et al, 2008). The concentrations observed in the Delaware River are also well below PFOS concentration measured in the Conasauga River in Georgia (maximum level at 318.3 ng/L) (Konwick et al, 2008) and Lake Onondaga near Syracuse, New York (maximum level at 1,090 ng/L) (Sinclair et al, 2006). Nevertheless, the bioaccumulation properties of PFOS indicate the need for low concentrations in water to assure environmental safety. Concentrations of PFOS in the Delaware River did not exceed a USEPA Provisional Health Advisory of 200 ng/L for short-term exposure (USEPA, 2011), an aquatic life chronic benchmark of 5,100 ng/L or an avian wildlife value of 47 ng/L estimated by other authors (Giesy et al, 2010; Rostkowski et al., 2006) (Figure 5). In the Delaware Estuary, PFOS have been reported as a contaminant in osprey eggs (Toschik et al, 2005). Although PFOS concentrations are low in the river water sampled, bioaccumulation of PFOS with potential adverse human health effects from fish consumption and effects on wildlife populations make further studies warranted. Perfluorononanoate (PFNA) at a maximum of 976 ng/L was the PFAS with the highest concentrations in the DRBC surveys (Table 9). Figure 6 shows the distribution of PFNA in the tidal river. The highest concentrations occur between RM 68.1 and 80. The concentrations found are higher than the 0 to 6 ng/L concentrations of PFNA found in streams of an industrial area in Korea (Rostkowski et al., 2006) and levels measured in the Conasauga River (maximum level at 32.8 to 369 ng/L ) near carpet manufacturing facilities in Georgia, USA (Konwick et al., 2008). Insufficient information is available to make a preliminary assessment of human health and ecotoxicology for PFNA. However, PFNA (nine fluorinated carbons) has been detected in wildlife indicating the potential for bioaccumulation and biomagnification as reported by Conder et al., (2008) substantiating the need for further study of PFN in the Delaware River. Perfluorohexanesulfonate (PFHxS) was below the detection limit at three sites in this study and detected in the range of 2.97 to 4.48 ng/L at three other sites (Table 9 and Appendix B, Tables B8 to B10). The concentrations measured are similar to concentrations observed in numerous New York state waters (0.7 to 5.6 ng/l ) and lower than most observations in Lake Onondaga, New York (4.2 to 8.5 ng/L) (Sinclair et al., 2006). Concentration for environmental safety such as water quality criteria for aquatic life and human health are not available for PFHS. Perfluorohexanoate (PFHxA) was detected at all six sites in each of the three years of this study in the range of 1.4 to 79.80 ng/L (Table 9 and Appendix B, Tables B8 to B10). Higher concentrations were generally observed between RM 50 and 80. In Korean

-33-
streams with industrial activity, PFHxA are reported to be in the range of 0.77 to 27 ng/L (Rostkowski et al., 2006 ). Concentration for environmental safety such as water quality criteria for aquatic life and human health are not available for PFHxA. Perfluoroundecanoate (PFUnA) was detected at four downriver sites between RM 50 and 90 in concentrations ranging from 1.42 to 26 ng/L (Table 9 and Appendix B, Tables B8 to B10). PFUnA has been reported at concentrations lower than other PFASs such as PFOA in surface water (D’eon et al, 2009). However, PFUnA has also been detected in wildlife indicating possible biomagnification and bioaccumulation (Conder et al, 2008; Toschik et al, 2005). The eleven carbon chain PFUnA was the predominant PFAS observed in recent DRBC fish tissue samples. A comparison of PFUnA concentrations in water and fish tissue from the tidal Delaware River is shown in Figure 7.
Table 9. Perfluoroalkyl and polyfluoroalkyl substances in Ambient Water
Maximum concentration
2007
(ng/L) 2008
(ng/L) 2009 (ng/l)
Limit of Quantification (ng/l)
Perfluorodecanoate (PFDA) C10 10 6 3 1.0 Perfluorododecanoate (PFDoA) C12 NR NR NR 1.0
Perfluoroheptanoate (PFHpA) C7 24 16 10 1.0 Perfluorohexanoate (PFHxA) C6 80 80 7 1.0 Perfluorononanoate (PFNA) C9 976 650 546 1.0 Perfluorooctanoate (PFOA) C8 75 48 28 1.0 Perfluoropentanoate (PFPeA) C5 35 32 14 1.0 Perfluoroundecanoate (PFUnA) C11 26 12 4 1.0
Perfluorobutanoate (PFBA) C4 19 26 8 1.0 Perfluorobutanesulfonate (PFBS) C4 3 26 8 2.0
Perfluorohexanesulfonate (PFHxS) C6 4 4 4 2.0
Perfluorooctanesulfonate (PFOS)C8 8 12 8 2.0 Perfluorooctane sulfonamide (PFOSA) NR NR NR
NR - not reported, below quantification limit Perfluoroalkyl and polyfluoroalkyl substances at each sample site are reported in Appendix B, Table B.4.

Figure 4. PPerfluorooct
-34-
tanoic acid ((PFOA) in aambient waater
Figuure 5. Perfluuorooctanes
-35-
sulfonate (PPFOS) in ammbient waterr
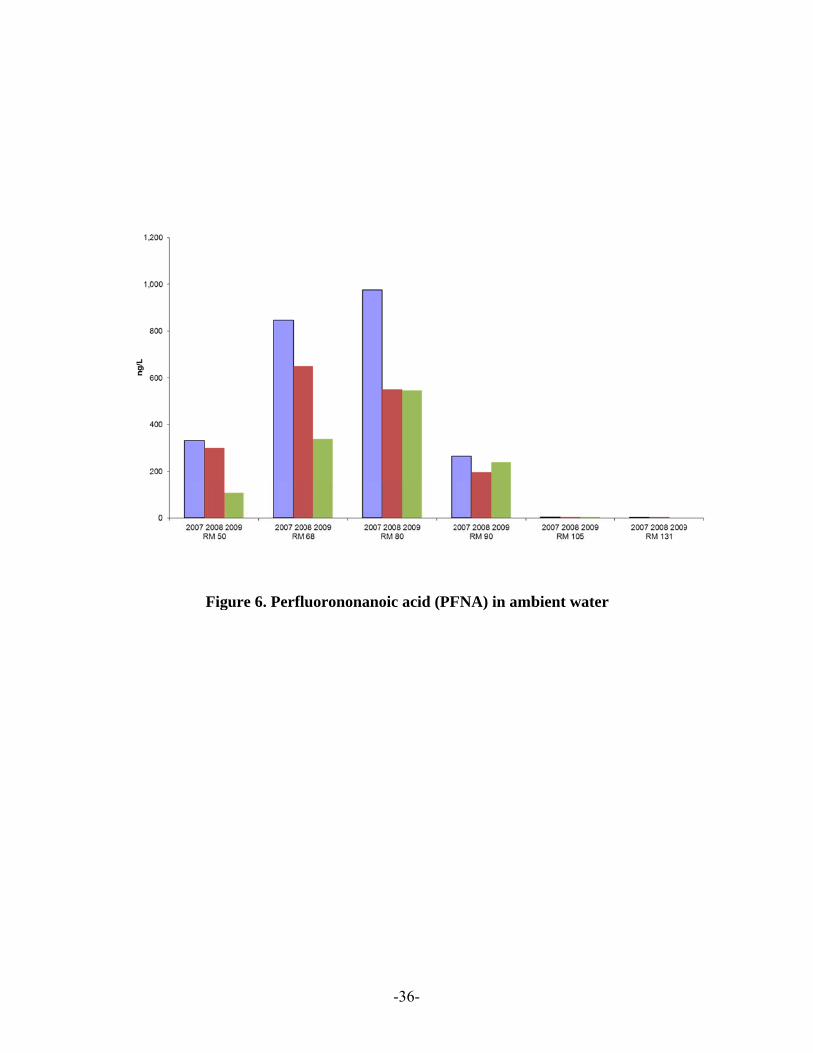
Figure 6. Perfluorononano
-36-
oic acid (PFFNA) in ambbient waterr

Figure 77. Perfluoroundecanoic
-37-
c acid (PFUddA) in wateer and fish tissue

-38-
5.4 Polybrominated Diphenyl Ethers
5.4.1 Ambient Water
Polybrominated diphenyl ethers (PBDE) are flame retardants found primarily in polymers and plastics. They are widely distributed in the environment and are present at increasing levels in people (U.S. Environmental Protection Agency. Polybrominated Diphenyl Ethers (PBDE) Project Plan, March 2006. http://www.epa.gov/oppt/pbde/pubs/proj-plan32906a.pdf). Flame retardants have been placed on the EPA Unregulated Contaminant Monitoring Rule 2 list to collect data for contaminants suspected to be present in drinking water, but that do not have health-based standards set under the Safe Drinking Water Act (SDWA). The flame retardants are 2,2’,4,4’- tetrabromodiphenyl ether (BDE-47), 2,2’,4,4’,5-pentabromodiphenyl ether (BDE-99), 2,2’,4,4’,5,5’-hexabromodiphenyl ether (BDE-153) and 2,2’,4,4’,6-pentabromodiphenyl ether (BDE-100). (http://water.epa.gov/lawsregs/sdwa/ucmr/ucmr2/methods.cfm) The analytical method used in this study measured forty-six individual PBDE congeners. However, in the interest of simplicity, the congeners are grouped by homologs (compounds with similar structures such as congeners with 5 bromine atoms are grouped together as pentabromodiphenyl ether homologs) (Appendix A, Table A2). In the DRBC ambient water study, the homologs with the maximum concentrations were decabromodiphenyl ethers (DeBDE) and nonabromodiphenyl ethers (NoBDE) (Table 10). The predominant homolog at three river sites was DeBDE detected in the range of 2,090 to 7,630 pg/L (Figure 8). In addition, nonabromodiphenyl ethers (NoBDE), pentabromodiphenyl ethers (PeBDE), and tetrabromodiphenyl ethers (TeBDE) were predominant at different sites detected in the range of 29 to 161 pg/L (Figure 8). Overall, total polybrominated diphenyl ethers (tPBDE) were detected at concentrations between 87 to 9,376 pg/L in ambeint water (Appendix B, Table B11). In unpublished reports, tPBDE have been measured in surface water at levels between 31 to 158 pg/L in Lake Michigan and at 6 pg/L in Lake Ontario (Canadian Environmental Protection Act, 1999 Ecological Screening Assessment Report on Polybrominated Diphenyl Ethers (PBDEs) (http://www.ec.gc.ca/CEPARegistry/documents/subs_list/PBDE_SAR/PBDEs_SAR_EC_June_2006_(en).pdf ). Comparisons among studies are difficult because it is unclear the methods used to measure the PBDE in the other studies and the number of congeners used to calculate the tPBDE. Nevertheless, the homolog distribution observed in the Delaware River is similar to those observed in other North American surface waters. DeBDE is the most prevalent commercial PBDE and is often found in sewage sludge, sediment and water. Any assessment of risk from PBDE should consider the fact that some BDE such as PeBDE and OcBDE have low potential for direct toxicity but can bioaccumulate. The environmental concern from other BDE such as DeBDE is primarily due to persistence and the potential for congeners to transform to bioaccumulative forms.

-39-
5.4.2 Fish Tissue Environmental monitoring programs conducted worldwide during the past decade have shown increasing levels of some BDE congeners in contrast to a general decline in the occurrence of dioxins, PCBs and chlorinated pesticides. PBDEs have been observed in whole or fillet fish tissue at concentrations from non-detect to 1,300 ppb (ng/g) total PBDE wet weight (ww) in U.S. waterways (Wenning et al, 2011). DRBC monitoring in the tidal Delaware River from 2004 to 2007 found ranges for tPBDE of 13 to 168 ng/g ww and 562 to 5,046 ng/g lipid in channel catfish and white perch with BDE 47, 99 and 100 the most abundant congeners. Studies of other biota in the Delaware Estuary found tPBDE at 82 to 572 ng/g ww in osprey eggs and 10 to 5,652 ng/g lipid in American eels with BDE 47 the most abundant congener in both studies (Toschik et al., 2005; Ashley et al., 2007). Risk from human consumption based on concentrations observed in fish from the Delaware River was assessed by establishing screening threshold values for four PBDE congeners (BDE-47, BDE-99, BDE-153 and BDE-209) that have oral reference doses listed in EPA-IRIS for non-carcinogenic effects. The fish tissue screening threshold values were established by following USEPA’s “Guidance for Assessing Chemical Contaminant Data for Use in Fish Advisories – Volume 1, 2 and 3 (http://water.epa.gov/scitech/swguidance/fishshellfish/techguidance/guidance.cfm). The fish tissue screening values (FTSV) are 400 ppb for PBDE-47, PBDE-99, and PBDE-153 and 28,000 ppb for PBDE-209. None of the white perch or channel catfish tissue samples collected in the main stem Delaware River in 2004 to 2007 exceeded these screening values. Maximum concentrations in tidal Delaware River fish tissue were 80 ppb for PBDE-47, 53 ppb for PBDE-99, 8 ppb for PBDE-153 and 1 ppb for PBDE-209. While total PBDE in Delaware Estuary fish has been reported as greater on average than in fish sampled at other U.S. and international locations, non-cancer risk as a function of fish consumption was reported as relatively low. (Greene, R. 2007. http://www.epa.epa/waterscience/fish/forum/2007/) FTSVs for carcinogenic effects are not available for PBDE. Although BDE-209 has suggestive evidence of carcinogenic potential, an oral slope factor is not listed in IRS. There are insufficient data currently available to determine if BDE-47, BDE-99, and BDE-153 are potential carcinogens. The DRBC plans to continue to monitor PBDE in fish tissue if adequate funding is available.

-40-
Table 10. Polybrominated Diphenyl Ether Homologs in 2007 Ambient Water Survey
Maximum concentration
(pg/L) Detection limit
(ng/l) Dibromodiphenyl ethers DiBDE 4.06 10 Tribromodiphenyl ethers TriBDE 22.75 10 Tetrabromodiphenyl ethers TeBDE 237.62 10 Pentabromodiphenyl ethers PeBDE 216.02 10 Hexabromodiphenyl ethers HxBDE 50.21 10 Heptabromodiphenyl ethers HpBDE 10.75 20 Octabromodiphenyl ethers OcBDE 44.7 20 Nonabromodiphenyl ethers NoBDE 1,161 100 Decabromodiphenyl ethers DeBDE 7,630 200
PBDE homologs at each sample site are reported in Appendix B. n=6

-41-
Figure 8. PBDE in ambient waters of the tidal Delaware River
5068
8090
105131 DiBDE
TriBDE
TeBDE
PeBDE
HxBDE
HpBDE
OcBDE
NoBDE
DeBDE
0
1000
2000
3000
4000
5000
6000
7000
8000
pg/L
River Miles
mouth of bay
head of tide
-42-
5.5 Nonylphenol and Nonylphenol ethoxylates
Nonylphenol ethoxylates (NPEO) are surfactants used in detergents and other industrial applications. Nonylphenols (NP) are often found in the environment as microbial decay products of NPE. In general, NP are considered more toxic than NPEOs (Vazquez-Duhalt et al., 2005). Although NP are not unregulated, our understanding of their toxicity is still emerging especially in the area of estrogenic effects. In 2006, the USEPA propagated aquatic life criteria for NP (Aquatic Life Ambient Water Quality Criteria Nonylphenol Final, EPA-822-R-05-005, http://www.epa.gov/waterscience/criteria/nonylphenol/final-doc.pdf ). NP levels in the tidal Delaware River in the time and space of this limited study did not exceed USEPA criteria of 1.7 μg/L marine Criterion Continuous Concentration (CCC) or 6.6 μg/L freshwater CCC (Table 11 and Figure 9). In interpreting the concentrations of NP in the environment with regard to the criteria, it should be noted that since studies in the literature that measured estrogenic effects by NP did not meet data quality for deriving criteria, they were not included in the calculation of the USEPA criteria for NP. However, chronic toxicity data used in the derivation of the criteria did include growth and reproduction endpoints. Therefore, to the extent that these chronic toxicity endpoints include the effect of endocrine disruption, the estrogenicity of NP is included in the derivation of the criteria. In short, upon development of standardized tests for estrogenicity, the criteria will certainly be revised. The concentrations of NP measured in the tidal Delaware River, with a maximum of 0.0876 μg/l, are well below those considered protective (Table 11 and Appendix B, Table B12). Figure 12 shows the distribution of NP in the tidal river. Water concentrations of NP have been reported as high as 644 μg/L in Spanish waters (Sole et al., 2000). Maximum concentrations have been reported in the UK at 53 μg/L (Blackburn and Waldock, 1995) and in the Hudson River Estuary at 95 μg/l (Dachs et al., 1999). Published studies including those that measured estrogenicity indicate that surface waters containing < 1 μg/l of NP are at low risk, surface waters containing between 1 to 10 μg/l are at some risk and surface water at >10 μg/l are at a significant risk of environmental harm (Vazquez-Duhalt et al., 2005). It should also be noted that the lipohilic NP can bioaccumulate (Vazquez-Duhalt et al., 2005). Because of its widespread occurrence in the environment and the evolving knowledge of its ecotoxicity, NP should continue to be characterized as a contaminant of emerging concern in DRBC studies.

-43-
Table 11. Nonylphenol and Nonylphenol Ethoxylates in 2007 Survey
Maximum concentration
μg/l / ng/l Detection limit
ng/l 4-nonylphenol 0.0876 / 87.6 10 4-nonylphenol monoethoxylate 0.0398 / 39.8 50 4-nonylphenol diethoxylate ND 50
ND - not detected NP and NPEOs at each sample site are reported in Appendix B.
Figure 9. Nonylphenol (NP) in ambient waters of the tidal Delaware River
0.00
0.01
0.02
0.03
0.04
0.05
0.06
0.07
0.08
0.09
0.10
50 68.1 80 90 105.4 131.1
River Miles
NP μ
g/L
Liston Point
South of Del. Mem. Br.
Mouth ofMarcus Hook Creek
Mouth ofSchuylkill R.
Mouth ofPennsauken R.
Biles Channel
Marine CCC = 1.7 μg/LFreshwater CCC = 6.6 μg/L
-44-
5.6 Bisphenol A
Bisphenol A was not detected, at a detection limit of 0.05 ng/L, in ambient waters of the tidal Delaware River at any of the six sites sampled in 2008, the only year the parameter was included in the survey.
6.0 Conclusions Pharmaceuticals and personal care products (PPCP) detected at concentrations of ng/L in the Delaware River were comparable to compounds and concentrations measured in other studies of ambient water in urban areas with the exception of codeine and metformin. Fifteen PPCP were identified for future focused study in surface waters of the tidal Delaware River based on the criteria of environmental occurrence, aquatic ecotoxicity, potential human health effects to sensitive populations, and analytical feasibility. The effects of PPCP in estuarine and coastal waters are not well studied. Future work should evaluate the sources as well as the fate and effects of PPCP in the Delaware River water column, sediments and biota.
Natural and synthetic hormones were detected in ng/L levels in the main stem Delaware River. They have been ranked in the top chemicals in U.S. surface waters for potential ecological effects warranting further study in the Delaware River Basin.
Perfluoroalkyl and polyfluoroalkyl substances (PFASs) were measured in ng/L concentrations in water and fish tissue. The predominant PFAS is perfluorononanoic acid (PFNA) in surface water and perfluoroundecanoic acid (PFUdA) in fish tissue. Although concentrations of PFASs in water appear to be trending downward each year in the Delaware River, additional ecotoxicology and bioaccumulation information is needed for these compounds especially on longer chain and sulfonated PFASs.
Nonylphenol (NP) concentrations in the Delaware River did not exceed current USEPA national water quality criteria. However, because of widespread occurrence in the environment and the evolving knowledge of ecotoxicity, NP and NPEOs should continue to be characterized as a contaminant of emerging concern in Delaware River Basin studies.
Polybrominated diphenyl ethers (PBDE ) were measured in pg/L to ng/L concentrations with homolog distributions in the tidal Delaware River similar to those observed in other North American locations. Because of the low levels found in water, future monitoring of PBDE in the Delaware River Basin should focus on bioaccumulation in fish tissue and other biota.

-45-
7.0 References Ashley, J.T.F., D. Libero, E. Halscheid, L. Zaoudeh and H.M. Stapleton. 2007. Polybrominated diphenyl ethers in American Eels (Anguilla rostrata) from the Delaware River, USA. Bull Environ Contam Toxicol 79:99-103. Ankley, G.T., B.W. Brooks, D. B. Huggett, and J.P. Sumpter. 2006. Repeating History: Pharmaceuticals in the Environment. Environ. Sci. Technol. 41: 8211-8217. Barbosa, I R., A. Nogueira, and A. Soares. 2008. Acute and chronic effects of testosterone and 4-hydroxyandrostenedione to the crustacean Daphnia magna. Ecotoxicology and Environmental Safety 71:757-764. Bergh, K. 2005 unpublished. Ecological Risk Assessment of Pharmaceuticals and Personal Care Products in Surface Water. (http://ir.lib.sfu.ca/retrieve/2491/etd1839.pdf) Blackburn, M.A. and M.J. Waldock. 1995. Concentration of alkylphenols in rivers and estuarines in England and Wales. Water Res. 29:1623-1629. as reported in Vazquez-Duhalt et al., 2005. Brooks B.W., C.K. Chambliss, J.K. Stanley, A. Ramirez, K.E. Banks, R.D. Johnson and R.J. Lewis. 2005. Determination of select antidepressants in fish from an effluent dominated stream. Environ. Toxicol. Chem. 24:464-469. Bruce, G M, R C Pleus and S A Snyder. 2010. Toxicological relevance of pharmaceuticals in drinking water. Environ. Sci. Technol. 44:5619-5626. Caldwell, D.J., F. Mastrocco, P.D. Anderson, R. Lange and J.P. Sumpter. 2012. Predicted-no-effect concentrations for the steroid estrogens estrone, 17-β-estradiol, estriol, and 17α-ethinylestradiol. Environ. Toxicol and Chem. 31:1-11. Celiz, M.D., J. Tso and D.S. Aga. 2009. Pharmaceutical metabolites in the environment: analytical challenges and ecological risks. Environ. Sci. Technol. 28:2473-2484. Cleuvers, M. 2003. Aquatic ecotoxicity of pharmaceuticals including the assessment of combination effects. Toxicology Letters 142:185-194. Collier, A C. 2007. Pharmaceutical contaminants in potable water: potential concerns for pregnant women and children. Ecohealth 4: 164-171. Conder, J.M., R. A. Hoke, W. De Wolf, M.H. Russell and R. C. Buck. 2007. Are PFCA bioaccumulative? A critical review and comparison with regulatory criteria and persistent lipophilic compounds. Environ. Sci. Technol. 42: 995-1003

-46-
Cooper, E.R, TC Siewicki and K Phillips. 2008. Preliminary risk assessment database and risk ranking of pharmaceuticals in the environment. Science of the Total Environment 398: 26-33. Crane, M; C. Watts and T. Boucard. 2006. Chronic aquatic environmental risks from exposure to human pharmaceuticals. Science of the Total Environment 367:23-41 Cunningham, V L; M Buzby, T Hutchinson; F Mastrocco, N Parke and N Roden, 2006. Effects of Human Phamaceuticals on Aquatic Life: Next Steps. Environment Science & Technology. Vol 40.Issue 11 pp 3456-3462. Cunningham, V L; S P Binks and M J Olson. 2009. Human health risk assessment from the presence of human pharmaceuticals in the aquatic environment. Regul. Toxicol. and Pharmacology 53: 39-45. Dachs J., D. A. Van Ry, and S.J. Eisenreich 1999. Occurrence of estrogenic nonylphenols in the urban and coastal atmosphere of lower Hudson River Estuary. Environ. Sci. Technol. 33:2676-2679 as reported in Vazquez-Duhalt et al., 2005. Daughton, C.G. and T. A. Ternes. 1999. Pharmaceuticals and personal care products in the environment: agents of subtle change? Environ Health Perspectives 107, (6) 1- 49. D’eon, J C, P W Crozier, V I Furdui, E J Reiner, E L Libelo and S A Mabury. 2009. Perfluorinated phosphonic acids in Canadian surface water and wastewater treatment plant effluent: discovery of a new class of perfluorinated acids. Environ. Toxicol and Chem. 28(10)2101-2107. de Voogt, P., M L Janex-Habibi, F Sacher, L Puijker and M Mons. 2009. Development of a common priority list of pharmaceuticals relevant for the water cycle. Water Sci and Technol. 59 (1): 39-46 European Medicines Agency. 2006. GUIDELINE ON THE ENVIRONMENTAL RISK ASSESSMENT OF MEDICINAL PRODUCTS FOR HUMAN USE http://www.ema.europa.eu/docs/en_GB/document_library/Scientific_guideline/2009/10/WC500003978.pdf (accessed June 6, 2012). Fent, K, A Weston and D. Caminanda. 2006. Ecotoxicology of human pharmaceuticals. Aquatic Toxicology 76:122-159. Focazio, M J, W Kolpin and E T Furlong. 2004. Occurrence of Human Pharmaceuticals in Water Resources of the United States: A Review in Klaus Kummerer (ed) Pharmaceuticals in the Environment Sources, Fates, Effects and Risks, Springer, New York, New York

-47-
Giesy JP , J E. Naile, J S Khim, P D Jones and J L Newsted . 2010. Aquatic Toxicology of Perfluorinated Chemicals in David M Whitacre (ed) Reviews of Environmental Contamination and Toxicology. Springer Science Gomes, R.L., H.E. Deacon, K.A. Lai, J. W. Birkett, M.D. Scrimshaw, and J. N. Lester. 2004. An assessment of the bioaccumulation of estrone in Daphnia magna. Environ Toxicol Chem 23:105-108. Greene, R. 2007. Polybrominated diphenyl ethers (PBDEs) in fish from the Delaware River Drainage Basin. Proceedings of the 2007 National Forum on Contaminants in Fish http://www.epa.epa/waterscience/fish/forum/2007/ Hurst, T.K.V., M. R., Matthiessen, P., and Waldock, M. J. (2001). Characterisation of estrogenic compounds in water samples collected from United Kingdom estuaries. Environ. Toxicol. Chem. 20, 2165–2170. Jjemba, P K. 2006. Excretion and ecotoxicity of pharmaceutical and personal care products in the environment. Ecotoxicology and Environmental Safety 63:113-130. Johnston, C. (personal communication). ([email protected]) US EPA Headquarters / Office of Science and Technology 1200 Pennsylvania Ave NW Washington, DC 20460 Jurgens, M., K. Holthaus, A.C. Johnson, J.J.L. Smith, M. Hetherridge and R.J. Williams. 2002. The potential for estradiol and ethinylestradiol degradation in English Rivers. Environ Toxicol Chem 21:480-488. Kidd, K.A., P. J. Blanchfield, K. H. Mills, V.P. Palace, R. E. Evans, J.M. Lazorchak and R. W. Flick. 2007. Collapse of a fish population after exposure to a synthetic estrogen. Proceedings National Academy of Sciences 104:8897-8901 Konwick, B.J., G.T. Tomy, N. Ismail, J.T. Peterson, R. J. Fauver, D. Higginbotham and A. T. Fisk. 2008. Concentrations and patterns of perfluoroalkyl acids in Georgia, USA surface waters near and distant to a major use source. Environ Toxicol and Chem 27: 2011-2018. Kolpin, D W, E T Furlong, M T Meyer, E M Thurman, S D Zaugg, L B Barber, H T Buxton. 2002. Pharmaceuticals, hormones, and other organic wastewater contaminants in U.S. streams, 1999-2000: a national reconnaissance. Environ. Sci. Technol., 36, 1202-1211 Kostich, MS and J M Lazorchak. 2007. Risks to aquatic organisms posed by human pharmaceutical use. Science of the Total Environment 389: 329-339.
-48-
Kumar, A, B Chang and I Xagoraraki. 2010. Human Health Risk Assessment of Pharmaceuticals in Water: Issues and Challenges Ahead. Int. J. Environ. Res. Public Health. 7: 3929-3953. Kumar, A and I Xagoraraki, 2010a. Human health risk assessment of phamaceuticals in water: an uncertainity analysis of meprobamate, carbamazepine and phenytoin. Regul. Toxicol. and Pharmacology 57:146-156. Kumar, A and I Xagoraraki, 2010b. Pharmaceuticals, personal care products and endocrine-disrupting chemicals in U.S. surface and finished waters: a proposed ranking system. Science of the Total Environment 408: 5972-5989. Loper, C.A., J.K. Crawford, K.L. Otto, R.L. Manning, M.T. Meyer, and E.T. Furlong. unpublished. Concentrations of selected pharmaceuticals and antibiotics in south-central Pennsylvania water, March through September 2006: U.S. Geological Survey Data Series 300 http://pubs.usgs.gov/ds/300/. Lόpez de Alda, M., A. Gil, E. Paz and D. Barcelo. 2002. Occurrence and analysis of estrogens and progestogens in river sediments by liquid chromatography-electrospray-mass spectrometry. Analyst, 127:1299-1304. Mack, P.M. unpublished. Emerging Contaminants in Metropolitan Chicago Rivers. Sierra Club-River Prairie Group Report , DuPage County, Illinois. http://illinois.sierraclub.org/RPG/reports/RPG_EmergContamReport2008.pdf. Ottmar, K J., L M Colosi and J A Smith. 2010. Development and application of a model to estimate wastewater treatment plant prescription pharmaceutical influent loadings and concentrations. Bull Environ Contam Toxicol 84: 507-512. Pait, A.S., R.A. Warner, S.I. Hartwell, J.O. Nelson, P.A. Paceco, and A.L. Mason. 2006. Human Use Pharmaceuticals in the Estuarine Environment: A Survey of the Chesapeake Bay, Biscayne Bay and Gulf of the Farallones. NOS NCCOS 7. Siver Spring, MD. NOAA/NOS/NCCOS/Center for Coastal Monitoring and Assessment. Phillips P. J., S. G. Smith, D. W. Kolpin, S. D. Zaugg, H. T. Buxton, E. T. Furlong, K. Esposito and B. Stinson. 2010. Pharmaceutical formulation facilities as sources of opioids and other pharmaceuticals to wastewater treatment plant effluents. Environ. Sci. Technol., 44 (13), 4910–4916 Petrovic, M, M. Solé,, M. J. López De Alda, and D. Barceló. 2002. Endocrine disruptors in sewage treatment plants, receiving river waters, and sediments: Integration of chemical analysis and biological effects on feral carp. Environ Toxicol and Chem 21:2146-2156. Rostkowski, P., N. Yamashita, I. Man Ka So, S. Taniyasu, P. Kwan Sing Lam, J. Falandysz, K. Tae Lee, S. Kyu Kim, J. Seong Khim, S. Hyeon Im, J.L. Newsted, P.D. Jones, K. Kannan and J.P. Giesy. 2006. Perfluorinated compounds in the streams of the

-49-
Shiwa industrial zone and Lake Shihwa, South Korea. Environ Toxicol and Chem 25:2374-2380. Roos, V., L. Gunnarsson, J. Fick, DGJ Larson and C Ruden. 2012. Prioritising pharmaceuticals for environmental risk assessment: towards adequate and feasible first-tier selection. Science of the Total Environment 421-422: 102-110. Scheurer M, Sacher F and Brauch H J. 2009. Occurrence of the antidiabetic drug metformin in sewage and surface waters in Germany. J Environ Monit 9:1608-1613. Schmitt, H, T Boucard, J Garric, J Jensen, J Parrott, A Pery, J Romke, J O Straub, T H Hutchinson, P Sanchez-Arguello, A Wennmalm and K Duis. 2009. Recommendations on the environmental risk assessment of pharmaceuticals: effect characterization. Integr Environ Assess and Manag 6(1): 588-602. Schwab, B W, E P Hayes, J M Fiori, F J Mastrocco, N M Roden, D Cragin, R D Meyerhoff, V J D’Aco, And P D Anderson. 2005. Human pharmaceuticals in US surface waters: a human health risk assessment. Regul. Toxicol. and Pharmacol. 42: 296-312. Sinclair, E., D.T. Mayack, K. Roblee, N. Yamashita, K. Kannan. 2006. Occurrence of perfuoroalkyl surfactants in water, fish, and birds from New York State. Arch. Environ, Contam. Toxicol. 50:398-410. Sole M., M.J. Lopez de Alda, M. Castillo, C. Porte, K. Ladegaard-Pedersen and D. Barcelo. 2000. Estrogeniciity determination in sewage treatment plants and surface waters from Catalonian area (NE Spain). Environ. Sci. Technol. 34:5076-5083 as reported in Vazquez-Duhalt et al., 2005. Tarazona, J.V., B.I. Escher, E. Giltrow, J. Sumpter and T. Knacker. 2009. Targeting the environmental risk assessment of pharmaceuticals: facts and fantasies. Integr Environ Assess and Manag 6:603-613. TCC Consortium. High Production Volume (HPV) Chemical Challenge Program Data Availablility and Screening Level Assessment for Triclocarban, CAS#:101-20-2. http://www.epa.gov/hpv/pubs/summaries/tricloca/c14186tc.htm Toschik, P C , B A Rattner, P C McGowan, M C Christman, D B Carter, R C Hale, C W Matson, and M A Ottinger. 2004. Effects of contaminant exposure on reproductive success of osprey (Pandion haliaetus) nesting in Delaware River and Bay, USA. Environ. Toxicol. and Chem. 24:617-628 U.S. Environmental Protection Agency . 2009. Occurrence of Contaminants of Emerging Concern in Wastewater From Nine Publicly Owned Treatment Works. EPA-821-R-09-009.
-50-
U.S. Environmental Protection Agency. 2011 Edition of the Drinking Water Standards and Health Advisories. EPA 820-R-11-002 Vazquez-Duhalt, R., F. Marquez-Roca, E. Ponce, A.F. Licea, and M.T. Viana. 2005. Nonylphenol, an integrated vision of a pollutant. Appl. Ecol. and Environ. Res. 4(1):1-25. Velicu, M and R Suri. 2009. Presence of steroid hormones and antibiotics in surface water of agricultural, suburban and mixed-use areas. Environ Monit Assess 154:349-359. Wenning, R.J., L. Martello and A. Prusak-Daniel. 2011. “Dioxins, PCBs and PBDE in Aquatic Organism”. in Environmental Contaminants in Biota: Interpreting Tissue Concentrations, 2nd Ed, Editors: WN Beyer and JP Meador.

-51-
8.0 Acknowledgements Reviewers for this report were Dr. Thomas Fikslin, DRBC; Dr. Robert Hoke, Haskell Global Centers for Health and Environmental Sciences, E. I. du Pont de Nemours and Co.; Dr. Richard Greene, DNREC; Julie Petix, NJDHSS; Dr. Daniel Caldwell, Johnson & Johnson, Co (Section 5.2 Hormones and Sterols); Dr. Jeffrey Ashley, Philadelphia University. (Section 5.4 PBDE); Dr. Franklin Houghton, University of Pittsburgh (Appendix C Assays for Estrogenic Compounds); and Greg Cavallo PG, DRBC (data management and review). Technical assistance was also received from Kelly Mayo-Bean, USEPA. Preparation and chemical analyses was performed by Axys Analytical Services Ltd. Field support was provided by DRBC staff. Maps are courtesy of Karen Reavy, DRBC. This project was supported by the Delaware River Basin Commission and the United States Environmental Protection Agency.

-52-
Appendix A: PPCP and PBDE Analytes Table A1. PPCP Analytes and Estimated Detection Limits (EDL) Compound EDL UNITS Compound EDL UNITS Metformin 61.1 NG/L Albuterol 0.308 NG/L 2-Hydroxy-ibuprofen 90.2 NG/L Verapamil 0.149 NG/L Caffeine 14.7 NG/L Alprazolam 0.298 NG/L
Theophylline 58.7 NG/L 10-hydroxy-amitriptyline 0.147 NG/L
Acetaminophen 58.7 NG/L Enalapril 0.308 NG/L Valsartan 3.92 NG/L Norverapamil 0.149 NG/L Sulfamethoxazole 0.915 NG/L Bisphenol A 2460 NG/L Ibuprofen 14.7 NG/L Furosemide 49.6 NG/L Naproxen 2.94 NG/L Glipizide 5.9 NG/L Atenolol 1.82 NG/L Glyburide 2.95 NG/L Gemfibrozil 1.51 NG/L Hydrochlorothiazide 19.7 NG/L Oxycodone 1.08 NG/L Triclosan 59 NG/L DEET 0.497 NG/L Warfarin 1.47 NG/L Metoprolol 2.09 NG/L Carbadox 1.47 NG/L Benzoylecgonine 0.294 NG/L Cefotaxime 16.6 NG/L Carbamazepine 1.49 NG/L Ciprofloxacin 5.9 NG/L Meprobamate 3.97 NG/L Clinafloxacin 13.7 NG/L Codeine 3.71 NG/L Cloxacillin 1.18 NG/L Cotinine 1.54 NG/L Digoxin 14.7 NG/L Trimethoprim 3 NG/L Digoxigenin 18.6 NG/L Hydrocodone 1.85 NG/L Enrofloxacin 2.95 NG/L Azithromycin 1.49 NG/L Flumequine 1.47 NG/L Methylprednisolone 6.24 NG/L Fluoxetine 1.47 NG/L Clarithromycin 1.47 NG/L Lincomycin 6.88 NG/L Triclocarban 2.94 NG/L Lomefloxacin 2.95 NG/L Diltiazem 0.294 NG/L Miconazole 1.47 NG/L Erythromycin-H2O 0.294 NG/L Norfloxacin 14.7 NG/L Diphenhydramine 0.597 NG/L Norgestimate 2.95 NG/L Amphetamine 1.49 NG/L Ofloxacin 14.7 NG/L Triamterene 0.299 NG/L Ormetoprim 0.59 NG/L Thiabendazole 1.49 NG/L Oxacillin 2.95 NG/L Desmethyldiltiazem 0.147 NG/L Oxolinic Acid 0.59 NG/L Ranitidine 0.768 NG/L Penicillin G 1.18 NG/L Propoxyphene 0.294 NG/L Penicillin V 2.95 NG/L Fluticasone propionate 1.99 NG/L Roxithromycin 0.295 NG/L Cocaine 0.147 NG/L Sarafloxacin 31.3 NG/L Sulfadimethoxine 0.294 NG/L Sulfachloropyridazine 1.47 NG/L Dehydronifedipine 0.596 NG/L Sulfadiazine 1.47 NG/L Amitriptyline 0.294 NG/L Sulfamerazine 0.769 NG/L Sertraline 0.392 NG/L Sulfamethazine 0.59 NG/L

-53-
Table A1 (cont.). PPCP Analytes and Estimated Detection Limit (EDL). Compound EDL UNITS Compound EDL UNITS Sulfamethizole 0.693 NG/L Trenbolone acetate 0.295 NG/L
Sulfanilamide 14.7 NG/L Anhydrochlortetracycline (ACTC) 60.9 NG/L
Sulfathiazole 1.47 NG/L Anhydrotetracycline (ATC) 14.7 NG/L Tylosin 5.9 NG/L Chlortetracycline (CTC) 5.9 NG/L Virginiamycin 9.82 NG/L Demeclocycline 14.7 NG/L 1,7-Dimethylxanthine 147 NG/L Doxycycline 5.9 NG/L
Amlodipine 1.47 NG/L
4-Epianhydrochlortetracycline (EACTC) 77.6 NG/L
Benztropine 0.295 NG/L 4-Epianhydrotetracycline (EATC) 21.9 NG/L
Betamethasone 1.47 NG/L 4-Epichlortetracycline (ECTC) 14.7 NG/L
Diazepam 0.295 NG/L 4-Epioxytetracycline (EOTC) 5.9 NG/L
Fluocinonide 5.9 NG/L 4-Epitetracycline (ETC) 8.75 NG/L Hydrocortisone 59 NG/L Isochlortetracycline (ICTC) 5.9 NG/L Norfluoxetine 1.47 NG/L Minocycline 151 NG/L Paroxetine 3.93 NG/L Oxytetracyclin (OTC) 5.9 NG/L Prednisolone 5.9 NG/L Tetracycline (TC) 5.9 NG/L Prednisone 19.7 NG/L Atorvastatin 24.1 NG/L Promethazine 0.393 NG/L Cimetidine 2.89 NG/L Propranolol 1.97 NG/L Clonidine 24.1 NG/L Simvastatin 19.7 NG/L Trenbolone 3.93 NG/L

-54-
Table A2. PBDE Analytes in 2007 Survey and Their Detection Limits
Polybrominated Diphenyl Ethers EPA Method 1614 (MLA-033)
Detection limit (pg/l) 2,4-DiBDE BDE - 7 10 2,4'-DiBDE BDE - 8 10 2,6-DiBDE BDE - 10 10 3,3'-DiBDE BDE - 11 10 3,4-DiBDE BDE - 12 10 3,4'-DiBDE BDE - 13 10 4,4'-DiBDE BDE - 15 10 2,2',4-TriBDE BDE - 17 10 2,3',4-TriBDE BDE - 25 10 2,4,4'-TriBDE BDE - 28 10 2,4,6-TriBDE BDE - 30 10 2,4',6-TriBDE BDE - 32 10 2',3,4-TriBDE BDE - 33 10 3,3',4-TriBDE BDE - 35 10 3,4,4'-TriBDE BDE - 37 10 2,2',4,4'-TeBDE BDE - 47 10 2,2',4,5'-TeBDE BDE - 49 10 2,2',4,6'-TeBDE BDE - 51 10 2,3',4,4'-TeBDE BDE - 66 10 2,3',4',6-TeBDE BDE - 71 10 2,4,4',6-TeBDE BDE- 75 10 3,3',4,4'-TeBDE BDE- 77 10 3,3',4,5'-TeBDE BDE - 79 10 2,2',3,4,4'-PeBDE BDE - 85 10 2,2',4,4',5-PeBDE BDE - 99 10 2,2',4,4',6-PeBDE BDE - 100 10 2,3,3',4,4'-PeBDE BDE - 105 10 2,3,4,5,6-PeBDE BDE - 116 10 2,3',4,4',6-PeBDE BDE - 119 10 2,3',4,5,5'-PeBDE BDE - 120 10 3,3',4,4',5-PeBDE BDE - 126 10 2,2',3,3',4,4'-HxBDE BDE - 128 10 2,2',3,4,4',5'-HxBDE BDE - 138 10 2,2',3,4,4',6'-HxBDE BDE - 140 10 2,2',4,4',5,5'-HxBDE BDE - 153 10 2,2',4,4',5,6'-HxBDE BDE - 154 10 2,2',4,4',6,6'-HxBDE BDE - 155 10

-55-
Polybrominated Diphenyl Ethers EPA Method 1614 (MLA-033)
Detection limit (pg/l) 2,3,4,4',5,6-HxBDE BDE - 166 10 2,2',3,4,4',5,6-HpBDE BDE - 181 20 2,2',3,4,4',5',6-HpBDE BDE - 183 20 2,3,3',4,4',5,6-HpBDE BDE - 190 20 2,2',3,4,4',5,5',6-OcBDE BDE - 203 20 2,2',3,3',4,4',5,5',6-NoBDE BDE - 206 100 2,2',3,3',4,4',5,6,6'-NoBDE BDE - 207 100 2,2',3,3',4,5,5',6,6'-NoBDE BDE - 208 100 2,2',3,3',4,4',5,5',6,6'-DeBDE BDE - 209 200

-56-
Appendix B: Data Tables Table B1. PPCP in ambient water - 2007 (ng/L)
RM Azithromycin Caffeine Carbamazepine Clarithromycin Codeine Dehydronifedipine Diltiazem Diphenhydramine Erythromycin-
H2O Fluoxetine
50 ND 12.5 18.8 ND 16 1.1 0.502 1.11 2.68 8.02 68.1 ND 57.2 44.9 ND 159 2.59 3.17 1.02 7.06 3.63 80 ND 24.6 60.4 2.86 14.9 2.97 12.3 1.64 14.4 ND 90 ND 72.2 37.5 10.9 11.4 2.27 12.8 4.56 14.9 ND
105.4 ND 10.4 24.7 5.45 4.52 0.941 4.1 2.21 6.68 ND 131.1 4.96 36.5 11.8 5.18 3.4 ND 2.79 3.47 3.95 ND
RM Norfloxacin Ofloxacin Sulfadiazine Sulfadimethoxine Sulfamethoxazole Sulfanilamide Trimethoprim Gemfibrozil Ibuprofen Naproxen Triclocarban
50 ND ND ND 1.64 49.8 ND 4.73 6.4 ND ND ND
68.1 ND ND 2.91 ND 124 ND 11.1 22.5 15.9 11.1 ND 80 ND ND 2.36 ND 150 24.2 16.6 30.5 ND 17.6 ND 90 ND ND ND ND 99.9 ND 11.3 44.3 ND 45 6.34
105.4 ND ND ND ND 37.8 ND 4.36 14.5 ND 27.9 4.36 131.1 9.7 1.6 ND ND 12.7 ND ND 6.36 ND 18 6.54

-57-
Table B.2. PPCP in ambient water - 2008 (ng/L) RM Azithromycin Caffeine Carbamazepine Clarithromycin Codeine Dehydronifedipine Diltiazem Diphenhydramine Erythromycin-H2O Fluoxetine
50 ND ND 30.5 ND 4.65 0.637 0.422 0.766 1.19 ND
68.1 ND 44.1 64.5 ND 72.7 1.74 2.26 ND 4.36 5.4 80 ND 117.1 67.3 ND 4.21 2.19 7.01 0.69 6.23 ND 90 ND 166.1 52.9 2.65 3.29 1.61 9.83 1.91 4.94 ND
105.4 ND 86.1 20.2 ND ND ND 2.39 1.01 0.61 ND 131.1 ND 74 27.6 1.61 ND ND 2.68 3.64 0.97 ND
RM Norfloxacin Ofloxacin Sulfadiazine Sulfadimethoxine Sulfamethoxazole Sulfanilamide Trimethoprim Gemfibrozil Ibuprofen Naproxen Triclocarban
50 ND ND ND ND 18.8 ND ND 3.13 ND ND ND 68.1 ND ND ND 0.485 129 ND 7.29 7.32 ND ND ND 80 ND ND ND ND 112 ND 13.1 18.7 ND 9.52 ND 90 ND ND ND ND 80.5 ND 13.8 24.9 ND 26.2 8.53
105.4 ND ND ND ND 20.1 ND ND 6.31 ND 21.8 3.7 131.1 ND ND ND 0.37 24.5 ND 6.27 10.1 ND 18 6.8
RM Sulfathiazole Lincomycin Albuterol Metformin Ranitidine Dimethylxanthine Cotinine Carbadox Thiabendazole
50 2.35 37.4 ND ND ND ND ND ND 2.97
68.1 ND 18.4 ND 1810 ND 220 21.2 ND 3.45
80 ND ND 0.668 3590 0.922 193 34.3 7.48 10.5
90 ND ND 0.711 3570 1.14 239 35.6 5.89 73.6
105.4 ND ND ND 972 ND ND 10.4 2.2 25.2
131.1 ND ND ND 669 0.754 ND 8.99 ND ND

-58-
Table B.3. PPCP in ambient water - 2009 (ng/L)
RM Azithromycin Caffeine Carbamazepine Clarithromycin Codeine Dehydronifedipine Diltiazem Diphenhydramine Erythromycin-
H2O Fluoxetine
50 ND 24 14.6 4.78 25.9 ND 0.492 0.66 2.07 ND 68.1 ND 47.3 32.2 ND 38.2 0.698 2.28 0.75 4.25 ND 80 ND 178 39.2 1.53 15.9 1.41 6.87 1.07 6.82 ND 90 ND 238 37.4 11.6 12.2 1.19 9.51 3.66 9.24 ND
105.4 ND 118 26.9 6.96 7.25 0.698 4.52 4.11 5.04 ND 131.1 14.1 46.7 16.1 5.93 ND ND 3.76 7.68 3.7 ND
RM Norfloxacin Ofloxacin Sulfadiazine Sulfadimethoxine Sulfamethoxazole Sulfanilamide Trimethoprim Gemfibrozil Ibuprofen Naproxen Triclocarban
50 ND ND ND ND 49.1 ND ND 6.53 ND ND ND
68.1 ND ND ND ND 70.1 ND 7.72 18.9 ND 4.75 ND 80 ND ND ND 0.809 88.8 ND 18.4 43.5 71.2 21.9 ND 90 ND ND ND 1.42 82.8 ND 20.3 53.9 76.6 67.5 10.7
105.4 ND ND ND ND 53.5 ND 7.71 25.5 30 44.4 6.17 131.1 ND ND ND ND 22.2 ND 4.78 11.7 ND 20.1 10.5
RM Sulfathiazole Lincomycin Albuterol Metformin Ranitidine Dimethylxanthine Cotinine Carbadox Thiabendazole
50 ND ND ND 0 ND ND 21.2 ND ND
68.1 ND ND 0.399 263 ND ND 18.8 ND ND 80 ND ND 0.996 798 2.11 ND 38.2 ND ND 90 ND ND 0.968 1140 3.18 ND 37.9 ND ND
105.4 ND ND 0.555 750 1.23 ND 14.8 ND ND 131.1 ND ND 0.344 250 1.27 ND 6.33 ND ND
RM Valsartan Atenolol Oxycodone Benzoylecgonine Meprobamate Metoprolol Hydrocodone Amphetamine Triamterene Cocaine Propoxyphene
50 14 13.8 40.7 6.92 15 11.5 8.11 ND 3.8 0.965 1.02 68.1 38.4 20.2 53.1 16.2 32.9 23.7 16.2 ND 1.06 0.339 1.92 80 51.1 53.8 20.8 30.5 38.2 35.4 5.49 3.83 3.65 1.21 2.15 90 97.6 58.8 15.3 39.6 32.8 42.4 3.21 5.53 4.47 1.05 2.96
105.4 91.8 28.6 6.65 10.6 17.8 21.2 2.16 4.52 2.92 2.33 1.18 131.1 58.5 11.6 1.83 6.04 6.23 15.1 ND ND 2.15 2.58 1.51
-59-
Table B3. continued PPCP in ambient water - 2009 (ng/L)
RM Amitriptyline Sertraline Alprazolam Enalapril Methylprednisolone Norverapamil Verapamil Acetaminophen Fluticasone propionate Ibuprofen
50 0.491 ND 0.422 ND ND ND ND ND ND ND 68.1 1.01 ND 0.456 ND 0.8 ND ND ND ND ND 80 1.17 ND 0.612 0.343 ND ND ND ND 2.11 71.2 90 1.39 1.16 0.583 ND ND ND 0.287 105 2.06 76.6
105.4 0.834 0.636 0.375 ND ND ND 0.238 ND 2.31 30 131.1 0.759 0.692 ND ND ND 0.172 0.852 ND 2.69 ND
RM Theophylline 2-Hydroxy-ibuprofen Desmethyldiltiazem 10-hydroxy-amitriptyline DEET Thiabendazole
50 ND ND ND ND 28.3 2.47
68.1 ND 113 1.31 ND 32.9 3.66 80 118 346 1.96 0.245 42.8 3.27 90 145 286 3.35 0.382 40.8 2.63
105.4 ND ND 1.38 0.227 17.5 1.5 131.1 ND ND 0.961 0.214 6.34 1.78
-60-
Table B.4. PPCP 2007 to 2009 mean ng/L
RM Azithromycin Caffeine Carbamazepine Clarithromycin Codeine Dehydronifedipine Diltiazem Diphenhydramine Erythromycin-H2O Fluoxetine
50 ND 18 21 5 16 1 0 1 2 8
68.1 ND 50 47 ND 90 2 3 1 5 5 80 ND 107 56 2 12 2 9 1 9 ND 90 ND 159 43 8 9 2 11 3 10 ND
105.4 ND 72 24 6 6 1 4 2 4 ND 131.1 10 52 19 4 3 ND 3 5 3 ND
-61-
Table B5. Sterols and Hormones in ambient water - 2007 (ng/L)
RM Estrone Norethindrone Coprostanol Epicoprostanol Cholesterol Cholestanol Desmosterol Campesterol Stigmasterol beta-Sitosterol 50 ND 4.24 6.84 2.47 390 47.46 52.5 100.86 87 312
68.1 ND ND 57.9 15 595 137.16 88.3 150.86 139 286 80 ND ND 90 16.7 761 143.16 60.1 145.86 225 294 90 ND ND 82.8 10.9 309 64.66 27.7 53.56 160 293
105.4 ND ND 87.6 11.4 256 50.96 34.3 66.36 195 415 131.1 1.3 ND 198 15.3 643 67.16 49.6 73.16 198 534
ND= not detected 17α-ethinyl estradiol concentrations in 2007 were elevated by the presence of interference and are not reported.
-62-
Table B6. Sterols and Hormones in ambient water - 2008 (ng/L) RM Estrone Norethindrone Coprostanol Epicoprostanol Cholesterol Cholestanol Desmosterol Campesterol Stigmasterol 50 ND ND 10.1 ND 766 55.5 94.7 226 86.4
68.1 ND ND 22.5 6.35 904 110 105 350 175 80 ND ND 50.9 12.3 1130 152 239 308 341 90 ND ND 70.2 14.4 1220 115 343 281 322
105.4 ND ND 67.4 10.8 2120 115 1250 546 396 131.1 ND ND 267 18.1 1790 104 83 324 643
RM 17 alpha-Ethinyl-Estradiol beta Stigmastanol beta-Sitosterol Ergosterol
50 ND 31.1 335 6.22 68.1 1.97 68 306 11.4 80 2.3 60 476 9.65 90 ND 43.4 403 ND
105.4 4.01 46.2 546 ND 131.1 2.4 39.3 856 6.44
ND= not detected
-63-
Table B7. Hormones in ambient water - 2009 (ng/L)
RM Estrone Norethindrone 17 alpha-Ethinyl-Estradiol Desogestrel 17 alpha-Dihydroequilin Equilenin Equilin 17 beta-Estradiol
50 ND ND ND 242 ND ND ND ND 68.1 ND ND ND 239 ND ND ND ND 80 ND ND ND ND ND ND ND ND 90 ND ND ND ND ND ND ND ND
105.4 ND ND ND ND ND ND ND ND 131.1 ND ND ND ND ND ND ND ND
RM 17 alpha-Estradiol Allyl Trenbolone Androstenedione Androsterone Estriol Mestranol Norgestrel Testosterone Progesterone 50 ND ND ND ND ND ND ND ND ND
68.1 ND ND ND ND ND ND ND ND ND 80 ND ND ND ND ND ND ND ND ND 90 ND ND ND ND ND ND ND ND ND
105.4 ND ND ND ND ND ND ND ND ND 131.1 ND ND ND ND ND ND ND 1.37 ND
ND= not detected

-64-
Table B8. PFASs (ng/L) in ambient water - 2007
Liston Point
De. Mem Bridge Marcus Hook Creek Schuylkill R. Pennsauken Creek Biles Channel
RM 50 RM 68.1 RM 80 RM 90 RM 105.4 RM 131.1
Perfluorobutanoate (PFBA) C4 17.60 19.00 5.89 2.92 1.43 1.71 Perfluoropentanoate (PFPeA) C5 35.40 30.50 10.40 5.09 4.56 ND Perfluorohexanoate (PFHxA) C6 57.90 79.80 16.20 6.00 3.59 1.40 Perfluoroheptanoate (PFHpA) C7 19.80 24.30 12.30 4.55 2.85 ND Perfluorooctanoate (PFOA) C8 57.30 75.40 23.80 10.80 5.80 3.54 Perfluorononanoate (PFNA) C9 331.00 847.00 976.00 265.00 3.32 1.71 Perfluorodecanoate (PFDA) C10 6.97 9.97 4.62 2.07 1.11 ND Perfluoroundecanoate (PFUnA) C11 2.42 8.92 26.00 7.22 ND ND Perfluorododecanoate (PFDoA) C12 ND ND ND ND ND ND Perfluorobutanesulfonate (PFBS) C4 2.79 2.34 ND ND ND ND Perfluorohexanesulfonate (PFHxS) C6 2.97 ND 4.48 4.12 ND ND Perfluorooctanesulfonate (PFOS) C8 5.96 7.27 7.05 8.42 7.49 2.70 Perfluorooctane sulfonamide (PFOSA) C8 ND ND ND ND ND ND
ND= not detected

-65-
Table B9. PFASs (ng/L) in ambient water - 2008
Liston Point De. Mem
Bridge Marcus Hook Creek Schuylkill R. Pennsauken Creek Biles Channel RM 50 RM 68.1 RM 80 RM 90 RM 105.4 RM 131.1
Perfluorobutanoate (PFBA) C4 25.9 20.6 4.51 4.87 2.6 1.63 Perfluoropentanoate (PFPeA) C5 31.6 28.2 8.9 5.88 ND ND Perfluorohexanoate (PFHxA) C6 80.1 53.8 10.5 6.26 5.02 2.92 Perfluoroheptanoate (PFHpA) C7 16.3 15.4 7.23 4.51 2.72 2.03 Perfluorooctanoate (PFOA) C8 47.5 48 19.2 10.2 5.1 3.99 Perfluorononanoate (PFNA) C9 301 650 552 196 4.25 3.24 Perfluorodecanoate (PFDA) C10 5.25 6.21 2.33 1.69 ND ND Perfluoroundecanoate (PFUnA) C11 2.47 7.23 11.8 5.44 ND ND Perfluorododecanoate (PFDoA) C12 ND ND ND ND ND ND Perfluorobutanesulfonate (PFBS) C4 24.4 15.4 3.73 3.24 ND ND Perfluorohexanesulfonate (PFHxS) C6 2.12 3.55 2.1 3.17 ND ND Perfluorooctanesulfonate (PFOS) C8 6.16 11.7 10.9 10.5 6.71 3.53 Perfluorooctane sulfonamide (PFOSA) C8 ND ND ND ND ND ND
ND= not detected
-66-
Table B10. PFASs (ng/L) in ambient water - 2009
Liston Point De. Mem
Bridge Marcus Hook Creek Schuylkill R. Pennsauken Creek Biles Channel RM 50 RM 68.1 RM 80 RM 90 RM 105.4 RM 131.1
Perfluorobutanoate (PFBA) C4 7.46 8.15 3.37 2.84 1.87 ND Perfluoropentanoate (PFPeA) C5 13.8 11.7 3.98 3.17 2.23 1.34 Perfluorohexanoate (PFHxA) C6 40 47.4 6.54 6.07 5.45 3.27 Perfluoroheptanoate (PFHpA) C7 7.78 9.81 5.02 4.01 1.95 1.14 Perfluorooctanoate (PFOA) C8 20.4 27.7 16.4 11.5 5.37 3.29 Perfluorononanoate (PFNA) C9 108 338 546 240 3.68 1.65 Perfluorodecanoate (PFDA) C10 2.08 2.62 1.75 ND ND ND Perfluoroundecanoate (PFUnA) C11 1.42 3.97 8.3 3.86 ND ND Perfluorododecanoate (PFDoA) C12 ND ND ND ND ND ND Perfluorobutanesulfonate (PFBS) C4 9.88 8.57 2.62 ND ND ND Perfluorohexanesulfonate (PFHxS) C6 ND 2.74 3.62 3.05 2.89 ND Perfluorooctanesulfonate (PFOS) C8 2.86 5.75 7.97 5.99 7 ND Perfluorooctane sulfonamide (PFOSA) C8 ND ND ND ND ND ND
ND= not detected

-67-
Table B11. PBDE in ambient water – 2007 (pg/L)
RM DiBDE TriBDE TeBDE PeBDE HxBDE HpBDE OcBDE NoBDE DeBDE tPBDE 50 4.06 8.34 10.88 12.1 7.56 ND 12.2 161 30 246
68.1 4.3 11.97 65.16 101.187 24.97 7.78 25.6 413 2,090 2,744 80 3.08 6.85 28.62 12.07 12.02 ND 11.4 13.3 ND 87 90 3.38 22.75 237.62 216.02 50.21 10.75 44.7 1161 7,630 9,376
105.4 1.95 16.22 119.59 108.65 21.8 6.45 32.1 608 3,170 4,085 131.1 ND 7.71 118.81 136.57 20.28 3.13 27.6 40.5 ND 355
ND= not detected Table B12.Nonylphenols and Nonylphenol Ethoxylates in Ambient Water – 2007 (ng/L)
RM NP NP1EO 50 0.8 ND
68.1 87.6 18.4 80 34.6 17.6 90 17.7 24.6
105.4 43.1 39.8 131.1 20.7 7.97
NP = nonylphenol NPEO1 = nonylphenol monoethoxylate

-68-
Appendix C: Aquatic Toxicity Data Table C1: Aquatic Toxicology Data for Pharmaceuticals and Personal Care Products Parameter acute
ECx or LCx mg/L
chronic NOEC or ChV mg/L
Assessment Factor
PNEC ng/L
Organism Source
1,7-dimethylxanthine
100 1000 100,000 Scenedesmus subspicatus
MSDS
1,7-dimethylxanthine
178 1000 178,000 Daphnia magna MSDS
1,7-dimethylxanthine
100 1000 100,000 Leucisus idus MSDS
2-hydroxy-ibuprofen
NA NA
10-hydroxy-amitriptyline
NA NA
acetaminophen 378 1000 378,000 Brachydanio rerio Cunningham et al., 2006
Albuterol 1.3 100 13,000 Daphnid ECOSAR (phenol amine)
Albuterol 2.591 100 25,910 Daphnid ECOSAR (aliphatic amine)
alprazolam 0.018 100 180 Daphnid ECOSAR (triazoles)
amitriptyline 0.017 100 170 Daphnid ECOSAR amoxicillin 0.0037 1000 4 Microcystis
aeruginosa Schmitt et al 2009
amphetamine 11.871 100 118,710 Daphnid ECOSAR Atenolol 3.2 100 32,000 Pimephales
promelas Winter et al, 2008
Atenolol 1.8 100 18,000 Daphnia magna Kuster et al, 2010
azithromycin >120 1000 120,000 Daphnid Cunningham et al., 2006
azithromycin 1.023 100 10,230 fish ECOSAR benzoylecgonine 1.531 100 15,310 fish ECOSAR
(esters) benzoylecgonine 24.708 100 247,080 Daphnid ECOSAR
(esters) benzoylecgonine 5.81 100 58,100 green algae ECOSAR
(esters) caffeine 151 1000 151,000 Pimephales Cunningham
et al., 2006 carbadox 38.699 100 386,990 fish ECOSAR carbamazepine 0.377 100 3,770 Brachionus
calyciflorus Ferrari et al., 2003
carbamazepine 0.025 100 250 Ceriodaphnia Ferrari et al., 2003
-69-
Parameter acute ECx or LCx mg/L
chronic NOEC or ChV mg/L
Assessment Factor
PNEC ng/L
Organism Source
carbamazepine 25.5 1000 25,500 Lemna minor Cleuvers, 2003
ciprofloxacin 0.106 100 1,060 Lemna gibba Crane et al., 2006
ciprofloxacin 0.005 1000 5 Microcystis aeruginosa
Schmitt et al 2009
clarithromycin 0.002 1000 2 algae Cunningham et al., 2006
clarithromycin 18.66 1000 18,660 Ceriodaphnia Cunningham et al., 2006
clarithromycin 0.002 1000 2 Pseudokirchneriella subcapitata
Schmitt et al. 2009
cocaine 5.482 1000 5,482 Daphnid ECOSAR codeine 7.438 1000 7,438 Fish ECOSAR
(vinyl/allyl alcohol)
codeine 0.976 1000 976 Daphnid ECOSAR (vinyl/allyl alcohol)
codeine 18.345 100 183,450 green algae ECOSAR (aliphatic amines)
cotinine 12.95 100 129,500 fish ECOSAR (aliphatic amines)
cotinine 1.425 100 14,250 Daphnid ECOSAR (aliphatic amines)
cotinine 5.732 100 57,320 green algae ECOSAR (aliphatic amines)
cotinine 1000 100 10,000,000
Lemna gibba Brain et al, 2004 (max test conc)
DEET 0.091 100 910 fish ECOSAR dehydronifedipine NA NA Desmethyl-diltiazem
NA NA
digoxigenin 70.837 100 708,370 Daphnid ECOSAR digoxin <0.01 100 100 Hydra vulgaris Crane et al.,
2006 diltiazem 0.092 100 920 fish ECOSAR
(amines) diphenhydramine 1.289 100 12,890 Daphnid ECOSAR enalapril 220 100 2,200,000 green algae ECOSAR enrofloxacine 123 100 1,230,000 green algae ECOSAR erythromycin hydrate
0.94 1000 940 Brachionus calcyciflous
Cunningham et al., 2006

-70-
Parameter acute ECx or LCx mg/L
chronic NOEC or ChV mg/L
Assessment Factor
PNEC ng/L
Organism Source
erythromycin hydrate
0.02 1000 20 Pseudokirchneriella subcapitata
Cunningham et al., 2006
fluoxetine 0.0001 1000 0.10 Gammurus pulex Schmitt et al, 2009
fluoxetine 0.00064 100 6.4 Potamopyrgus antipodarum
Schmitt et al 2009
fluoxetine 0.0006 100 6 Desmodesmus subspicatus
Oakes et al., 2010
fluoxetine 0.089 100 890 Daphnid Oakes et al., 2010
fluticasone propionate
NA NA
furosemide 1.216 100 12,160 fish ECOSAR (amides -acids)
furosemide 38.677 100 386,770 Daphnid ECOSAR (amides -acids)
furosemide 21.238 100 212,380 green algae ECOSAR (amides -acids)
gemfibrozil 74.3 1000 74,300 Daphnia magna CCEHBR gemfibrozil 0.53 1000 530 Ceriodaphnia CCEHBR gemfibrozil 0.44 1000 440 Brachionus
calyciflorus CCEHBR
Hydrocodone 9.37 100 93,700 Daphnid ECOSAR ibuprofen 0.0000
1 1000 0.01 Gammarus pulex Schmitt et al,
2009 ibuprofen 0.001 1000 1.00 Lemna minor Schmitt et al
2009 ibuprofen 1,000.00 pers.com.
Dan Caldwell
lincomycin 0.07 1000 70 Pseudokirchneriella subcapitata
Cunningham et al., 2006
lincomycin 0.68 1000 680 Brachionus calyciflorus
Cunningham et al., 2006
Meprobamate 10.674 100 106,740 fish ECOSAR (esters)
Meprobamate 243.393 100 2,433,930
Daphnid ECOSAR (esters)
Meprobamate 24.473 100 244,730 green algae ECOSAR (esters)
Metformin 110 1000 110,000 Lemna Cleuvers 2003
Metformin 64 1000 64,000 Daphnia magna Cleuvers 2003
Metformin 130 1000 130,000 Daphnid CCEHBR
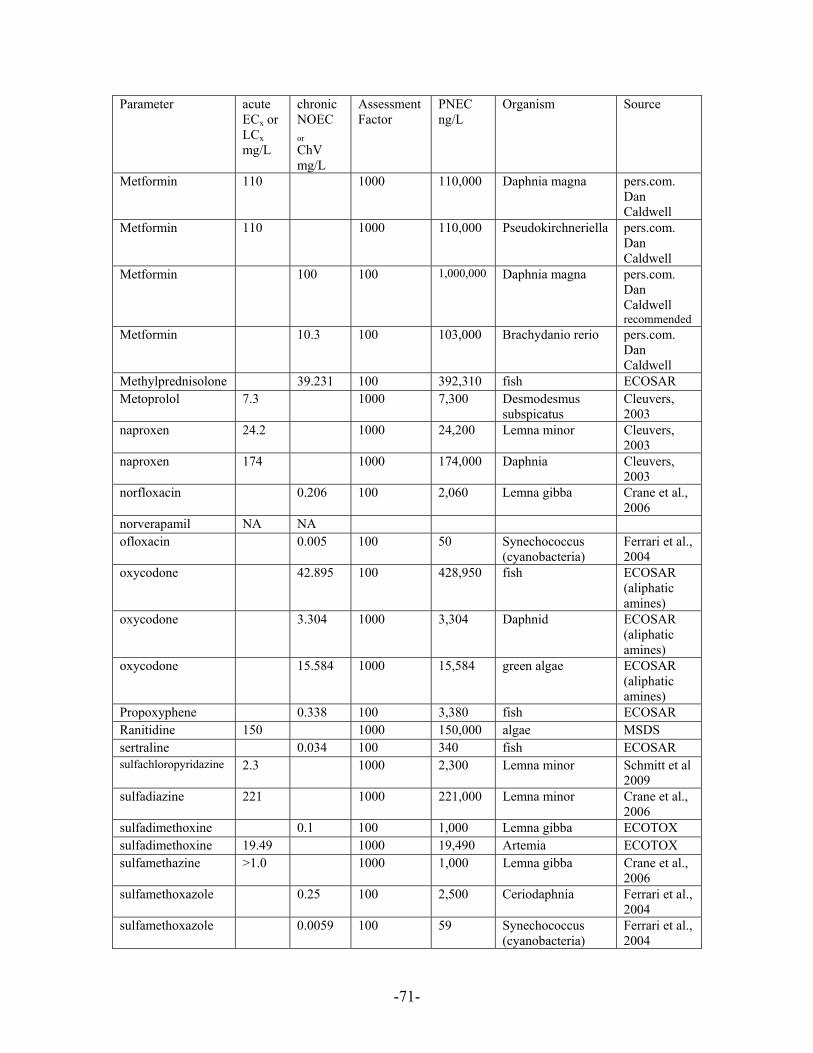
-71-
Parameter acute ECx or LCx mg/L
chronic NOEC or ChV mg/L
Assessment Factor
PNEC ng/L
Organism Source
Metformin 110 1000 110,000 Daphnia magna pers.com. Dan Caldwell
Metformin 110 1000 110,000 Pseudokirchneriella pers.com. Dan Caldwell
Metformin 100 100 1,000,000 Daphnia magna pers.com. Dan Caldwell recommended
Metformin 10.3 100 103,000 Brachydanio rerio pers.com. Dan Caldwell
Methylprednisolone 39.231 100 392,310 fish ECOSAR Metoprolol 7.3 1000 7,300 Desmodesmus
subspicatus Cleuvers, 2003
naproxen 24.2 1000 24,200 Lemna minor Cleuvers, 2003
naproxen 174 1000 174,000 Daphnia Cleuvers, 2003
norfloxacin 0.206 100 2,060 Lemna gibba Crane et al., 2006
norverapamil NA NA ofloxacin 0.005 100 50 Synechococcus
(cyanobacteria) Ferrari et al., 2004
oxycodone 42.895 100 428,950 fish ECOSAR (aliphatic amines)
oxycodone 3.304 1000 3,304 Daphnid ECOSAR (aliphatic amines)
oxycodone 15.584 1000 15,584 green algae ECOSAR (aliphatic amines)
Propoxyphene 0.338 100 3,380 fish ECOSAR Ranitidine 150 1000 150,000 algae MSDS sertraline 0.034 100 340 fish ECOSAR sulfachloropyridazine 2.3 1000 2,300 Lemna minor Schmitt et al
2009 sulfadiazine 221 1000 221,000 Lemna minor Crane et al.,
2006 sulfadimethoxine 0.1 100 1,000 Lemna gibba ECOTOX sulfadimethoxine 19.49 1000 19,490 Artemia ECOTOX sulfamethazine >1.0 1000 1,000 Lemna gibba Crane et al.,
2006 sulfamethoxazole 0.25 100 2,500 Ceriodaphnia Ferrari et al.,
2004 sulfamethoxazole 0.0059 100 59 Synechococcus
(cyanobacteria) Ferrari et al., 2004

-72-
Parameter acute ECx or LCx mg/L
chronic NOEC or ChV mg/L
Assessment Factor
PNEC ng/L
Organism Source
sulfanilamide 14 1000 13,700 Daphnia magna ECOTOX sulfanilamide 1 100 10,000 Oryzia latipes ECOTOX sulfathiazole 0.923 100 9,230 fish ECOSAR theophylline 100 1000 100,000 Leuciscus idus MSDS theophylline 178 1000 178,000 Daphnia magna MSDS thiabendazole 0.012 100 120 rainbow trout MSDS thiabendazole 0.11 100 1,100 fathead minnow MSDS thiabendazole 0.55 1000 550 rainbow trout MSDS Triamterene 56 100 560,000 Daphnid ECOSAR triclocarban 0.00005
6 100 0.56 Americamysis
bahia ECOTOX
triclocarban 0.00025 100 2.50 Daphnid ECOTOX trimethoprim 1 100 10,000 Lemna gibba ECOTOX trimethoprim 6 100 60,000 Daphnia magna ECOTOX tylosin 22.4 100 224,000 Brachionus
plicatilus ECOTOX
tylosin 22.4 100 224,000 Brachionus calyciflorus
ECOTOX
tylosin 45 100 450,000 Daphnia magna ECOTOX tylosin 1 100 10,000 Lemna gibba ECOTOX valsartan 58 100 580,000 green algae FDA
Novartis EA 2009
valsartan 280 100 2,800,000 Daphnia magna FDA Novartis EA 2009
valsartan 100 100 1,000,000 Salmo gairdneri FDA Novartis EA 2009
verapamil 0.029 100 290 Daphnid ECOSAR EC50 – effective concentration of the tested chemical at which mortality or immobility occurs at 50 % of organisms LC50 -lethal concentration of the tested chemical at which mortality occurs at 50 % of organisms NOEC – no observed effect concentration ChV – chronic value is the geometric mean of the no observed effect concentration (NOEC) and the lowest observed effect concentration (LOEC) as reported in ECOSAR
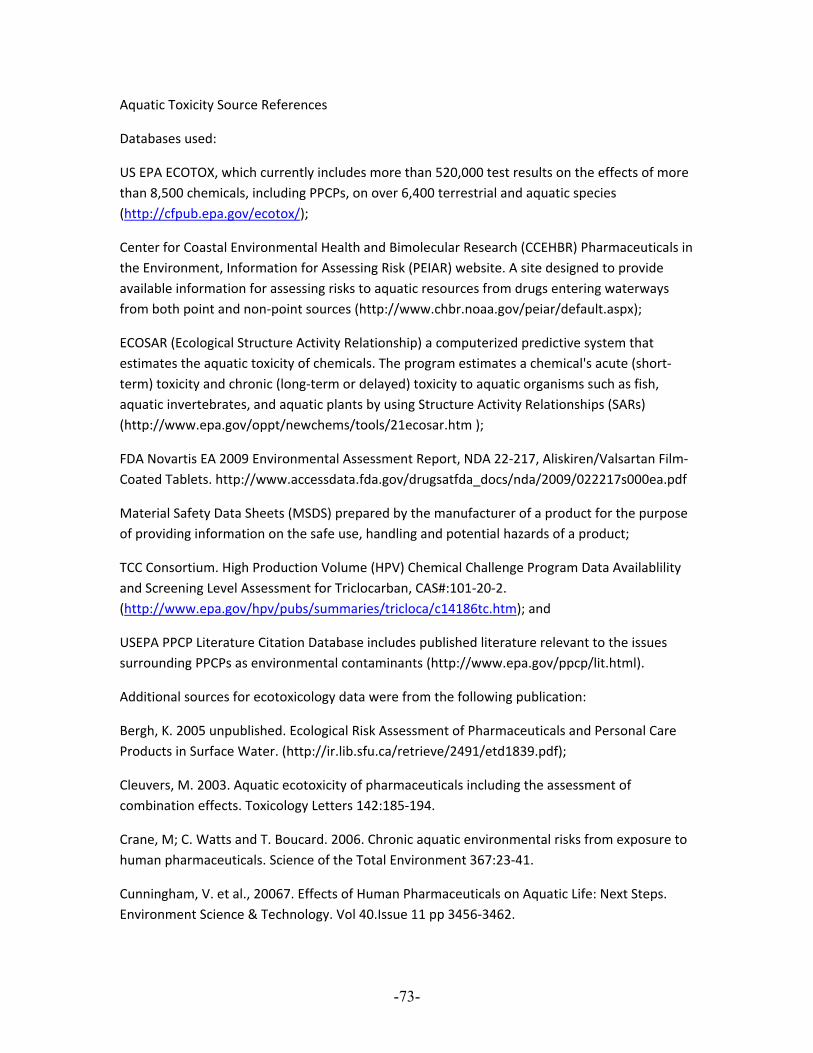
-73-
Aquatic Toxicity Source References
Databases used:
US EPA ECOTOX, which currently includes more than 520,000 test results on the effects of more than 8,500 chemicals, including PPCPs, on over 6,400 terrestrial and aquatic species (http://cfpub.epa.gov/ecotox/);
Center for Coastal Environmental Health and Bimolecular Research (CCEHBR) Pharmaceuticals in the Environment, Information for Assessing Risk (PEIAR) website. A site designed to provide available information for assessing risks to aquatic resources from drugs entering waterways from both point and non‐point sources (http://www.chbr.noaa.gov/peiar/default.aspx);
ECOSAR (Ecological Structure Activity Relationship) a computerized predictive system that estimates the aquatic toxicity of chemicals. The program estimates a chemical's acute (short‐term) toxicity and chronic (long‐term or delayed) toxicity to aquatic organisms such as fish, aquatic invertebrates, and aquatic plants by using Structure Activity Relationships (SARs) (http://www.epa.gov/oppt/newchems/tools/21ecosar.htm );
FDA Novartis EA 2009 Environmental Assessment Report, NDA 22‐217, Aliskiren/Valsartan Film‐Coated Tablets. http://www.accessdata.fda.gov/drugsatfda_docs/nda/2009/022217s000ea.pdf
Material Safety Data Sheets (MSDS) prepared by the manufacturer of a product for the purpose of providing information on the safe use, handling and potential hazards of a product;
TCC Consortium. High Production Volume (HPV) Chemical Challenge Program Data Availablility and Screening Level Assessment for Triclocarban, CAS#:101‐20‐2. (http://www.epa.gov/hpv/pubs/summaries/tricloca/c14186tc.htm); and
USEPA PPCP Literature Citation Database includes published literature relevant to the issues surrounding PPCPs as environmental contaminants (http://www.epa.gov/ppcp/lit.html).
Additional sources for ecotoxicology data were from the following publication:
Bergh, K. 2005 unpublished. Ecological Risk Assessment of Pharmaceuticals and Personal Care Products in Surface Water. (http://ir.lib.sfu.ca/retrieve/2491/etd1839.pdf);
Cleuvers, M. 2003. Aquatic ecotoxicity of pharmaceuticals including the assessment of combination effects. Toxicology Letters 142:185‐194.
Crane, M; C. Watts and T. Boucard. 2006. Chronic aquatic environmental risks from exposure to human pharmaceuticals. Science of the Total Environment 367:23‐41.
Cunningham, V. et al., 20067. Effects of Human Pharmaceuticals on Aquatic Life: Next Steps. Environment Science & Technology. Vol 40.Issue 11 pp 3456‐3462.

-74-
Fent, K, A Weston and D. Caminanda. 2006. Ecotoxicology of human pharmaceuticals. Aquatic Toxicology 76:122‐159
Ferrari B. et al. 2004. Environmental risk assessment of six human pharmaceuticals: are the current environmental risk assessment procedures sufficient for the protection of the aquatic environment. Environ Toxicol and Chem 23(5)1344‐1354.
Kuster, A. et al., 2009. Environmental risk assessment of hman pharmaceuticals in the European union: a case study with the β‐blocker atenolol. Integr Environ Assess and Manag 6(1)514‐523
Oakes, K. D.et al., 2010. Environmental Risk assessment for the serotonin re‐uptake inhibitor fluoxetine: case study using the European risk assessment framework. Integr Environ Assess and Manag 6(1)524‐539
Schmitt, H et al., 2009. Recommendations on the environmental risk assessment of pharmaceuticals: effect characterization. Integr Environ Assess and Manag 6(1): 588‐602.
Winter et al 2008. Defining the chronic impacts of atenolol on embryo‐larval development and reproduction in the fathead minnow (Pimephales promelas). Aquat. Toxicol. (3) 361‐369.
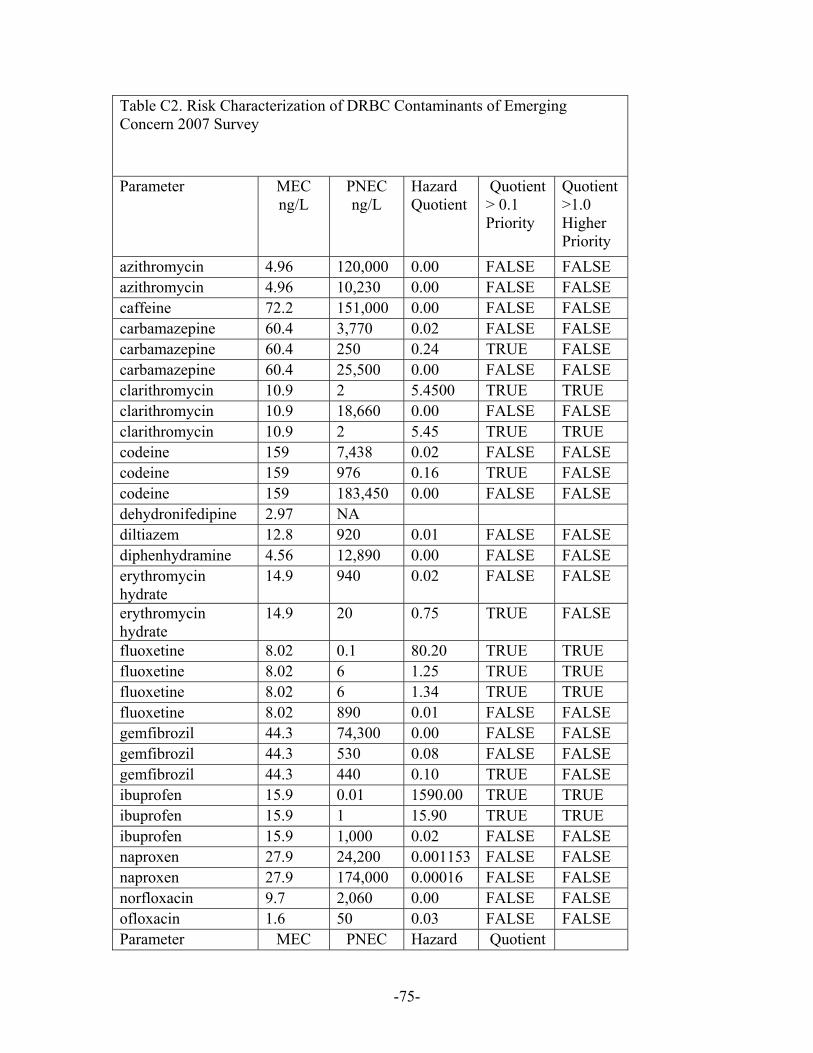
-75-
Table C2. Risk Characterization of DRBC Contaminants of Emerging Concern 2007 Survey
Parameter MEC ng/L
PNEC ng/L
Hazard Quotient
Quotient > 0.1 Priority
Quotient >1.0 Higher Priority
azithromycin 4.96 120,000 0.00 FALSE FALSE azithromycin 4.96 10,230 0.00 FALSE FALSE caffeine 72.2 151,000 0.00 FALSE FALSE carbamazepine 60.4 3,770 0.02 FALSE FALSE carbamazepine 60.4 250 0.24 TRUE FALSE carbamazepine 60.4 25,500 0.00 FALSE FALSE clarithromycin 10.9 2 5.4500 TRUE TRUE clarithromycin 10.9 18,660 0.00 FALSE FALSE clarithromycin 10.9 2 5.45 TRUE TRUE codeine 159 7,438 0.02 FALSE FALSE codeine 159 976 0.16 TRUE FALSE codeine 159 183,450 0.00 FALSE FALSE dehydronifedipine 2.97 NA diltiazem 12.8 920 0.01 FALSE FALSE diphenhydramine 4.56 12,890 0.00 FALSE FALSE erythromycin hydrate
14.9 940 0.02 FALSE FALSE
erythromycin hydrate
14.9 20 0.75 TRUE FALSE
fluoxetine 8.02 0.1 80.20 TRUE TRUE fluoxetine 8.02 6 1.25 TRUE TRUE fluoxetine 8.02 6 1.34 TRUE TRUE fluoxetine 8.02 890 0.01 FALSE FALSE gemfibrozil 44.3 74,300 0.00 FALSE FALSE gemfibrozil 44.3 530 0.08 FALSE FALSE gemfibrozil 44.3 440 0.10 TRUE FALSE ibuprofen 15.9 0.01 1590.00 TRUE TRUE ibuprofen 15.9 1 15.90 TRUE TRUE ibuprofen 15.9 1,000 0.02 FALSE FALSE naproxen 27.9 24,200 0.001153 FALSE FALSE naproxen 27.9 174,000 0.00016 FALSE FALSE norfloxacin 9.7 2,060 0.00 FALSE FALSE ofloxacin 1.6 50 0.03 FALSE FALSE Parameter MEC PNEC Hazard Quotient

-76-
ng/L ng/L Quotient > 0.1 Priority
Quotient >1.0 Higher Priority
sulfadiazine 2.91 221,000 0.00 FALSE FALSE sulfadimethoxine 1.64 1,000 0.00 FALSE FALSE sulfadimethoxine 1.64 19,490 0.00 FALSE FALSE sulfamethoxazole 150 2,500 0.06 FALSE FALSE sulfamethoxazole 150 59 2.54 TRUE TRUE sulfanilamide 16.6 13,700 0.001212 FALSE FALSE sulfanilamide 16.6 10,000 0.00166 FALSE FALSE triclocarban 6.54 0.56 11.67857 TRUE TRUE triclocarban 6.54 2.5 2.616 TRUE TRUE trimethoprim 16.6 10,000 0.00 FALSE FALSE trimethoprim 16.6 60,000 0.00 FALSE FALSE MEC = measured environmental concentration PNEC = predicted no effect concentration most sensitive species Hazard Quotient = MEC/PNEC NA = not available

-77-
Table C3. Risk Characterization of DRBC Contaminants of Emerging Concern 2008 Survey
Parameter MEC ng/L
PNEC ng/L
Hazard Quotient
Quotient > 0.1
Priority
Quotient
>1.0 Higher Priority
1,7-dimethylxanthine 239 100,000 0.00239 FALSE FALSE 1,7-dimethylxanthine 239 100,000 0.00239 FALSE FALSE 1,7-dimethylxanthine 239 178,000 0.0013427 FALSE FALSE Albuterol 0.711 13,000 7.9888E-07 FALSE FALSE caffeine 166.1 151,000 0.0011 FALSE FALSE carbadox 7.48 386,990 1.9329E-05 FALSE FALSE carbamazepine 67.3 3,770 0.01785146 FALSE FALSE carbamazepine 67.3 250 0.2692 TRUE FALSE carbamazepine 67.3 25,500 0.00263922 FALSE FALSE clarithromycin 2.65 2 1.325 TRUE TRUE clarithromycin 2.65 18,660 0.00014202 FALSE FALSE codeine 72.7 7,438 0.01628584 FALSE FALSE codeine 72.7 976 0.0744877 FALSE FALSE codeine 72.7 183,450 0.00039629 FALSE FALSE codeine 72.7 129,500 0.00056139 FALSE FALSE cotinine 35.6 129,500 0.0002749 FALSE FALSE cotinine 35.6 14,250 0.00249825 FALSE FALSE cotinine 35.6 57,320 0.00062107 FALSE FALSE cotinine 35.6 10,000,000 0.00000356 FALSE FALSE dehydronifedipine 2.19 708,370 3.0916E-06 FALSE FALSE diltiazem 9.83 920 0.00076261 FALSE FALSE diphenhydramine 3.64 12,890 0.00028239 FALSE FALSE erythromycin hydrate 6.23 940 0.00662766 FALSE FALSE erythromycin hydrate 6.23 20 0.3115 TRUE FALSE fluoxetine 5.4 0 54 TRUE TRUE fluoxetine 5.4 6 0.84375 TRUE FALSE fluoxetine 5.4 6 0.9 TRUE FALSE fluoxetine 5.4 890 0.00606742 FALSE FALSE gemfibrozil 24.9 100,000 0.000249 FALSE FALSE lincomycin 37.4 70 0.53428571 TRUE FALSE lincomycin 37.4 680 0.055 FALSE FALSE Metformin 3590 110,000 0.03263636 FALSE FALSE Metformin 3590 64,000 0.05609375 FALSE FALSE Metformin 3590 130,000 0.02761538 FALSE FALSE Metformin 3590 110,000 0.03263636 FALSE FALSE Metformin 3590 110,000 0.03263636 FALSE FALSE Metformin 3590 1,000,000 0.00359 FALSE FALSE Metformin 3590 103,000 0.03485437 FALSE FALSE

-78-
Parameter MEC ng/L
PNEC ng/L
Hazard Quotient
Quotient > 0.1
Priority
Quotient
>1.0 Higher Priority
naproxen 26.2 24,200 0.00108264 FALSE FALSE naproxen 26.2 174,000 0.00015057 FALSE FALSE Ranitidine 0.922 1,000 0.000922 FALSE FALSE sulfadimethoxine 0.485 1,000 0.000485 FALSE FALSE sulfadimethoxine 0.485 19,490 2.4885E-05 FALSE FALSE sulfamethoxazole 2.35 2,500 0.00094 FALSE FALSE sulfamethoxazole 2.35 59 0.03983051 FALSE FALSE thiabendazole 73.6 120 0.61333333 TRUE FALSE thiabendazole 73.6 1,100 0.06690909 FALSE FALSE thiabendazole 73.6 550 0.13381818 TRUE FALSE triclocarban 8.53 1 15.2321429 TRUE TRUE triclocarban 8.53 3 3.412 TRUE TRUE trimethoprim 13.1 10,000 0.03983051 FALSE FALSE trimethoprim 13.1 60,000 0.03983051 FALSE FALSE
MEC = highest measured environmental concentration PNEC = predicted no effect concentration most sensitive species Hazard Quotient = MEC/PNEC NA = not available

-79-
Table C4. Risk Characterization of DRBC Contaminants of Emerging Concern 2009 Survey
Parameter MEC ng/L
PNEC ng/L
Hazard Quotient
Quotient > 0.1
Priority
Quotient >1.0
Higher Priority
2-hydroxy-ibuprofen 346 NA 10-hydroxy-amitriptyline 0.382 NA acetaminophen 105 100 1.05 TRUE TRUE Albuterol 0.996 13,000 0.00 FALSE FALSE Alprazolam 0.612 180 0.00 FALSE FALSE Amitriptyline 1.39 170 0.01 FALSE FALSE Amphetamine 5.53 118,710 0.00 FALSE FALSE Atenolol 58.8 32,000 0.00 FALSE FALSE Atenolol 58.8 18,000 0.00 FALSE FALSE azithromycin 14.1 120,000 0.0001175 FALSE FALSE azithromycin 14.1 10,230 0.0013783 FALSE FALSE Benzoylecgonine 39.6 15,310 0.00258654 FALSE FALSE caffeine 238 151,000 0.00 FALSE FALSE carbadox 7.48 386,990 1.9329E-05 FALSE FALSE carbamazepine 39.2 3,770 0.01 FALSE FALSE carbamazepine 39.2 250 0.16 TRUE FALSE carbamazepine 39.2 25,500 0.00 FALSE FALSE clarithromycin 11.6 2 5.80 TRUE TRUE clarithromycin 11.6 18,660 0.00 FALSE FALSE clarithromycin 11.6 2 5.80 TRUE TRUE cocaine 2.58 5,482 0.00 FALSE FALSE codeine 38.2 7,438 0.01 FALSE FALSE codeine 38.2 976 0.04 FALSE FALSE codeine 38.2 18,345 0.00 FALSE FALSE cotinine 38.2 1,000 0.04 FALSE FALSE DEET 42.8 900 0.05 FALSE FALSE dehydronifedipine 1.41 NA Desmethyldiltiazem 3.35 NA diltiazem 9.51 920 0.01 FALSE FALSE diphenhydramine 7.68 12,890 0.00 FALSE FALSE Enalapril 0.343 2,200,000 0.00 FALSE FALSE erythromycin hydrate 9.24 940 0.01 FALSE FALSE erythromycin hydrate 9.24 20 0.46 TRUE FALSE Fluticasone propionate 2.69 NA gemfibrozil 53.9 440 0.12 TRUE FALSE

-80-
Parameter MEC ng/L
PNEC ng/L
Hazard Quotient
Quotient > 0.1
Priority
Quotient >1.0
Higher Priority
Hydrocodone 16.2 93,700 0.00 FALSE FALSE ibuprofen 76.6 0.01 7660.00 TRUE TRUE ibuprofen 76.6 1 76.60 TRUE TRUE ibuprofen 76.6 1,000 0.08 FALSE FALSE Meprobamate 38.2 106,740 0.00 FALSE FALSE Meprobamate 38.2 244,730 0.00 FALSE FALSE Metformin 1140 110,000 0.01 FALSE FALSE Metformin 1140 64,000 0.02 FALSE FALSE Metformin 1140 130,000 0.01 FALSE FALSE Metformin 1140 110,000 0.01 FALSE FALSE Metformin 1140 110,000 0.01 FALSE FALSE Metformin 1140 1,000,000 0.00 FALSE FALSE Metformin 1140 103,000 0.01 FALSE FALSE Methylprednisolone 0.8 392,310 0.00 FALSE FALSE Metoprolol 42.4 7,300 0.01 FALSE FALSE naproxen 67.5 24,200 0.00 FALSE FALSE Norverapamil 0.172 NA oxycodone 53.1 3,304 0.02 FALSE FALSE Propoxyphene 2.96 3,380 0.00 FALSE FALSE Ranitidine 3.18 150,000 0.00 FALSE FALSE Sertraline 1.16 340 0.00 FALSE FALSE sulfadimethoxine 1.42 1,000 0.00 FALSE FALSE sulfamethoxazole 88.8 2,500 0.04 FALSE FALSE sulfamethoxazole 88.8 59 1.51 TRUE TRUE sulfathiazole 2.35 9,230 0.00 FALSE FALSE theophylline 145 116,750 0.00 FALSE FALSE thiabendazole 3.66 10,000 0.00 FALSE FALSE thiabendazole 3.66 1,000 0.00 FALSE FALSE Triamterene 4.47 560,000 0.00 FALSE FALSE triclocarban 10.7 0.56 19.11 TRUE TRUE triclocarban 10.7 2.50 4.28 TRUE TRUE trimethoprim 20.3 10,000 0.00 FALSE FALSE trimethoprim 20.3 60,000 0.00 FALSE FALSE valsartan 97.6 90,000 FALSE FALSE Verapamil 0.852 290 0.00 FALSE FALSE
MEC = measured environmental concentration PNEC = predicted no effect concentration most sensitive species Hazard Quotient = MEC/PNEC NA = not available

-81-
Appendix D: Bioassays
Short-term Chronic Toxicity Tests
Bioassays were included in the study because they assess chemical mixtures and possible additive effects as well as assess toxicants with no specific analytical detection method or chemicals that are not being monitored by chemical methods used in the study. Concurrent with sampling for contaminants of emerging concern in years 2007 and 2008, short-term chronic toxicity tests were conducted with ambient water from the six sampling stations in the main-stem river as described in the contaminants of emerging concern sampling . Samples were split and transported on the day collected to the respective laboratories for toxicity testing and physical-chemical analysis. Samples for toxicity testing were transported to American Aquatic Testing Laboratory Inc., Allentown, PA. Following USEPA Methods, short-term chronic toxicity tests were performed using Pimephales promelas, Americamysis bahia, Menidia beryllina, and Ceriodaphnia dubia in 7-day tests; Pseudokirchneriella subcapitata in a 96-hour test; and Hyalella azteca in a 10-day water-only test. Test organism survival, growth, and when possible, reproduction were measured (USEPA 2000, 2002a and 2002b) (Table C1). Results from this study indicate that water collected from six main-stem sites in the tidal Delaware River Basin caused little or no significant adverse effects for the endpoints measured in short-term chronic toxicity tests for the species tested. Survival, growth and reproduction results indicated the lack of effects (MacGillivray et al., 2011). Bioassays can provide a cost effective approach for prioritization of monitoring surface water quality in a large watershed providing information for environmental management over the largest time scale and spatial coverage with limited resources. Using bioassays, sites that exhibit harmful effects can be targeted for additional evaluation using more expensive chemical analysis, toxicity identification evaluation and toxicity reduction evaluation.
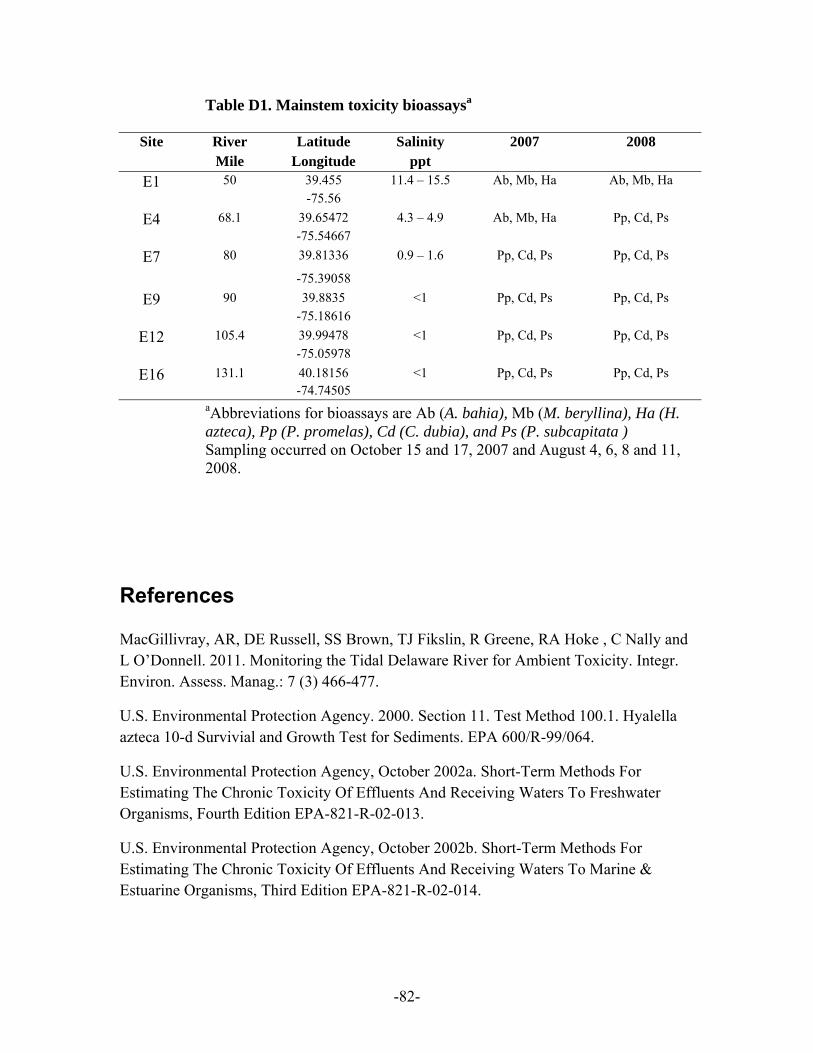
-82-
Table D1. Mainstem toxicity bioassaysa
Site River Latitude Salinity 2007 2008 Mile Longitude ppt
E1 50 39.455 11.4 – 15.5 Ab, Mb, Ha Ab, Mb, Ha -75.56
E4 68.1 39.65472 4.3 – 4.9 Ab, Mb, Ha Pp, Cd, Ps -75.54667
E7 80 39.81336 0.9 – 1.6 Pp, Cd, Ps Pp, Cd, Ps
-75.39058 E9 90 39.8835 <1 Pp, Cd, Ps Pp, Cd, Ps
-75.18616 E12 105.4 39.99478 <1 Pp, Cd, Ps Pp, Cd, Ps
-75.05978 E16 131.1 40.18156 <1 Pp, Cd, Ps Pp, Cd, Ps
-74.74505 aAbbreviations for bioassays are Ab (A. bahia), Mb (M. beryllina), Ha (H.
azteca), Pp (P. promelas), Cd (C. dubia), and Ps (P. subcapitata ) Sampling occurred on October 15 and 17, 2007 and August 4, 6, 8 and 11,
2008.
References MacGillivray, AR, DE Russell, SS Brown, TJ Fikslin, R Greene, RA Hoke , C Nally and L O’Donnell. 2011. Monitoring the Tidal Delaware River for Ambient Toxicity. Integr. Environ. Assess. Manag.: 7 (3) 466-477.
U.S. Environmental Protection Agency. 2000. Section 11. Test Method 100.1. Hyalella azteca 10-d Survivial and Growth Test for Sediments. EPA 600/R-99/064.
U.S. Environmental Protection Agency, October 2002a. Short-Term Methods For Estimating The Chronic Toxicity Of Effluents And Receiving Waters To Freshwater Organisms, Fourth Edition EPA-821-R-02-013.
U.S. Environmental Protection Agency, October 2002b. Short-Term Methods For Estimating The Chronic Toxicity Of Effluents And Receiving Waters To Marine & Estuarine Organisms, Third Edition EPA-821-R-02-014.

-83-
Assays for Estrogenic Compounds A number of the compounds detected in the 2007 pilot study have been proven or suspected to be estrogenic including hormones and nonylphenols. Therefore, as part of a weight of evidence approach to environmental assessment, the 2008 study included both chemical analysis for contaminants of emerging concern and bioassays for estrogenicity. The bioassays were included because they assess chemical mixtures and possible additive effects as well as assess toxicants with no specific analytical detection method or chemicals that are not being monitored by chemical methods used in the study. Affordable bioassays integrated with more costly analytical testing can provide a cost effective approach for monitoring surface water quality for endocrine disrupting activity (Quiros. et al., 2005). Samples were collected for estrogenicity bioassays at six sites. Ambient water samples were split and transported on the day collected to the respective laboratories for bioassays and physical-chemical analysis. Samples for estrogenic compounds assays were shipped to the University of Pittsburgh. The extraction process described in Soto et al. (2004) was followed. Each water sample was processed in 250 mL fractions. The fraction was poured onto a 1 liter separatory funnel. Fifteen mLs of dichloromethane (DCM) was added to each fraction. The separatory funnel was vigorously shaken for 2 minutes and allowed to settle for 15 minutes. The DCM is heavier than water and sinks to the bottom of the funnel where it is removed. This process was repeated two more times for a total of three extractions for each fraction. The DCM from each water sample was combined and concentrated using nitrogen and an NEVAP evaporator (Organomation Associates, Berlin, MA, USA) maintained at 40°C. The residue was suspended in 1 mL ethanol: glycerol (70:30) and stored at -20C, under nitrogen, until tested in the both assays. The efficiency of this extraction procedure was tested by adding a known quantity of tritiated estradiol to distilled water. Following the above procedure, recoveries of 88 to 92% of the tritiated estradiol was obtained. The ambient water was tested in two types of bioassaysE-screen assay and estrogen receptor binding assay (Soto et al, 2004; Eagon et al. 1980; Porter et al., 1983; Rogerson and Eagon, 1986).
E-Screen Assay
The E-Screen assay utilized three human breast cancer cell lines, MCF-7 which is mostly estrogen receptor (ER)-alpha positive, T47D which is mostly ER-beta positive and BT-20 which is ER-negative as described in Soto et al, (2004). This assay was performed in phenol-red free RPMI supplemented with charcoal-dextran stripped fetal bovine serum. After 72 hours of exposure to various concentrations (1/4000, 1/3000, 1/1500, 1/1000, 1/500, 1/200, and 1/100) of ambient river water water in steroid-free medium, the 96-well plates were stained using sulforhodamine B and absorbance at 564 nm was measured
-84-
using a plate reader. In the E-screen assay, none of the cell lines exhibited a proliferative response to extracts derived from water samples RM 50, RM 68.1, RM 80, RM90, and Blank. MCF-7 did exhibit a weak response, at higher concentrations (1/200 and 1/100) of extract derived from water samples RM 105.4 and RM 131.1. This response was muted with 1x10⁻⁶M 4-hydroxytamoxifen, an ER blocker, suggesting this is an estrogenic response. MCF-7 exhibited an antagonistic response, again at higher concentrations, to sample RM 131.1 in the presence of 1x10⁻⁹M E2. T47D exhibited an antagonistic response at higher concentrations (1/200, and 1/100) to samples RM 105.4 and RM 131.1 in the presence of 1x10⁻⁹M E2. BT-20, the negative control cell line, did not respond to any of the test conditions. This indicates the absence of non-specific growth factors and cytotoxic compounds (Table C2)

-85-
Table D2. Summary of E-Screen Assay RM 50 RM 68.1 RM 80 RM 90 RM 105.4 RM 131.1 Blank
MCF-7 - - - - -/+ -/+ -
MCF-7+E2 - - - - - * -
T47D - - - - - - -
T47D+E2 - - - - * * -
BT-20 - - - - - - -
BT-20+E2 - - - - - - -
Key: -: No Response -/+: Weak Response +: Moderate Response ++: Strong Response *: Antagonistic Response
Competitive ER-Binding Assay
The competitive in vitro estrogen receptor (ER) binding assay, previously described by Porter et al. (1983), Rogerson et al. (1986), and Eagon et al. (1980), is used to identify the presence of estrogenic compounds that can bind to the ER. Aliquots of cytosol were prepared using either mature rabbit uteri as a source of ER-alpha or male rat prostate as a source of ER-beta. The cytosols were incubated with 5nM [3H]-E2 in the absence (control) and presence of ambient river water extracts along with standards of known estrogenic potency such as estradiol (E2) and diethylstilbestrol (DES), a potent estrogen. The cytosol, [3H]-E2, and various concentrations (1/20, 1/5, 1/1) of sample were combined and allowed to incubate over night at 40C. The next morning, the bound ligand was separated from the free ligand using P6 resin spin columns. The effluent passing through the spin column was added to scintillation vials containing 8 mLs of Biosafe II counting cocktail. The disintegrations per minute (DPMs) was measured using a beta counter. The mean DPMs for each test condition were calculated. The lower the DPMs the more displacement that has taken place suggesting that the test agent is estrogenic. Generally, the greater the competition of the water, as expressed relative to the results of control binding in the absence of river water, the greater the likelihood the sample contains an estrogenic compound. The Competitive ER-alpha binding assay measures the displacement of tritiated estradiol ([3H]-E2) from estrogen receptor. The cell proliferation assay quantitating growth of hormone-sensitive cells based on three human breast cancer cell lines BT-20, MCF-7 and T47D in the presence and absence of estradiol as described in Soto et al., (2004). The screening level assays for estrogenic compounds

-86-
indicated either low concentrations or weak effects for the ambient water sampled from the tidal Delaware River. All of the river water samples tested were at least weak estrogen competitors and that some of the samples were strong competitors (Table C3). In addition, the samples are arranged based on the strength of competition in Table C4. At the 1/1 dilution of the water sample, the samples fall into three groups. Samples from RM 68.1 and the blank were weak estrogen competitors, while samples from RM 131.1, RM 105.4 and RM 50 were moderate estrogen competitors and finally, E7 was a strong competitor. Future monitoring should include assays for estrogenic compounds in fish tissue where bioaccumulation of estrogenic compounds may occur causing a stronger response to be observed.
Table D3. Summary of Competitive ER-alpha Binding Assay (DPM)
River Mile 1/20 Dilution 1/5 Dilution 1/1 Dilution
50 0.80 (-/+) 0.76 (+) 0.58 (+)
68.1 0.80 (-/+) 0.86 (-/+) 0.84 (-/+)
80 0.81 (-/+) 0.68 (+) 0.54 (+/++)
90 0.72 (+) NR NR
105.4 0.86 (-/+) 0.76 (+) 0.68 (+)
131.1 0.79 (+) 0.82 (-/+) 0.74 (+)
Blank 0.86 (-/+) 0.83 (-/+) 0.80 (-/+)
- : No Competition (100% - 90% of Control) -/+: Weak Competition (89% - 80% of Control) +: Moderate Competition (79% - 55% of Control) ++: Strong Competition (<=55% of Control) NR – not reported DPM – disintegrations per minute Table D4. Samples Arranged by Concentration and Increasing ER-alpha Competition (DPM)
1/20 Dilution 1/5 Dilution 1/1 Dilution
105.4 0.86 (-/+) RM 68.1 0.86 (-/+) RM 68.1 0.84 (-/+)
Blank 0.86 (-/+) Blank 0.83 (-/+) Blank 0.80 (-/+)
RM 80 0.86 (-/+) RM 131.1 0.82 (-/+) RM 131.1 0.74 (+)
RM 50 0.80 (-/+) RM 50 0.76 (+) RM 105.4 0.68 (+)
RM 68.1 0.80 (-/+) RM 105.4 0.76 (+) RM 50 0.58 (+)
RM 131.1 0.79 (+) RM 80 0.68 (+) RM 80 0.54 (++)

-87-
References Soto, A, J. Calabro, N. Prechtl, A. Yau, E. Orlando,A. Daxenberger, A. Kolok, L. Guillette, B. Le Bizec, I. Lange and C. Sonnenschein. 2004. Androgenic and estrogenic activity in water bodies receiving cattle feedlot effluent in eastern Nebraska, USA. Environ. Health Perspectives. Vol 112, Number 3.
Eagon PK, Fisher SE, Imhoff AF, et al: Estrogen binding proteins of male rat liver: Influences of hormonal changes. Arch. Biochem. Biophys. 201:486-499, 1980.
Porter LE, Elm MS, Van Theil DH, and Eagon PK.: Characterization and quantitation of human hepatic estrogen receptor. Gastroenterology 84:704-712, 1983.
Quiros, L R Cespedes, S LaCorte, P Viana, D Raldua, D Barcelo, and B Pina. 2005. Detection and evaluation of endocrine-disruption activity in water samples from Portuguese rivers. Environ. Toxicol. and Chem 24(2)389-395.
Rogerson BJ, and Eagon PK: A male-specific hepatic estrogen binding protein: Characteristics and binding properties. Arch. Biochem. Biophys. 250:70-85, 1986.