Container productivity at New Zealand ports · PDF fileby the port that the additional...
12
REPORT Container productivity at New Zealand ports OCTOBER 2011
Transcript of Container productivity at New Zealand ports · PDF fileby the port that the additional...

REPORTContainer productivity at New Zealand portsOCTOBER 2011
CONTAINER PRODUCTIVITY AT NEW ZEALAND PORTS ____________________________________________________________________________________________________________________
1
Introduction This report looks at container productivity data from six ports1 in New Zealand. It also compares this data with productivity results from Australian and other international ports. Brief summary of results New Zealand ports had differing results in 2009 and 2010, reflecting the differing situations for each port. Tauranga performed well for crane, ship and vessel rates, while Auckland and Otago had vessel rates comparable with Tauranga. The trends over the last two calendar years show that crane rates at New Zealand ports on average have been static, but ship and vessel rates on average have grown about four percent per annum. The container productivity of New Zealand ports appears at least comparable with, and in some cases better than, Australian and other international ports. Figure 1 CentrePort Wellington working a ship at night (left), and overlooking Otago’s Port Chalmers (right)
1 Ports of Auckland, Port of Tauranga, Port of Napier, CentrePort (Wellington), Lyttelton Port of Christchurch and Port
Otago.
CONTAINER PRODUCTIVITY AT NEW ZEALAND PORTS ____________________________________________________________________________________________________________________
2
Background There has been some debate in the New Zealand maritime transport sector about the lack of freight-related statistics in some areas. One such area is port productivity, where there has been little information apart from a few studies2.
In February this year, the Ministry of Transport (the Ministry) worked with port companies to obtain data on container productivity. Six key ports agreed to participate in this exercise. The six ports involved handle over 90 percent of container traffic through New Zealand ports.
The ports agreed to supply the following quarterly data to the government on an ongoing basis (including data back to 2009):
• quantity of containers • crane rate (the number of containers a crane lifts on and off a container ship in an hour) • ship rate (the number of containers moved on and off a container ship in an hour) • vessel rate (the number of containers moved on and off a container ship in an hour of labour) There are different ways of measuring container productivity. The data in this study is based on container productivity measures as defined by the Bureau of Infrastructure, Transport and Regional Economics in Australia (BITRE)3. The crane rate is a measure of the average productivity of container cranes at a port after allowing for operational and non-operational delays in using cranes. However, the crane rate does not reflect the productivity of a port’s container terminal operation which may use two or more cranes to load and unload containers from a ship. The ship and vessel rates help to give a better overall perspective of container productivity at a port. The Ministry has done an initial analysis of data provided by ports, and compared the results with Australian port data available in BITRE’s Waterline reports. The Ministry also found data on cranes rates for some other international ports. The Ministry recognises that this work is a limited assessment of port productivity. The Waterline reports outline a number of other productivity performance measures. However, the Ministry believes that looking at the three measures gives a good initial overview of container productivity at New Zealand ports. In addition, this work has not considered other factors involved in operating container terminals, for example, straddle carriers, information technology systems, business processes, container stacking, size of container yards and so on. Neither has it looked at productivity ‘value for money’, at the costs of improving productivity, nor whether shipping lines would be willing to pay such costs. Figure 2 Two ships being worked at the Fergusson container terminal, Ports of Auckland
2 For example, see New Zealand Port Sector Report 2010, Rockpoint Corporate Finance Ltd, and Port Performance and
Ownership, New Zealand Institute of Economic Research, August 2010. 3 http://www.bitre.gov.au/info.aspx?NodeId=166
CONTAINER PRODUCTIVITY AT NEW ZEALAND PORTS ____________________________________________________________________________________________________________________
3
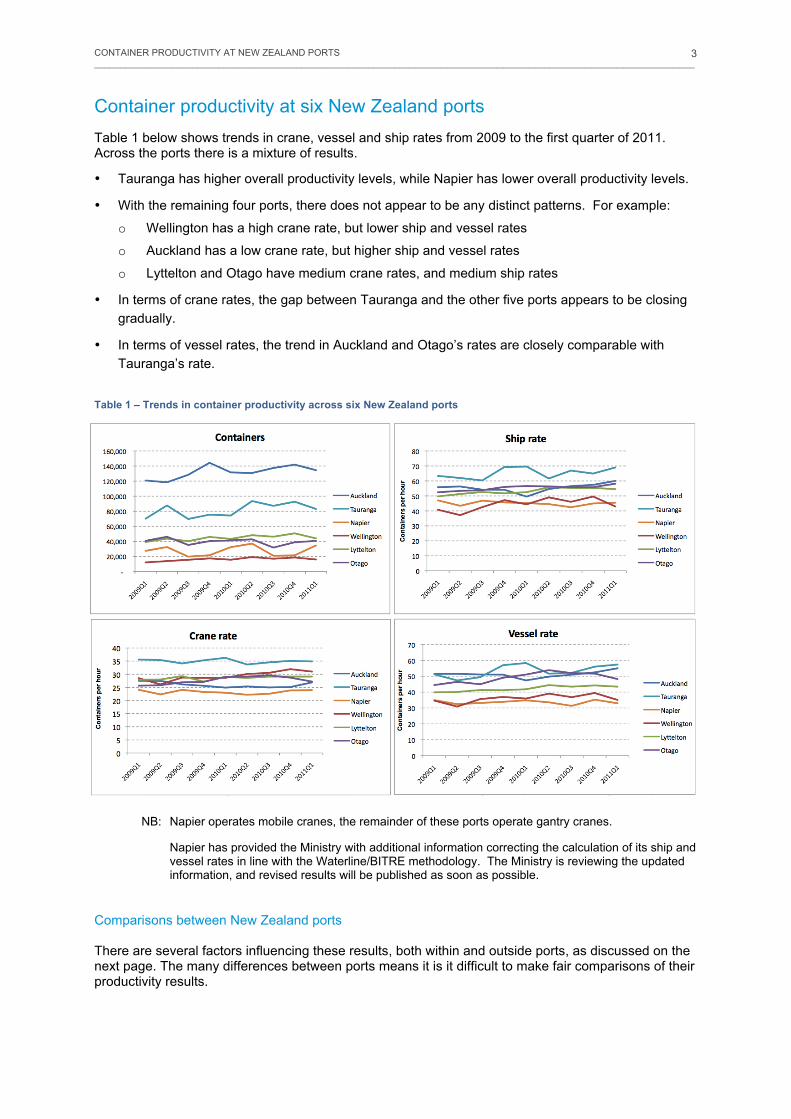
Container productivity at six New Zealand ports Table 1 below shows trends in crane, vessel and ship rates from 2009 to the first quarter of 2011. Across the ports there is a mixture of results.
• Tauranga has higher overall productivity levels, while Napier has lower overall productivity levels.
• With the remaining four ports, there does not appear to be any distinct patterns. For example:
o Wellington has a high crane rate, but lower ship and vessel rates
o Auckland has a low crane rate, but higher ship and vessel rates
o Lyttelton and Otago have medium crane rates, and medium ship rates
• In terms of crane rates, the gap between Tauranga and the other five ports appears to be closing gradually.
• In terms of vessel rates, the trend in Auckland and Otago’s rates are closely comparable with Tauranga’s rate.
Table 1 – Trends in container productivity across six New Zealand ports
NB: Napier operates mobile cranes, the remainder of these ports operate gantry cranes. Napier has provided the Ministry with additional information correcting the calculation of its ship and
vessel rates in line with the Waterline/BITRE methodology. The Ministry is reviewing the updated information, and revised results will be published as soon as possible.
Comparisons between New Zealand ports There are several factors influencing these results, both within and outside ports, as discussed on the next page. The many differences between ports means it is it difficult to make fair comparisons of their productivity results.
CONTAINER PRODUCTIVITY AT NEW ZEALAND PORTS __________________________________________________________________________________________________________
4
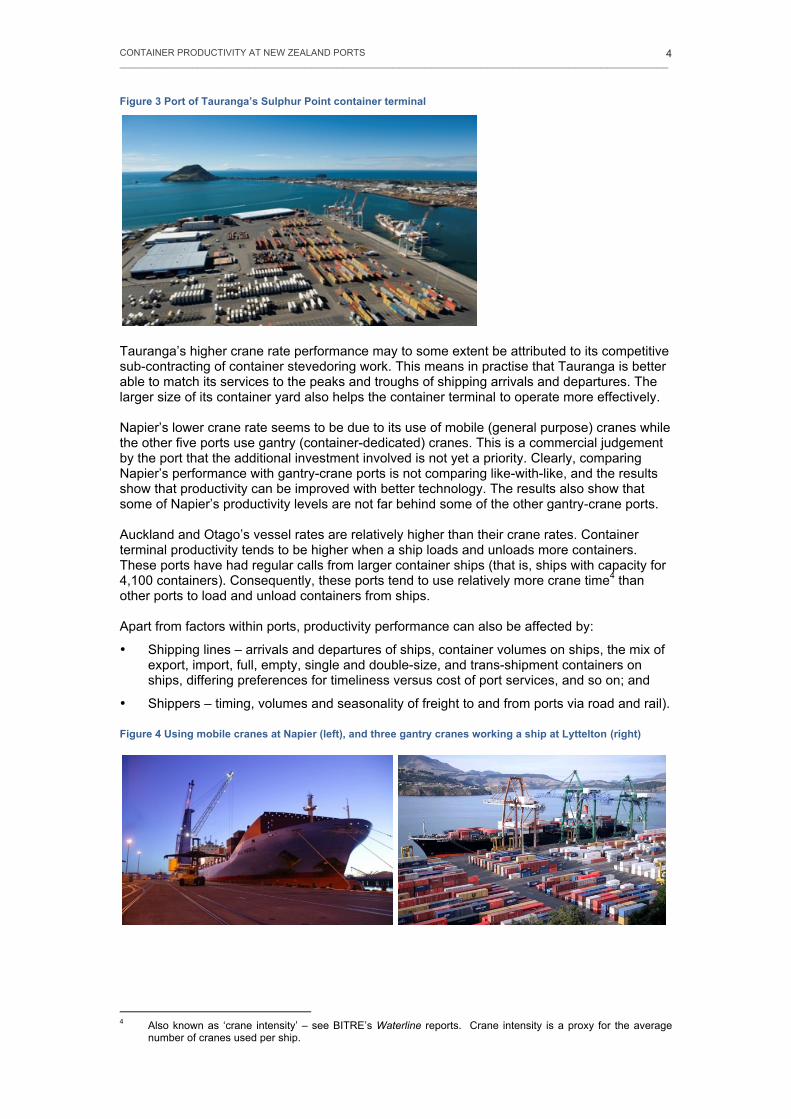
Figure 3 Port of Tauranga’s Sulphur Point container terminal
Tauranga’s higher crane rate performance may to some extent be attributed to its competitive sub-contracting of container stevedoring work. This means in practise that Tauranga is better able to match its services to the peaks and troughs of shipping arrivals and departures. The larger size of its container yard also helps the container terminal to operate more effectively. Napier’s lower crane rate seems to be due to its use of mobile (general purpose) cranes while the other five ports use gantry (container-dedicated) cranes. This is a commercial judgement by the port that the additional investment involved is not yet a priority. Clearly, comparing Napier’s performance with gantry-crane ports is not comparing like-with-like, and the results show that productivity can be improved with better technology. The results also show that some of Napier’s productivity levels are not far behind some of the other gantry-crane ports. Auckland and Otago’s vessel rates are relatively higher than their crane rates. Container terminal productivity tends to be higher when a ship loads and unloads more containers. These ports have had regular calls from larger container ships (that is, ships with capacity for 4,100 containers). Consequently, these ports tend to use relatively more crane time4 than other ports to load and unload containers from ships. Apart from factors within ports, productivity performance can also be affected by:
• Shipping lines – arrivals and departures of ships, container volumes on ships, the mix of export, import, full, empty, single and double-size, and trans-shipment containers on ships, differing preferences for timeliness versus cost of port services, and so on; and
• Shippers – timing, volumes and seasonality of freight to and from ports via road and rail). Figure 4 Using mobile cranes at Napier (left), and three gantry cranes working a ship at Lyttelton (right)
4 Also known as ‘crane intensity’ – see BITRE’s Waterline reports. Crane intensity is a proxy for the average
number of cranes used per ship.
CONTAINER PRODUCTIVITY AT NEW ZEALAND PORTS __________________________________________________________________________________________________________
5
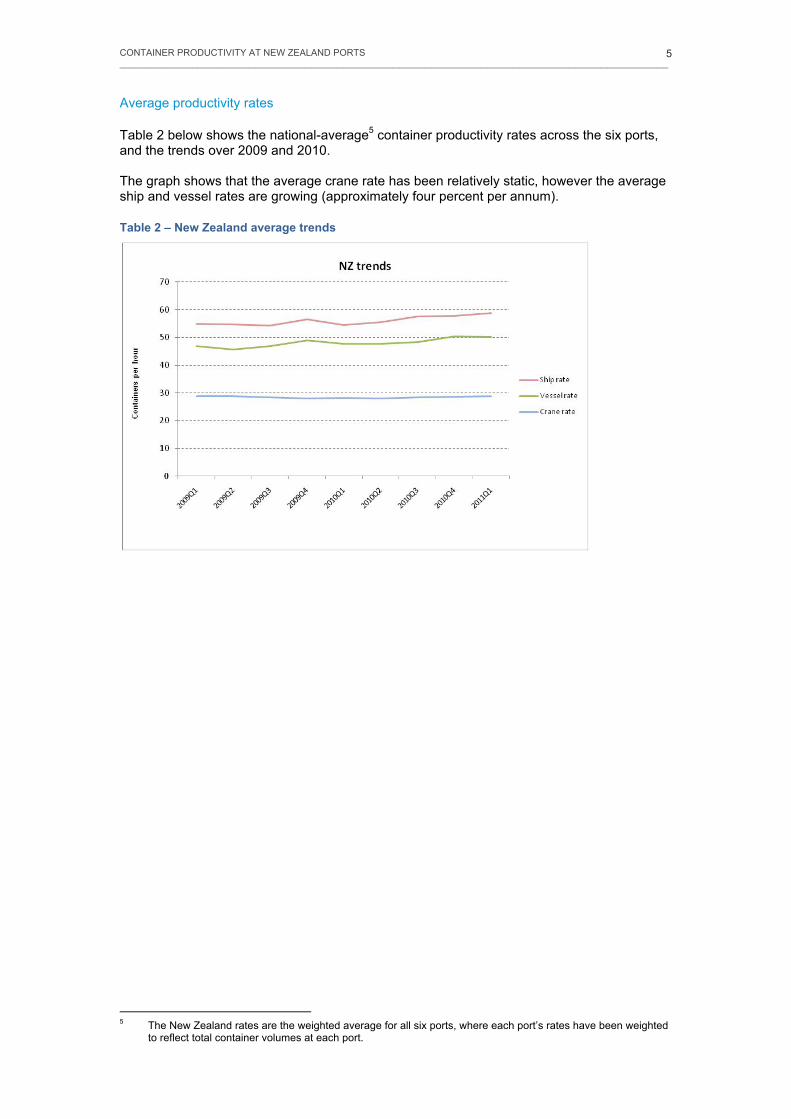
Average productivity rates Table 2 below shows the national-average5 container productivity rates across the six ports, and the trends over 2009 and 2010. The graph shows that the average crane rate has been relatively static, however the average ship and vessel rates are growing (approximately four percent per annum). Table 2 – New Zealand average trends
5 The New Zealand rates are the weighted average for all six ports, where each port’s rates have been weighted
to reflect total container volumes at each port.
CONTAINER PRODUCTIVITY AT NEW ZEALAND PORTS __________________________________________________________________________________________________________
6
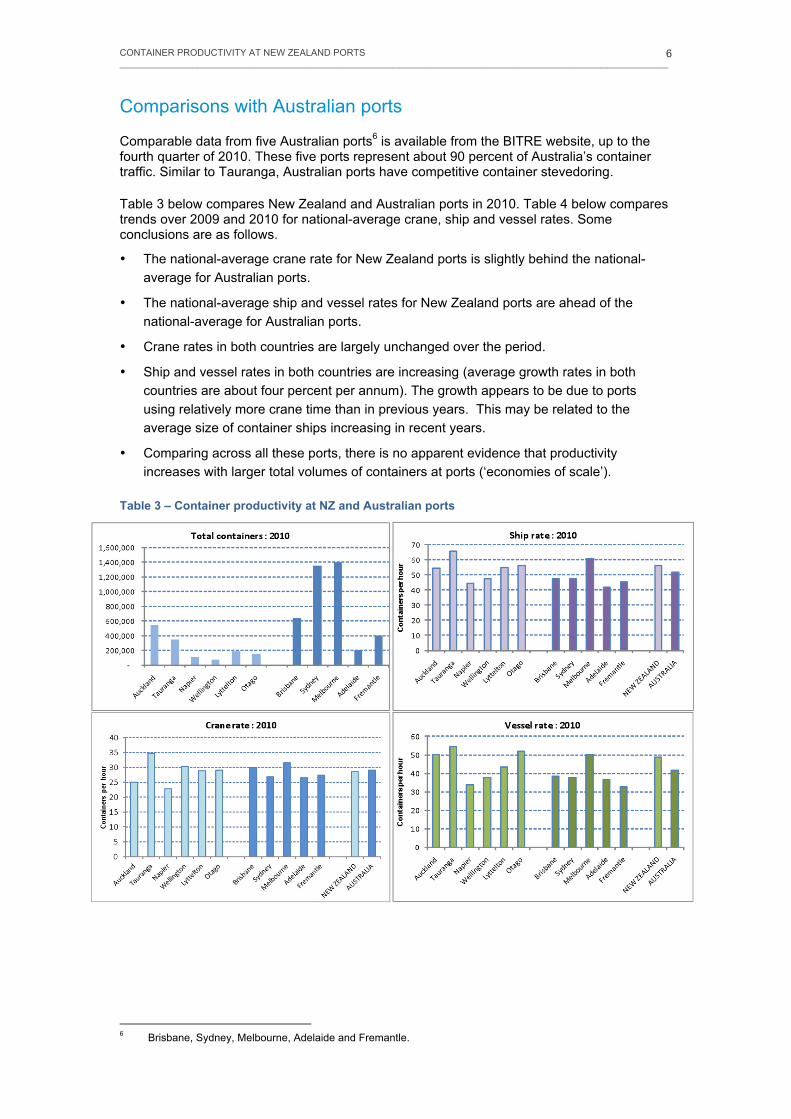
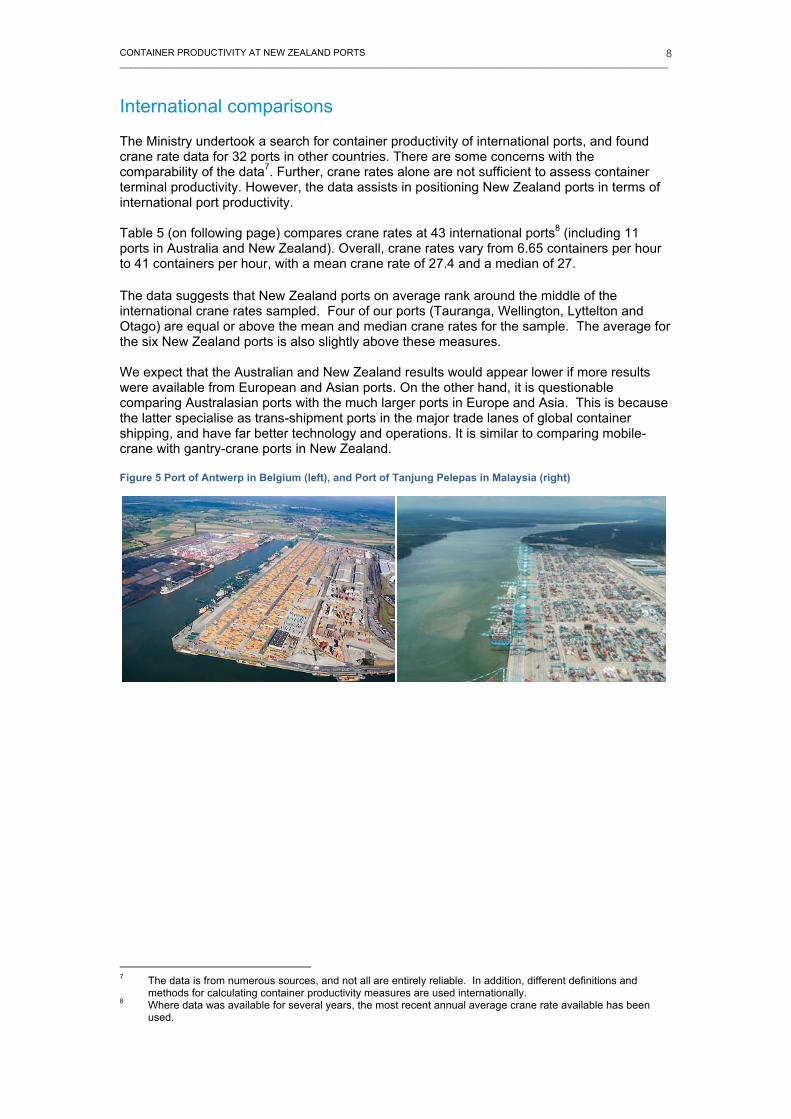
Comparisons with Australian ports Comparable data from five Australian ports6 is available from the BITRE website, up to the fourth quarter of 2010. These five ports represent about 90 percent of Australia’s container traffic. Similar to Tauranga, Australian ports have competitive container stevedoring. Table 3 below compares New Zealand and Australian ports in 2010. Table 4 below compares trends over 2009 and 2010 for national-average crane, ship and vessel rates. Some conclusions are as follows.
• The national-average crane rate for New Zealand ports is slightly behind the national-average for Australian ports.
• The national-average ship and vessel rates for New Zealand ports are ahead of the national-average for Australian ports.
• Crane rates in both countries are largely unchanged over the period.
• Ship and vessel rates in both countries are increasing (average growth rates in both countries are about four percent per annum). The growth appears to be due to ports using relatively more crane time than in previous years. This may be related to the average size of container ships increasing in recent years.
• Comparing across all these ports, there is no apparent evidence that productivity increases with larger total volumes of containers at ports (‘economies of scale’).
Table 3 – Container productivity at NZ and Australian ports
6 Brisbane, Sydney, Melbourne, Adelaide and Fremantle.
CONTAINER PRODUCTIVITY AT NEW ZEALAND PORTS __________________________________________________________________________________________________________
7
Figure 5 Gantry cranes and a view of containers at Melbourne Port
Table 4 – New Zealand and Australian average trends
CONTAINER PRODUCTIVITY AT NEW ZEALAND PORTS __________________________________________________________________________________________________________
8
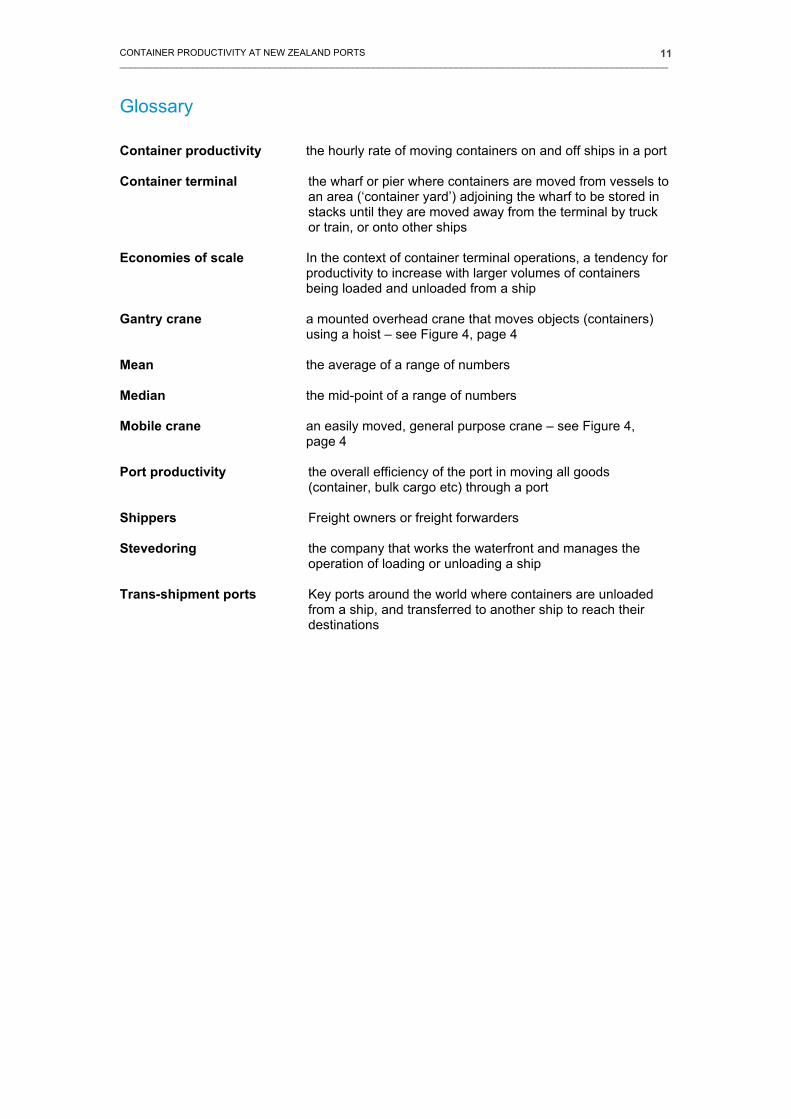
International comparisons The Ministry undertook a search for container productivity of international ports, and found crane rate data for 32 ports in other countries. There are some concerns with the comparability of the data7. Further, crane rates alone are not sufficient to assess container terminal productivity. However, the data assists in positioning New Zealand ports in terms of international port productivity. Table 5 (on following page) compares crane rates at 43 international ports8 (including 11 ports in Australia and New Zealand). Overall, crane rates vary from 6.65 containers per hour to 41 containers per hour, with a mean crane rate of 27.4 and a median of 27. The data suggests that New Zealand ports on average rank around the middle of the international crane rates sampled. Four of our ports (Tauranga, Wellington, Lyttelton and Otago) are equal or above the mean and median crane rates for the sample. The average for the six New Zealand ports is also slightly above these measures. We expect that the Australian and New Zealand results would appear lower if more results were available from European and Asian ports. On the other hand, it is questionable comparing Australasian ports with the much larger ports in Europe and Asia. This is because the latter specialise as trans-shipment ports in the major trade lanes of global container shipping, and have far better technology and operations. It is similar to comparing mobile-crane with gantry-crane ports in New Zealand. Figure 5 Port of Antwerp in Belgium (left), and Port of Tanjung Pelepas in Malaysia (right)
7 The data is from numerous sources, and not all are entirely reliable. In addition, different definitions and
methods for calculating container productivity measures are used internationally. 8 Where data was available for several years, the most recent annual average crane rate available has been
used.
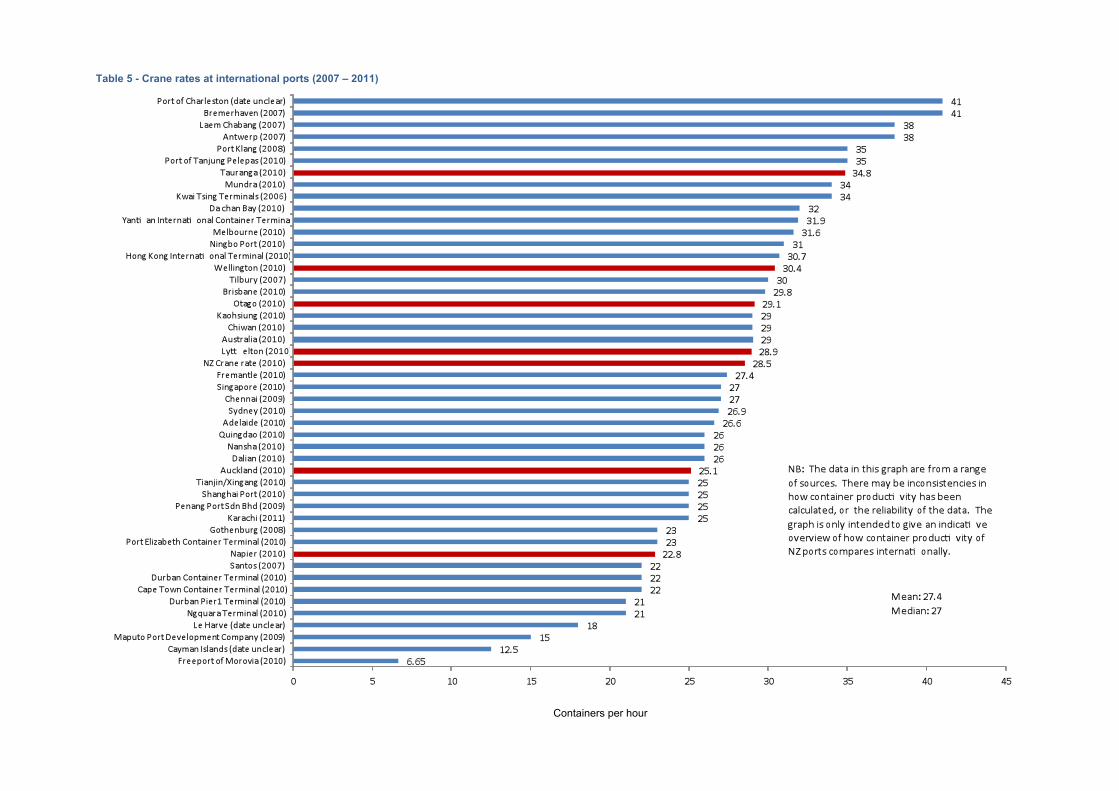
Table 5 - Crane rates at international ports (2007 – 2011)
Containers per hour

CONTAINER PRODUCTIVITY AT NEW ZEALAND PORTS __________________________________________________________________________________________________________
10
Conclusions There is a mixture of container productivity results for New Zealand’s six main container ports, reflecting the differing situations for each port. Overall, the top three container operations appear to be Auckland, Tauranga and Otago. The trend over the last two years is for national-average crane productivity to be static, but national-average ship and vessel productivity to grow about four percent per annum. This growth seems to be due to ports using relatively more crane time than in previous years, which may be related to an increasing average size of container ships. Comparison with Australian port data shows that New Zealand ports are slightly behind in terms of national-average crane rates, but ahead in terms of national-average ship and vessel rates. However, the trends in both countries are similar: the national-average rates over 2009 and 2010 for Australasian ports show static crane productivity, but ship and vessel productivity growing about four percent per annum. Productivity is better when a ship loads and unloads more containers. However, there is no apparent evidence that productivity is higher at Australian and New Zealand ports which handle larger total volumes of containers each year. New Zealand port crane productivity on average seems to rank around the middle of the international crane rates sampled. However, these comparisons may not be reliable given crane rate data from different periods and different definitions of container crane productivity in other countries. Overall, container productivity at the six New Zealand ports appears adequate. No doubt there is room for improvement, but container productivity in general is not poor. The Ministry of Transport will continue to monitor New Zealand’s port productivity with ports providing data each quarter. This data will be published in future on the Ministry’s website – www.transport.govt.nz .
CONTAINER PRODUCTIVITY AT NEW ZEALAND PORTS __________________________________________________________________________________________________________
11
Glossary Container productivity the hourly rate of moving containers on and off ships in a port Container terminal the wharf or pier where containers are moved from vessels to
an area (‘container yard’) adjoining the wharf to be stored in stacks until they are moved away from the terminal by truck or train, or onto other ships
Economies of scale In the context of container terminal operations, a tendency for
productivity to increase with larger volumes of containers being loaded and unloaded from a ship
Gantry crane a mounted overhead crane that moves objects (containers)
using a hoist – see Figure 4, page 4 Mean the average of a range of numbers Median the mid-point of a range of numbers Mobile crane an easily moved, general purpose crane – see Figure 4,
page 4 Port productivity the overall efficiency of the port in moving all goods
(container, bulk cargo etc) through a port Shippers
Freight owners or freight forwarders
Stevedoring the company that works the waterfront and manages the operation of loading or unloading a ship
Trans-shipment ports Key ports around the world where containers are unloaded
from a ship, and transferred to another ship to reach their destinations