Contagion between the united states and latinamerican ...
21
www.cya.unam.mx/index.php/cya Contaduría y Administración 65 (2) 2020, 1-21 Accounting & Management Abstract In this paper we use the financial contagion test suggested by Hatemi and Hacker (2005) in order to test the hypothesis of contagion in the main equity markets of Latin America by the US equity markets in the subprime crisis. This test is based on the bootstrapping method, which is considered robust to the absence of normality and increasing volatility (heteroskedasticity), characteristics inherent to financial markets, particularly during periods of crisis. The results show evidence of financial contagion in the subprime crisis of 2008 from the main US stock indices to some of the main financial markets in Latin America. JEL code: F36, G15, C22 Keywords: Financial contagion; Beta; Bootstrap method Resumen En este trabajo empleamos la prueba de contagio financiero sugerida por Hatemi y Hacker (2005) con el fin de probar la hipotesis de contagio en los principales mercados accionarios de America Latina por parte de los mercados accionarios de Estados Unidos en la crisis del subprime. Dicha prueba se basa * Corresponding author. E-mail address: [email protected] (D. Rodríguez Benavides). Peer Reviewundertheresponsibility of Universidad Nacional Autónoma de México. http://dx.doi.org/10.22201/fca.24488410e.2018.1628 0186- 1042/©2019 Universidad Nacional Autónoma de México, Facultad de Contaduría y Administración. This is an open access article under the CC BY-NC-SA (https://creativecommons.org/licenses/by-nc-sa/4.0/) Contagion between the united states and latinamerican stock markets: The case of the financial crisis of 2008 Contagio entre las bolsas de Estados Unidos y las de América Latina: el caso de la crisis financiera de 2008 Domingo Rodríguez Benavides* Universidad Autónoma Metropolitana, México Received August 17, 2017; accepted April 9, 2018 Available online July 30, 2019
Transcript of Contagion between the united states and latinamerican ...

www.cya.unam.mx/index.php/cya
Contaduría y Administración 65 (2) 2020, 1-21 Accounting & Management
Abstract
In this paper we use the financial contagion test suggested by Hatemi and Hacker (2005) in order to test the hypothesis of contagion in the main equity markets of Latin America by the US equity markets in the subprime crisis. This test is based on the bootstrapping method, which is considered robust to the absence of normality and increasing volatility (heteroskedasticity), characteristics inherent to financial markets, particularly during periods of crisis. The results show evidence of financial contagion in the subprime crisis of 2008 from the main US stock indices to some of the main financial markets in Latin America.
JEL code: F36, G15, C22Keywords: Financial contagion; Beta; Bootstrap method
Resumen
En este trabajo empleamos la prueba de contagio financiero sugerida por Hatemi y Hacker (2005) con el fin de probar la hipotesis de contagio en los principales mercados accionarios de America Latina por parte de los mercados accionarios de Estados Unidos en la crisis del subprime. Dicha prueba se basa
* Corresponding author.E-mail address: [email protected] (D. Rodríguez Benavides).Peer Reviewundertheresponsibility of Universidad Nacional Autónoma de México.
http://dx.doi.org/10.22201/fca.24488410e.2018.16280186- 1042/©2019 Universidad Nacional Autónoma de México, Facultad de Contaduría y Administración. This is an open access article under the CC BY-NC-SA (https://creativecommons.org/licenses/by-nc-sa/4.0/)
Contagion between the united states and latinamerican stock markets: The case of the financial crisis of 2008
Contagio entre las bolsas de Estados Unidos y las de América Latina: el caso de la crisis financiera de 2008
Domingo Rodríguez Benavides*
Universidad Autónoma Metropolitana, México
Received August 17, 2017; accepted April 9, 2018Available online July 30, 2019
2
D. Rodríguez Benavides / Contaduría y Administración 65(2) 2020, 1-21http://dx.doi.org/10.22201/fca.24488410e.2018.1628
Introduction
In the last decades, some Latin American countries such as Chile, Bolivia, and Mexico, as well as many other emerging and developing countries, have made notable efforts to open their borders to trade and make the exchange of their currencies more flexible. Along with these processes, some of them have moved towards greater integration into the international financial system. In several of these countries, capital inflows have been promoted while con-trols on capital outflows have relaxed (Agosin and French-Davis, 1993). The reason for these policies is based on the general expectation that trade and financial liberalization would boost economic activity by strengthening competitiveness, opening new export markets, attracting foreign direct investment, and stimulating domestic savings and investment. The reforms that have driven these processes have led to greater cooperation with developed countries, in particular with the United States and the European Union, leading in some cases to the formation of free trade agreements or association agreements.
However, there is no unanimous view of the consequences of this financial integration (Khallouli and Sandretto, 2012). Conversely, others highlight the fact that greater integration into international financial markets increases vulnerability to external influences, particularly investments in international capital movements. This is called “contagion risk” and means that these countries may be increasingly affected by negative external shocks (Colins and Biekpe, 2003; Bekaert et al., 2005).
The subprime crisis, for example, was not really limited to the mortgage markets of the United States. As a result of securitization, the crisis spread to the entire financial market, not only in the United States, but also to all developed countries (Horta et al. 2008). The magnitude and depth of this global crisis, considered by some to be the most severe since the 1929 crisis, as well as the possibility for some countries to be infected and to experience the consequences of its effects, have led to a resurgence of interest in financial contagion and its propagation mechanisms.
en el método de remuestreo con bootstrap, el cual se considera robusto a la ausencia de normalidad y de una creciente volatilidad (heterocedasticidad), caracteristicas inherentes a los mercados financieros particularmente en periodos de crisis. Los resultados muestran evidencia de contagio financiero en la crisis subprime de 2008 de los principales indices accionarios de Estados Unidos a algunos de los principales mercados financieros de Latinoamerica.
Código JEL: F36, G15, C22Palabras clave: Contagio financiero; Beta; Método de Bootstrap

3
D. Rodríguez Benavides / Contaduría y Administración 65(2) 2020, 1-21http://dx.doi.org/10.22201/fca.24488410e.2018.1628
There is ample literature on financial contagion and the paths it takes, but there is no universally accepted definition of contagion in the literature. However, it has historically been associated with a significant increase in cross-market linkages after a shock to one country or group of countries (Forbes and Rigobon, 2002; and Hatemi-J and Hacker, 2005).
There are several ways to define financial contagion. For example, Rigobon (2002) defines it as a significant increase in cross-market linkages after a shock to one country or group of countries. According to this definition, contagion does not occur if two markets show a high degree of financial interdependence during periods of stability and crisis (Fuchun, 2009). Other forms of contagion are the increase in the probability of crisis, which goes beyond the links in the fundamentals, and the rapid increase in co-movements between markets during crisis episodes (Forbes and Rigobon, 2012; Bekaert, Harvey and Lumsdaine, 2002).
Empirically, one way of proving contagion is through cross-correlation coefficients be-tween different geographic markets (King and Wadhwani, 1990; Lee and Kim, 1993; Calvo and Reinhart, 1996; Forbes and Rigobon, 2002; Hon et al., 2004; Pretorius and Beer, 2004). Hatemi-J and Hacker (2005) mention other methods of proving contagion, which are: (i) the use of variance-covariance matrices in the ARCH and GARCH models in order to investigate potential transmission mechanisms; (ii) those that analyze changes in co-integration vectors between countries; and (iii) those that investigate whether a variety of factors affect market susceptibility to financial crises.
It has been demonstrated that the estimation of population correlation coefficients between financial variables of different geographic markets is biased if the volatility is greater for a period of the data subject to comparison (Forbes and Rigobon, 2012). In this work an alter-native method, proposed by Hatemi-J and Hacker (2005), is used to test financial contagion. This method, instead of testing contagion between financial markets through the comparison of correlation coefficients—between periods with different volatility—, suggests finding out whether there is change in the slope coefficient in a regression of a financial variable of a market against a financial variable of another market in the period in which a period of greater volatility begins. Hatemi-J and Hacker (2005) investigated the properties of the test through Monte Carlo simulations because the classic assumptions underlying the regression model with this type of variables are hardly fulfilled. Another innovation to the empirical literature on the subject of this work is that it analyzes the possibility of financial contagion to Latin American stock markets from different stock indices in the United States considered as the most representative.

4
D. Rodríguez Benavides / Contaduría y Administración 65(2) 2020, 1-21http://dx.doi.org/10.22201/fca.24488410e.2018.1628
Brief Review of the Empirical Literature
Bodart and Candelon (2009) propose a contagion measure through the frequency domain causality test developed by Breitung and Candelon (2006). Bodart and Candelon (2009) define financial contagion as a temporary and significant increase in the links between mar-kets after a shock. One of the main advantages of the test proposed by Bodart and Candelon (2009) is that it clearly differentiates between temporary and permanent changes in the links between markets, of which the former are considered as evidence of contagion, while the latter are simply a measure of interdependence between markets. With this approach, they prove the existence of contagion between several Latin American and Asian markets during the international financial crises of 1994 and 1997. Their results show evidence of contagion in the two crises being studied; furthermore, their approach shows that during the Asian crisis, both contagion and interdependence were responsible for strengthening the links between the markets analyzed, which is not observed in the Tequila crisis. They also highlight that the spillover effects of these crises have been geographically confined to the region where the shock occurred. They also find support that contagion is more regional than global as suggested by the works of Glick and Rose (1999) and Kaminsky and Reinhart (2000).
Neaime (2002) studied a mix of countries in the Middle East and North Africa and from the Gulf Cooperation Council (GCC) during the period of 1990-2000. His results show in-creasing regional financial integration in the GCC countries and strong sensitivity to one-way shocks from the United States and the United Kingdom in the countries of the Middle East and North Africa region. Erdal and Gunduz (2001) investigated the interdependence of the Istanbul Stock Exchange with the G-7 equity markets and the stock markets of Israel, Jordan, Egypt, and Morocco, before and after the Asian crisis. Erdal and Gunduz (2002) reject the hypothesis of significant links between the Middle East and North African markets based on the Granger causality tests and found only one co-integration vector between the Istanbul Stock Exchange and the G-7 markets.
Khallouli and Sandretto (2012) investigate whether the subprime crisis in the United States contaminated the countries of the Middle East and North Africa. Khallouli and Sandretto (2012) try to find evidence of “pure contagion” instead of “shift-contagion”, for which they estimate an EGARCH Markov-Switching model, proposed by Henry (2009), to determine if the stock markets under study were contaminated. Their results provide evidence of a persistent recession that is characterized by high and low variance regimes, which coincide with what they call the third phase of the subprime crisis. Additionally, they find evidence of contagion in the mean and variance of the Middle East and North African stock markets caused by the U.S. stock market.
Dimitriou, Kenourgios, and Simos (2013) investigate the contagion effects of the global financial crisis through a multivariate model of Fractionally Integrated Asymmetric Powers
5
D. Rodríguez Benavides / Contaduría y Administración 65(2) 2020, 1-21http://dx.doi.org/10.22201/fca.24488410e.2018.1628
(FIAPARCH) of dynamic conditional correlation (DCC) in the five most important emerging markets: Brazil, Russia, India, China, and South Africa (BRICS), and in the United States in the period of 1997-2012. Dimitriou et al. (2013) identify both the duration and phases of the crisis with economic and statistical approaches. The empirical evidence provided by the authors does not confirm contagion effect for most BRICS during the early stages of the crisis, suggesting signs of isolation and disconnection. However, they find that the links resurface after the collapse of Lehman Brothers, which they attribute to a change in the risk taking of investors. Additionally, they show evidence that the correlations between the BRICS and the United States have increased since the beginning of 2009, which indicates that the dependence is greater in the bullish periods than in the bearish ones.
Fedderke and Marinkov (2016) propose a diagnostic test to determine whether financial shocks are due to the spread of idiosyncratic shocks originating in a single country (or group of countries), or if they are a reflection of market interdependence due to common factors between markets. The test proposed by Fedderke and Marinkov (2016) is given by the ratio
obtained from the ratio of the conditional and unconditional correlation coefficients among markets. They analytically demonstrate that their test statistic is robust to a series of factors such as heteroscedasticity due to the conditional volatility of the market, the impact of omitted variables, and of endogeneity between markets. The results of the tests applied to the Asian and subprime crisis with the test suggest that the propagation of shocks was mainly due to common fundamentals, while in the European crisis the propagation of shocks is idiosyncratic and centered in Cyprus, Greece, and Latvia.
Among the works that have been done on this subject in Latin American countries is the one by Chirinos (2013), who utilizes coupling and extreme events to measure the interde-pendence of the Latin American markets. Based on the theory of extreme values, the author finds that negative shocks are transmitted with a greater force in the countries of the region than the positive ones.
Bejarano, Gómez, Melo, and Torres (2015) use the Dynamic Conditional Correlation Multivariate GARCH model to prove contagion in Latin American financial markets from shocks from the United States and Europe in the period between July 4, 2001, and December 30, 2013. The results show evidence of two periods of contagion, the first corresponds to the subprime crisis in the United States and the second to the period of turbulence of European sovereign bonds recorded between 2011 and 2012.
Romero, Bonilla, Benedetti, and Serletis (2015) use the Hinich portmanteau bicorrelation test (1996) to represent non-linear events detected in Latin American stock markets. They identify the beginning, end, intensity, and persistence of non-linear episodes. The six episodes that they identified in the period from January 1994 to November 2012 were contemporaneous with international financial crises, allowing them to speculate that contagion caused by finan-

6
D. Rodríguez Benavides / Contaduría y Administración 65(2) 2020, 1-21http://dx.doi.org/10.22201/fca.24488410e.2018.1628
cial crises induces non-linear dependencies. Similarly, they observe a systematic non-linear structure in the performance series of the stock market index that has been associated with the temporary lack of market efficiency.Mollah, Quoreshi, and Zafirov (2016) find evidence of contagion in developed and emerging markets during the global and Eurozone crises through the daily MSCI US dollar-denominated indices of fifty-five equity markets for the period of 2003-2013. Their results show that conta-gion spread from the United States to global markets during both crises. They also identify that the transfer of banking risk between the United States and other countries is the key conduit for correlations between countries.
Polanco, Fernández, and Neumann carry out an analysis of the peripheral stock exchange indices of the European Union (called PIIGS) with the S&P Europe 350 (SPEURO) index used as a European market reference during the pre-crisis (2004-2007) and crisis (2008-2011) periods. They calculate a moving-window spectral correlation for stock yields and apply non-linear Granger causality tests to the coefficients of spectral decomposition of yields. Their results show that the correlation is stronger for the crisis period than for the pre-crisis period and that the stock indices of Portugal, Italy, and Spain were more interconnected with each other during the crisis than with SPEURO. They also found that the Portuguese stock market is the most sensitive and vulnerable member of the PIIGS, while the Greek stock market tends to move away from the European reference market since the financial crisis of 2008 to 2011. The non-linear causality tests indicate that in the first three wavelet scales (intra-weekly, weekly, and biweekly) the number of one-way and two-way causalities is greater during the crisis than in the pre-crisis period, which they attribute to financial contagion. Moreover, the causality analysis shows that Granger’s cause-effect direction for the periods prior to the crisis and crisis is not invariable to the time scales considered, and that the causality directions between the stock markets studied do not appear to have a preferential direction effect.
Econometric methodology
According to Hatemi-J and Hacker (2005), in order to prove contagion of a crisis in the market generated by to the market generated by , two periods are considered: a period without crisis and a period with crisis, with and being the financial variables in two different geographical markets. However, the variables are generated in a dependent manner, with a volatility that increases in the periods of crises when compared to the periods without crisis. To this end, Hatemi-J and Hacker (2005) depart from the idea of a data generating process in which the variable is determined by both the level of and by its variability, as well as one independent error term.

7
D. Rodríguez Benavides / Contaduría y Administración 65(2) 2020, 1-21http://dx.doi.org/10.22201/fca.24488410e.2018.1628
That is, the variability of is based on the variability of and on an independent error term. For these authors, there is evidence of contagion if the effect of the changes in on the changes in significantly increases during the period of crisis. In other words, there is evidence of contagion if the coefficient of the slope among the variables, in a regression of Y on , significantly increases in the period of high volatility. More explicitly, Hatemi-J and Hacker (2005) assume the following data generating process that is given by the following equations: (1)
and
(2)
where is the dependent variable, is the independent variable (with a mean equal to c), and is the error term. and are the coefficients of the parameters in the regression equation. The and subindices represent the low and high volatility periods, respectively, from which this last period arose due to the presence of a crisis. The terms of the variances , and
have time as a sub-index, thus allowing the possibility to have
heteroscedasticity in each of the associated random variables.The contagion test proposed by Hatemi-J and Hacker (2005) consists on proving the
following null hypothesis: (3)
In the following regression model:
(4)
Where is a dummy variable equal to zero for the low volatility period and takes the value of 1 in the high volatility period
. The regression presented in (4) is estimated for
the complete sample of values, that is, for both volatility periods. The coefficient repre-sents the change in the regression slope, so the null hypothesis that states that is equal to zero implies that there is no change in the relationship between and , which in turn does not mean that there was contagion from to . This null hypothesis is tested through the statistic associated with (Hatemi-J and Hacker, 2005). The procedure considers the
8
D. Rodríguez Benavides / Contaduría y Administración 65(2) 2020, 1-21http://dx.doi.org/10.22201/fca.24488410e.2018.1628
possibility that the homoscedasticity assumption is infringed because the variance of the error may differ between periods of low and high volatility
.
Following Hatemi-J, Roca, and Al-Shayeb (2014) to illustrate the bootstrapping technique used, the model set out in equation (4) is approached in terms of matrix notation as follows:
(5)
where:
is a vector ;
is a matrix of
.
is a vector of
; and
is a vector
;
As it is known, the parameter vector can be estimated through MCO in the following manner:
(6)
The implementation of the bootstrapping technique follows these 4 stages:
1. Generate time series and through the bootstrapping technique using a replacement, that is,
9
D. Rodríguez Benavides / Contaduría y Administración 65(2) 2020, 1-21http://dx.doi.org/10.22201/fca.24488410e.2018.1628
where With as the size of the bootstrapping sample. Similarly:
2. The parameter vector is estimated with the resulting series of the re-sampling through bootstrapping in the following manner:
3. Phases 1 and 2 are iterated times, Hatemi-J et al. (2014) suggest that and it is the number of iterations used in the estimations.
4. Lastly, based on the coefficients estimated by bootstrapping , the median is ob-tained. Hatemi-J et al. (2014) use the median instead of the mean arguing that the former is robust in the presence of outliers.
Bootstrapping is also used to implement the statistical significance tests of each parame-ter. The p-value of each test parameter that is represented as: is also obtained through bootstrapping. In this case, is a vector that classifies the restrictions imposed by the null hypothesis.
The p-value of the bootstrap for this hypothesis is calculated in the following manner. If the median for is a positive number, then the p-value is the percentage of elements of the resulting distribution of the bootstrap for that are negative plus those that are two times greater than the median. However, if the median for is lower than zero, then the p-value is the percentage of the resulting distribution of the bootstrap for that are positive plus the percentage of elements in that are smaller than twice the value of the median (Hatemi-J, Roca and Al-Shayeb, 2014). The cut-off point of two times the median of . generates p-values, which are comparable to the two-sided symmetric tests in a traditional test approach, as indicated by Hatemi-J and Hacker (2005).
Data and empirical results
In order to evaluate the hypothesis of financial contagion by the most representative stock markets in the United States to the main Latin American markets for the case of the subpri-me crisis, daily data were taken from the closing price from October 12, 2007, to June 16, 2009, for a total of 438 observations, in local currency and dollars, of the following stock markets: Chile (IPSA), Colombia (IGBC), Argentina (MERVAL), Brazil (IBOV), Mexico (IPyC), and the United States (NASDAQ, DJIA and S&P 500). The daily yields of each
10
D. Rodríguez Benavides / Contaduría y Administración 65(2) 2020, 1-21http://dx.doi.org/10.22201/fca.24488410e.2018.1628
market were obtained using the first logarithmic difference of the closing price of the previous indices, that is, through:
. The evolution of the yields of the stock
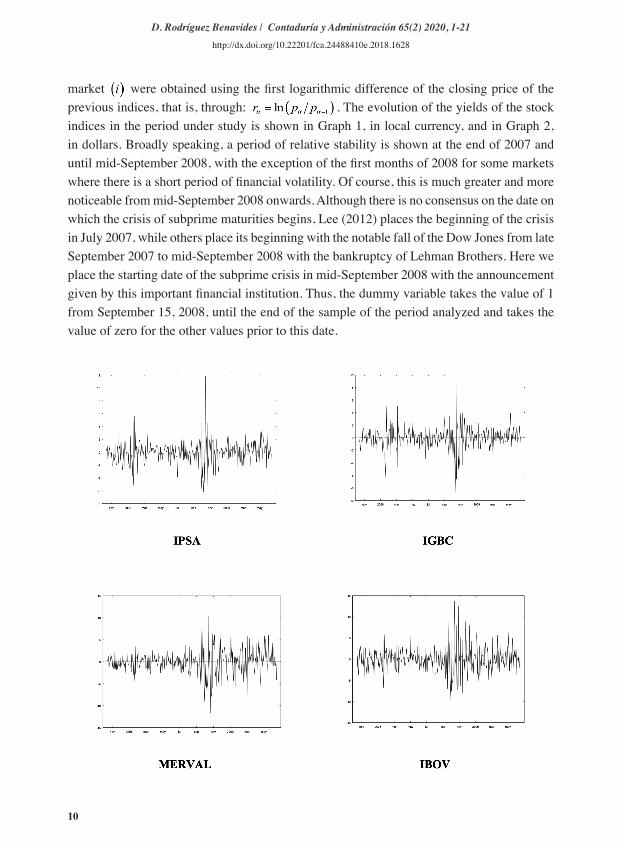
indices in the period under study is shown in Graph 1, in local currency, and in Graph 2, in dollars. Broadly speaking, a period of relative stability is shown at the end of 2007 and until mid-September 2008, with the exception of the first months of 2008 for some markets where there is a short period of financial volatility. Of course, this is much greater and more noticeable from mid-September 2008 onwards. Although there is no consensus on the date on which the crisis of subprime maturities begins, Lee (2012) places the beginning of the crisis in July 2007, while others place its beginning with the notable fall of the Dow Jones from late September 2007 to mid-September 2008 with the bankruptcy of Lehman Brothers. Here we place the starting date of the subprime crisis in mid-September 2008 with the announcement given by this important financial institution. Thus, the dummy variable takes the value of 1 from September 15, 2008, until the end of the sample of the period analyzed and takes the value of zero for the other values prior to this date.

11
D. Rodríguez Benavides / Contaduría y Administración 65(2) 2020, 1-21http://dx.doi.org/10.22201/fca.24488410e.2018.1628
Figure 1.Daily yields of the Latin American stock markets from October 12, 2007, to June 16, 2009 (Data using local currency).

12
D. Rodríguez Benavides / Contaduría y Administración 65(2) 2020, 1-21http://dx.doi.org/10.22201/fca.24488410e.2018.1628
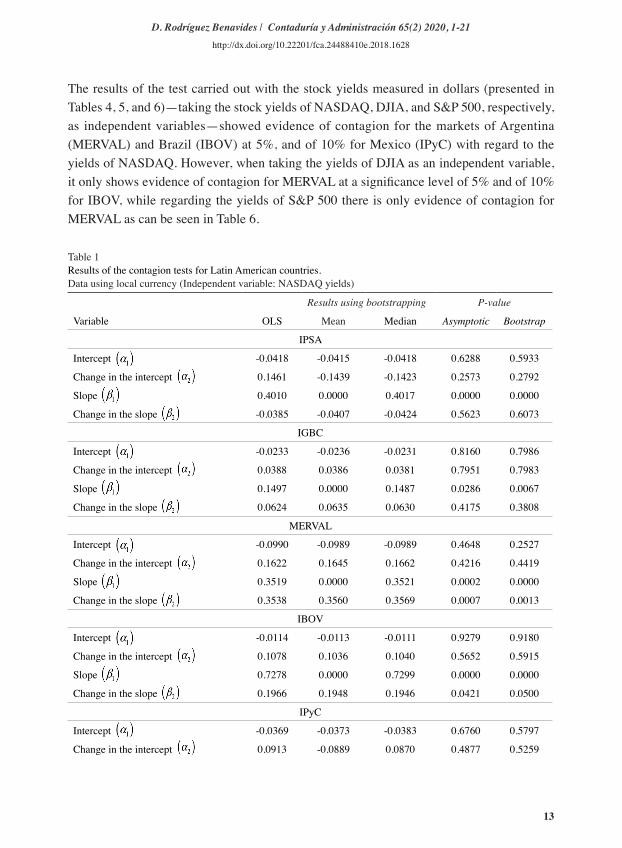
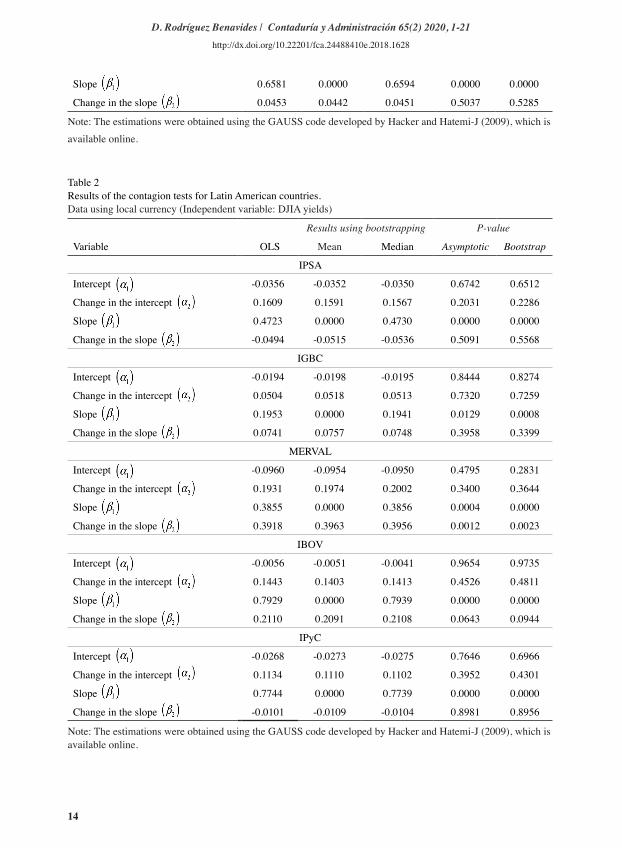
The results of the model proposed in equation (4) to carry out the subprime crisis contagion test are presented in Tables 1, 2, and 3, taking the NASDAQ, the DJIA, and the S&P 500 as independent stock markets, respectively, or on which the rest of the stock markets depend on for data in local currency; while Tables 4, 5, and 6 show the yields in dollars, respectively. When taking the NASDAQ stock yields as dependent variables, the results of the test with local currency yields show evidence of contagion only for the Argentine stock market yields (MERVAL), while the Brazilian stock market yields (IBOV) apparently became contagious from the asymptotic test result. However, such result is discarded from the p-value resulting from the bootstrapping technique. Whereas when it is taken as a variable dependent on the share yields of the DJIA and the S&P 500, the results are practically the same since there is only evidence of contagion for the MERVAL at the significance level of 5%, and of 10% for the IBOVESPA with respect to the DJIA.
Figure 2.Daily yields of the Latin American stock markets from October 12, 2007, to June 16, 2009 (Data in USD).
13
D. Rodríguez Benavides / Contaduría y Administración 65(2) 2020, 1-21http://dx.doi.org/10.22201/fca.24488410e.2018.1628
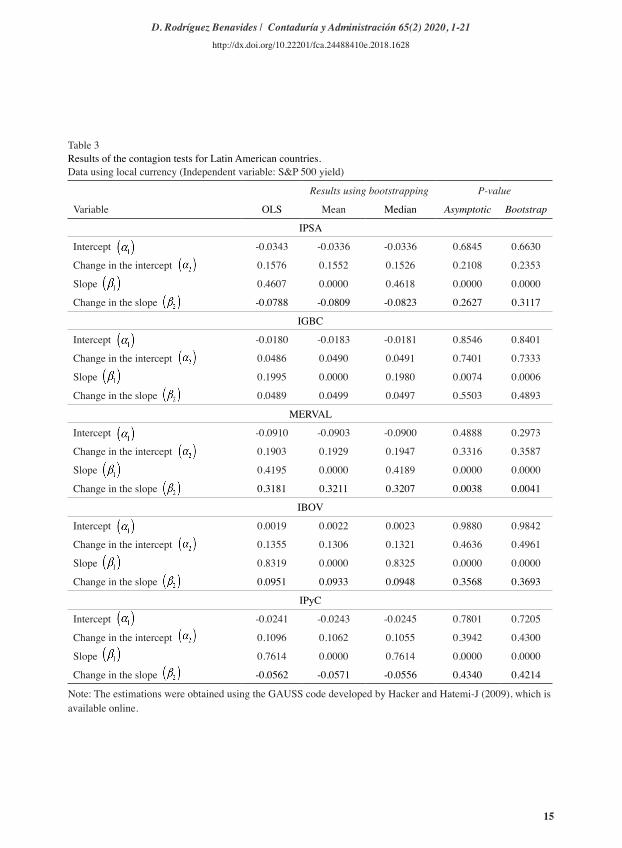
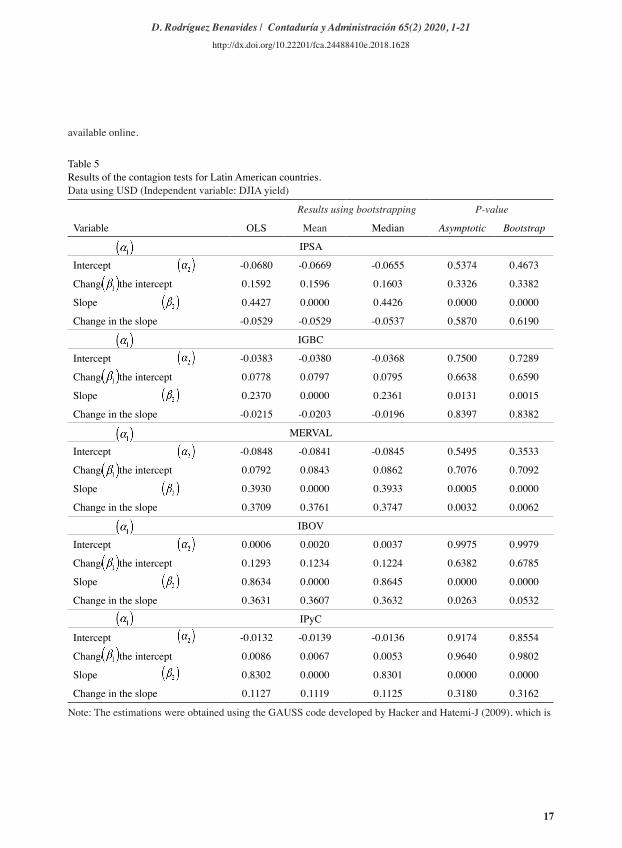
The results of the test carried out with the stock yields measured in dollars (presented in Tables 4, 5, and 6)—taking the stock yields of NASDAQ, DJIA, and S&P 500, respectively, as independent variables—showed evidence of contagion for the markets of Argentina (MERVAL) and Brazil (IBOV) at 5%, and of 10% for Mexico (IPyC) with regard to the yields of NASDAQ. However, when taking the yields of DJIA as an independent variable, it only shows evidence of contagion for MERVAL at a significance level of 5% and of 10% for IBOV, while regarding the yields of S&P 500 there is only evidence of contagion for MERVAL as can be seen in Table 6.
Table 1Results of the contagion tests for Latin American countries.Data using local currency (Independent variable: NASDAQ yields)
Results using bootstrapping P-value
Variable OLS Mean Median Asymptotic Bootstrap
IPSA
Intercept -0.0418 -0.0415 -0.0418 0.6288 0.5933
Change in the intercept 0.1461 -0.1439 -0.1423 0.2573 0.2792
Slope 0.4010 0.0000 0.4017 0.0000 0.0000
Change in the slope -0.0385 -0.0407 -0.0424 0.5623 0.6073
IGBC
Intercept -0.0233 -0.0236 -0.0231 0.8160 0.7986
Change in the intercept 0.0388 0.0386 0.0381 0.7951 0.7983
Slope 0.1497 0.0000 0.1487 0.0286 0.0067
Change in the slope 0.0624 0.0635 0.0630 0.4175 0.3808
MERVAL
Intercept -0.0990 -0.0989 -0.0989 0.4648 0.2527
Change in the intercept 0.1622 0.1645 0.1662 0.4216 0.4419
Slope 0.3519 0.0000 0.3521 0.0002 0.0000
Change in the slope 0.3538 0.3560 0.3569 0.0007 0.0013
IBOV
Intercept -0.0114 -0.0113 -0.0111 0.9279 0.9180
Change in the intercept 0.1078 0.1036 0.1040 0.5652 0.5915
Slope 0.7278 0.0000 0.7299 0.0000 0.0000
Change in the slope 0.1966 0.1948 0.1946 0.0421 0.0500
IPyC
Intercept -0.0369 -0.0373 -0.0383 0.6760 0.5797
Change in the intercept 0.0913 -0.0889 0.0870 0.4877 0.5259
14
D. Rodríguez Benavides / Contaduría y Administración 65(2) 2020, 1-21http://dx.doi.org/10.22201/fca.24488410e.2018.1628
Slope 0.6581 0.0000 0.6594 0.0000 0.0000
Change in the slope 0.0453 0.0442 0.0451 0.5037 0.5285
Note: The estimations were obtained using the GAUSS code developed by Hacker and Hatemi-J (2009), which is available online.
Table 2Results of the contagion tests for Latin American countries.Data using local currency (Independent variable: DJIA yields)
Results using bootstrapping P-value
Variable OLS Mean Median Asymptotic Bootstrap
IPSA
Intercept -0.0356 -0.0352 -0.0350 0.6742 0.6512
Change in the intercept 0.1609 0.1591 0.1567 0.2031 0.2286
Slope 0.4723 0.0000 0.4730 0.0000 0.0000
Change in the slope -0.0494 -0.0515 -0.0536 0.5091 0.5568
IGBC
Intercept -0.0194 -0.0198 -0.0195 0.8444 0.8274
Change in the intercept 0.0504 0.0518 0.0513 0.7320 0.7259
Slope 0.1953 0.0000 0.1941 0.0129 0.0008
Change in the slope 0.0741 0.0757 0.0748 0.3958 0.3399
MERVAL
Intercept -0.0960 -0.0954 -0.0950 0.4795 0.2831
Change in the intercept 0.1931 0.1974 0.2002 0.3400 0.3644
Slope 0.3855 0.0000 0.3856 0.0004 0.0000
Change in the slope 0.3918 0.3963 0.3956 0.0012 0.0023
IBOV
Intercept -0.0056 -0.0051 -0.0041 0.9654 0.9735
Change in the intercept 0.1443 0.1403 0.1413 0.4526 0.4811
Slope 0.7929 0.0000 0.7939 0.0000 0.0000
Change in the slope 0.2110 0.2091 0.2108 0.0643 0.0944
IPyC
Intercept -0.0268 -0.0273 -0.0275 0.7646 0.6966
Change in the intercept 0.1134 0.1110 0.1102 0.3952 0.4301
Slope 0.7744 0.0000 0.7739 0.0000 0.0000
Change in the slope -0.0101 -0.0109 -0.0104 0.8981 0.8956
Note: The estimations were obtained using the GAUSS code developed by Hacker and Hatemi-J (2009), which is available online.
15
D. Rodríguez Benavides / Contaduría y Administración 65(2) 2020, 1-21http://dx.doi.org/10.22201/fca.24488410e.2018.1628
Table 3Results of the contagion tests for Latin American countries.Data using local currency (Independent variable: S&P 500 yield)
Results using bootstrapping P-value
Variable OLS Mean Median Asymptotic Bootstrap
IPSA
Intercept -0.0343 -0.0336 -0.0336 0.6845 0.6630
Change in the intercept 0.1576 0.1552 0.1526 0.2108 0.2353
Slope 0.4607 0.0000 0.4618 0.0000 0.0000
Change in the slope -0.0788 -0.0809 -0.0823 0.2627 0.3117
IGBC
Intercept -0.0180 -0.0183 -0.0181 0.8546 0.8401
Change in the intercept 0.0486 0.0490 0.0491 0.7401 0.7333
Slope 0.1995 0.0000 0.1980 0.0074 0.0006
Change in the slope 0.0489 0.0499 0.0497 0.5503 0.4893
MERVAL
Intercept -0.0910 -0.0903 -0.0900 0.4888 0.2973
Change in the intercept 0.1903 0.1929 0.1947 0.3316 0.3587
Slope 0.4195 0.0000 0.4189 0.0000 0.0000
Change in the slope 0.3181 0.3211 0.3207 0.0038 0.0041
IBOV
Intercept 0.0019 0.0022 0.0023 0.9880 0.9842
Change in the intercept 0.1355 0.1306 0.1321 0.4636 0.4961
Slope 0.8319 0.0000 0.8325 0.0000 0.0000
Change in the slope 0.0951 0.0933 0.0948 0.3568 0.3693
IPyC
Intercept -0.0241 -0.0243 -0.0245 0.7801 0.7205
Change in the intercept 0.1096 0.1062 0.1055 0.3942 0.4300
Slope 0.7614 0.0000 0.7614 0.0000 0.0000
Change in the slope -0.0562 -0.0571 -0.0556 0.4340 0.4214
Note: The estimations were obtained using the GAUSS code developed by Hacker and Hatemi-J (2009), which is available online.

16
D. Rodríguez Benavides / Contaduría y Administración 65(2) 2020, 1-21http://dx.doi.org/10.22201/fca.24488410e.2018.1628
Table 4Results of the contagion tests for Latin American countries.Data using USD (Independent variable: NASDAQ yields)
Results using bootstrapping P-value
Variable OLS Mean Median Asymptotic Bootstrap
IPSA
Intercept -0.0752 -0.0742 -0.0744 0.5003 0.4138
Change in the intercept 0.1472 0.1462 0.1465 0.3763 0.3823
Slope 0.3589 0.0000 0.3582 0.0000 0.0000
Change in the slope -0.0752 -0.0742 -0.0744 0.5003 0.4138
IGBC
Intercept -0.0442 -0.0438 -0.0427 0.7155 0.6925
Change in the intercept 0.0707 0.0709 0.0706 0.6956 0.6950
Slope 0.1684 0.0000 0.1685 0.0416 0.0088
Change in the slope -0.0040 -0.0020 -0.0012 0.9657 0.9884
MERVAL
Intercept -0.0877 -0.0876 -0.0878 0.5343 0.3290
Change in the intercept 0.0491 0.0518 -0.0542 0.8155 0.8085
Slope 0.3606 0.0000 0.3612 0.0002 0.0000
Change in the slope -0.0877 -0.0876 -0.0878 0.5343 0.3290
IBOV
Intercept -0.0047 -0.0041 -0.0018 0.9794 0.9901
Change in the intercept 0.0815 0.0763 0.0749 0.7647 0.7897
Slope 0.8043 0.0000 0.8060 0.0000 0.0000
Change in the slope 0.3121 0.3087 0.3113 0.0265 0.0368
IPyC
Intercept -0.0239 -0.0245 -0.0254 0.8493 0.7344
Change in the intercept -0.0199 -0.0222 -0.0236 0.9153 0.9085
Slope 0.7082 0.0000 0.7098 0.0000 0.0000
Change in the slope 0.1648 0.1631 0.1627 0.0877 0.0920
Note: The estimations were obtained using the GAUSS code developed by Hacker and Hatemi-J (2009), which is
17
D. Rodríguez Benavides / Contaduría y Administración 65(2) 2020, 1-21http://dx.doi.org/10.22201/fca.24488410e.2018.1628
available online.
Table 5Results of the contagion tests for Latin American countries.Data using USD (Independent variable: DJIA yield)
Results using bootstrapping P-value
Variable OLS Mean Median Asymptotic Bootstrap
IPSA
Intercept -0.0680 -0.0669 -0.0655 0.5374 0.4673
Change in the intercept 0.1592 0.1596 0.1603 0.3326 0.3382
Slope 0.4427 0.0000 0.4426 0.0000 0.0000
Change in the slope -0.0529 -0.0529 -0.0537 0.5870 0.6190
IGBC
Intercept -0.0383 -0.0380 -0.0368 0.7500 0.7289
Change in the intercept 0.0778 0.0797 0.0795 0.6638 0.6590
Slope 0.2370 0.0000 0.2361 0.0131 0.0015
Change in the slope -0.0215 -0.0203 -0.0196 0.8397 0.8382
MERVAL
Intercept -0.0848 -0.0841 -0.0845 0.5495 0.3533
Change in the intercept 0.0792 0.0843 0.0862 0.7076 0.7092
Slope 0.3930 0.0000 0.3933 0.0005 0.0000
Change in the slope 0.3709 0.3761 0.3747 0.0032 0.0062
IBOV
Intercept 0.0006 0.0020 0.0037 0.9975 0.9979
Change in the intercept 0.1293 0.1234 0.1224 0.6382 0.6785
Slope 0.8634 0.0000 0.8645 0.0000 0.0000
Change in the slope 0.3631 0.3607 0.3632 0.0263 0.0532
IPyC
Intercept -0.0132 -0.0139 -0.0136 0.9174 0.8554
Change in the intercept 0.0086 0.0067 0.0053 0.9640 0.9802
Slope 0.8302 0.0000 0.8301 0.0000 0.0000
Change in the slope 0.1127 0.1119 0.1125 0.3180 0.3162
Note: The estimations were obtained using the GAUSS code developed by Hacker and Hatemi-J (2009), which is

18
D. Rodríguez Benavides / Contaduría y Administración 65(2) 2020, 1-21http://dx.doi.org/10.22201/fca.24488410e.2018.1628
available online.
Table 6Results obtained from the contagion tests for Latin American countries.Data in USD (Independent variable: S&P 500 yields)
Results using bootstrapping P-value
Variable OLS Mean Median Asymptotic Bootstrap
IPSA
Intercept -0.0683 -0.0668 -0.0669 0.5336 0.4641
Change in the intercept 0.1595 0.1587 0.1593 0.3293 0.3389
Slope 0.4152 0.0000 0.4147 0.0000 0.0000
Change in the slope -0.0522 -0.0524 -0.0528 0.5674 0.5860
IGBC
Intercept -0.0394 -0.0391 -0.0381 0.7425 0.7220
Change in theintercept 0.0791 0.0800 0.0792 0.6582 0.6569
Slope 0.2111 0.0000 0.2107 0.0201 0.0026
Change in theslope -0.0094 -0.0083 -0.0078 0.9250 0.9277
MERVAL
Intercept -0.0795 -0.0795 -0.0787 0.5625 0.3765
Change in the intercept 0.0766 0.0766 0.0798 0.7081 0.7098
Slope 0.4294 0.4295 0.0000 0.0000 0.0000
Change in the slope 0.2987 0.2987 0.3020 0.0092 0.0091
IBOV
Intercept 0.0098 0.0109 0.0133 0.9563 0.9195
Change in the intercept 0.1183 0.1116 0.1094 0.6586 0.7042
Slope 0.9185 0.0000 0.9194 0.0000 0.0000
Change in the slope 0.2133 0.2109 0.2134 0.1543 0.1857
IPyC
Intercept -0.0104 -0.0108 -0.0112 0.9335 0.8791
Change in the intercept 0.0049 0.0015 0.0002 0.9789 0.9994
Slope 0.8162 0.0000 0.8159 0.0000 0.0000
Change in the slope 0.0570 0.0558 0.0570 0.5813 0.5544
Note: The estimations were obtained using the GAUSS code developed by Hacker and Hatemi-J (2009), which is available online.
From the results of the contagion tests carried out from the more representative markets of the United States towards the main stock markets of Latin America, it stands out that most of the estimated intercepts
were negative—with the exception of the Brazilian stock
19
D. Rodríguez Benavides / Contaduría y Administración 65(2) 2020, 1-21http://dx.doi.org/10.22201/fca.24488410e.2018.1628
market (IBOV) when it interacts with S&P 500 with data in the local currency and with DJIA and S&P 500 in dollars—suggesting that the majority of the estimated average yields during the study period are negative; nevertheless, none of them were significant. Something similar happens with the coefficient that measures the change in the intercept
, which is
mostly positive and never resulted statistically significant. However, something interesting is that the coefficient that measures the slope
, regardless of whether the stock yields are
considered as an independent variable, was positive and significant, which can be interpreted as evidence of a generalized interdependence of the yields of the stock markets considered in the study. While the estimated coefficients of changes in the slope
were positive and
negative, and their significance was evaluated in order to prove the contagion hypothesis, as was previously discussed.
Another result that must be emphasized is the fact that the results of the contagion test are practically the same when compared to the inference that can be extracted from the asymp-totic tests , with the exception of the tests performed for the IBOVESPA when related to the NASDAQ, with yields in local currency, and with the DJIA, with yields measured in dollars, since in both cases the result of the contagion test changes from apparently having evidence of contagion with the asymptotic test to rejecting it with the bootstrapping method.
Lastly, it is important to consider that the currency does not seem to have an important role in the specification of the financial contagion tests between the yields of the stock markets, since the results are not modified whether said yields are considered in the local currency or in USD.
Conclusions
This work uses the financial contagion test proposed by Hatemi and Hacker (2005) to test contagion in the main Latin American stock markets caused by the stock markets of the Uni-ted States. This entails determining whether the slope coefficient changes in a regression of the stock yields of one country and is reflected in the stock yields of another country. In said test there is evidence of contagion if the slope coefficient increases during the crisis period.
Hatemi and Hacker (2005) concluded that it is not possible to obtain valid inference in this test if it is based on asymptotic distribution t . Therefore, they suggested an alternative approach that is based on resampling through bootstrapping, which they argue has better properties, with one of its main qualities being that it is robust in the presence of heteroscedasticity, and it presents lack of normality in the residues of the estimated model. This is the method used in this work.
The estimated beta coefficient of the slope was statistically significant in all the models in which the test was carried out, suggesting that there is a permanent dependence of the Latin American markets that were considered with regard to the main stock indices of the United States.However, there was evidence of financial contagion of the subprime crisis with yields measu-
20
D. Rodríguez Benavides / Contaduría y Administración 65(2) 2020, 1-21http://dx.doi.org/10.22201/fca.24488410e.2018.1628
red in dollars in the Argentine market (MERVAL) at a significance level of 5% with respect to the three U.S. stock markets considered. In the Brazilian IBOVESPA, the level is at 10% significance with respect to the NASDAQ and the DJIA.
Similar results were found with the yields measured in dollars, since there was also evi-dence of contagion for MERVAL and IBOVESPA deriving from NASDAQ and DJIA at a significance level of 5%, for IPyC in Mexico deriving from NASDAQ at a significance level of 10%, and for Argentina deriving from S&P 500 also at a significance level of 5%.
Thus, the results of the contagion test used reveal evidence of contagion in the markets of Argentina and Brazil; in the case of the former the evidence is greater because regardless of the stock index of the United States considered in the test, the result is the same. Meanwhile, for Brazil the result depends largely on the stock index of the United States. Paradoxically, in the case of Mexico, and despite its high degree of commercial integration with its northern neighbor, the evidence of contagion in this test is scarce and was only found with respect to the least representative index of the three considered for the United States.
These results are consistent with those reported in other studies and with other methodo-logies used for Argentina and Brazil, according to Naoui, Liouane, and Brahim (2010), but not for Mexico. The results are also consistent in the case of Argentina and Brazil as found by Bejarano, Gómez, Melo, and Torres (2015), but not for Brazil, Chile, and Mexico.
The above results suggest evidence of contagion in the Argentine and Brazilian stock markets by the stock market of the United States. This may be caused by the way in which the markets are integrated or interrelated and the way in which information is quickly processed in financial markets. However, some other possible interrelationships between these markets revealing how financial contagion spreads between major stock markets to emerging markets remain to be addressed.
Referencias
Bekaert,G., Harvey,C.R., & Lumsdaine,R.L. (2002). Dating the integration of world equity markets. Journal of Financial Economics,65,203–247.
Bekaert G., Harvey C. and Lundblad C. (2005). Does financial liberalisation spur growth?.Journal of Financial Economics, 77(1), pp. 3-55.
Bodart, V., Candelon, B. (2009).Evidence of interdependence and contagion using a frequency domain framework.Emerging Markets Review, 10, 140–150.
Breitung, J. and Candelon, B. (2006). Testing for short and long-run causality: a frequency domain approach. Jour-nal of Econometrics, 12, 363–378.
Calvo, S. and Reinhart, C. M. (1996). Capital flows to Latin America: is there evidence of contagion effects?, in Private Capital Flows to Emerging Markets After the Mexican Crisis. (Eds) G. A. Calvo, M. Goldstein and E.
Hochreiter, Institute for International Economics, Washington, DC.
21
D. Rodríguez Benavides / Contaduría y Administración 65(2) 2020, 1-21http://dx.doi.org/10.22201/fca.24488410e.2018.1628
Collins D. and Biekpe N. (2003). Contagion: a fear for African equity markets?.Journal of Economics& Business, 55(5), pp. 405-426.
Chirinos G., M. (2013). Medición de contagio e interdependencia financieros mediante cópulas y eventos extremos en los países de la América Latina. El Trimestre Económico. Vol. LXXX (1), núm. 317, pp. 169-206
Dimitriou, D., Kenourgios, D., Simos, T. (2013). Global financial crisis and emerging stock market contagion: A multivariate FIAPARCH–DCC approach. International Review of Financial Analysis, 30, 46–56.
Dooley, M., and Hutchison, M. (2009). Transmission of the U.S. subprime crisis to emerging markets: Evidence on the decoupling–recoupling hypothesis. Journal of International Money and Finance, 28, 1331–1349.
Erdal, F. and L. Gunduz (2001).An Empirical Investigation of the Interdependence of Istanbul Stock Exchange with Selected Stock Markets. An International Conference: Economies and Business in Transition, Global Business and Technology Association, Istanbul.
Fedderke, J. W. and Marinkov, M. (2016) Diagnosing the Source of Financial Market Shocks: An Application to the Asian, Subprime and European Financial Crises. Pacific Economic Review, doi: 10.1111/1468-0106.12162.
Forbes, K., Rigobon, R. (2000). Contagion in Latin America: definitions, measurement, and policy implications. NBER Working Paper, p. 7885.
Forbes, K. J. and Rigobon, R. (2002). No contagion, only interdependence: measuring stock market comovements. Journal of Finance, LVII, pp. 2223–61.
Fuchun, L. (2009). Testing for financial contagion with applications to the Canadian banking system. Bank of Canada, Working papers 09-14
Glick, R., Rose, A.K. (1999). Contagion and crisis. Why are currency crises regional? Journal of International Money and Finance 18, 603–617.
Hacker, R.S., Hatemi-J, A. (2009).ContagT: GAUSS module to implement a pairwise bootstrap test for contagion. Statistical Software Components, G00007. Boston College Department of Economics (Available online).
Hatemi-J, A., Hacker, R.S. (2005).Analternative method to test for contagion with an application to the Asian finan-cial crisis. Appl.Financ.Econ.Lett. 1 (6), 343–347.
Hatemi-J, A., Roca, E. & Al-Shayeb, A. (2014).How Integrated are Real Estate Markets with the World Market? Evidence from Case-Wise Bootstrap Analysis. Economic Modelling, Volume 37, pp. 137-142.
Hon, M. T., Strauss, J. and Yong, S. K. (2004). Contagion in financial markets after September 11: myth or reality?, Journal of Financial Research, 27, pp. 95–114.
Horta P., Mendes C. and Vieira I. (2008). Contagion effects of the US subprime crisis on developed countries. CEFAGE-UE Working Paper 2008/08.
Kaminsky, G. and Reinhart, C. (2000). On crises, contagion, and confusion. Journal of International Economics 51, 145–168.
Khallouli, Wajih and René Sandretto (2012).Testing for “Contagion” of the Subprime Crisis on the Middle East and North African Stock Markets: A Markov Switching EGARCH Approach. Journal of Economic Integration. Vol. 27, No. 1, pp. 134-166.
King, M. A. and Wadhwani, S. (1990). Transmission of volatility between stock markets.Review of Financial Stu-dies, 3, 5–33.
Lee, S. B. and Kim, J. K. (1993). Does the October 1987 crash strengthen the co-movements among national stock markets?.Review of Financial Economics, 3, 89–102.
Lee, H.Y. (2012). Contagion in international stock markets during the subprime mortgage crisis. International Journal of Economics and Financial Issues 2: 41–53
Neaime, S. (2002).Liberalization and Financial Integration of MENA Stock Markets. Paper presented at the 9th Economic Research Forum Meeting, American University in Sharjah, United Arab Emirates.
Pretorius, A. and Beer, J. (2004). Contagion in Africa: South Africa and a troubled neighbour, Zimbabwe. Economic Modelling, 27, 95–114.
Romero-Meza, R., Bonilla, C., Benedetti, H., and Serletis, A. (2015) Nonlinearities and Financial Contagion in Latin American Stock Markets. Economic Modelling, 51, 653-656.
Wang, G.-J., Xie, C., Lin, M., y Stanley, H. E. (2017). Stock market contagion during the global financial crisis: A multiscale approach. Finance Research Letters, 22, pp. 163-168.