Contact: Gary Thompson – Media Jonathan Halkyard ...
34
1 Contact: Gary Thompson – Media Jonathan Halkyard – Investors Harrah’s Entertainment, Inc. Harrah’s Entertainment, Inc. (702) 407-6529 (702) 407-6080 Harrah’s Entertainment Reports 2008 Fourth-Quarter, Full-Year Global Results • Revenues decline 13.3 percent from 2007 fourth quarter • Fourth-Quarter Property EBITDA declines 23.2 percent from prior year • Goodwill impairment charge impacts results LAS VEGAS – March 13, 2009 – Harrah's Entertainment, Inc. today reported the following financial results for the 2008 fourth quarter and full year: HARRAH’S ENTERTAINMENT, INC. Company-wide Results Percent Fourth Quarter Increase/ (In millions) 2008 2007 (Decrease) Total revenues .......................................................... $ 2,278.4 $2,627.5 (13.3)% (Loss)/income from operations .................................. (5,348.0) 145.8 N/M Loss from continuing operations ............................... (4,784.0) (56.1) N/M Property EBITDA....................................................... 478.0 622.8 (23.2)% Adjusted EBITDA (a) ................................................. 453.6 618.1 (26.6)% In accordance with Generally Accepted Accounting Principles, we have separated our historical financial results for the Successor period from January 28, 2008 through December 31, 2008, and the Predecessor period from January 1, 2008 through January 27, 2008; however, we have also combined the Successor and Predecessor periods’ results for the year
Transcript of Contact: Gary Thompson – Media Jonathan Halkyard ...

1
Contact: Gary Thompson – Media Jonathan Halkyard – Investors Harrah’s Entertainment, Inc. Harrah’s Entertainment, Inc. (702) 407-6529 (702) 407-6080
Harrah’s Entertainment Reports 2008 Fourth-Quarter, Full-Year Global Results
• Revenues decline 13.3 percent from 2007 fourth quarter
• Fourth-Quarter Property EBITDA declines 23.2 percent from prior year
• Goodwill impairment charge impacts results
LAS VEGAS – March 13, 2009 – Harrah's Entertainment, Inc. today reported the following
financial results for the 2008 fourth quarter and full year:
HARRAH’S ENTERTAINMENT, INC.
Company-wide Results Percent Fourth Quarter Increase/
(In millions) 2008 2007 (Decrease)
Total revenues .......................................................... $ 2,278.4 $2,627.5 (13.3)% (Loss)/income from operations.................................. (5,348.0) 145.8 N/M Loss from continuing operations ............................... (4,784.0) (56.1) N/M Property EBITDA....................................................... 478.0 622.8 (23.2)% Adjusted EBITDA (a) ................................................. 453.6 618.1 (26.6)%
In accordance with Generally Accepted Accounting Principles, we have separated our
historical financial results for the Successor period from January 28, 2008 through December
31, 2008, and the Predecessor period from January 1, 2008 through January 27, 2008;
however, we have also combined the Successor and Predecessor periods’ results for the year
2
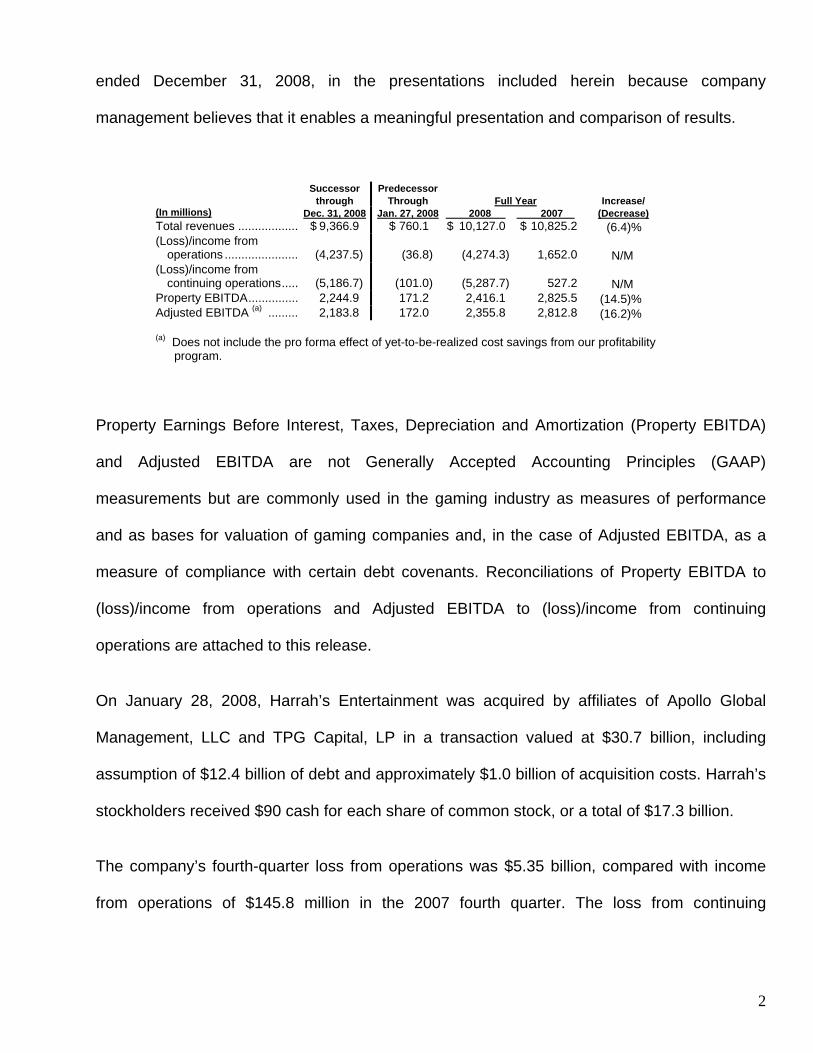
ended December 31, 2008, in the presentations included herein because company
management believes that it enables a meaningful presentation and comparison of results.
Successor Predecessor through Through Full Year Increase/ (In millions) Dec. 31, 2008 Jan. 27, 2008 2008 2007 (Decrease)
Total revenues .................. $ 9,366.9 $ 760.1 $ 10,127.0 $ 10,825.2 (6.4)% (Loss)/income from
operations ...................... (4,237.5) (36.8) (4,274.3) 1,652.0 N/M (Loss)/income from
continuing operations..... (5,186.7) (101.0) (5,287.7) 527.2 N/M Property EBITDA............... 2,244.9 171.2 2,416.1 2,825.5 (14.5)% Adjusted EBITDA (a) ......... 2,183.8 172.0 2,355.8 2,812.8 (16.2)% (a) Does not include the pro forma effect of yet-to-be-realized cost savings from our profitability
program.
Property Earnings Before Interest, Taxes, Depreciation and Amortization (Property EBITDA)
and Adjusted EBITDA are not Generally Accepted Accounting Principles (GAAP)
measurements but are commonly used in the gaming industry as measures of performance
and as bases for valuation of gaming companies and, in the case of Adjusted EBITDA, as a
measure of compliance with certain debt covenants. Reconciliations of Property EBITDA to
(loss)/income from operations and Adjusted EBITDA to (loss)/income from continuing
operations are attached to this release.
On January 28, 2008, Harrah’s Entertainment was acquired by affiliates of Apollo Global
Management, LLC and TPG Capital, LP in a transaction valued at $30.7 billion, including
assumption of $12.4 billion of debt and approximately $1.0 billion of acquisition costs. Harrah’s
stockholders received $90 cash for each share of common stock, or a total of $17.3 billion.
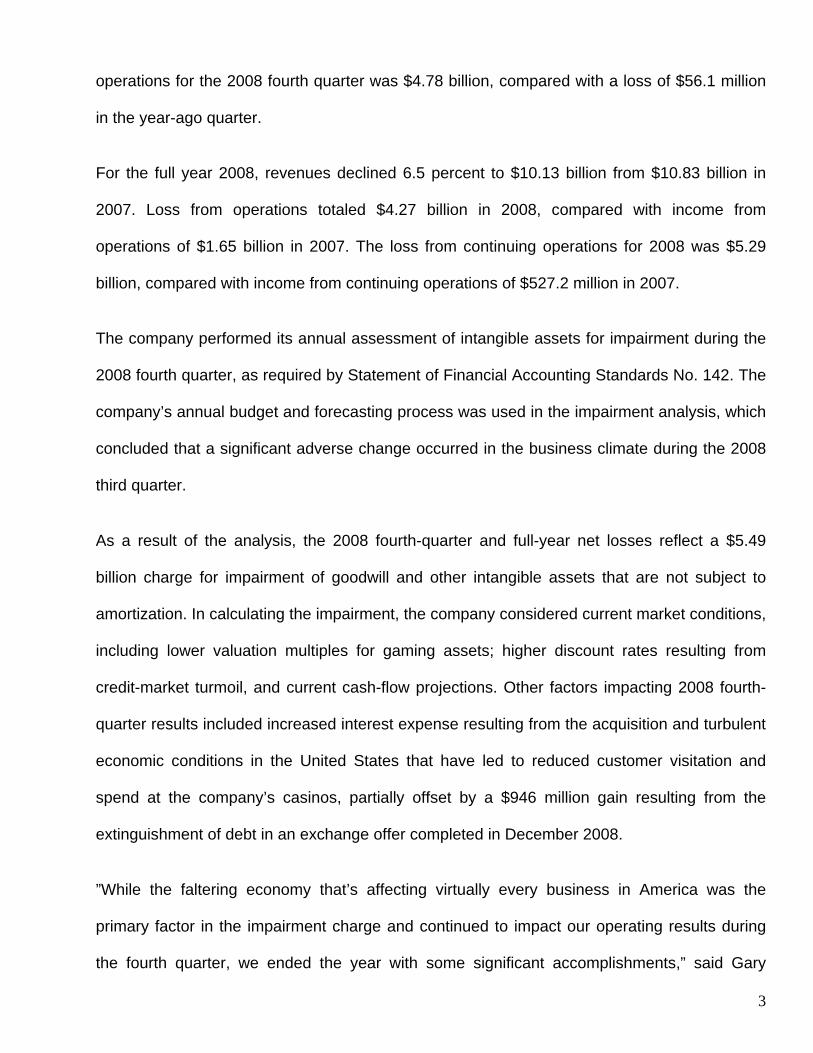
The company’s fourth-quarter loss from operations was $5.35 billion, compared with income
from operations of $145.8 million in the 2007 fourth quarter. The loss from continuing
3
operations for the 2008 fourth quarter was $4.78 billion, compared with a loss of $56.1 million
in the year-ago quarter.
For the full year 2008, revenues declined 6.5 percent to $10.13 billion from $10.83 billion in
2007. Loss from operations totaled $4.27 billion in 2008, compared with income from
operations of $1.65 billion in 2007. The loss from continuing operations for 2008 was $5.29
billion, compared with income from continuing operations of $527.2 million in 2007.
The company performed its annual assessment of intangible assets for impairment during the
2008 fourth quarter, as required by Statement of Financial Accounting Standards No. 142. The
company’s annual budget and forecasting process was used in the impairment analysis, which
concluded that a significant adverse change occurred in the business climate during the 2008
third quarter.
As a result of the analysis, the 2008 fourth-quarter and full-year net losses reflect a $5.49
billion charge for impairment of goodwill and other intangible assets that are not subject to
amortization. In calculating the impairment, the company considered current market conditions,
including lower valuation multiples for gaming assets; higher discount rates resulting from
credit-market turmoil, and current cash-flow projections. Other factors impacting 2008 fourth-
quarter results included increased interest expense resulting from the acquisition and turbulent
economic conditions in the United States that have led to reduced customer visitation and
spend at the company’s casinos, partially offset by a $946 million gain resulting from the
extinguishment of debt in an exchange offer completed in December 2008.
”While the faltering economy that’s affecting virtually every business in America was the
primary factor in the impairment charge and continued to impact our operating results during
the fourth quarter, we ended the year with some significant accomplishments,” said Gary

4
Loveman, Harrah’s chairman, president and chief executive officer. “During the year, we
reduced labor and marketing costs substantially and completed two of the largest capital
projects in the company’s history, putting the bulk of our planned capital-spending activities
behind us.
“In keeping with our determination to align capacity with demand, we announced a delay in the
completion of an additional 660 rooms in the new Octavius Tower at Caesars Palace,”
Loveman said. “We made this decision because the weak economy is expected to continue to
impact demand for rooms in the Las Vegas market over the next several months even as
additional supply is added by other operators. Once demand improves, the additional rooms in
the Octavius Tower can be completed in a matter of months. Meanwhile, we continued to
move forward with plans to open the new convention center under construction at Caesars
Palace by mid-summer 2009 due to strong advance bookings for that facility.
“We successfully launched a pilot of LEAN operations management, the efficiency-
enhancement process pioneered by Toyota, at several of our properties during the fourth
quarter and will roll out the program across the enterprise this year,” Loveman said. “We’ve
been particularly pleased at the resultant efficiency improvements thus far, as well as the
enthusiasm exhibited by front-line employees who participated in the program at the test
properties.
“In December 2008, we completed an exchange offer that enabled us to reduce our overall
principal debt from the 2008 third-quarter levels by approximately $1.16 billion, and we
subsequently launched a second exchange offer this month in an effort to reduce the
outstanding debt of Harrah’s Operating Company and extend the maturity of that debt,”
Loveman said. “As we move into a year likely to present continuing economic challenges, we
5
are focused on the need to remain flexible in our staffing and marketing requirements and to
be nimble in responding to changes in customer and competitor behavior.”
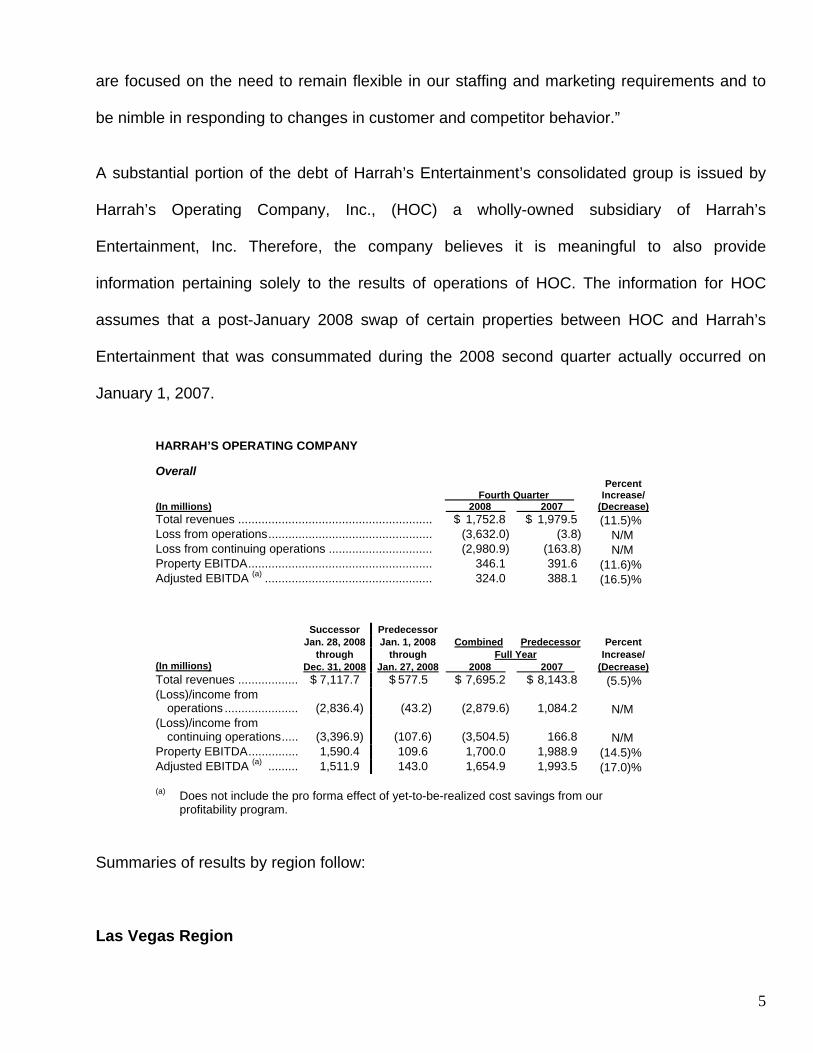
A substantial portion of the debt of Harrah’s Entertainment’s consolidated group is issued by
Harrah’s Operating Company, Inc., (HOC) a wholly-owned subsidiary of Harrah’s
Entertainment, Inc. Therefore, the company believes it is meaningful to also provide
information pertaining solely to the results of operations of HOC. The information for HOC
assumes that a post-January 2008 swap of certain properties between HOC and Harrah’s
Entertainment that was consummated during the 2008 second quarter actually occurred on
January 1, 2007.
HARRAH’S OPERATING COMPANY
Overall
Percent Fourth Quarter Increase/
(In millions) 2008 2007 (Decrease)
Total revenues .......................................................... $ 1,752.8 $ 1,979.5 (11.5)% Loss from operations................................................. (3,632.0) (3.8) N/M Loss from continuing operations ............................... (2,980.9) (163.8) N/M Property EBITDA....................................................... 346.1 391.6 (11.6)% Adjusted EBITDA (a) .................................................. 324.0 388.1 (16.5)%
Successor Predecessor Jan. 28, 2008 Jan. 1, 2008 Combined Predecessor Percent through through Full Year Increase/ (In millions) Dec. 31, 2008 Jan. 27, 2008 2008 2007 (Decrease)
Total revenues .................. $ 7,117.7 $ 577.5 $ 7,695.2 $ 8,143.8 (5.5)% (Loss)/income from
operations ...................... (2,836.4) (43.2) (2,879.6) 1,084.2 N/M (Loss)/income from
continuing operations..... (3,396.9) (107.6) (3,504.5) 166.8 N/M Property EBITDA............... 1,590.4 109.6 1,700.0 1,988.9 (14.5)% Adjusted EBITDA (a) ......... 1,511.9 143.0 1,654.9 1,993.5 (17.0)% (a) Does not include the pro forma effect of yet-to-be-realized cost savings from our
profitability program.
Summaries of results by region follow:
Las Vegas Region
6
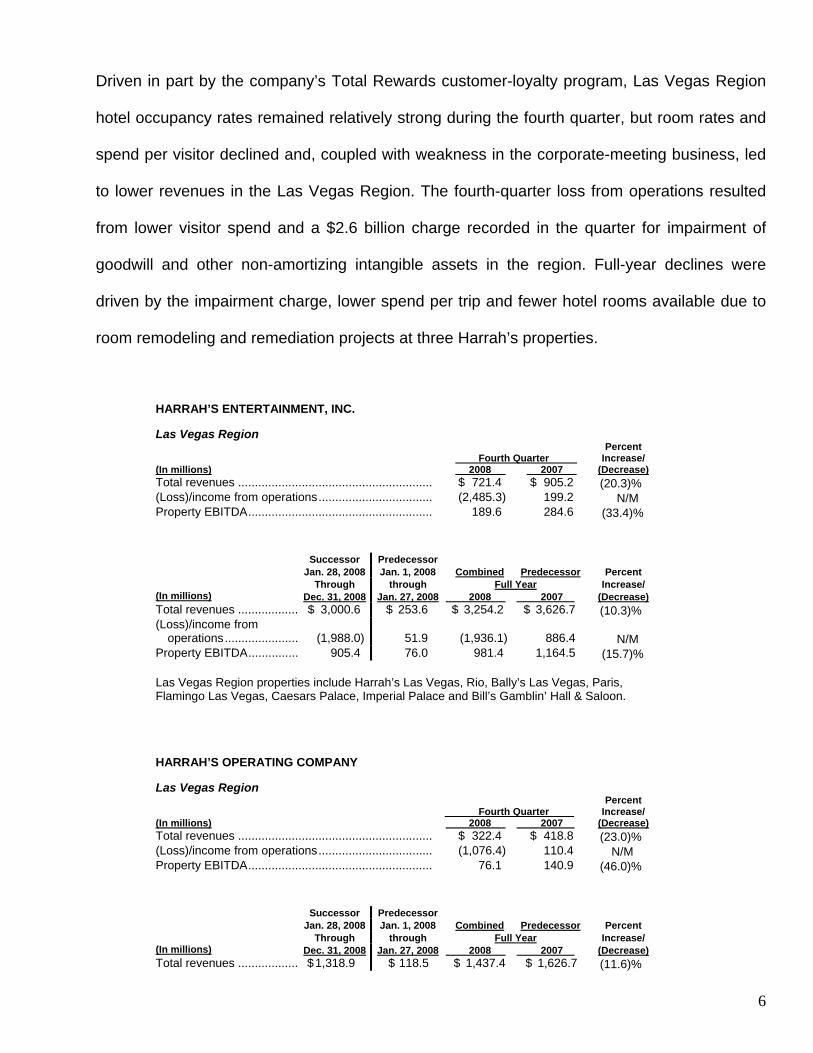
Driven in part by the company’s Total Rewards customer-loyalty program, Las Vegas Region
hotel occupancy rates remained relatively strong during the fourth quarter, but room rates and
spend per visitor declined and, coupled with weakness in the corporate-meeting business, led
to lower revenues in the Las Vegas Region. The fourth-quarter loss from operations resulted
from lower visitor spend and a $2.6 billion charge recorded in the quarter for impairment of
goodwill and other non-amortizing intangible assets in the region. Full-year declines were
driven by the impairment charge, lower spend per trip and fewer hotel rooms available due to
room remodeling and remediation projects at three Harrah’s properties.
HARRAH’S ENTERTAINMENT, INC.
Las Vegas Region Percent Fourth Quarter Increase/
(In millions) 2008 2007 (Decrease)
Total revenues .......................................................... $ 721.4 $ 905.2 (20.3)% (Loss)/income from operations.................................. (2,485.3) 199.2 N/M Property EBITDA....................................................... 189.6 284.6 (33.4)%
Successor Predecessor Jan. 28, 2008 Jan. 1, 2008 Combined Predecessor Percent Through through Full Year Increase/ (In millions) Dec. 31, 2008 Jan. 27, 2008 2008 2007 (Decrease)
Total revenues .................. $ 3,000.6 $ 253.6 $ 3,254.2 $ 3,626.7 (10.3)% (Loss)/income from
operations...................... (1,988.0) 51.9 (1,936.1) 886.4 N/M Property EBITDA............... 905.4 76.0 981.4 1,164.5 (15.7)% Las Vegas Region properties include Harrah’s Las Vegas, Rio, Bally’s Las Vegas, Paris, Flamingo Las Vegas, Caesars Palace, Imperial Palace and Bill’s Gamblin’ Hall & Saloon.
HARRAH’S OPERATING COMPANY
Las Vegas Region Percent Fourth Quarter Increase/
(In millions) 2008 2007 (Decrease)
Total revenues .......................................................... $ 322.4 $ 418.8 (23.0)% (Loss)/income from operations.................................. (1,076.4) 110.4 N/M Property EBITDA....................................................... 76.1 140.9 (46.0)%
Successor Predecessor Jan. 28, 2008 Jan. 1, 2008 Combined Predecessor Percent Through through Full Year Increase/ (In millions) Dec. 31, 2008 Jan. 27, 2008 2008 2007 (Decrease)
Total revenues .................. $ 1,318.9 $ 118.5 $ 1,437.4 $ 1,626.7 (11.6)%
7
Successor Predecessor Jan. 28, 2008 Jan. 1, 2008 Combined Predecessor Percent Through through Full Year Increase/ (In millions) Dec. 31, 2008 Jan. 27, 2008 2008 2007 (Decrease)
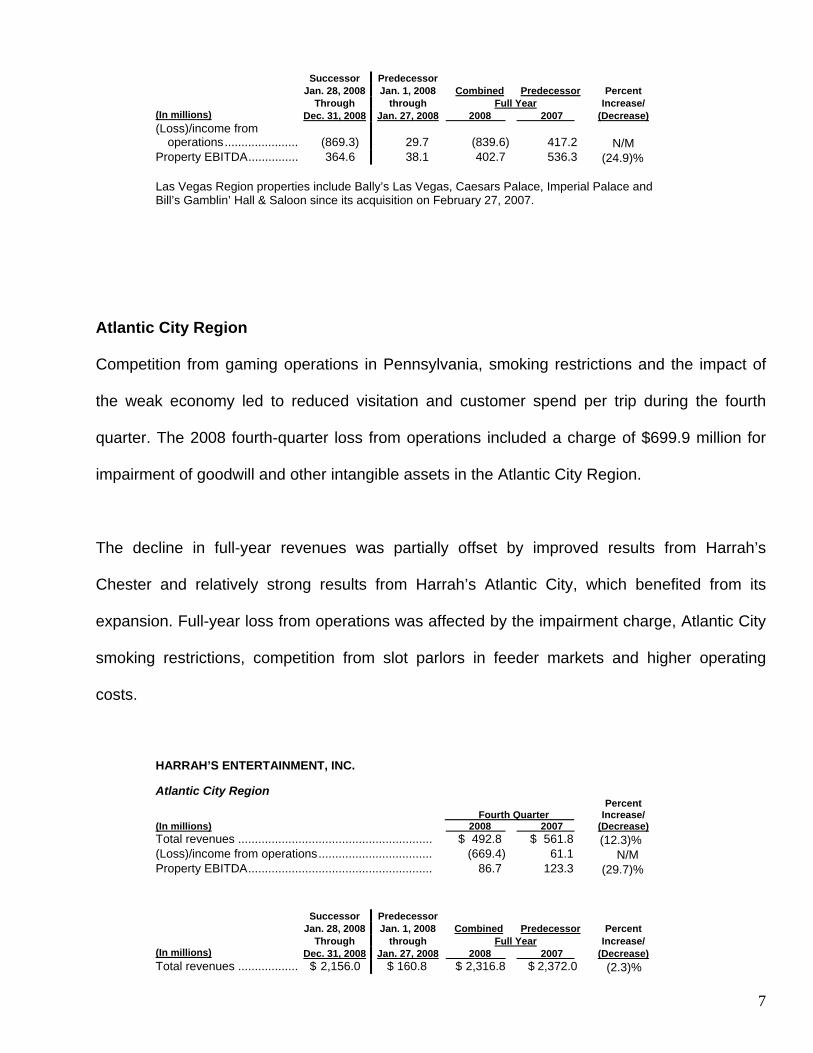
(Loss)/income from operations...................... (869.3) 29.7 (839.6) 417.2 N/M
Property EBITDA............... 364.6 38.1 402.7 536.3 (24.9)% Las Vegas Region properties include Bally’s Las Vegas, Caesars Palace, Imperial Palace and Bill’s Gamblin’ Hall & Saloon since its acquisition on February 27, 2007.
Atlantic City Region
Competition from gaming operations in Pennsylvania, smoking restrictions and the impact of
the weak economy led to reduced visitation and customer spend per trip during the fourth
quarter. The 2008 fourth-quarter loss from operations included a charge of $699.9 million for
impairment of goodwill and other intangible assets in the Atlantic City Region.
The decline in full-year revenues was partially offset by improved results from Harrah’s
Chester and relatively strong results from Harrah’s Atlantic City, which benefited from its
expansion. Full-year loss from operations was affected by the impairment charge, Atlantic City
smoking restrictions, competition from slot parlors in feeder markets and higher operating
costs.
HARRAH’S ENTERTAINMENT, INC.
Atlantic City Region Percent Fourth Quarter Increase/
(In millions) 2008 2007 (Decrease)
Total revenues .......................................................... $ 492.8 $ 561.8 (12.3)% (Loss)/income from operations.................................. (669.4) 61.1 N/M Property EBITDA....................................................... 86.7 123.3 (29.7)%
Successor Predecessor Jan. 28, 2008 Jan. 1, 2008 Combined Predecessor Percent Through through Full Year Increase/ (In millions) Dec. 31, 2008 Jan. 27, 2008 2008 2007 (Decrease)
Total revenues .................. $ 2,156.0 $ 160.8 $ 2,316.8 $ 2,372.0 (2.3)%
8
Successor Predecessor Jan. 28, 2008 Jan. 1, 2008 Combined Predecessor Percent Through through Full Year Increase/ (In millions) Dec. 31, 2008 Jan. 27, 2008 2008 2007 (Decrease)
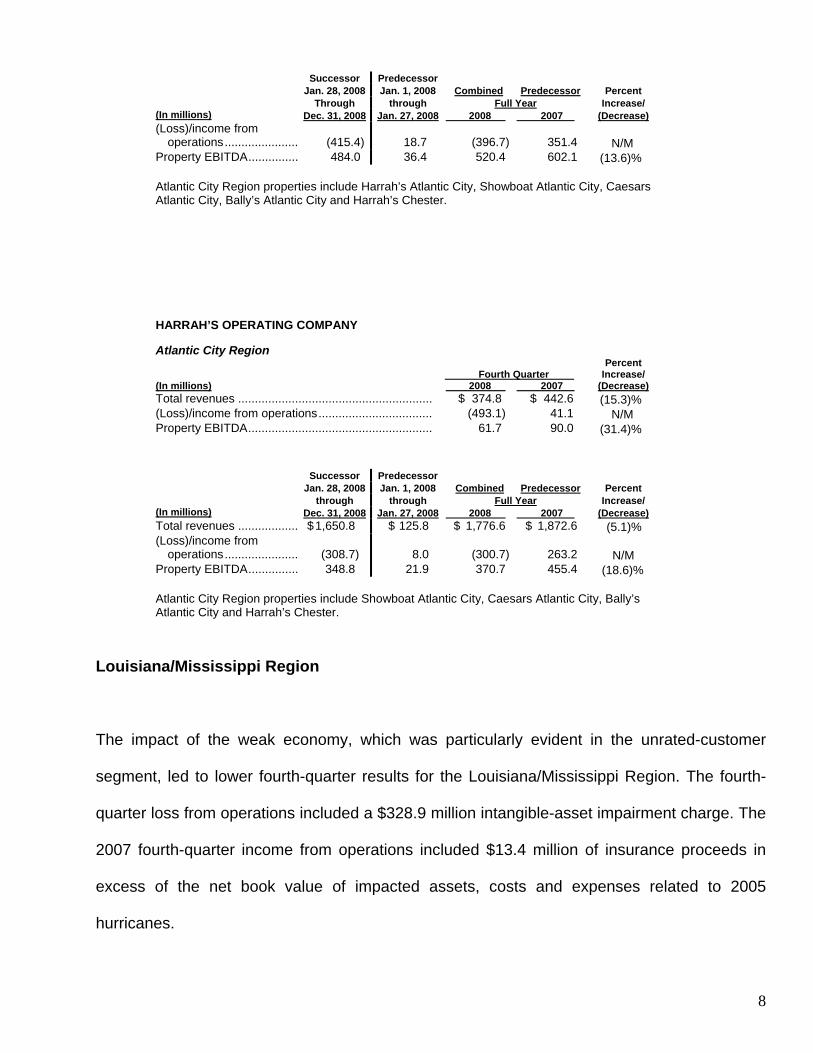
(Loss)/income from operations...................... (415.4) 18.7 (396.7) 351.4 N/M
Property EBITDA............... 484.0 36.4 520.4 602.1 (13.6)% Atlantic City Region properties include Harrah’s Atlantic City, Showboat Atlantic City, Caesars Atlantic City, Bally’s Atlantic City and Harrah’s Chester.
HARRAH’S OPERATING COMPANY
Atlantic City Region Percent Fourth Quarter Increase/
(In millions) 2008 2007 (Decrease)
Total revenues .......................................................... $ 374.8 $ 442.6 (15.3)% (Loss)/income from operations.................................. (493.1) 41.1 N/M Property EBITDA....................................................... 61.7 90.0 (31.4)%
Successor Predecessor Jan. 28, 2008 Jan. 1, 2008 Combined Predecessor Percent through through Full Year Increase/ (In millions) Dec. 31, 2008 Jan. 27, 2008 2008 2007 (Decrease)
Total revenues .................. $ 1,650.8 $ 125.8 $ 1,776.6 $ 1,872.6 (5.1)% (Loss)/income from
operations...................... (308.7) 8.0 (300.7) 263.2 N/M Property EBITDA............... 348.8 21.9 370.7 455.4 (18.6)% Atlantic City Region properties include Showboat Atlantic City, Caesars Atlantic City, Bally’s Atlantic City and Harrah’s Chester.
Louisiana/Mississippi Region
The impact of the weak economy, which was particularly evident in the unrated-customer
segment, led to lower fourth-quarter results for the Louisiana/Mississippi Region. The fourth-
quarter loss from operations included a $328.9 million intangible-asset impairment charge. The
2007 fourth-quarter income from operations included $13.4 million of insurance proceeds in
excess of the net book value of impacted assets, costs and expenses related to 2005
hurricanes.
9
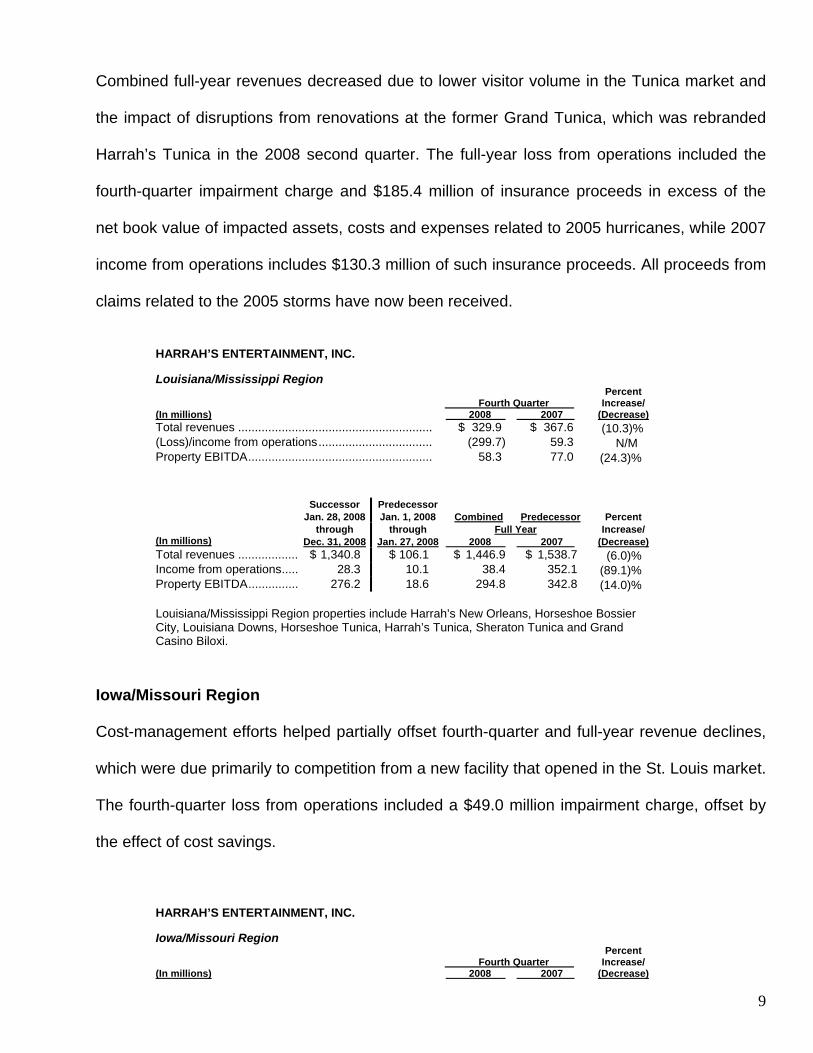
Combined full-year revenues decreased due to lower visitor volume in the Tunica market and
the impact of disruptions from renovations at the former Grand Tunica, which was rebranded
Harrah’s Tunica in the 2008 second quarter. The full-year loss from operations included the
fourth-quarter impairment charge and $185.4 million of insurance proceeds in excess of the
net book value of impacted assets, costs and expenses related to 2005 hurricanes, while 2007
income from operations includes $130.3 million of such insurance proceeds. All proceeds from
claims related to the 2005 storms have now been received.
HARRAH’S ENTERTAINMENT, INC.
Louisiana/Mississippi Region
Percent Fourth Quarter Increase/
(In millions) 2008 2007 (Decrease)
Total revenues .......................................................... $ 329.9 $ 367.6 (10.3)% (Loss)/income from operations.................................. (299.7) 59.3 N/M Property EBITDA....................................................... 58.3 77.0 (24.3)%
Successor Predecessor Jan. 28, 2008 Jan. 1, 2008 Combined Predecessor Percent through through Full Year Increase/ (In millions) Dec. 31, 2008 Jan. 27, 2008 2008 2007 (Decrease)
Total revenues .................. $ 1,340.8 $ 106.1 $ 1,446.9 $ 1,538.7 (6.0)% Income from operations..... 28.3 10.1 38.4 352.1 (89.1)% Property EBITDA............... 276.2 18.6 294.8 342.8 (14.0)% Louisiana/Mississippi Region properties include Harrah’s New Orleans, Horseshoe Bossier City, Louisiana Downs, Horseshoe Tunica, Harrah’s Tunica, Sheraton Tunica and Grand Casino Biloxi.
Iowa/Missouri Region
Cost-management efforts helped partially offset fourth-quarter and full-year revenue declines,
which were due primarily to competition from a new facility that opened in the St. Louis market.
The fourth-quarter loss from operations included a $49.0 million impairment charge, offset by
the effect of cost savings.
HARRAH’S ENTERTAINMENT, INC.
Iowa/Missouri Region Percent Fourth Quarter Increase/
(In millions) 2008 2007 (Decrease)

10
HARRAH’S ENTERTAINMENT, INC.
Iowa/Missouri Region Percent Fourth Quarter Increase/
(In millions) 2008 2007 (Decrease)
Total revenues .......................................................... $ 189.6 $ 197.5 (4.0)% (Loss)/income from operations.................................. (4.6) 33.6 (113.7)% Property EBITDA....................................................... 58.1 55.8 4.1 %
Successor Predecessor Jan. 28, 2008 Jan. 1, 2008 Combined Predecessor Percent through through Full Year Increase/ (In millions) Dec. 31, 2008 Jan. 27, 2008 2008 2007 (Decrease)
Total revenues .................. $ 727.0 $ 55.8 $ 782.8 $ 811.4 (3.5)% Income from operations..... 108.2 7.7 115.9 143.6 (19.3)% Property EBITDA............... 206.1 13.0 219.1 225.3 (2.8)% Iowa/Missouri/Kansas Region properties include Harrah’s St. Louis, Harrah’s Council Bluffs, Horseshoe Council Bluffs and Harrah’s North Kansas City.
Illinois/Indiana Region The opening of a major renovation and expansion at Horseshoe Hammond on August 8, 2008,
helped partially offset the impact of a smoking ban in Illinois that led to lower 2008 fourth-
quarter and full-year revenues in the Illinois/Indiana Region. The fourth-quarter loss from
operations included a $617.1 million impairment charge. The full-year results were also
impacted by the Illinois smoking ban.
HARRAH’S ENTERTAINMENT, INC.
Illinois/Indiana Region
Percent Fourth Quarter Increase/
(In millions) 2008 2007 (Decrease)
Total revenues .......................................................... $ 294.3 $ 311.1 (5.4)% Loss from operations................................................. (597.2) (23.6) N/M Property EBITDA....................................................... 44.7 54.0 (17.2)%
Successor Predecessor Jan. 28, 2008 Jan. 1, 2008 Combined Predecessor Percent through through Full Year Increase/ (In millions) Dec. 31, 2008 Jan. 27, 2008 2008 2007 (Decrease)
Total revenues .................. $ 1,098.7 $ 85.5 $ 1,184.2 $1,285.8 (7.9)% (Loss)/income from
operations...................... (505.9) 8.7 (497.2) 135.3 N/M Property EBITDA............... 195.4 13.6 209.0 258.1 (19.0)% Illinois/Indiana properties include Horseshoe Hammond, Harrah’s Joliet, Harrah’s Metropolis and Horseshoe Southern Indiana.
11
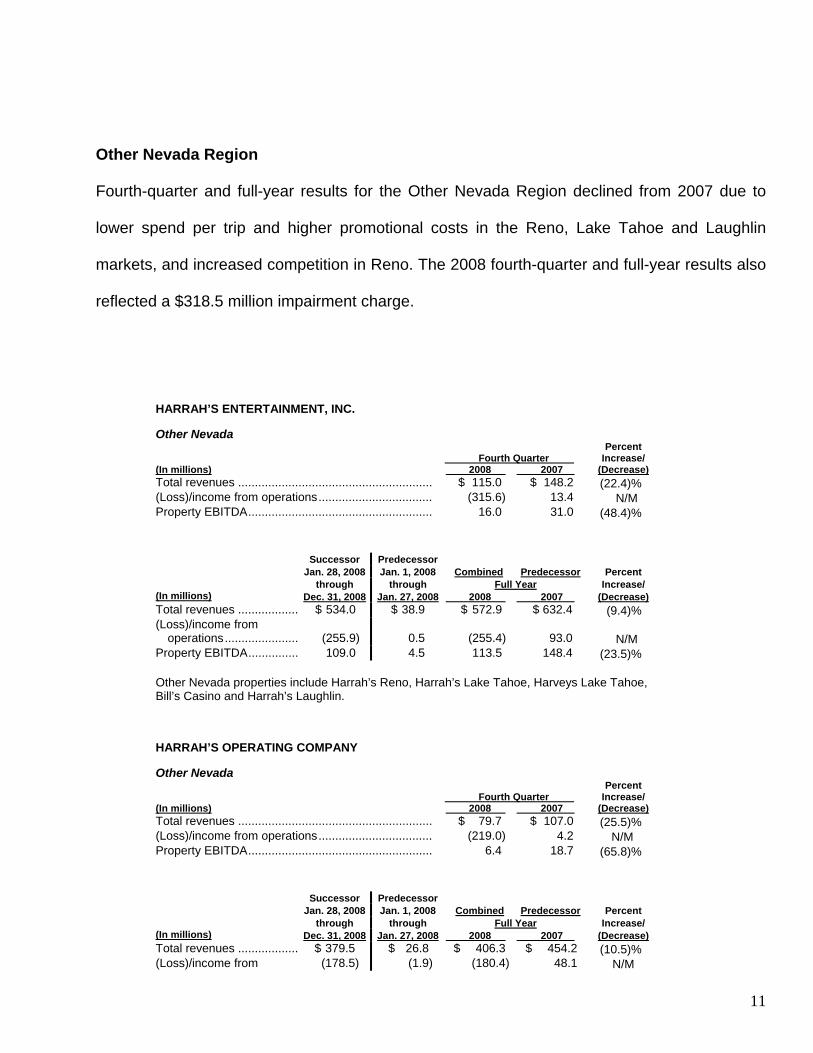
Other Nevada Region
Fourth-quarter and full-year results for the Other Nevada Region declined from 2007 due to
lower spend per trip and higher promotional costs in the Reno, Lake Tahoe and Laughlin
markets, and increased competition in Reno. The 2008 fourth-quarter and full-year results also
reflected a $318.5 million impairment charge.
HARRAH’S ENTERTAINMENT, INC.
Other Nevada Percent Fourth Quarter Increase/
(In millions) 2008 2007 (Decrease)
Total revenues .......................................................... $ 115.0 $ 148.2 (22.4)% (Loss)/income from operations.................................. (315.6) 13.4 N/M Property EBITDA....................................................... 16.0 31.0 (48.4)%
Successor Predecessor Jan. 28, 2008 Jan. 1, 2008 Combined Predecessor Percent through through Full Year Increase/ (In millions) Dec. 31, 2008 Jan. 27, 2008 2008 2007 (Decrease)
Total revenues .................. $ 534.0 $ 38.9 $ 572.9 $ 632.4 (9.4)% (Loss)/income from
operations...................... (255.9) 0.5 (255.4) 93.0 N/M Property EBITDA............... 109.0 4.5 113.5 148.4 (23.5)% Other Nevada properties include Harrah’s Reno, Harrah’s Lake Tahoe, Harveys Lake Tahoe, Bill’s Casino and Harrah’s Laughlin.
HARRAH’S OPERATING COMPANY
Other Nevada Percent Fourth Quarter Increase/
(In millions) 2008 2007 (Decrease)
Total revenues .......................................................... $ 79.7 $ 107.0 (25.5)% (Loss)/income from operations.................................. (219.0) 4.2 N/M Property EBITDA....................................................... 6.4 18.7 (65.8)%
Successor Predecessor Jan. 28, 2008 Jan. 1, 2008 Combined Predecessor Percent through through Full Year Increase/ (In millions) Dec. 31, 2008 Jan. 27, 2008 2008 2007 (Decrease)
Total revenues .................. $ 379.5 $ 26.8 $ 406.3 $ 454.2 (10.5)% (Loss)/income from (178.5) (1.9) (180.4) 48.1 N/M
12
Successor Predecessor Jan. 28, 2008 Jan. 1, 2008 Combined Predecessor Percent through through Full Year Increase/ (In millions) Dec. 31, 2008 Jan. 27, 2008 2008 2007 (Decrease)
operations......................Property EBITDA............... 66.7 1.2 67.9 92.4 (26.5)% Other Nevada properties include Harrah’s Reno, Harrah’s Lake Tahoe, Harveys Lake Tahoe, and Bill’s Casino.
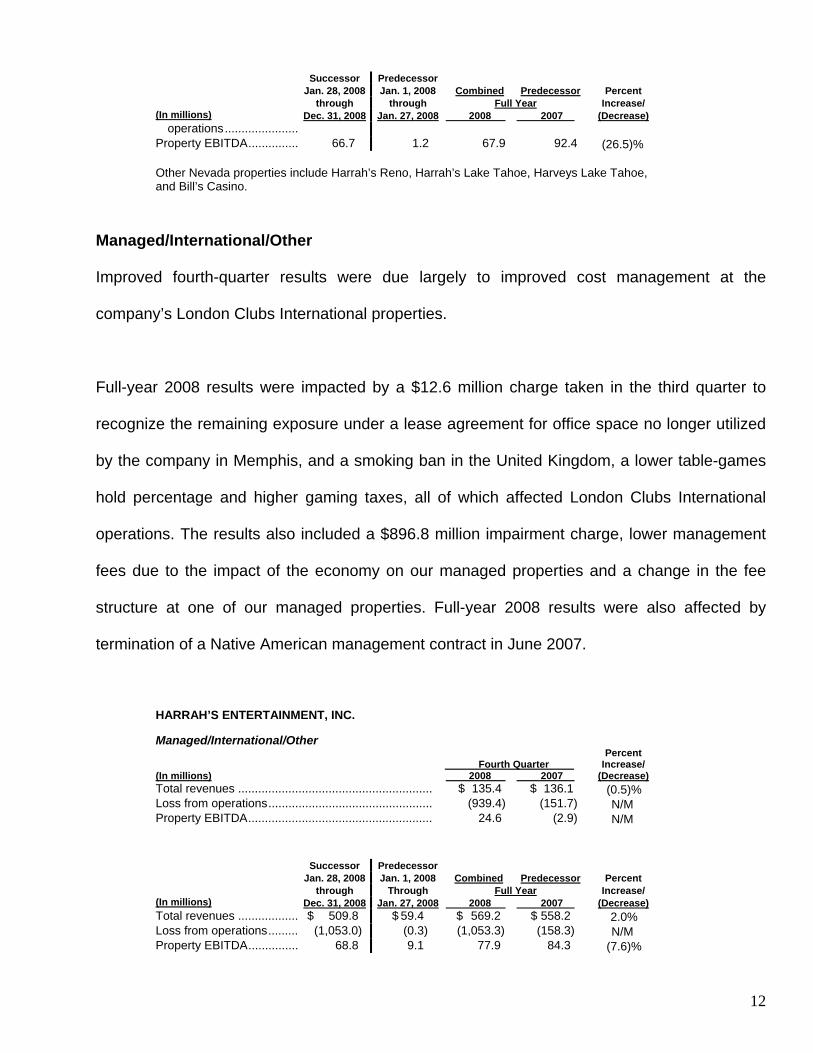
Managed/International/Other
Improved fourth-quarter results were due largely to improved cost management at the
company’s London Clubs International properties.
Full-year 2008 results were impacted by a $12.6 million charge taken in the third quarter to
recognize the remaining exposure under a lease agreement for office space no longer utilized
by the company in Memphis, and a smoking ban in the United Kingdom, a lower table-games
hold percentage and higher gaming taxes, all of which affected London Clubs International
operations. The results also included a $896.8 million impairment charge, lower management
fees due to the impact of the economy on our managed properties and a change in the fee
structure at one of our managed properties. Full-year 2008 results were also affected by
termination of a Native American management contract in June 2007.
HARRAH’S ENTERTAINMENT, INC.
Managed/International/Other Percent Fourth Quarter Increase/
(In millions) 2008 2007 (Decrease)
Total revenues .......................................................... $ 135.4 $ 136.1 (0.5)% Loss from operations................................................. (939.4) (151.7) N/M Property EBITDA....................................................... 24.6 (2.9) N/M
Successor Predecessor Jan. 28, 2008 Jan. 1, 2008 Combined Predecessor Percent through Through Full Year Increase/ (In millions) Dec. 31, 2008 Jan. 27, 2008 2008 2007 (Decrease)
Total revenues .................. $ 509.8 $ 59.4 $ 569.2 $ 558.2 2.0% Loss from operations......... (1,053.0) (0.3) (1,053.3) (158.3) N/M Property EBITDA............... 68.8 9.1 77.9 84.3 (7.6)%
13
Successor Predecessor Jan. 28, 2008 Jan. 1, 2008 Combined Predecessor Percent through Through Full Year Increase/ (In millions) Dec. 31, 2008 Jan. 27, 2008 2008 2007 (Decrease)
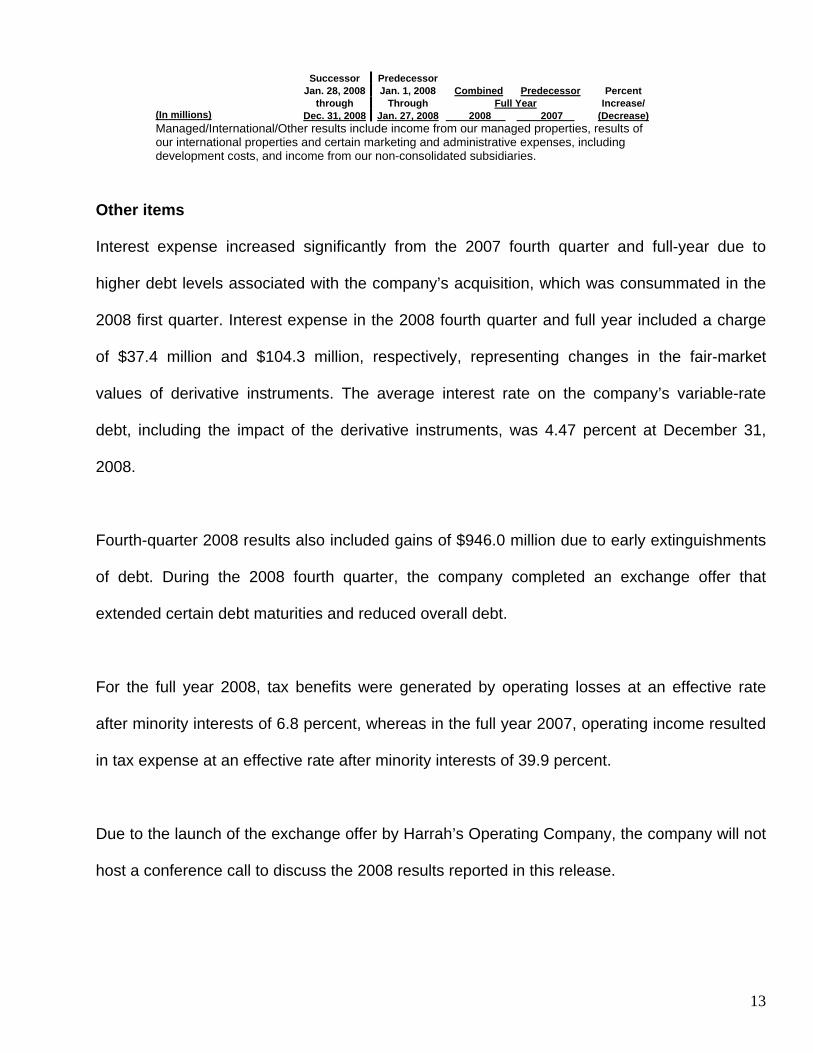
Managed/International/Other results include income from our managed properties, results of our international properties and certain marketing and administrative expenses, including development costs, and income from our non-consolidated subsidiaries.
Other items
Interest expense increased significantly from the 2007 fourth quarter and full-year due to
higher debt levels associated with the company’s acquisition, which was consummated in the
2008 first quarter. Interest expense in the 2008 fourth quarter and full year included a charge
of $37.4 million and $104.3 million, respectively, representing changes in the fair-market
values of derivative instruments. The average interest rate on the company’s variable-rate
debt, including the impact of the derivative instruments, was 4.47 percent at December 31,
2008.
Fourth-quarter 2008 results also included gains of $946.0 million due to early extinguishments
of debt. During the 2008 fourth quarter, the company completed an exchange offer that
extended certain debt maturities and reduced overall debt.
For the full year 2008, tax benefits were generated by operating losses at an effective rate
after minority interests of 6.8 percent, whereas in the full year 2007, operating income resulted
in tax expense at an effective rate after minority interests of 39.9 percent.
Due to the launch of the exchange offer by Harrah’s Operating Company, the company will not
host a conference call to discuss the 2008 results reported in this release.
14
Harrah's Entertainment, Inc. is the world's largest provider of branded casino entertainment.
Since its beginning in Reno, Nevada, more than 70 years ago, Harrah's has grown through
development of new properties, expansions and acquisitions, and now operates casinos on
four continents. The company's properties operate primarily under the Harrah's®, Caesars®
and Horseshoe® brand names; Harrah's also owns the London Clubs International family of
casinos and the World Series of Poker®. Harrah's Entertainment is focused on building loyalty
and value with its customers through a unique combination of great service, excellent
products, unsurpassed distribution, operational excellence and technology leadership. For
more information, please visit www.harrahs.com.
This release includes "forward-looking statements" intended to qualify for the safe harbor from
liability established by the Private Securities Litigation Reform Act of 1995. You can identify
these statements by the fact that they do not relate strictly to historical or current facts. These
statements contain words such as "may," "will," "project," "might," "expect," "believe,"
"anticipate," "intend," "could," "would," "estimate," "continue" or "pursue," or the negative or
other variations thereof or comparable terminology. In particular, they include statements
relating to, among other things, future actions, new projects, strategies, future performance,
the outcomes of contingencies and future financial results of Harrah's. These forward-looking
statements are based on current expectations and projections about future events.
Investors are cautioned that forward-looking statements are not guarantees of future
performance or results and involve risks and uncertainties that cannot be predicted or
quantified and, consequently, the actual performance of Harrah's may differ materially from
those expressed or implied by such forward-looking statements. Such risks and uncertainties

15
include, but are not limited to, the following factors, as well as other factors described from
time to time in our reports filed with the Securities and Exchange Commission (including the
sections entitled "Risk Factors" and "Management's Discussion and Analysis of Financial
Condition and Results of Operations" contained therein): the outcome of any legal proceedings
that have been, or will be, instituted against the company related to the acquisition of the
company by affiliates of TPG Capital and Apollo Management; the impact of the company’s
significant indebtedness; the effects of local and national economic, credit and capital market
conditions on the economy in general, and on the gaming and hotel industries in particular;
construction factors, including delays, increased costs for labor and materials, availability of
labor and materials, zoning issues, environmental restrictions, soil and water conditions,
weather and other hazards, site access matters and building permit issues; the effects of
environmental and structural building conditions relating to our properties; access to available
and reasonable financing on a timely basis; the ability to timely and cost-effectively integrate
acquisitions into our operations; changes in laws, including increased tax rates, smoking bans,
regulations or accounting standards, third-party relations and approvals, and decisions of
courts, regulators and governmental bodies; litigation outcomes and judicial actions, including
gaming legislative action, referenda and taxation; the ability of our customer-tracking, customer
loyalty and yield-management programs to continue to increase customer loyalty and same
store sales or hotel sales; our ability to recoup costs of capital investments through higher
revenues; acts of war or terrorist incidents or natural disasters; abnormal gaming holds; the
potential difficulties in employee retention as a result of the sale of the company to affiliates of
TPG Capital and Apollo Management; and the effects of competition, including locations of
competitors and operating and market competition.
Any forward-looking statements are made pursuant to the Private Securities Litigation Reform
Act of 1995 and, as such, speak only as of the date made. Harrah's disclaims any obligation to

16
update the forward-looking statements. You are cautioned not to place undue reliance on
these forward-looking statements, which speak only as of the date stated, or if no date is
stated, as of the date of this press release.

17
HARRAH'S ENTERTAINMENT, INC. CONSOLIDATED SUMMARY OF OPERATIONS
(UNAUDITED)
Successor Predecessor Combined Predecessor Successor Predecessor Jan. 28, 2008 Jan. 1, 2008 Year Ended Fourth Quarter Ended Through Through Dec. 31, (In millions) Dec. 31, 2008 Dec. 31, 2007 Dec. 31, 2008 Jan. 27, 2008 2008 2007 Revenues $ 2,278.4 $ 2,627.5 $ 9,366.9 $ 760.1 $10,127.0 $10,825.2Property operating expenses (1,800.4) (2,004.7) (7,122.0) (588.9) (7,710.9) (7,999.7)Depreciation and amortization (174.5) (215.9) (626.9) (63.5) (690.4) (817.2)
Operating profit 303.5 406.9 1,618.0 107.7 1,725.7 2,008.3 Corporate expense (35.8) (40.4) (131.8) (8.5) (140.3) (138.1)Acquisition and integration costs (1.0) (5.1) (24.0) (125.6) (149.6) (13.4)(Loss)/income on interests in nonconsolidated
affiliates (0.8)
0.4
(2.1)
0.5
(1.6)
3.9
Amortization of intangible assets (43.7) (20.0) (162.9) (5.5) (168.4) (73.5)Impairment of intangible assets (5,489.6) (169.6) (5,489.6) - (5,489.6) (169.6)Project opening costs and other items (80.6) (26.4) (45.1) (5.4) (50.5) 34.4 (Loss)/income from operations (5,348.0) 145.8 (4,237.5) (36.8) (4,274.3) 1,652.0 Interest expense, net of interest capitalized (605.6) (222.3) (2,074.9) (89.7) (2,164.6) (800.8)Gains/(losses) on early extinguishments of debt 946.0 - 742.1 - 742.1 (2.0)Other income, including interest income 16.6 14.5 35.2 1.1 36.3 43.3 (Loss)/income from continuing operations
before income taxes and minority interests (4,991.0)
(62.0)
(5,535.1)
(125.4)
(5,660.5)
892.5
Income tax benefit/(provision) 212.8 4.0 360.4 26.0 386.4 (350.1)Minority interests (5.8) 1.9 (12.0) (1.6) (13.6) (15.2)(Loss)/income from continuing operations (4,784.0) (56.1) (5,186.7) (101.0) (5,287.7) 527.2 Discontinued operations, net of tax 1.9 8.3 90.4 0.1 90.5 92.2
Net (loss)/income $ (4,782.1) $ (47.8) $ (5,096.3) $ (100.9) $ (5,197.2) $ 619.4
18
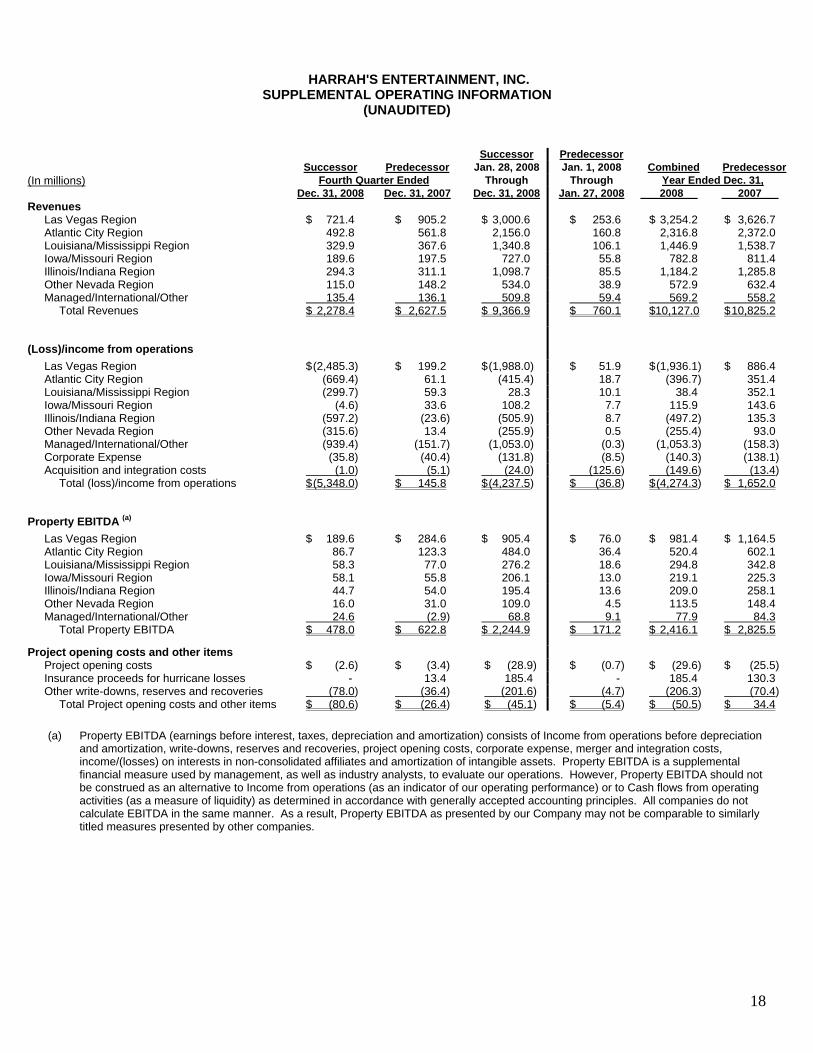
HARRAH'S ENTERTAINMENT, INC. SUPPLEMENTAL OPERATING INFORMATION
(UNAUDITED)
Successor Predecessor Successor Predecessor Jan. 28, 2008 Jan. 1, 2008 Combined Predecessor(In millions) Fourth Quarter Ended Through Through Year Ended Dec. 31, Dec. 31, 2008 Dec. 31, 2007 Dec. 31, 2008 Jan. 27, 2008 2008 2007 Revenues Las Vegas Region $ 721.4 $ 905.2 $ 3,000.6 $ 253.6 $ 3,254.2 $ 3,626.7 Atlantic City Region 492.8 561.8 2,156.0 160.8 2,316.8 2,372.0 Louisiana/Mississippi Region 329.9 367.6 1,340.8 106.1 1,446.9 1,538.7 Iowa/Missouri Region 189.6 197.5 727.0 55.8 782.8 811.4 Illinois/Indiana Region 294.3 311.1 1,098.7 85.5 1,184.2 1,285.8 Other Nevada Region 115.0 148.2 534.0 38.9 572.9 632.4 Managed/International/Other 135.4 136.1 509.8 59.4 569.2 558.2 Total Revenues $ 2,278.4 $ 2,627.5 $ 9,366.9 $ 760.1 $10,127.0 $ 10,825.2
(Loss)/income from operations
Las Vegas Region $ (2,485.3) $ 199.2 $ (1,988.0) $ 51.9 $ (1,936.1) $ 886.4 Atlantic City Region (669.4) 61.1 (415.4) 18.7 (396.7) 351.4 Louisiana/Mississippi Region (299.7) 59.3 28.3 10.1 38.4 352.1 Iowa/Missouri Region (4.6) 33.6 108.2 7.7 115.9 143.6 Illinois/Indiana Region (597.2) (23.6) (505.9) 8.7 (497.2) 135.3 Other Nevada Region (315.6) 13.4 (255.9) 0.5 (255.4) 93.0 Managed/International/Other (939.4) (151.7) (1,053.0) (0.3) (1,053.3) (158.3) Corporate Expense (35.8) (40.4) (131.8) (8.5) (140.3) (138.1) Acquisition and integration costs (1.0) (5.1) (24.0) (125.6) (149.6) (13.4) Total (loss)/income from operations $ (5,348.0) $ 145.8 $ (4,237.5) $ (36.8) $ (4,274.3) $ 1,652.0
Property EBITDA (a)
Las Vegas Region $ 189.6 $ 284.6 $ 905.4 $ 76.0 $ 981.4 $ 1,164.5 Atlantic City Region 86.7 123.3 484.0 36.4 520.4 602.1 Louisiana/Mississippi Region 58.3 77.0 276.2 18.6 294.8 342.8 Iowa/Missouri Region 58.1 55.8 206.1 13.0 219.1 225.3 Illinois/Indiana Region 44.7 54.0 195.4 13.6 209.0 258.1 Other Nevada Region 16.0 31.0 109.0 4.5 113.5 148.4 Managed/International/Other 24.6 (2.9) 68.8 9.1 77.9 84.3 Total Property EBITDA $ 478.0 $ 622.8 $ 2,244.9 $ 171.2 $ 2,416.1 $ 2,825.5
Project opening costs and other items Project opening costs $ (2.6) $ (3.4) $ (28.9) $ (0.7) $ (29.6) $ (25.5) Insurance proceeds for hurricane losses - 13.4 185.4 - 185.4 130.3 Other write-downs, reserves and recoveries (78.0) (36.4) (201.6) (4.7) (206.3) (70.4) Total Project opening costs and other items $ (80.6) $ (26.4) $ (45.1) $ (5.4) $ (50.5) $ 34.4
(a) Property EBITDA (earnings before interest, taxes, depreciation and amortization) consists of Income from operations before depreciation
and amortization, write-downs, reserves and recoveries, project opening costs, corporate expense, merger and integration costs, income/(losses) on interests in non-consolidated affiliates and amortization of intangible assets. Property EBITDA is a supplemental financial measure used by management, as well as industry analysts, to evaluate our operations. However, Property EBITDA should not be construed as an alternative to Income from operations (as an indicator of our operating performance) or to Cash flows from operating activities (as a measure of liquidity) as determined in accordance with generally accepted accounting principles. All companies do not calculate EBITDA in the same manner. As a result, Property EBITDA as presented by our Company may not be comparable to similarly titled measures presented by other companies.
19
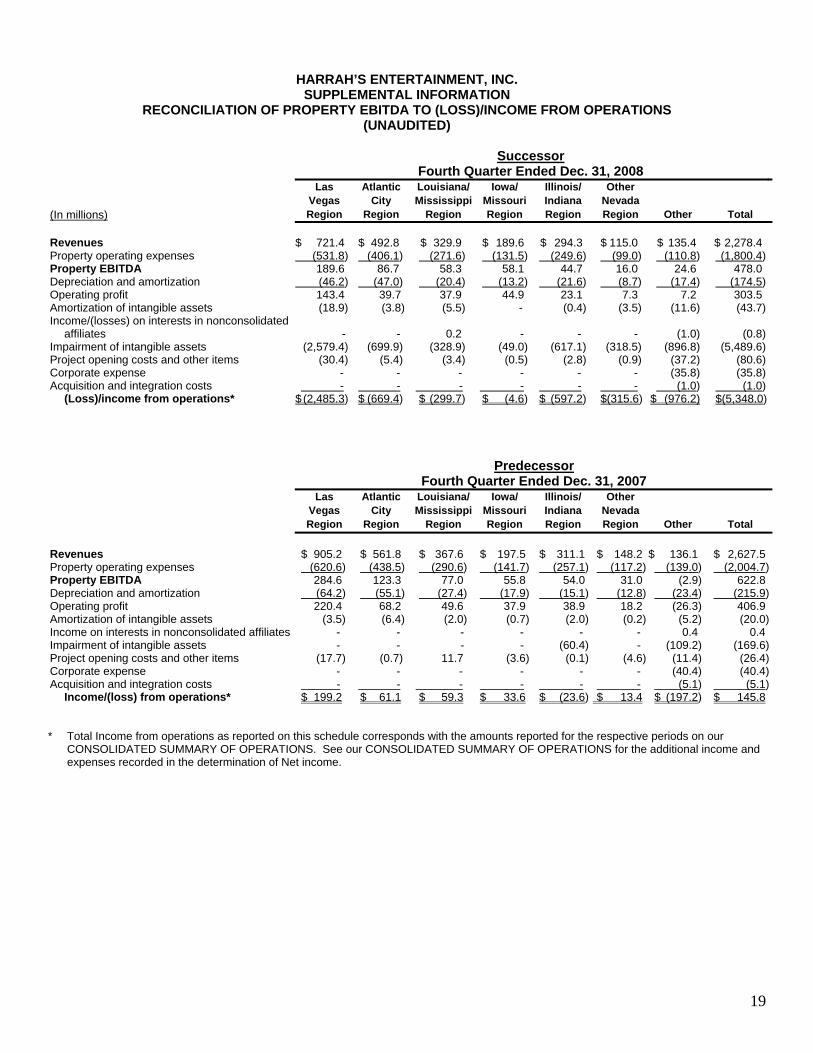
HARRAH’S ENTERTAINMENT, INC. SUPPLEMENTAL INFORMATION
RECONCILIATION OF PROPERTY EBITDA TO (LOSS)/INCOME FROM OPERATIONS (UNAUDITED)
Successor Fourth Quarter Ended Dec. 31, 2008 Las Atlantic Louisiana/ Iowa/ Illinois/ Other Vegas City Mississippi Missouri Indiana Nevada (In millions) Region Region Region Region Region Region Other Total Revenues $ 721.4 $ 492.8 $ 329.9 $ 189.6 $ 294.3 $ 115.0 $ 135.4 $ 2,278.4 Property operating expenses (531.8) (406.1) (271.6) (131.5) (249.6) (99.0) (110.8) (1,800.4) Property EBITDA 189.6 86.7 58.3 58.1 44.7 16.0 24.6 478.0 Depreciation and amortization (46.2) (47.0) (20.4) (13.2) (21.6) (8.7) (17.4) (174.5) Operating profit 143.4 39.7 37.9 44.9 23.1 7.3 7.2 303.5 Amortization of intangible assets (18.9) (3.8) (5.5) - (0.4) (3.5) (11.6) (43.7) Income/(losses) on interests in nonconsolidated
affiliates -
-
0.2
-
-
-
(1.0)
(0.8)
Impairment of intangible assets (2,579.4) (699.9) (328.9) (49.0) (617.1) (318.5) (896.8) (5,489.6) Project opening costs and other items (30.4) (5.4) (3.4) (0.5) (2.8) (0.9) (37.2) (80.6) Corporate expense - - - - - - (35.8) (35.8) Acquisition and integration costs - - - - - - (1.0) (1.0)
(Loss)/income from operations* $ (2,485.3) $ (669.4) $ (299.7) $ (4.6) $ (597.2) $(315.6) $ (976.2) $(5,348.0) Predecessor Fourth Quarter Ended Dec. 31, 2007 Las Atlantic Louisiana/ Iowa/ Illinois/ Other Vegas City Mississippi Missouri Indiana Nevada Region Region Region Region Region Region Other Total Revenues $ 905.2 $ 561.8 $ 367.6 $ 197.5 $ 311.1 $ 148.2 $ 136.1 $ 2,627.5 Property operating expenses (620.6) (438.5) (290.6) (141.7) (257.1) (117.2) (139.0) (2,004.7)Property EBITDA 284.6 123.3 77.0 55.8 54.0 31.0 (2.9) 622.8 Depreciation and amortization (64.2) (55.1) (27.4) (17.9) (15.1) (12.8) (23.4) (215.9)Operating profit 220.4 68.2 49.6 37.9 38.9 18.2 (26.3) 406.9 Amortization of intangible assets (3.5) (6.4) (2.0) (0.7) (2.0) (0.2) (5.2) (20.0)Income on interests in nonconsolidated affiliates - - - - - - 0.4 0.4 Impairment of intangible assets - - - - (60.4) - (109.2) (169.6)Project opening costs and other items (17.7) (0.7) 11.7 (3.6) (0.1) (4.6) (11.4) (26.4)Corporate expense - - - - - - (40.4) (40.4)Acquisition and integration costs - - - - - - (5.1) (5.1)
Income/(loss) from operations* $ 199.2 $ 61.1 $ 59.3 $ 33.6 $ (23.6) $ 13.4 $ (197.2) $ 145.8 * Total Income from operations as reported on this schedule corresponds with the amounts reported for the respective periods on our
CONSOLIDATED SUMMARY OF OPERATIONS. See our CONSOLIDATED SUMMARY OF OPERATIONS for the additional income and expenses recorded in the determination of Net income.
20
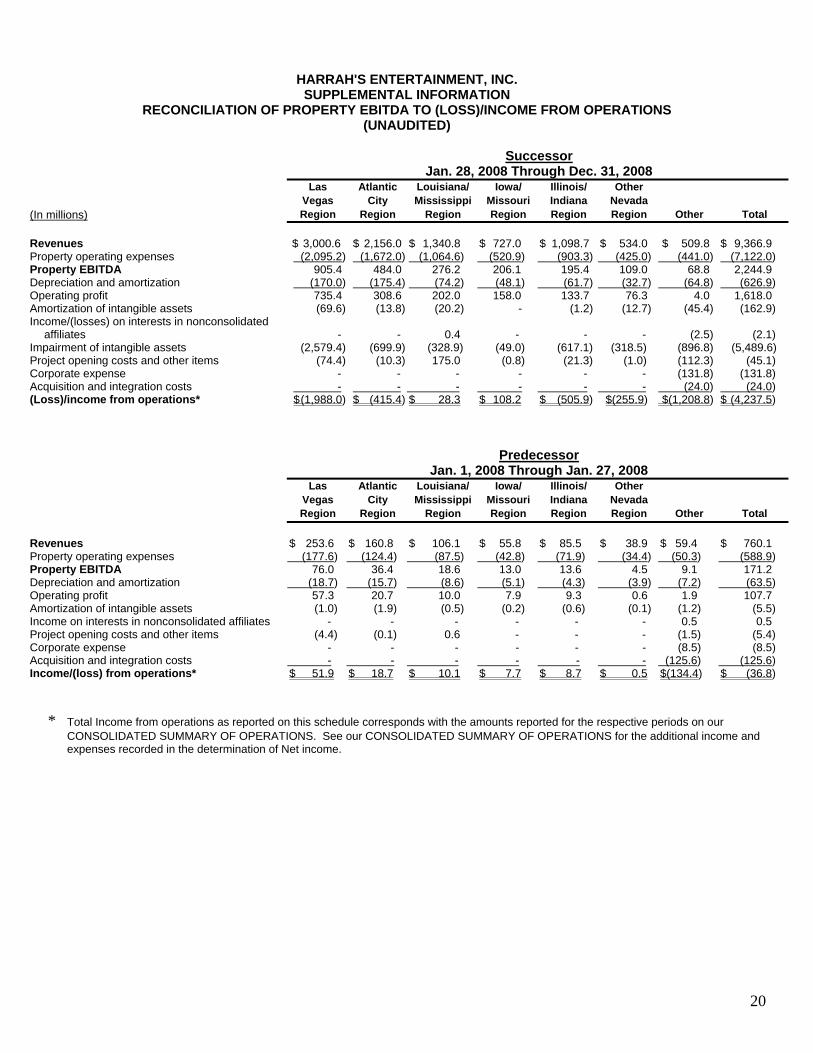
HARRAH'S ENTERTAINMENT, INC. SUPPLEMENTAL INFORMATION
RECONCILIATION OF PROPERTY EBITDA TO (LOSS)/INCOME FROM OPERATIONS (UNAUDITED)
Successor Jan. 28, 2008 Through Dec. 31, 2008 Las Atlantic Louisiana/ Iowa/ Illinois/ Other Vegas City Mississippi Missouri Indiana Nevada (In millions) Region Region Region Region Region Region Other Total Revenues $ 3,000.6 $ 2,156.0 $ 1,340.8 $ 727.0 $ 1,098.7 $ 534.0 $ 509.8 $ 9,366.9 Property operating expenses (2,095.2) (1,672.0) (1,064.6) (520.9) (903.3) (425.0) (441.0) (7,122.0) Property EBITDA 905.4 484.0 276.2 206.1 195.4 109.0 68.8 2,244.9 Depreciation and amortization (170.0) (175.4) (74.2) (48.1) (61.7) (32.7) (64.8) (626.9) Operating profit 735.4 308.6 202.0 158.0 133.7 76.3 4.0 1,618.0 Amortization of intangible assets (69.6) (13.8) (20.2) - (1.2) (12.7) (45.4) (162.9) Income/(losses) on interests in nonconsolidated
affiliates -
-
0.4
-
-
-
(2.5)
(2.1)
Impairment of intangible assets (2,579.4) (699.9) (328.9) (49.0) (617.1) (318.5) (896.8) (5,489.6) Project opening costs and other items (74.4) (10.3) 175.0 (0.8) (21.3) (1.0) (112.3) (45.1) Corporate expense - - - - - - (131.8) (131.8) Acquisition and integration costs - - - - - - (24.0) (24.0) (Loss)/income from operations* $ (1,988.0) $ (415.4) $ 28.3 $ 108.2 $ (505.9) $(255.9) $(1,208.8) $ (4,237.5) Predecessor Jan. 1, 2008 Through Jan. 27, 2008 Las Atlantic Louisiana/ Iowa/ Illinois/ Other Vegas City Mississippi Missouri Indiana Nevada Region Region Region Region Region Region Other Total Revenues $ 253.6 $ 160.8 $ 106.1 $ 55.8 $ 85.5 $ 38.9 $ 59.4 $ 760.1 Property operating expenses (177.6) (124.4) (87.5) (42.8) (71.9) (34.4) (50.3) (588.9) Property EBITDA 76.0 36.4 18.6 13.0 13.6 4.5 9.1 171.2 Depreciation and amortization (18.7) (15.7) (8.6) (5.1) (4.3) (3.9) (7.2) (63.5) Operating profit 57.3 20.7 10.0 7.9 9.3 0.6 1.9 107.7 Amortization of intangible assets (1.0) (1.9) (0.5) (0.2) (0.6) (0.1) (1.2) (5.5) Income on interests in nonconsolidated affiliates - - - - - - 0.5 0.5 Project opening costs and other items (4.4) (0.1) 0.6 - - - (1.5) (5.4) Corporate expense - - - - - - (8.5) (8.5) Acquisition and integration costs - - - - - - (125.6) (125.6) Income/(loss) from operations* $ 51.9 $ 18.7 $ 10.1 $ 7.7 $ 8.7 $ 0.5 $(134.4) $ (36.8)
* Total Income from operations as reported on this schedule corresponds with the amounts reported for the respective periods on our
CONSOLIDATED SUMMARY OF OPERATIONS. See our CONSOLIDATED SUMMARY OF OPERATIONS for the additional income and expenses recorded in the determination of Net income.
21
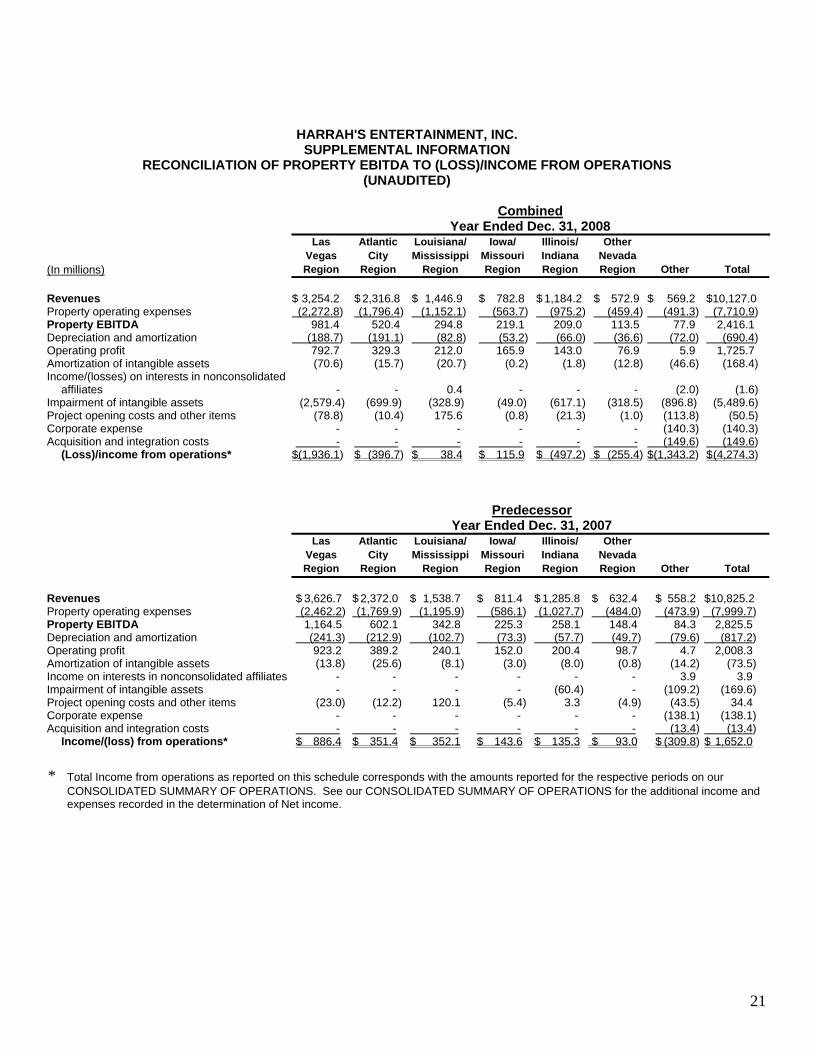
HARRAH'S ENTERTAINMENT, INC. SUPPLEMENTAL INFORMATION
RECONCILIATION OF PROPERTY EBITDA TO (LOSS)/INCOME FROM OPERATIONS (UNAUDITED)
Combined Year Ended Dec. 31, 2008 Las Atlantic Louisiana/ Iowa/ Illinois/ Other Vegas City Mississippi Missouri Indiana Nevada (In millions) Region Region Region Region Region Region Other Total Revenues $ 3,254.2 $ 2,316.8 $ 1,446.9 $ 782.8 $ 1,184.2 $ 572.9 $ 569.2 $10,127.0 Property operating expenses (2,272.8) (1,796.4) (1,152.1) (563.7) (975.2) (459.4) (491.3) (7,710.9) Property EBITDA 981.4 520.4 294.8 219.1 209.0 113.5 77.9 2,416.1 Depreciation and amortization (188.7) (191.1) (82.8) (53.2) (66.0) (36.6) (72.0) (690.4) Operating profit 792.7 329.3 212.0 165.9 143.0 76.9 5.9 1,725.7 Amortization of intangible assets (70.6) (15.7) (20.7) (0.2) (1.8) (12.8) (46.6) (168.4) Income/(losses) on interests in nonconsolidated
affiliates -
-
0.4
-
-
-
(2.0)
(1.6)
Impairment of intangible assets (2,579.4) (699.9) (328.9) (49.0) (617.1) (318.5) (896.8) (5,489.6) Project opening costs and other items (78.8) (10.4) 175.6 (0.8) (21.3) (1.0) (113.8) (50.5) Corporate expense - - - - - - (140.3) (140.3) Acquisition and integration costs - - - - - - (149.6) (149.6)
(Loss)/income from operations* $(1,936.1) $ (396.7) $ 38.4 $ 115.9 $ (497.2) $ (255.4) $(1,343.2) $ (4,274.3) Predecessor Year Ended Dec. 31, 2007 Las Atlantic Louisiana/ Iowa/ Illinois/ Other Vegas City Mississippi Missouri Indiana Nevada Region Region Region Region Region Region Other Total Revenues $ 3,626.7 $ 2,372.0 $ 1,538.7 $ 811.4 $ 1,285.8 $ 632.4 $ 558.2 $10,825.2 Property operating expenses (2,462.2) (1,769.9) (1,195.9) (586.1) (1,027.7) (484.0) (473.9) (7,999.7) Property EBITDA 1,164.5 602.1 342.8 225.3 258.1 148.4 84.3 2,825.5 Depreciation and amortization (241.3) (212.9) (102.7) (73.3) (57.7) (49.7) (79.6) (817.2) Operating profit 923.2 389.2 240.1 152.0 200.4 98.7 4.7 2,008.3 Amortization of intangible assets (13.8) (25.6) (8.1) (3.0) (8.0) (0.8) (14.2) (73.5) Income on interests in nonconsolidated affiliates - - - - - - 3.9 3.9 Impairment of intangible assets - - - - (60.4) - (109.2) (169.6) Project opening costs and other items (23.0) (12.2) 120.1 (5.4) 3.3 (4.9) (43.5) 34.4 Corporate expense - - - - - - (138.1) (138.1) Acquisition and integration costs - - - - - - (13.4) (13.4)
Income/(loss) from operations* $ 886.4 $ 351.4 $ 352.1 $ 143.6 $ 135.3 $ 93.0 $ (309.8) $ 1,652.0 * Total Income from operations as reported on this schedule corresponds with the amounts reported for the respective periods on our
CONSOLIDATED SUMMARY OF OPERATIONS. See our CONSOLIDATED SUMMARY OF OPERATIONS for the additional income and expenses recorded in the determination of Net income.

22
HARRAH'S ENTERTAINMENT, INC. SUPPLEMENTAL INFORMATION
RECONCILIATION OF LOSS FROM CONTINUING OPERATIONS TO ADJUSTED EBITDA (UNAUDITED)
Adjusted EBITDA is defined as EBITDA further adjusted to exclude unusual items and other adjustments required or permitted in
calculating covenant compliance under the indenture governing the senior notes and senior toggle notes, the interim loan agreement and/or our new senior credit facilities. We believe that the inclusion of supplementary adjustments to EBITDA applied in presenting Adjusted EBITDA are appropriate to provide additional information to investors about certain material non-cash items and about unusual items that we do not expect to continue at the same level in the future. Because not all companies use identical calculations, our presentation of Adjusted EBITDA may not be comparable to other similarly titled measures of other companies.
The following table reconciles Loss from continuing operations and Adjusted EBITDA of Harrah’s Entertainment, Inc. for the Successor
period for three months ended December 31, 2008, and the Predecessor period for three months ended December 31, 2007.
(In millions) Successor
Three months ended December 31, 2008
Predecessor Three months ended December 31, 2007
Loss from continuing operations..................................................................... $ (4,784.0) $ (56.1) Interest expense, net of interest income......................................................... 590.1 208.1 Benefit for income taxes ................................................................................. (212.8) (4.0) Depreciation and amortization ........................................................................ 221.7 247.8
EBITDA (a)................................................................................................... (4,185.0) 395.8 Project opening costs, abandoned projects and development costs (b) ......... 2.9 4.5 Acquisition and integration costs ................................................................... 1.0 5.1 Gains on early extinguishments of debt (c)...................................................... (946.0) - Minority interests, net of distributions (d) ........................................................ (3.8) (9.4) Impairment of goodwill and intangible assets ................................................ 5,489.6 169.6 Non-cash expense for stock compensation benefits (e) .................................. 4.0 13.6 Income from insurance claims for hurricane losses (f) .................................... - (13.4) Other non-recurring or non-cash items (g)....................................................... 90.9 52.8 Pro forma adjustment for acquired, new or disposed properties (h)................ - (0.5)
Adjusted EBITDA (i) .................................................................................... $ 453.6 $ 618.1
a) 2008 includes the impairment of goodwill and intangible assets. b) Represents (i) project opening costs incurred in connection with expansion and renovation projects at various properties; (ii) write-off of
abandoned development projects; and (iii) non-recurring strategic planning and restructuring costs.
c) Represents (i) the difference between the net book value and cash paid for notes exchanged and retired for cash; (ii) the difference between the net book value of the old notes and the fair market value of new notes issued; and (iii) the write-off of historical unamortized deferred financing costs and unamortized market value premiums/discounts.
d) Represents minority owners’ share of income from our majority-owned subsidiaries, net of cash distributions to minority owners.
e) Represents non-cash compensation expense related to stock options.
f) Represents non-recurring insurance recoveries related to Hurricane Katrina.
g) Represents the elimination of other non-recurring and non-cash items such as litigation awards and settlements, severance and relocation costs, excess gaming taxes, gains and losses from disposal of assets, equity in non-consolidated subsidiaries (net of distributions) and one-time costs relating to new state gaming legislation.
h) Represents the full period estimated impact of newly completed construction projects.
i) Does not include the yet-to-be-realized cost savings from our profitability improvement program.
23
HARRAH'S ENTERTAINMENT, INC. SUPPLEMENTAL INFORMATION
RECONCILIATION OF INCOME/(LOSS) FROM CONTINUING OPERATIONS TO LTM ADJUSTED EBITDA (UNAUDITED)
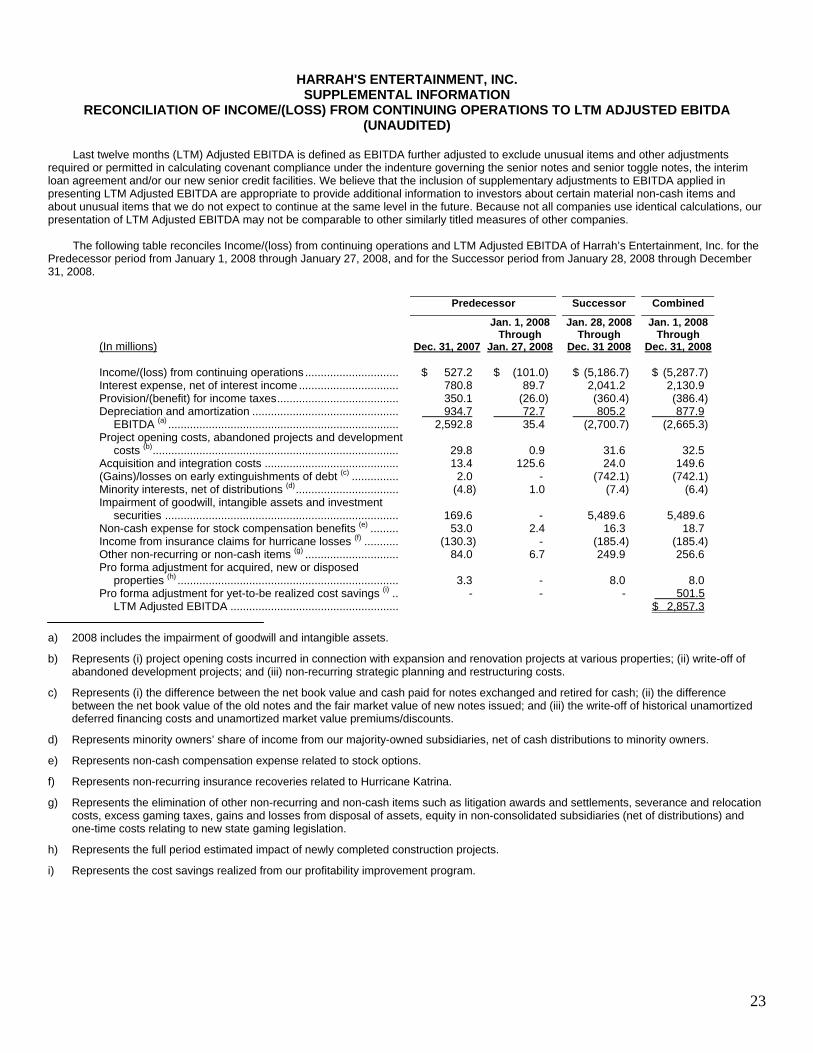
Last twelve months (LTM) Adjusted EBITDA is defined as EBITDA further adjusted to exclude unusual items and other adjustments
required or permitted in calculating covenant compliance under the indenture governing the senior notes and senior toggle notes, the interim loan agreement and/or our new senior credit facilities. We believe that the inclusion of supplementary adjustments to EBITDA applied in presenting LTM Adjusted EBITDA are appropriate to provide additional information to investors about certain material non-cash items and about unusual items that we do not expect to continue at the same level in the future. Because not all companies use identical calculations, our presentation of LTM Adjusted EBITDA may not be comparable to other similarly titled measures of other companies.
The following table reconciles Income/(loss) from continuing operations and LTM Adjusted EBITDA of Harrah’s Entertainment, Inc. for the
Predecessor period from January 1, 2008 through January 27, 2008, and for the Successor period from January 28, 2008 through December 31, 2008.
Predecessor Successor Combined
(In millions)
Dec. 31, 2007
Jan. 1, 2008 Through
Jan. 27, 2008
Jan. 28, 2008 Through
Dec. 31 2008
Jan. 1, 2008 Through
Dec. 31, 2008 Income/(loss) from continuing operations .............................. $ 527.2 $ (101.0) $ (5,186.7) $ (5,287.7) Interest expense, net of interest income ................................ 780.8 89.7 2,041.2 2,130.9 Provision/(benefit) for income taxes....................................... 350.1 (26.0) (360.4) (386.4) Depreciation and amortization ............................................... 934.7 72.7 805.2 877.9
EBITDA (a) .......................................................................... 2,592.8 35.4 (2,700.7) (2,665.3) Project opening costs, abandoned projects and development
costs (b)............................................................................... 29.8
0.9
31.6
32.5
Acquisition and integration costs ........................................... 13.4 125.6 24.0 149.6 (Gains)/losses on early extinguishments of debt (c) ............... 2.0 - (742.1) (742.1) Minority interests, net of distributions (d)................................. (4.8) 1.0 (7.4) (6.4) Impairment of goodwill, intangible assets and investment
securities ........................................................................... 169.6
-
5,489.6
5,489.6
Non-cash expense for stock compensation benefits (e) ......... 53.0 2.4 16.3 18.7 Income from insurance claims for hurricane losses (f) ........... (130.3) - (185.4) (185.4) Other non-recurring or non-cash items (g) .............................. 84.0 6.7 249.9 256.6 Pro forma adjustment for acquired, new or disposed
properties (h) ....................................................................... 3.3
-
8.0
8.0
Pro forma adjustment for yet-to-be realized cost savings (i) .. - - - 501.5 LTM Adjusted EBITDA ...................................................... $ 2,857.3
a) 2008 includes the impairment of goodwill and intangible assets.
b) Represents (i) project opening costs incurred in connection with expansion and renovation projects at various properties; (ii) write-off of abandoned development projects; and (iii) non-recurring strategic planning and restructuring costs.
c) Represents (i) the difference between the net book value and cash paid for notes exchanged and retired for cash; (ii) the difference between the net book value of the old notes and the fair market value of new notes issued; and (iii) the write-off of historical unamortized deferred financing costs and unamortized market value premiums/discounts.
d) Represents minority owners’ share of income from our majority-owned subsidiaries, net of cash distributions to minority owners.
e) Represents non-cash compensation expense related to stock options.
f) Represents non-recurring insurance recoveries related to Hurricane Katrina.
g) Represents the elimination of other non-recurring and non-cash items such as litigation awards and settlements, severance and relocation costs, excess gaming taxes, gains and losses from disposal of assets, equity in non-consolidated subsidiaries (net of distributions) and one-time costs relating to new state gaming legislation.
h) Represents the full period estimated impact of newly completed construction projects.
i) Represents the cost savings realized from our profitability improvement program.
24
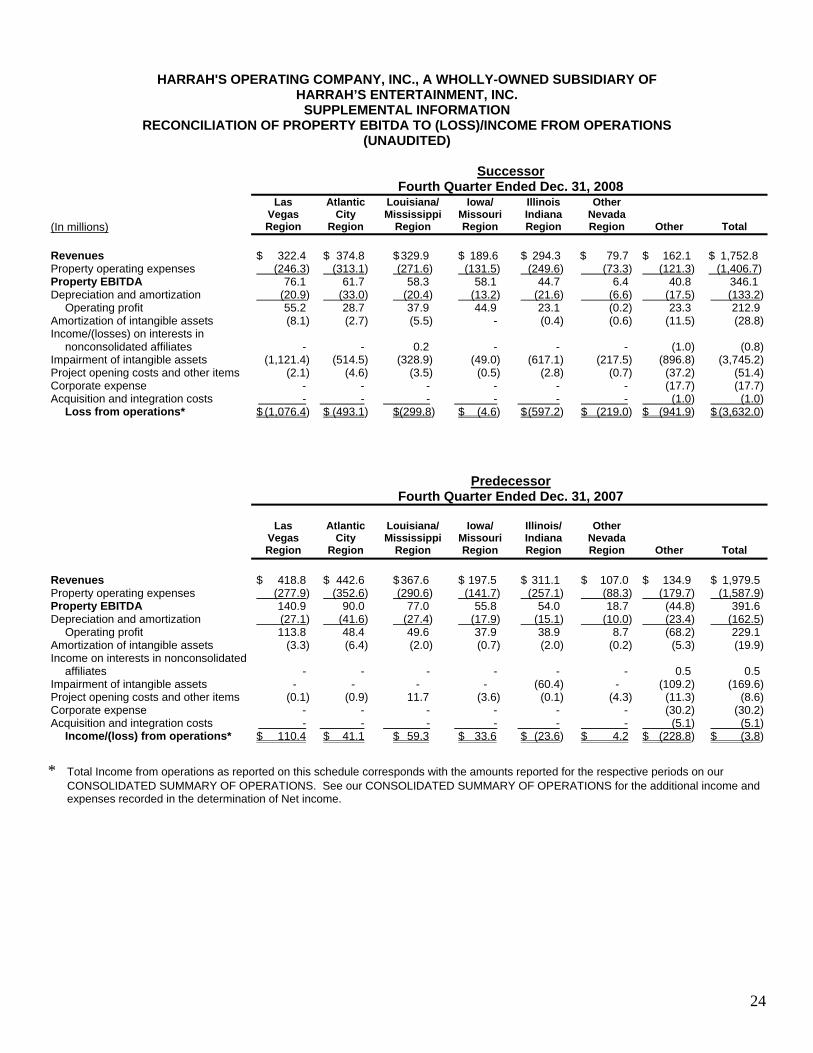
HARRAH'S OPERATING COMPANY, INC., A WHOLLY-OWNED SUBSIDIARY OF HARRAH’S ENTERTAINMENT, INC.
SUPPLEMENTAL INFORMATION RECONCILIATION OF PROPERTY EBITDA TO (LOSS)/INCOME FROM OPERATIONS
(UNAUDITED)
Successor Fourth Quarter Ended Dec. 31, 2008 Las
Vegas Atlantic
City Louisiana/ Mississippi
Iowa/ Missouri
Illinois Indiana
Other Nevada
(In millions) Region Region Region Region Region Region Other Total Revenues $ 322.4 $ 374.8 $ 329.9 $ 189.6 $ 294.3 $ 79.7 $ 162.1 $ 1,752.8 Property operating expenses (246.3) (313.1) (271.6) (131.5) (249.6) (73.3) (121.3) (1,406.7)Property EBITDA 76.1 61.7 58.3 58.1 44.7 6.4 40.8 346.1 Depreciation and amortization (20.9) (33.0) (20.4) (13.2) (21.6) (6.6) (17.5) (133.2)
Operating profit 55.2 28.7 37.9 44.9 23.1 (0.2) 23.3 212.9 Amortization of intangible assets (8.1) (2.7) (5.5) - (0.4) (0.6) (11.5) (28.8)Income/(losses) on interests in
nonconsolidated affiliates -
-
0.2
-
-
-
(1.0)
(0.8)
Impairment of intangible assets (1,121.4) (514.5) (328.9) (49.0) (617.1) (217.5) (896.8) (3,745.2)Project opening costs and other items (2.1) (4.6) (3.5) (0.5) (2.8) (0.7) (37.2) (51.4)Corporate expense - - - - - - (17.7) (17.7)Acquisition and integration costs - - - - - - (1.0) (1.0)
Loss from operations* $ (1,076.4) $ (493.1) $(299.8) $ (4.6) $ (597.2) $ (219.0) $ (941.9) $ (3,632.0) Predecessor Fourth Quarter Ended Dec. 31, 2007 Las
Vegas Atlantic
City Louisiana/ Mississippi
Iowa/ Missouri
Illinois/ Indiana
Other Nevada
Region Region Region Region Region Region Other Total Revenues $ 418.8 $ 442.6 $ 367.6 $ 197.5 $ 311.1 $ 107.0 $ 134.9 $ 1,979.5 Property operating expenses (277.9) (352.6) (290.6) (141.7) (257.1) (88.3) (179.7) (1,587.9)Property EBITDA 140.9 90.0 77.0 55.8 54.0 18.7 (44.8) 391.6 Depreciation and amortization (27.1) (41.6) (27.4) (17.9) (15.1) (10.0) (23.4) (162.5)
Operating profit 113.8 48.4 49.6 37.9 38.9 8.7 (68.2) 229.1 Amortization of intangible assets (3.3) (6.4) (2.0) (0.7) (2.0) (0.2) (5.3) (19.9)Income on interests in nonconsolidated
affiliates -
-
-
-
-
-
0.5
0.5
Impairment of intangible assets - - - - (60.4) - (109.2) (169.6)Project opening costs and other items (0.1) (0.9) 11.7 (3.6) (0.1) (4.3) (11.3) (8.6)Corporate expense - - - - - - (30.2) (30.2)Acquisition and integration costs - - - - - - (5.1) (5.1)
Income/(loss) from operations* $ 110.4 $ 41.1 $ 59.3 $ 33.6 $ (23.6) $ 4.2 $ (228.8) $ (3.8) * Total Income from operations as reported on this schedule corresponds with the amounts reported for the respective periods on our
CONSOLIDATED SUMMARY OF OPERATIONS. See our CONSOLIDATED SUMMARY OF OPERATIONS for the additional income and expenses recorded in the determination of Net income.
25
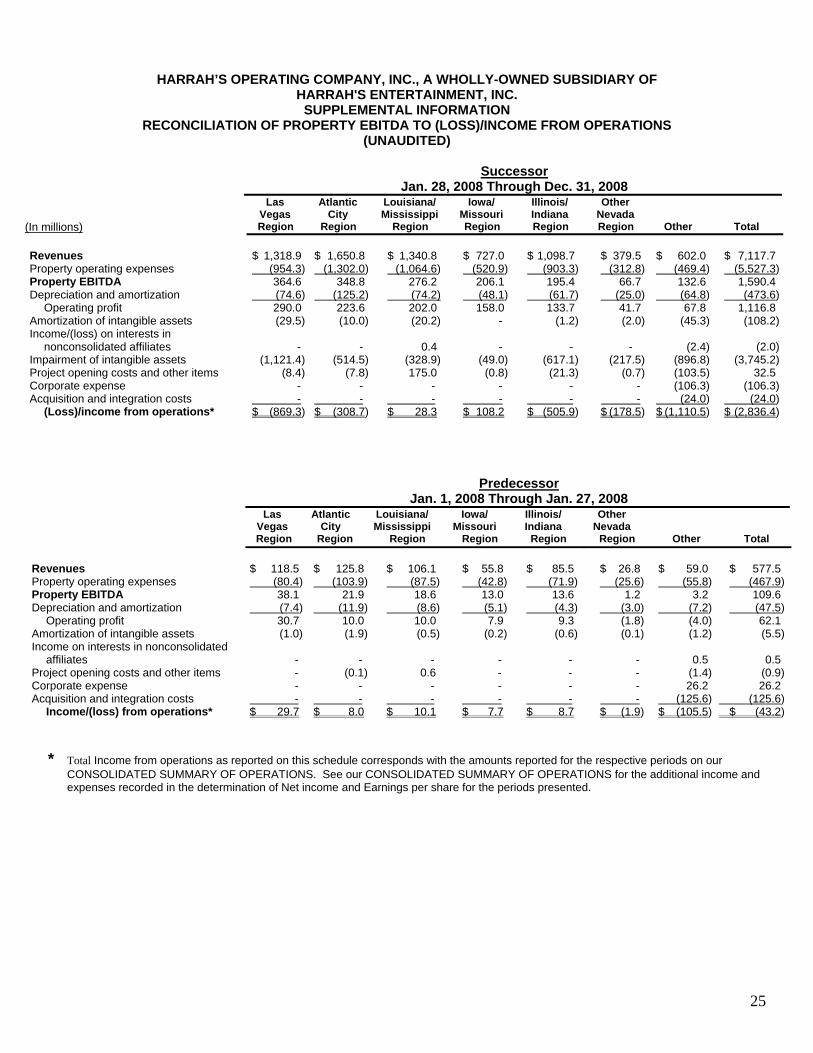
HARRAH’S OPERATING COMPANY, INC., A WHOLLY-OWNED SUBSIDIARY OF HARRAH'S ENTERTAINMENT, INC.
SUPPLEMENTAL INFORMATION RECONCILIATION OF PROPERTY EBITDA TO (LOSS)/INCOME FROM OPERATIONS
(UNAUDITED)
Successor Jan. 28, 2008 Through Dec. 31, 2008 Las
Vegas Atlantic
City Louisiana/ Mississippi
Iowa/ Missouri
Illinois/ Indiana
Other Nevada
(In millions) Region Region Region Region Region Region Other Total Revenues $ 1,318.9 $ 1,650.8 $ 1,340.8 $ 727.0 $ 1,098.7 $ 379.5 $ 602.0 $ 7,117.7 Property operating expenses (954.3) (1,302.0) (1,064.6) (520.9) (903.3) (312.8) (469.4) (5,527.3) Property EBITDA 364.6 348.8 276.2 206.1 195.4 66.7 132.6 1,590.4 Depreciation and amortization (74.6) (125.2) (74.2) (48.1) (61.7) (25.0) (64.8) (473.6)
Operating profit 290.0 223.6 202.0 158.0 133.7 41.7 67.8 1,116.8 Amortization of intangible assets (29.5) (10.0) (20.2) - (1.2) (2.0) (45.3) (108.2) Income/(loss) on interests in
nonconsolidated affiliates -
-
0.4
-
-
-
(2.4)
(2.0)
Impairment of intangible assets (1,121.4) (514.5) (328.9) (49.0) (617.1) (217.5) (896.8) (3,745.2) Project opening costs and other items (8.4) (7.8) 175.0 (0.8) (21.3) (0.7) (103.5) 32.5 Corporate expense - - - - - - (106.3) (106.3) Acquisition and integration costs - - - - - - (24.0) (24.0)
(Loss)/income from operations* $ (869.3) $ (308.7) $ 28.3 $ 108.2 $ (505.9) $ (178.5) $ (1,110.5) $ (2,836.4)
Predecessor Jan. 1, 2008 Through Jan. 27, 2008
Las Vegas
Atlantic City
Louisiana/ Mississippi
Iowa/ Missouri
Illinois/ Indiana
Other Nevada
Region Region Region Region Region Region Other Total Revenues $ 118.5 $ 125.8 $ 106.1 $ 55.8 $ 85.5 $ 26.8 $ 59.0 $ 577.5 Property operating expenses (80.4) (103.9) (87.5) (42.8) (71.9) (25.6) (55.8) (467.9) Property EBITDA 38.1 21.9 18.6 13.0 13.6 1.2 3.2 109.6 Depreciation and amortization (7.4) (11.9) (8.6) (5.1) (4.3) (3.0) (7.2) (47.5)
Operating profit 30.7 10.0 10.0 7.9 9.3 (1.8) (4.0) 62.1 Amortization of intangible assets (1.0) (1.9) (0.5) (0.2) (0.6) (0.1) (1.2) (5.5) Income on interests in nonconsolidated
affiliates -
-
-
-
-
-
0.5
0.5
Project opening costs and other items - (0.1) 0.6 - - - (1.4) (0.9) Corporate expense - - - - - - 26.2 26.2 Acquisition and integration costs - - - - - - (125.6) (125.6)
Income/(loss) from operations* $ 29.7 $ 8.0 $ 10.1 $ 7.7 $ 8.7 $ (1.9) $ (105.5) $ (43.2) * Total Income from operations as reported on this schedule corresponds with the amounts reported for the respective periods on our
CONSOLIDATED SUMMARY OF OPERATIONS. See our CONSOLIDATED SUMMARY OF OPERATIONS for the additional income and expenses recorded in the determination of Net income and Earnings per share for the periods presented.

26
HARRAH’S OPERATING COMPANY, INC., A WHOLLY-OWNED SUBSIDIARY OF HARRAH'S ENTERTAINMENT, INC.
SUPPLEMENTAL INFORMATION RECONCILIATION OF PROPERTY EBITDA TO (LOSS)/INCOME FROM OPERATIONS
(UNAUDITED)
Combined Year Ended Dec. 31, 2008 Las
Vegas Atlantic
City Louisiana/Mississippi
Iowa/ Missouri
Illinois/ Indiana
Other Nevada
(In millions) Region Region Region Region Region Region Other Total Revenues $ 1,437.4 $ 1,776.6 $ 1,446.9 $ 782.8 $ 1,184.2 $ 406.3 $ 661.0 $ 7,695.2 Property operating expenses (1,034.7) (1,405.9) (1,152.1) (563.7) (975.2) (338.4) (525.2) (5,995.2)Property EBITDA 402.7 370.7 294.8 219.1 209.0 67.9 135.8 1,700.0 Depreciation and amortization (82.0) (137.1) (82.8) (53.2) (66.0) (28.0) (72.0) (521.1)
Operating profit 320.7 233.6 212.0 165.9 143.0 39.9 63.8 1,178.9 Amortization of intangible assets (30.5) (11.9) (20.7) (0.2) (1.8) (2.1) (46.5) (113.7)Income/(loss) on interests in
nonconsolidated affiliates -
-
0.4
-
-
-
(1.9)
(1.5)
Impairment of intangible assets (1,121.4) (514.5) (328.9) (49.0) (617.1) (217.5) (896.8) (3,745.2)Project opening costs and other Items (8.4) (7.9) 175.6 (0.8) (21.3) (0.7) (104.9) 31.6 Corporate expense - - - - - - (80.1) (80.1)Acquisition and integration costs - - - - - - (149.6) (149.6)
(Loss)/income from operations* $ (839.6) $ (300.7) $ 38.4 $ 115.9 $ (497.2) $ (180.4) $(1,216.0) $ (2,879.6) Predecessor Year Ended Dec. 31, 2007 Las
Vegas Atlantic
City Louisiana/Mississippi
Iowa/ Missouri
Illinois/ Indiana
Other Nevada
Region Region Region Region Region Region Other Total Revenues $ 1,626.7 $ 1,872.6 $ 1,538.7 $ 811.4 $ 1,285.8 $ 454.2 $ 554.4 $ 8,143.8 Property operating expenses (1,090.4) (1,417.2) (1,195.9) (586.1) (1,027.7) (361.8) (475.8) (6,154.9)Property EBITDA 536.3 455.4 342.8 225.3 258.1 92.4 78.6 1,988.9 Depreciation and amortization (100.9) (159.5) (102.7) (73.3) (57.7) (38.8) (79.5) (612.4)
Operating profit 435.4 295.9 240.1 152.0 200.4 53.6 (0.9) 1,376.5 Amortization of intangible assets (13.3) (25.7) (8.1) (3.0) (8.0) (0.7) (14.2) (73.0)Income on interests in nonconsolidated
affiliates -
-
-
-
-
-
4.0
4.0
Impairment of intangible assets - - - - (60.4) - (109.2) (169.6)Project opening costs and other Items (4.9) (7.0) 120.1 (5.4) 3.3 (4.8) (42.5) 58.8 Corporate expense - - - - - - (99.1) (99.1)Acquisition and integration costs - - - - - - (13.4) (13.4)
Income/(loss) from operations* $ 417.2 $ 263.2 $ 352.1 $ 143.6 $ 135.3 $ 48.1 $ (275.3) $ 1,084.2
* Total Income from operations as reported on this schedule corresponds with the amounts reported for the respective periods on our CONSOLIDATED SUMMARY OF OPERATIONS. See our CONSOLIDATED SUMMARY OF OPERATIONS for the additional income and expenses recorded in the determination of Net income and Earnings per share for the periods presented.

27
HARRAH'S OPERATING COMPANY, INC., A WHOLLY-OWNED SUBSIDIARY OF HARRAH'S ENTERTAINMENT, INC.
SUPPLEMENTAL INFORMATION CALCULATION OF ADJUSTED EBITDA
(UNAUDITED)
Adjusted EBITDA is defined as EBITDA further adjusted to exclude unusual items and other adjustments required or permitted in calculating covenant compliance under the indenture governing the senior notes and senior toggle notes, the interim loan agreement and/or our new senior credit facilities. We believe that the inclusion of supplementary adjustments to EBITDA applied in presenting Adjusted EBITDA are appropriate to provide additional information to investors about certain material non-cash items and about unusual items that we do not expect to continue at the same level in the future. Because not all companies use identical calculations, our presentation of Adjusted EBITDA may not be comparable to other similarly titled measures of other companies.
In connection with the acquisition of the Company by affiliates of Apollo Global Management, LLC and TPG Capital, LP, eight of our properties and their related operating assets were spun off from Harrah’s Operating Company to Harrah's Entertainment through a series of distributions, liquidations, transfers and contributions, collectively referred to as “the CMBS Spin-Off.” The eight properties, as of the closing, are Harrah’s Las Vegas, Rio, Flamingo Las Vegas, Harrah’s Atlantic City, Showboat Atlantic City, Harrah’s Lake Tahoe, Harveys Lake Tahoe and Bill’s Lake Tahoe. Subsequent to the closing and subject to regulatory approval, Paris Las Vegas and Harrah’s Laughlin and their related operating assets will be spun off from Harrah’s Operating Company and its subsidiaries to Harrah’s Entertainment, and Harrah’s Lake Tahoe, Harveys Lake Tahoe, Bill’s Lake Tahoe and Showboat Atlantic City and their related operating assets will be transferred to subsidiaries of Harrah’s Operating Company from Harrah's Entertainment (the “Post-Close CMBS Exchange”). The properties spun off from Harrah’s Operating Company and owned by Harrah's Entertainment, whether at closing or after the subsequent transfer, will collectively be referred to as “the CMBS properties.” Also in connection with the acquisition by affiliates of Apollo and TPG, London Clubs International Limited (“London Clubs”) and its subsidiaries, with the exception of the subsidiaries related to the South Africa operations, became subsidiaries of Harrah’s Operating Company (“the London Clubs Transfer”). London Clubs and its subsidiaries were previously subsidiaries of Harrah Entertainment.
The following table reconciles Loss from continuing operations and Adjusted EBITDA for Harrah’s Operating Company, Inc., for the
Successor period for three months ended December 31, 2008, and the Predecessor period for three months ended December 31, 2007.
28
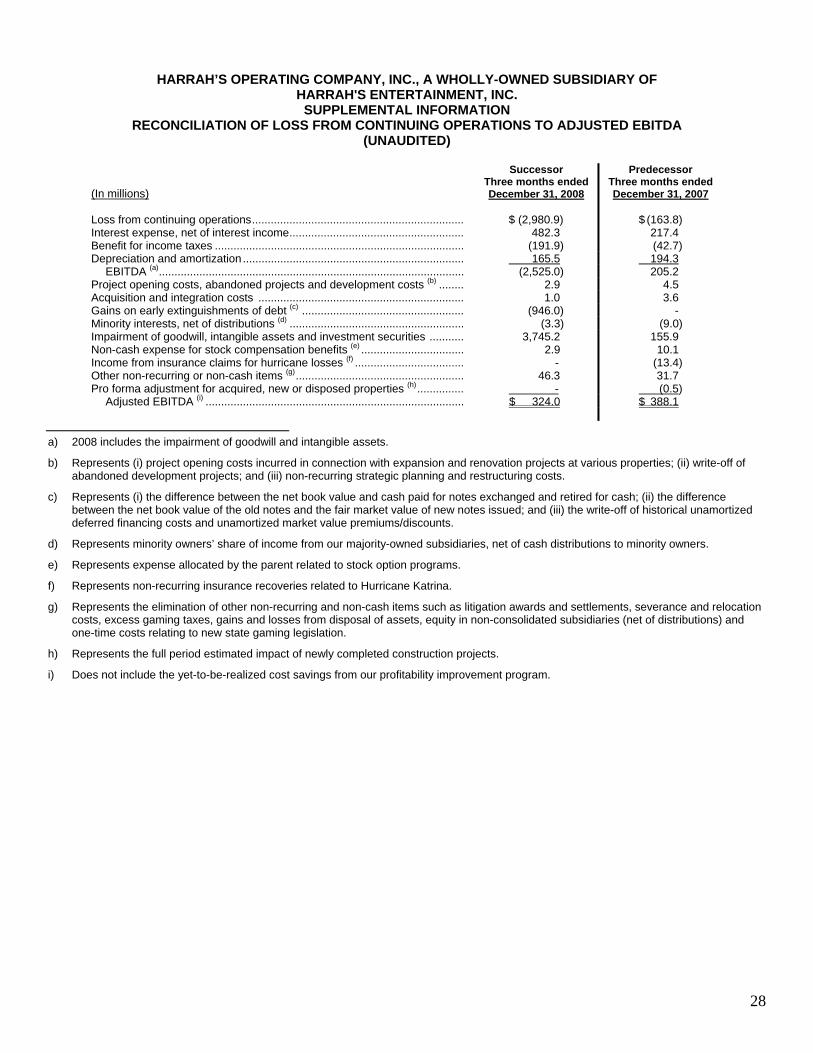
HARRAH’S OPERATING COMPANY, INC., A WHOLLY-OWNED SUBSIDIARY OF HARRAH'S ENTERTAINMENT, INC.
SUPPLEMENTAL INFORMATION RECONCILIATION OF LOSS FROM CONTINUING OPERATIONS TO ADJUSTED EBITDA
(UNAUDITED)
(In millions) Successor
Three months ended December 31, 2008
Predecessor Three months ended December 31, 2007
Loss from continuing operations.................................................................... $ (2,980.9) $ (163.8) Interest expense, net of interest income........................................................ 482.3 217.4 Benefit for income taxes ................................................................................ (191.9) (42.7) Depreciation and amortization ....................................................................... 165.5 194.3
EBITDA (a).................................................................................................. (2,525.0) 205.2 Project opening costs, abandoned projects and development costs (b) ........ 2.9 4.5 Acquisition and integration costs .................................................................. 1.0 3.6 Gains on early extinguishments of debt (c) .................................................... (946.0) - Minority interests, net of distributions (d) ........................................................ (3.3) (9.0) Impairment of goodwill, intangible assets and investment securities ........... 3,745.2 155.9 Non-cash expense for stock compensation benefits (e) ................................. 2.9 10.1 Income from insurance claims for hurricane losses (f) ................................... - (13.4) Other non-recurring or non-cash items (g)...................................................... 46.3 31.7 Pro forma adjustment for acquired, new or disposed properties (h)............... - (0.5)
Adjusted EBITDA (i) ................................................................................... $ 324.0 $ 388.1
a) 2008 includes the impairment of goodwill and intangible assets.
b) Represents (i) project opening costs incurred in connection with expansion and renovation projects at various properties; (ii) write-off of abandoned development projects; and (iii) non-recurring strategic planning and restructuring costs.
c) Represents (i) the difference between the net book value and cash paid for notes exchanged and retired for cash; (ii) the difference between the net book value of the old notes and the fair market value of new notes issued; and (iii) the write-off of historical unamortized deferred financing costs and unamortized market value premiums/discounts.
d) Represents minority owners’ share of income from our majority-owned subsidiaries, net of cash distributions to minority owners.
e) Represents expense allocated by the parent related to stock option programs.
f) Represents non-recurring insurance recoveries related to Hurricane Katrina.
g) Represents the elimination of other non-recurring and non-cash items such as litigation awards and settlements, severance and relocation costs, excess gaming taxes, gains and losses from disposal of assets, equity in non-consolidated subsidiaries (net of distributions) and one-time costs relating to new state gaming legislation.
h) Represents the full period estimated impact of newly completed construction projects.
i) Does not include the yet-to-be-realized cost savings from our profitability improvement program.

29
HARRAH'S OPERATING COMPANY, INC., A WHOLLY-OWNED SUBSIDIARY OF HARRAH’S ENTERTAINMENT, INC.
SUPPLEMENTAL INFORMATION RECONCILIATION OF INCOME/(LOSS) FROM CONTINUING OPERATIONS TO LTM ADJUSTED EBITDA
(UNAUDITED)
LTM Adjusted EBITDA is defined as EBITDA further adjusted to exclude unusual items and other adjustments required or permitted in calculating covenant compliance under the indenture governing the senior notes and senior toggle notes, the interim loan agreement and/or our new senior credit facilities. We believe that the inclusion of supplementary adjustments to EBITDA applied in presenting LTM Adjusted EBITDA are appropriate to provide additional information to investors about certain material non-cash items and about unusual items that we do not expect to continue at the same level in the future. Because not all companies use identical calculations, our presentation of LTM Adjusted EBITDA may not be comparable to other similarly titled measures of other companies.
The following table reconciles Income/(loss) from continuing operations and LTM Adjusted EBITDA of Statement of operations of Harrah's
Operating Company, Inc., for the Predecessor period from January 1, 2008 through January 27, 2008 and for the Successor period from January 28, 2008 through December 31, 2008.
Predecessor Successor Combined
(In millions)
Dec. 31, 2007
Jan. 1, 2008 Through
Jan. 27, 2008
Jan. 28, 2008 Through
Dec. 31, 2008
Jan. 1, 2008 Through
Dec. 31, 2008 Income/(loss) from continuing operations.............................. $ 166.8 $ (107.6) $ (3,396.9) $ (3,504.5) Interest expense, net of interest income................................ 787.5 85.7 1,675.4 1,761.1 Provision/(benefit) for income taxes....................................... 152.6 (21.6) (378.5) (400.1) Depreciation and amortization ............................................... 729.4 56.7 597.2 653.9
EBITDA (a) .......................................................................... 1,836.3 13.2 (1,502.8) (1,489.6) Project opening costs, abandoned projects and development
costs (b)............................................................................... 26.8
0.9
30.0
30.9
Acquisition and integration costs .......................................... 9.4 125.6 24.0 149.6 Losses/(gains) on early extinguishments of debt (c) ............... 2.0 - (742.1) (742.1) Minority interests, net of distributions (d)................................. (3.7) 0.8 (7.2) (6.4) Impairment of goodwill, intangible assets and investment
securities............................................................................ 155.9
-
3,745.2
3,745.2
Non-cash expense for stock compensation benefits (e) ......... 38.2 1.7 12.1 13.8 Income from insurance claims for hurricane losses (f) ........... (130.3) - (185.4) (185.4) Other non-recurring or non-cash items (g) .............................. 55.6 0.8 130.1 130.9 Pro forma adjustment for acquired, new or disposed
properties (h) ....................................................................... 3.3
-
8.0
8.0
Pro forma adjustment for yet-to-be realized cost savings (i) .. 361.1 LTM Adjusted EBITDA ...................................................... $ 2,016.0
a) 2008 includes the impairment of goodwill and intangible assets.
b) Represents (i) project opening costs incurred in connection with expansion and renovation projects at various properties; (ii) write-off of abandoned development projects; and (iii) non-recurring strategic planning and restructuring costs.
c) Represents (i) the difference between the net book value and cash paid for notes exchanged and retired for cash; (ii) the difference between the net book value of the old notes and the fair market value of new notes issued; and (iii) the write-off of historical unamortized deferred financing costs and premiums/discounts.
d) Represents minority owners’ share of income from our majority-owned subsidiaries, net of cash distributions to minority owners.
e) Represents expense allocated by the parent related to stock option programs.
f) Represents non-recurring insurance recoveries related to Hurricane Katrina.
g) Represents the elimination of other non-recurring and non-cash items such as litigation awards and settlements, severance and relocation costs, excess gaming taxes, gains and losses from disposal of assets, equity in non-consolidated subsidiaries (net of distributions) and one-time costs relating to new state gaming legislation.
h) Represents the full period estimated impact of newly completed construction projects.
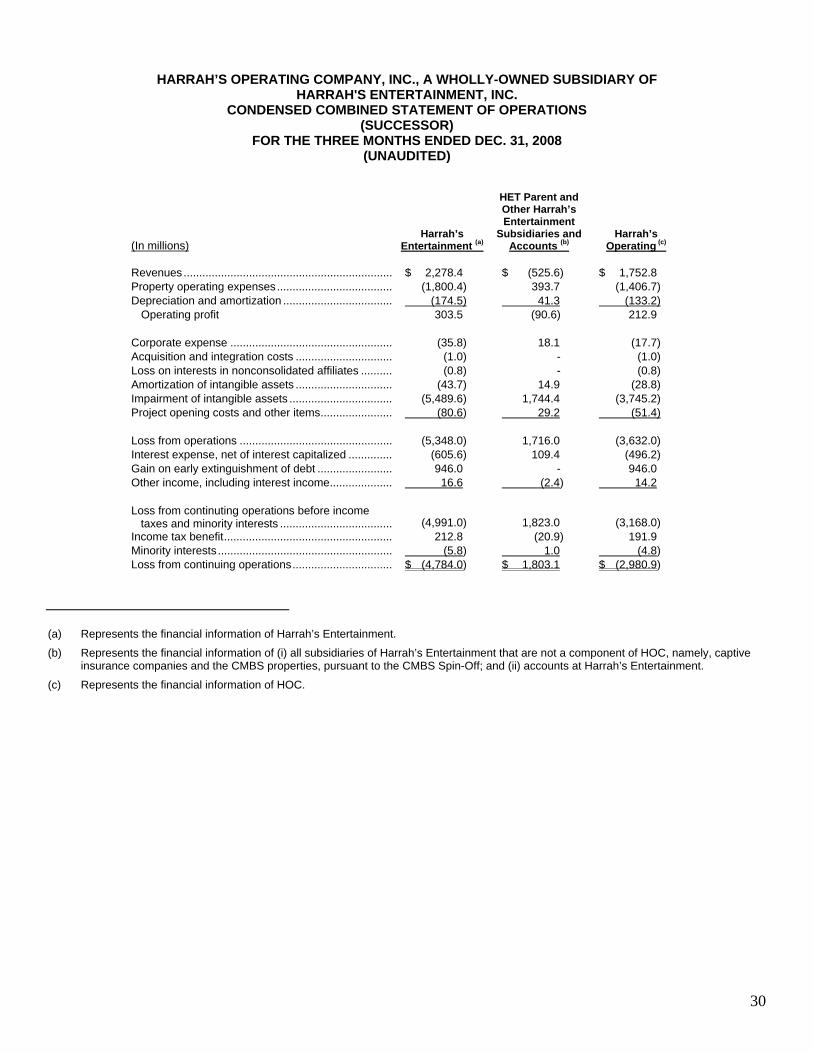
i) Represents the yet-to-be-realized cost savings from our profitability improvement program. The following tables present the condensed combined statement of operations of Harrah's Operating Company, Inc. for the Predecessor
period from January 1, 2008 through January 27, 2008 and for the Successor period from January 28, 2008 through December 31, 2008, taking into consideration the CMBS Spin-Off, the London Clubs Transfer and the Post-Close CMBS Transactions:
30
HARRAH’S OPERATING COMPANY, INC., A WHOLLY-OWNED SUBSIDIARY OF HARRAH'S ENTERTAINMENT, INC.
CONDENSED COMBINED STATEMENT OF OPERATIONS (SUCCESSOR)
FOR THE THREE MONTHS ENDED DEC. 31, 2008 (UNAUDITED)
(In millions)
Harrah’s Entertainment (a)
HET Parent and Other Harrah’s Entertainment
Subsidiaries and Accounts (b)
Harrah’s Operating (c)
Revenues .................................................................... $ 2,278.4 $ (525.6) $ 1,752.8 Property operating expenses...................................... (1,800.4) 393.7 (1,406.7) Depreciation and amortization .................................... (174.5) 41.3 (133.2)
Operating profit 303.5 (90.6) 212.9
Corporate expense ..................................................... (35.8) 18.1 (17.7) Acquisition and integration costs ................................ (1.0) - (1.0) Loss on interests in nonconsolidated affiliates ........... (0.8) - (0.8) Amortization of intangible assets ................................ (43.7) 14.9 (28.8) Impairment of intangible assets .................................. (5,489.6) 1,744.4 (3,745.2) Project opening costs and other items........................ (80.6) 29.2 (51.4)
Loss from operations .................................................. (5,348.0) 1,716.0 (3,632.0) Interest expense, net of interest capitalized ............... (605.6) 109.4 (496.2) Gain on early extinguishment of debt ......................... 946.0 - 946.0 Other income, including interest income..................... 16.6 (2.4) 14.2 Loss from continuting operations before income
taxes and minority interests ..................................... (4,991.0) 1,823.0 (3,168.0) Income tax benefit....................................................... 212.8 (20.9) 191.9 Minority interests......................................................... (5.8) 1.0 (4.8) Loss from continuing operations................................. $ (4,784.0) $ 1,803.1 $ (2,980.9)
(a) Represents the financial information of Harrah’s Entertainment.
(b) Represents the financial information of (i) all subsidiaries of Harrah’s Entertainment that are not a component of HOC, namely, captive insurance companies and the CMBS properties, pursuant to the CMBS Spin-Off; and (ii) accounts at Harrah’s Entertainment.
(c) Represents the financial information of HOC.
31
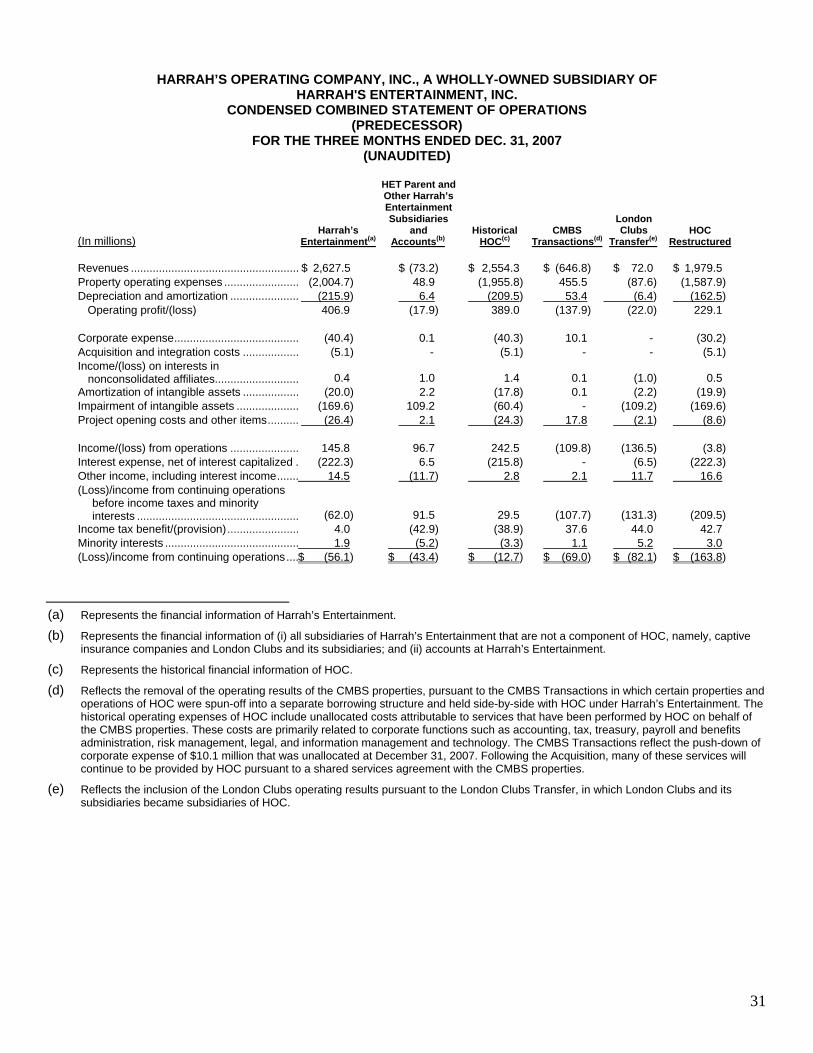
HARRAH’S OPERATING COMPANY, INC., A WHOLLY-OWNED SUBSIDIARY OF HARRAH'S ENTERTAINMENT, INC.
CONDENSED COMBINED STATEMENT OF OPERATIONS (PREDECESSOR)
FOR THE THREE MONTHS ENDED DEC. 31, 2007 (UNAUDITED)
(In millions)
Harrah’s
Entertainment(a)
HET Parent andOther Harrah’sEntertainmentSubsidiaries
and Accounts(b)
Historical HOC(c)
CMBS Transactions(d)
London Clubs
Transfer(e)
HOC Restructured
Revenues ...................................................... $ 2,627.5 $ (73.2) $ 2,554.3 $ (646.8) $ 72.0 $ 1,979.5 Property operating expenses ........................ (2,004.7) 48.9 (1,955.8) 455.5 (87.6) (1,587.9) Depreciation and amortization ...................... (215.9) 6.4 (209.5) 53.4 (6.4) (162.5)
Operating profit/(loss) 406.9 (17.9) 389.0 (137.9) (22.0) 229.1
Corporate expense........................................ (40.4) 0.1 (40.3) 10.1 - (30.2) Acquisition and integration costs .................. (5.1) - (5.1) - - (5.1) Income/(loss) on interests in
nonconsolidated affiliates........................... 0.4 1.0 1.4 0.1 (1.0) 0.5 Amortization of intangible assets .................. (20.0) 2.2 (17.8) 0.1 (2.2) (19.9) Impairment of intangible assets .................... (169.6) 109.2 (60.4) - (109.2) (169.6) Project opening costs and other items.......... (26.4) 2.1 (24.3) 17.8 (2.1) (8.6)
Income/(loss) from operations ...................... 145.8 96.7 242.5 (109.8) (136.5) (3.8) Interest expense, net of interest capitalized . (222.3) 6.5 (215.8) - (6.5) (222.3) Other income, including interest income....... 14.5 (11.7) 2.8 2.1 11.7 16.6 (Loss)/income from continuing operations
before income taxes and minority interests .................................................... (62.0) 91.5 29.5 (107.7) (131.3) (209.5)
Income tax benefit/(provision)....................... 4.0 (42.9) (38.9) 37.6 44.0 42.7 Minority interests ........................................... 1.9 (5.2) (3.3) 1.1 5.2 3.0 (Loss)/income from continuing operations....$ (56.1) $ (43.4) $ (12.7) $ (69.0) $ (82.1) $ (163.8)
(a) Represents the financial information of Harrah’s Entertainment.
(b) Represents the financial information of (i) all subsidiaries of Harrah’s Entertainment that are not a component of HOC, namely, captive insurance companies and London Clubs and its subsidiaries; and (ii) accounts at Harrah’s Entertainment.
(c) Represents the historical financial information of HOC.
(d) Reflects the removal of the operating results of the CMBS properties, pursuant to the CMBS Transactions in which certain properties and operations of HOC were spun-off into a separate borrowing structure and held side-by-side with HOC under Harrah’s Entertainment. The historical operating expenses of HOC include unallocated costs attributable to services that have been performed by HOC on behalf of the CMBS properties. These costs are primarily related to corporate functions such as accounting, tax, treasury, payroll and benefits administration, risk management, legal, and information management and technology. The CMBS Transactions reflect the push-down of corporate expense of $10.1 million that was unallocated at December 31, 2007. Following the Acquisition, many of these services will continue to be provided by HOC pursuant to a shared services agreement with the CMBS properties.
(e) Reflects the inclusion of the London Clubs operating results pursuant to the London Clubs Transfer, in which London Clubs and its subsidiaries became subsidiaries of HOC.
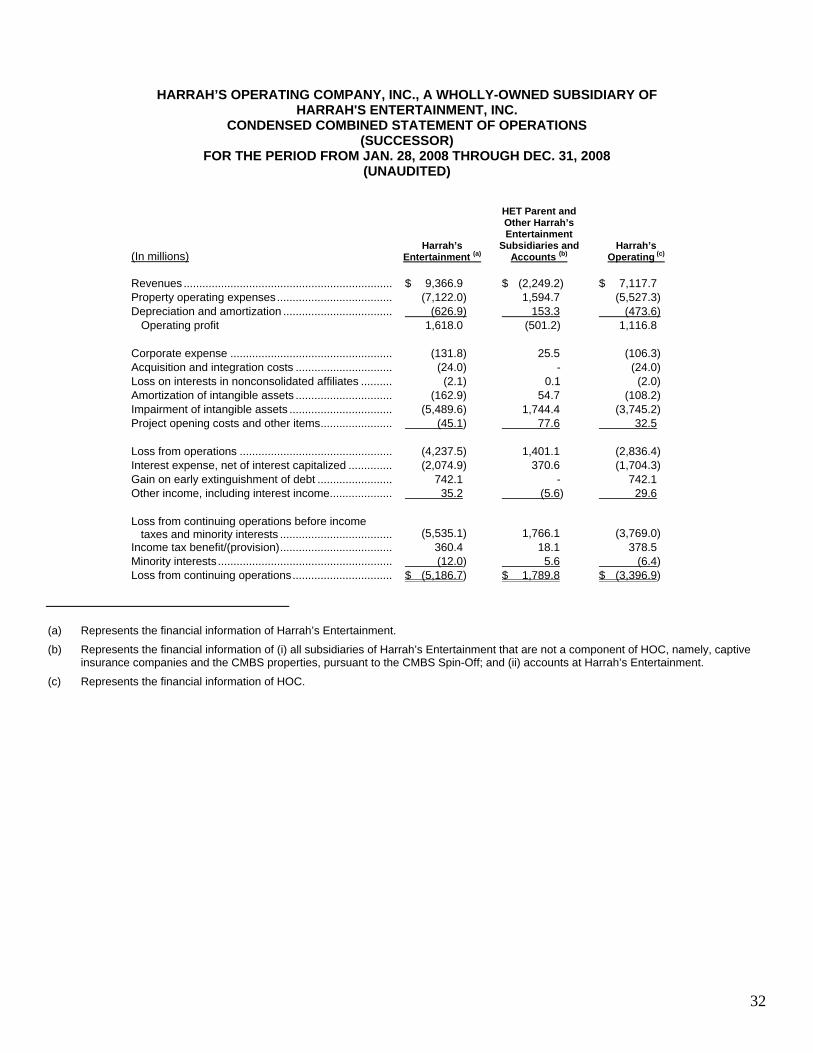
32
HARRAH’S OPERATING COMPANY, INC., A WHOLLY-OWNED SUBSIDIARY OF
HARRAH'S ENTERTAINMENT, INC. CONDENSED COMBINED STATEMENT OF OPERATIONS
(SUCCESSOR) FOR THE PERIOD FROM JAN. 28, 2008 THROUGH DEC. 31, 2008
(UNAUDITED)
(In millions)
Harrah’s Entertainment (a)
HET Parent and Other Harrah’s Entertainment
Subsidiaries and Accounts (b)
Harrah’s Operating (c)
Revenues .................................................................... $ 9,366.9 $ (2,249.2) $ 7,117.7 Property operating expenses...................................... (7,122.0) 1,594.7 (5,527.3) Depreciation and amortization .................................... (626.9) 153.3 (473.6)
Operating profit 1,618.0 (501.2) 1,116.8
Corporate expense ..................................................... (131.8) 25.5 (106.3) Acquisition and integration costs ................................ (24.0) - (24.0) Loss on interests in nonconsolidated affiliates ........... (2.1) 0.1 (2.0) Amortization of intangible assets ................................ (162.9) 54.7 (108.2) Impairment of intangible assets .................................. (5,489.6) 1,744.4 (3,745.2) Project opening costs and other items........................ (45.1) 77.6 32.5
Loss from operations .................................................. (4,237.5) 1,401.1 (2,836.4) Interest expense, net of interest capitalized ............... (2,074.9) 370.6 (1,704.3) Gain on early extinguishment of debt ......................... 742.1 - 742.1 Other income, including interest income..................... 35.2 (5.6) 29.6 Loss from continuing operations before income
taxes and minority interests ..................................... (5,535.1) 1,766.1 (3,769.0) Income tax benefit/(provision)..................................... 360.4 18.1 378.5 Minority interests......................................................... (12.0) 5.6 (6.4) Loss from continuing operations................................. $ (5,186.7) $ 1,789.8 $ (3,396.9)
(a) Represents the financial information of Harrah’s Entertainment.
(b) Represents the financial information of (i) all subsidiaries of Harrah’s Entertainment that are not a component of HOC, namely, captive insurance companies and the CMBS properties, pursuant to the CMBS Spin-Off; and (ii) accounts at Harrah’s Entertainment.
(c) Represents the financial information of HOC.
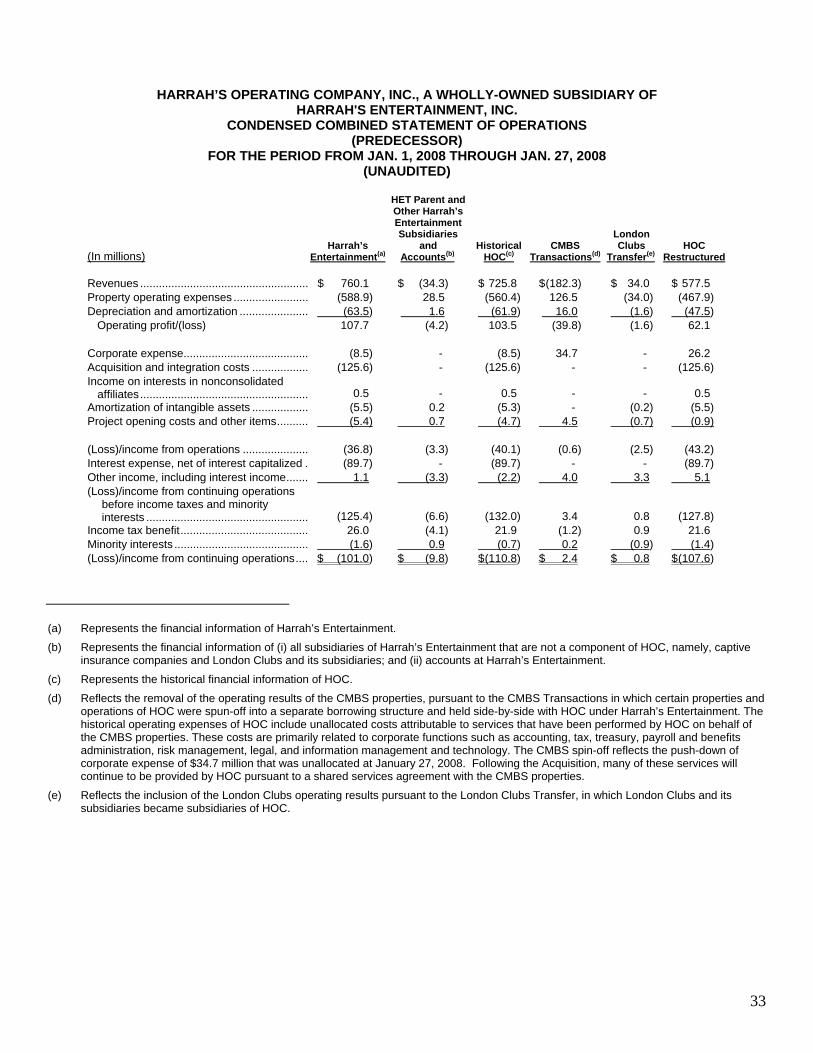
33
HARRAH’S OPERATING COMPANY, INC., A WHOLLY-OWNED SUBSIDIARY OF
HARRAH'S ENTERTAINMENT, INC. CONDENSED COMBINED STATEMENT OF OPERATIONS
(PREDECESSOR) FOR THE PERIOD FROM JAN. 1, 2008 THROUGH JAN. 27, 2008
(UNAUDITED)
(In millions)
Harrah’s
Entertainment(a)
HET Parent andOther Harrah’sEntertainmentSubsidiaries
and Accounts(b)
HistoricalHOC(c)
CMBS Transactions(d)
London Clubs
Transfer(e)
HOC Restructured
Revenues ...................................................... $ 760.1 $ (34.3) $ 725.8 $ (182.3) $ 34.0 $ 577.5 Property operating expenses ........................ (588.9) 28.5 (560.4) 126.5 (34.0) (467.9) Depreciation and amortization ...................... (63.5) 1.6 (61.9) 16.0 (1.6) (47.5)
Operating profit/(loss) 107.7 (4.2) 103.5 (39.8) (1.6) 62.1
Corporate expense........................................ (8.5) - (8.5) 34.7 - 26.2 Acquisition and integration costs .................. (125.6) - (125.6) - - (125.6) Income on interests in nonconsolidated
affiliates...................................................... 0.5 - 0.5 - - 0.5 Amortization of intangible assets .................. (5.5) 0.2 (5.3) - (0.2) (5.5) Project opening costs and other items.......... (5.4) 0.7 (4.7) 4.5 (0.7) (0.9)
(Loss)/income from operations ..................... (36.8) (3.3) (40.1) (0.6) (2.5) (43.2) Interest expense, net of interest capitalized . (89.7) - (89.7) - - (89.7) Other income, including interest income....... 1.1 (3.3) (2.2) 4.0 3.3 5.1 (Loss)/income from continuing operations
before income taxes and minority interests .................................................... (125.4) (6.6) (132.0) 3.4 0.8 (127.8)
Income tax benefit......................................... 26.0 (4.1) 21.9 (1.2) 0.9 21.6 Minority interests ........................................... (1.6) 0.9 (0.7) 0.2 (0.9) (1.4) (Loss)/income from continuing operations.... $ (101.0) $ (9.8) $ (110.8) $ 2.4 $ 0.8 $ (107.6)
(a) Represents the financial information of Harrah’s Entertainment.
(b) Represents the financial information of (i) all subsidiaries of Harrah’s Entertainment that are not a component of HOC, namely, captive insurance companies and London Clubs and its subsidiaries; and (ii) accounts at Harrah’s Entertainment.
(c) Represents the historical financial information of HOC.
(d) Reflects the removal of the operating results of the CMBS properties, pursuant to the CMBS Transactions in which certain properties and operations of HOC were spun-off into a separate borrowing structure and held side-by-side with HOC under Harrah’s Entertainment. The historical operating expenses of HOC include unallocated costs attributable to services that have been performed by HOC on behalf of the CMBS properties. These costs are primarily related to corporate functions such as accounting, tax, treasury, payroll and benefits administration, risk management, legal, and information management and technology. The CMBS spin-off reflects the push-down of corporate expense of $34.7 million that was unallocated at January 27, 2008. Following the Acquisition, many of these services will continue to be provided by HOC pursuant to a shared services agreement with the CMBS properties.
(e) Reflects the inclusion of the London Clubs operating results pursuant to the London Clubs Transfer, in which London Clubs and its subsidiaries became subsidiaries of HOC.
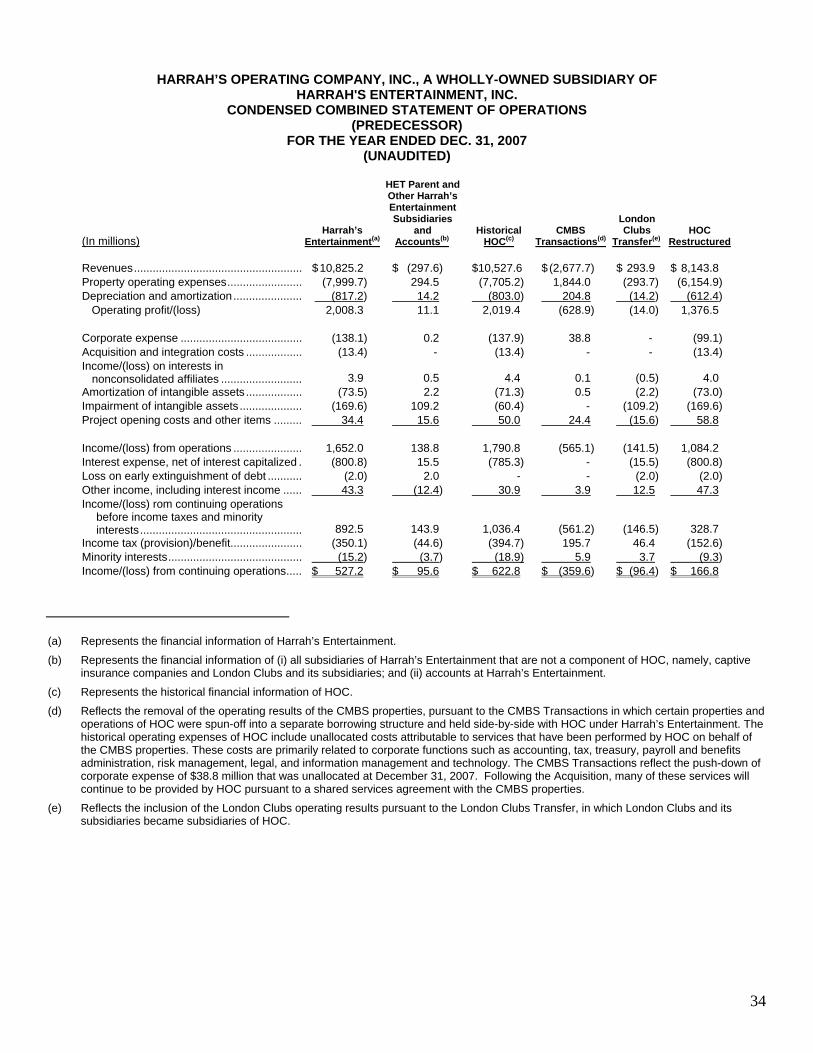
34
HARRAH’S OPERATING COMPANY, INC., A WHOLLY-OWNED SUBSIDIARY OF HARRAH'S ENTERTAINMENT, INC.
CONDENSED COMBINED STATEMENT OF OPERATIONS (PREDECESSOR)
FOR THE YEAR ENDED DEC. 31, 2007 (UNAUDITED)
(In millions)
Harrah’s
Entertainment(a)
HET Parent andOther Harrah’sEntertainmentSubsidiaries
and Accounts(b)
Historical HOC(c)
CMBS Transactions(d)
London Clubs
Transfer(e)
HOC Restructured
Revenues...................................................... $ 10,825.2 $ (297.6) $10,527.6 $ (2,677.7) $ 293.9 $ 8,143.8 Property operating expenses........................ (7,999.7) 294.5 (7,705.2) 1,844.0 (293.7) (6,154.9) Depreciation and amortization...................... (817.2) 14.2 (803.0) 204.8 (14.2) (612.4)
Operating profit/(loss) 2,008.3 11.1 2,019.4 (628.9) (14.0) 1,376.5
Corporate expense ....................................... (138.1) 0.2 (137.9) 38.8 - (99.1) Acquisition and integration costs .................. (13.4) - (13.4) - - (13.4) Income/(loss) on interests in
nonconsolidated affiliates .......................... 3.9 0.5 4.4 0.1 (0.5) 4.0 Amortization of intangible assets .................. (73.5) 2.2 (71.3) 0.5 (2.2) (73.0) Impairment of intangible assets.................... (169.6) 109.2 (60.4) - (109.2) (169.6) Project opening costs and other items ......... 34.4 15.6 50.0 24.4 (15.6) 58.8
Income/(loss) from operations ...................... 1,652.0 138.8 1,790.8 (565.1) (141.5) 1,084.2 Interest expense, net of interest capitalized . (800.8) 15.5 (785.3) - (15.5) (800.8) Loss on early extinguishment of debt ........... (2.0) 2.0 - - (2.0) (2.0) Other income, including interest income ...... 43.3 (12.4) 30.9 3.9 12.5 47.3 Income/(loss) rom continuing operations
before income taxes and minority interests.................................................... 892.5 143.9 1,036.4 (561.2) (146.5) 328.7
Income tax (provision)/benefit....................... (350.1) (44.6) (394.7) 195.7 46.4 (152.6) Minority interests........................................... (15.2) (3.7) (18.9) 5.9 3.7 (9.3) Income/(loss) from continuing operations..... $ 527.2 $ 95.6 $ 622.8 $ (359.6) $ (96.4) $ 166.8
(a) Represents the financial information of Harrah’s Entertainment.
(b) Represents the financial information of (i) all subsidiaries of Harrah’s Entertainment that are not a component of HOC, namely, captive insurance companies and London Clubs and its subsidiaries; and (ii) accounts at Harrah’s Entertainment.
(c) Represents the historical financial information of HOC.
(d) Reflects the removal of the operating results of the CMBS properties, pursuant to the CMBS Transactions in which certain properties and operations of HOC were spun-off into a separate borrowing structure and held side-by-side with HOC under Harrah’s Entertainment. The historical operating expenses of HOC include unallocated costs attributable to services that have been performed by HOC on behalf of the CMBS properties. These costs are primarily related to corporate functions such as accounting, tax, treasury, payroll and benefits administration, risk management, legal, and information management and technology. The CMBS Transactions reflect the push-down of corporate expense of $38.8 million that was unallocated at December 31, 2007. Following the Acquisition, many of these services will continue to be provided by HOC pursuant to a shared services agreement with the CMBS properties.
(e) Reflects the inclusion of the London Clubs operating results pursuant to the London Clubs Transfer, in which London Clubs and its subsidiaries became subsidiaries of HOC.