CONTACT: Alisa Rosenberg (914) 640-5214 STARWOOD … · STARWOOD REPORTS THIRD QUARTER 2005 RESULTS...
28
-1- CONTACT: Alisa Rosenberg (914) 640-5214 FOR IMMEDIATE RELEASE October 26, 2005 STARWOOD REPORTS THIRD QUARTER 2005 RESULTS WHITE PLAINS, NY, October 26, 2005 – Starwood Hotels & Resorts Worldwide, Inc. (NYSE: HOT): Third Quarter 2005 Highlights: EPS from continuing operations for the third quarter of 2005 was $0.18, compared to $0.49 in the third quarter of 2004. Excluding special items which primarily relate to tax expense on the adoption of a plan to repatriate foreign earnings in accordance with the American Jobs Creation Act of 2004 and additional tax expense related to the 1998 disposition of ITT World Directories, EPS from continuing operations was $0.58 for the third quarter of 2005 compared to $0.40 for the third quarter of 2004. REVPAR at Same-Store Owned Hotels in North America and worldwide increased 13.2% and 11.9%, respectively, when compared to the third quarter of 2004. ADR increased 10.1% and 8.5% in North America and worldwide, respectively. Margins at Starwood branded Same-Store Owned Hotels in North America improved approximately 280 basis points when compared to the third quarter of 2004. Globally, REVPAR for Same-Store Owned Hotels grew for W Hotels (24.5%), followed by St. Regis/Luxury Collection (11.2%), Westin (10.3%), and Sheraton (10.3%), with each of these brands experiencing both ADR and occupancy gains. Third-party management and franchise fees in the quarter increased 11.4% when compared to 2004. Vacation ownership and residential revenues, which exclude gains on sales of notes receivable, increased 33.1%. Excluding the fractional sales at the St. Regis Aspen and residential sales at the St. Regis in San Francisco, contract sales at vacation ownership properties were up 14.4% when compared to 2004. Net income for the third quarter of 2005 was $39 million, compared to net income of $107 million in the third quarter of 2004. Excluding special items, income from
-
Upload
hoangnguyet -
Category
Documents
-
view
215 -
download
2
Transcript of CONTACT: Alisa Rosenberg (914) 640-5214 STARWOOD … · STARWOOD REPORTS THIRD QUARTER 2005 RESULTS...

-1-
CONTACT: Alisa Rosenberg (914) 640-5214 FOR IMMEDIATE RELEASE October 26, 2005
STARWOOD REPORTS THIRD QUARTER 2005 RESULTS
WHITE PLAINS, NY, October 26, 2005 – Starwood Hotels & Resorts Worldwide, Inc. (NYSE: HOT):
Third Quarter 2005 Highlights:
EPS from continuing operations for the third quarter of 2005 was $0.18, compared to $0.49 in the third quarter of 2004. Excluding special items which primarily relate to tax expense on the adoption of a plan to repatriate foreign earnings in accordance with the American Jobs Creation Act of 2004 and additional tax expense related to the 1998 disposition of ITT World Directories, EPS from continuing operations was $0.58 for the third quarter of 2005 compared to $0.40 for the third quarter of 2004.
REVPAR at Same-Store Owned Hotels in North America and worldwide increased 13.2% and 11.9%, respectively, when compared to the third quarter of 2004. ADR increased 10.1% and 8.5% in North America and worldwide, respectively.
Margins at Starwood branded Same-Store Owned Hotels in North America improved approximately 280 basis points when compared to the third quarter of 2004.
Globally, REVPAR for Same-Store Owned Hotels grew for W Hotels (24.5%), followed by St. Regis/Luxury Collection (11.2%), Westin (10.3%), and Sheraton (10.3%), with each of these brands experiencing both ADR and occupancy gains.
Third-party management and franchise fees in the quarter increased 11.4% when compared to 2004.
Vacation ownership and residential revenues, which exclude gains on sales of notes receivable, increased 33.1%. Excluding the fractional sales at the St. Regis Aspen and residential sales at the St. Regis in San Francisco, contract sales at vacation ownership properties were up 14.4% when compared to 2004.
Net income for the third quarter of 2005 was $39 million, compared to net income of $107 million in the third quarter of 2004. Excluding special items, income from
-2-
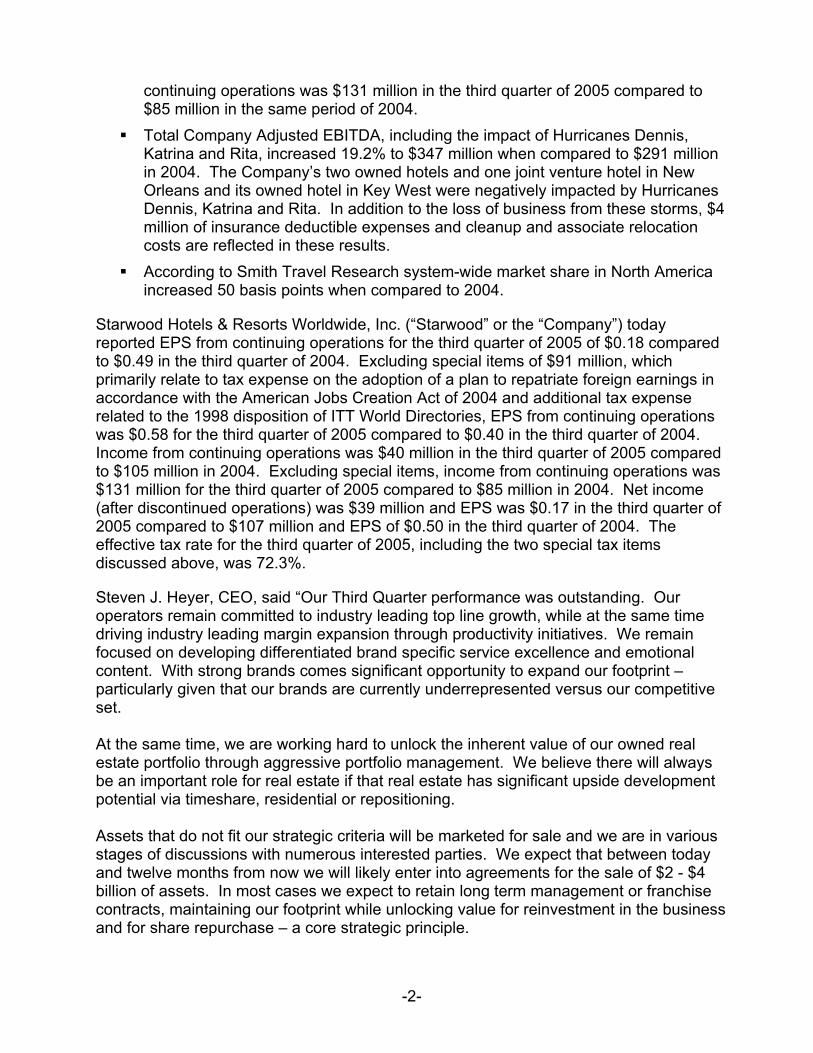
continuing operations was $131 million in the third quarter of 2005 compared to $85 million in the same period of 2004.
Total Company Adjusted EBITDA, including the impact of Hurricanes Dennis, Katrina and Rita, increased 19.2% to $347 million when compared to $291 million in 2004. The Company’s two owned hotels and one joint venture hotel in New Orleans and its owned hotel in Key West were negatively impacted by Hurricanes Dennis, Katrina and Rita. In addition to the loss of business from these storms, $4 million of insurance deductible expenses and cleanup and associate relocation costs are reflected in these results.
According to Smith Travel Research system-wide market share in North America increased 50 basis points when compared to 2004.
Starwood Hotels & Resorts Worldwide, Inc. (“Starwood” or the “Company”) today reported EPS from continuing operations for the third quarter of 2005 of $0.18 compared to $0.49 in the third quarter of 2004. Excluding special items of $91 million, which primarily relate to tax expense on the adoption of a plan to repatriate foreign earnings in accordance with the American Jobs Creation Act of 2004 and additional tax expense related to the 1998 disposition of ITT World Directories, EPS from continuing operations was $0.58 for the third quarter of 2005 compared to $0.40 in the third quarter of 2004. Income from continuing operations was $40 million in the third quarter of 2005 compared to $105 million in 2004. Excluding special items, income from continuing operations was $131 million for the third quarter of 2005 compared to $85 million in 2004. Net income (after discontinued operations) was $39 million and EPS was $0.17 in the third quarter of 2005 compared to $107 million and EPS of $0.50 in the third quarter of 2004. The effective tax rate for the third quarter of 2005, including the two special tax items discussed above, was 72.3%.
Steven J. Heyer, CEO, said “Our Third Quarter performance was outstanding. Our operators remain committed to industry leading top line growth, while at the same time driving industry leading margin expansion through productivity initiatives. We remain focused on developing differentiated brand specific service excellence and emotional content. With strong brands comes significant opportunity to expand our footprint – particularly given that our brands are currently underrepresented versus our competitive set. At the same time, we are working hard to unlock the inherent value of our owned real estate portfolio through aggressive portfolio management. We believe there will always be an important role for real estate if that real estate has significant upside development potential via timeshare, residential or repositioning. Assets that do not fit our strategic criteria will be marketed for sale and we are in various stages of discussions with numerous interested parties. We expect that between today and twelve months from now we will likely enter into agreements for the sale of $2 - $4 billion of assets. In most cases we expect to retain long term management or franchise contracts, maintaining our footprint while unlocking value for reinvestment in the business and for share repurchase – a core strategic principle.

-3-
Our core lodging businesses remain strong. The time is right to harvest previously unrecognized assets, build on our innovative culture, build world class brands, drive related growth and secure our position as the premier owned, management and franchise hotel and resort company.” Operating Results:
Third Quarter Ended September 30, 2005
Cash flow from operations was $588 million compared to $195 million in 2004. Total Company Adjusted EBITDA was $347 million compared to $291 million in 2004.
Owned, Leased and Consolidated Joint Venture Hotels
REVPAR for Same-Store Owned Hotels in North America and worldwide increased 13.2% and 11.9%, respectively, when compared to 2004. REVPAR at Same-Store Owned Hotels in North America increased 24.5% at W, 21.6% at St. Regis/Luxury Collection, 10.8% at Sheraton, and 10.5% at Westin. REVPAR growth was particularly strong at the Company’s owned hotels in New York, Seattle, Chicago, Los Angeles, Maui, Toronto, San Diego, San Francisco, and Atlanta. Revenue from transient travel was up 17.4% in North America when compared to 2004. Internationally, Same-Store Owned Hotel REVPAR increased 8.4%, with Latin America up 18.2% (REVPAR in owned hotels in Argentina, Brazil, Peru and resort areas in Mexico was particularly strong), Europe up 6.9%, and Asia Pacific up 5.6%. Excluding the favorable effects of foreign exchange, REVPAR increased 6.4% internationally.
Total revenues at Same-Store Owned Hotels worldwide increased 10.3% to $848 million when compared to $769 million in 2004 while costs and expenses at the hotels increased 7.0% to $624 million in 2005 compared to $583 million in 2004. Total revenues at Same-Store Owned Hotels in North America increased 10.9% to $613 million in 2005 when compared to $553 million in 2004 while costs and expenses at these hotels increased 7.4% to $454 million when compared to $423 million in 2004.
System-wide REVPAR; Management/Franchise Fees
System-wide (owned, managed and franchised) REVPAR for Same-Store Hotels in North America increased 11.7%; W Hotels 23.8%, St. Regis/Luxury Collection 18.2%, Sheraton 11.5%, Four Points by Sheraton 10.7%, and Westin 9.3%. For the twelfth quarter in a row, total Company market share in North America increased for the Company’s owned and managed hotels as well as for system-wide hotels. Total third-party management and franchise fees were $91 million, up $9 million, or 11.4%, from last year.
Distribution
Starwood’s central distribution systems gross bookings during the third quarter of 2005 increased approximately 7.7% when compared to 2004. Gross online bookings through proprietary branded websites increased 19.8% as compared to 2004, with gross dollar bookings from the proprietary branded sites increasing 32.3%. Gross online dollar bookings represented approximately 11.6% of the overall gross dollar bookings, with 76.1% of that coming from our proprietary branded websites, as compared to 10.3% of

-4-
overall gross dollar bookings, with 73.3% of that from proprietary branded websites in 2004.
Vacation Ownership and Residential
Vacation ownership and residential revenue, which excludes gains on sales of notes receivable (there were no sales of notes receivable in the third quarter of 2005), was up $58 million, or 33.1% to $233 million when compared to 2004 primarily due to residential sales at the St. Regis Museum Tower in San Francisco. Vacation ownership sales increased at our resorts in Orlando, Scottsdale and Maui and decreased at our resort in Rancho Mirage, California, where substantially all of the available inventory has been sold. Contract sales, excluding fractional sales at the St. Regis Aspen and residential sales at the St. Regis in San Francisco, were up 14.4% when compared to 2004. The average price per timeshare unit sold increased approximately 7.7% to $21,595, and the number of contracts signed increased approximately 6.2% when compared to 2004.
In the third quarter of 2005, the Company continued selling condominiums at the St. Regis Museum Tower which is in the final stages of construction in San Francisco, and recognized revenues of approximately $57 million. This mixed-use project (hotel and residential) received a temporary certificate of occupancy earlier this month, and is expected to open in early November.
In addition to its robust pipeline of existing vacation ownership inventory, the Company continues to evaluate its existing owned real estate for potential conversion to vacation ownership, fractional, or residential projects. For example, the Company is converting two floors of the St. Regis hotel in New York into fractional units and has partially demolished the Sheraton in Cancun, Mexico where it will build a timeshare development that is expected to have up to 73 units upon completion of the first phase. The Company is also working with its business partners to develop similar conversion opportunities at managed hotels.
Currently, the Company is working on new phases at the Westin Ka’anapali Ocean Resort Villas in Maui, Hawaii, the Westin Kierland Villas in Scottsdale, Arizona, the Sheraton Broadway Plantation in Myrtle Beach, South Carolina, and the Sheraton Vistana Villages in Orlando, Florida.
In addition to the expansion at the existing properties above, Starwood Vacation Ownership is in the predevelopment phase of several new vacation ownership resorts including one in Princeville on the island of Kauai, Hawaii. The Company is also working on a third St. Regis-branded fractional resort in Punta Mita, Mexico.
As mentioned earlier, the Company did not sell any notes receivable and thereby did not recognize any gains during the third quarter of 2005 compared to gains of $3 million in the same period of 2004.
Brand Development/Unit Growth
During the third quarter, the Company signed 17 hotel management and franchise contracts (representing approximately 4,000 rooms) including the Westin Paris (Paris, France, 438 rooms), Sheraton Maitland (Maitland, Florida, 396 rooms), Sheraton

-5-
Carlsbad (Carlsbad, California, 350 rooms) and Four Points by Sheraton Shanghai Pudong (Shanghai, China, 340 rooms). Nine new hotels and resorts (representing approximately 1,500 rooms) entered the system, including the Sheraton Myrtle Beach Convention Center Hotel (Myrtle Beach, South Carolina, 402 rooms), and the Sheraton Oran Hotel & Towers (Oran, Algeria, 321 rooms). Ten properties (representing approximately 2,300 rooms) were removed from the system during the quarter (4 Sheratons, 3 Four Points, 2 Luxury Collection and 1 unbranded). The Company had approximately 200 hotels and approximately 53,000 rooms in its active global development pipeline at September 30, 2005, with roughly half of that number in international locations.
In September 2005, the Company opened its second Remede Spa in the St. Regis hotel in New York, and in October 2005 opened a new Bliss spa, its sixth overall, in the W Lakeshore hotel in Chicago.
In the fourth quarter of 2005 and in 2006, the Company plans to open 2 new Bliss spas in W hotels in Dallas and Los Angeles, and a new Remede Spa in the St. Regis hotel in San Francisco with several others in various planning stages.
Results for the Nine Months Ended September 30, 2005:
EPS from continuing operations was $1.18 compared to $1.21 in 2004. Excluding special items, EPS from continuing operations was $1.63 compared to $1.05 in 2004. Income from continuing operations was $264 million compared to $258 million in 2004. Excluding special items, income from continuing operations was $364 million compared to $225 million in 2004. Net income (after discontinued operations) was $263 million and EPS was $1.18 compared to $295 million and $1.38, respectively, in 2004.
Cash flow from operations was $818 million compared to $377 million in 2004. Total Company Adjusted EBITDA was $1.026 billion compared to $823 million in 2004.
Capital:
Gross capital spending during the quarter included approximately $57 million in renovations of hotel assets including construction capital at the St. Regis in New York, New York, the Westin Long Beach in Long Beach, California, and the Sheraton Centre Toronto Hotel in Toronto, Canada. Investment spending on gross VOI inventory was $27 million, which was more than offset by cost of sales of $43 million tied to VOI sales during the quarter. The inventory spend included VOI construction at the Westin Ka’anapali Ocean Resort Villas in Maui, Hawaii, the Sheraton Vistana Villages in Orlando, Florida, and the Westin Kierland Villas in Scottsdale, Arizona. Additionally during the quarter, further investment spending of $85 million included the ongoing development of the St. Regis Museum Tower in San Francisco which will consist of 260 hotel rooms and 102 condominium units. Through September 30, 2005, the Company has invested $294 million in the St. Regis Museum Tower project, which, as discussed earlier, is expected to open in early November 2005. The Company expects to realize gross proceeds of approximately $245 million from the sale of the project’s condominiums and has recognized approximately $156 million in revenues to date.

-6-
Balance Sheet:
At September 30, 2005, the Company had total debt of $4.307 billion and cash and cash equivalents (including $262 million of restricted cash) of $1.171 billion, or net debt of $3.136 billion, compared to net debt of $3.460 billion at the end of the second quarter of 2005. In addition, the Company continues to have an investment in the senior debt of Le Meridien hotels and at September 30, 2005 the balance of that investment including accrued interest was $225 million.
At September 30, 2005, debt was approximately 78% fixed rate and 22% floating rate and its weighted average maturity was 4.4 years with a weighted average interest rate of 6.15%. The Company had cash (including total restricted cash) and availability under domestic and international revolving credit facilities of approximately $2.172 billion.
2005 Asset Sales In the nine months ended September 30, 2005, in addition to the sale of three hotels in joint ventures that we hold minority interest in, the Company sold six wholly owned hotels for total cash proceeds of $132 million. In addition, the Company signed purchase and sale agreements for another three hotels for gross proceeds of approximately $334 million. These sales are expected to close before the end of 2005. The Company’s guidance for 2006 includes only management or franchise fees expected from these sold hotels.
Outlook:
All comments in the following paragraphs and certain comments in this release above are deemed to be forward-looking statements. These statements reflect expectations of the Company’s performance given its current base of assets and its current understanding of external economic and geo-political environments. Actual results may differ materially.
For the fourth quarter of 2005, if REVPAR at Same-Store Owned Hotels in North America increases approximately 10% -12% versus the same period in 2004:
Adjusted EBITDA would be expected to be approximately $384 million, an increase of 17.4% when compared to $327 million in the same period of 2004.
Net income would be expected to be approximately $143 million, an increase of 16.3% when compared to income from continuing operations before special items in the fourth quarter of 2004.
EPS would be expected to be $0.64, an increase of 12.3% when compared to EPS from continuing operations before special items in the fourth quarter of 2004.
For the full year 2005, based on the fourth quarter 2005 assumptions above:
Full year revenues, including other revenues from managed and franchised properties, would be expected to be approximately $6.0 billion.

-7-
Full year Adjusted EBITDA would be expected to increase approximately 22.6% to approximately $1.410 billion, when compared to 2004 Adjusted EBITDA of $1.150 billion.
Full year net income before special items would be expected to be approximately $506 million at approximately a 24% effective tax rate, which assumes an annual dividend of $0.84 per Share (payable in January 2006), when compared to 2004 income from continuing operations before special items of approximately $348 million at a 13.9% effective tax rate.
Full year EPS before special items would be expected to increase approximately 40.1% to $2.27 when compared to 2004 EPS from continuing operations before special items of $1.62.
Full year capital expenditures (excluding timeshare inventory) would be approximately $550 million, including $300 million for maintenance, renovation and technology, approximately $100 million for the completion of the St. Regis San Francisco multi-use project under construction, and $150 million for other growth initiatives. Additionally, net capital expenditures for timeshare inventory would be approximately $100 million.
For the full year the Company expects cash interest expense of approximately $284 million and cash taxes of approximately $462 million.
For the full year 2006, if REVPAR at Same-Store Owned Hotels in North America increases approximately 8% - 10% versus the full year 2005:
Full year Adjusted EBITDA, after adjusting for 2005 asset sales that we believe would have contributed approximately $30 million of EBITDA in 2006, is expected to be approximately $1.560 billion, when compared to 2005 Adjusted EBITDA of $1.410 billion. The Adjusted EBITDA estimate includes margin improvement of approximately 200 basis points.
Full year income from continuing operations would be expected to be approximately $611 million at a 27% effective tax rate, which assumes an annual dividend of $0.84 per Share (payable in January 2007), when compared to 2005 net income before special items of approximately $506 million at a 24% effective tax rate.
Full year EPS would be expected to increase approximately 19% to $2.70 when compared to 2005 EPS before special items of $2.27.
The Company’s guidance for 2006 above excludes the impact of SFAS 123R which requires the Company to begin expensing options in 2006. Stock option expense is expected to be approximately $40 to $45 million on a pre-tax basis or $0.13 to $0.15 of EPS. While the Board of Directors has not made final decisions on stock based compensation for 2006, the guidance assumes a shift to more restricted stock which adds $10 to $15 million to restricted stock expense in the 2006 EBITDA guidance with a commensurate reduction in option expense.
The 2006 guidance also excludes the impact of the adoption of SFAS 152, Accounting for Real Estate Time-Sharing Transactions, which is expected to result

-8-
in a one-time pre-tax charge of approximately $100 to $120 million in the first quarter of 2006.
The 2006 guidance also excludes transition costs associated with the Meridien transaction which is assumed to close by year end 2005.
Special Items:
The Company recorded net charges of $91 million (after-tax) for special items in the third quarter of 2005 compared to $20 million of net credits (after-tax) in the same period of 2004.
Special items in the third quarter of 2005 primarily relate to tax expense on the adoption of a plan to repatriate foreign earnings in accordance with the American Jobs Creation Act of 2004, additional tax expense related to the Company’s 1998 disposition of ITT World Directories and losses on the sale of two hotels.
The following represents a reconciliation of income from continuing operations before special items to income from continuing operations after special items (in millions, except per share data):
Three Months Ended September 30,
Nine Months Ended September 30,
2005 2004 2005 2004
$ 131 $ 85 Income from continuing operations before special items ............. $ 364 $ 225 $ 0.58 $ 0.40 EPS before special items ............................................................. $ 1.63 $ 1.05 Special Items ― 37 Restructuring and other special credits, net (a) ― 37 ― ― Adjustment to costs associated with construction remediation (b) . ― 4 (16) (4) Loss on asset dispositions and impairments, net (c) .................... (32) (8) (16) 33 Total special items – pre-tax ........................................................ (32) 33 6 (13) Income tax benefit (expense) for special items (d) ........................ 11 (12) (47) ― Tax expense on repatriation of foreign earnings (e)....................... (47) ― (34) ― Reserves and settlements associated with tax matters (f) ............ (32) 12 (91) 20 Total special items – after-tax....................................................... (100) 33 $ 40 $ 105 Income from continuing operations .............................................. $ 264 $ 258 $ 0.18 $ 0.49 EPS including special items ......................................................... $ 1.18 $ 1.21
(a) During the three and nine months ended September 30, 2004, the Company reversed a $37 million reserve previously recorded through restructuring and other special credits due to a favorable judgment in a litigation matter.
(b) Represents adjustments to the Company’s share of costs for construction remediation efforts at a property owned by a vacation ownership unconsolidated joint venture that were previously recorded in 2002.
(c) For the three months ended September 30, 2005, primarily reflects the losses recorded on the sale of two hotels. For the nine months ended September 30, 2005, the loss also reflects impairment charges associated with the Sheraton hotel in Cancun, Mexico that is being partially demolished in order to build vacation ownership units. Loss of $4 million and $8 million for the three and nine months ended September 30, 2004, respectively, reflects impairment charges primarily associated with the Company’s investment in a joint venture that owns a hotel managed by the Company and the renovation of a portion of the W New York for the Bliss spa.
(d) Represents taxes on special items at the Company’s incremental tax rate. (e) Represents tax expense associated with the adoption of a plan to repatriate foreign earnings, in accordance
with the American Jobs Creation Act of 2004.

-9-
(f) The Company recorded a tax charge of approximately $40 million for the three and nine months ended September 30, 2005 to increase its tax reserves relating to the Company’s 1998 disposition of World Directories as a result of a recent United States Tax Court decision against another taxpayer. This amount also includes tax refunds of $6 million and $8 million in the three and nine months ended September 30, 2005, respectively, related to tax years prior to the 1995 split-up of ITT Corporation. Tax benefit of $12 million in the nine months ended September 30, 2004 reflects the favorable results of certain changes to the Federal tax rules.
The Company has included the above supplemental information concerning special items to assist investors in analyzing Starwood’s financial position and results of operations. The Company has chosen to provide this information to investors to enable them to perform meaningful comparisons of past, present and future operating results and as a means to emphasize the results of core on-going operations.
Starwood will be conducting a conference call to discuss the third quarter financial results at 10:30 a.m. (EDT) today. The conference call will be available through simultaneous webcast in the Investor Relations/Press Releases section of the Company’s website at www.starwoodhotels.com. A replay of the conference call will also be available from 1:30 p.m. (EDT) today through Wednesday, November 2 at 12:00 midnight (EDT) on both the Company’s website and via telephone replay at (719) 457-0820 (access code 9041603).
Definitions:
All references to EPS, unless otherwise noted, reflect earnings per diluted share from continuing operations. All references to “net capital expenditures” mean gross capital expenditures for timeshare and fractional inventory net of cost of sales. EBITDA represents net income before interest expense, taxes, depreciation and amortization. The Company believes that EBITDA is a useful measure of the Company’s operating performance due to the significance of the Company’s long-lived assets and level of indebtedness. EBITDA is a commonly used measure of performance in its industry which, when considered with GAAP measures, the Company believes gives a more complete understanding of the Company’s ability to service debt, fund capital expenditures, pay income taxes and pay cash distributions. It also facilitates comparisons between the Company and its competitors. The Company’s management has historically adjusted EBITDA (i.e., “Adjusted EBITDA”) when evaluating operating performance for the total Company as well as for individual properties or groups of properties because the Company believes that the inclusion or exclusion of certain recurring and non-recurring items, such as the special items described on page 8 of this release and/or revenues and costs and expenses from hotels sold, is necessary to provide the most accurate measure of core operating results and as a means to evaluate comparative results. The Company’s management also used Adjusted EBITDA as a measure in determining the value of acquisitions and dispositions and it is used in the annual budget process. Due to guidance from the Securities and Exchange Commission, the Company now does not reflect such items when calculating EBITDA; however, the Company continues to adjust for these special items and refers to this measure as Adjusted EBITDA. The Company has historically reported this measure to its investors and believes that the continued inclusion of Adjusted EBITDA provides consistency in its financial reporting and enables investors to perform more meaningful comparisons of past, present and future operating results and provides a means to evaluate the results of its core on-going operations. EBITDA and Adjusted EBITDA are not intended to represent cash flow from operations as defined by GAAP and such metrics should not be

-10-
considered as an alternative to net income, cash flow from operations or any other performance measure prescribed by GAAP. The Company’s calculation of EBITDA and Adjusted EBITDA may be different from the calculations used by other companies and, therefore, comparability may be limited.
All references to Same-Store Owned Hotels reflect the Company’s owned, leased and consolidated joint venture hotels, excluding hotels sold to date, undergoing significant repositionings or for which comparable results are not available (i.e., hotels not owned during the entire periods presented or closed due to seasonality or hurricane damage.) REVPAR is defined as revenue per available room. ADR is defined as average daily rate.
All references to contract sales reflect vacation ownership sales before revenue adjustments for percentage of completion accounting methodology.
Starwood Hotels & Resorts Worldwide, Inc. is one of the leading hotel and leisure companies in the world with approximately 750 properties in more than 80 countries and 120,000 employees at its owned and managed properties. With internationally renowned brands, Starwood® corporation is a fully integrated owner, operator and franchisor of hotels and resorts including: St. Regis®, The Luxury Collection®, Sheraton®, Westin®, Four Points® by Sheraton, and W®, Hotels and Resorts as well as Starwood Vacation Ownership, Inc., one of the premier developers and operators of high quality vacation interval ownership resorts. For more information, please visit www.starwoodhotels.com.
** Please contact Starwood’s new, toll-free media hotline at (866) 4-STAR-PR (866-478-2777) for photography or additional information.**
Note: This press release contains forward-looking statements within the meaning of federal securities regulations. Forward-looking statements are not guarantees of future performance and involve risks and uncertainties and other factors that may cause actual results to differ materially from those anticipated at the time the forward-looking statements are made. Further results, performance and achievements may be affected by general economic conditions including the prospects for improved performance internationally, the impact of war and terrorist activity, business and financing conditions, foreign exchange fluctuations, cyclicality of the real estate and the hotel and vacation ownership businesses, operating risks associated with the hotel and vacation ownership businesses, relationships with associates and labor unions, customers and property owners, the impact of the internet reservation channels, our reliance on technology, domestic and international political and geopolitical conditions, competition, governmental and regulatory actions (including the impact of changes in U.S. and foreign tax laws and their interpretation), travelers’ fears of exposure to contagious diseases, risk associated with the level of our indebtedness, risk associated with potential acquisitions and dispositions, and other circumstances and uncertainties. These risks and uncertainties are presented in detail in our filings with the Securities and Exchange Commission. Although we believe the expectations reflected in such forward-looking statements are based upon reasonable assumptions, we can give no assurance that our expectations will be attained or that results will not materially differ. We undertake no obligation to publicly update or revise any forward-looking statement, whether as a result of new information, future events or otherwise.
-11-
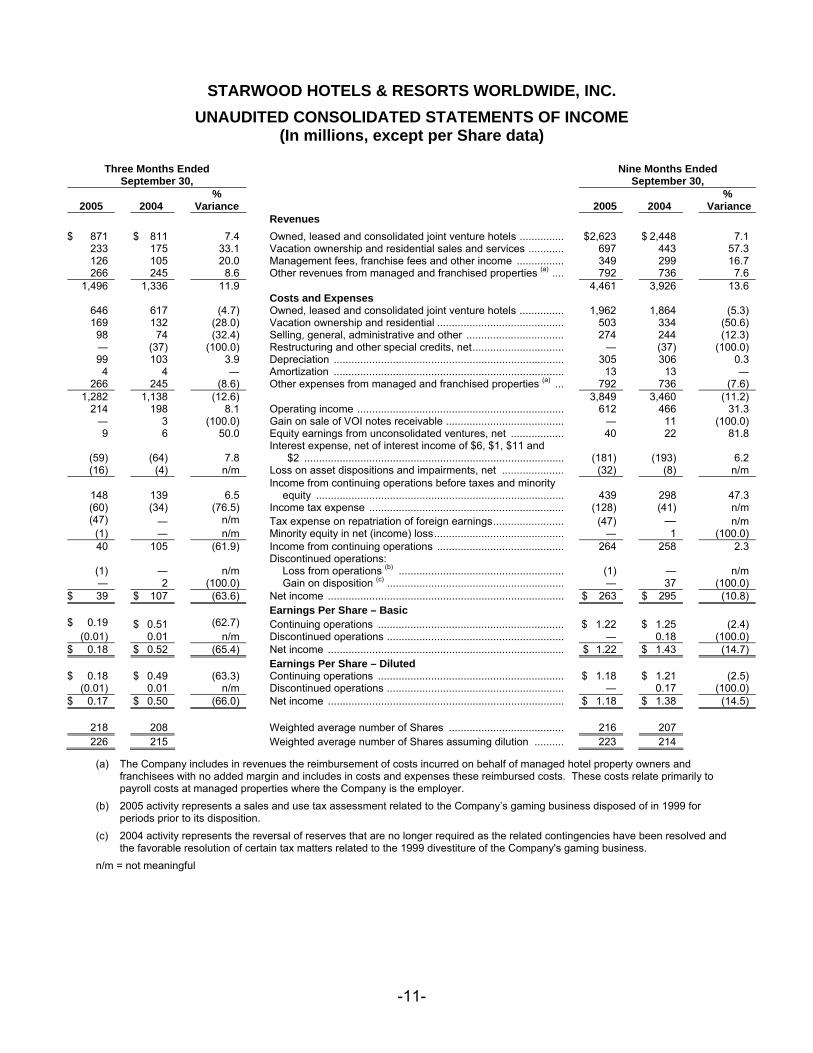
STARWOOD HOTELS & RESORTS WORLDWIDE, INC. UNAUDITED CONSOLIDATED STATEMENTS OF INCOME
(In millions, except per Share data)
Three Months Ended September 30,
Nine Months Ended September 30,
2005 2004 %
Variance 2005 2004 %
Variance Revenues
$ 871 $ 811 7.4 Owned, leased and consolidated joint venture hotels ............... $ 2,623 $ 2,448 7.1 233 175 33.1 Vacation ownership and residential sales and services ............ 697 443 57.3 126 105 20.0 Management fees, franchise fees and other income ................ 349 299 16.7 266 245 8.6 Other revenues from managed and franchised properties (a) .... 792 736 7.6 1,496 1,336 11.9 4,461 3,926 13.6 Costs and Expenses 646 617 (4.7) Owned, leased and consolidated joint venture hotels ............... 1,962 1,864 (5.3) 169 132 (28.0) Vacation ownership and residential ........................................... 503 334 (50.6) 98 74 (32.4) Selling, general, administrative and other ................................. 274 244 (12.3) ― (37) (100.0) Restructuring and other special credits, net............................... ― (37) (100.0) 99 103 3.9 Depreciation .............................................................................. 305 306 0.3 4 4 ― Amortization .............................................................................. 13 13 ― 266 245 (8.6) Other expenses from managed and franchised properties (a) ... 792 736 (7.6) 1,282 1,138 (12.6) 3,849 3,460 (11.2) 214 198 8.1 Operating income ...................................................................... 612 466 31.3 ― 3 (100.0) Gain on sale of VOI notes receivable ........................................ ― 11 (100.0) 9 6 50.0 Equity earnings from unconsolidated ventures, net .................. 40 22 81.8
(59) (64) 7.8 Interest expense, net of interest income of $6, $1, $11 and
$2 ........................................................................................ (181) (193) 6.2 (16) (4) n/m Loss on asset dispositions and impairments, net ..................... (32) (8) n/m
148 139 6.5 Income from continuing operations before taxes and minority
equity .................................................................................... 439 298 47.3 (60) (34) (76.5) Income tax expense .................................................................. (128) (41) n/m (47) ― n/m Tax expense on repatriation of foreign earnings........................ (47) ― n/m (1) ― n/m Minority equity in net (income) loss............................................ ― 1 (100.0) 40 105 (61.9) Income from continuing operations ........................................... 264 258 2.3 Discontinued operations: (1) ― n/m Loss from operations (b) ........................................................ (1) ― n/m ― 2 (100.0) Gain on disposition (c) ............................................................ ― 37 (100.0) $ 39 $ 107 (63.6) Net income ................................................................................ $ 263 $ 295 (10.8) Earnings Per Share – Basic $ 0.19 $ 0.51 (62.7) Continuing operations ............................................................... $ 1.22 $ 1.25 (2.4) (0.01) 0.01 n/m Discontinued operations ............................................................ ― 0.18 (100.0) $ 0.18 $ 0.52 (65.4) Net income ................................................................................ $ 1.22 $ 1.43 (14.7) Earnings Per Share – Diluted $ 0.18 $ 0.49 (63.3) Continuing operations ............................................................... $ 1.18 $ 1.21 (2.5) (0.01) 0.01 n/m Discontinued operations ............................................................ ― 0.17 (100.0) $ 0.17 $ 0.50 (66.0) Net income ................................................................................ $ 1.18 $ 1.38 (14.5) 218 208 Weighted average number of Shares ....................................... 216 207 226 215 Weighted average number of Shares assuming dilution .......... 223 214
(a) The Company includes in revenues the reimbursement of costs incurred on behalf of managed hotel property owners and franchisees with no added margin and includes in costs and expenses these reimbursed costs. These costs relate primarily to payroll costs at managed properties where the Company is the employer.
(b) 2005 activity represents a sales and use tax assessment related to the Company’s gaming business disposed of in 1999 for periods prior to its disposition.
(c) 2004 activity represents the reversal of reserves that are no longer required as the related contingencies have been resolved and the favorable resolution of certain tax matters related to the 1999 divestiture of the Company's gaming business.
n/m = not meaningful

-12-
STARWOOD HOTELS & RESORTS WORLDWIDE, INC. CONSOLIDATED BALANCE SHEETS
(in millions, except share data) September 30,
2005 (unaudited)
December 31, 2004
Assets Current assets: Cash and cash equivalents ............................................................................... $ 909 $ 326 Restricted cash .................................................................................................. 251 347 Accounts receivable, net of allowance for doubtful accounts of $58 and $58...... 642 482 Inventories .......................................................................................................... 281 371 Prepaid expenses and other ............................................................................... 187 157 Total current assets 2,270 1,683 Investments ............................................................................................................ 408 453 Plant, property and equipment, net ........................................................................ 6,777 6,997 Goodwill and intangible assets, net ........................................................................ 2,539 2,544 Other assets (a) ....................................................................................................... 745 621 $ 12,739 $ 12,298 Liabilities and Stockholders’ Equity Current liabilities: Short-term borrowings and current maturities of long-term debt (b) ..................... $ 604 $ 619 Accounts payable ............................................................................................... 149 200 Accrued expenses .............................................................................................. 802 872 Accrued salaries, wages and benefits ................................................................ 262 299 Accrued taxes and other ..................................................................................... 471 138 Total current liabilities ..................................................................................... 2,288 2,128 Long-term debt (b) ................................................................................................... 3,703 3,823 Deferred income taxes ........................................................................................... 611 880 Other liabilities ........................................................................................................ 682 652 7,284 7,483 Minority interest ...................................................................................................... 25 27 Exchangeable units and Class B preferred shares, at redemption value of $38.50
― ― Commitments and contingencies Stockholders’ equity: Class A exchangeable preferred shares of the Trust; $0.01 par value;
authorized 30,000,000 shares; outstanding 562,222 and 597,825 shares at September 30, 2005 and December 31, 2004, respectively .......................... ― ―
Corporation common stock; $0.01 par value; authorized 1,050,000,000 shares; outstanding 219,272,686 and 208,730,800 shares at September 30, 2005 and December 31, 2004, respectively .................................................................... 2 2
Trust Class B shares of beneficial interest; $0.01 par value; authorized 1,000,000,000 shares; outstanding 219,272,686 and 208,730,800 shares at September 30, 2005 and December 31, 2004, respectively ........................... 2 2
Additional paid-in capital ........................................................................................ 5,593 5,121 Deferred compensation .......................................................................................... (64) (14) Accumulated other comprehensive loss ................................................................. (298) (255) Retained earnings (accumulated deficit) ................................................................ 195 (68) Total stockholders’ equity ................................................................................ 5,430 4,788 $ 12,739 $ 12,298
(a) Includes restricted cash of $11 million and $10 million at September 30, 2005 and December 31, 2004, respectively. (b) Excludes Starwood’s share of unconsolidated joint venture debt aggregating approximately $421 million and $438 million at
September 30, 2005 and December 31, 2004, respectively.

-13-
STARWOOD HOTELS & RESORTS WORLDWIDE, INC. Non-GAAP to GAAP Reconciliations – Historical Data
(in millions)
Three Months Ended September 30,
Nine Months Ended September 30,
2005
2004
% Variance
2005
2004
% Variance
Reconciliation of Net Income to EBITDA and Adjusted EBITDA $ 39 $ 107 (63.6) Net income .................................................................................... $ 263 $ 295 (10.8)
70 68 (2.9) Interest expense(a) ......................................................................... 207 209 1.0 106 35 n/m Income tax expense(b) ................................................................... 174 8 n/m 108 111 2.7 Depreciation(c) ............................................................................... 330 330 ―
6 6 ― Amortization (d)................................................................................ 18 18 ― 329 327 0.6 EBITDA .......................................................................................... 992 860 15.3 ― ― ― Adjustment to costs associated with construction remediation ..... ― (4) (100.0)16 4 n/m Loss on asset dispositions and impairments, net........................... 32 8 n/m
― (37) (100.0) Restructuring and other special credits, net................................... ― (37) (100.0) 2 (3) n/m Discontinued operations(e) .............................................................. 2 (4) n/m $ 347 $ 291 19.2 Adjusted EBITDA ........................................................................... $ 1,026 $ 823 24.7
(a) Includes $5 and $3 million of interest expense related to unconsolidated joint ventures for the three months ended September 30, 2005 and 2004, respectively, and $15 and $14 million for the nine months ended September 30, 2005 and 2004, respectively.
(b) Includes $47 million of tax expense on the repatriation of foreign earnings for the three and nine months ended September 30, 2005. Also includes $(1) and $1 million of tax expense (benefit) recorded in discontinued operations for the three months ended September 30, 2005 and 2004, respectively, and $(1) and $(33) million for the nine months ended September 30, 2005 and 2004, respectively.
(c) Includes $9 and $8 million of Starwood’s share of depreciation expense of unconsolidated joint ventures for the three months ended September 30, 2005 and 2004, respectively, and $25 and $24 million for the nine months ended September 30, 2005 and 2004, respectively.
(d) Includes $2 and $2 million of Starwood’s share of amortization expense of unconsolidated joint ventures for the three months ended September 30, 2005 and 2004, respectively, and $5 and $5 million for the nine months ended September 30, 2005 and 2004, respectively.
(e) Excludes the taxes already added back as noted in (b) above.
Three Months Ended
September 30,
Nine Months Ended
September 30, 2005 2004 2005 2004
Cash Flow Data $ 39 $ 107 Net income .................................................................................................... $ 263 $ 295 Exclude: 1 (2) Discontinued operations, net .................................................................... 1 (37) 40 105 Income from continuing operations ............................................................... 264 258 258 (67) (Increase) decrease in restricted cash .......................................................... 97 (197)
290 157 Adjustments to income from continuing operations, changes in working
capital, and other ...................................................................................... 457 315 588 195 Cash from continuing operations .............................................................. 818 376 ― ― Cash from discontinued operations .......................................................... ― 1 $ 588 $ 195 Cash from operating activities .................................................................. $ 818 $ 377 $ (103) $ (80) Cash used for investing activities ............................................................. $ (254) $ (324) $ 45 $ (50) Cash from (used for) financing activities ................................................. $ 34 $ (251)

-14-
STARWOOD HOTELS & RESORTS WORLDWIDE, INC. Non-GAAP to GAAP Reconciliations – Future Performance
(In millions)
Three Months Ended Year Ended December 31, December 31, 2005 2005 2006
$ 143 Net Income ....................................................................... $ 406 $ 611 77 Interest expense ............................................................... 284 270 48 Income tax expense .......................................................... 222 226 116 Depreciation and amortization .......................................... 464 453 384 EBITDA ............................................................................. 1,376 1,560 ― Loss on asset dispositions and impairments, net .............. 32 ― ― Discontinued operations .................................................... 2 ― $ 384 Adjusted EBITDA............................................................... $ 1,410 $ 1,560
Three Months Ended December 31, 2004
Year Ended December 31, 2004
$ 100 Net income ................................................................................... $ 395 66 Interest expense ........................................................................... 275 26 Income tax expense ..................................................................... 34 115 Depreciation ................................................................................. 445 8 Amortization .................................................................................. 26 315 EBITDA ......................................................................................... 1,175 25 Loss on asset dispositions and impairments, net .......................... 33 (13) Discontinued operations ............................................................... (17) ― Restructuring and other special credits, net .................................. (37) ― Adjustment to costs associated with construction remediation ...... (4) $ 327 Adjusted EBITDA .......................................................................... $ 1,150
Year Ended
December 31, 2005 Net income before special items ............................................................... $ 506 Special items (see page 8)........................................................................ (100) Net income................................................................................................ $ 406 EPS before special items ......................................................................... $ 2.27 Special items (see page 8) ....................................................................... (0.45) EPS ......................................................................................................... $ 1.82

-15-
STARWOOD HOTELS & RESORTS WORLDWIDE, INC.
Non-GAAP to GAAP Reconciliations – Same Store Owned Hotel Revenue and Expenses (In millions)
Three Months Ended September 30,
Nine Months Ended September 30,
2005
2004
% Variance
Same-Store Owned Hotels (1) Worldwide
2005
2004
% Variance
Revenue $ 848 $ 769 10.3 Same-Store Owned Hotels ....................................................................... $ 2,498 $ 2,299 8.7 3 17 (82.4) Hotels Sold or Closed in 2005 and 2004 (7 hotels) .................................... 27 52 (48.1) 15 20 (25.0) Hotels Without Comparable Results (7 hotels)........................................... 92 91 1.1 5 5 ― Other ancillary hotel operations.................................................................. 6 6 ―$ 871 $ 811 7.4 Total Owned, Leased and Consolidated Joint Venture Hotels Revenue ......... $ 2,623 $ 2,448 7.1 Costs and Expenses $ 624 $ 583 (7.0) Same-Store Owned Hotels ....................................................................... $ 1,864 $ 1,750 (6.5) 2 15 86.7 Hotels Sold or Closed in 2005 and 2004 (7 hotels) .................................... 23 44 47.7 18 17 (5.9) Hotels Without Comparable Results (7 hotels)........................................... 72 66 (9.1) 2 2 ― Other ancillary hotel operations.................................................................. 3 4 25.0
$ 646 $ 617 (4.7) Total Owned, Leased and Consolidated Joint Venture Hotels Costs and
Expenses ................................................................................................... $ 1,962 $ 1,864 (5.3)
Three Months Ended September 30,
Nine Months Ended September 30,
2005 2004 %
Variance Same-Store Owned Hotels
North America 2005 2004 %
Variance Revenue $ 613 $ 553 10.9 Same-Store Owned Hotels ................................................................. $ 1,799 $ 1,665 8.0
3 12 (75.0) Hotels Sold or Closed in 2005 and 2004 (6 hotels) ............................. 23 38 (39.5)14 16 (12.5) Hotels Without Comparable Results (6 hotels) .................................... 80 78 2.6
$ 630 $ 581 8.4 Total Owned, Leased and Consolidated Joint Venture Hotels Revenue ......... $ 1,902 $ 1,781 6.8 Costs and Expenses
$ 454 $ 423 (7.4) Same-Store Owned Hotels .................................................................. $ 1,342 $ 1,272 (5.5)2 11 81.8 Hotels Sold or Closed in 2005 and 2004 (6 hotels) .............................. 18 32 43.8
17 14 (21.4) Hotels Without Comparable Results (6 hotels) .................................... 65 57 (14.0)
$ 473 $ 448 (5.6) Total Owned, Leased and Consolidated Joint Venture Hotels Costs and
Expenses .................................................................................................. $ 1,425 $ 1,361 (4.7)
Three Months Ended
September 30, Nine Months Ended
September 30,
2005
2004 %
Variance Same-Store Owned Hotels
International
2005
2004 %
Variance Revenue $ 235 $ 216 8.8 Same-Store Owned Hotels .............................................................. $ 699 $ 634 10.3 ― 5 (100.0) Hotels Sold or Closed in 2005 and 2004 (1 hotel)............................. 4 14 (71.4) 1 4 (75.0) Hotels Without Comparable Results (1 hotel) ................................. 12 13 (7.7) 5 5 ― Other ancillary hotel operations ........................................................ 6 6 ― $ 241 $ 230 4.8 Total Owned, Leased and Consolidated Joint Venture Hotels Revenue ..... $ 721 $ 667 8.1 Costs and Expenses $ 170 $ 160 (6.3) Same-Store Owned Hotels .............................................................. $ 522 $ 478 (9.2) ― 4 100.0 Hotels Sold or Closed in 2005 and 2004 (1 hotel)............................. 5 12 58.3 1 3 66.7 Hotels Without Comparable Results (1 hotel) .................................. 7 9 22.2 2 2 ― Other ancillary hotel operations ........................................................ 3 4 25.0
$ 173 $ 169 (2.4) Total Owned, Leased and Consolidated Joint Venture Hotels Costs and
Expenses ............................................................................................. $ 537 $ 503 (6.8) (1) Same-Store Owned Hotel Results exclude 7 hotels sold or closed in 2005 and 2004 and 7 hotels without comparable results.

STARWOOD HOTELS & RESORTS WORLDWIDE, INC.Hotel Results - Same Store Owned Hotels (1)
For the Three Months Ended September 30, 2005
UNAUDITED
2005 2004 Var. 2005 2004 Var. 2005 2004 Var.
SAME STORE OWNED HOTELSREVPAR ($) 126.76 113.29 11.9% 127.00 112.22 13.2% 126.09 116.37 8.4%ADR ($) 171.69 158.17 8.5% 165.65 150.49 10.1% 191.79 184.02 4.2%OCCUPANCY (%) 73.8% 71.6% 2.2 76.7% 74.6% 2.1 65.7% 63.2% 2.5
SHERATONREVPAR ($) 105.60 95.78 10.3% 114.87 103.72 10.8% 85.94 79.01 8.8%ADR ($) 147.38 136.40 8.0% 151.26 138.35 9.3% 137.41 131.30 4.7%OCCUPANCY (%) 71.6% 70.2% 1.4 75.9% 75.0% 0.9 62.5% 60.2% 2.3
WESTINREVPAR ($) 132.48 120.07 10.3% 117.49 106.35 10.5% 179.93 163.32 10.2%ADR ($) 177.29 164.36 7.9% 154.43 141.36 9.2% 255.42 246.80 3.5%OCCUPANCY (%) 74.7% 73.1% 1.6 76.1% 75.2% 0.9 70.4% 66.2% 4.2
ST. REGIS/LUXURY COLLECTIONREVPAR ($) 239.32 215.30 11.2% 201.11 165.34 21.6% 293.93 290.39 1.2%ADR ($) 372.22 363.58 2.4% 318.04 292.31 8.8% 446.63 459.46 (2.8%)OCCUPANCY (%) 64.3% 59.2% 5.1 63.2% 56.6% 6.6 65.8% 63.2% 2.6
WREVPAR ($) 202.21 162.38 24.5% 202.21 162.38 24.5% 0.00 0.00 0.0%ADR ($) 246.66 214.15 15.2% 246.66 214.15 15.2% 0.00 0.00 0.0%OCCUPANCY (%) 82.0% 75.8% 6.2 82.0% 75.8% 6.2 0.0% 0.0% n/a
OTHERREVPAR ($) 106.43 95.90 11.0% 105.72 95.78 10.4% 110.56 96.62 14.4%ADR ($) 132.95 124.84 6.5% 131.83 126.86 3.9% 139.49 114.35 22.0%OCCUPANCY (%) 80.1% 76.8% 3.3 80.2% 75.5% 4.7 79.3% 84.5% (5.2)
(1) Hotel Results exclude 7 hotels sold or closed and 6 hotels without comparable results during 2004 and 2005
(2) See next page for breakdown by division
17 16 1
9 3 6
10 10 0
56 34 22
36 22 14
WORLDWIDE NORTH AMERICA INTERNATIONAL(2)
128 Hotels 85 Hotels 43 Hotels
Page 1

STARWOOD HOTELS & RESORTS WORLDWIDE, INC.Hotel Results - Same Store Owned Hotels (1)
For the Three Months Ended September 30, 2005
UNAUDITED
2005 2004 Var. 2005 2004 Var. 2005 2004 Var.
SAME STORE OWNED HOTELSREVPAR ($) 175.42 164.10 6.9% 59.38 50.22 18.2% 115.11 109.03 5.6%ADR ($) 253.15 248.43 1.9% 102.98 93.98 9.6% 156.56 139.44 12.3%OCCUPANCY (%) 69.3% 66.1% 3.2 57.7% 53.4% 4.3 73.5% 78.2% (4.7)
SHERATONREVPAR ($) 112.51 105.99 6.2% 52.71 43.55 21.0% 117.90 116.63 1.1%ADR ($) 161.66 154.75 4.5% 97.55 89.82 8.6% 168.41 156.93 7.3%OCCUPANCY (%) 69.6% 68.5% 1.1 54.0% 48.5% 5.5 70.0% 74.3% (4.3)
WESTINREVPAR ($) 216.09 196.51 10.0% 84.67 75.56 12.1% 0.00 0.00 0.0%ADR ($) 308.36 307.66 0.2% 118.57 104.58 13.4% 0.00 0.00 0.0%OCCUPANCY (%) 70.1% 63.9% 6.2 71.4% 72.3% (0.9) 0.0% 0.0% n/a
ST. REGIS/LUXURY COLLECTIONREVPAR ($) 293.93 290.39 1.2% 0.00 0.00 0.0% 0.00 0.00 0.0%ADR ($) 446.63 459.46 (2.8%) 0.00 0.00 0.0% 0.00 0.00 0.0%OCCUPANCY (%) 65.8% 63.2% 2.6 0.0% 0.0% n/a 0.0% 0.0% n/a
OTHERREVPAR ($) 0.00 0.00 0.0% 0.00 0.00 0.0% 110.56 96.62 14.4%ADR ($) 0.00 0.00 0.0% 0.00 0.00 0.0% 139.49 114.35 22.0%OCCUPANCY (%) 0.0% 0.0% n/a 0.0% 0.0% n/a 79.3% 84.5% (5.2)
(1) Hotel Results exclude 7 hotels sold or closed and 6 hotels without comparable results during 2004 and 2005
EUROPE LATIN AMERICA ASIA PACIFIC
28 Hotels 11 Hotels 4 Hotels
11 8 3
11 3 0
0 0 1
6 0 0
Page 2

STARWOOD HOTELS & RESORTS WORLDWIDE, INC.Hotel Results - Same Store Owned Hotels (1)
For the Three Months Ended September 30, 2005
UNAUDITED ($ thousands except variances)
2005 2004 Var. 2005 2004 Var. 2005 2004 Var.
SAME STORE OWNED HOTELS Total REVENUE 848,071 768,811 10.3% 612,926 552,764 10.9% 235,145 216,047 8.8%Total EXPENSE 624,168 583,472 (7.0%) 454,523 423,369 (7.4%) 169,644 160,103 (6.0%)
SHERATONREVENUE 341,211 315,104 8.3% 238,934 221,665 7.8% 102,277 93,439 9.5%EXPENSE 249,234 235,068 (6.0%) 173,201 164,065 (5.6%) 76,033 71,003 (7.1%)
WESTINREVENUE 268,047 242,290 10.6% 177,153 160,115 10.6% 90,894 82,175 10.6%EXPENSE 194,249 181,798 (6.8%) 130,014 121,931 (6.6%) 64,235 59,867 (7.3%)
ST. REGIS/LUXURY COLLECTIONREVENUE 77,232 72,190 7.0% 44,233 39,749 11.3% 32,999 32,441 1.7%EXPENSE 61,559 58,838 (4.6%) 40,386 37,044 (9.0%) 21,173 21,794 2.8%
W(2)
REVENUE 99,977 82,683 20.9% 99,977 82,683 20.9% 0 0 0.0%EXPENSE 72,805 65,716 (10.8%) 72,805 65,716 (10.8%) 0 0 0.0%
OTHERREVENUE 61,604 56,544 8.9% 52,629 48,552 8.4% 8,975 7,992 12.3%EXPENSE 46,321 42,052 (10.2%) 38,118 34,613 (10.1%) 8,203 7,439 (10.3%)
(1) Hotel Results exclude 7 hotels sold or closed and 6 hotels without comparable results during 2004 and 2005
(2) Includes lease expense of $4,288 in 2005 and 2004 related to the lease of the W Times Square in New York
(3) See next page for breakdown by division
17 16 1
9 3 6
10 10 0
56 34 22
36 22 14
WORLDWIDE(2) NORTH AMERICA(2) INTERNATIONAL(3)
128 Hotels 85 Hotels 43 Hotels
Page 3
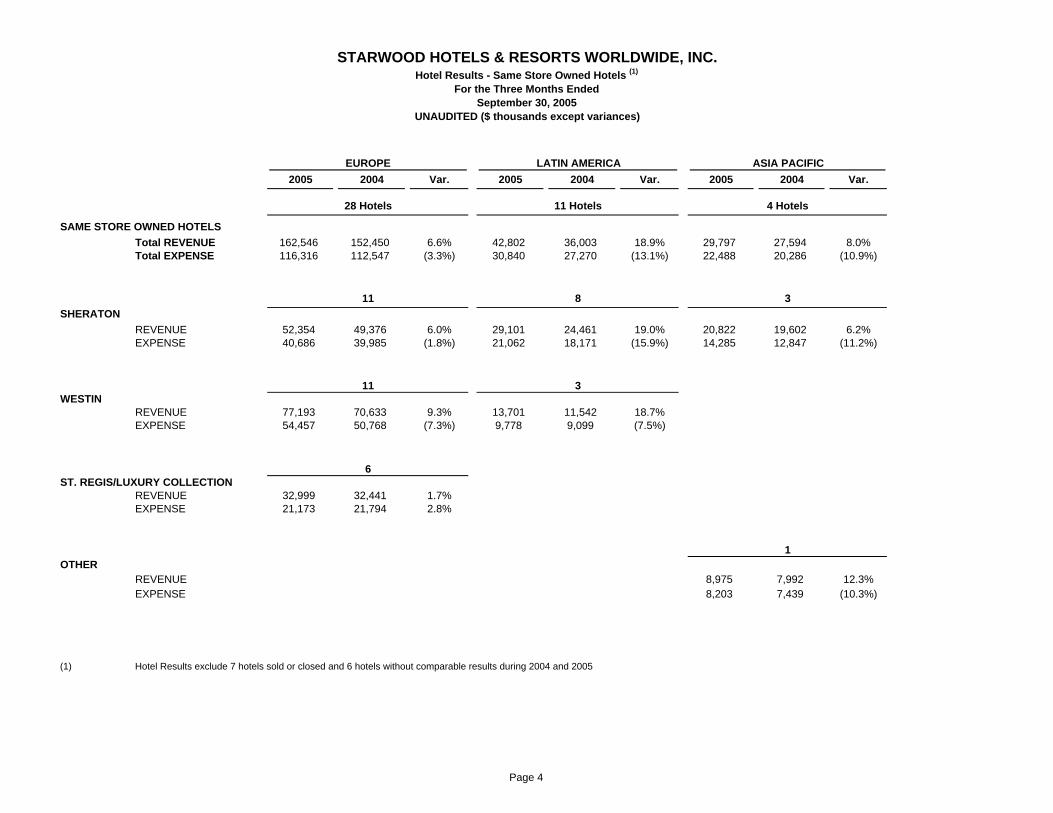
STARWOOD HOTELS & RESORTS WORLDWIDE, INC.Hotel Results - Same Store Owned Hotels (1)
For the Three Months Ended September 30, 2005
UNAUDITED ($ thousands except variances)
2005 2004 Var. 2005 2004 Var. 2005 2004 Var.
SAME STORE OWNED HOTELS Total REVENUE 162,546 152,450 6.6% 42,802 36,003 18.9% 29,797 27,594 8.0%Total EXPENSE 116,316 112,547 (3.3%) 30,840 27,270 (13.1%) 22,488 20,286 (10.9%)
SHERATONREVENUE 52,354 49,376 6.0% 29,101 24,461 19.0% 20,822 19,602 6.2%EXPENSE 40,686 39,985 (1.8%) 21,062 18,171 (15.9%) 14,285 12,847 (11.2%)
WESTINREVENUE 77,193 70,633 9.3% 13,701 11,542 18.7% 0 0 0.0%EXPENSE 54,457 50,768 (7.3%) 9,778 9,099 (7.5%) 0 0 0.0%
ST. REGIS/LUXURY COLLECTIONREVENUE 32,999 32,441 1.7% 0 0 n/a 0 0 n/aEXPENSE 21,173 21,794 2.8% 0 0 n/a 0 0 n/a
OTHERREVENUE 0 0 0.0% 0 0 0.0% 8,975 7,992 12.3%EXPENSE 0 0 0.0% 0 0 0.0% 8,203 7,439 (10.3%)
(1) Hotel Results exclude 7 hotels sold or closed and 6 hotels without comparable results during 2004 and 2005
EUROPE LATIN AMERICA ASIA PACIFIC
28 Hotels 11 Hotels 4 Hotels
11 8 3
11 3 0
0 0 1
6 0 0
Page 4
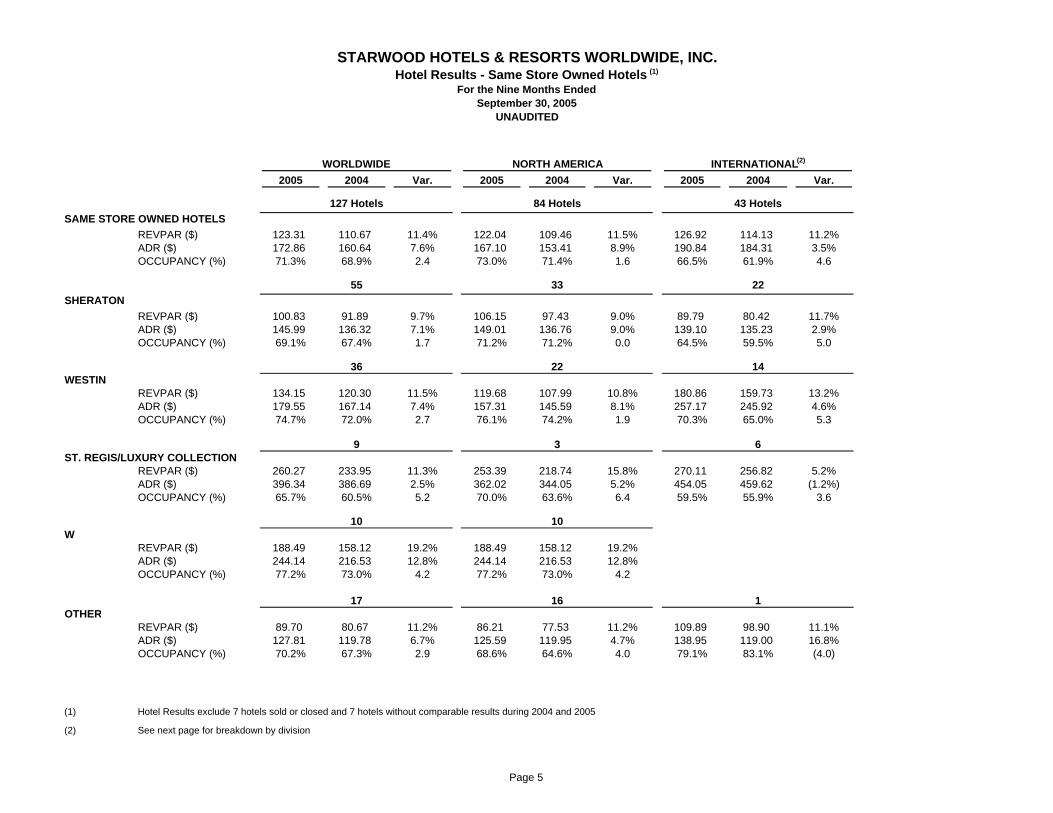
STARWOOD HOTELS & RESORTS WORLDWIDE, INC.Hotel Results - Same Store Owned Hotels (1)
For the Nine Months Ended September 30, 2005
UNAUDITED
2005 2004 Var. 2005 2004 Var. 2005 2004 Var.
SAME STORE OWNED HOTELSREVPAR ($) 123.31 110.67 11.4% 122.04 109.46 11.5% 126.92 114.13 11.2%ADR ($) 172.86 160.64 7.6% 167.10 153.41 8.9% 190.84 184.31 3.5%OCCUPANCY (%) 71.3% 68.9% 2.4 73.0% 71.4% 1.6 66.5% 61.9% 4.6
SHERATONREVPAR ($) 100.83 91.89 9.7% 106.15 97.43 9.0% 89.79 80.42 11.7%ADR ($) 145.99 136.32 7.1% 149.01 136.76 9.0% 139.10 135.23 2.9%OCCUPANCY (%) 69.1% 67.4% 1.7 71.2% 71.2% 0.0 64.5% 59.5% 5.0
WESTINREVPAR ($) 134.15 120.30 11.5% 119.68 107.99 10.8% 180.86 159.73 13.2%ADR ($) 179.55 167.14 7.4% 157.31 145.59 8.1% 257.17 245.92 4.6%OCCUPANCY (%) 74.7% 72.0% 2.7 76.1% 74.2% 1.9 70.3% 65.0% 5.3
ST. REGIS/LUXURY COLLECTIONREVPAR ($) 260.27 233.95 11.3% 253.39 218.74 15.8% 270.11 256.82 5.2%ADR ($) 396.34 386.69 2.5% 362.02 344.05 5.2% 454.05 459.62 (1.2%)OCCUPANCY (%) 65.7% 60.5% 5.2 70.0% 63.6% 6.4 59.5% 55.9% 3.6
WREVPAR ($) 188.49 158.12 19.2% 188.49 158.12 19.2% 0.00 0.00 0.0%ADR ($) 244.14 216.53 12.8% 244.14 216.53 12.8% 0.00 0.00 0.0%OCCUPANCY (%) 77.2% 73.0% 4.2 77.2% 73.0% 4.2 0.0% 0.0% n/a
OTHERREVPAR ($) 89.70 80.67 11.2% 86.21 77.53 11.2% 109.89 98.90 11.1%ADR ($) 127.81 119.78 6.7% 125.59 119.95 4.7% 138.95 119.00 16.8%OCCUPANCY (%) 70.2% 67.3% 2.9 68.6% 64.6% 4.0 79.1% 83.1% (4.0)
(1) Hotel Results exclude 7 hotels sold or closed and 7 hotels without comparable results during 2004 and 2005
(2) See next page for breakdown by division
WORLDWIDE NORTH AMERICA INTERNATIONAL(2)
127 Hotels 84 Hotels 43 Hotels
55 33 22
36 22 14
17 16 1
9 3 6
10 10 0
Page 5

STARWOOD HOTELS & RESORTS WORLDWIDE, INC.Hotel Results - Same Store Owned Hotels (1)
For the Nine Months Ended September 30, 2005
UNAUDITED
2005 2004 Var. 2005 2004 Var. 2005 2004 Var.
SAME STORE OWNED HOTELSREVPAR ($) 170.97 156.05 9.6% 68.59 57.89 18.5% 116.64 105.21 10.9%ADR ($) 255.98 249.22 2.7% 108.50 103.53 4.8% 157.58 140.28 12.3%OCCUPANCY (%) 66.8% 62.6% 4.2 63.2% 55.9% 7.3 74.0% 75.0% (1.0)
SHERATONREVPAR ($) 116.41 106.52 9.3% 57.10 48.77 17.1% 120.78 109.09 10.7%ADR ($) 169.03 164.28 2.9% 97.04 94.60 2.6% 170.31 155.75 9.3%OCCUPANCY (%) 68.9% 64.8% 4.1 58.8% 51.6% 7.2 70.9% 70.0% 0.9
WESTINREVPAR ($) 207.66 185.69 11.8% 112.21 92.53 21.3% 0.00 0.00 0.0%ADR ($) 311.73 299.29 4.2% 140.57 127.66 10.1% 0.00 0.00 0.0%OCCUPANCY (%) 66.6% 62.0% 4.6 79.8% 72.5% 7.3 0.0% 0.0% n/a
ST. REGIS/LUXURY COLLECTIONREVPAR ($) 270.11 256.82 5.2% 0.00 0.00 0.0% 0.00 0.00 0.0%ADR ($) 454.05 459.62 (1.2%) 0.00 0.00 0.0% 0.00 0.00 0.0%OCCUPANCY (%) 59.5% 55.9% 3.6 0.0% 0.0% n/a 0.0% 0.0% n/a
OTHERREVPAR ($) 0.00 0.00 0.0% 0.00 0.00 0.0% 109.89 98.90 11.1%ADR ($) 0.00 0.00 0.0% 0.00 0.00 0.0% 138.95 119.00 16.8%OCCUPANCY (%) 0.0% 0.0% n/a 0.0% 0.0% n/a 79.1% 83.1% (4.0)
(1) Hotel Results exclude 7 hotels sold or closed and 7 hotels without comparable results during 2004 and 2005
0 0 1
6 0 0
11 8 3
11 3 0
EUROPE LATIN AMERICA ASIA PACIFIC
28 Hotels 11 Hotels 4 Hotels
Page 6
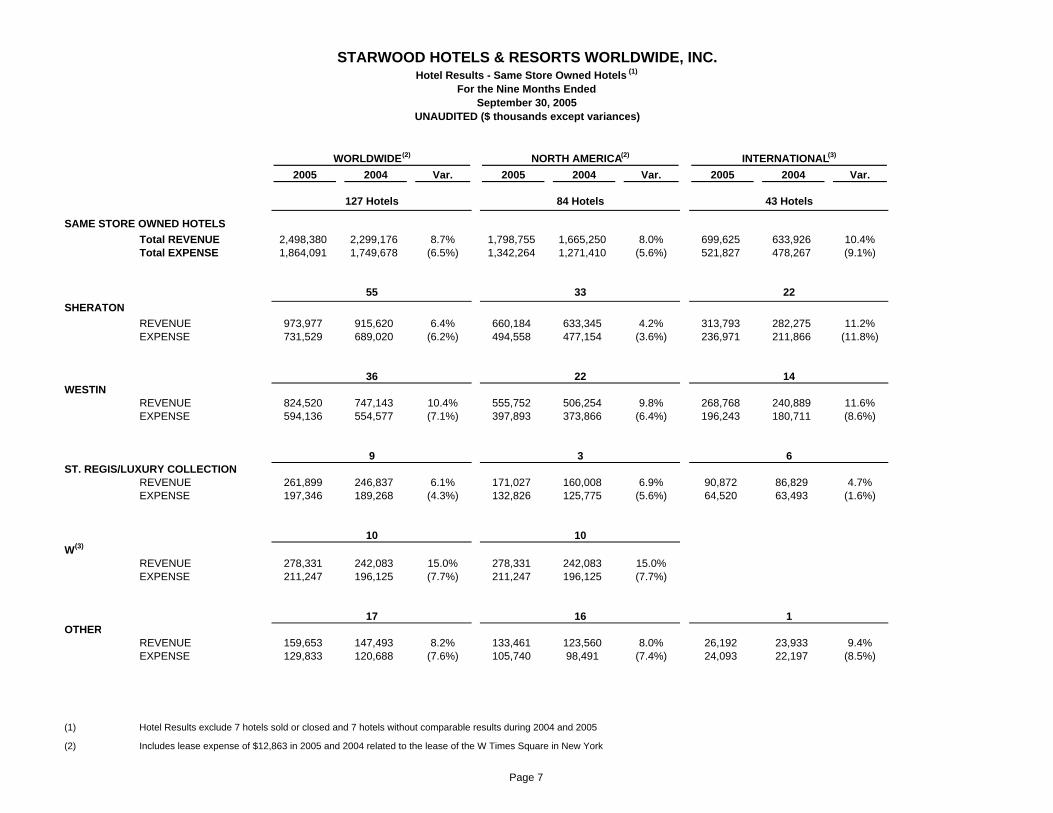
STARWOOD HOTELS & RESORTS WORLDWIDE, INC.Hotel Results - Same Store Owned Hotels (1)
For the Nine Months Ended September 30, 2005
UNAUDITED ($ thousands except variances)
2005 2004 Var. 2005 2004 Var. 2005 2004 Var.
SAME STORE OWNED HOTELS Total REVENUE 2,498,380 2,299,176 8.7% 1,798,755 1,665,250 8.0% 699,625 633,926 10.4%Total EXPENSE 1,864,091 1,749,678 (6.5%) 1,342,264 1,271,410 (5.6%) 521,827 478,267 (9.1%)
SHERATONREVENUE 973,977 915,620 6.4% 660,184 633,345 4.2% 313,793 282,275 11.2%EXPENSE 731,529 689,020 (6.2%) 494,558 477,154 (3.6%) 236,971 211,866 (11.8%)
WESTINREVENUE 824,520 747,143 10.4% 555,752 506,254 9.8% 268,768 240,889 11.6%EXPENSE 594,136 554,577 (7.1%) 397,893 373,866 (6.4%) 196,243 180,711 (8.6%)
ST. REGIS/LUXURY COLLECTIONREVENUE 261,899 246,837 6.1% 171,027 160,008 6.9% 90,872 86,829 4.7%EXPENSE 197,346 189,268 (4.3%) 132,826 125,775 (5.6%) 64,520 63,493 (1.6%)
W(3)
REVENUE 278,331 242,083 15.0% 278,331 242,083 15.0% 0 0 0.0%EXPENSE 211,247 196,125 (7.7%) 211,247 196,125 (7.7%) 0 0 0.0%
OTHERREVENUE 159,653 147,493 8.2% 133,461 123,560 8.0% 26,192 23,933 9.4%EXPENSE 129,833 120,688 (7.6%) 105,740 98,491 (7.4%) 24,093 22,197 (8.5%)
(1) Hotel Results exclude 7 hotels sold or closed and 7 hotels without comparable results during 2004 and 2005
(2) Includes lease expense of $12,863 in 2005 and 2004 related to the lease of the W Times Square in New York
WORLDWIDE(2) NORTH AMERICA(2) INTERNATIONAL(3)
127 Hotels 84 Hotels 43 Hotels
55 33 22
36 22 14
17 16 1
9 3 6
10 10 0
Page 7
STARWOOD HOTELS & RESORTS WORLDWIDE, INC.Hotel Results - Same Store Owned Hotels (1)
For the Nine Months Ended September 30, 2005
UNAUDITED ($ thousands except variances)
(3) See next page for breakdown by division
Page 8

STARWOOD HOTELS & RESORTS WORLDWIDE, INC.Hotel Results - Same Store Owned Hotels (1)
For the Nine Months Ended September 30, 2005
UNAUDITED ($ thousands except variances)
2005 2004 Var. 2005 2004 Var. 2005 2004 Var.
SAME STORE OWNED HOTELS Total REVENUE 470,684 435,574 8.1% 142,086 119,656 18.7% 86,855 78,696 10.4%Total EXPENSE 362,299 337,740 (7.2%) 93,683 80,897 (15.8%) 65,845 59,630 (10.4%)
SHERATONREVENUE 162,646 149,568 8.7% 90,484 77,944 16.1% 60,663 54,763 10.8%EXPENSE 132,536 121,309 (9.3%) 62,683 53,124 (18.0%) 41,752 37,433 (11.5%)
WESTINREVENUE 217,166 199,177 9.0% 51,602 41,712 23.7% 0 0 0.0%EXPENSE 165,243 152,938 (8.0%) 31,000 27,773 (11.6%) 0 0 0.0%
ST. REGIS/LUXURY COLLECTIONREVENUE 90,872 86,829 4.7% 0 0 n/a 0 0 n/aEXPENSE 64,520 63,493 (1.6%) 0 0 n/a 0 0 n/a
OTHERREVENUE 0 0 0.0% 0 0 0.0% 26,192 23,933 9.4%EXPENSE 0 0 0.0% 0 0 0.0% 24,093 22,197 (8.5%)
(1) Hotel Results exclude 7 hotels sold or closed and 7 hotels without comparable results during 2004 and 2005
0 0 1
6 0 0
11 8 3
11 3 0
EUROPE LATIN AMERICA ASIA PACIFIC
28 Hotels 11 Hotels 4 Hotels
Page 9

Interest Balance Interest Avg MaturityDebt Terms (in millions) % of Portfolio Rate (in years)
Floating Rate Debt:
Senior credit facilityRevolving credit facility Various + 125 9$ 0% 4.15% 1.0Term loan LIBOR + 125 475 11% 5.11% 0.9
484 11% 5.10% 0.9
Mortgages and other Various 183 4% 5.27% 2.0
Interest rate swaps LIBOR + 423 300 7% 8.30%
Total Floating 967 22% 6.12% 1.2
Fixed Rate Debt:
Sheraton Holding public debt (1) 1,049 24% 6.00% 7.2
Senior notes (2) 1,500 35% 6.70% 4.2
Convertible debt 360 8% 3.50% 0.6
Mortgages and other 731 18% 7.26% 5.5
Interest rate swaps (300) (7%) 7.88%
Total Fixed 3,340 78% 6.15% 5.0
Total Debt 4,307$ 100% 6.15% 4.4
<1 year 604$ 1-3 years 1,624 4-5 years 480 >5 years 1,599
4,307$
Maturities(1) Balance consists of outstanding public debt of $1.048 billion and a $1 million fair value adjustment related to the unamortized gain on fixed to floating interest rate swaps terminated in September 2002 and March 2004.
(2) Balance consists of outstanding public debt of $1.497 billion and a $22 million fair value adjustment related to the unamortized gain on fixed to floating interest rate swaps terminated in September 2002 and March 2004 and a ($19) million fair value adjustment related to current fixed to floating interest rate swaps.
STARWOOD HOTELS & RESORTS WORLDWIDE, INC.Debt Portfolio Summary
As of September 30, 2005UNAUDITED
Page 9

STARWOOD HOTELS & RESORTS WORLDWIDE, INC.Hotels without Comparable Results & Other Selected Items
As of September 30, 2005UNAUDITED ($ millions)
Properties without comparable results in 2005: Selected Balance Sheet and Cash Flow Items:
Property Location Cash and cash equivalents (including restricted cash of $262 million) 1,171$ Sheraton Kauai Koloa, HI Debt 4,307$ St. Regis Aspen Aspen, COParadise Streams Caesars Mt. Pocono, PAShertaton Cancun Cancun, MexicoW New Orleans - French Quarter New Orleans, LA Revenues and Expenses Associated with Assets Sold in 2005 or Expected to be Sold in the Fourth Quarter (1):W New Orleans New Orleans, LASheraton Suites Key West Key West, FL Q1 Q2 Q3 Q4 Full Year
Hotels Sold in 2005:Properties sold or closed in 2005 and 2004: 2005 Revenues 13$ 11$ 3$ -$ 27$ Property Location Expenses 12$ 8$ 2$ -$ 22$ Sheraton Denver Tech Center Englewood, CODeerfield Hilton Ft. Lauderdale, FL 2004Rancho Bernardo Four Points by Sheraton Rancho Bernardo, CA Revenues 14$ 19$ 16$ 16$ 65$ Sheraton Lisboa Hotel & Towers Lisbon, Portugal Expenses 13$ 14$ 13$ 14$ 54$ Raphael Chicago, ILSheraton Chapel Hill Chapel Hill, NC Hotels with a Signed Purchase & Sale Agreement:St. Regis Washington, DC Washington, DC 2005
Revenues 15$ 21$ 18$ -$ 54$ Expenses 11$ 13$ 11$ -$ 35$
2004Revenues 15$ 19$ 17$ 17$ 68$ Expenses 11$ 12$ 11$ 12$ 46$
(1) Results consist of 6 hotels sold in 2005 and 3 hotels for which we have signed a Purchase & Sale agreement. These amounts are included in the revenues and expenses from owned, leased and consolidated joint venture hotels in 2005 and 2004.
Page 11

STARWOOD HOTELS & RESORTS WORLDWIDE, INC.Capital Expenditures
For the Three and Nine Months Ended September 30, 2005UNAUDITED ($ millions)
Q3 YTD
Capital Expenditures:Owned, Leased and Consolidated Joint Venture Hotels 57 183 Corporate/IT 13 29
Subtotal 70 212
Vacation Ownership Capital Expenditures:Capital expenditures (includes land acquisitions) 80 88
Net capital expenditures for inventory (1) (16) (36) Subtotal 64 52
Development Capital 85 183
Total Capital Expenditures 219 447
(1) Represents gross inventory capital expenditures of $27 and $100 in the three and nine months ended September 30, 2005, respectively, less cost of sales of $43 and $136 in the three and nine months ended September 30, 2005, respectively.
Page 11

STARWOOD HOTELS & RESORTS WORLDWIDE, INC.Summary of Portfolio by Properties & Rooms
As of September 30, 2005UNAUDITED
Owned Hotels Rooms Hotels Rooms Hotels Rooms Hotels Rooms Hotels RoomsSheraton 35 16,049 11 3,074 7 3,235 3 1,028 56 23,386 Westin 22 10,359 11 2,372 3 901 - - 36 13,632 Four Points 6 1,153 - - - - 1 630 7 1,783 W 12 4,294 - - - - - - 12 4,294 Luxury Collection 1 654 5 638 2 320 - - 8 1,612 St. Regis 3 667 1 161 - - - - 4 828 Other 11 2,634 - - - - - - 11 2,634
Total Owned 90 35,810 28 6,245 12 4,456 4 1,658 134 48,169
Managed & UJVSheraton 41 20,565 73 21,483 11 2,140 46 16,416 171 60,604 Westin 37 20,893 7 1,869 - - 12 4,935 56 27,697 Four Points 1 475 7 1,019 2 263 2 387 12 2,144 W 5 904 - - 1 237 2 353 8 1,494 Luxury Collection 6 1,404 6 942 8 188 - - 20 2,534 St. Regis 3 596 1 95 - - 2 591 6 1,282 Other 2 2,705 - - - - 2 296 4 3,001
Total Managed & UJV 95 47,542 94 25,408 22 2,828 66 22,978 277 98,756
FranchisedSheraton 113 35,787 29 6,953 3 1,074 17 6,050 162 49,864 Westin 18 7,289 3 1,141 3 598 5 1,226 29 10,254 Four Points 91 15,861 11 1,482 9 1,350 1 126 112 18,819 Luxury Collection 1 249 12 1,354 - - - - 13 1,603
Total Franchised 223 59,186 55 10,930 15 3,022 23 7,402 316 80,540
SystemwideSheraton 189 72,401 113 31,510 21 6,449 66 23,494 389 133,854 Westin 77 38,541 21 5,382 6 1,499 17 6,161 121 51,583 Four Points 98 17,489 18 2,501 11 1,613 4 1,143 131 22,746 W 17 5,198 - - 1 237 2 353 20 5,788 Luxury Collection 8 2,307 23 2,934 10 508 - - 41 5,749 St. Regis 6 1,263 2 256 - - 2 591 10 2,110 Other 13 5,339 - - - - 2 296 15 5,635
Total Systemwide 408 142,538 177 42,583 49 10,306 93 32,038 727 227,465
ASIA TotalNAD EAME LAD
Page 12