Consumption of Pork Products: Now and to the Year...
22
Consumption of Pork Products: Now and to the Year 2020 Christopher Davis Economic Research Service U.S. Department of Agriculture Washington, DC 20036-5831 Biing-Hwan Lin Economic Research Service U.S. Department of Agriculture Washington, DC 20036-5831 Steven T. Yen Department of Agricultural Economics University of Tennessee Knoxville, TN 37996-4518 May 2004 Abstract Data from the U.S. Department of Agriculture’s 1994-96 and 1998 Continuing Survey of Food Intakes by Individuals are used to describe pork consumption patterns as well as to estimate a censored demand system for pork cuts. The descriptive analysis fills the void about basic information on who consumes pork, how much, and where. A censored system of four pork cuts is estimated by a maximum likelihood procedure and used to predict consumption of pork products through the year 2020. Key Words: Censored dependent variables, CSFII, pork, Tobit system. Selected paper to be presented at the AAEA annual meeting, Denver, August 1-4, 2004. The work is performed under Federal funding and hence can not be copyrighted.
Transcript of Consumption of Pork Products: Now and to the Year...

Consumption of Pork Products: Now and to the Year 2020
Christopher Davis Economic Research Service
U.S. Department of Agriculture Washington, DC 20036-5831
Biing-Hwan Lin
Economic Research Service U.S. Department of Agriculture Washington, DC 20036-5831
Steven T. Yen
Department of Agricultural Economics University of Tennessee
Knoxville, TN 37996-4518
May 2004 Abstract Data from the U.S. Department of Agriculture’s 1994-96 and 1998 Continuing Survey of Food Intakes by Individuals are used to describe pork consumption patterns as well as to estimate a censored demand system for pork cuts. The descriptive analysis fills the void about basic information on who consumes pork, how much, and where. A censored system of four pork cuts is estimated by a maximum likelihood procedure and used to predict consumption of pork products through the year 2020. Key Words: Censored dependent variables, CSFII, pork, Tobit system. Selected paper to be presented at the AAEA annual meeting, Denver, August 1-4, 2004. The work is performed under Federal funding and hence can not be copyrighted.
Pork, “the other white meat”, is one of the most desired meats in the United States. In 2002,
pork accounted for 40 percent of all red meats consumed (U.S. Department Agriculture (USDA),
2003). As the fourth largest sector among all U.S. farm commodities, the hog industry continues
to grow in farm size and undergo changes in the way hogs are produced, managed, and
marketed. A record production of 20.4 billion pounds of pork is expected to reach the market
this year (USDA, 2004).
While we know a great deal about pork production, there is little or no data to show the
basic facts about pork use except total disappearance. In fact, very little is known about the
demographics of pork consumption, how much is consumed, and where pork is consumed. A
better understanding of these three key factors will enable the industry to design effective
marketing strategies and to predict future demand. For example, the changing racial/ethnic
landscape in the United States and the graying of Americans are expected to influence future
pork demand (Lin et al, 2003). This study analyzed the most recent data from the USDA’s food
consumption survey to examine the factors affecting pork consumption. A descriptive analysis
was conducted to describe the distribution of pork consumption, both fresh and processed, across
different marketing sectors, geographic regions, and population groups. In addition, a censored
demand system was estimated for four cuts of pork, and the estimated system was used to
forecast consumption of pork products through the year 2020.
Data
The USDA has conducted periodic food consumption surveys in the United States since the
1930’s. The most recent food consumption surveys, the 1994-96 and 1998 Continuing Survey of
Food Intakes by Individuals (CSFII 1994-96 and 1998) and the 1994-96 Diet and Health
Knowledge Survey (DHKS), conducted by USDA’s Agricultural Research Service (ARS),

2
2
provide the data for this study (USDA 2000). Each year of the 1994-96 CSFII survey comprises
of a nationally representative sample of non-institutionalized persons residing in the United
States. As a supplemental survey to the 1994-96 CSFII, the 1998 CSFII was conducted to
increase the 1994-96 CSFII sample for children.
In the CSFII, two nonconsecutive days of dietary data for individuals of all ages were
collected three to ten days apart through in-person interviews using 24-hour recalls. The 1994-96
CSFII data provide information on the food intakes of 15,303 individuals, while the 1998 CSFII
data provide intake information on 5,559 children up to 9 years of age. The respondents in the
CSFII provided a list of foods consumed as well as information on where and how much of each
food was eaten.
After the respondents reported their first day of dietary intake, an adult 20 years old or
above was randomly selected from each household to participate in the DHKS. The DHKS
questions cover a wide range of issues, including self-perceptions of the adequacy of nutrient
intakes, awareness of diet-health relationships, knowledge of dietary recommendations,
perceived importance of following dietary guidance, use and perceptions of food labels, and
behaviors related to fat intake and food safety. Out of 7,842 households eligible to participate in
the DHKS, respondents from 5,765 households completed the survey.
The ARS created several technical databases to support use of CSFII data. More than
7,000 food items were reported being consumed by the CSFII respondents. Each food is
described and a recipe is provided in the recipe database. ARS also developed the Food
Commodity Intake Database (FCID) for the Environmental Protection Agency (EPA) to estimate
human exposures to pesticide residues through the consumption of foods and beverages (EPA
2000). The FCID provides data on the edible amount of over 500 agricultural food commodities

3
3
contained in foods reported being eaten in CSFII. The description of the food items, their recipes,
and the FCID database were used for this study in classifying pork cuts and calculating the
amount of pork consumed.
Socioeconomic and demographic data for the sample households and their members are
also reported in CSFII. These personal data were combined with consumption data to describe
pork consumption patterns—who eats pork, how much, and where. This descriptive analysis
was conducted by incorporating sample weights to represent the total U.S. market. Additionally,
a censored demand system for four pork cuts was estimated and served as the basis to project
pork consumption through the year 2020. We were interested in examining the role of dietary
knowledge in pork consumption, so the demand analysis was conducted using the data provided
by the adults who completed the DHKS.
U.S. Pork consumption: who, what, how much, and where
The CSFII data were used to estimate the distribution of pork consumption by economic and
demographic characteristics. According to USDA’s food disappearance data, each American
consumed an average of 66 pounds of pork, carcass weight, per year during the 1994-98 period.
This per capita consumption was combined with market distribution to derive per capita pork
consumption by economic and demographic characteristics.
In this study, pork was separated into two main product forms--fresh and processed. The
consumption of individual cuts within each form could also be estimated with CSFII data and its
associated databases. For fresh pork, individual cuts included pork chops, pork steaks, ribs,
fresh-ham, other fresh pork, and pork parts. The processed pork category could be further
disaggregated into lunchmeats, hot dogs, bacon, sausage, smoked ham, and other processed pork.

4
4
Due to space limitation, we described pork consumption in terms of market distribution and per
capita consumption (in parentheses) for the two aggregated product forms—fresh and processed
(table 1).
[insert table 1 here]
CSFII data indicate that 38 and 62 percent (25 and 41 pounds per person) of pork were
consumed as fresh and processed, respectively, during the 1994-98 period. Pork was purchased
mainly at retail stores (78 percent) and considered as at-home foods. A larger proportion of fresh
pork was purchased for at-home consumption (82 percent), compared with the 76 percent for
processed pork. Restaurants, including fast food places, represented the bulk of pork consumed
away from home with a 17-percent share of total pork consumption (11 pounds per person per
year). Consumers consumed an average of 7 pounds of processed pork and 4 pounds of fresh
pork at restaurants during 1994-98.
There were regional differences in pork consumption. The pork market was strongest in
the Midwest region (75 pounds per person per year) and weakest in the West region (53 pounds).
The Midwest accounted for 24 percent of the U.S. population and 26, 27, and 27 percent of fresh,
processed, and total pork consumption, respectively. Fresh pork was favored in the West, while
processed pork was favored in the South. Pork was favored by rural consumers, who represented
21 percent of the U.S. population and 25 percent of pork consumption.
Males consumed more pork, both fresh and processed, than did females (84 pounds
versus 48 pounds). Pork consumption initially increased with age, peaking among the 40-59 age
group (99 pounds for men and 54 pounds for women), and then declined.
In the CSFII survey, households were classified into three income brackets using the
Federal poverty guidelines. The poverty guideline was developed by the U.S. Department of
5
5
Health and Human Services for the implementation of Federal food programs. Some Federal
food programs, such as the Food Stamp Program, have used 130 percent of the poverty level as
the eligibility criterion for participation. CSFII data indicate that lower-income consumers ate
more pork than their higher-income counterparts. Individuals in households with income eligible
for the Food stamp program consumed about 70 pounds of pork per year, compared to 68 and 62
pounds consumed in higher income households.
The 1994-96 and 1998 CSFII were based on populations from the 1990 Census. At that
time, Hispanics and Blacks accounted for 11 and 13 percent of U.S. population, respectively.
The 2000 Census results show the United States has been undergoing rapid demographic
expansion. Pork was favored by Blacks, who consumed about 82 pounds per person per year,
followed by 74, 64, and 57 pounds consumed by other race, Whites, and Hispanics, respectively.
Blacks had a strong preference for processed pork (54 pounds) and consumers of other races
favored fresh pork (49 pounds).
The Censored Demand System for Pork by Cut
In this study, we also estimated a demand system for pork cuts and used it to forecast pork
demand through the year 2020. Four cuts of pork were specified: fresh pork (chop, loin, rib, ham,
and other fresh cuts, excluding offal or byproducts), brunch meats (includes lunch meats, hot
dogs, bacon, and sausage), smoked ham, and other pork. The CSFII data indicate that over the
two-day survey period, 23, 35, 21, and 38 percent of the DHKS respondents consumed fresh
pork, lunchmeats, smoked ham, and other pork.
Because the dependent variables are censored (i.e., some individuals did not consume
certain pork cuts during the survey period), standard regression procedures not accommodating


8
8
these effects of variables are calculated by the delta approximation method (Spanos).
The explanatory variables in the demand system included household income, dietary
knowledge, household size, household type, age, gender, age, race/ethnicity, employment status,
and seasonal/location dummy variables. The variable names and definitions and the sample
statistics are given in table 2. All explanatory variables, except dietary knowledge, are self-
explanatory. We used 12 DHKS questions to measure dietary knowledge. Five of these questions
reflect an individual’s knowledge of recommended servings for the five food groups specified in
the Food Guide Pyramid (grains, dairy, meats, fruits, and vegetables). The remaining seven
questions probe an individual’s awareness of any health problems caused by dietary related
behavior, such as eating too much fat or not eating enough fiber. The dietary knowledge was
derived by summing correct answers to the recommended servings (in range) and the number of
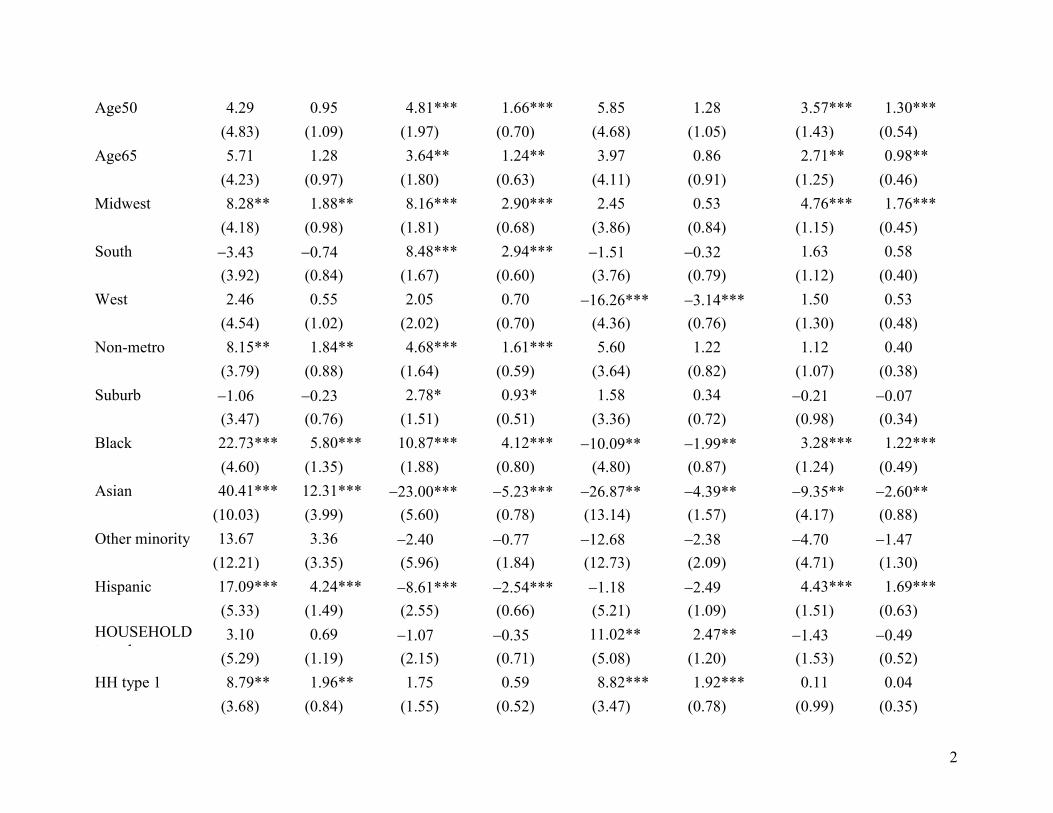
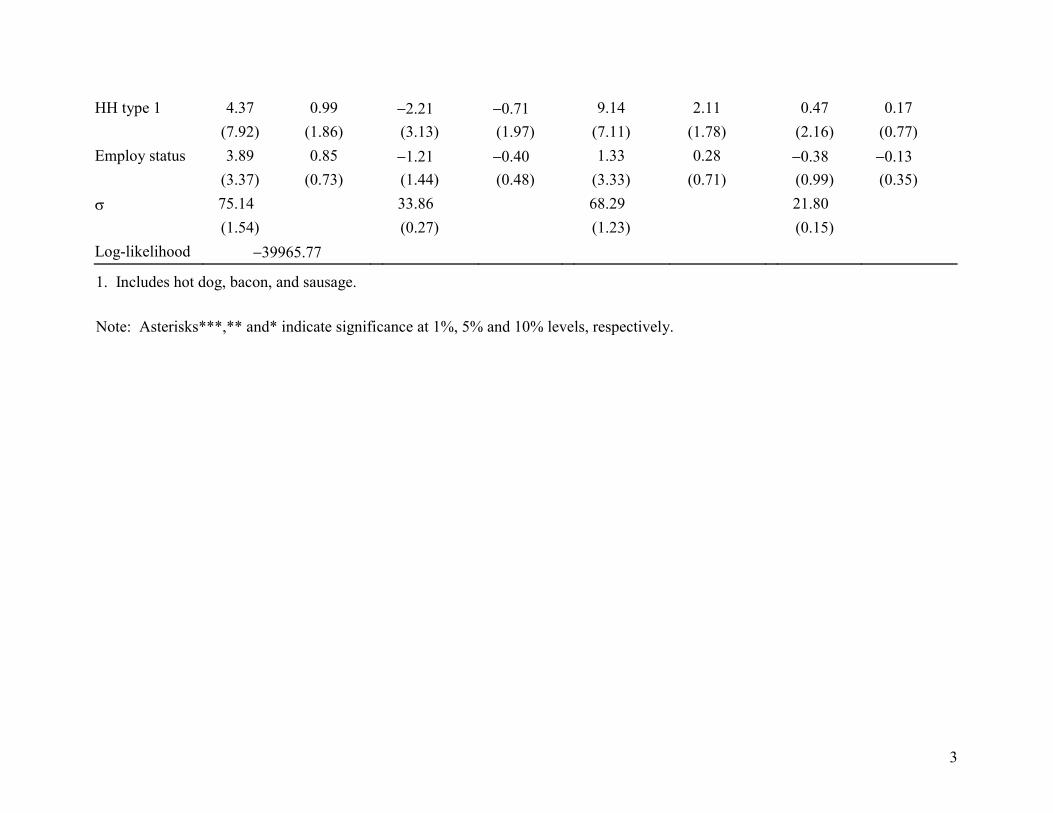
diet-health relationships of which the respondent was aware. The estimates of parameters and
elasticities (and their standard errors and significance levels) are given in table 3.
[insert table 2]
[insert table 3]
The censored demand results suggest that household income had a negative effect on per
capita consumption of brunch meats (including lunchmeats, hot dogs, bacon, and sausage) but
had no significant effect on the consumption of the other three cuts—fresh pork, smoked ham,
and other pork. Adults with higher dietary knowledge tended to consume less brunch meats and
smoked ham. These findings are consistent with those reported in a study, which applied a
different approach to the same data (table 15 and 16 in Lin et al).
Pork consumption was found to be quite stable across the four seasons of the year. Males
consumed more pork than did females. Seniors (those of age 66 and older) consumed less pork

9
9
than did younger adults. Pork demand was strongest in the Midwest region. Consumers in the
Southern region had a strong preference for brunch meats. Consumers in the Western region
consumed the least amount of smoked ham. Consumers living in non-metropolitan (rural) areas
consumed more pork than did other consumers. Compared with other consumers, Asians (who
account for the majority of the other race category of the descriptive analysis) consumed the
largest amount of fresh pork but the least amount of the other three cuts of pork. The Blacks
preferred consuming fresh pork, brunch meats, and other pork. The Whites consumed more
smoked ham than did other consumers, while Hispanics preferred fresh pork but not brunch
meats.
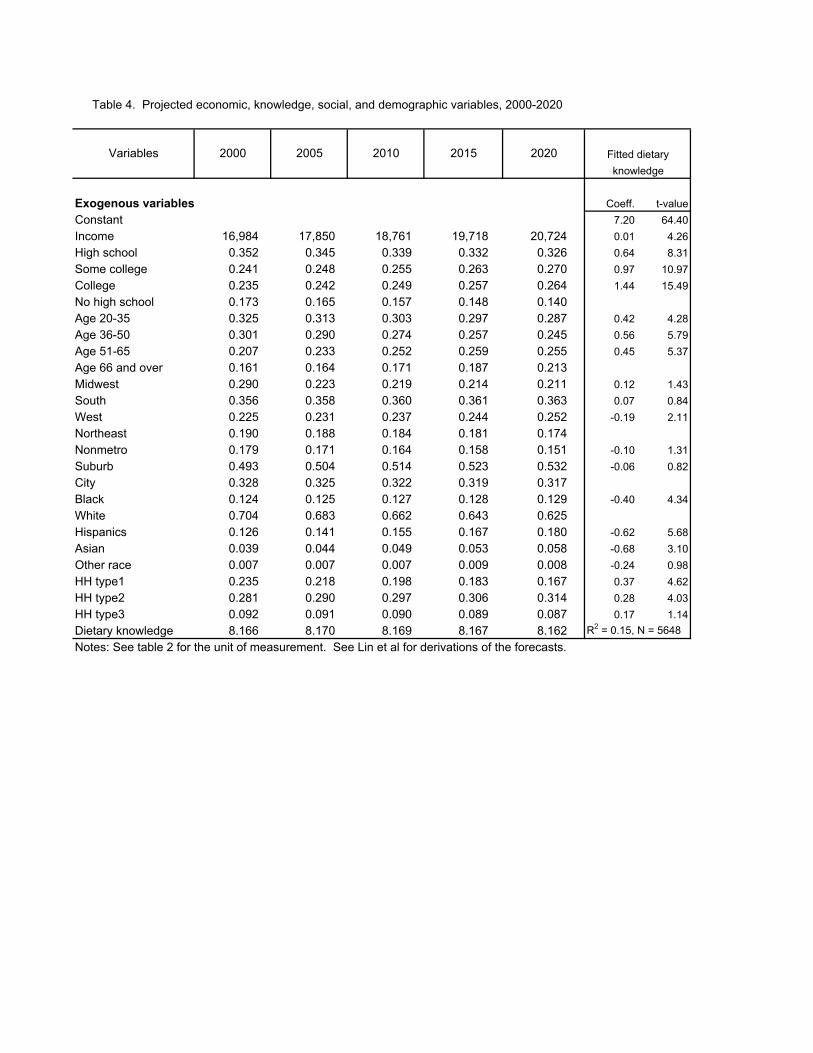
Future Pork consumption: 2000-2020
Note that CSFII and DHKS data used in the demand estimation were collected for 1994-96. The
first step in forecasting pork consumption was to project the values of the exogenous economic,
knowledge, social, and demographic variables that affect pork consumption. The projected
values of some variables, in 5-year increments beginning with the year 2000, are reported in
table 4. Values of other exogenous variables not in table 4 were assumed to remain constant at
the mean values of the 1994-96 and 1998 CSFII sample data. A discussion of the future values of
exogenous variables can be found in Lin et al.
[insert table 4 here]
An OLS model was fitted for dietary knowledge to forecast future dietary knowledge.
The results, summarized in the last two columns of table 4, indicate that dietary knowledge rose
with income and educational achievement, but declined with age. Dietary knowledge also varied

10
10
by marital status, race, and the location of the respondent’s residence. The predictions of dietary
knowledge are shown in the last row of table 4.
Several assumptions were made to forecast pork consumption. First, consumers’
preferences for pork were assumed to carry over from 1994-96 to 2020. Second, the analysis
was based on a cross-section of data collected over a short period of time. Given that the surveys
contain no price information, prices do not appear in the consumption equations. As such,
relative prices were assumed the same for all households of the same region within a season and
throughout the prediction period. Note that regional and seasonal dummy variables were
included in the model, so that systematic price variations by region and season should have been
captured. Third, there was an implicit assumption that as any individual moves from one
demographic group (e.g., age) to another, his/her preferences immediately take on the
characteristics of the new group.
The rates of change in per capita and total pork consumption among adults predicted for
the 2000-2020 period are shown in figures 1 and 2. The U.S. population is expected to grow by
50 million people between 2000 and 2020. Per capita consumption of fresh pork was predicted
to rise by 3.4 percent between 2000 and 2020, whereas per capita consumption of brunch meat,
smoked ham, and other pork were predicted to fall by 7.5, 5.2, and 2.5 percent, respectively,
during the 2000-2020 period.
[insert figures here]
The graying of the population and the changing racial/ethnicity landscape in the United
States contributed to the predicted changes in per capita consumption. It was predicted that those
older than 65 would increase their share of the U.S. population, and this age group (the base in
regression) consumed the least amount of all four pork cuts (Lin et al). It was predicted that
11
11
Hispanics, Asians, and Blacks would increase their representation in the U.S. population.
Compared to Whites, Hispanics consumed more fresh pork and other pork but less brunch meats
and smoked ham, Asians consumed more fresh pork and less of other three pork cuts, and Blacks
consumed less smoked ham but more of the other three pork cuts. During the 2000-2020 period,
the U.S. population would age to the extent that those older than 65 would increase their
representation at the expenses of each of these other three age groups, 20-35, 36-50, and 51-65.
Because of rising U.S. population, the total U.S. consumption of all four pork cuts was
predicted to increase between 2000 and 2020. Among the four cuts, only fresh pork was
predicted to exhibit increasing per capita consumption. Therefore, total fresh pork consumption
was predicted to rise at a faster rate (22 percent over 20 years) than the other cuts (9 percent for
brunch meats, 12 percent for smoked ham, and 15 percent for other pork). Combining the four
cuts, the total U.S. pork consumption was predicted to rise by 15 percent between 2000 and 2020.
The predicted changes in per capita and total pork consumption are a result of predicted
changes in economic and demographic conditions. The contribution of each factor to
consumption can be traced through a decomposition analysis (see Lin at al). The contribution
can be quite complex for some factors, such as income and age. Income and age affect pork
consumption directly according to the censored demand system, and they also indirectly affect
pork consumption through dietary knowledge. The decomposition analysis was not conducted
for this study.
Conclusions
Data from the USDA’s food consumption surveys conducted in 1994-96 and 1998 were analyzed
to describe U.S. pork consumption patterns and to estimate a demand system for pork cuts,

12
12
which was used to forecast pork consumption through the year 2020. The data show that
processed market dominated the fresh market (68 percent versus 32 percent) and the at-home
market dominated the away-from-home market (78 percent versus 22 percent). Our analysis
shows that income and dietary knowledge had negative effects on the consumption of certain
pork cuts. Further, pork consumption varied by a host of social and demographic factors,
including race and age. As a result, the expected changing racial landscape and graying of the
American population are expected to affect future pork market.
The estimated demand system for pork cuts and the predicted social, economic, and
demographic conditions were used to predict the per capita consumption of the pork cuts. It
should be noted that there are key assumptions underlying the predictions. We assumed that
consumers’ preferences for pork and relative pork prices would stay the same throughout year
2020. Over time, as consumers move from one demographic group to another (such as aging),
they would take on the new group’s consumption patterns. The results indicated that per capita
consumption of fresh pork would rise but the consumption of processed pork would decline over
the next two decades. However, the U.S. population is predicted to grow by an estimated 50
million people. As a result, between 2000 and 2020, the consumption of fresh pork was
predicted to grow by 22 percent, followed by a 15 percent growth in other pork, 12 percent for
smoked ham, and 9 percent for lunchmeats, hot dogs, bacon, and sausage.

13
13
References
Amemiya, T. “Multivariate Regression and Simultaneous Equation Models When the
Dependent Variables Are Truncated Normal.” Econometrica 42(1974):999�1012.
Daganzo, C. Multinomial Probit: The Theory and Its Application to Demand Forecasting. New
York: Academic Press,1980.
Davidson, R., and J.G. MacKinnon. Estimation and Inference in Econometrics. Oxford, UK:
Oxford University Press, 1993.
Environmental Protection Agency, Office of Pesticide Programs. Food Commodity Intake
Database. CD-ROM, 2000.
Kotz, S., N.L. Johnson, and N. Balalrishnan. Continuous Multivariate Distributions, vol. 1:
Models and Applications, 2nd ed. New York: John Wiley & Sons, 2000.
Lin, B.H., J Variyam, J. Allshouse, and J. Cromartie. Food and Agricultural Commodity
Consumption in the United States: Looking Ahead to 2020, Washington, DC: U.S.
Department of Agriculture, Economic Research Service, Agricultural Economic Report No.
820, February 2003.
McDonald J.F., and R.A. Moffitt. “The Uses of Tobit Analysis.” The Review of Economics and
Statistics 62(1980):318�21.
Hajivassiliou, V.A. “Classical Estimation Methods for LDV Models Using Simulation.”
Handbook of Econometrics, vol. 4. R.F. Engle and D.L. McFadden, eds., chap. 40, pp.
2383�2441. Amsterdam: North-Holland, 1994.
Spanos, A. Probability Theory and Statistical Inference: Econometric Modeling with
Observational Data. Cambridge, UK: Cambridge University Press, 1999.

14
14
U.S. Department of Agriculture. Agricultural Statistics. National Agricultural Statistics Service.
U.S. Government Printing Office, Washington, D.C. 2003.
U.S. Department of Agriculture, Agricultural Research Service. World Agricultural Supply and
Demand Estimates. WASDE -409: pp. 1-36. April 8, 2004.
U.S. Department of Agriculture, Agricultural Research Service. Continuing Survey of Food
Intakes by Individuals 1994-96 and 1998. CD-ROM., 2000.
Yen, S.T., and B. Lin. “Beverage Consumption among US Children and Adolescents: Full-
information and Quasi Maximum-likelihood Estimation of a Censored System.”
European Review of Agricultural Economics 29(2002):85�103.

Table 1. U.S. consumption of fresh and processed pork: market distribution and per capita
Item
Fresh: Processed 37.7 (24.9) 62.3 (41.1)
Food Sources:Home 78.1 (51.5) 81.8 (20.4) 75.8 (31.2)Away from Home 21.9 (14.5) 18.2 (4.5) 24.2 (10.0)Restaurant 17.1 (11.3) 15.4 (3.8) 18.1 (7.4)Others 4.9 (3.2) 2.8 (0.7) 6.1 (2.5)
Census Region:Northeast 19.6 19.6 (65.9) 18.9 (20.3) 19.9 (45.7)Midwest 23.5 26.6 (74.7) 26.0 (23.2) 26.9 (51.5)South 34.9 36.1 (68.2) 32.2 (19.4) 37.9 (48.9)West 22.0 17.7 (53.1) 22.8 (21.8) 15.3 (31.3)
MSA Status:Urban 31.8 30.4 (63.0) 34.1 (22.5) 28.6 (40.5)Suburban 47.0 44.8 (62.9) 42.1 (18.8) 46.1 (44.1)Non-metro (rural) 21.2 24.8 (77.3) 23.8 (23.6) 25.3 (53.7)
Race/Ethnic Origin:White, Non-Hispanic 72.5 70.4 (64.1) 61.1 (17.7) 74.8 (46.4)Black, Non-Hispanic 12.6 15.6 (81.6) 16.8 (28.0) 15.0 (53.6)Hispanic 10.6 9.1 (56.7) 11.9 (23.6) 7.8 (33.1)Other races 4.4 4.9 (73.7) 10.3 (49.2) 2.4 (24.5)
Household Income as a Percentage of Poverty:
Under 130 percent 19.2 20.2 (69.6) 21.4 (23.4) 19.7 (46.2)131-350 percent 41.8 43.1 (68.1) 41.6 (20.9) 43.8 (47.2)Over 350 percent 39.0 36.7 (62.0) 37.0 (19.9) 36.5 (42.1)
Gender and Age:Male, All 49.0 62.6 (84.4) 62.7 (26.9) 62.6 (57.5)
Male, 2-11 9.0 6.3 (46.1) 5.4 (12.6) 6.7 (33.5)Male, 12-19 5.9 7.7 (85.6) 6.9 (24.6) 8.0 (61.0)Male, 20-30 16.0 22.7 (93.5) 22.4 (29.4) 22.8 (64.1)Male, 40-59 11.6 17.3 (98.5) 18.4 (33.3) 16.8 (65.2)Male, 60 and over 6.7 8.7 (85.8) 9.6 (30.1) 8.3 (55.7)
Female, All 51.0 37.4 (48.4) 37.3 (15.4) 37.4 (33.0)Female, 2-11 8.5 4.9 (38.3) 3.5 (8.6) 5.6 (29.6)Female, 12-19 5.7 3.9 (45.7) 3.4 (12.5) 4.2 (33.2)Female, 20-30 15.9 11.9 (49.5) 12.8 (16.9) 11.5 (32.5)Female, 40-59 12.1 9.9 (54.1) 10.6 (18.4) 9.6 (35.7)Female, 60 and over 8.6 6.7 (51.4) 6.9 (16.8) 6.6 (34.5)
Market share in percent (per capita consumption in pounds)
Source: U.S. Department of Agriculture, Agricultural Research Service, 2000. 1994-96 and 1998 Continuing Survey of Food Intakes by Individuals.
Population share All pork Fresh market Processed market
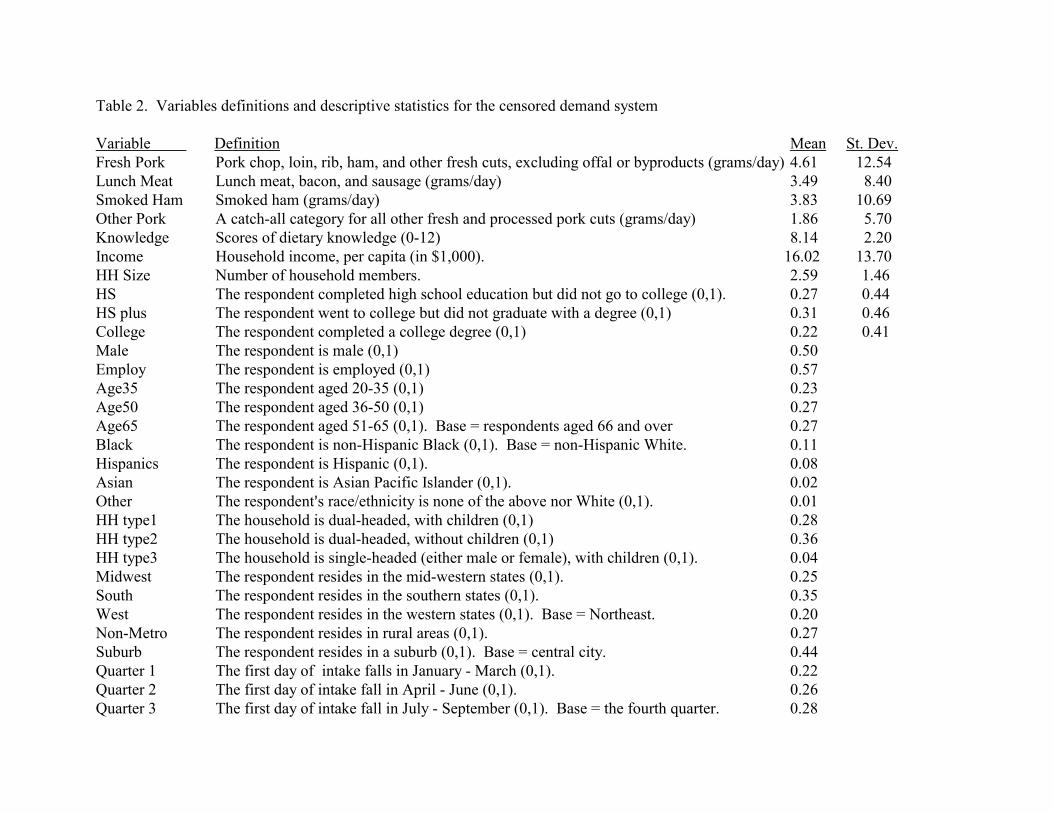
Table 2. Variables definitions and descriptive statistics for the censored demand system
Variable Definition Mean St. Dev. Fresh Pork Pork chop, loin, rib, ham, and other fresh cuts, excluding offal or byproducts (grams/day) 4.61 12.54 Lunch Meat Lunch meat, bacon, and sausage (grams/day) 3.49 8.40 Smoked Ham Smoked ham (grams/day) 3.83 10.69 Other Pork A catch-all category for all other fresh and processed pork cuts (grams/day) 1.86 5.70 Knowledge Scores of dietary knowledge (0-12) 8.14 2.20 Income Household income, per capita (in $1,000). 16.02 13.70 HH Size Number of household members. 2.59 1.46 HS The respondent completed high school education but did not go to college (0,1). 0.27 0.44 HS plus The respondent went to college but did not graduate with a degree (0,1) 0.31 0.46 College The respondent completed a college degree (0,1) 0.22 0.41 Male The respondent is male (0,1) 0.50 Employ The respondent is employed (0,1) 0.57 Age35 The respondent aged 20-35 (0,1) 0.23 Age50 The respondent aged 36-50 (0,1) 0.27 Age65 The respondent aged 51-65 (0,1). Base = respondents aged 66 and over 0.27 Black The respondent is non-Hispanic Black (0,1). Base = non-Hispanic White. 0.11 Hispanics The respondent is Hispanic (0,1). 0.08 Asian The respondent is Asian Pacific Islander (0,1). 0.02 Other The respondent=s race/ethnicity is none of the above nor White (0,1). 0.01 HH type1 The household is dual-headed, with children (0,1) 0.28 HH type2 The household is dual-headed, without children (0,1) 0.36 HH type3 The household is single-headed (either male or female), with children (0,1). 0.04 Midwest The respondent resides in the mid-western states (0,1). 0.25 South The respondent resides in the southern states (0,1). 0.35 West The respondent resides in the western states (0,1). Base = Northeast. 0.20 Non-Metro The respondent resides in rural areas (0,1). 0.27 Suburb The respondent resides in a suburb (0,1). Base = central city. 0.44 Quarter 1 The first day of intake falls in January - March (0,1). 0.22 Quarter 2 The first day of intake fall in April - June (0,1). 0.26 Quarter 3 The first day of intake fall in July - September (0,1). Base = the fourth quarter. 0.28

1
Table 3. Maximum-Likelihood Estimates of Censored System of Equations
Variable Fresh Pork Brunch meat1 Smoked Ham Other Pork Estimate Elasticity Estimate Elasticity Estimate Elasticity Estimate Elasticity Constant �83.32*** �22.05*** �50.43*** �16.82*** (8.38) (3.52) (8.13) (2.32) Continuous Variables Income 0.07 0.03 �0.23*** �0.16*** �0.15 �0.06 0.00 �0.01 (0.12) (0.04) (0.05) (0.04) (0.11) (0.05) (0.04) (0.04)
Diet knowledge �0.56 �0.11 �0.94*** �0.34*** �1.37** �0.29** �0.11 �0.06 (0.64) (0.12) (0.28) (0.10) (0.65) (0.14) (0.17) (0.10) Household size 1.29 0.08 �0.23 �0.03 �2.02 �0.13 0.71* 0.13* (1.39) (0.08) (0.57) (0.07) (1.48) (0.10) (0.42) (0.07) Weekend �1.17 �0.02 4.17*** 0.10*** 0.64 0.01 0.88 0.03 (2.48) (0.03) (1.05) (0.03) (2.35) (0.03) (0.74) (0.03) Binary Variables Quarter 1 5.07 1.14 1.24 0.42 2.46 0.53 0.59 0.21 (4.01) (0.92) (1.71) (0.58) (3.74) (0.82) (1.14) (0.40) Quarter 2 3.15 0.70 1.00 0.34 2.08 0.45 �0.42 �0.15 (3.83) (0.86) (1.63) (0.55) (3.61) (0.79) (1.08) (0.37) Quarter 3 �1.55 �0.34 2.04 0.69 �1.47 �0.31 �1.40 �0.48 (3.84) (0.83) (1.56) (0.54) (3.67) (0.77) (1.07) (0.36) Male 13.49*** 2.95*** 11.54*** 3.84*** 12.58*** 2.68*** 4.09*** 1.43*** (2.96) (0.65) (1.27) (0.42) (2.83) (0.60) (0.85) (0.29) Age35 1.34 0.30 0.45 0.15 1.24 0.27 5.98*** 2.26*** (4.96) (1.10) (2.11) (0.71) (4.76) (1.03) (1.42) (0.58)
2
Age50 4.29 0.95 4.81*** 1.66*** 5.85 1.28 3.57*** 1.30*** (4.83) (1.09) (1.97) (0.70) (4.68) (1.05) (1.43) (0.54) Age65 5.71 1.28 3.64** 1.24** 3.97 0.86 2.71** 0.98** (4.23) (0.97) (1.80) (0.63) (4.11) (0.91) (1.25) (0.46) Midwest 8.28** 1.88** 8.16*** 2.90*** 2.45 0.53 4.76*** 1.76*** (4.18) (0.98) (1.81) (0.68) (3.86) (0.84) (1.15) (0.45) South �3.43 �0.74 8.48*** 2.94*** �1.51 �0.32 1.63 0.58 (3.92) (0.84) (1.67) (0.60) (3.76) (0.79) (1.12) (0.40) West 2.46 0.55 2.05 0.70 �16.26*** �3.14*** 1.50 0.53 (4.54) (1.02) (2.02) (0.70) (4.36) (0.76) (1.30) (0.48) Non-metro 8.15** 1.84** 4.68*** 1.61*** 5.60 1.22 1.12 0.40 (3.79) (0.88) (1.64) (0.59) (3.64) (0.82) (1.07) (0.38) Suburb �1.06 �0.23 2.78* 0.93* 1.58 0.34 �0.21 �0.07 (3.47) (0.76) (1.51) (0.51) (3.36) (0.72) (0.98) (0.34) Black 22.73*** 5.80*** 10.87*** 4.12*** �10.09** �1.99** 3.28*** 1.22*** (4.60) (1.35) (1.88) (0.80) (4.80) (0.87) (1.24) (0.49) Asian 40.41*** 12.31*** �23.00*** �5.23*** �26.87** �4.39** �9.35** �2.60** (10.03) (3.99) (5.60) (0.78) (13.14) (1.57) (4.17) (0.88) Other minority 13.67 3.36 �2.40 �0.77 �12.68 �2.38 �4.70 �1.47 (12.21) (3.35) (5.96) (1.84) (12.73) (2.09) (4.71) (1.30) Hispanic 17.09*** 4.24*** �8.61*** �2.54*** �1.18 �2.49 4.43*** 1.69*** (5.33) (1.49) (2.55) (0.66) (5.21) (1.09) (1.51) (0.63) HOUSEHOLD t 1
3.10 0.69 �1.07 �0.35 11.02** 2.47** �1.43 �0.49 (5.29) (1.19) (2.15) (0.71) (5.08) (1.20) (1.53) (0.52) HH type 1 8.79** 1.96** 1.75 0.59 8.82*** 1.92*** 0.11 0.04 (3.68) (0.84) (1.55) (0.52) (3.47) (0.78) (0.99) (0.35)
3
HH type 1 4.37 0.99 �2.21 �0.71 9.14 2.11 0.47 0.17 (7.92) (1.86) (3.13) (1.97) (7.11) (1.78) (2.16) (0.77) Employ status 3.89 0.85 �1.21 �0.40 1.33 0.28 �0.38 �0.13 (3.37) (0.73) (1.44) (0.48) (3.33) (0.71) (0.99) (0.35) � 75.14 33.86 68.29 21.80 (1.54) (0.27) (1.23) (0.15) Log-likelihood �39965.77
1. Includes hot dog, bacon, and sausage.
Note: Asterisks***,** and* indicate significance at 1%, 5% and 10% levels, respectively.
Exogenous variables Coeff. t-valueConstant 7.20 64.40Income 16,984 17,850 18,761 19,718 20,724 0.01 4.26High school 0.352 0.345 0.339 0.332 0.326 0.64 8.31Some college 0.241 0.248 0.255 0.263 0.270 0.97 10.97College 0.235 0.242 0.249 0.257 0.264 1.44 15.49No high school 0.173 0.165 0.157 0.148 0.140Age 20-35 0.325 0.313 0.303 0.297 0.287 0.42 4.28Age 36-50 0.301 0.290 0.274 0.257 0.245 0.56 5.79Age 51-65 0.207 0.233 0.252 0.259 0.255 0.45 5.37Age 66 and over 0.161 0.164 0.171 0.187 0.213Midwest 0.290 0.223 0.219 0.214 0.211 0.12 1.43South 0.356 0.358 0.360 0.361 0.363 0.07 0.84West 0.225 0.231 0.237 0.244 0.252 -0.19 2.11Northeast 0.190 0.188 0.184 0.181 0.174Nonmetro 0.179 0.171 0.164 0.158 0.151 -0.10 1.31Suburb 0.493 0.504 0.514 0.523 0.532 -0.06 0.82City 0.328 0.325 0.322 0.319 0.317Black 0.124 0.125 0.127 0.128 0.129 -0.40 4.34White 0.704 0.683 0.662 0.643 0.625Hispanics 0.126 0.141 0.155 0.167 0.180 -0.62 5.68Asian 0.039 0.044 0.049 0.053 0.058 -0.68 3.10Other race 0.007 0.007 0.007 0.009 0.008 -0.24 0.98HH type1 0.235 0.218 0.198 0.183 0.167 0.37 4.62HH type2 0.281 0.290 0.297 0.306 0.314 0.28 4.03HH type3 0.092 0.091 0.090 0.089 0.087 0.17 1.14Dietary knowledge 8.166 8.170 8.169 8.167 8.162 R2 = 0.15, N = 5648Notes: See table 2 for the unit of measurement. See Lin et al for derivations of the forecasts.
Fitted dietaryknowledge
Table 4. Projected economic, knowledge, social, and demographic variables, 2000-2020
2015 2020Variables 2000 2005 2010

9095
100105110115120125
per c
apita
2005 2010 2015 2020
Year
Figure 2. Growth in U.S. total pork consumption by cuts (base year 2000 = 100)
Fresh pork Lunch meat, bacon, sauage Smoked ham Other pork Total
86889092949698
100102104
per c
apita
2005 2010 2015 2020
Year
Figure 1. Changes in per capita pork consumption in the U.S.(base year 2000 = 100)
Fresh pork Lunch meat, bacon, sauage Smoked ham Other pork Total


![Pandering and pork-barrel politics · pork / =∗ >/ (∗)+ >(=∗ ∗= =, ()= < ≥ ()+≥(. / /. / ∗ ∗ ()= ⎧ ⎪⎨ ⎪⎩ ()>) ()∈ ) (∗,)> . ≡ /)]](https://static.fdocuments.us/doc/165x107/5f953f35c33d70257c62d34e/pandering-and-pork-barrel-politics-pork-a-a-a-a-.jpg)