Consumers and Nutrition Content Claims. A study of ... · Consumers and Nutrition Content Claims. A...
139
Consumers and Nutrition Content Claims. A study of responses to vitamin, mineral and other claims. December 21, 2009 - Prepared for - Food Standards Australia New Zealand 55 Blackall Street Canberra ACT 2600 - Prepared by - Roy Morgan Research Level 2/26 Wharf Street, Brisbane, QLD 4000
-
Upload
truongkhuong -
Category
Documents
-
view
217 -
download
0
Transcript of Consumers and Nutrition Content Claims. A study of ... · Consumers and Nutrition Content Claims. A...

Consumers and Nutrition Content Claims. A
study of responses to vitamin, mineral and
other claims.
December 21, 2009
- Prepared for -
Food Standards Australia New Zealand 55 Blackall Street
Canberra ACT 2600
- Prepared by -
Roy Morgan Research
Level 2/26 Wharf Street,
Brisbane, QLD 4000

Consumer response to nutrition content claims on foods
Roy Morgan Research December, 2009
INDEX
1. EXECUTIVE SUMMARY........................................................................................ 1
2. INTRODUCTION...................................................................................................... 3
2.1 BACKGROUND ........................................................................................................ 3
2.2 RESEARCH OBJECTIVES..................................................................................... 7
3. METHODOLOGY..................................................................................................... 8
3.1 STUDY DESIGN........................................................................................................ 8
3.2 STAGE 1: DEVELOPMENT OF STIMULI .......................................................... 9
3.3 STAGE 2: QUESTIONNAIRE DEVELOPMENT .............................................. 11
3.4 STAGE 3: ONLINE SURVEY ............................................................................... 13
3.4.1 Sampling and stratification................................................................................. 13
3.4.2 Response Rate ..................................................................................................... 13
3.5 SAMPLE PROFILE ................................................................................................ 14
3.6 VARIABLES OF INTEREST AND RECLASSIFICATION.............................. 16
3.7 ANALYSES .............................................................................................................. 20
4. MAIN FINDINGS .................................................................................................... 21
4.1 OVERALL PRODUCT EVALUATIONS............................................................. 21
4.2 COGNITIVE AND BEHAVIOURAL MEASURES ............................................ 29
4.3 DOES THE PRESENCE OF CLAIM AFFECT CONSUMERS’ PRODUCT
EVALUATIONS?.............................................................................................................. 32
4.3.1 Does the presence of a claim effect consumers’ purchase intention? ................ 33
4.3.2 Does the presence of a claim affect consumers’ nutrition attitude?................... 43
4.3.3 Does the presence of claim affect consumers’ perceptions of the number of types
of people benefiting from eating the product?................................................................. 53
4.3.4 Does the presence of a claim affect consumers’ perceptions of the number of
types of health benefits from eating the product?............................................................ 63
5. SUMMARY OF THE KEY FINDINGS ................................................................ 73
APPENDIX A: SAMPLE PLAN...................................................................................... 77

Consumer response to nutrition content claims on foods
Roy Morgan Research December, 2009
APPENDIX B: ACHIEVED SAMPLE ........................................................................... 81
APPENDIX C: ADDITONAL TABLES......................................................................... 85
APPENDIX D: TECHNICAL APPENDIX .................................................................... 86
APPENDIX E: PICTURES OF STIMULI ..................................................................... 92
APPENDIX F: QUESTIONNAIRE............................................................................... 109

Consumer response to nutrition content claims on foods Page 1
Roy Morgan Research December, 2009
1. EXECUTIVE SUMMARY
• Food Standards Australia New Zealand (FSANZ) commissioned Roy Morgan
Research to undertake a study of the impact of nutrition content claims on products of
lower nutritional quality. The study addresses the key research question: are
consumer’s nutrition evaluations and intention to purchase influenced by nutrition
content claims on products of lower nutritional quality?
• The study used a between-groups experimental design where participants were asked to
evaluate product stimuli that closely approximated real-world products. Participants
were randomly allocated to either a treatment group or a control group. Treatment and
control groups differed in that those in the former were exposed to product stimuli with
nutrition content claims and those in the latter were exposed to product stimuli without
nutrition content claims.
• The study used nutrition content claims regarding vitamins, minerals and biologically
active substances on four food products: ice cream, frozen lasagne, fruit drink, and
potato chips. The four food products were of lower nutritional quality and their
nutritional profile did not meet the Nutrient Profiling Scoring Criteria (NPSC).
• The study was implemented using an on-line survey which enabled respondents to
view images of product stimuli. The product stimuli approximated real world
products and were relative to each other in size. A sample of adult main grocery
buyers was drawn. A total of 1,127 respondents completed the survey, 814 from
Australia and 313 from New Zealand, proportionally drawn from country, age group,
and gender.
• Four evaluation measures were used to determine if the presence nutrition content
claim had a significant effect:
o Intention to purchase the product
o Nutrition attitude towards the product
o Number of types of people perceived to benefit from consuming the product
o Number of types of health benefits perceived from consuming the product
• The study found that nutrition content claims had no significant effect on the purchase
intention, nutrition attitude, perceptions of types of people who would benefit, or
perceptions of the types of health benefits, both overall and across products. The only
exception was that claim presence significantly predicted the perceptions of the
number of types of people who would benefit from drinking fruit drink; however, the

Consumer response to nutrition content claims on foods Page 2
Roy Morgan Research December, 2009
strength of the influence was relatively low and accounted for less than 1% of the
variance.
• While nutrition content claims had no impact, several socio-demographic, cognitive,
and behavioural factors were found to significantly influence the prediction of
respondent’s purchase intentions, nutrition attitude, perceptions of the number of types
of people who would benefit, and perceptions of the number of types of health benefits.
• Country of residence was a significant factor in all four evaluation measures for all four
products both individually and also overall. Australians consistently scored higher
across the evaluation measures than New Zealand based respondents.
• While not significant in all circumstances household income, nutrition knowledge, and
knowledge of micronutrient functions were important factors for most evaluations.
Lower household income, lower nutrition knowledge, and a higher reported knowledge
of micronutrient functions were consistently associated with higher product
evaluations.
• To a smaller degree age, gender, dependents in the household, education level, health
concerns, and motivation to read nutrition labels also yielded an effect on evaluations.
• In summary, exposure to nutrition content claims about vitamins, minerals and
biologically active substances on the ice cream, frozen lasagne, fruit drink, and potato
chip packaging presented in product images via an online survey did not enhance
consumer’s product evaluations or purchase intentions. Only in the instance of the fruit
drink did the presence of a claim significantly affect their evaluation of the number of
types of people who would benefit from the consuming the product.
• Consistent with the findings of the previous commissioned nutrient content claim
research, there were several socio-demographic, cognitive, and behavioural factors
which influenced consumer’s purchase intentions and product evaluations. However,
the strength of influence was relatively weak, accounting for no more than 17% of the
total variance. This indicates that there are other factors which are influencing
consumers purchase intentions and product evaluations, at least for foods which are of
low nutrition quality, which have not been captured by this research.
Consumer response to nutrition content claims on foods Page 3
Roy Morgan Research December, 2009
2. INTRODUCTION
2.1 Background
Food Standards Australian New Zealand (FSANZ) is a statutory authority operating under
the Food Standards Australia New Zealand Act 1991. FSANZ’s primary function is to
protect the health and safety of people in Australia and New Zealand through the
development of effective food standards. FSANZ does this collaboratively with all
Australian governments and the government of New Zealand and with industry, consumer
and public health stakeholders.
FSANZ is responsible for developing, varying and reviewing food standards that regulate
the labeling and composition of food sold in Australia and New Zealand. In Australia,
FSANZ also develops food standards for food safety, maximum residue limits and primary
production and processing standards.
FSANZ issued a Draft Assessment Report (DAR) in November 2005 setting out a
proposed approach to the regulation of nutrition, health and related claims together with
the proposed new Standard 1.2.7 – Nutrition, Health and Related Claims. The proposed
draft Standard sets out the criteria and conditions for making nutrition content claims1. In
the DAR, FSANZ proposed that generic disqualifying criteria (now called Nutrient
Profiling Scoring Criterion (NPSC)) would not be applied to nutrition content claims.
However, specific disqualifying criteria in relation to certain nutrients could be applied
where considered necessary. Subsequently, a Preliminary Final Assessment report (PFAR)
was released for comment in April 20072. Comments received from submitters in response
to the Draft and Preliminary Final Assessment Reports highlighted concerns about
consumers’ use and comprehension of nutrition content claims. One area of concern is the
influence of nutrition content claims when they are on products of lower nutritional
quality.
The Final Assessment Report was presented to the Australian and New Zealand Food
Regulation Ministerial Council (Ministerial Council) in April 2008. Following the meeting
of the Ministerial Council in May 2008, FSANZ was notified of a First Review Request.
The lack of the application of the NPSC to products of lower nutritional quality with
nutrition content claims about vitamins, minerals and biologically active substances was
1 FSANZ 2005, Draft Assessment Report Proposal P293 Nutrition, Health and Related Claims 7 December
2005, FSANZ, Canberra. (Available at: Food Standards Australia New Zealand: Proposal P293 – Nutrition, Health and Related Claims). 2 FSANZ 2007, Preliminary Final Assessment Report Proposal P293 Nutrition, Health and Related Claims 4
April 2007, FSANZ, Canberra. (Available at: Food Standards Australia New Zealand: Proposal P293 – Nutrition, Health and Related Claims).
Consumer response to nutrition content claims on foods Page 4
Roy Morgan Research December, 2009
one of the issues raised in the First Review Request. In response to the concerns, FSANZ
subsequently commissioned the research reported here.
Previous research on the use of nutrition labels has reported high levels of label use by
consumers. For example, research commissioned by FSANZ has suggested that
approximately two-thirds of respondents use some form of nutrition label information,
even if only occasionally3. However studies of consumers in real-world shopping
environments suggest the use of nutrition label information may be much lower4. Research
commissioned by FSANZ has also shown some degree of difficulty among some
consumers in accurately interpreting nutrition content claims5. Until recently, there has
been little experimental research in Australia and New Zealand exploring the effect of such
claims on the purchase intention and product evaluations of consumers, using stimuli that
closely approximate real-world products.
Therefore, in 2007, FSANZ commissioned two studies exploring the influence of nutrition
content claims on consumers’ evaluations and purchase decisions. The products which
were chosen to be the focus for the two studies were chosen due to their lower nutritional
quality, their prominence of these products in the market place, and the presence of
nutrition content claims on these products, as revealed in the most recent Food Label
Monitoring Survey6. The first study explored consumer use of nutrition content claims in
shopping environments, and focused on the use of nutrition content claims by consumers in
real-world shopping environments to better understand if such claims were being used,
how they were being used and how important they were in purchase decisions of
consumers.
The second study, which was commissioned to Roy Morgan Research, utilised an
experimental design to measure the impact of macronutrient content claims related to fat,
sugar and fibre on consumers’ evaluations and purchase intentions. This study focused on
the use of nutrition content claims7 on 3-dimensional stimuli that closely approximated
3 NFO Donovan Research 2003, Food labelling issues: Quantitative research with consumers. Report to
Food Standards Australia New Zealand. (Evaluation Report Series No 4), FSANZ, Canberra. (Available at: Food Standards Australia New Zealand: Quantitative research with consumers. (June, 2003)). 4 European Hear Network 2003. A systematic review of the research on consumer understanding of nutrition
labelling, EHN, Brussels. 5 NFO Donovan Research 2003, A qualitative consumer study related to nutrition content claims on food
labels. Report to Food Standards Australia New Zealand, FSANZ, Canberra. (Available at: Food Standards Australia New Zealand: Consumer study related to nutrition content claims (July 2003)). 6 AgriQuality Australia Pty Ltd 2007, Report on the Assessment of 2005 Labels for Nutrition, Health and
Related Claims: Ongoing Food Label Monitoring Survey in Australia and New Zealand. Report to Food
Standards Australia New Zealand. (Evaluation Report Series No 16), FSANZ, Canberra. (Available at: Food Standards Australia New Zealand: Report on the Assessment of 2005 Labels for Nutrition, Health and Related Claims (April 2007)). 7 The claims for this research were on products that do not meet the Nutrient Profiling Scoring Criterion.

Consumer response to nutrition content claims on foods Page 5
Roy Morgan Research December, 2009
real-world products to better understand their impact on consumer purchase decisions. The
second study was completed and reported upon in January 20088. In this study 1,060
respondents from Australia and New Zealand were mailed out stimuli of breakfast cereal
and sweet biscuit packaging that closely approximated real-world products. Respondents
randomly received one of five versions of both the breakfast cereal and the sweet biscuit
packaging. Four of the versions of the packaging each had one nutrition content claim
(treatment groups) and one version had no nutrition content claim (control group). This
enabled comparison of responses from those who received packaging with nutrition
content claims with those who received packaging without nutrition content claims. A
telephone survey was used to obtain responses to the packaging and collect other
information.
The overall results from this study showed that the presence or absence of a nutrition
content claim on the packaging did not significantly influence overall purchase intention,
nutrition attitudes towards the products, perception of the number of types of people who
would benefit from consuming the products, or perception of the number of types of health
benefits from consuming the products. An analysis of the results for the breakfast cereal
and the sweet biscuit products separately showed that respondents who were not exposed
to a nutrition content claim had a greater purchase intention for the breakfast cereal
product. Also, the type of nutrition content claim (e.g. 97% fat free, low in saturated fat,
etc) had no impact on respondents purchase intention and product evaluations.
Furthermore, the presence or absence of a nutrition content claim did not contribute
significantly to the prediction of purchase intention or product evaluations. In fact, other
socio-demographic, cognitive and behavioural factors were found to play a more
significant role in influencing respondents purchase intention, nutrition attitude, and
perceptions of the number of types of people who would benefit and number of types of
health benefits. Such factors included age group, gender, ethnicity, income level,
education level, dependents in household, level of trust in nutritional label information,
level of attention paid to healthy diet, nutrition knowledge, and daily fruit and vegetable
intake.
During stakeholder consultations for the concerns over the limitations of the study were
raised. These included:
• Limiting the nutrition content claims to macronutrients (ie fat, sugar and fibre)
• Limiting the product types tested (i.e breakfast cereals and sweet biscuits)
8 Roy Morgan Research, An investigation into the impact of Nutrition Content claims on packaging in
relation to consumer purchase intention, nutrition attitude and health benefits. Report to Food Standards Australia New Zealand, FSANZ, Canberra. (Available at: http://www.foodstandards.gov.au/_srcfiles/P293 _Attach_10_2_RMR.pdf#search=%22roy%20morgan%22 (January, 2008)).
Consumer response to nutrition content claims on foods Page 6
Roy Morgan Research December, 2009
• Design features of the stimuli, in particular the prominence of nutrition content
claims.
Subsequently a third study on nutrition content claims was commissioned to Roy Morgan
Research. This study addresses the key research question: are consumer’s nutrition
evaluations and intention to purchase influenced by nutrition content claims when they are
on products of lower nutrition quality?
The research builds upon the previous study and extends that work through testing
nutrition content claims about vitamins, minerals and biologically-active substances across
a broader range of products, namely ice cream; frozen lasagne; fruit drink and potato chips.
Greater emphasis was also given to the location and prominence of the nutrition content
claims on the stimuli used in the study.

Consumer response to nutrition content claims on foods Page 7
Roy Morgan Research December, 2009
2.2 Research Objectives
The research objectives of this study were to investigate:
• The impact of presence of a nutrition content claim on consumer product evaluations
(i.e. on purchase intention, nutritional attitude, perceived number of types of people
benefiting from consuming the product, and perceived number of types of health
benefits from product consumption). This impact was assessed across four products
which did not meet the NPSC: ice cream, frozen lasagne, fruit drink, and potato chips;
and
• The impact of socio-demographic, cognitive, and behavioural factors in predicting
consumer’s product evaluations (i.e. purchase intention, nutritional attitude, perceived
number of types of people benefiting from consuming the product, and perceived
number of types of health benefits from product consumption).
FSANZ took the opportunity of the study to collect data on other aspects however these are
not reported in this report which focuses on the main research objective above.
Consumer response to nutrition content claims on foods Page 8
Roy Morgan Research December, 2009
3. METHODOLOGY
3.1 Study design
The study used a between-groups experimental design where participants were asked to
evaluate product stimuli that closely approximated real-world products. Participants were
randomly allocated to either a treatment group or a control group. Treatment and control
groups differed in that those in the former were exposed to product stimuli with nutrition
content claims and those in the latter were exposed to product stimuli without nutrition
content claims. This enabled comparison of nutrition evaluations and purchase intention
from those who were exposed to nutrition content claims with those who were not exposed
to nutrition content claims to isolate the effect of the nutrition content claims.
Packaging was designed for four stimuli products: ice cream, fruit drink, frozen lasagne,
and potato chips. For each product there were two treatment groups and one control group,
with the exception of frozen lasagne which was divided into four treatment groups and two
control groups9 (see Table 1). All respondents were exposed to all four stimuli products.
Respondents were randomly allocated to either to a treatment group or a control group.
Respondents who were randomly assigned to the control group received only control
stimuli across all products. This was to avoid any possible learning effects of exposure to
a claim on one stimuli package that could influence evaluations and perceptions on non-
claim packages. To avoid the possibility of order effects to the exposure to products, the
order in which products were presented to respondents was randomly generated.
The design of the study was essentially the same as that used in the previous study on
macronutrient nutrition content claims (Roy Morgan Research, 2008). The findings from
both the previous experimental study as well as the in-shop observational study (Colmar
Brunton Social Research, 2007) have been considered in refining the approach for the
current study.
Data collection for the current study was through an online survey and the product stimuli
were presented to participants as electronic images. Time and financial constraints did not
permit the use of 3-dimensional packaging as stimuli or the collection of data through
computer-assisted telephone interviews as was used in the 2008 study. A stratified random
sample of adult main grocery buyers (over 18 years) from Australia and New Zealand were
invited to take part in the study. The sample was provided by Research Now, an online
research panel provider.
9 The additional treatment and control groups for the frozen lasagne product were included to measure the impact of manipulating the NIP. This part of the study is not reported here and will be the subject of future analysis.

Consumer response to nutrition content claims on foods Page 9
Roy Morgan Research December, 2009
3.2 Stage 1: Development of Stimuli
Roy Morgan Research’s internal graphic design team designed electronic 3-dimensional
packages for: a) ice cream, b) frozen lasagne, c) fruit drink, and d) potato chips. The size,
design, colours, and label information of the packages were created to approximate as
close as possible actual real life products. The claims were selected to be relevant to the
products and to provide a diversity of vitamin, mineral and biologically active substance
claims.
For the ice cream, the nutrition content claims were:
• Source of calcium
• Source of phosphorus
For the frozen lasagne, the nutrition content claims were:
• Source of iron
• Source of selenium
For the fruit drink, the nutrition content claims were:
• Contains antioxidants-flavonoids
• Contains beta-cryptoxanthins
For the potato chips, the nutrition content claims were:
• Good Source of niacin
• Good Source of vitamin C
Using three-dimensional stimuli that closely approximated real-world products ensured
respondents reacted to the stimuli as they would to any other actual ice cream, frozen
lasagne, fruit drink, or potato chip products they may purchase. There are several aspects
of the display of the nutrition content claim which can influence the impact of the claim.
These include but are not limited to: the size of the packaging and the claim itself, the
colour and designs incorporated font size, and text direction. The experimental design
holds these factors constant for each product to allow the effect of the presence of the
nutrition content claim to be measured.
The stimuli packaging contained the mandated and commercially provided information
that would be included on packaged food products of the four types. This includes
branding, pictures, size, serving suggestions, manufacturer address and contact details
storage instructions, best before/use-by dates, ingredient list, and the nutrition information
panel (NIP). These aspects were held constant across treatment and control stimuli
products.

Consumer response to nutrition content claims on foods Page 10
Roy Morgan Research December, 2009
For all nutrients and energy declared in the NIP, food composition data-bases were
consulted to ensure that realistic values were used for each product. Based on the values
declared in the NIP for energy, saturated fat, sugars, sodium, and protein, the products
would not meet the NPSC as proposed in the Final Assessment Report. The values for the
vitamins and minerals declared in the NIP met the criteria proposed in the Final
Assessment Report for nutrition content claims about these micronutrients. As no specific
criteria for nutrition content claims about biologically active substances have been
proposed, the values declared in the NIP for flavonoids and beta-cryptoxanthins were
obtained from USDA databases to ensure realistic values for the fruit drink were used.
In using products that do not meet the NPSC, they are the types of products that when
featuring nutrition content claims represent those where greatest concern has been
expressed, that is those of lower nutritional quality. However, in designing the study in
this manner, the findings are not directly transferable to products that are considered to be
of higher nutritional quality.
The NIP values were identical for ice cream, fruit drink, and potato chips for both
treatment and control stimuli. This meant that the NIP had values for the claimed nutrients
or BAS used for both experimental groups (e.g. values for both calcium and phosphorus
were present in the NIPs for ice cream independently carrying the calcium or phosphorus
claim) although this would not occur in practice. In addition the values for the claimed
nutrients or BAS were also in the NIPs for the control group products. Both the ice cream
and fruit drink were moderately high in sugar while the potato chips were moderately high
in fat. For the frozen lasagne there were different NIP values for the two-subgroups within
the two experimental and one control condition: one product was moderately high in fat
while the other product was lower in fat (see Table 1).
Table 1: Products and claims
Exp Group 1 Exp Group 2 Control group
Sub group
1a
Subgroup
1b
Subgroup
2a
Subgroup
2b
Subgroup
3a
Subgroup
3b
Frozen
lasagne
Iron + moderately
high fat
Iron + low-
moderate fat
Selenium +
moderately high fat
Selenium + low-
moderate fat
No claim + moderately
high fat
No claim + low-
moderate high fat
Fruit
drink
Antioxidants-flavonoids + moderately high sugar
Beta-cryptoxanthins + moderately high sugar
No claim + moderately high sugar
Ice
cream
Calcium + moderately high sugar
Phosphorus + moderately high sugar
No claim + moderately high sugar
Potato
chips
Niacin + moderately high fat
Vitamin C + moderately high fat
No claim + moderately high fat

Consumer response to nutrition content claims on foods Page 11
Roy Morgan Research December, 2009
Respondents were able to view the packages as images. They were able to view the front
and back image of each product up to three times. To provide all respondents the
opportunity to clearly read information on the contents of each package there was an
option to make the size of the image larger or smaller. The order of exposure to the four
products was randomly generated for each respondent.
Examples of the stimuli used are provided in Appendix E.
3.3 Stage 2: Questionnaire Development
A draft questionnaire was developed by FSANZ and provided to Roy Morgan Research. It
was based on the questionnaire that was administered in the previous study into
macronutrient nutrition content claims. The questions were designed to measure the level
of impact that nutrition content claims about vitamins, minerals and biologically active
substances have on purchase intention and product evaluations. FSANZ and Roy Morgan
Research worked collaboratively to ensure that the questionnaire translated to an online
format.
Purchase intention and product evaluations were the key dependent measures upon which
the impacts of nutrition content claims were gauged. The four measures were:
• Purchase intention
• Nutrition attitude;
• Number of types of people who would benefit from eating the product; and
• Number of types of nutrition and health benefits from eating the product.
The survey also contained the following items:
• Information used to determine purchase intention e.g. NIP, general knowledge
• Consumer nutrition knowledge;
• Willingness to try new foods (food neophobia);
• Purchase frequency of product types;
• Consumption frequency of product types;
• Knowledge of vitamin, mineral and biologically active substance functions;
• Familiarity of vitamin, mineral and biologically active substances;
• Interest in nutritional information on food packages;
• Degree of care in reading nutrition labels
• Amount of attention paid to keeping a healthy diet;
• Number of health concerns; and

Consumer response to nutrition content claims on foods Page 12
Roy Morgan Research December, 2009
• Socio-demographic and behavioural variables: age, sex, country of origin, ethnicity,
dependents in the household, food/grocery buyer status, education level, annual
household income, daily consumption of vegetables, and daily consumption of fruit.
Measures were taken from international studies with high validity and reliability among
tested target populations10 11 12 13 14 and from previous FSANZ studies.
The structure of the questionnaire ensured that the impact of prompting or learning from
questions on subsequent questions was limited as much as possible. In particular the
questions about intent to purchase were asked prior to any questions about the nutritional
quality of the product. In this way respondents were not prompted to specifically think
about nutritional issues in answering the intent to purchase question. Thus nutritional
quality would only be incorporated into the decision-making if the respondent normally
considered this aspect, and the answer more accurately reflects the response if taken in a
shopping environment. Subsequent questions about nutritional quality may prompt
respondents to explore aspects of the pack that they normally may not do, for example the
NIP. Importantly instructions to the respondents did not direct them to any particular label
elements when responding, thus respondents would use the label elements they felt most
relevant in making nutritional evaluations.
The final survey can be viewed in Appendix F.
10 Keller, S. B., Landry, M., Olson, J., Velliquette, A. M., Burton, S., & Andrews, J. C. 1997. ‘The effects of nutrition package claims, nutrition facts panels, and motivation to read nutrition information on consumer product evaluations’, Journal of Public Policy & Marketing, vol. 16, no. 2, pp. 256-269. 11 Roe, B., Levy, A. S., & Derby, B.M. 1999, ‘The impact of health claims on consumer search and product evaluation outcomes: Results from FDA experimental data’, Journal of Public Policy & Marketing, vol. 18, no. 1, pp. 89-105. 12 Steptoe, A., Pollard, T. M., & Wardle, J. 2005, ‘Development of a measure of the motives underlying the selection of food: the Food Choice Questionnaire’, Appetite, vol. 25, pp. 267-284. 13 Garretson, J. A. & Burton, S. 2000, ‘Effects of nutrition facts panel values, nutrition claims, and health claims on consumer attitudes, perceptions of disease-related risks, and trust.’, Journal of Public Policy &
Marketing, vol. 19, no. 2, pp. 213-227. 14 Moorman, C. 1996, ‘A quasi experiment to assess the consumer and informational determinants of nutrition information processing activities: The case of the nutrition labelling and education act’, Journal of
Public Policy & Marketing, vol. 15, no. 1, pp. 28-44.

Consumer response to nutrition content claims on foods Page 13
Roy Morgan Research December, 2009
3.4 Stage 3: Online Survey
3.4.1 Sampling and stratification
Respondents meeting the selection criteria (≥18 years of age, from Australia or New
Zealand, and main grocery buyers15) were targeted to complete the survey online. A
sampling plan specifying quotas by experimental condition, product type, gender and
country was developed and is shown in Appendix A of this report. This plan was based on
the information available in Roy Morgan Research Single Source on the age and gender
profile of main grocery buyers i.e. those who usually buy groceries comprise of 33% males
and 67% females. The sample was provided by Research Now, an on-line research panel
provider.
A sample size of 1,100 was considered to be appropriate to determine the impact that
nutrition content claims have on product evaluation and purchase intention, yet modest
enough to protect against small differences in results reaching statistical significance.
3.4.2 Response Rate
The response rate was calculated by dividing the total number of completed surveys by the
number of in-scope individuals invited. In Australia, of the 5,096 individuals invited and
deemed to be in-scope, 817 surveys were successfully completed from the 995 in-scope
individuals who entered the survey. In New Zealand, of the 2,758 individuals invited and
deemed to be in-scope, 315 surveys were successfully completed from the 425 in-scope
individuals who entered the survey. Thus, a large number of individuals who were sent the
invitation did not enter the survey, as is usually the case with online surveys.
The overall response rate was 14.3% overall, 16.0% for Australia and 11.3% for New
Zealand. Table 2 shows the breakdown of the final response categories for in-scope
individuals contacted.
15 Main grocery buyers were persons who do half or more of the food and grocery shopping for their household.

Consumer response to nutrition content claims on foods Page 14
Roy Morgan Research December, 2009
Table 2: Response Rates for the Survey
Final Response Category Australia New Zealand TOTAL
Total Invited 5340 3000 8340
Total entered survey 1239 667 1906
Screened out: main grocery shopping
criteria 35 35 70
Screened out: age criteria 2 2 4
Screened out: quota for age/sex 207 205 412
Total entered survey - out of scope 244 242 486
Total entered survey – in scope 995 425 1420
Total invited - in scope 5096 2758 7854
Left survey after reading introduction 71 41 112
Interviews – incompletes 110 71 181
Interviews completed 814 313 1127
Response rate (completes/total in scope) 16.0% 11.3% 14.3%
3.5 Sample Profile
Of the 1,127 respondents who completed the survey, 814 are Australian residents and 313
are New Zealand residents. Overall 31% (n = 349) of the sample were male and 69% (n =
778) were female. By age group 24% (n = 276) were aged 18-34, 41% (n = 461) aged 35-
54, and 35% (n = 390) aged 55 and over.
A detailed description of achieved sample sizes by treatment condition, product type,
gender, and country are presented in the tables in Appendix B.
A brief analysis of the profile of respondents was conducted, to investigate if there were
any pre-existing differences between the control and treatment groups, in terms of socio-
demographic information. As shown in Table 3, there were no differences recorded in
terms of age group, gender, country, household income, ethnicity, dependents in
household, or education level.

Consumer response to nutrition content claims on foods Page 15
Roy Morgan Research December, 2009
Table 3: Socio-demographic differences between those exposed to nutrition content claims and those not
exposed
Category Claim Present Claim Absent Statistic
Younger (18-34) 184 (16.3%) 92 (8.2%)
Middle (35-54) 304 (27%) 157 (13.9%)
Age-group
Older (55+) 260 (23.1%) 130 (11.5%)
χ2(2)=0.64, p=.969, n.s.
Male 232 (20.6%) 117 (10.4%) Sex
Female 516 (45.8%) 262 (23.2%)
χ2(1)=0.002, p=.960, n.s.
1st quartile (lowest) 144 (15.2%) 75 (7.9%)
2nd quartile 121 (12.8%) 72 (7.6%)
3rd quartile 229 (24.2%) 116 (12.3%)
Income*
4th quartile (highest) 121 (12.8%) 67 (7.1%)
χ2(3)=0.825, p=.843, n.s.
Australia 537 (47.6%) 277 (24.6%) Country
New Zealand 211 (18.7%) 102 (9.1%)
χ2(1)=0.211, p=.646, n.s.
Non-Indigenous 708 (63.3%) 364 (32.5%) Ethnicity**
Indigenous 34 (3%) 13 (1.2%)
χ2(1)=0.799, p=.371, n.s.
No 498 (44.2%) 245 (21.7%) Dependents in
Household Yes 250 (22.2%) 134 (11.9%)
χ2(1)=0.419, p=.518, n.s.
Up to high school 391 (34.7%) 212 (18.8%) Education
Level Higher education 357 (31.7%) 167 (14.8%)
χ2(1)=1.357, p=.244, n.s.
*182 respondents chose not to answer this question
**8 respondents chose not to answer this question

Consumer response to nutrition content claims on foods Page 16
Roy Morgan Research December, 2009
3.6 Variables of interest and reclassification
The dependent variables of interest in the survey were purchase intention, nutrition
attitude, perceptions of the number of types of people who would benefit from consuming
the product, and perceptions of the number of health benefits accruing from product
consumption. The independent variables of interest were treatment group, socio-
demographic, cognitive and behavioural information (Table 4). Tables 5, 6, and 7 outline
the generation of variables from questionnaire responses to facilitate analysis. Only the
data used in analyses have been highlighted in this report.
Table 4. Dependent and Independent Variables
DEPENDENT
VARIABLES16
INDEPENDENT VARIABLES
Product
evaluations
Socio-demographic Cognitive Behavioural Treatment groups
Purchase
Intention
Age group Nutrition knowledge Frequency of
consuming products
Claim/No Claim
(Treatment/Control)
Nutrition
Attitude
Gender Knowledge of
vitamin, mineral and
BAS functions
Frequency of
buying products
Perceived
number of types
of people who
would benefit
Country Familiarity of
vitamin, mineral and
BAS functions
Attention to a
healthy diet
Perceived
number of health
benefits
Ethnicity Motivation to read
nutrition information
Food neophobia
Household income Interest in NIP Health concerns
Education level Information used in
evaluations
Fruit and vegetable
intake
Number of dependents
in household
16 All dependent variables were calculated for each food product and overall across products.

Consumer response to nutrition content claims on foods Page 17
Roy Morgan Research December, 2009
Table 5: Dependent variables manipulated for use in analyses and reporting
Dependent
Variable
Description Manipulations
for analyses
by FOOD
PRODUCT
Manipulations
for analyses
OVERALL
Outcome
categories
Purchase intention
7 point scale (2 questions)
Mean of 2 questions for each food product
Mean of all food product purchase intention means
Mean score
(1-7)
Nutrition attitude
7 point scale (2 questions)
Mean of 2 questions for each food product
Mean of all food product nutrition attitudes
Mean score
(1-7)
Perceived number of types of people who would benefit
7 categories (1 question) + 4 ‘other’ categories
‘Count’ for each food product
Mean of all food vehicle sums/counts
Sum of the number of types of people who would benefit (0 – 11)
Perceived number of health benefits
14 categories (1 question) + 4 ‘other’ categories
‘Count’ for each food product
Mean of all food vehicle sums/counts
Sum of the number of types of health benefits (0 – 18)

Consumer response to nutrition content claims on foods Page 18
Roy Morgan Research December, 2009
Table 6: Independent variables manipulated for use in analyses and reporting
Variable Description Manipulations Outcome categories
Age group 3 categories Nil Younger (18-34 years)
Middle (35-54 years)
Older (55+ years)
Gender 2 categories Nil Male
Female
Income 14 categories Divide into quartiles 1st quartile (lowest)
2nd quartile
3rd quartile
4th quartile (highest)
Dependants in Household
Numbered response to 3 group categories
Re-code into 2 categories:
18 yrs and over
Sum (15-17 yrs + less than 15 yrs)
Dependants
No dependants
Ethnicity 4 categories Re-code into 2 categories
Indigenous
Non-indigenous
Country 2 categories Nil Australia
New Zealand
Education AUST: 6 categories
NZ: 7 categories
Collapse into 2 categories
High school education
Higher than high school education
Nutrition knowledge (quartiles)
14 questions (correct/incorrect)
Sum of 14 questions to give score as percentage correct.
Divide into quartiles.
1st quartile (lowest)
2nd quartile
3rd quartile
4th quartile (highest)
Nutrition knowledge
(dichotomy)
14 questions (correct/incorrect)
Sum of 14 questions to give score as percentage correct.
Divide into categories.
Low (score < 50)
High (score 50 +)
Attention to a healthy diet
6 ordinal responses Re-coded into 3 categories.
None (6)
Low (4-5)
Med/High (1-3)

Consumer response to nutrition content claims on foods Page 19
Roy Morgan Research December, 2009
Table 6: Independent variables manipulated for use in analyses and reporting (continued)
Variable Description Manipulations Outcome categories
Familiarity of micronutrient functions (category)
7 point scale
(8 questions)
Sum and mean of 8 questions. Divide into categories.
Low
Moderate
High
Knowledge of micronutrient functions (mean)
7 point scale
(8 questions)
Sum and mean of 8 questions
Mean
Knowledge of micronutrients (category)
7 point scale
(8 questions)
Sum and mean of 8 questions. Divide into categories.
Low
Moderate
High
Motivation to read nutrition information
7 point scale
(2 questions)
Sum and mean of 2 questions. Divide into categories
Low (1-2)
Moderate (3-5)
High (6-7)
Interest in NIP 7 point scale
(1 question)
Divide into categories.
Low (1-2)
Moderate (3-5)
High (6-7)
Food neophobia 7 point scale
(6 questions)
Reverse score question 1 and 6.
Sum and mean of 6 questions.
Low (1-3)
Moderate (3-5)
High (5-7)
Frequency of eating foods (by product)
6 point scale
(1 question)
Divide into 2 categories.
Regularly (less than weekly) (1-3)
Regularly (weekly or more) (4-6)
Information used in evaluations
1 multiple response question
(12 categories)
Sum responses across products by category.
Across each category code the sum into 2 categories.
Yes (1 or more)
No (0)
Back of pack looked at
As indicated by timer Divide into categories
Yes
No

Consumer response to nutrition content claims on foods Page 20
Roy Morgan Research December, 2009
Table 7: Manipulation variables for use in analyses and reporting
Treatment
groups Description Manipulation Coding
Claim presence
2 categories
Combine all participants exposed to a claim (Claim 1 + Claim 2).
Combine those in control group not exposed to a claim.
Claim
No claim
3.7 Analyses
As noted in Section 2.2 the objective of this study was to measure the impact of the
presence of a nutrition content claim on consumer product evaluations across a range of
food products of lower nutritional quality and the contribution socio-demographic,
cognitive, and behavioural factors in predicting these evaluations. As with the previous
study regression techniques were most appropriate to independently determine the
contribution of various factors, including the presence of nutrition content claims, to
consumer’s evaluations. Additionally descriptive statistics are provided for the key
variables in Tables 7 and 8. Chi-square analyses have been to compare the socio-
demographic profile of treatment and control samples (Table 3).
Hierarchical Multiple Linear Regressions
Regression is used to determine the ‘best fit’ of a series of variables in predicting the
dependent variables. Hierarchical Multiple Linear Regression was chosen to explore the
impact of a set of socio-demographic, cognitive, and behavioural independent variables on
the dependent variables. The addition of the claim presence into the second part of the
regression allows its added influence to be explored independently. The independent
variables used in the HMLR analyses are outlined in section 4.3.
Consumer response to nutrition content claims on foods Page 21
Roy Morgan Research December, 2009
4. MAIN FINDINGS
4.1 Overall product evaluations
Initial analyses of the four dependent variables were carried out to ensure any assumptions
required for the use of regression were not violated. That is the data is normally
distributed and the levels of skewness and kurtosis are not problematic.
Purchase intention and nutrition attitude (overall and across the four products) were
normally distributed, and skewness and kurtosis were not an issue of concern with scores
relatively symmetrical.
However, the perceived number of people who benefited and the perceived number of
types of health benefits (overall and across the four products) were not normally
distributed. In particular, respondent’s perception of the number of types of people
benefiting from eating potato chips displayed positive skewness and positive kurtosis.
This indicated that the majority of respondents viewed that potato chips benefited few, if
any, types of people. Perceived number of types of health benefits, overall and for ice
cream, frozen lasagne and chips were both positively skewed and positively kurtosed. This
was particularly the case for perceived number of types of health benefits from consuming
potato chips. Again, this reflects that the majority of the sample viewed these products as
having few if any health benefits. However, regression analyses are generally robust to
violations of normality. Therefore these variables were not transformed, nor were any
outliers excluded. A full review of the assumptions of analyses and procedures used to test
assumptions is provided in Appendix D (Technical Appendix).
Tables 7 and 8 provide the mean responses and standard deviations for each dependent
variable by a range of independent variables for respondents exposed and not exposed to a
claim. Purchase intention and nutrition attitude were rated on a scale from 1 to 7 where 1
= low and 7 = high. Perceived number of types of people benefiting was summed from 0
to 11 and perceived number of types of health benefits from 0 to 18.
A comparison of the mean responses for overall purchase intention shows little difference
between respondents exposed to claims (M = 3.84, SD = 1.49) and respondents not
exposed to claims (M = 3.96, SD = 1.53). Results are similar for overall nutrition attitude
(Claim, M = 3.87, SD = 1.37; No claim, M = 3.88, SD = 1.45), overall perceived number of
people who benefit from consuming the products (Claim, M = 2.30, SD = 1.83; No Claim,
M = 2.15, SD = 1.84), and overall perceived number of types of health benefits from
consuming the products (Claim, M = 2.48, SD = 2.86; No Claim, M = 2.54, SD = 3.15). In
general, regardless of the presence or absence of a claim, respondent’s purchase intentions

Consumer response to nutrition content claims on foods Page 22
Roy Morgan Research December, 2009
are moderate, nutrition attitude towards the products are low, and perceptions of the types
of people and health benefits from consuming the products are very low.
Several differences exist between socio-demographic groups and between respondents
exposed and not exposed to a claim. Consistently, respondents purchase intention,
nutrition attitudes, perceptions of the number of types of people who would benefit, and
perceptions of number of types of health benefits gained from product consumption were
higher amongst males, Australians, respondents with lower education levels, and
respondents with lower income levels. Differences can also be seen in various cognitive
and behavioural characteristics. Generally, respondents purchase intentions, nutrition
attitudes, perceptions of number of types of people who would benefit, and perceptions of
number of types of health benefits gained from product consumption were higher amongst
respondents with low nutrition knowledge, moderate motivation to read nutrition
information, low tolerance for trying new foods, low or no attention to a healthy diet, have
no health concerns, report to have a high knowledge of micronutrient functions, moderate
interest in micronutrient content, and regularly (weekly or more) consume all four
products.

Consumer response to nutrition content claims on foods Page 23
Roy Morgan Research December, 2009
Table 8: Mean overall product evaluations for respondents exposed to claims
Product evaluation Overall Purchase Intention Overall Nutrition Attitude Perceived number of
people who benefit
Perceived number of
health benefits
n Mean SD n Mean SD n Mean SD n Mean SD
Total 747 3.84 1.49 735 3.87 1.37 748 2.30 1.83 748 2.48 2.86
Male 232 3.90 1.44 230 4.01 1.40 232 2.49 1.80 232 2.88 3.13 Gender
Female 515 3.82 1.51 505 3.80 1.36 516 2.22 1.84 516 2.30 2.71
18-34 yrs 183 3.97 1.38 179 3.77 1.24 184 2.35 1.81 184 2.77 3.12
35-54 yrs 304 3.77 1.51 298 3.74 1.38 304 2.15 1.81 304 2.27 2.69
Age group
55+ yrs 260 3.84 1.53 258 4.08 1.43 260 2.45 1.86 260 2.52 2.84
Australia 536 4.02 1.48 530 4.03 1.37 537 2.47 1.87 537 2.74 3.07 Country
New Zealand 211 3.40 1.41 205 3.45 1.30 211 1.88 1.64 211 1.82 2.08
No 497 3.77 1.48 492 3.87 1.37 498 2.34 1.84 498 2.54 2.89 Dependents in
Household Yes 250 3.99 1.50 243 3.87 1.38 250 2.23 1.81 250 2.36 2.79
Up to High School Education 357 3.97 1.59 346 4.02 1.41 357 2.41 1.84 357 2.57 3.09 Education Level
Higher Education 390 3.73 1.38 389 3.73 1.32 391 2.20 1.84 391 2.40 2.70
1st quartile (lowest) 144 4.19 1.57 144 4.39 1.43 144 2.93 1.76 144 3.09 3.10
2nd quartile 121 3.90 1.42 117 4.06 1.31 121 2.35 1.81 121 2.42 2.95
3rd quartile 229 3.81 1.45 226 3.74 1.26 229 2.21 1.80 229 2.51 2.85
Household
Income
4th quartile (highest) 120 3.60 1.49 119 3.55 1.35 121 1.99 1.85 121 2.30 2.97
Non-Indigenous 707 3.84 1.48 696 3.88 1.35 708 2.31 1.82 708 2.48 2.85 Ethnicity
Indigenous 34 3.85 1.71 33 3.64 1.77 34 2.35 2.01 34 2.73 3.19
Purchase intention and nutrition attitude, (1-7), where 1 = low and 7 = high; Perceived number of people who benefit (0-11); Perceived number of health benefits (0-18)

Consumer response to nutrition content claims on foods Page 24
Roy Morgan Research December, 2009
Table 8: Mean overall product evaluations for respondents exposed to claims (continued)
Product evaluation Overall Purchase Intention Overall Nutrition Attitude Perceived number of
people who benefit
Perceived number of
health benefits
n Mean SD n Mean SD n Mean SD n Mean SD
Low 29 4.66 1.66 27 4.36 1.66 29 2.69 2.01 29 3.73 4.04 Nutrition Knowledge
High 706 3.81 1.47 697 3.84 1.36 707 2.30 1.80 707 2.43 2.73
Low 65 3.63 1.24 63 3.76 1.21 65 2.14 1.57 65 2.04 2.41
Moderate 207 3.99 1.38 202 3.97 1.21 208 2.27 1.81 208 2.43 2.97
Motivation to Read
Nutrition information
High 471 3.80 1.55 467 3.83 1.46 471 2.35 1.87 471 2.57 2.87
Low 208 4.08 1.42 205 3.88 1.38 208 2.21 1.78 208 2.52 2.87
Moderate 456 3.76 1.48 449 3.83 1.36 457 2.36 1.85 457 2.48 2.82
Food Neophobia
High 75 3.65 1.59 74 4.02 1.42 75 2.36 1.71 75 2.32 2.82
None 6 3.22 1.38 5 2.50 1.91 6 2.08 2.18 6 0.96 2.35
Low 41 4.38 1.44 40 4.47 1.12 41 2.37 1.85 41 2.07 2.43
Attention to Healthy
Diet
Med/High 697 3.82 1.48 687 3.84 1.37 698 2.30 1.82 698 2.52 2.88
Rarely (less than weekly) 434 3.65 1.47 424 3.65 1.31 434 1.95 1.67 434 2.00 2.50 Frequency of Eating
Ice Cream Regularly (weekly or more) 313 4.11 1.47 311 4.17 1.40 314 2.79 1.92 314 3.14 3.18
Rarely (less than weekly) 631 3.68 1.44 619 3.71 1.32 631 2.10 1.71 631 2.14 2.50 Frequency of Eating
Frozen Meal (e.g.
Lasagne) Regularly (weekly or more) 116 4.75 1.44 116 4.73 1.32 117 3.43 2.04 117 4.34 3.82
Purchase intention and nutrition attitude, (1-7), where 1 = low and 7 = high; Perceived number of people who benefit (0-11); Perceived number of health benefits (0-18)

Consumer response to nutrition content claims on foods Page 25
Roy Morgan Research December, 2009
Table 8: Mean overall product evaluations for respondents exposed to claims (continued)
Product evaluation Overall Purchase
Intention
Overall Nutrition Attitude Perceived number of
people who benefit
Perceived number of
health benefits
n Mean SD n Mean SD n Mean SD n Mean SD
Rarely (less than weekly) 350 3.35 1.40 343 3.40 1.26 351 1.72 1.60 351 1.76 2.37 Frequency of
Drinking Fruit
Drink Regularly (weekly or more) 397 4.28 1.42 392 4.28 1.34 397 2.81 1.86 397 3.12 3.09
Rarely (less than weekly) 496 3.57 1.45 488 3.61 1.32 497 2.08 1.71 497 2.17 2.54 Frequency of
Eating Potato Chips Regularly (weekly or more) 251 4.38 1.40 247 4.37 1.33 251 2.75 1.97 251 3.10 3.31
Low 203 3.74 1.46 200 3,73 1.29 203 2.16 1.71 203 2.16 2.88
Moderate 357 3.88 1.43 351 3.89 1.35 357 2.36 1.86 357 2.54 2.91 Familiarity of
Micronutrient
Functions High 113 3.80 1.59 113 3.85 1.52 113 2.54 2.02 113 2.99 2.86
Low 228 3.67 1.43 223 3.68 1.29 228 2.04 1.65 228 1.90 2.67
Moderate 399 3.90 1.43 396 3.93 1.35 399 2.42 1.83 399 2.68 2.83 Knowledge of
Micronutrient
Functions High 99 4.04 1.75 98 4.10 1.62 99 2.67 2.14 99 3.28 3.24
None 94 4.15 1.44 92 4.17 1.34 95 2.71 1.99 95 3.62 3.82
Specific and General 501 3.87 1.50 493 3.89 1.36 501 2.33 1.80 501 2.35 2.61 Health Concerns
General Only 152 3.58 1.44 150 3.61 1.39 152 1.95 1.76 152 2.21 2.79
Low 37 3.40 1.23 36 3.79 1.41 37 2.08 1.57 37 1.83 2.00
Moderate 241 3.97 1.36 235 3.93 1.20 242 2.27 1.81 242 2.43 3.03
Interest in NIP
High 465 3.80 1.55 461 3.84 1.45 465 2.35 1.86 465 2.57 2.82
Purchase intention and nutrition attitude, (1-7), where 1 = low and 7 = high; Perceived number of people who benefit (0-11); Perceived number of health benefits (0-18)

Consumer response to nutrition content claims on foods Page 26
Roy Morgan Research December, 2009
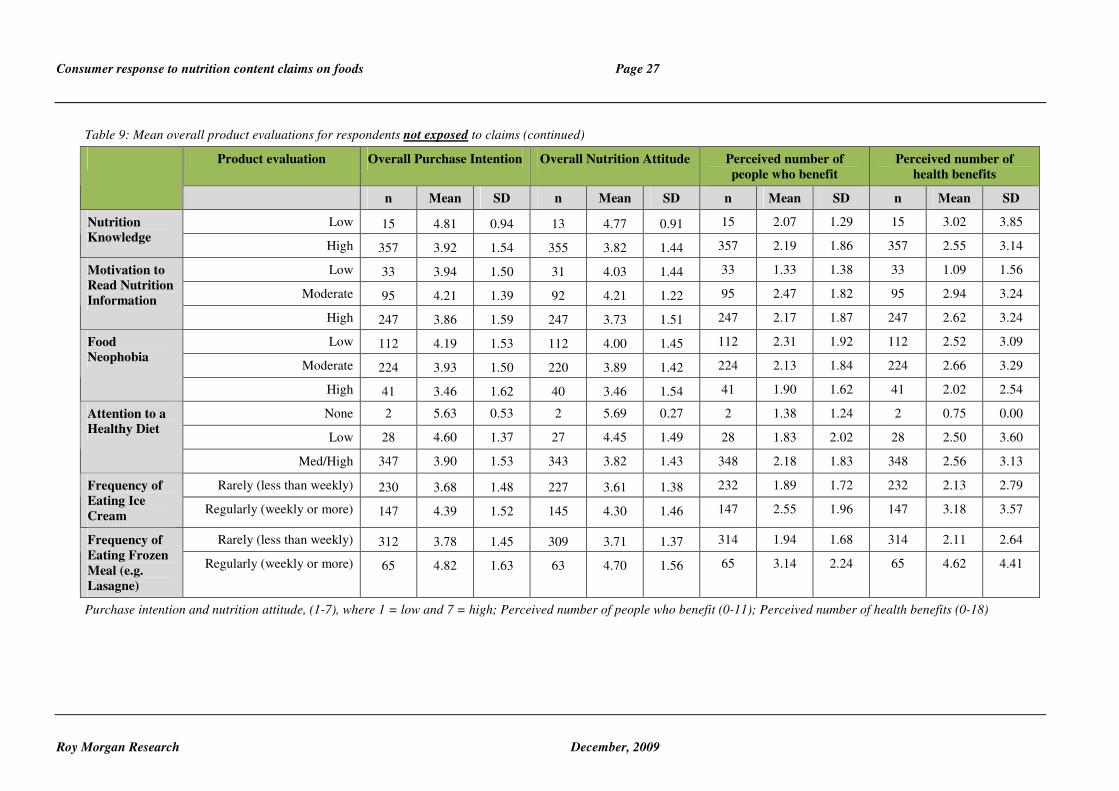
Table 9: Mean overall product evaluations for respondents not exposed to claims
Product evaluation Overall Purchase Intention Overall Nutrition Attitude Perceived number of
people who benefit
Perceived number of
health benefits
n Mean SD n Mean SD n Mean SD n Mean SD
Total 377 3.96 1.53 372 3.88 1.45 379 2.15 1.84 379 2.54 3.15
Male 117 4.43 1.41 116 4.42 1.39 117 2.46 2.04 117 3.47 3.82 Gender
Female 260 3.75 1.54 256 3.63 1.41 262 2.01 1.73 262 2.12 2.71
18-34 yrs 90 4.09 1.43 89 3.87 1.46 92 2.40 2.04 92 3.17 3.67
35-54 yrs 157 3.92 1.46 154 3.78 1.34 157 2.00 1.77 157 2.38 3.10
Age group
55+ yrs 130 3.91 1.69 129 4.00 1.56 130 2.15 1.76 130 2.28 2.77
Australia 275 4.10 1.54 273 3.99 1.46 277 2.35 1.93 277 2.77 3.24 Country
New Zealand 102 3.58 1.46 99 3.57 1.37 102 1.61 1.45 102 1.92 2.81
No 244 3.80 1.62 241 3.83 1.50 245 2.14 1.81 245 2.59 3.20 Dependents in
Household Yes 133 4.25 1.32 131 3.97 1.35 134 2.17 1.90 134 2.45 3.08
Up to High School Education 166 4.14 1.52 162 4.13 1.43 167 2.32 1.83 167 2.42 2.84 Education Level
Higher Education 211 3.82 1.54 210 3.69 1.43 212 2.01 1.84 212 2.63 3.38
1st quartile (lowest) 75 4.08 1.52 72 4.12 1.47 75 2.64 1.89 75 2.94 3.10
2nd quartile 71 4.29 1.54 70 4.25 1.49 72 2.30 2.00 72 3.08 3.84
3rd quartile 115 3.79 1.53 114 3.68 1.39 116 1.89 1.63 116 1.95 2.53
Household
Income
4th quartile (highest) 67 3.81 1.57 67 3.63 1.46 67 2.01 1.88 67 2.91 3.49
Non-Indigenous 362 3.97 1.53 357 3.90 1.45 364 2.18 1.83 364 2.55 3.14 Ethnicity
Indigenous 13 3.88 1.58 13 3.51 1.39 13 1.44 1.93 13 2.52 3.83
Purchase intention and nutrition attitude, (1-7), where 1 = low and 7 = high; Perceived number of people who benefit (0-11); Perceived number of health benefits (0-18)
Consumer response to nutrition content claims on foods Page 27
Roy Morgan Research December, 2009
Table 9: Mean overall product evaluations for respondents not exposed to claims (continued)
Product evaluation Overall Purchase Intention Overall Nutrition Attitude Perceived number of
people who benefit
Perceived number of
health benefits
n Mean SD n Mean SD n Mean SD n Mean SD
Low 15 4.81 0.94 13 4.77 0.91 15 2.07 1.29 15 3.02 3.85 Nutrition
Knowledge High 357 3.92 1.54 355 3.82 1.44 357 2.19 1.86 357 2.55 3.14
Low 33 3.94 1.50 31 4.03 1.44 33 1.33 1.38 33 1.09 1.56
Moderate 95 4.21 1.39 92 4.21 1.22 95 2.47 1.82 95 2.94 3.24
Motivation to
Read Nutrition
Information
High 247 3.86 1.59 247 3.73 1.51 247 2.17 1.87 247 2.62 3.24
Low 112 4.19 1.53 112 4.00 1.45 112 2.31 1.92 112 2.52 3.09
Moderate 224 3.93 1.50 220 3.89 1.42 224 2.13 1.84 224 2.66 3.29
Food
Neophobia
High 41 3.46 1.62 40 3.46 1.54 41 1.90 1.62 41 2.02 2.54
None 2 5.63 0.53 2 5.69 0.27 2 1.38 1.24 2 0.75 0.00
Low 28 4.60 1.37 27 4.45 1.49 28 1.83 2.02 28 2.50 3.60
Attention to a
Healthy Diet
Med/High 347 3.90 1.53 343 3.82 1.43 348 2.18 1.83 348 2.56 3.13
Rarely (less than weekly) 230 3.68 1.48 227 3.61 1.38 232 1.89 1.72 232 2.13 2.79 Frequency of
Eating Ice
Cream Regularly (weekly or more) 147 4.39 1.52 145 4.30 1.46 147 2.55 1.96 147 3.18 3.57
Rarely (less than weekly) 312 3.78 1.45 309 3.71 1.37 314 1.94 1.68 314 2.11 2.64 Frequency of
Eating Frozen
Meal (e.g.
Lasagne)
Regularly (weekly or more) 65 4.82 1.63 63 4.70 1.56 65 3.14 2.24 65 4.62 4.41
Purchase intention and nutrition attitude, (1-7), where 1 = low and 7 = high; Perceived number of people who benefit (0-11); Perceived number of health benefits (0-18)

Consumer response to nutrition content claims on foods Page 28
Roy Morgan Research December, 2009
Table 9: Mean overall product evaluations for respondents not exposed to claims (continued)
Product evaluation Overall Purchase Intention Overall Nutrition Attitude Perceived number of
people who benefit
Perceived number of
health benefits
n Mean SD n Mean SD n Mean SD n Mean SD
Rarely (less than weekly) 187 3.42 1.49 185 3.41 1.37 189 1.68 1.62 189 1.63 2.33 Frequency of
Drinking Fruit
Drink Regularly (weekly or more) 190 4.49 1.38 187 4.34 1.37 190 2.61 1.93 190 3.44 3.58
Rarely (less than weekly) 253 3.62 1.51 250 3.60 1.39 254 1.86 1.64 254 2.05 2.55 Frequency of
Eating Potato
Chips Regularly (weekly or more) 124 4.64 1.34 122 4.44 1.41 125 2.74 2.08 125 3.54 3.94
Low 104 3.86 1.41 102 3.88 1.25 104 1.86 1,53 104 1.89 2.34
Moderate 161 3.84 1.47 160 3.73 1.41 161 2.14 1.82 161 2.55 3.02 Familiarity of
Micronutrient
Functions High 68 3.96 1.85 68 3.95 1.75 68 2.61 2.06 68 3.34 3.51
Low 113 3.74 1.44 111 3.71 1.33 113 1.73 1.50 113 1.82 2.28
Moderate 186 3.95 1.49 184 3.87 1.42 186 2.32 1.86 186 2.74 3.19 Knowledge of
Micronutrient
Functions High 63 4.28 1.83 63 4.06 1.71 63 2.60 2.21 63 3.28 3.77
None 51 4.13 1.55 50 4.21 1.39 52 2.17 1.92 52 2.71 3.37
Specific and General 258 3.99 1.54 254 3.92 1.45 259 2.29 1.86 259 2.74 3.29 Health
Concerns
General Only 68 3.71 1.49 68 3.49 1.41 68 1.61 1.60 68 1.65 2.22
Low 19 4.04 1.59 18 4.09 1.65 19 1.34 1.45 19 0.74 1.05
Moderate 119 4.24 1.37 115 4.26 1.24 119 2.39 1.77 119 2.96 3.28
Interest in NIP
High 236 3.80 1.60 236 3.66 1.49 236 2.14 1.88 236 2.52 3.17
Purchase intention and nutrition attitude, (1-7), where 1 = low and 7 = high; Perceived number of people who benefit (0-11); Perceived number of health benefits (0-18)
Consumer response to nutrition content claims on foods Page 29
Roy Morgan Research December, 2009
4.2 Cognitive and behavioural measures
This section explores the variables of interest in terms of cognitive and behavioural
measures that may affect the dependent variables. Descriptives of several variables, which
are not included in further analyses but are of interest, are provided in this section. Means
and standard deviations are provided in Table 10.
In general, respondents had a moderately high interest in NIPs, (t(1116)=4.46, p < .001).
New Zealand respondents paid slightly higher attention to a healthy diet than Australians
(t(1113)=-1.99, p = .047). Overall attention to a healthy diet across both counties was
moderately high. The food neophobia scores were lower than average indicating that
respondents are somewhat willing to try new foods. In both countries the average daily
consumption of fruit was similar to the recommended levels (2 serves per day), whereas
the average daily intake of vegetables was below recommended levels (5 serves per day in
Australia and 3 serves per day in New Zealand).
The distribution of the sample by cognitive and behavioural measures is outlined in Table
11. 85.4% of respondents were responsible for all or most of the household shopping,
while 14.6% were responsible for about half of the shopping. Overall, nearly two-thirds of
respondents were highly motivated to read nutrition information (63.7%) while 70% of
respondents had a medium-high interest in the NIP. Almost all respondents (94.4%) gave
correct responses to 50% or more of the nutrition knowledge questions. Approximately
two-thirds of respondents reported moderate-high levels of both micronutrient knowledge
(66.3%) and familiarity (69.5). With regards to health, 67.4% of respondents reported
having a general and a specific health concern (e.g. food allergy) and 92.8% reported
paying medium/high attention to a healthy diet.

Consumer response to nutrition content claims on foods Page 30
Roy Morgan Research December, 2009
Table 10: Mean scores for cognitive and behavioural measures
Variable Mean (SD)
Interest in NIP17
5.70 (1.54)
Australia 5.83 (1.42)***
New Zealand 5.38 (1.76)
Attention to a healthy diet (1-5)18
2.44 (0.82)
Australia 2.41 (0.81)
New Zealand 2.52 (0.82)*
Food neophobia (1-7)19
3.74 (1.11)
Australia 3.74 (1.12)
New Zealand 3.76 (1.07)
Daily consumption of fruit (1-6)20
2.07 (1.05)
Australia 2.04 (1.01)
New Zealand 2.14 (1.16)
Daily consumption of vegetables (1-6)21
2.68 (1.25)
Australia 2.68 (1.23)
New Zealand 2.68 (1.30) Bold indicates significant differences * p < .05 *** p < .001
17 Interest in NIP (1-7), where 1 = Not at all interested, 7 = Very interested. 18 Attention to a healthy diet (1-6), where 1 = Very high amount of attention, 5 = Very low amount of
attention. 19 Food neophobia (1-7), where 1 = strongly disagree (lower), 7 = stronger agree (higher) 20 Daily consumption of fruit (1-6), where 1 = 1 serve or less, 6 = 6 serves or more 21 Daily consumption of vegetables (1-6), where 1 = 1 serve or less, 6 = 6 serves or more

Consumer response to nutrition content claims on foods Page 31
Roy Morgan Research December, 2009
Table 11: Distribution of sample by cognitive and behavioural measures
Variable Categories % response
Low 28.4
Medium 60.4
Interest in NIP
High 10.3
None 0.7
Low 6.1
Attention to healthy diet
Med/High 92.8
None 13.0
Specific and general health concerns 67.4
Health Concerns22
General health concerns only 19.5
Low 8.7
Moderate 26.9
Motivation to read nutrition
information
High 63.7
Low 30.3
Moderate 51.9
Knowledge of micronutrient
functions
High 14.4
Low 30.5
Moderate 51.5
Familiarity of micronutrient
functions
High 18.0
Low 3.9 Nutrition knowledge
High 94.4
About half of the food and grocery shopping 14.6 Main grocery shopper
All or most of the food and grocery shopping 85.4
22 Health Concerns -
Specific: 1 - Food allergy
2 – Other health concerns such as asthma, diabetes, migraine
3 – Digestive concerns such as celiac disease, irritable bowel syndrome
4 – Health concerns such as heart disease, high blood pressure or cholesterol
General: 5 – On a specific diet
6 – Watching my weight or others’ weight generally
7 – Watching my health or other’s health generally
8 – Pregnancy or breast feeding
9 – Religious or ethical beliefs that influence dietary choices
10 – Vegetarian or vegan diet

Consumer response to nutrition content claims on foods Page 32
Roy Morgan Research December, 2009
4.3 Does the presence of claim affect consumers’ product evaluations?
To investigate if claim presence affected consumers’ product evaluations Hierarchical
Multiple Linear Regression (HMLR) analyses were performed. Multiple Linear Regression
is a statistical treatment that is used to estimate the coefficients of the linear equation,
involving one or more independent variables that best predict the value of the dependent
variable. The HMLR allows independent variables to be entered at each step to report the
change in the strength of the relationship between the set of independent variables and the
dependent variables.
In the 2007 nutrition content claims survey stepwise regressions revealed several socio-
demographic, cognitive, and behavioural factors to be significant predictors of purchase
intention, nutrition attitude, and perceptions of the numbers of, types of people who would
benefit as well as the types of health benefits from consuming the products. However,
claim presence was not found to be a statistically significant predictor. Therefore, a
hierarchical approach was used because of the learning from these prior research findings.
The variables which were found in the previous study to be statistically significant in
predicting the four dependent variables were entered into the model first. Claim presence,
which was found previously to have no influence on the dependent variables, was then
entered in the second step of the model to determine whether it significantly contributed
towards consumer’s product evaluations.
The justification of the order of entry of the independent variables is supported by
Tabachnick and Fidell (2001, p.138)23 who state that if there are independent variables
which have greater theoretical importance they should be entered earlier into the
hierarchical regression model. Additional information about HMLR and its assumptions
are included in the Appendix F (Technical Appendix).
The regression models were run against each dependent variable, both overall as well as by
individual food products. For inclusion in the regression models some independent
variables required manipulation to meet the assumptions of this form of analysis. The
independent variables which were entered into the regression at step 1 of the model were:
• Age group (younger, middle, older)
• Gender (female, male)
• Country (Australia, New Zealand)
• Dependents (non, one or more)
23 Tabachnick, B. G., & Fidell, L. S. 2001. Using Multivariate Statistics. 4
th Ed. Allyn and Bacon, Boston.

Consumer response to nutrition content claims on foods Page 33
Roy Morgan Research December, 2009
• Ethnicity (Indigenous, Non-Indigenous)
• Household Income Level (quartiles)
• Education Level (high school, higher than high school)
• Health concerns (none, general only, specific and general)
• Nutrition knowledge (quartiles)
• Motivation to read nutrition information (mean)
• Knowledge of micronutrient functions (mean)
Claim presence (present, absent) was then entered in step 2 of the regression models.
4.3.1 Does the presence of a claim effect consumers’ purchase intention?
Overall Purchase Intention
In step 1 of the model, the multiple correlation coefficient (R = .365) was significantly
different to zero (F(11, 890) = 12.469, p < .001), and 13.4% of the variance in overall
purchase intention was explained by the set of independent variables entered (R² = .134,
adjusted R² = .123).
In step 2, with claim presence entered into the model, the multiple correlation coefficient
was only marginally higher (R = .366), indicating that it is not a significant predictor of
overall purchase intention (F(1,889) = .484, p = .487).
The independent variables which significantly predicted overall purchase intention in step
1 remained significant in step 2 when claim presence was entered into the model (see
Table 12). Country, dependents in household, household income, education level, nutrition
knowledge, and knowledge of micronutrient functions were found to significantly and
uniquely contribute to the prediction of overall purchase intention.
Higher purchase intentions were found amongst the Australian sample, individuals with
dependents in the household, households with lower incomes, lower levels of education,
lower nutrition knowledge, and higher self-reported knowledge of micronutrient functions.

Consumer response to nutrition content claims on foods Page 34
Roy Morgan Research December, 2009
Table 12: Impact of variables on Overall Purchase Intention (step 2)
Predictor/independent variables B S.E. (B) β t P sr2
Age group# -.074 .072 -.037 -1.034 .301 -.032
Gender# -.183 .105 -.056 -1.740 .082 -.054
Country# -.716 .111 -.214 -6.460 .000*** -.202
Dependents in the household# .390 .107 .122 3.655 .000*** .114
Ethnicity# .259 .239 .035 1.082 .280 .034
Household income† -.162 .049 -.114 -3.281 .001** -.102
Education level# .248 .102 .082 2.431 .015* .076
Health concerns# -.152 .089 -.054 -1.699 .090 -.053
Nutrition knowledge† -.237 .048 -.159 -4.907 .000*** -.153
Motivation to read nutrition information‡ -.065 .035 -.065 -1.845 .065 -.058
Knowledge of micronutrient functions‡ .177 .041 .149 4.367 .000*** .136
Claim Presence# .069 .100 .022 .696 .487 .022
# Categorical variables,
† Variable in Quartiles,
‡ Variable Mean
Bold indicates significant differences * p < .05 ** p < .01 *** p < .001

Consumer response to nutrition content claims on foods Page 35
Roy Morgan Research December, 2009
Ice Cream Purchase Intention
In line with overall purchase intention, in step 1 of the model for ice cream purchase
intention the multiple correlation coefficient (R = .295) was significantly different to zero
(F(11, 878) = 7.623, p < .001). 8.7% of the variance was explained by the set of
independent variables entered (R² = .087, adjusted R² = .076).
In step 2, with claim presence entered into the model, the multiple correlation coefficient
was only marginally higher (R = .296) indicating that the presence or absence of a claim
(calcium or phosphorus) was not a significant predictor of ice cream purchase intention
(F(1,877) = .633, p = .426). 8.8% of the variance was now accounted for (R² = .088,
adjusted R² = .075).
The independent variables which significantly predicted ice cream purchase intention in
step 1 remained significant in step 2 when claim presence was entered into the model (see
Table 13). Country, dependents in the household, nutrition knowledge, motivation to read
nutrition information, and knowledge of micronutrient functions were found to
significantly and uniquely contribute to the prediction of ice cream purchase intention.
Higher ice cream purchase intentions were found amongst the Australia sample,
individuals with dependents in the household, lower nutrition knowledge, moderate
motivation to read nutrition information, and individuals with higher self-reported
knowledge of micronutrient functions.

Consumer response to nutrition content claims on foods Page 36
Roy Morgan Research December, 2009
Table 13: Impact of variables on Ice Cream Purchase Intention (step 2)
Predictor/independent variables B S.E. (B) β t p sr2
Age group# .027 .093 .011 .289 .773 .009
Gender# .126 .137 .031 .926 .355 .030
Country# -.684 .144 -.163 -4.755 .000*** -.153
Dependents in the household# .456 .138 .114 3.302 .001** .106
Ethnicity# .261 .313 .028 .836 .403 .027
Household income† -.095 .064 -.053 -1.485 .138 -.048
Education level# .128 .133 .034 .966 .334 .031
Health concerns# -.215 .116 -.061 -1.854 .064 -.060
Nutrition knowledge† -.237 .062 -.127 -3.793 .000*** -.122
Motivation to read nutrition information‡ -.092 .046 -.073 -2.016 .044* -.065
Knowledge of micronutrient functions‡ .258 .053 .172 4.860 .000*** .157
Claim Presence# .103 .129 .026 .796 .426 .026
# Categorical variables,
† Variable in Quartiles,
‡ Variable Mean
Bold indicates significant differences * p < .05 ** p < .01 *** p < .001

Consumer response to nutrition content claims on foods Page 37
Roy Morgan Research December, 2009
Frozen Lasagne Purchase Intention
In Step 1 of the model for frozen lasagne purchase intention, the multiple correlation
coefficient (R = .318) was significantly different to zero (F(11, 885) = 9.071, p < .001).
10.1% of the variance was explained by the set of independent variables entered (R² =
.101, adjusted R² = .090). In step 2, with claim presence entered into the model, the
multiple correlation coefficient remained the same (R = .318) indicating that the presence
or absent of a claim (iron or selenium) was not a significant predictor of frozen lasagne
purchase intention (F(1,884) = .017, p = .897; R² = .101, adjusted R² = .089).
The independent variables which significantly predicted overall purchase intention in step
1 remained significant in step 2 when claim presence was entered into the model (see
Table 14). Gender, country, household income, education level, nutrition knowledge, and
knowledge of micronutrient functions were found to significantly and uniquely contribute
to the prediction of frozen lasagne purchase intention.
Higher frozen lasagne purchase intentions were found amongst males, the Australian
sample, households with lower incomes, lower levels of education, and lower nutrition
knowledge.

Consumer response to nutrition content claims on foods Page 38
Roy Morgan Research December, 2009
Table 14: Impact of variables on Frozen Lasagne Purchase Intention (step 2)
Predictor/independent variables B S.E. (B) β t p sr2
Age group# -.051 .100 -.019 -.514 .608 -.016
Gender# -.493 .147 -.110 -3.344 .001** -.107
Country# -.681 .155 -.149 -4.389 .000*** -.140
Dependents in the household# .246 .149 .056 1.649 .099 .053
Ethnicity# .241 .338 .024 .713 .476 .023
Household income† -.213 .069 -.109 -3.087 .002** -.098
Education level# .552 .143 .133 3.861 .000*** .123
Health concerns# -.160 .125 -.042 -1.277 .202 -.041
Nutrition knowledge† -.206 .068 -.101 -3.049 .002** -.097
Motivation to read nutrition information‡
-.080 .049 -.058 -1.624 .105 -.052
Knowledge of micronutrient functions‡ .223 .057 .136 3.906 .000*** .125
Claim Presence# .018 .139 .004 .130 .897 .004
# Categorical variables,
† Variable in Quartiles,
‡ Variable Mean
Bold indicates significant differences
* p < .05 ** p < .01 *** p < .001

Consumer response to nutrition content claims on foods Page 39
Roy Morgan Research December, 2009
Fruit Drink Purchase Intention
In Step 1 of the model for fruit drink purchase intention the multiple correlation coefficient
(R = .310) was significantly different to zero (F(11, 888) = 8.565, p < .001). 9.6% of the
variance was explained by the set of independent variables entered (R² = .096, adjusted R²
= .085).
In step 2, with claim presence entered into the model, the multiple correlation coefficient
remained the same (R = .310) indicating that the presence or absent of a claim
(antioxidants-flavonoids or beta-cryptoxanthins) was not a significant predictor of fruit
drink purchase intention (F(1,887) = .282, p = .595; R² = .096, adjusted R² = .084).
The independent variables which significantly predicted fruit drink purchase intention in
step 1 remained significant in step 2 when claim presence was entered into the model
(Table 15). Gender, country, dependents in household, household income, education level,
nutrition knowledge, and knowledge of micronutrient functions were found to significantly
and uniquely contribute to the prediction of fruit drink purchase intention.
Higher fruit drink purchase intentions were found amongst males, the Australian sample,
individuals with dependents in the household, households with lower incomes, lower levels
of education, lower nutrition knowledge, and individuals with higher self-reported
knowledge of micronutrient functions.

Consumer response to nutrition content claims on foods Page 40
Roy Morgan Research December, 2009
Table 15: Impact of variables on Fruit Drink Purchase Intention (step 2)
Predictor/independent variables B S.E. (B) β t p sr2
Age group# -.154 .099 -.057 -1.565 .118 -.050
Gender# -.492 .145 -.112 -3.389 .001** -.108
Country# -.688 .153 -.153 -4.506 .000*** -.144
Dependents in the household# .444 .147 .103 3.016 .003** .096
Ethnicity# .138 .329 .014 .419 .676 .013
Household income† -.170 .068 -.089 -2.496 .013* -.080
Education level# .302 .141 .074 2.147 .032* .069
Health concerns# -.143 .123 -.038 -1.164 .245 -.037
Nutrition knowledge† -.305 .067 -.152 -4.582 .000*** -.146
Motivation to read nutrition information‡
.008 .049 .006 .169 .866 .005
Knowledge of micronutrient functions‡
.165 .056 .103 2.949 .003** .094
Claim Presence# .073 .137 .017 .531 .595 .017
# Categorical variables,
† Variable in Quartiles,
‡ Variable Mean
Bold indicates significant differences
* p < .05 ** p < .01 *** p < .001

Consumer response to nutrition content claims on foods Page 41
Roy Morgan Research December, 2009
Potato Chip Purchase Intention
In Step 1 of the model for potato chip purchase intention the multiple correlation
coefficient (R = .262) was significantly different to zero (F(11, 880) = 5.897, p < .001).
6.9% of the variance was explained by the set of independent variables entered (R² = .069,
adjusted R² = .057). In step 2, with claim presence entered into the model, the multiple
correlation coefficient remained the same (R = .262) indicating that the presence or
absence of a claim (niacin or vitamin C) was not a significant predictor of potato chip
purchase intention (F(1,879) = .143, p = .705; R² = .069, adjusted R² = .056).
The independent variables which significantly predicted overall purchase intention in step
1 remained significant in step 2 when claim presence was entered into the model (see
Table 16). Country, dependents in household, household income, and nutrition knowledge
were found to significantly and uniquely contribute to the prediction of potato chip
purchase intention.
Higher potato chip purchase intentions were found amongst the Australian sample,
individuals with dependents in the household, households with lower incomes, and lower
nutrition knowledge.

Consumer response to nutrition content claims on foods Page 42
Roy Morgan Research December, 2009
Table 16: Impact of variables on Potato Chip Purchase Intention (step 2)
Predictor/independent variables B S.E. (B) β t p sr2
Age group# -.135 .096 -.052 -1.405 .160 -.046
Gender# .118 .142 .028 .831 .406 .027
Country# -.762 .149 -.177 -5.108 .000*** -.166
Dependents in the household# .410 .144 .100 2.853 .004** .093
Ethnicity# .269 .320 .029 .840 .401 .027
Household income† -.167 .067 -.091 -2.507 .012* -.082
Education level# .041 .138 .011 .301 .763 .010
Health concerns# -.141 .120 -.039 -1.178 .239 -.038
Nutrition knowledge† -.207 .065 -.108 -3.182 .002** -.104
Motivation to read nutrition information‡
-.090 .048 -.069 -1.876 .061 -.061
Knowledge of micronutrient functions‡ .073 .055 .047 1.327 .185 .043
Claim Presence# .051 .134 .012 .379 .705 .012
# Categorical variables,
† Variable in Quartiles,
‡ Variable Mean
Bold indicates significant differences
* p < .05 ** p < .01 *** p < .001
Consumer response to nutrition content claims on foods Page 43
Roy Morgan Research December, 2009
4.3.2 Does the presence of a claim affect consumers’ nutrition attitude?
Overall Nutrition Attitude
In step 1 of the model, the multiple correlation coefficient (R = .412) was significantly
different to zero (F(11, 881) = 16.367, p < .001), and 17% of the variance in overall
nutrition attitude was explained by the set of independent variables entered (R² = 0.170,
adjusted R² = 0.159). In step 2, with claim presence entered into the model, the multiple
correlation coefficient remained the same (R = .412) indicating that it was not a significant
predictor of overall nutrition attitude (F(1,880) = .467, p = .494.
The independent variables which significantly predicted overall nutrition attitude in step 1
remained significant in step 2 when claim presence was entered into the model (see Table
17). Gender, country, dependents in the household, household income, education level,
health concerns, nutrition knowledge, motivation to read nutrition information, and
knowledge of micronutrient functions were found to significantly and uniquely contribute
to the prediction of overall nutrition attitude.
Overall nutrition attitudes were found to be higher amongst males, the Australian sample,
individuals with dependents in the household, households with lower incomes, lower levels
of education, no health concerns, lower nutrition knowledge, moderate motivation to read
nutrition information, and higher self-reported knowledge of micronutrient functions.

Consumer response to nutrition content claims on foods Page 44
Roy Morgan Research December, 2009
Table 17: Impact of variables on Overall Nutrition Attitude (step 2)
Predictor/independent variables B S.E. (B) β t p sr2
Age group# .089 .065 .048 1.368 .172 .042
Gender# -.304 .095 -.101 -3.188 .001** -.098
Country# -.603 .101 -.194 -5.962 .000*** -.183
Dependents in the household# .252 .097 .085 2.587 .010* .079
Ethnicity# -.033 .217 -.005 -.150 .881 -.005
Household income† -.205 .045 -.156 -4.566 .000*** -.140
Education level# .227 .093 .081 2.447 .015* .075
Health concerns# -.207 .081 -.080 -2.551 .011* -.078
Nutrition knowledge† -.256 .044 -.186 -5.836 .000*** -.179
Motivation to read nutrition information‡ -.072 .032 -.077 -2.234 .026* -.069
Knowledge of micronutrient functions‡ .169 .037 .154 4.574 .000*** .140
Claim Presence# -.062 .091 -.021 -.684 .494 -.021
#
Categorical variables, †
Variable in Quartiles, ‡
Variable Mean
Bold indicates significant differences
* p < .05 ** p < .01 *** p < .001
Consumer response to nutrition content claims on foods Page 45
Roy Morgan Research December, 2009
Ice Cream Nutrition Attitude
In Step 1 of the model for ice cream nutrition attitude the multiple correlation coefficient
(R = .350) was significantly different to zero (F(11, 836) = 10.576, p < .001). 12.2% of the
variance was explained by the set of independent variables entered (R² = .122, adjusted R²
= .111). In step 2, with claim presence entered into the model, the multiple correlation
coefficient remained the same (R = .350) indicating that the presence or absence of a claim
(calcium or phosphorus) was not a significant predictor of ice cream nutrition attitude
(F(1,835) = .153, p = .695).
The independent variables which significantly predicted ice cream nutrition attitude in step
1 remained significant in step 2 when claim presence was entered into the model (see
Table 18). Age group, country, household income, health concerns, nutrition knowledge,
and knowledge of micronutrient functions were found to significantly and uniquely
contribute to the prediction of ice cream nutrition attitude.
Nutrition attitudes towards ice cream were found to be higher amongst older individuals,
the Australian sample, households with lower incomes, no health concerns, lower nutrition
knowledge, and higher self-reported knowledge of micronutrient functions.
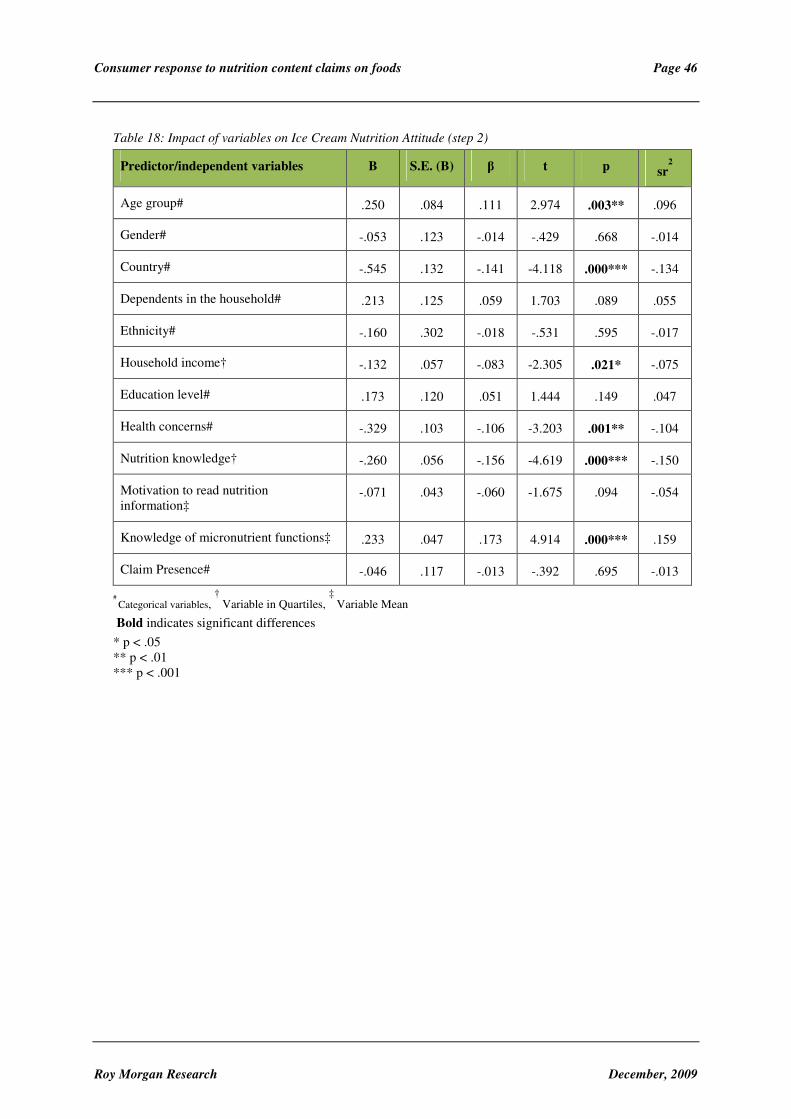
Consumer response to nutrition content claims on foods Page 46
Roy Morgan Research December, 2009
Table 18: Impact of variables on Ice Cream Nutrition Attitude (step 2)
Predictor/independent variables B S.E. (B) β t p sr2
Age group# .250 .084 .111 2.974 .003** .096
Gender# -.053 .123 -.014 -.429 .668 -.014
Country# -.545 .132 -.141 -4.118 .000*** -.134
Dependents in the household# .213 .125 .059 1.703 .089 .055
Ethnicity# -.160 .302 -.018 -.531 .595 -.017
Household income† -.132 .057 -.083 -2.305 .021* -.075
Education level# .173 .120 .051 1.444 .149 .047
Health concerns# -.329 .103 -.106 -3.203 .001** -.104
Nutrition knowledge† -.260 .056 -.156 -4.619 .000*** -.150
Motivation to read nutrition information‡
-.071 .043 -.060 -1.675 .094 -.054
Knowledge of micronutrient functions‡ .233 .047 .173 4.914 .000*** .159
Claim Presence# -.046 .117 -.013 -.392 .695 -.013
#
Categorical variables, †
Variable in Quartiles, ‡
Variable Mean
Bold indicates significant differences
* p < .05 ** p < .01 *** p < .001

Consumer response to nutrition content claims on foods Page 47
Roy Morgan Research December, 2009
Frozen Lasagne Nutrition Attitude
In Step 1 of the model for frozen lasagne nutrition attitude, the multiple correlation
coefficient (R = .344) was significantly different to zero (F(11, 851) = 10.415, p < .001).
11.9% of the variance was explained by the set of independent variables entered (R² =
.119, adjusted R² = .107). In step 2, with claim presence entered into the model, the
multiple correlation coefficient was only marginally higher (R = .347) indicating that the
presence or absence of a claim (iron or selenium) was not a significant predictor of Frozen
Meal (Lasagne) Nutrition Attitude (F(1,850) = 1.956, p = .162;). 12.1% of the variance is
now accounted for (R² = .121, adjusted R² = .108).
The independent variables which significantly predicted frozen lasagne nutrition attitude in
step 1 remained significant in step 2 when claim presence was entered into the model (see
Table 19). Gender, country, household income, education level, nutrition knowledge, and
knowledge of micronutrient functions were found to significantly and uniquely contribute
to the prediction of frozen lasagne nutrition attitude.
Nutrition attitudes towards frozen lasagne were found to be higher amongst males, the
Australian sample, households with lower incomes, lower levels of education, lower
nutrition knowledge, and higher self-reported knowledge of micronutrient functions.

Consumer response to nutrition content claims on foods Page 48
Roy Morgan Research December, 2009
Table 19: Impact of variables on Frozen Lasagne Nutrition Attitude (step 2)
Predictor/independent variables B S.E. (B) β t p sr2
Age group# .137 .085 .060 1.613 .107 .052
Gender# -.380 .125 -.101 -3.036 .002** -.098
Country# -.603 .134 -.154 -4.502 .000*** -.145
Dependents in the household# .232 .128 .063 1.815 .070 .058
Ethnicity# -.098 .287 -.012 -.340 .734 -.011
Household income† -.182 .059 -.111 -3.099 .002** -.100
Education level# .547 .122 .156 4.504 .000*** .145
Health concerns# -.037 .106 -.011 -.347 .729 -.011
Nutrition knowledge† -.172 .057 -.100 -2.997 .003** -.096
Motivation to read nutrition information‡
-.061 .043 -.050 -1.406 .160 -.045
Knowledge of micronutrient functions‡ .212 .049 .152 4.329 .000*** .139
Claim Presence# -.166 .118 -.045 -1.399 .162 -.045
# Categorical variables,
† Variable in Quartiles,
‡ Variable Mean
Bold indicates significant differences * p < .05 ** p < .01 *** p < .001

Consumer response to nutrition content claims on foods Page 49
Roy Morgan Research December, 2009
Fruit Drink Nutrition Attitude
In Step 1 of the model for fruit drink nutrition attitude the multiple correlation coefficient
(R = .330) was significantly different to zero (F(11, 856) = 9.49, p < .001). 10.9% of the
variance was explained by the set of independent variables entered (R² = .109, adjusted R²
= .097). In step 2, with claim presence entered into the model, the multiple correlation
coefficient was only marginally higher (R = .332) indicating that the presence or absence
of a claim (antioxidants-flavonoids or beta-cryptoxanthins) was not a significant predictor
of Fruit Drink Nutrition Attitude (F(1,855) = 1.68, p = .195). 11% of the variance was
now accounted for (R² = .11, adjusted R² = .098).
The independent variables which significantly predicted fruit drink nutrition attitude in
step 1 remained significant in step 2 when claim presence was entered into the model (see
Table 20). Gender, country, dependents in the household, household income, health
concerns, and nutrition knowledge were found to significantly and uniquely contribute to
the prediction of fruit drink nutrition attitude.
Nutrition attitudes towards fruit drink were found to be higher amongst males, the
Australian sample, households with lower incomes, lower levels of education, lower
nutrition knowledge, and higher self-reported knowledge of micronutrient functions.
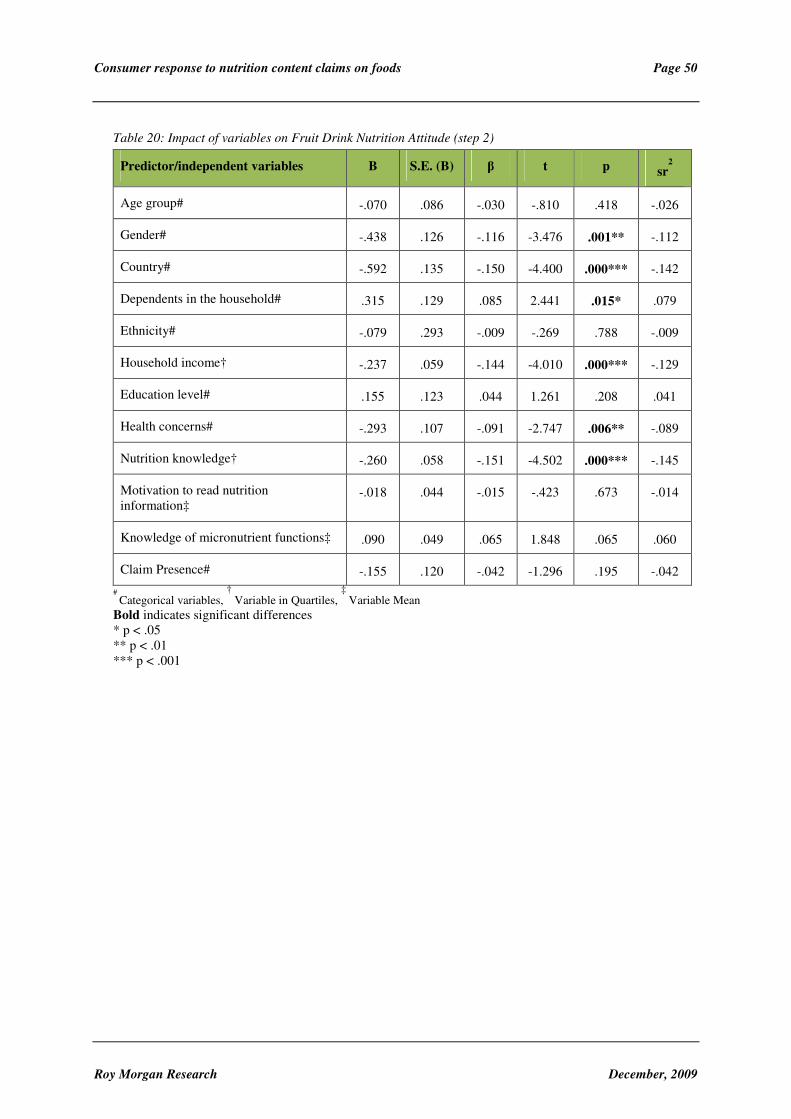
Consumer response to nutrition content claims on foods Page 50
Roy Morgan Research December, 2009
Table 20: Impact of variables on Fruit Drink Nutrition Attitude (step 2)
Predictor/independent variables B S.E. (B) β t p sr2
Age group# -.070 .086 -.030 -.810 .418 -.026
Gender# -.438 .126 -.116 -3.476 .001** -.112
Country# -.592 .135 -.150 -4.400 .000*** -.142
Dependents in the household# .315 .129 .085 2.441 .015* .079
Ethnicity# -.079 .293 -.009 -.269 .788 -.009
Household income† -.237 .059 -.144 -4.010 .000*** -.129
Education level# .155 .123 .044 1.261 .208 .041
Health concerns# -.293 .107 -.091 -2.747 .006** -.089
Nutrition knowledge† -.260 .058 -.151 -4.502 .000*** -.145
Motivation to read nutrition information‡
-.018 .044 -.015 -.423 .673 -.014
Knowledge of micronutrient functions‡ .090 .049 .065 1.848 .065 .060
Claim Presence# -.155 .120 -.042 -1.296 .195 -.042
# Categorical variables,
† Variable in Quartiles,
‡ Variable Mean
Bold indicates significant differences * p < .05 ** p < .01 *** p < .001
Consumer response to nutrition content claims on foods Page 51
Roy Morgan Research December, 2009
Potato Chip Nutrition Attitude
In Step 1 of the model for potato chip nutrition attitude the multiple correlation coefficient
(R = .331) was significantly different to zero (F(11, 857) = 9.574, p < .001). 10.9% of the
variance was explained by the set of independent variables entered (R² = .109, adjusted R²
= .098). In step 2, with claim presence entered into the model, the multiple correlation
coefficient remained the same (R = .331) indicating that the presence or absence of a claim
(niacin or vitamin C) was not a significant predictor of potato chip nutrition attitude
(F(1,856) = .072, p = .789).
The independent variables which significantly predicted potato chip nutrition attitude in
step 1 remained significant in step 2 when claim presence was entered into the model (see
Table 21). Country, household income, nutrition knowledge, motivation to read nutrition
information, and knowledge of micronutrient functions were found to significantly and
uniquely contribute to the prediction of potato chip nutrition attitude.
Nutrition attitudes towards potato chips were found to be higher amongst the Australian
sample, households with lower incomes, lower nutrition knowledge, moderate motivation
to read nutrition information, and higher self-reported knowledge of micronutrient
functions.

Consumer response to nutrition content claims on foods Page 52
Roy Morgan Research December, 2009
Table 21: Impact of variables on Potato Chips Nutrition Attitude (step 2)
Predictor/independent variables B S.E. (B) β t p sr2
Age group# .005 .089 .002 .055 .956 .002
Gender# -.232 .133 -.059 -1.753 .080 -.057
Country# -.604 .140 -.148 -4.314 .000*** -.139
Dependents in the household# .147 .134 .038 1.098 .272 .035
Ethnicity# .230 .299 .026 .770 .442 .025
Household income† -.251 .062 -.145 -4.050 .000*** -.131
Education level# .011 .128 .003 .084 .933 .003
Health concerns# -.193 .112 -.057 -1.725 .085 -.056
Nutrition knowledge† -.333 .060 -.185 -5.507 .000*** -.178
Motivation to read nutrition information‡ -.116 .045 -.093 -2.565 .010* -.083
Knowledge of micronutrient functions‡ .152 .051 .104 2.955 .003** .095
Claim Presence# .034 .125 .009 .268 .789 .009
# Categorical variables,
† Variable in Quartiles,
‡ Variable Mean
Bold indicates significant differences * p < .05 ** p < .01 *** p < .001

Consumer response to nutrition content claims on foods Page 53
Roy Morgan Research December, 2009
4.3.3 Does the presence of claim affect consumers’ perceptions of the number of types
of people benefiting from eating the product?
Overall Perceived Number of Types of People Benefiting
In step 1 of the model, the multiple correlation coefficient (R = .329) was significantly
different to zero (F(11, 890) = 9.831, p < .001). 10.8% of the variance in overall perceived
number of types of people benefiting was explained by the set of independent variables
entered (R² = .108, adjusted R² = .097).
In step 2, with claim presence entered into the model, the multiple correlation coefficient
was only marginally higher (R = .333), indicating that claim presence did not significantly
influence overall perceptions of the number of types of people who would benefit
(F(1,889) = 2.539, p = .111). 11.1% of the variance was now accounted for (R² = .111,
adjusted R² = .099).
The independent variables which significantly predicted the respondent’s perceptions of
number of types of people who would benefit in step 1, remained significant in step 2
when claim presence was entered into the model (see Table 22). Country, household
income, education level, nutrition knowledge, and knowledge of micronutrient functions
were found to significantly and uniquely contribute to the prediction of overall perceived
types of people benefiting. In Step 2, health concerns were also a significant predictor
(change of p = .058 to p = .048).
Overall perceptions of the number of types of people benefiting from consuming the
products were found to be higher amongst the Australian sample, households with lower
incomes, lower levels of education, lower nutrition knowledge, higher self-reported
knowledge of micronutrient functions, and no health concerns.

Consumer response to nutrition content claims on foods Page 54
Roy Morgan Research December, 2009
Table 22: Impact of variables on Overall Perceived Number of Types of People Benefiting (step 2)
Predictor/independent variables B S.E. (B) β t p sr2
Age group# -.153 .087 -.063 -1.752 .080 -.055
Gender# -.236 .128 -.060 -1.839 .066 -.058
Country# -.642 .135 -.159 -4.746 .000*** -.150
Dependents in the household# .141 .130 .037 1.083 .279 .034
Ethnicity# .148 .292 .017 .506 .613 .016
Household income† -.266 .060 -.155 -4.398 .000*** -.139
Education level# .313 .125 .085 2.506 .012* .079
Health concerns# -.215 .109 -.064 -1.979 .048* -.063
Nutrition knowledge† -.205 .059 -.114 -3.479 .001** -.110
Motivation to read nutrition information‡
.010 .043 .008 .228 .820 .007
Knowledge of micronutrient functions‡ .230 .050 .161 4.646 .000*** .147
Claim Presence -.194 .122 -.051 -1.593 .111 -.050
# Categorical variables,
† Variable in Quartiles,
‡ Variable Mean
Bold indicates significant differences * p < .05 ** p < .01 *** p < .001

Consumer response to nutrition content claims on foods Page 55
Roy Morgan Research December, 2009
Ice Cream - Perceived Number of Types of People Benefiting
In Step 1 of the model for the perceived number of types of people benefiting from ice
cream the multiple correlation coefficient (R = .262) was significantly different to zero
(F(11, 890) = 5.975, p < .001). 6.9% of the variance was explained by the set of
independent variables entered (R² = .069, adjusted R² = .057).
In step 2, with claim presence entered into the model, the multiple correlation coefficient
was marginally higher (R = .269) and the change approaching statistical significance,
indicating that the presence or absence of a claim (calcium or phosphorus) was trending
towards being a weak predictor of respondent’s perceptions of the number of types of
people who would benefit from eating ice cream (F(1,889) = 3.618, p = .057). 7.3% of the
variance was now accounted for (R² = .073, adjusted R² = .060).
The independent variables which were significant predictors in step 1 remained significant
in step 2 when claim presence was entered into the model (see Table 23). Country,
household income, nutrition knowledge, and knowledge of micronutrient functions were
found to significantly and uniquely contribute to the prediction model of the number of
types of people who would benefit from consuming ice cream.
Perceptions of the number of types of people benefiting from consuming ice cream were
found to be higher amongst the Australian sample, households with lower incomes, lower
nutrition knowledge, and higher self-reported knowledge of micronutrient functions.

Consumer response to nutrition content claims on foods Page 56
Roy Morgan Research December, 2009
Table 23: Impact of variables on Ice Cream – who would benefit (step 2)
Predictor/independent variables B S.E. (B) β t p sr2
Age group# .043 .127 .013 .342 .733 .011
Gender# .162 .187 .029 .866 .387 .028
Country# -.837 .197 -.146 -4.254 .000*** -.137
Dependents in the household# .187 .190 .034 .984 .325 .032
Ethnicity# .368 .425 .029 .865 .388 .028
Household income† -.208 .088 -.085 -2.361 .018* -.076
Education level# .324 .182 .062 1.787 .074 .058
Health concerns# -.140 .158 -.029 -.884 .377 -.029
Nutrition knowledge† -.240 .086 -.094 -2.791 .005** -.090
Motivation to read nutrition information‡
.054 .063 .031 .860 .390 .028
Knowledge of micronutrient functions‡
.289 .072 .142 4.013 .000*** .130
Claim Presence# -.337 .177 -.062 -1.902 .057 -.061
# Categorical variables,
† Variable in Quartiles,
‡ Variable Mean
Bold indicates significant differences * p < .05 ** p < .01 *** p < .001
Consumer response to nutrition content claims on foods Page 57
Roy Morgan Research December, 2009
Frozen Lasagne - Perceived Number of Types of People Benefiting
In Step 1 of the model for frozen lasagne perceived number of types of people benefiting
the multiple correlation coefficient (R = .231) was significantly different to zero (F(11,
890) = 4.549, p < .001). 5.3% of the variance was explained by the set of independent
variables entered (R² = .053, adjusted R² = .042).
In step 2, with claim presence entered into the model, the multiple correlation coefficient
was only marginally higher (R = .232) indicating that the presence or absence of a claim
(Iron or Selenium) was not a significant predictor of the perceived number of types of
people who would benefit from eating frozen lasagne (F(1,889) = .477, p = .49). 5.4% of
the variance was now accounted for (R² = .054, adjusted R² = .041).
The independent variables, which significantly predicted perceptions of the number of
types of people who would benefit from eating frozen lasagne, in Step 1 remained
significant in Step 2 when claim presence was entered into the model (see Table 24).
Country, household income, education level, and knowledge of micronutrient functions
were found to significantly and uniquely contribute to the prediction model.
Perceptions of the number of types of people benefiting from consuming frozen lasagne
were found to be higher amongst the Australian sample, households with lower incomes,
lower levels of education, and higher self-reported knowledge of micronutrient functions.

Consumer response to nutrition content claims on foods Page 58
Roy Morgan Research December, 2009
Table 24: Impact of variables on Frozen Lasagne – Who would benefit (step 2)
Predictor/independent variables B S.E. (B) β t p sr2
Age group# -.060 .129 -.017 -.466 .642 -.015
Gender# -.337 .189 -.060 -1.781 .075 -.058
Country# -.425 .199 -.074 -2.135 .033* -.070
Dependents in the household# .281 .192 .051 1.463 .144 .048
Ethnicity# .002 .430 .000 .006 .996 .000
Household income† -.179 .089 -.073 -2.011 .045* -.066
Education level# .660 .184 .126 3.596 .000*** .117
Health concerns# -.183 .160 -.038 -1.144 .253 -.037
Nutrition knowledge† -.086 .087 -.033 -.986 .324 -.032
Motivation to read nutrition information‡ -.003 .064 -.002 -.043 .966 -.001
Knowledge of micronutrient functions‡ .272 .073 .133 3.732 .000*** .122
Claim Presence# -.124 .179 -.023 -.691 .490 -.023
# Categorical variables,
† Variable in Quartiles,
‡ Variable Mean
Bold indicates significant differences * p < .05 ** p < .01 *** p < .001
Consumer response to nutrition content claims on foods Page 59
Roy Morgan Research December, 2009
Fruit Drink - Perceived Number of Types of People Benefiting
In Step 1 of the model for the perceived number of types of people benefiting from
consuming the fruit drink the multiple correlation coefficient (R = .277) was significantly
different to zero (F(11, 890) = 6.734, p < .001). 7.7% of the variance was explained by the
set of independent variables entered (R² = .077, adjusted R² = .065).
In step 2, with claim presence entered into the model, the multiple correlation coefficient
was higher (R = .284) and indicated that the presence or absence of a claim (antioxidants-
flavonoids or beta-cryptoxanthins) was also a significant predictor of respondents
perceptions types of people who would benefit from drinking fruit drink (F(1,889) = 3.863,
p = .50). 8.1% of the variance was now accounted for (R² = .081, adjusted R² = .068). The
direction of the effect was in the direction that respondents exposed to a claim indicated
that a higher number of types of people would benefit from consuming fruit drink,
compared to respondents not exposed to a claim.
The independent variables which significantly predicted the dependent variable in step 1
remained significant in step 2 when claim presence was entered into the model (see Table
25). Age group, gender, country, household income, health concerns, nutrition knowledge,
and claim presence were found to significantly and uniquely contribute to the prediction of
the dependent variable.
Perceptions of the number of types of people benefiting from consuming fruit drink were
found to be higher amongst younger respondents, males, the Australian sample, households
with lower incomes, no health concerns, and lower nutrition knowledge.

Consumer response to nutrition content claims on foods Page 60
Roy Morgan Research December, 2009
Table 25: Impact of variables on Fruit Drink – Who would benefit (step 2)
Predictor/independent variables B S.E. (B) β t p sr2
Age group# -.355 .144 -.091 -2.466 .014* -.079
Gender# -.441 .212 -.069 -2.085 .037* -.067
Country# -.793 .223 -.122 -3.561 .000*** -.115
Dependents in the household# .219 .214 .035 1.019 .308 .033
Ethnicity# -.139 .481 -.010 -.290 .772 -.009
Household income† -.507 .099 -.182 -5.099 .000*** -.164
Education level# .178 .205 .030 .868 .386 .028
Health concerns# -.424 .179 -.078 -2.367 .018* -.076
Nutrition knowledge† -.268 .097 -.092 -2.763 .006** -.089
Motivation to read nutrition information‡
-.015 .071 -.008 -.217 .828 -.007
Knowledge of micronutrient functions‡ .116 .082 .050 1.428 .154 .046
Claim Presence# -.394 .200 -.063 -1.966 .050* -.063
# Categorical variables,
† Variable in Quartiles,
‡ Variable Mean
Bold indicates significant differences * p < .05 ** p < .01 *** p < .001

Consumer response to nutrition content claims on foods Page 61
Roy Morgan Research December, 2009
Potato Chips - Perceived Number of Types of People Benefiting
In Step 1 of the model for the perceived number of types of people benefiting from
consuming potato chips, the multiple correlation coefficient (R = .289) was significantly
different to zero (F(11, 890) = 7.377, p < .001). 8.4% of the variance was explained by the
set of independent variables entered (R² = .084, adjusted R² = .072).
In step 2, with claim presence entered into the model, the multiple correlation coefficient
was marginally higher (R = .290), but not significantly, indicating that the presence or
absence of a claim (niacin or vitamin C) was not a significant predictor of the perception of
types of people who would benefit from eating potato chips (F(1,889) = .397, p = .529).
The independent variables which significantly predicted the dependent variable in step 1
remained significant in step 2 when claim presence was entered into the model (see Table
26). Age group, gender, country, household income, nutrition knowledge, and knowledge
of micronutrient functions were found to significantly and uniquely contribute to the
prediction of respondent’s perceptions of the number of types of people who would benefit
from consuming potato chips.
Perceptions of the number of types of people benefiting from consuming potato chips were
found to be higher amongst younger respondents, males, the Australian sample, households
with lower incomes, lower nutrition knowledge, and higher self-reported knowledge of
micronutrient functions.

Consumer response to nutrition content claims on foods Page 62
Roy Morgan Research December, 2009
Table 26: Impact of variables on Potato Chips – Who would benefit (step 2)
Predictor/independent variables B S.E. (B) β t p sr2
Age group# -.241 .090 -.098 -2.676 .008** -.086
Gender# -.329 .132 -.083 -2.487 .013* -.080
Country# -.512 .139 -.125 -3.672 .000*** -.118
Dependents in the household# -.121 .134 -.031 -.903 .367 -.029
Ethnicity# .361 .301 .040 1.200 .231 .039
Household income† -.169 .062 -.097 -2.717 .007** -.087
Education level# .087 .128 .023 .679 .498 .022
Health concerns# -.114 .112 -.033 -1.017 .309 -.033
Nutrition knowledge† -.227 .061 -.125 -3.740 .000*** -.120
Motivation to read nutrition information‡
.003 .045 .003 .077 .938 .002
Knowledge of micronutrient functions‡ .242 .051 .167 4.752 .000*** .153
Claim Presence# .079 .125 .020 .630 .529 .020
# Categorical variables,
† Variable in Quartiles,
‡ Variable Mean
Bold indicates significant differences * p < .05 ** p < .01 *** p < .001

Consumer response to nutrition content claims on foods Page 63
Roy Morgan Research December, 2009
4.3.4 Does the presence of a claim affect consumers’ perceptions of the number of types
of health benefits from eating the product?
Overall Perceived Number of Types of Health Benefits
In step 1 of the model, the multiple correlation coefficient (R = .328) was significantly
different to zero (F(11, 890) = 9.746, p < .001). 10.8% of the variance in overall perceived
number of types of health benefits from consuming the products was explained by the set
of independent variables entered (R² = .108, adjusted R² = .096).
In Step 2, with claim presence entered into the model, the multiple correlation coefficient
remained the same (R = .328), indicating that it was not a significant predictor of the
overall perceptions of the number of types of health benefits arising from consuming the
products (F(1,889) = .011, p = .918.
The independent variables which significantly predicted to the dependent variable in step 1
remained significant in step 2 when claim presence was entered into the model (see Table
27). Age group, gender, country, household income, health concerns, nutrition knowledge,
and knowledge of micronutrient functions were found to significantly and uniquely
contribute to the prediction of overall perceived types of health benefits.
Overall perceptions of the number of types of health benefits from consuming the products
were found to be higher amongst younger respondents, males, the Australian sample,
households with lower incomes, respondents with no health concerns, lower nutrition
knowledge, and higher self-reported knowledge of micronutrient functions.

Consumer response to nutrition content claims on foods Page 64
Roy Morgan Research December, 2009
Table 27: Impact of variables on Overall Types of Health Benefits (step 2)
Predictor/independent variables B S.E. (B) β t p sr2
Age group# -.500 .144 -.126 -3.477 .001** -.110
Gender# -.756 .211 -.117 -3.574 .000*** -.113
Country# -.880 .223 -.133 -3.956 .000*** -.025
Dependents in the household# -.080 .214 -.013 -.371 .711 -.012
Ethnicity# .528 .481 .036 1.098 .273 .035
Household income† -.259 .099 -.092 -2.610 .009** -.083
Education level# .291 .205 .048 1.419 .156 .045
Health concerns# -.383 .179 -.069 -2.140 .033* -.068
Nutrition knowledge† -.254 .097 -.086 -2.621 .009** -.083
Motivation to read nutrition information‡ .050 .071 .025 .702 .483 .022
Knowledge of micronutrient functions‡ .473 .082 .202 5.804 .000*** .184
Claim Presence# -.021 .200 -.003 -.103 .918 -.003
# Categorical variables,
† Variable in Quartiles,
‡ Variable Mean
Bold indicates significant differences * p < .05 ** p < .01 *** p < .001

Consumer response to nutrition content claims on foods Page 65
Roy Morgan Research December, 2009
Ice Cream - Perceived Number of Types of Health Benefits
In Step 1 of the model, for ice cream perceived number of types of health benefits, the
multiple correlation coefficient (R = .265) was significantly different to zero (F(11, 890) =
6.095, p < .001). 7% of the variance was explained by the set of independent variables
entered (R² = .070, adjusted R² = .059). In Step 2, with claim presence entered into the
model, the multiple correlation coefficient remained the same (R = .265) indicating that the
presence or absence of a claim (calcium or phosphorus) was not a significant predictor of
respondents perception of the number of types of health benefits associated with ice cream
(F(1,889) = .015, p = .902).
The independent variables which significantly predicted the dependent variable in step 1
remained significant in Step 2 when claim presence was entered into the model (see Table
28). Country, nutrition knowledge, and knowledge of micronutrient functions were found
to significantly and uniquely contribute to the prediction of perceived number of types of
health benefits of consuming ice cream.
Perceptions of the number of types of health benefits of consuming ice cream were found
to be higher amongst the Australian sample, lower nutrition knowledge, and higher self-
reported knowledge of micronutrient functions.

Consumer response to nutrition content claims on foods Page 66
Roy Morgan Research December, 2009
Table 28: Impact of variables on Ice Cream - Types of Health Benefits (step 2)
Predictor/independent variables B S.E. (B) β t p sr2
Age group# -.232 .166 -.052 -1.398 .162 -.045
Gender# -.132 .244 -.018 -.543 .587 -.018
Country# -.770 .256 -.103 -3.005 .003** -.097
Dependents in the household# -.229 .247 -.032 -.928 .354 -.030
Ethnicity# .171 .554 .010 .309 .758 .010
Household income† -.090 .114 -.028 -.788 .431 -.025
Education level# .252 .236 .037 1.067 .286 .035
Health concerns# -.203 .206 -.033 -.986 .324 -.032
Nutrition knowledge† -.335 .112 -.101 -2.995 .003** -.097
Motivation to read nutrition information‡ .044 .082 .020 .541 .589 .017
Knowledge of micronutrient functions‡ .543 .094 .205 5.780 .000*** .187
Claim Presence# .028 .230 .004 .123 .902 .004
# Categorical variables,
† Variable in Quartiles,
‡ Variable Mean
Bold indicates significant differences * p < .05 ** p < .01 *** p < .001

Consumer response to nutrition content claims on foods Page 67
Roy Morgan Research December, 2009
Frozen Lasagne - Perceived Number of Types of Health Benefits
In Step 1 of the model for frozen lasagne perceived number of types of health benefits the
multiple correlation coefficient (R = .263) was significantly different to zero (F(11, 890) =
6.021, p < .001). 6.9% of the variance was explained by the set of independent variables
entered (R² = .069, adjusted R² = .058). In Step 2, with claim presence entered into the
model, the multiple correlation coefficient remained the same (R = .263) indicating that the
presence or absence of a claim (iron or selenium) was not a significant predictor of
respondent’s perceptions of the number of types of health benefits from consuming frozen
lasagne (F(1,889) = .077, p = .782).
The independent variables which significantly predicted the dependent variable in step 1
remained significant in step 2 when claim presence was entered into the model (see Table
29). Age group, gender, country, education level, nutrition knowledge, and knowledge of
micronutrient functions were found to significantly and uniquely contribute to the
prediction of the perceived number of types of health benefits of frozen lasagne.
Perceptions of the number of types of health benefits of consuming frozen lasagne were
found to be higher amongst younger respondents, males, the Australian sample, lower
levels of education, lower nutrition knowledge, and higher self-reported knowledge of
micronutrient functions.

Consumer response to nutrition content claims on foods Page 68
Roy Morgan Research December, 2009
Table 29: Impact of variables on Frozen Lasagne - Types of Health Benefits (step 2)
Predictor/independent variables B S.E. (B) β t p sr2
Age group# -.454 .191 -.088 -2.381 .017* -.077
Gender# -1.159 .280 -.138 -4.133 .000*** -.134
Country# -.601 .295 -.070 -2.035 .042* -.066
Dependents in the household# .102 .284 .012 .357 .721 .012
Ethnicity# .891 .638 .047 1.398 .162 .045
Household income† -.190 .132 -.052 -1.442 .150 -.047
Education level# .630 .272 .081 2.314 .021* .075
Health concerns# -.369 .238 -.052 -1.555 .120 -.050
Nutrition knowledge† -.258 .129 -.067 -2.004 .045* -.065
Motivation to read nutrition information‡
.127 .094 .049 1.343 .179 .043
Knowledge of micronutrient functions‡ .447 .108 .147 4.134 .000*** .134
Claim Presence# .074 .265 .009 .277 .782 .009
# Categorical variables,
† Variable in Quartiles,
‡ Variable Mean
Bold indicates significant differences * p < .05 ** p < .01 *** p < .001

Consumer response to nutrition content claims on foods Page 69
Roy Morgan Research December, 2009
Fruit Drink - Perceived Number of Types of Health Benefits
In Step 1 of the model for fruit drink perceived number of types of health benefits the
multiple correlation coefficient (R = .299) was significantly different to zero (F(11, 890) =
7.933, p < .001). 8.9% of the variance was explained by the set of independent variables
entered (R² = .089, adjusted R² = .078). In step 2, with claim presence entered into the
model, the multiple correlation coefficient remained the same (R = .299) indicating that the
presence or absence of a claim (antioxidants-flavonoids or beta-cryptoxanthins) was not a
significant predictor of the perceptions of the number of types of health benefits from
consuming the fruit drink (F(1,889) = .282, p = .595).
The independent variables which significantly predicted the dependent variable in step 1
remained significant in step 2 when claim presence was entered into the model (see Table
30). Age group, gender, country, household income, health concerns, and knowledge of
micronutrient functions were found to significantly and uniquely contribute to the
prediction model.
Perceptions of the number of types of health benefits of consuming fruit drink were found
to be higher amongst younger respondents, males, the Australian sample, households with
lower incomes, respondents with no health concerns, and higher self-reported knowledge
of micronutrient functions.

Consumer response to nutrition content claims on foods Page 70
Roy Morgan Research December, 2009
Table 30: Impact of variables on Fruit Drink - Types of Health Benefits (step 2)
Predictor/independent variables B S.E. (B) β t p sr2
Age group# -.918 .235 -.143 -3.903 .000*** -.125
Gender# -1.115 .346 -.107 -3.226 .001** -.103
Country# -1.637 .364 -.153 -4.498 .000*** -.144
Dependents in the household# .031 .350 .003 .088 .930 .003
Ethnicity# .797 .786 .034 1.014 .311 .032
Household income† -.608 .163 -.133 -3.742 .000*** -.120
Education level# .204 .336 .021 .607 .544 .019
Health concerns# -.724 .293 -.081 -2.471 .014* -.079
Nutrition knowledge† -.135 .159 -.028 -.849 .396 -.027
Motivation to read nutrition information‡
.012 .116 .004 .100 .921 .003
Knowledge of micronutrient functions‡ .505 .133 .133 3.787 .000*** .121
Claim Presence# -.174 .327 -.017 -.531 .595 -.017
# Categorical variables,
† Variable in Quartiles,
‡ Variable Mean
Bold indicates significant differences * p < .05 ** p < .01 *** p < .001

Consumer response to nutrition content claims on foods Page 71
Roy Morgan Research December, 2009
Potato Chips - Perceived Number of Types of Health Benefits
In Step 1 of the model, for potato chip perceived number of types of health benefits, the
multiple correlation coefficient (R = .275) was significantly different to zero (F(11, 890) =
6.627, p < .001). 7.6% of the variance was explained by the set of independent variables
entered (R² = .076, adjusted R² = .064). In step 2, with claim presence entered into the
model, the multiple correlation coefficient remained the same (R = .275) indicating that the
presence or absence of a claim (niacin or vitamin C) was not a significant predictor of the
perception of the number of types of health benefits from consuming potato chips
(F(1,889) = .003, p = .957).
The independent variables which significantly predicted the dependent variable in step 1
remained significant in step 2 when claim presence was entered into the model (see Table
31). Age group, gender, country, nutrition knowledge, and knowledge of micronutrient
functions were found to significantly and uniquely contribute to the prediction of perceived
potato chip health benefits.
Perceptions of the number of types of health benefits of consuming potato chips were
found to be higher amongst younger respondents, males, the Australian sample, lower
nutrition knowledge, and higher self-reported knowledge of micronutrient functions.

Consumer response to nutrition content claims on foods Page 72
Roy Morgan Research December, 2009
Table 31: Impact of variables on Potato Chips - Types of Health Benefits (step 2)
Predictor/independent variables B S.E. (B) β t p sr2
Age group# -.397 .137 -.107 -2.890 .004** -.093
Gender# -.616 .202 -.102 -3.052 .002** -.098
Country# -.513 .212 -.083 -2.417 .016* -.078
Dependents in the household# -.222 .205 -.037 -1.083 .279 -.035
Ethnicity# .251 .459 .018 .547 .584 .018
Household income† -.149 .095 -.056 -1.573 .116 -.051
Education level# .079 .196 .014 .402 .688 .013
Health concerns# -.237 .171 -.046 -1.384 .167 -.045
Nutrition knowledge† -.290 .093 -.105 -3.126 .002** -.101
Motivation to read nutrition information‡
.017 .068 .009 .250 .803 .008
Knowledge of micronutrient functions‡ .398 .078 .181 5.115 .000*** .165
Claim Presence# -.010 .191 -.002 -.054 .957 -.002
# Categorical variables,
† Variable in Quartiles,
‡ Variable Mean
Bold indicates significant differences * p < .05 ** p < .01 *** p < .001
Consumer response to nutrition content claims on foods Page 73
Roy Morgan Research December, 2009
5. SUMMARY OF THE KEY FINDINGS
This research study was the third study in a series commissioned by FSANZ to investigate
the impact that nutrition content claims on product packaging has on consumers. The
study was initiated out of concerns that nutrition content claims on foods of lower
nutritional quality may mislead consumers. The research objectives of this study were to
investigate:
• The impact of presence of a nutrition content claim on consumer product evaluations
(i.e. on purchase intention, nutritional attitude, perceived number of types of people
benefiting from consuming the product, and perceived number of types of health
benefits from product consumption). This impact was assessed across four products
which did not meet the NPSC: ice cream, frozen lasagne, fruit drink, and potato chips;
and
• The impact of socio-demographic, cognitive, and behavioural factors in predicting
consumer’s product evaluations (i.e. purchase intention, nutritional attitude, perceived
number of types of people benefiting from consuming the product, and perceived
number of types of health benefits from product consumption).
The key finding was that nutrition content claims did not significantly enhance respondent
evaluations of the four product types tested. Only in one case did the presence of a
nutrition content claim have significant impact. Respondents exposed to an antioxidant
content claim on a fruit juice drink reported significantly higher numbers of types of
people who would benefit from consuming the fruit drink than those exposed to the
product without the claim. However the claim presence only accounted for 0.4% of the
variance. This general finding is consistent with both the experimental and supermarket
studies previously undertaken.
Purchase intention across the four products and overall were moderate both for respondents
exposed to a claim and not exposed to a claim. Similarly, overall scores for nutrition
attitude towards the four products were relatively low and consistent across the two
treatment groups (claim/no claim). Overall and across all four products respondents
perceived that the consumption of the products as being beneficial to very few, if any,
types of people and having few to no types of health benefits. These perceptions were
consistent across treatment group (claim/no claim) and were the strongest in relation to the
consumption of potato chips.

Consumer response to nutrition content claims on foods Page 74
Roy Morgan Research December, 2009
While the presence of a nutrition content claim did not significantly impact consumer’s
evaluations, a number of socio-demographic, cognitive and behavioural factors did
contribute significantly to the evaluations.
Country of residence was a significant factor in all four evaluation measures for all four
products both individually and also overall. Australians consistently scored higher
purchase intentions, nutrition attitudes, perceptions of the number of types of people who
would benefit from consuming and the number of types of health benefits from consuming
the products than New Zealand based respondents.
While not significant in all circumstances household income, nutrition knowledge, and
knowledge of micronutrient functions were important factors for most evaluations. Lower
household income, lower nutrition knowledge, and a higher reported knowledge of
micronutrient functions were consistently associated with higher scores for purchase
intention, nutrition attitude, the number of types of people who would benefit and the
number of types of health benefits from consuming the products.
To a smaller degree age, gender, dependents in the household, education level, health
concerns, and motivation to read nutrition labels also yielded an effect on evaluations.
Respondents with no health concerns scored higher on nutrition attitude to ice cream and
for the four products overall, perceived number of the types of people benefiting from
consuming fruit drink and the products overall, and perceived number of types of health
benefits from consuming fruit drink the four products overall.
Lower education level was predictive of higher scores on purchase intentions for fruit
drink and overall for the four products, nutrition attitude to frozen lasagne, fruit drink, and
overall for the four products, and perceived number of the types of health benefits from
consumption of the frozen lasagne and all four products.
Males scored higher on purchase intentions for frozen lasagne and fruit drink, higher on
nutrition attitude to frozen lasagne, fruit drink and overall for the four products, higher
perceptions of the number of types of people benefiting from consuming fruit drink and
potato chips, and higher perceptions of the number of types of health benefits from
consuming all four products individually and overall.
Age had a slight effect on product evaluations. Younger respondents scored higher on
their perceptions of the number of types of people benefiting from consuming fruit drink
and potato chips, as well as the number of types of health benefits from consuming the
products individually and overall, with the exception of the consumption of ice cream.
Consumer response to nutrition content claims on foods Page 75
Roy Morgan Research December, 2009
Older respondents scored higher on their nutrition attitudes towards ice cream than the
younger respondents.
The presence of health concerns factored in slightly in the evaluations with respondents
with health concerns having higher scores than those with general or specific health
concerns for: purchase intention towards fruit drink and overall for all four products,
nutrition attitude towards frozen lasagne, fruit drink, and overall for all products, and
perceptions of the number of types of health benefits from consuming fruit drink and
overall for all the products. In line with these results, respondents who paid little attention
to a healthy diet and had a low willingness to try novel foods scored higher across all four
evaluation measures and all four products both individually and overall.
The presence of dependents in the household resulted in higher scores compared to those
with no dependents in the household on: nutrition attitude overall for the four products, and
purchase intentions towards ice cream, potato chips, and overall for the four products.
Finally, moderate motivation to read the nutrition information on the products, as opposed
to low or high, was associated with higher purchase intentions towards ice cream, and
higher nutrition attitudes towards potato chips and overall for all four products.
To summarise, exposure to nutrition content claims about vitamins, minerals and
biologically active substances on the ice cream, frozen lasagne, fruit drink, and potato chip
packaging presented in product images via an online survey did not enhance consumer’s
product evaluations or purchase intentions. Only in the instance of the fruit drink did the
presence of a claim significantly affect their evaluation of the number of types of people
who would benefit from the consuming the product.
Consistent with the findings of the previous macronutrient content claims survey there
were several socio-demographic, cognitive, and behavioural factors which influenced
consumer’s purchase intentions and product evaluations. However, the strength of
influence was relatively weak, accounting for overall no more than 17% of the variance.
This indicates that there are other factors which are influencing consumers purchase
intentions and product evaluations, at least for foods which are of low nutrition quality,
which have not been captured by this research.
The findings of this study may, to some extent, be limited by the online methodology in
which the exposure to the products is not the same as the real-life shopping environment.
A possible limitation of the implementation of the survey online could include the potential
differences in the appearance (e.g. picture quality, size, visibility) of the products based
upon different respondents’ computer screens, however as each respondent would view all
Consumer response to nutrition content claims on foods Page 76
Roy Morgan Research December, 2009
pictures on the same screen, this limitation is only likely to increase the variability of
responses rather than contribute to bias. Irrespective of the specific methodology used, it is
possible that respondents may have focused more intently on the packaging and labelling
than they would normally do, simply as a result of being part of the survey. As the sample
was drawn from an online research panel, it may include some respondents who, as they
regularly participate in research, may feel in some way ‘obligated’ to prepare for future
surveys by paying more attention to in-store product packaging. At the same time, it may
also include other respondents who, as they regularly participate in research, may feel less
inclined to take a close interest in the project at hand. Overall, there seems no reason to
believe that the methodology has had any consistent influence on the results in any
particular direction.
The strength of this study’s methodology include the absence of interviewer influence on
participations, the random assignment of participations across experimental conditions, and
controlling the sample stratification by age, gender, and country so it reflects the overall
population.
Based upon the findings of this study it is recommended that future research focuses on
uncovering the other factors which are influencing consumers’ purchase intention and
product evaluations in relation to nutrition value, people who would benefit, and the health
benefits associated with products of lower nutritional value. A combination of qualitative
methodology, such as focus groups with main grocery buyers, and follow-up quantitative
research based upon the information generation may be of benefit.

Consumer response to nutrition content claims on foods Page 77
Roy Morgan Research December, 2009
APPENDIX A: SAMPLE PLAN
Table 32: Sample Plan for Ice Cream
AUSTRALIA NEW ZEALAND
Female Male Female Male
TOTAL
Ice Cream Experimental Group 1 (Source of Calcium)
18-34 44 24 15 6 89
35-54 72 32 32 12 148
55+ 62 32 27 8 129
Total 178 88 74 26 366
Ice Cream Experimental Group 2 (Source of Phosphorus)
18-34 44 25 15 6 90
35-54 72 32 32 11 147
55+ 62 32 27 9 130
Total 178 89 74 26 367
Ice Cream Control Group (Absence of claim)
18-34 44 25 15 5 89
35-54 72 32 33 11 148
55+ 62 32 27 9 130
Total 178 89 75 25 367

Consumer response to nutrition content claims on foods Page 78
Roy Morgan Research December, 2009
Table 33: Sample Plan for Frozen Lasagne
AUSTRALIA NEW ZEALAND
Female Male Female Male
TOTAL
Frozen Meal Experimental Group 1a (Source of Iron + moderate-high fat NIP)
18-34 22 12 8 3 45
35-54 36 16 16 5 73
55+ 31 16 14 4 65
Total 89 44 38 12 183
Frozen Meal Experimental Group 1b (Source of Iron + lower-moderate fat NIP)
18-34 22 12 8 3 45
35-54 36 16 16 5 73
55+ 31 16 14 4 65
Total 89 44 38 12 183
Frozen Meal Experimental Group 2a (Source of Selenium + moderate-high fat NIP)
18-34 23 12 8 3 46
35-54 36 16 16 5 73
55+ 31 16 14 4 65
Total 90 44 38 12 184
Frozen Meal Experimental Group 2b (Source of Selenium + lower-moderate fat NIP)
18-34 22 12 8 3 45
35-54 36 16 16 5 73
55+ 31 16 14 4 65
Total 89 44 38 12 183
Frozen Meal Control Group (Absence of Claim)
18-34 44 25 15 5 89
35-54 72 32 33 12 149
55+ 62 32 27 8 129
Total 178 89 75 25 367
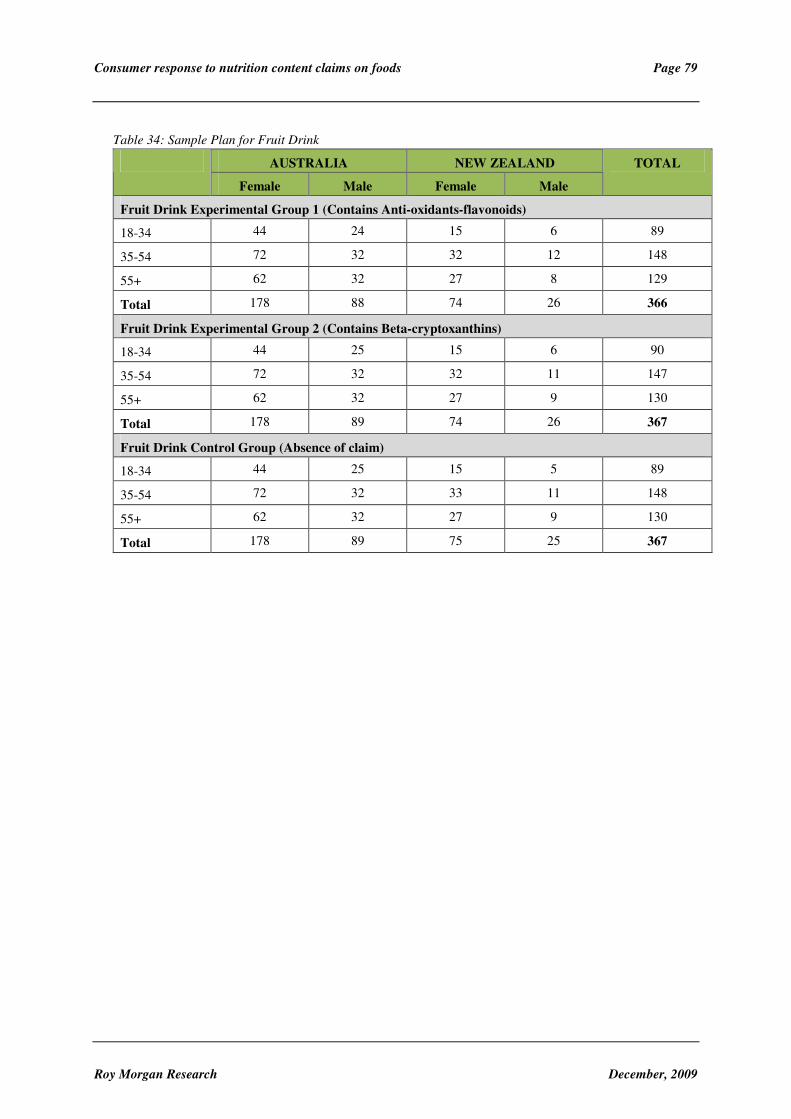
Consumer response to nutrition content claims on foods Page 79
Roy Morgan Research December, 2009
Table 34: Sample Plan for Fruit Drink
AUSTRALIA NEW ZEALAND
Female Male Female Male
TOTAL
Fruit Drink Experimental Group 1 (Contains Anti-oxidants-flavonoids)
18-34 44 24 15 6 89
35-54 72 32 32 12 148
55+ 62 32 27 8 129
Total 178 88 74 26 366
Fruit Drink Experimental Group 2 (Contains Beta-cryptoxanthins)
18-34 44 25 15 6 90
35-54 72 32 32 11 147
55+ 62 32 27 9 130
Total 178 89 74 26 367
Fruit Drink Control Group (Absence of claim)
18-34 44 25 15 5 89
35-54 72 32 33 11 148
55+ 62 32 27 9 130
Total 178 89 75 25 367
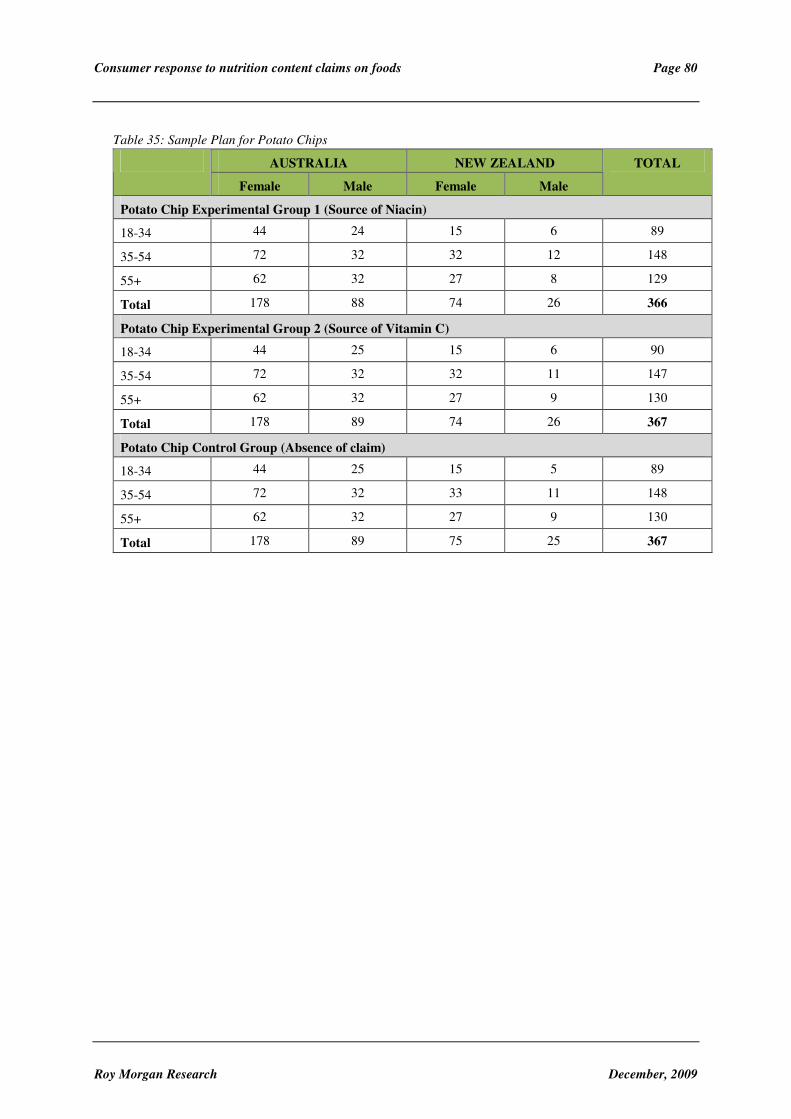
Consumer response to nutrition content claims on foods Page 80
Roy Morgan Research December, 2009
Table 35: Sample Plan for Potato Chips
AUSTRALIA NEW ZEALAND
Female Male Female Male
TOTAL
Potato Chip Experimental Group 1 (Source of Niacin)
18-34 44 24 15 6 89
35-54 72 32 32 12 148
55+ 62 32 27 8 129
Total 178 88 74 26 366
Potato Chip Experimental Group 2 (Source of Vitamin C)
18-34 44 25 15 6 90
35-54 72 32 32 11 147
55+ 62 32 27 9 130
Total 178 89 74 26 367
Potato Chip Control Group (Absence of claim)
18-34 44 25 15 5 89
35-54 72 32 33 11 148
55+ 62 32 27 9 130
Total 178 89 75 25 367

Consumer response to nutrition content claims on foods Page 81
Roy Morgan Research December, 2009
APPENDIX B: ACHIEVED SAMPLE
Table 36: Actual cell sizes achieved for Ice Cream
AUSTRALIA NEW ZEALAND
Female Male Female Male
TOTAL
Ice Cream Experimental Group 1 (Source of Calcium)
18-34 43 24 16 7 90
35-54 75 32 33 13 153
55+ 63 32 27 8 130
Total 181 88 76 28 373
Ice Cream Experimental Group 2 (Source of Phosphorus)
18-34 45 25 18 6 94
35-54 74 32 33 12 151
55+ 62 30 27 11 130
Total 181 87 78 29 375
Ice Cream Control Group (Absence of claim)
18-34 45 26 16 5 92
35-54 79 32 34 12 157
55+ 62 33 26 9 130
Total 186 91 76 26 379
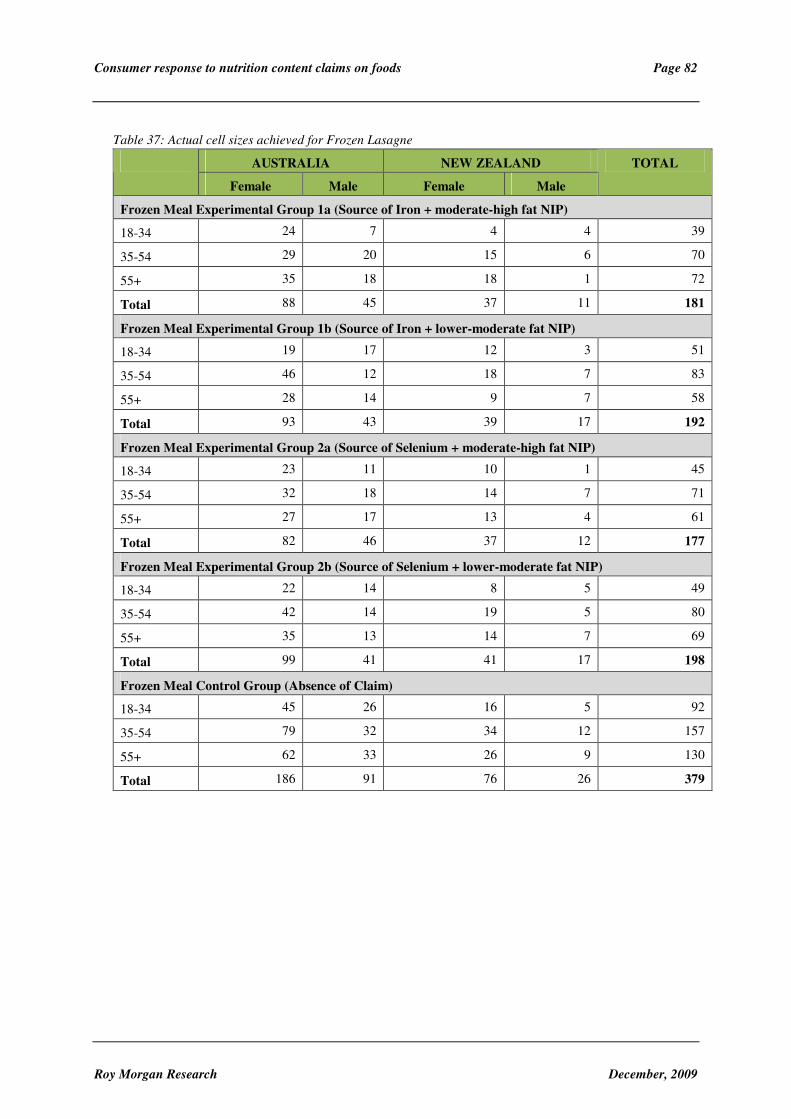
Consumer response to nutrition content claims on foods Page 82
Roy Morgan Research December, 2009
Table 37: Actual cell sizes achieved for Frozen Lasagne
AUSTRALIA NEW ZEALAND
Female Male Female Male
TOTAL
Frozen Meal Experimental Group 1a (Source of Iron + moderate-high fat NIP)
18-34 24 7 4 4 39
35-54 29 20 15 6 70
55+ 35 18 18 1 72
Total 88 45 37 11 181
Frozen Meal Experimental Group 1b (Source of Iron + lower-moderate fat NIP)
18-34 19 17 12 3 51
35-54 46 12 18 7 83
55+ 28 14 9 7 58
Total 93 43 39 17 192
Frozen Meal Experimental Group 2a (Source of Selenium + moderate-high fat NIP)
18-34 23 11 10 1 45
35-54 32 18 14 7 71
55+ 27 17 13 4 61
Total 82 46 37 12 177
Frozen Meal Experimental Group 2b (Source of Selenium + lower-moderate fat NIP)
18-34 22 14 8 5 49
35-54 42 14 19 5 80
55+ 35 13 14 7 69
Total 99 41 41 17 198
Frozen Meal Control Group (Absence of Claim)
18-34 45 26 16 5 92
35-54 79 32 34 12 157
55+ 62 33 26 9 130
Total 186 91 76 26 379

Consumer response to nutrition content claims on foods Page 83
Roy Morgan Research December, 2009
Table 38: Actual cell sizes achieved for Fruit Drink
AUSTRALIA NEW ZEALAND
Female Male Female Male
TOTAL
Fruit Drink Experimental Group 1 (Contains Anti-oxidants-flavonoids)
18-34 43 24 16 7 90
35-54 75 32 33 13 153
55+ 63 32 27 8 130
Total 181 88 76 28 373
Fruit Drink Experimental Group 2 (Contains Beta-cryptoxanthins)
18-34 45 25 18 6 94
35-54 74 32 33 12 151
55+ 62 30 27 11 130
Total 181 87 78 29 375
Fruit Drink Control Group (Absence of claim)
18-34 45 26 16 5 92
35-54 79 32 34 12 157
55+ 62 33 26 9 130
Total 186 91 76 26 379

Consumer response to nutrition content claims on foods Page 84
Roy Morgan Research December, 2009
Table 39: Actual cell sizes achieved for Potato Chips
AUSTRALIA NEW ZEALAND
Female Male Female Male
TOTAL
Potato Chip Experimental Group 1 (Source of Niacin)
18-34 43 24 16 7 90
35-54 75 32 33 13 153
55+ 63 32 27 8 130
Total 181 88 76 28 373
Potato Chip Experimental Group 2 (Source of Vitamin C)
18-34 45 25 18 6 94
35-54 74 32 33 12 151
55+ 62 30 27 11 130
Total 181 87 78 29 375
Potato Chip Control Group (Absence of claim)
18-34 45 26 16 5 92
35-54 79 32 34 12 157
55+ 62 33 26 9 130
Total 186 91 76 26 379

Consumer response to nutrition content claims on foods Page 85
Roy Morgan Research December, 2009
APPENDIX C: ADDITONAL TABLES
Table 40: Normality, skewness, and kurtosis of Purchase Intention (overall and by product)
Kolmogorov-Smirnov Dependent Variable:
Purchase Intention Statistic df Sign.
Skewness Kurtosis
Overall .037 1124 <.001 .009 -.693
Ice Cream .120 1104 <.001 -.252 -.988
Frozen Lasagne .150 1114 <.001 .120 -1.362
Fruit Drink .129 1117 <.001 -.004 -1.279
Potato Chips .128 1105 <.001 -.201 -1.143
Table 41: Normality, skewness, and kurtosis of Nutrition Attitude (overall and by product)
Kolmogorov-Smirnov Dependent Variable:
Nutrition Attitude Statistic df Sign.
Skewness Kurtosis
Overall .053 1107 <.001 .182 -.498
Ice Cream .097 1040 <.001 .022 -.823
Frozen Lasagne .101 1060 <.001 -.029 -.903
Fruit Drink .125 1064 <.001 -.197 -.919
Potato Chips .118 1065 <.001 .352 -.926
Table 42: Normality, skewness, and kurtosis of Types of People who would Benefit (overall and by product)
Kolmogorov-Smirnov Dependent Variable:
Who would benefit Statistic df Sign.
Skewness Kurtosis
Overall .110 1127 <.001 .663 -.195
Ice Cream .293 1127 <.001 .716 -.936
Frozen Lasagne .258 1127 <.001 .693 -.922
Fruit Drink .209 1127 <.001 -.128 -1.620
Potato Chips .436 1127 <.001 2.257 4.099
Table 43: Normality, skewness, and kurtosis of Types of Health Benefits (overall and by product)
Kolmogorov-Smirnov Dependent Variable:
Types of Health Benefits Statistic df Sign.
Skewness Kurtosis
Overall .199 1127 <.001 1.911 3.928
Ice Cream .274 1127 <.001 2.346 4.993
Frozen Lasagne .299 1127 <.001 2.047 3.279
Fruit Drink .169 1127 <.001 .744 -.811
Potato Chips .369 1127 <.001 3.512 12.122

Consumer response to nutrition content claims on foods Page 86
Roy Morgan Research December, 2009
APPENDIX D: TECHNICAL APPENDIX
Assumptions of Analyses
Multiple Linear Regression
Major assumptions of Multiple Linear Regression are:
1. Linearity of the relationship between dependent and independent variables
2. Independence of the errors
3. Homoscedasticity (constant variance) of the errors
4. Normality of the error distribution
To look at the regression assumptions, plots for each regression equation of residuals
versus predicted values and normal Q-Q plots of to test he normality of the distribution
were constructed, and examined.
In summary:
DV1 (Purchase intention):
Linearity – graph shows linear (i.e. not curvilinear)
Homoscedasticity – no evidence of violation from graphs
Normality – mostly normal as data points centred around zero
(normality is not essential for regression)
Independence – no issues with collinearity or singularity
DV2 (Nutrition Attitude):
Linearity – graph shows linear (i.e. not curvilinear)
Homoscedasticity – no evidence of violation from graphs
Normality – mostly normal as data points centred around zero
(normality is not essential for regression)
Independence – no issues with collinearity or singularity
DV3 (Perceived Number of Types of People Benefiting):
Linearity – graph shows linear (i.e. not curvilinear)
Homoscedasticity – no evidence of violation from graphs
Normality – mostly normal as data points centred around zero
(normality is not essential for regression)
Independence – no issues with collinearity or singularity

Consumer response to nutrition content claims on foods Page 87
Roy Morgan Research December, 2009
DV4 (Perceived Number of Types of Health Benefits):
Linearity – graph shows slight curvlinearity
Homoscedasticity – no evidence of violation from graphs
Normality – mostly normal as data points centred around zero
(normality is not essential for regression)
Independence – no issues with collinearity or singularity
Therefore, for the four dependent variables overall there appears to be no major violations
of the essential assumptions of regression.
Rationale for the Hierarchical Multiple Linear Regressions
To conduct the Multiple Linear Regression analyses, variable manipulations were required,
as an assumption of Multiple Linear Regression is that all independent variables be either
interval or ratio scales; however, dichotomous variables (2-3 levels) are also permitted.
The variables included in all Multiple Regression Analyses are outlined in section 4.3, as
in the manipulation required to allow inclusion in the analyses. Please note, that the
regression indicated that the independent variables were correlated but to a small degree.
Multicollinearity was not as issue as indicated by standardised beta coefficients less than 1,
high tolerance values, low condition index, and all eigenvalues above 0. Thus, the
independent variables were sufficiently distinct to be included in each analysis.

Consumer response to nutrition content claims on foods Page 88
Roy Morgan Research December, 2009
Plots of residuals vs predicted values of the DVs

Consumer response to nutrition content claims on foods Page 89
Roy Morgan Research December, 2009
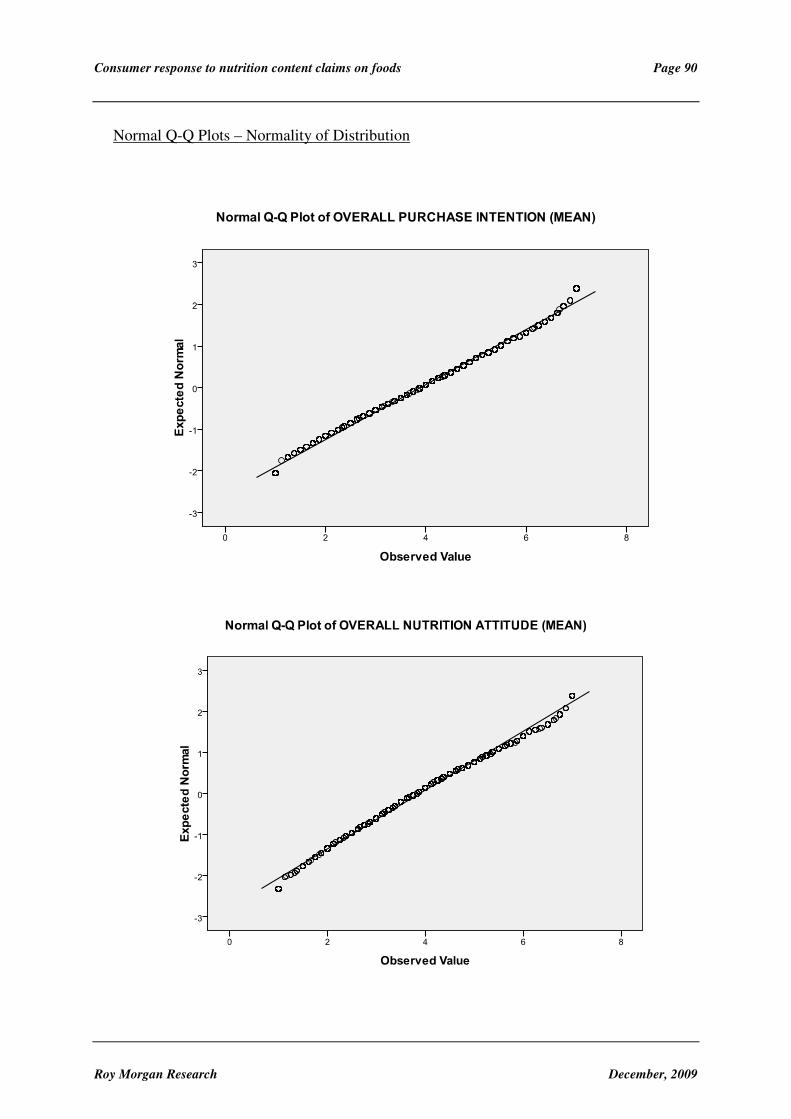
Consumer response to nutrition content claims on foods Page 90
Roy Morgan Research December, 2009
Normal Q-Q Plots – Normality of Distribution

Consumer response to nutrition content claims on foods Page 91
Roy Morgan Research December, 2009

Consumer response to nutrition content claims on foods Page 92
Roy Morgan Research December, 2009
APPENDIX E: PICTURES OF STIMULI
Ice Cream
Experimental Group 1 (Source of Calcium) – Front of Container

Consumer response to nutrition content claims on foods Page 93
Roy Morgan Research December, 2009
Experimental Group 2 (Source of Phosphorus) – Front of Container
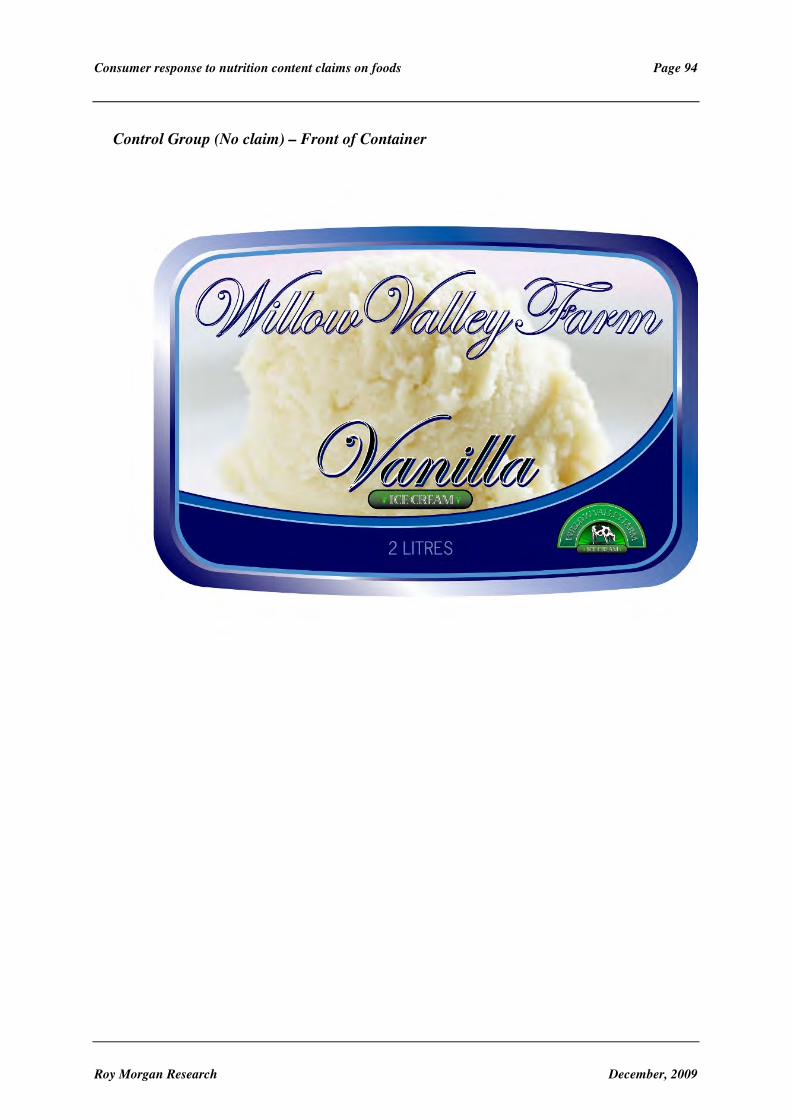
Consumer response to nutrition content claims on foods Page 94
Roy Morgan Research December, 2009
Control Group (No claim) – Front of Container

Consumer response to nutrition content claims on foods Page 95
Roy Morgan Research December, 2009
All Groups – Back of Packet (moderately high sugar NIP)

Consumer response to nutrition content claims on foods Page 96
Roy Morgan Research December, 2009
Frozen Lasagne
Experimental Group 1a and 1b (Source of Iron) – Front of Packet

Consumer response to nutrition content claims on foods Page 97
Roy Morgan Research December, 2009
Experimental Group 2a and 2b (Source of selenium) – Front of Packet

Consumer response to nutrition content claims on foods Page 98
Roy Morgan Research December, 2009
Control Group (No claim) – Front of Packet
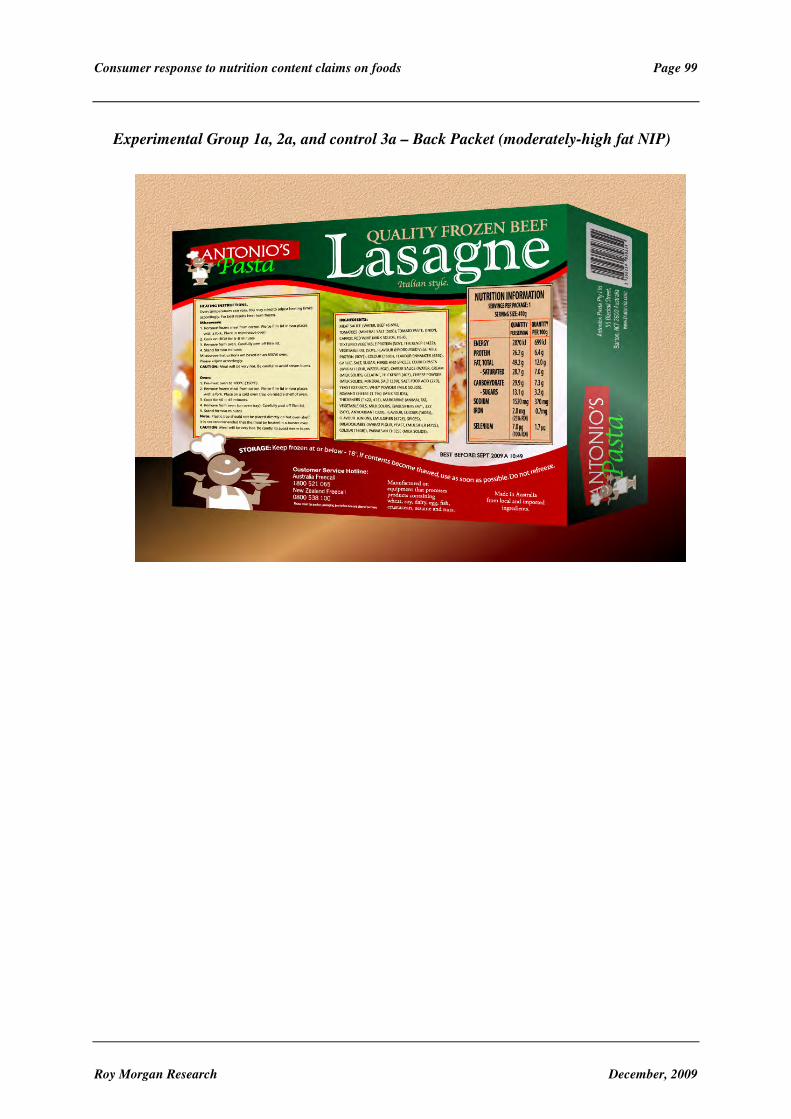
Consumer response to nutrition content claims on foods Page 99
Roy Morgan Research December, 2009
Experimental Group 1a, 2a, and control 3a – Back Packet (moderately-high fat NIP)

Consumer response to nutrition content claims on foods Page 100
Roy Morgan Research December, 2009
Experimental Group 1b, 2b, and control 3b – Back Packet (lower-moderate fat NIP)

Consumer response to nutrition content claims on foods Page 101
Roy Morgan Research December, 2009
Fruit Drink
Experimental Group 1 (Contains antioxidants-flavonoids) – Front of Container

Consumer response to nutrition content claims on foods Page 102
Roy Morgan Research December, 2009
Experimental Group 2 (Contains beta-cryptoxanthins) – Front of Container

Consumer response to nutrition content claims on foods Page 103
Roy Morgan Research December, 2009
Control Group (No claim) – Front of Container

Consumer response to nutrition content claims on foods Page 104
Roy Morgan Research December, 2009
All Conditions – Back of Container (moderately-high sugar NIP)

Consumer response to nutrition content claims on foods Page 105
Roy Morgan Research December, 2009
Potato Chips
Experimental Condition 1 (Source of Niacin) – Front of Packet

Consumer response to nutrition content claims on foods Page 106
Roy Morgan Research December, 2009
Experimental Group 2 (Source of Vitamin C) – Front of Packet

Consumer response to nutrition content claims on foods Page 107
Roy Morgan Research December, 2009
Control Conditions (No claim) – Front of Packet
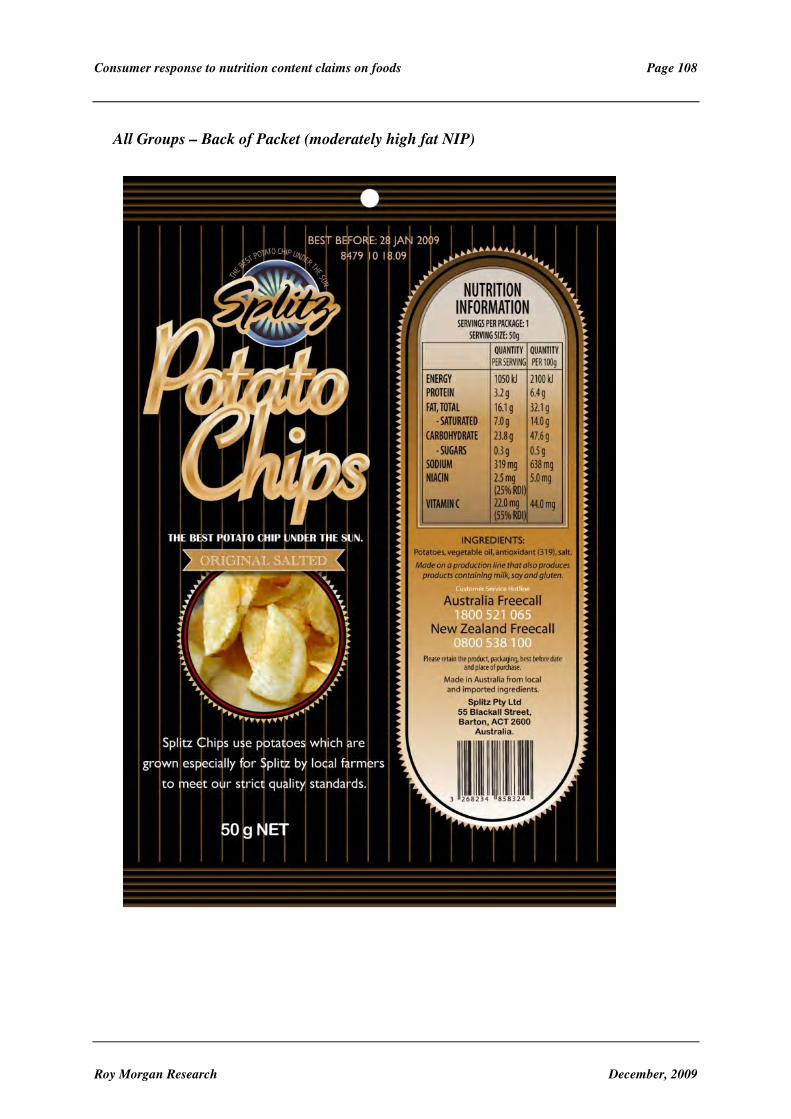
Consumer response to nutrition content claims on foods Page 108
Roy Morgan Research December, 2009
All Groups – Back of Packet (moderately high fat NIP)

Consumer response to nutrition content claims on foods Page 109
Roy Morgan Research December, 2009
APPENDIX F: QUESTIONNAIRE
Thank you for agreeing to take part in this survey. Today we're conducting a survey about food choices on behalf of Food Standards Australia New Zealand. The survey will take approximately 30 minutes to complete and will be used only for research purposes. Participating in this survey will allow you to provide your opinions and have your say.
Tips for completing the survey.
To navigate through the survey, please use the buttons within the survey.
Please DO NOT use the refresh, back or forward buttons on your browser.
If you wish to leave the survey and complete it later or if you are experiencing technical difficulties, press the stop button at the bottom of the survey.
If you do not click the stop button you will not be able to access the survey for up to 20 minutes.
The survey includes front and back images of food products, to be looked at as you would in a real life store situation. You may or may not wish to enlarge parts of the images. Should you wish to do so, click the 'Enlarge' button and then move the
button to the right.
If you experience technical difficulties please call 1800 337 332 to assist.
Please maximise this window before you continue.
Click NEXT to begin the survey.
QSCREEN. How much of the food and grocery shopping do you do for your household?
1. all or most of the food and grocery shopping 2. about half of the food and grocery shopping 3. less than half of the food and grocery shopping 4. none of the food and grocery shopping

Consumer response to nutrition content claims on foods Page 110
Roy Morgan Research December, 2009
IF NOT RESPONSIBLE FOR ANY OF THE FOOD OR GROCERY SHOPPING (Code 3 or 4 on QSCREEN) TERMINATE: Thank you but for this survey need people who are responsible for half or more of the food or grocery shopping.
ENDIF
QSCREENAGE. Age?
1. Under 18 2. 18-34 3. 35-54 4. 55+ 5. Can’t Say
IF UNDER 18 OR CAN’T SAY (Code 1 or Code 5 on QSREENAGE) TERMINATE: Thank you for your time, but for this survey we need to interview people of a certain age.
IF QUOTA FILLED TERMINATE: Thank you for your time, but you do not qualify for this survey at this time.
ENDIF
QSCREENSEX. Are You?
1. Male 2. Female
IF QUOTA FILLED TERMINATE: Thank you for your time, you do not qualify for this survey at this time.
ENDIF
You are about to see an image of an ice cream that you might buy at your local supermarket. Please look at this image in the same manner, and for as long as you would normally look at a similar product in a store situation.
INSERT SCREEN THAT CONTAINS FOOD IMAGE OF AN ICE CREAM PACK (RANDOMISE THE ORDER OF ALL FOUR FOOD PRODUCTS). THIS SCREEN WILL CONTAIN AN OPTIONAL LINK TO EITHER ANOTHER SCREEN THAT DISPLAYS THE BACK OF THE PRODUCT. THE RESPONDENT WILL BE ABLE TO TOGGLE BETWEEN THE 2 SCREENS. MULTIPLE TIMERS WILL BE ATTACHED TO THE ‘BACK VIEW’ SO THAT THE TOTAL TIME THE RESPONDENT SPENDS VIEWING THE BACK OF THE IMAGE CAN BE RECORDED AND AGGREGATED.

Consumer response to nutrition content claims on foods Page 111
Roy Morgan Research December, 2009
Q1. Thinking about the ice cream you have just seen:
[Single]
Q1A. How likely is it that you would purchase this ice cream?
1
Not at all
likely
2 3 4 5 6 7
Very likely
99
Don’t know
[Single]
Q1B. Assuming this ice cream has a cost that is similar to others on the market, how likely is it that you would purchase this ice cream?
1
Not at all
likely
2 3 4 5 6 7
Very likely
99
Don’t know
[Single]
Q1C. How would you rate the nutritiousness of this ice cream?
1
Poor
2 3 4 5 6 7
Good
99
Don’t know
[Single]
Q1D. What is your overall attitude towards the nutrition content of this ice cream?
1
Unfavourable
2 3 4 5 6 7
Favourable
99
Don’t know
[Multiple]
Q1E. Below is a list of some types of people. For each one, do you think they would or would not benefit from eating this ice cream as a regular part of the diet?
RANDOMISE

Consumer response to nutrition content claims on foods Page 112
Roy Morgan Research December, 2009
Yes, Would
Definitely Benefit
Yes,
Would Somewhat
Benefit
No,
Would Probably
Not Benefit
No, Would
Definitely Not
Benefit
Don’t Know
Women 1 2 3 4 99
Men 1 2 3 4 99
Children 1 2 3 4 99
Pregnant women 1 2 3 4 99
Older people 1 2 3 4 99
People trying to lose weight
1 2 3 4 99
People with particular health problems
1 2 3 4 99
[Multiple]
Are there any other types of people who would benefit from eating this ice cream as a regular part of their diet? If yes, please specify in boxes below (one per box):
Other types of people 1
(INSERT SPACE FOR RESPONDENT TO WRITE TEXT)
Other types of people 2
(INSERT SPACE FOR RESPONDENT TO WRITE TEXT)
Other types of people 3
(INSERT SPACE FOR RESPONDENT TO WRITE TEXT)
Other types of people 4
(INSERT SPACE FOR RESPONDENT TO WRITE TEXT)
[Single]
For each of these other types of people, to what extend would they benefit from eating this ice cream as a regular part of the diet?
Yes, Would Definitely
Benefit
Yes, Would Somewhat
Benefit
Don’t know
Other types of people 1 1 2 3

Consumer response to nutrition content claims on foods Page 113
Roy Morgan Research December, 2009
Other types of people 2 1 2 3
Other types of people 3 1 2 3
Other types of people 4 1 2 3
[Multiple]
Q1F. Below is a list of some nutrition and health benefits.
Do you think the following types of health benefits would result from eating this ice cream as a regular part of the diet?
RANDOMISE
Yes, a Definite Benefit
Yes, Somewh
at of a Benefit
No,
not Really a Benefit
No, Definitely not a Benefit
Don’t Know
Healthy bones and teeth 1 2 3 4 99
More energy from food 1 2 3 4 99
Healthy blood cells 1 2 3 4 99
Preventing cold or flu 1 2 3 4 99
Protection of body’s cells from some types of damage
1 2 3 4 99
Good eyesight 1 2 3 4 99
Healthy pregnancy 1 2 3 4 99
Healthy kidney function 1 2 3 4 99
A reduced risk of cancer 1 2 3 4 99
Healthy blood pressure 1 2 3 4 99
Healthy thyroid function 1 2 3 4 99
A reduced risk of diabetes 1 2 3 4 99
Healthy immune function 1 2 3 4 99
Healthy digestion 1 2 3 4 99
[Multiple]
Are there any other types of health benefits from eating this ice cream as a regular part of the diet? If yes, please specify in boxes below (one per box):
Other types of health benefits 1
(INSERT SPACE FOR RESPONDENT TO WRITE TEXT)

Consumer response to nutrition content claims on foods Page 114
Roy Morgan Research December, 2009
Other types of health benefits 2
(INSERT SPACE FOR RESPONDENT TO WRITE TEXT)
Other types of health benefits 3
(INSERT SPACE FOR RESPONDENT TO WRITE TEXT)
Other types of health benefits 4
(INSERT SPACE FOR RESPONDENT TO WRITE TEXT)
[Single]
For each type of health benefit you listed, to what extend do you think this health benefit would result from eating this ice cream?
Yes, Would Definitely
Benefit
Yes, Would Somewhat
Benefit
Don’t know
Other types of benefits 1 1 2 3
Other types of benefits 2 1 2 3
Other types of benefits 3 1 2 3
Other types of benefits 4 1 2 3
[Multiple]
Q1G. Thinking about how likely or unlikely it is that you would buy this ice cream. There may have been many and varied reasons why you indicated how likely or unlikely you would be to purchase this ice cream. Of the following, which if any, influenced your decision to buy or not to buy it?
THE BELOW TABLE WILL BE PRESENTED AS A GRID WITH A SMALL PICTURE FOR EACH OPTION. (EXCEPT OPTIONS: 1-YOUR GENERAL KNOWLEDGE, 97- NONE OF THE ABOVE/DID NOT USE ANY INFO AND 99- DON’T KNOW WHICH WILL BE PRESENTED IN TEXT). EACH OPTION SHOULD HAVE A TICK BOX BELOW IT SO THE RESPONDENT CAN SELECT THAT OPTION.
RANDOMISE
How
represented
Item
Picture Ingredients list
Picture Claims i.e “Source of Calcium”, “Source of Phosphorus”
Picture Nutrition information panel
Picture Pictures of the food used on the label
Picture Brand name, logo, manufacturer’s name
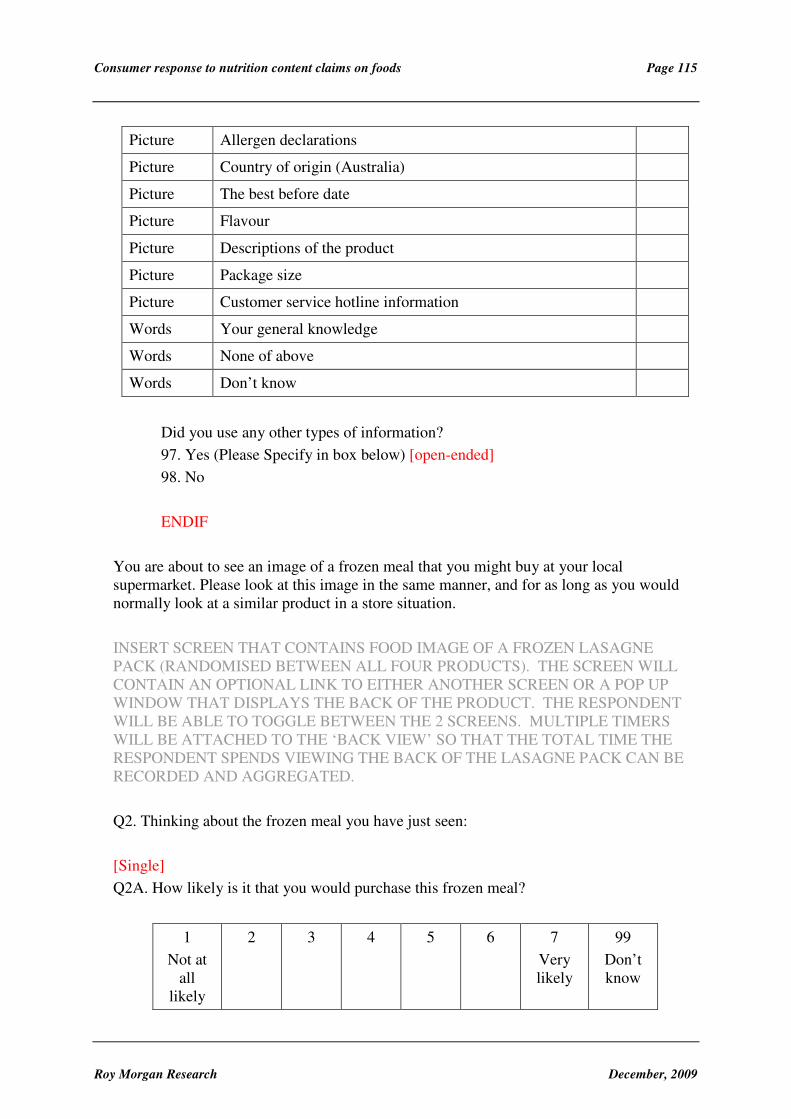
Consumer response to nutrition content claims on foods Page 115
Roy Morgan Research December, 2009
Picture Allergen declarations
Picture Country of origin (Australia)
Picture The best before date
Picture Flavour
Picture Descriptions of the product
Picture Package size
Picture Customer service hotline information
Words Your general knowledge
Words None of above
Words Don’t know
Did you use any other types of information?
97. Yes (Please Specify in box below) [open-ended]
98. No
ENDIF
You are about to see an image of a frozen meal that you might buy at your local supermarket. Please look at this image in the same manner, and for as long as you would normally look at a similar product in a store situation.
INSERT SCREEN THAT CONTAINS FOOD IMAGE OF A FROZEN LASAGNE PACK (RANDOMISED BETWEEN ALL FOUR PRODUCTS). THE SCREEN WILL CONTAIN AN OPTIONAL LINK TO EITHER ANOTHER SCREEN OR A POP UP WINDOW THAT DISPLAYS THE BACK OF THE PRODUCT. THE RESPONDENT WILL BE ABLE TO TOGGLE BETWEEN THE 2 SCREENS. MULTIPLE TIMERS WILL BE ATTACHED TO THE ‘BACK VIEW’ SO THAT THE TOTAL TIME THE RESPONDENT SPENDS VIEWING THE BACK OF THE LASAGNE PACK CAN BE RECORDED AND AGGREGATED.
Q2. Thinking about the frozen meal you have just seen:
[Single]
Q2A. How likely is it that you would purchase this frozen meal?
1
Not at all
likely
2 3 4 5 6 7
Very likely
99
Don’t know

Consumer response to nutrition content claims on foods Page 116
Roy Morgan Research December, 2009
[Single]
Q2B. Assuming this frozen meal has a cost that is similar to others on the market, how likely is it that you would purchase this frozen lasagne?
1
Not at all
likely
2 3 4 5 6 7
Very likely
99
Don’t know
[Single]
Q2C. How would you rate the nutritiousness of this frozen lasagne?
1
Poor
2 3 4 5 6 7
Good
99
Don’t know
[Single]
Q2D. What is your overall attitude towards the nutrition content of this frozen meal?
1
Unfavourable
2 3 4 5 6 7
Favourable
99
Don’t know
[Multiple]
Q2E. Below is a list of some types of people. For each one, do you think they would or would not benefit from eating this frozen meal as a regular part of the diet?
RANDOMISE
Yes, Would
Definitely Benefit
Yes, Would
Somewhat Benefit
No,
Would Probably
Not Benefit
No,
Would Definitely
Not Benefit
Don’t Know
Women 1 2 3 4 99
Men 1 2 3 4 99
Children 1 2 3 4 99
Pregnant women 1 2 3 4 99
Older people 1 2 3 4 99
People trying to lose weight
1 2 3 4 99

Consumer response to nutrition content claims on foods Page 117
Roy Morgan Research December, 2009
People with particular health problems
1 2 3 4 99
[Multiple]
Are there any other types of people who would benefit from eating this frozen meal as a regular part of their diet? If yes, please specify in boxes below (one per box):
Other types of people 1
(INSERT SPACE FOR RESPONDENT TO WRITE TEXT)
Other types of people 2
(INSERT SPACE FOR RESPONDENT TO WRITE TEXT)
Other types of people 3
(INSERT SPACE FOR RESPONDENT TO WRITE TEXT)
Other types of people 4
(INSERT SPACE FOR RESPONDENT TO WRITE TEXT)
[Single]
For each of these other types of people, to what extend would they benefit from eating this frozen meal as a regular part of the diet?
Yes, Would Definitely
Benefit
Yes, Would Somewhat
Benefit
Don’t know
Other types of people 1 1 2 3
Other types of people 2 1 2 3
Other types of people 3 1 2 3
Other types of people 4 1 2 3
[Multiple]
Q2F. Below is a list of some nutrition and health benefits.
Do you think the following types of health benefits would result from eating this frozen meal as a regular part of the diet?
RANDOMISE
Yes, a Definite Benefit
Yes, Somewh
at of a
No,
not Really a
No, Definitely not a
Don’t Know

Consumer response to nutrition content claims on foods Page 118
Roy Morgan Research December, 2009
Benefit Benefit Benefit
Healthy bones and teeth 1 2 3 4 99
More energy from food 1 2 3 4 99
Healthy blood cells 1 2 3 4 99
Preventing cold or flu 1 2 3 4 99
Protection of body’s cells from some types of damage
1 2 3 4 99
Good eyesight 1 2 3 4 99
Healthy pregnancy 1 2 3 4 99
Healthy kidney function 1 2 3 4 99
A reduced risk of cancer 1 2 3 4 99
Healthy blood pressure 1 2 3 4 99
Healthy thyroid function 1 2 3 4 99
A reduced risk of diabetes 1 2 3 4 99
Healthy immune function 1 2 3 4 99
Healthy digestion 1 2 3 4 99
[Multiple]
Are there any other types of health benefits from eating this frozen meal as a regular part of the diet? If yes, please specify in boxes below (one per box):
Other types of health benefits 1
(INSERT SPACE FOR RESPONDENT TO WRITE TEXT)
Other types of health benefits 2
(INSERT SPACE FOR RESPONDENT TO WRITE TEXT)
Other types of health benefits 3
(INSERT SPACE FOR RESPONDENT TO WRITE TEXT)
Other types of health benefits 4
(INSERT SPACE FOR RESPONDENT TO WRITE TEXT)
[Single]
For each type of health benefit you listed, to what extend do you think this health benefit would result from eating this frozen meal?
Yes, Would Yes, Would Don’t know

Consumer response to nutrition content claims on foods Page 119
Roy Morgan Research December, 2009
Definitely Benefit
Somewhat Benefit
Other types of benefits 1 1 2 3
Other types of benefits 2 1 2 3
Other types of benefits 3 1 2 3
Other types of benefits 4 1 2 3
[Multiple]
Q2G. Thinking about how likely or unlikely you would be to buy this frozen meal. There may have been many and varied reasons why you indicated how likely or unlikely you would be to purchase this frozen meal. Of the following, which if any, influenced your decision to buy or not to buy it?
THE BELOW TABLE WILL BE PRESENTED AS A GRID WITH A SMALL PICTURE FOR EACH OPTION. (EXCEPT OPTIONS: 1-YOUR GENERAL KNOWLEDGE, 97- NONE OF THE ABOVE/DID NOT USE ANY INFO AND 99- DON’T KNOW WHICH WILL BE PRESENTED IN TEXT). EACH OPTION SHOULD HAVE A TICK BOX BELOW IT SO THE RESPONDENT CAN SELECT THAT OPTION.
RANDOMISE ORDER
How
represented
Item
Picture Ingredients list
Picture Claims i.e. “Source of Iron”, “Source of Selenium”
Picture Nutrition information panel
Picture Pictures of the food used on the label
Picture Brand name, logo, Manufacturer’s name
Picture Allergen declarations
Picture Country of origin (Australia)
Picture The best before date
Picture Flavour (e.g. beef)
Picture Instructions how to cook
Picture Descriptions of the product
Picture Package size
Picture Customer service hotline information
Picture “Italian Style”
Picture “Simply the most delicious”

Consumer response to nutrition content claims on foods Page 120
Roy Morgan Research December, 2009
Words Your general knowledge
Words None of above
Words Don’t know
Did you use any other types of information?
97. Yes (Please Specify in box below) [open-ended] 98. No
ENDIF
You are about to see an image of a fruit drink that you might buy at your local supermarket. Please look at this image in the same manner, and for as long as you would normally look at a similar product in a store situation.
INSERT SCREEN THAT CONTAINS AN IMAGE OF A FRUIT DRINK (RANDOMISED). SCREEN WILL CONTAIN AN OPTIONAL LINK TO EITHER ANOTHER SCREEN OR A POP UP WINDOW THAT DISPLAYS THE BACK OF THE PRODUCT. THE RESPONDENT WILL BE ABLE TO TOGGLE BETWEEN THE 2 SCREENS. MULTIPLE TIMERS WILL BE ATTACHED TO THE ‘BACK VIEW’ SO THAT THE TOTAL TIME THE RESPONDENT SPENDS VIEWING THE BACK OF THE IMAGE CAN BE RECORDED AND AGGREGATED.
Q3. Thinking about the fruit drink you have just seen:
[Single]
Q3A. How likely is it that you would purchase this fruit drink?
1
Not at all
likely
2 3 4 5 6 7
Very likely
99
Don’t know
[Single]
Q3B. Assuming this fruit drink has a cost that is similar to others on the market, how likely is it that you would purchase this fruit drink?
1
Not at all
likely
2 3 4 5 6 7
Very likely
99
Don’t know

Consumer response to nutrition content claims on foods Page 121
Roy Morgan Research December, 2009
[Single]
Q3C. How would you rate the nutritiousness of this fruit drink?
1
Poor
2 3 4 5 6 7
Good
99
Don’t know
[Single]
Q3D. What is your overall attitude towards the nutrition content of this fruit drink?
1
Unfavourable
2 3 4 5 6 7
Favourable
99
Don’t know
[Multiple]
Q3E. Below is a list of some types of people. For each one, do you think they would or would not benefit from drinking this fruit drink as a regular part of the diet?
RANDOMISE
Yes, Would
Definitely Benefit
Yes, Would
Somewhat Benefit
No,
Would Probably
Not Benefit
No,
Would Definitely
Not Benefit
Don’t Know
Women 1 2 3 4 99
Men 1 2 3 4 99
Children 1 2 3 4 99
Pregnant women 1 2 3 4 99
Older people 1 2 3 4 99
People trying to lose weight
1 2 3 4 99
People with particular health problems
1 2 3 4 99
[Multiple]
Are there any other types of people who would benefit from drinking this fruit drink as a regular part of their diet? If yes, please specify in boxes below (one per box):
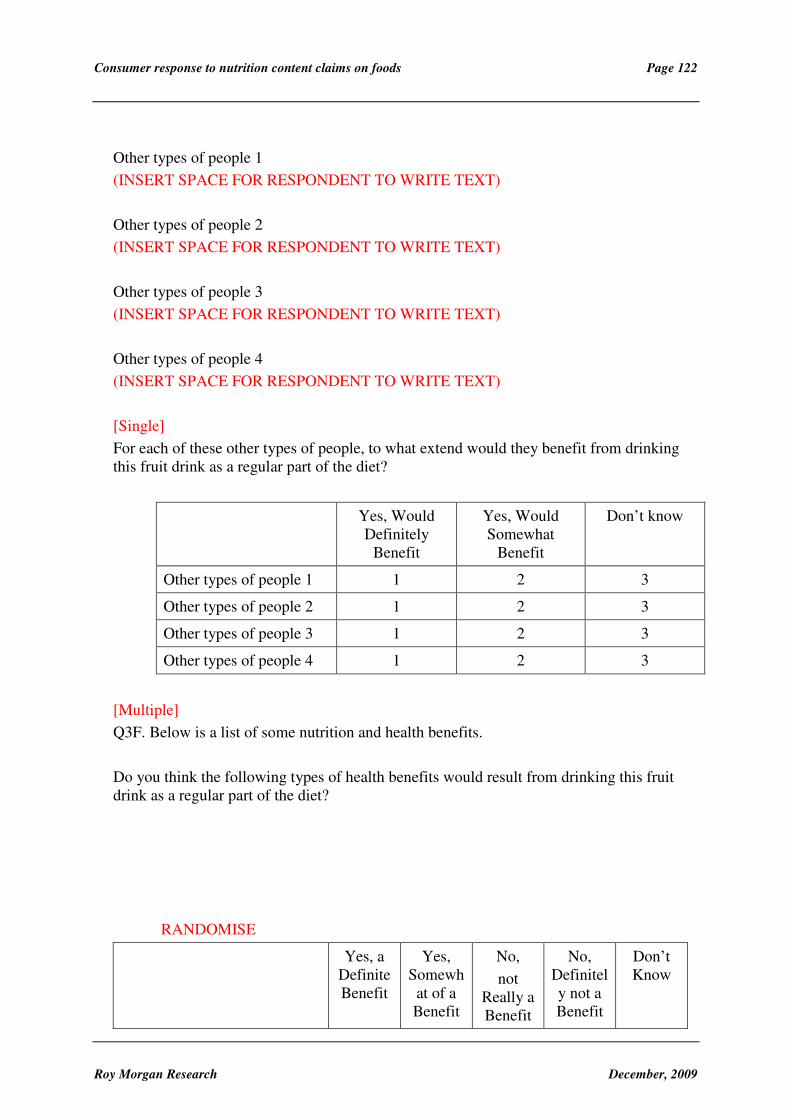
Consumer response to nutrition content claims on foods Page 122
Roy Morgan Research December, 2009
Other types of people 1
(INSERT SPACE FOR RESPONDENT TO WRITE TEXT)
Other types of people 2
(INSERT SPACE FOR RESPONDENT TO WRITE TEXT)
Other types of people 3
(INSERT SPACE FOR RESPONDENT TO WRITE TEXT)
Other types of people 4
(INSERT SPACE FOR RESPONDENT TO WRITE TEXT)
[Single]
For each of these other types of people, to what extend would they benefit from drinking this fruit drink as a regular part of the diet?
Yes, Would Definitely
Benefit
Yes, Would Somewhat
Benefit
Don’t know
Other types of people 1 1 2 3
Other types of people 2 1 2 3
Other types of people 3 1 2 3
Other types of people 4 1 2 3
[Multiple]
Q3F. Below is a list of some nutrition and health benefits.
Do you think the following types of health benefits would result from drinking this fruit drink as a regular part of the diet?
RANDOMISE
Yes, a Definite Benefit
Yes, Somewh
at of a Benefit
No,
not Really a Benefit
No, Definitely not a Benefit
Don’t Know

Consumer response to nutrition content claims on foods Page 123
Roy Morgan Research December, 2009
Healthy bones and teeth 1 2 3 4 99
More energy from food 1 2 3 4 99
Healthy blood cells 1 2 3 4 99
Preventing cold or flu 1 2 3 4 99
Protection of body’s cells from some types of damage
1 2 3 4 99
Good eyesight 1 2 3 4 99
Healthy pregnancy 1 2 3 4 99
Healthy kidney function 1 2 3 4 99
A reduced risk of cancer 1 2 3 4 99
Healthy blood pressure 1 2 3 4 99
Healthy thyroid function 1 2 3 4 99
A reduced risk of diabetes 1 2 3 4 99
Healthy immune function 1 2 3 4 99
Healthy digestion 1 2 3 4 99
[Multiple]
Are there any other types of health benefits from drinking this fruit drink as a regular part of the diet? If yes, please specify in boxes below (one per box):
Other types of health benefits 1
(INSERT SPACE FOR RESPONDENT TO WRITE TEXT)
Other types of health benefits 2
(INSERT SPACE FOR RESPONDENT TO WRITE TEXT)
Other types of health benefits 3
(INSERT SPACE FOR RESPONDENT TO WRITE TEXT)
Other types of health benefits 4
(INSERT SPACE FOR RESPONDENT TO WRITE TEXT)
[Single]
For each type of health benefit you listed, to what extend do you think this health benefit would result from drinking this fruit drink?
Yes, Would Definitely
Yes, Would Somewhat
Don’t know
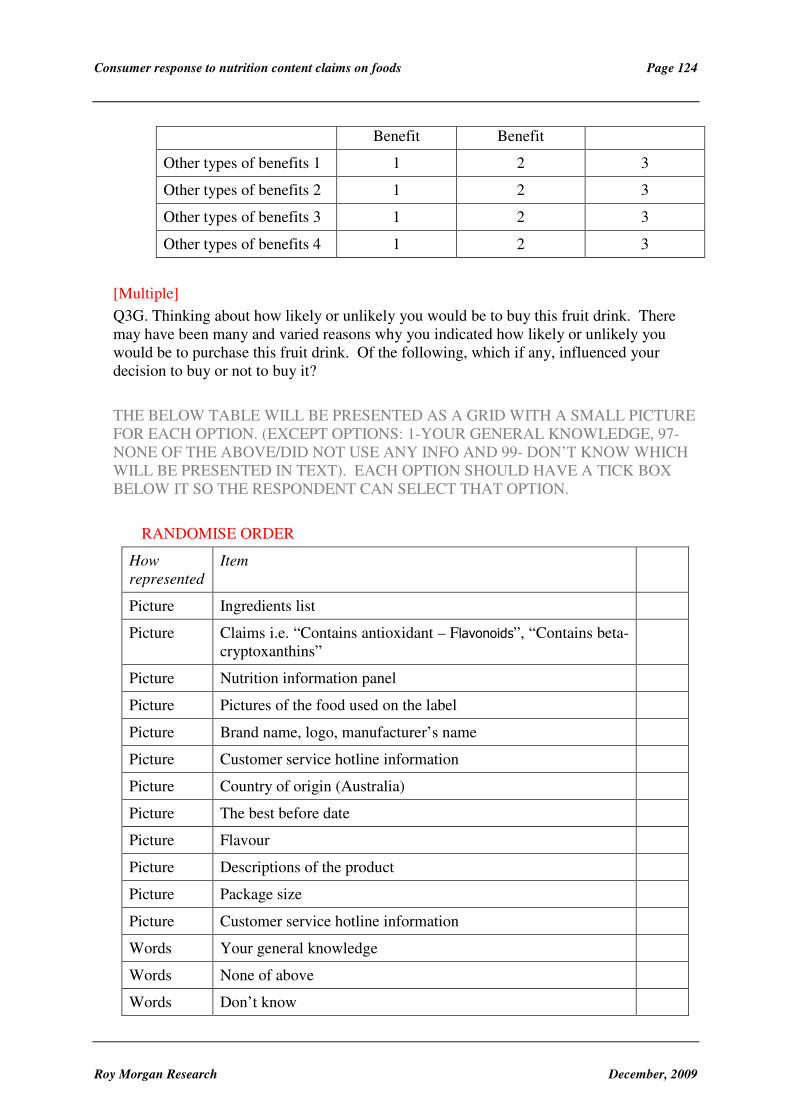
Consumer response to nutrition content claims on foods Page 124
Roy Morgan Research December, 2009
Benefit Benefit
Other types of benefits 1 1 2 3
Other types of benefits 2 1 2 3
Other types of benefits 3 1 2 3
Other types of benefits 4 1 2 3
[Multiple]
Q3G. Thinking about how likely or unlikely you would be to buy this fruit drink. There may have been many and varied reasons why you indicated how likely or unlikely you would be to purchase this fruit drink. Of the following, which if any, influenced your decision to buy or not to buy it?
THE BELOW TABLE WILL BE PRESENTED AS A GRID WITH A SMALL PICTURE FOR EACH OPTION. (EXCEPT OPTIONS: 1-YOUR GENERAL KNOWLEDGE, 97- NONE OF THE ABOVE/DID NOT USE ANY INFO AND 99- DON’T KNOW WHICH WILL BE PRESENTED IN TEXT). EACH OPTION SHOULD HAVE A TICK BOX BELOW IT SO THE RESPONDENT CAN SELECT THAT OPTION.
RANDOMISE ORDER
How
represented
Item
Picture Ingredients list
Picture Claims i.e. “Contains antioxidant – Flavonoids”, “Contains beta-cryptoxanthins”
Picture Nutrition information panel
Picture Pictures of the food used on the label
Picture Brand name, logo, manufacturer’s name
Picture Customer service hotline information
Picture Country of origin (Australia)
Picture The best before date
Picture Flavour
Picture Descriptions of the product
Picture Package size
Picture Customer service hotline information
Words Your general knowledge
Words None of above
Words Don’t know

Consumer response to nutrition content claims on foods Page 125
Roy Morgan Research December, 2009
Did you use any other types of information?
97. Yes (Please Specify in box below) [open-ended] 98. No
ENDIF
You are about to see an image of potato chips that you might buy at your local supermarket. Please look at this image in the same manner, and for as long as you would normally look at a similar product in a store situation.
INSERT SCREEN THAT CONTAINS AN IMAGE OF A POTATO CHIP PACK (RANDOMISED FOR ALL FOUR FOOD PRODUCTS). SCREEN WILL CONTAIN AN OPTIONAL LINK TO EITHER ANOTHER SCREEN OR A POP UP WINDOW THAT DISPLAYS THE BACK OF THE PRODUCT. THE RESPONDENT WILL BE ABLE TO TOGGLE BETWEEN THE 2 SCREENS. MULTIPLE TIMERS WILL BE ATTACHED TO THE ‘BACK VIEW’ SO THAT THE TOTAL TIME THE RESPONDENT SPENDS VIEWING THE BACK OF THE IMAGE CAN BE RECORDED AND AGGREGATED.
Q4. Thinking about the potato chips you have just seen:
[Single]
Q4A. How likely is it that you would purchase these potato chips?
1
Not at all
likely
2 3 4 5 6 7
Very likely
99
Don’t know
[Single]
Q4B. Assuming this product has a cost that is similar to others on the market, how likely is it that you would purchase these potato chips?
1
Not at all
likely
2 3 4 5 6 7
Very likely
99
Don’t know
[Single]
Q4C. How would you rate the nutritiousness of these potato chips?
1 2 3 4 5 6 7 99

Consumer response to nutrition content claims on foods Page 126
Roy Morgan Research December, 2009
Poor Good Don’t know
[Single]
Q4D. What is your overall attitude towards the nutrition content of these potato chips?
1
Unfavourable
2 3 4 5 6 7
Favourable
99
Don’t know
[Multiple]
Q4E. Below is a list of some types of people. For each one, do you think they would or would not benefit from eating these potato chips as a regular part of the diet?
RANDOMISE
Yes, Would
Definitely Benefit
Yes, Would
Somewhat Benefit
No, Would
Probably Not
Benefit
No, Would
Definitely Not
Benefit
Don’t Know
Women 1 2 3 4 99
Men 1 2 3 4 99
Children 1 2 3 4 99
Pregnant women 1 2 3 4 99
Older people 1 2 3 4 99
People trying to lose weight
1 2 3 4 99
People with particular health problems
1 2 3 4 99
[Multiple]
Are there any other types of people who would benefit from drinking these potato chips as a regular part of their diet? If yes, please specify in boxes below (one per box):
Other types of people 1
(INSERT SPACE FOR RESPONDENT TO WRITE TEXT)
Other types of people 2
(INSERT SPACE FOR RESPONDENT TO WRITE TEXT)

Consumer response to nutrition content claims on foods Page 127
Roy Morgan Research December, 2009
Other types of people 3
(INSERT SPACE FOR RESPONDENT TO WRITE TEXT)
Other types of people 4
(INSERT SPACE FOR RESPONDENT TO WRITE TEXT)
[Single]
For each of these other types of people, to what extend would they benefit from eating these potato chips as a regular part of the diet?
Yes, Would Definitely
Benefit
Yes, Would Somewhat
Benefit
Don’t know
Other types of people 1 1 2 3
Other types of people 2 1 2 3
Other types of people 3 1 2 3
Other types of people 4 1 2 3
[Multiple]
Q4F. Below is a list of some nutrition and health benefits.
Do you think the following types of health benefits would result from eating these potato chips as a regular part of the diet?
RANDOMISE
Yes, a Definite Benefit
Yes, Somewh
at of a Benefit
No,
not Really a Benefit
No, Definitely not a Benefit
Don’t Know
Healthy bones and teeth 1 2 3 4 99
More energy from food 1 2 3 4 99
Healthy blood cells 1 2 3 4 99
Preventing cold or flu 1 2 3 4 99
Protection of body’s cells from some types of damage
1 2 3 4 99
Good eyesight 1 2 3 4 99
Healthy pregnancy 1 2 3 4 99
Healthy kidney function 1 2 3 4 99
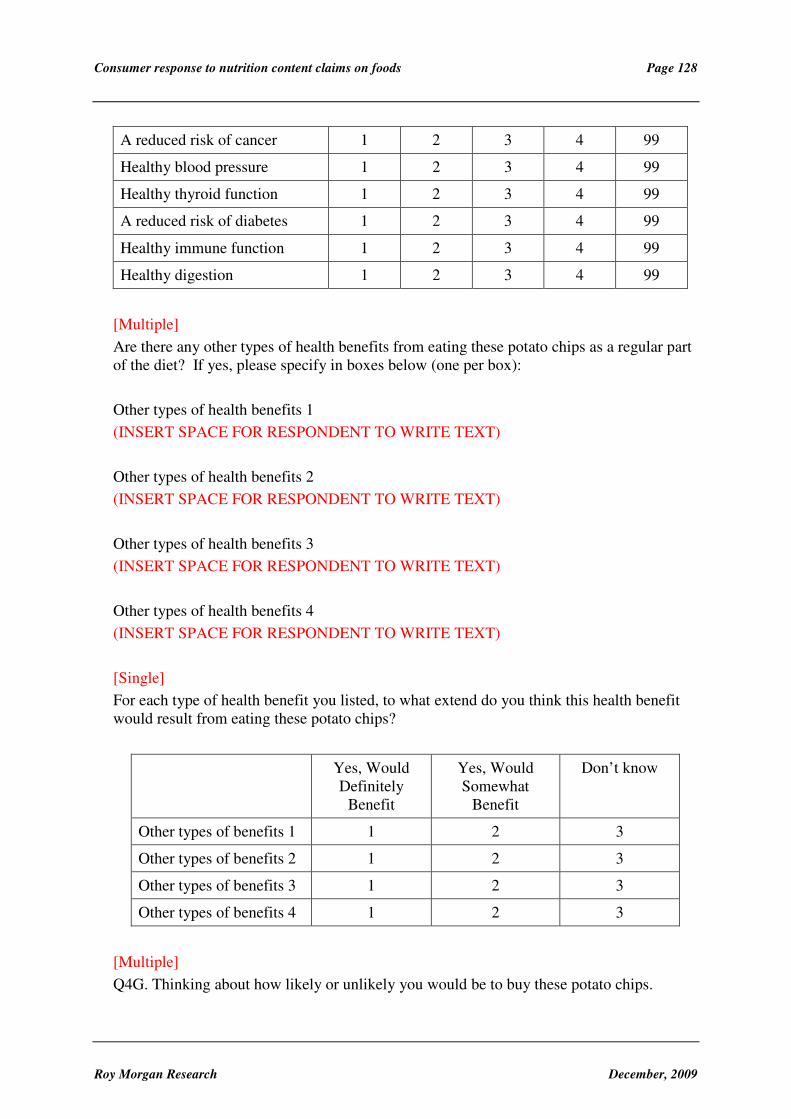
Consumer response to nutrition content claims on foods Page 128
Roy Morgan Research December, 2009
A reduced risk of cancer 1 2 3 4 99
Healthy blood pressure 1 2 3 4 99
Healthy thyroid function 1 2 3 4 99
A reduced risk of diabetes 1 2 3 4 99
Healthy immune function 1 2 3 4 99
Healthy digestion 1 2 3 4 99
[Multiple]
Are there any other types of health benefits from eating these potato chips as a regular part of the diet? If yes, please specify in boxes below (one per box):
Other types of health benefits 1
(INSERT SPACE FOR RESPONDENT TO WRITE TEXT)
Other types of health benefits 2
(INSERT SPACE FOR RESPONDENT TO WRITE TEXT)
Other types of health benefits 3
(INSERT SPACE FOR RESPONDENT TO WRITE TEXT)
Other types of health benefits 4
(INSERT SPACE FOR RESPONDENT TO WRITE TEXT)
[Single]
For each type of health benefit you listed, to what extend do you think this health benefit would result from eating these potato chips?
Yes, Would Definitely
Benefit
Yes, Would Somewhat
Benefit
Don’t know
Other types of benefits 1 1 2 3
Other types of benefits 2 1 2 3
Other types of benefits 3 1 2 3
Other types of benefits 4 1 2 3
[Multiple]
Q4G. Thinking about how likely or unlikely you would be to buy these potato chips.
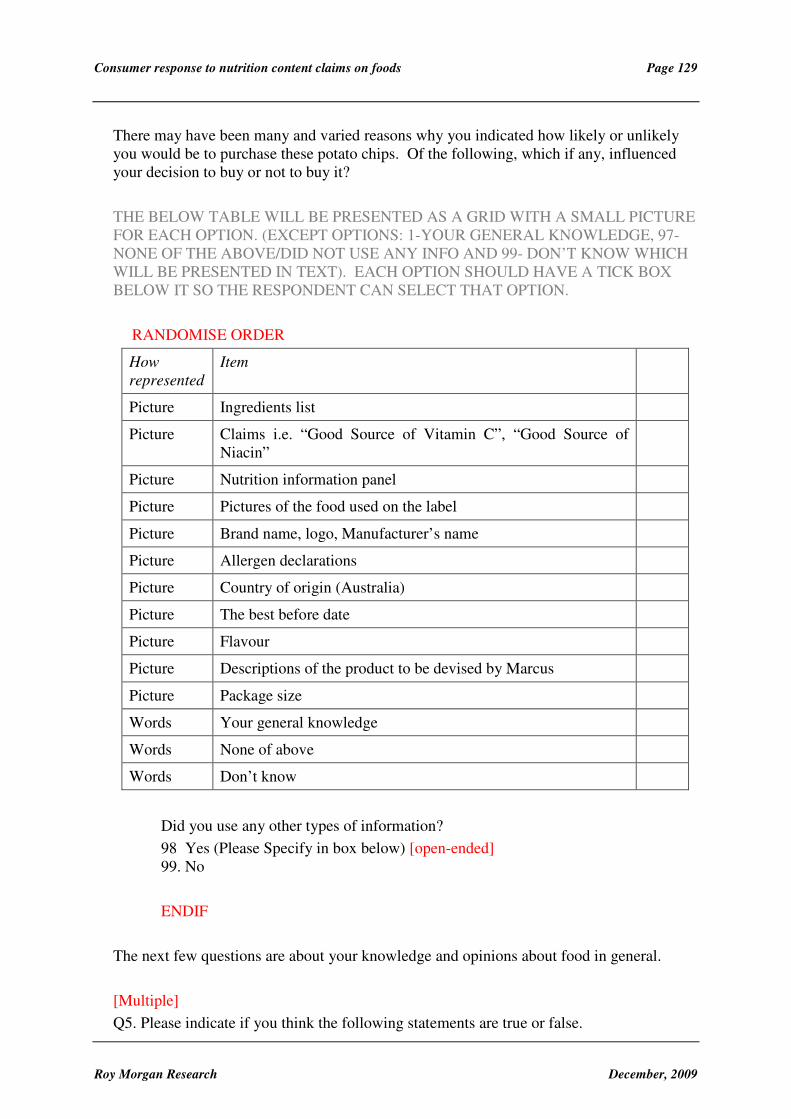
Consumer response to nutrition content claims on foods Page 129
Roy Morgan Research December, 2009
There may have been many and varied reasons why you indicated how likely or unlikely you would be to purchase these potato chips. Of the following, which if any, influenced your decision to buy or not to buy it?
THE BELOW TABLE WILL BE PRESENTED AS A GRID WITH A SMALL PICTURE FOR EACH OPTION. (EXCEPT OPTIONS: 1-YOUR GENERAL KNOWLEDGE, 97- NONE OF THE ABOVE/DID NOT USE ANY INFO AND 99- DON’T KNOW WHICH WILL BE PRESENTED IN TEXT). EACH OPTION SHOULD HAVE A TICK BOX BELOW IT SO THE RESPONDENT CAN SELECT THAT OPTION.
RANDOMISE ORDER
How
represented
Item
Picture Ingredients list
Picture Claims i.e. “Good Source of Vitamin C”, “Good Source of Niacin”
Picture Nutrition information panel
Picture Pictures of the food used on the label
Picture Brand name, logo, Manufacturer’s name
Picture Allergen declarations
Picture Country of origin (Australia)
Picture The best before date
Picture Flavour
Picture Descriptions of the product to be devised by Marcus
Picture Package size
Words Your general knowledge
Words None of above
Words Don’t know
Did you use any other types of information?
98 Yes (Please Specify in box below) [open-ended] 99. No
ENDIF
The next few questions are about your knowledge and opinions about food in general.
[Multiple]
Q5. Please indicate if you think the following statements are true or false.
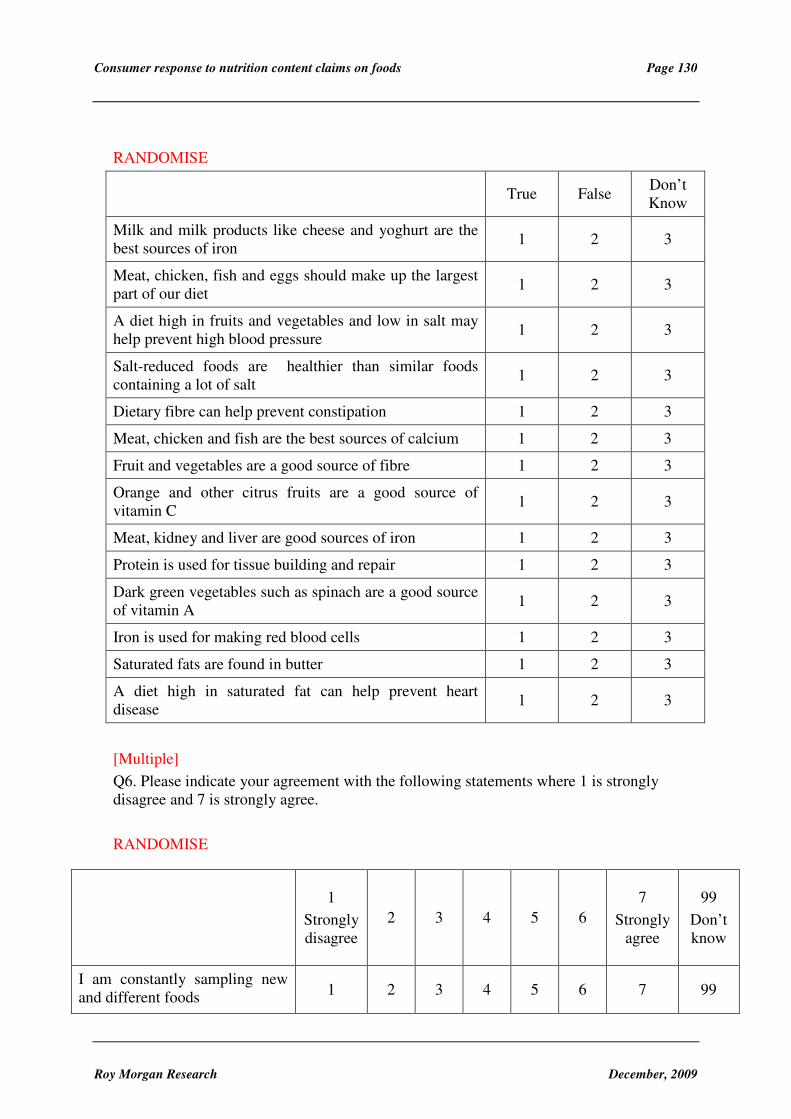
Consumer response to nutrition content claims on foods Page 130
Roy Morgan Research December, 2009
RANDOMISE
True False
Don’t Know
Milk and milk products like cheese and yoghurt are the best sources of iron
1 2 3
Meat, chicken, fish and eggs should make up the largest part of our diet
1 2 3
A diet high in fruits and vegetables and low in salt may help prevent high blood pressure
1 2 3
Salt-reduced foods are healthier than similar foods containing a lot of salt
1 2 3
Dietary fibre can help prevent constipation 1 2 3
Meat, chicken and fish are the best sources of calcium 1 2 3
Fruit and vegetables are a good source of fibre 1 2 3
Orange and other citrus fruits are a good source of vitamin C
1 2 3
Meat, kidney and liver are good sources of iron 1 2 3
Protein is used for tissue building and repair 1 2 3
Dark green vegetables such as spinach are a good source of vitamin A
1 2 3
Iron is used for making red blood cells 1 2 3
Saturated fats are found in butter 1 2 3
A diet high in saturated fat can help prevent heart disease
1 2 3
[Multiple]
Q6. Please indicate your agreement with the following statements where 1 is strongly disagree and 7 is strongly agree.
RANDOMISE
1
Strongly disagree
2 3 4 5 6
7
Strongly agree
99
Don’t know
I am constantly sampling new and different foods
1 2 3 4 5 6 7 99

Consumer response to nutrition content claims on foods Page 131
Roy Morgan Research December, 2009
[Multiple]
Q8. Do any of the following apply to you or any members of your household?
RANDOMISE
Food allergy 1
Other health concerns such as asthma, diabetes, migraine 2
Digestive concerns such as coeliac disease, irritable bowel syndrome 3
Health concerns such as heart disease, high blood pressure or cholesterol
4
On a specific diet 5
Watching my weight or others’ weight generally 6
Watching my health or others’ health generally 7
Pregnancy or breast feeding 8
Religious or ethical beliefs that influence dietary choices, 9
Vegetarian or vegan diet 10
Any others? IF YES, PLEASE SPECIFY: (INSERT SPACE FOR RESPONDENT TO INPUT TEXT)
96
None 97
Prefer not to answer 98
[Multiple]
Q9. How frequently do you eat the following foods?
I don’t trust new foods 1 2 3 4 5 6 7 99
If I don’t know what is in a food, I won’t try it
1 2 3 4 5 6 7 99
I am afraid to eat things I have never had before
1 2 3 4 5 6 7 99
I am very particular about the foods I will eat
1 2 3 4 5 6 7 99
I will eat almost anything 1 2 3 4 5 6 7 99
I am more interested in the fat, salt and sugar content of foods than the vitamin and mineral content
1 2 3 4 5 6 7 99

Consumer response to nutrition content claims on foods Page 132
Roy Morgan Research December, 2009
RANDOMISE
Never Less than
once a month
Once a month
Once a week
Once a day
More than
once a day
Potato chips 1 2 3 4 5 6
Frozen meals, e.g. lasagne
1 2 3 4 5 6
Ice cream 1 2 3 4 5 6
Fruit drinks 1 2 3 4 5 6
[Multiple]
Q9A. How frequently do you buy the following foods?
RANDOMISE
Never Less than
once a month
Once a month
Once a week
Once a day
More than
once a day
Potato chips 1 2 3 4 5 6
Frozen meals, e.g. lasagne
1 2 3 4 5 6
Ice cream 1 2 3 4 5 6
Fruit drinks 1 2 3 4 5 6
[Single]
Q10. How would you rate your knowledge of the functions of the following micronutrients?
RANDOMISE
1
Not at all knowledge-able
2 3 4 5 6 7
Extremely knowledge-
able
99 Don’t Know
Beta-cryptoxanthins
1 2 3 4 5 6 7 99
Niacin 1 2 3 4 5 6 7 99
Antioxidants (e.g. flavonoids)
1 2 3 4 5 6 7 99
Vitamin C 1 2 3 4 5 6 7 99

Consumer response to nutrition content claims on foods Page 133
Roy Morgan Research December, 2009
Calcium 1 2 3 4 5 6 7 99
Iron 1 2 3 4 5 6 7 99
Phosphorus 1 2 3 4 5 6 7 99
Selenium 1 2 3 4 5 6 7 99
[Single]
Q11. How would you rate your familiarity with the following micronutrients?
RANDOMISE
1
Not at all familiar
2 3 4 5 6 7
Extremely familiar
99
Don’t know
Beta-cryptoxanthins
1 2 3 4 5 6 7 99
Niacin 1 2 3 4 5 6 7 99
Antioxidants (e.g. flavonoids)
1 2 3 4 5 6 7 99
Vitamin C 1 2 3 4 5 6 7 99
Calcium 1 2 3 4 5 6 7 99
Iron 1 2 3 4 5 6 7 99
Phosphorus 1 2 3 4 5 6 7 99
Selenium 1 2 3 4 5 6 7 99
[Single]
Q12. Thinking now about the nutritional information on food packages, how interested are you in nutritional information on food packages?
1
Not at all interested
2 3 4 5 6 7
Very interested
99
Don’t know
[Single]
Q13. Thinking about nutrition labels on products, how much do you care about reading nutrition labels?

Consumer response to nutrition content claims on foods Page 134
Roy Morgan Research December, 2009
1
Not at all
2 3 4 5 6 7
Very much
99
Don’t know
[Multiple]
D1. Including yourself, how many people living in your household belong to the following age groups?
18 years and over
15-17 years
Less than 15 years
[Single]
D2. How much attention do you pay to keeping a healthy diet?
1. Very high amount of attention 2. High amount of attention 3. Medium amount of attention 4. Low amount of attention 5. Very low amount of attention 6. No attention
97. Don’t know
[Single]
D2A. Thinking about serves of vegetables you eat each day. One serve amounts to half a cup of cooked vegetables, or one cup of salad vegetables. How many serves do you usually eat each day?
1 serve or less 1
2 serves 2
3 serves 3
4 serves 4
5 serves 5
6 serves or more 6
Don’t eat vegetables 7
[Single]
D2B. Thinking about serves of fruit you eat each day. One serve amounts to one medium piece of fresh fruit, two small pieces of fresh fruit, half a cup of canned fruit, or half a cup of fruit juice. How many serves do you usually eat each day?
1 serve or less 1
2 serves 2

Consumer response to nutrition content claims on foods Page 135
Roy Morgan Research December, 2009
3 serves 3
4 serves 4
5 serves 5
6 serves or more 6
Don’t eat fruit 7
ASKIF: AUSTRALIAN SAMPLE ONLY
[Single]
D3A. Are you of Aboriginal or Torres Strait Islander origin?
1. No 2. Yes, Aboriginal 3. Yes, Torres Strait Islander 4. Both Aboriginal and Torres Strait Islander
98. Prefer not to answer
[Single]
D4A. What level of education is the highest you have attained?
1. Postgraduate Degree / Graduate Diploma / Graduate Certificate 2. Bachelor Degree 3. Advanced Diploma / Diploma / Certificate 4. Year 12 or Senior Certification/6th Form/Matriculation/Higher School
Certificate (H.S.C. or V.C.E) 5. Year 11/5th Form 6. Year 10/4th Form or below
96. Other (specify)
97. None of the above
98. Prefer not to answer
ENDIF
ASKIF: NEW ZEALAND SAMPLE ONLY
[Single]
D3B. Are you descended from a New Zealand Maori or do you belong to a Pacific Islander ethnic group?
1. Yes, a New Zealand Maori descendent 2. Yes, of Pacific Islander ethnicity 3. Both Maori and Pacific Islander ethnicity 4. Neither
98. Prefer not to answer
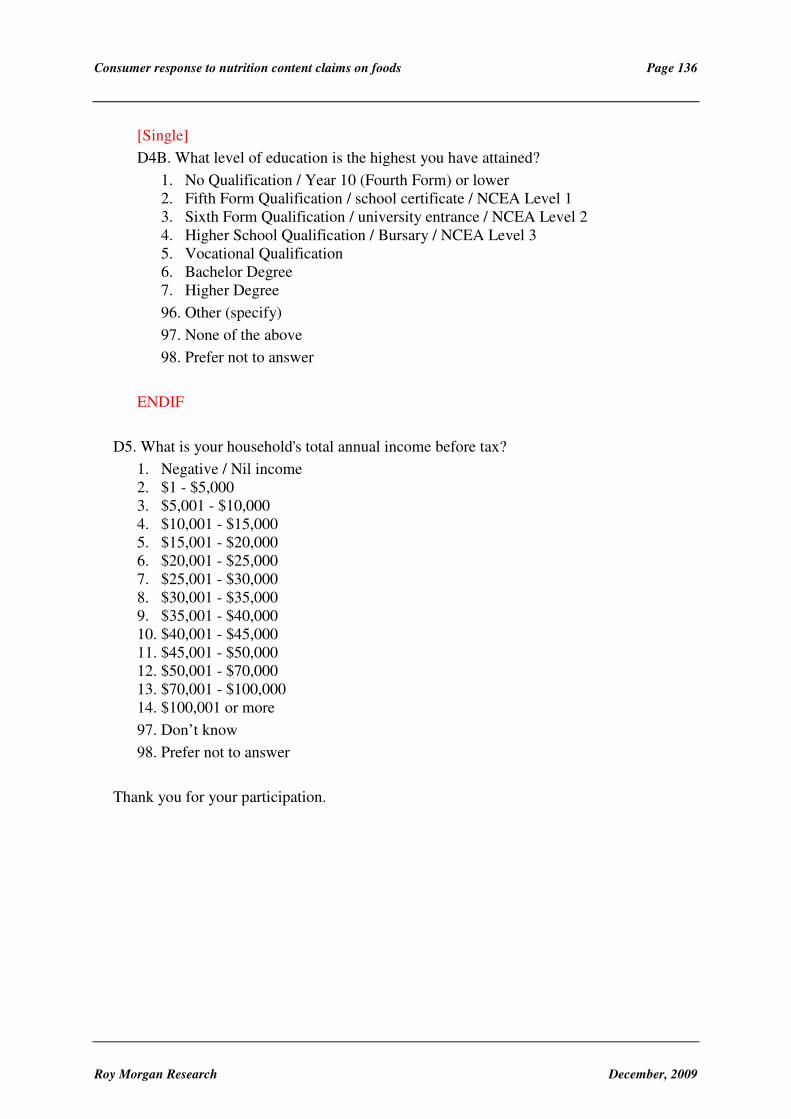
Consumer response to nutrition content claims on foods Page 136
Roy Morgan Research December, 2009
[Single]
D4B. What level of education is the highest you have attained?
1. No Qualification / Year 10 (Fourth Form) or lower 2. Fifth Form Qualification / school certificate / NCEA Level 1 3. Sixth Form Qualification / university entrance / NCEA Level 2 4. Higher School Qualification / Bursary / NCEA Level 3 5. Vocational Qualification 6. Bachelor Degree 7. Higher Degree
96. Other (specify)
97. None of the above
98. Prefer not to answer
ENDIF
D5. What is your household's total annual income before tax?
1. Negative / Nil income 2. $1 - $5,000 3. $5,001 - $10,000 4. $10,001 - $15,000 5. $15,001 - $20,000 6. $20,001 - $25,000 7. $25,001 - $30,000 8. $30,001 - $35,000 9. $35,001 - $40,000 10. $40,001 - $45,000 11. $45,001 - $50,000 12. $50,001 - $70,000 13. $70,001 - $100,000 14. $100,001 or more
97. Don’t know
98. Prefer not to answer
Thank you for your participation.