
Consumer Trust and Perceived Risk in B2C E Commerce
61
Consumer Trust and Perceived Risk in B2C E-Commerce
-
Upload
tanzir-islam -
Category
Mobile
-
view
212 -
download
3
Transcript of Consumer Trust and Perceived Risk in B2C E Commerce

Consumer Trust and Perceived Risk in
B2C E-Commerce

PREPARED BY
Samiha Majid RH 01
Shafqat Aurin Siddiqua RH 04
Mastura Tasnim RH 08
Chowdhury Ashiqur Rahman ZR 24
Joya Chowdhury RH 26
Md. Danial Rafi ZR 27
Silma Subah Ahmed RH 46
Rakib Ibnay Hossain ZR 47
Tanzir Islam ZR 51
Shaadmaan Ahmed Siddiqui ZR 58
GROUP 2 BBA BATCH 21, SECTION A
PREPARED FORDr. Muhammad Z Mamun
ProfessorInstitute Of Business Administration
University Of Dhaka
CONTENTS
3
LITERATURE REVIEW
INTRODUCTION METHODOLOGY RESEARCH FINDINGS
CONCLUSION
1 2 3 4 5

INTRODUCTION

1 INTRODUCTION
5
1.1 BROAD OBJECTIVE
To investigate the effect of consumer trust and perception
of risk on buying intent via e-commerce

1 INTRODUCTION
6
1.2 SPECIFIC OBJECTIVE
To gauge the effect of known vendors or brands on consumers’ trust.
To measure the effect of perception of privacy of information on a consumer’s trust
To understand the impact of perceived financial risk on consumers’ trust

METHODOLOGY

2 METHODOLOGY
8
Questionnaire Responses
Phone Interviews
Journals
Articles
Reports
Books
PRIMARY SOURCES SECONDARY SOURCES
2.1 DATA COLLECTION

2 METHODOLOGY
9
2.2 SAMPLING METHODS
CONVENIENT JUDGEMENTAL

2 METHODOLOGY
10
2.3 SAMPLE SIZE
273 RESPONDENTS SHOULD BE INTERVIEWED
WE APPROACHED ONLY 140 RESPONDENTS
USE E COMMERCE SERVICES
PRESICION LEVEL COMES TO 7%
AT 5% PRECISION LEVEL
DUE TO CONSTRAINTS
114 OUT OF 140 RESPONDENTS

2 METHODOLOGY
11
2.4 QUESTIONNAIRE DEVELOPMENT
INSTRUCTIONS
IDENTIFICATION DATA
REQUEST FOR COOPERATION

2 METHODOLOGY
12
2.5 INFORMATION SOUGHT
Respondent’s
Orientation To
E Commerce
Effect Of Brand
In Perceived
Value And Trust
Effect Of Site
Reputation On
Buying Intent
Effects Of
Privacy In
Perceived Value
And Trust
Effects Of
Perceived
Financial Risk
PART A PART B PART C PART D PART E

2 METHODOLOGY
13
2.6 VALIDITY CHECK
Measures what it is supposed to measure
Direct Measure= Self Evident
Indirect Measure= Only Approximate
We have chosen Face Validity
i.e. items chosen to measure a variable are logically related to it

2 METHODOLOGY
14
2.7 REALIBILITY OF DATA
Reliability Statistics (Cronbach’s Alpha and Split Half Technique)Cronbach's Alpha Part 1 Value .879
N of Items 9a
Part 2 Value .733N of Items 8b
Total N of Items 17Correlation Between Forms .374Spearman-Brown Coefficient Equal Length .544
Unequal Length .545Guttman Split-Half Coefficient .482
Cronbach’s Alpha
0.502 (Regular)
0.600 (Standardized Items)

LITERATURE REVIEW

3 INDUSTRY OVERVIEW
16
3.1 FINDINGS
Only 7% penetration per population
Expected rise from Tk. 450 mil to Tk. 2000 mil
Started from 1980s
1
2
3

3 INDUSTRY OVERVIEW
17
3.2 E COMMERCE VS. BRICK AND MORTAR
E COMMERCE BRICK & MORTAREase Of Use Tryout Possible
Pricing Very Crucial Shelf PositioningTime Lag Immediate Consumption
Solitary Activity Can Be A Social Activity

FACTORS INFLUENCING TRUST IN E- COMMERCE
18
3 KEY COMPONENTS
BRAND PRIVACY PRICING

RESEARCH FINDINGS

4 E-COMMERCE PENETRATION
20
140 Total Respondents
123 Are Aware
114 Avail Of E-commerce Services
AWARENESS TO USAGE RATIO 92.7%
AWARENESS TO USAGE RATIO
AWARE USERS
NON-AWARE USERS
4.1-3 E-COMMERCE AWARENESS & USAGE
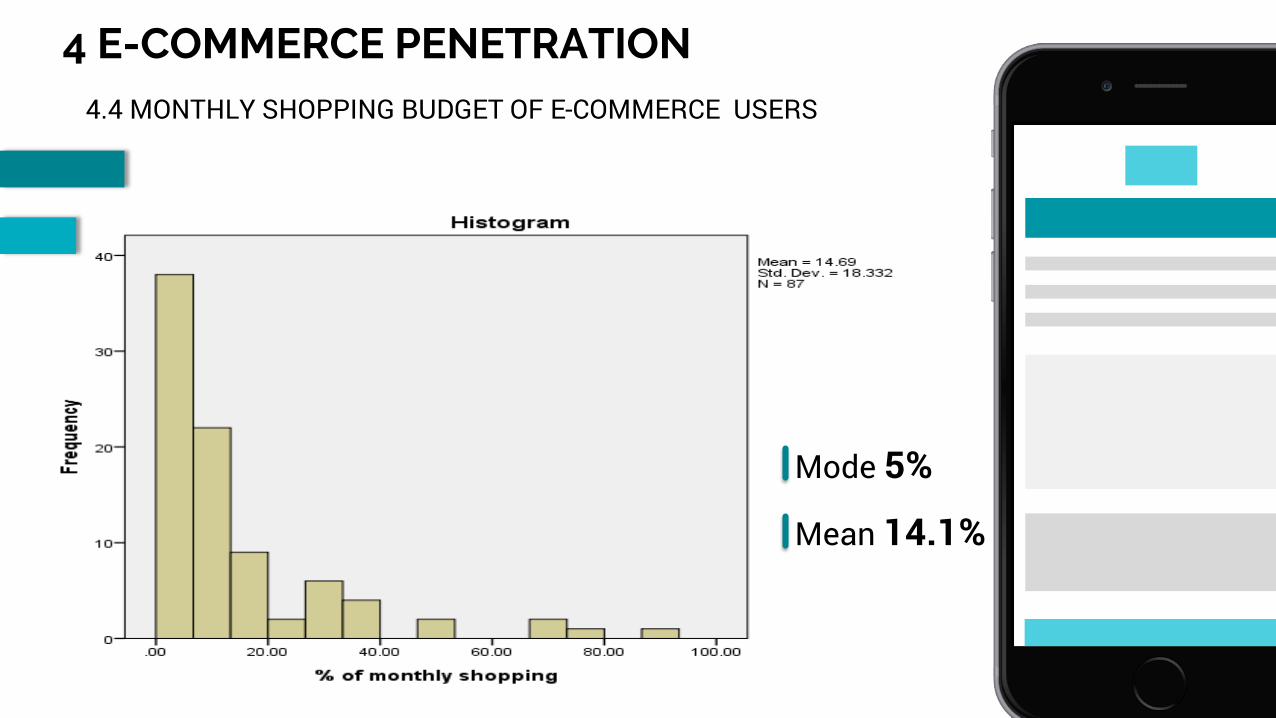
4 E-COMMERCE PENETRATION
21
4.4 MONTHLY SHOPPING BUDGET OF E-COMMERCE USERS
Mode 5%
Mean 14.1%

5 USER DEMOGRAPHICS
22
5.1-2 GENDER & AGE
53.5% Female : 46.5% Male
Average Age Of Users 20.8 Years
80.5% In 18-24 Age Group

23
5 USER DEMOGRAPHICS5.3-4 EDUCATION & PROFESSION
Education Demographics
Non-Graduate
Undergraduate
Graduates
74.6% Undergraduates
Profession Wise:
76.3% Students
23.7% Job Holders

6 PERCEPTION OF BRANDS
24
6.1 OVERVIEW
4 PERCEPTION OF PRODUCT QUALITY
5 PERCEPTION OF SERVICE QUALITY
6 PERCEPTION OF VALUE FOR MONEY
2 MOST PREFERRED BRANDS
3 MEASURING BRAND LOYALTY
1 NUMBER OF BRANDS PER USER

6 PERCEPTION OF BRANDS
25
6.1 NUMBER OF BRANDS PER USER
Mean 2.19

6 PERCEPTION OF BRANDS
26
6.2 MOST PREFERRED BRAND
36
19
87
43
3
21
14
Food Panda
Rokomari.com
Bikroy.com
Hungry Naki
Ekhanei.com
Akhoni.com
Banglashoppers.com
Others
No Particular Brand
24 Brands From 140 Respondents
53% Loyal To 4 Brands

6 PERCEPTION OF BRANDS
27
6.3 PERCEPTION OF PRODUCT QUALITY
Mode 8
Mean 6.29

6 PERCEPTION OF BRANDS
28
6.4 PERCEPTION OF SERVICE QUALITY
Mode 8
Mean 6.29
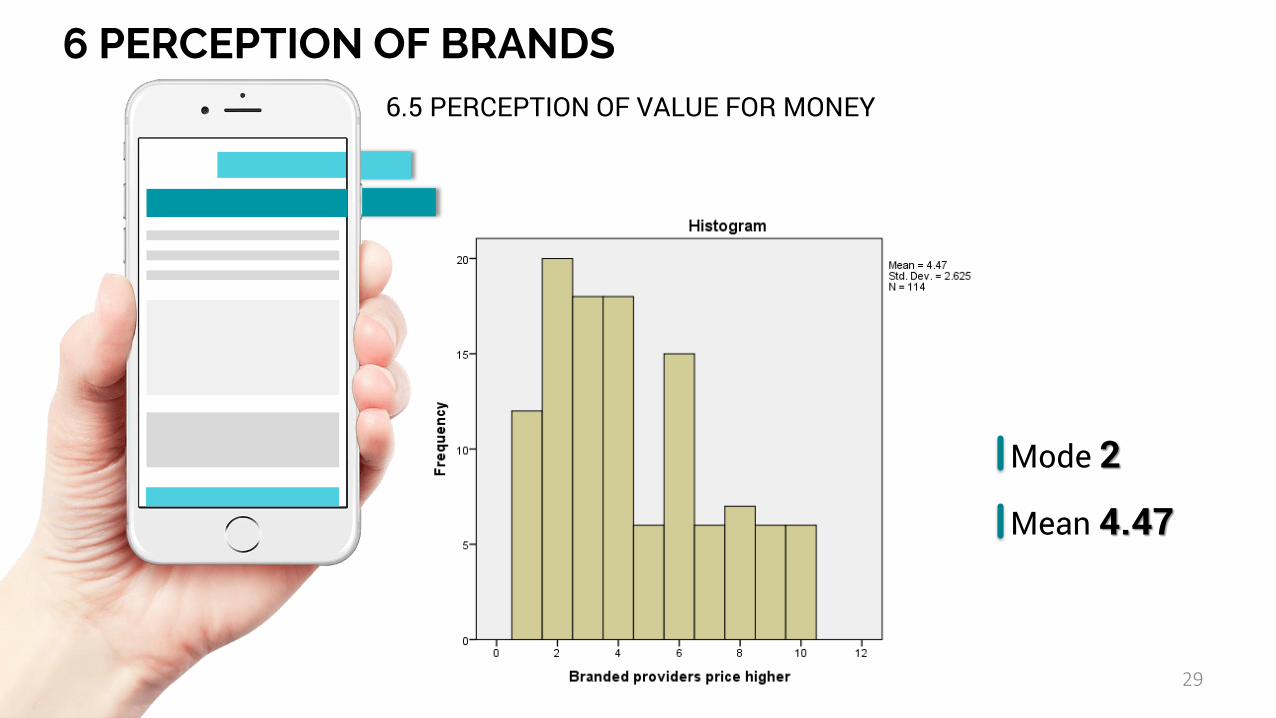
6 PERCEPTION OF BRANDS
29
6.5 PERCEPTION OF VALUE FOR MONEY
Mode 2
Mean 4.47
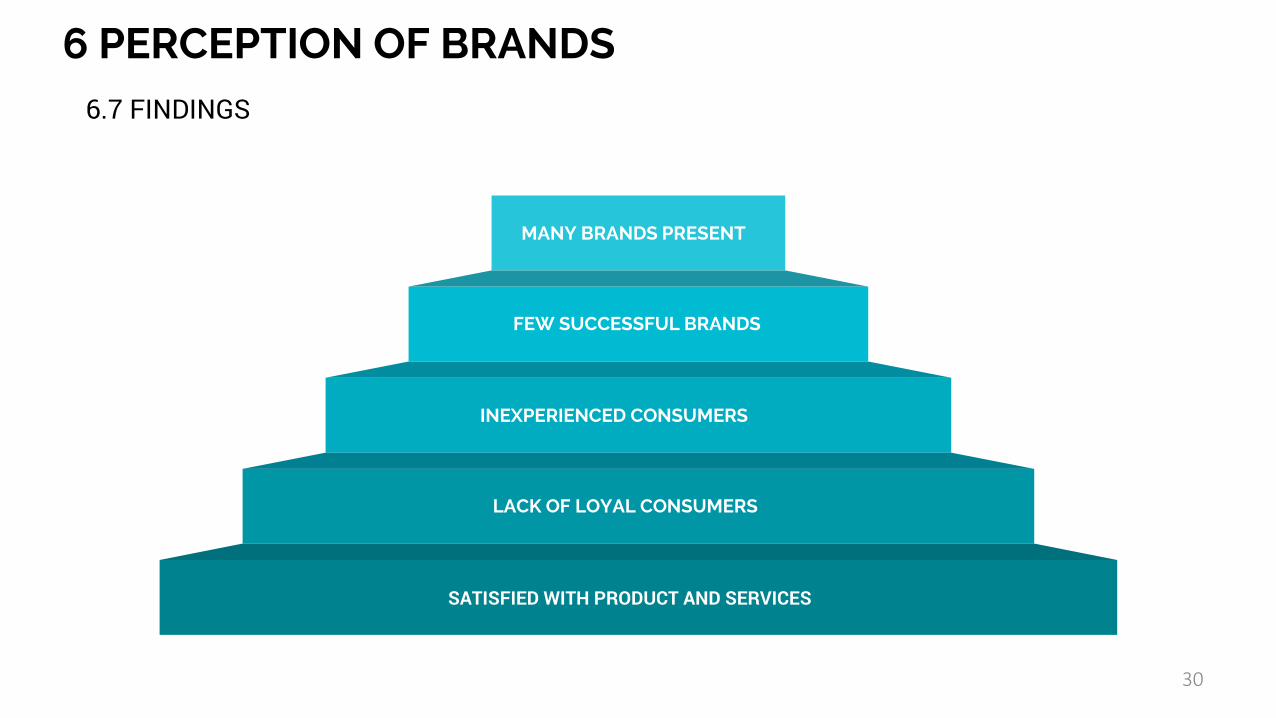
6 PERCEPTION OF BRANDS
30
LACK OF LOYAL CONSUMERS
INEXPERIENCED CONSUMERS
FEW SUCCESSFUL BRANDS
MANY BRANDS PRESENT
SATISFIED WITH PRODUCT AND SERVICES
6.7 FINDINGS

31
7 PERCEPTION OF PRIVACY OF INFORMATION7.1 LEVEL OF INFORMATION NEEDED
Detailed Moderate Minimal Total
In Number 8 95 11 114
In Percentage 7 83.3 9.6 100

32
7 PERCEPTION OF PRIVACY OF INFORMATION7.2 CUSTOMER CONTROL OVER INFORMATION SHARING
Sites Asking For Consumer Permission
Yes No N/A
22%
46%
32%
33
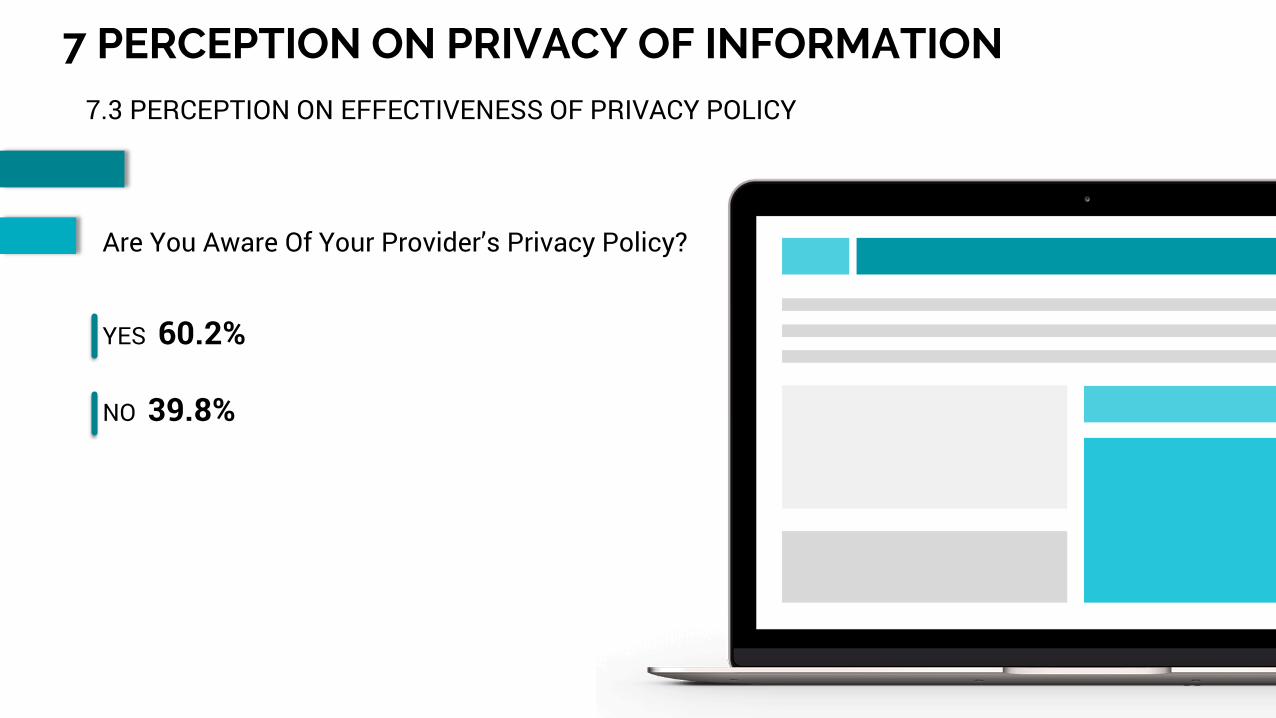
7 PERCEPTION ON PRIVACY OF INFORMATION7.3 PERCEPTION ON EFFECTIVENESS OF PRIVACY POLICY
Are You Aware Of Your Provider’s Privacy Policy?
YES 60.2%
NO 39.8%

34
7 PERCEPTION OF PRIVACY OF INFORMATION7.4 AWARENESS ABOUT PRIVACY POLICY
Mean 5.97
Mode 5

35
7 PERCEPTION OF PRIVACY OF INFORMATION7.5 MEASURE TAKEN FOR PRIVACY VIOLATION
Any Affirmative Action Taken On Behalf Of The Victims?
YES – For 5 out of 6 people who were victimized
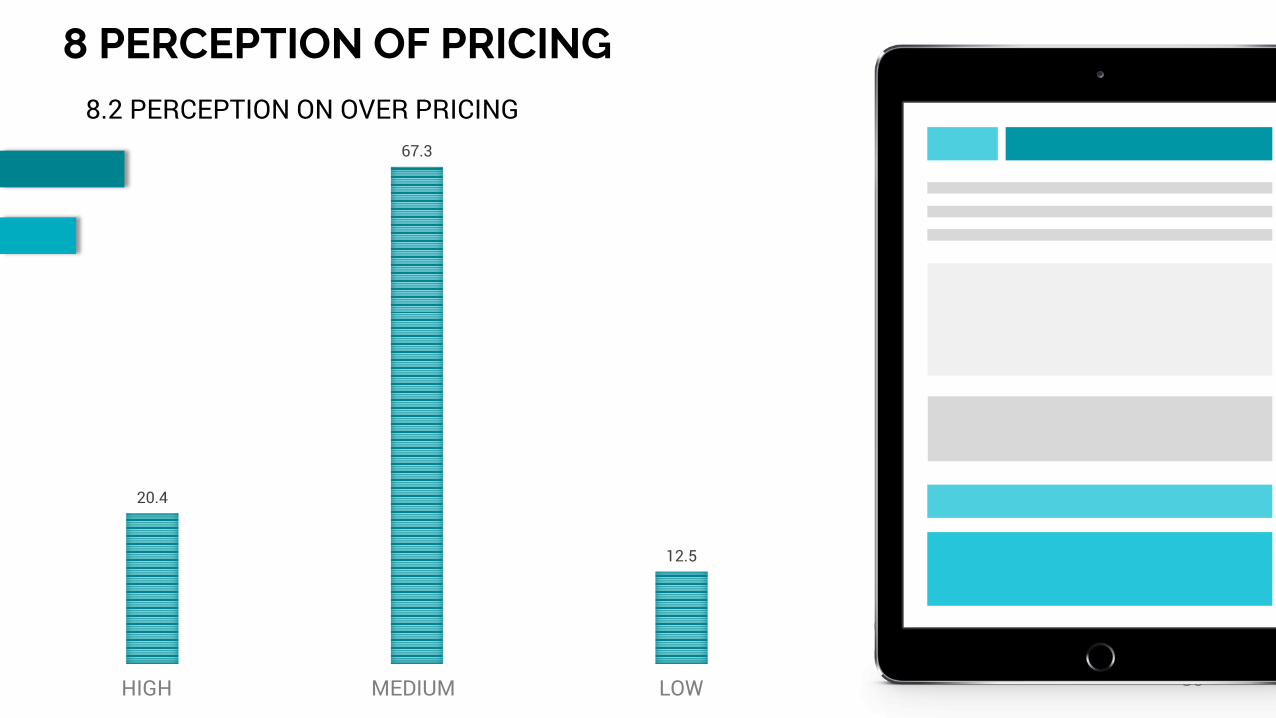
20.4
67.3
12.5
8 PERCEPTION OF PRICING
36
8.2 PERCEPTION ON OVER PRICING
HIGH MEDIUM LOW

8 PERCEPTION OF PRICING
37
8.3 PREFFERED METHOD OF FREIGHT COST
86.8%
FIXED
13.2%
PERCENTAGE BASED

8 PERCEPTION OF PRICING
38
8.4 FREIGHT COST JUSTIFIED?
Mean 5.62
Mode 5

8 PERCEPTION OF PRICING
39
8.5 OVERALL RATING
POSITIVELY SKEWED

8 PERCEPTION OF PRICING
40
8.6 FINDINGS
Moderate Perceived Over Pricing
Fixed Freight Cost Preference
Overall Positive Perception
Room For Price Sensitive Marketing
1
2
3
4

9 HYPOTHESIS TESTING
41
9.1 FINDINGS
How Do We Formulate The Sampling Distribution?
Likert scale values
Every question/variable contains a sample of the real
population
The distribution of the variable means would provide a
sample distribution

9 HYPOTHESIS TESTING
42
9.1 FINDINGS
How do we measure the population mean?
The Likert scale variables are ranged from 1 to 10
According to human perception, ‘5’ is the middle point of ‘1 to
10’

9 HYPOTHESIS TESTING
43
9.1 FINDINGS
Estimating the population mean to 5 would mean a
‘neutral’ response to the scale questions
We Start By Assuming µ=5

9 HYPOTHESIS TESTING
44
HYPOTHESIS 1: BRAND IMAGE POSITIVELY AFFECTS A CONSUMER’S TRUST
H0: µ ≥ 5; The perception of brand image positively affects a consumer’s trust
H1: µ < 5; The perception of brand image does not positively affect a consumer’s trust

9 HYPOTHESIS TESTING
45
HYPOTHESIS 1: TEST RESULTSStatistics
Likeliness to stick to the Brand in
near future
Branded Providers more reliable
Branded Providers provide better
quality
Branded providers price higher
Branded providers provide better
service
N Valid 114 114 114 114 114Missing 0 0 0 0 0
Mean 4.91 6.69 6.29 4.47 6.29Mode 3 9 8 2 8Std. Deviation 2.512 2.832 2.541 2.625 2.523
One-Sample Statistics
N Mean Std. Deviation
Std. Error Mean
Effect of Brand image in Buying Intention
5 5.7300 .97581 .43639
One-Sample TestTest Value = 5
t df Sig. (2-tailed)
Mean Difference
90% Confidence Interval of the
DifferenceLower Upper
Effect of Brand image in Buying Intention
1.673 4 .170 .73000 -.2003 1.6603
9 HYPOTHESIS TESTING
46
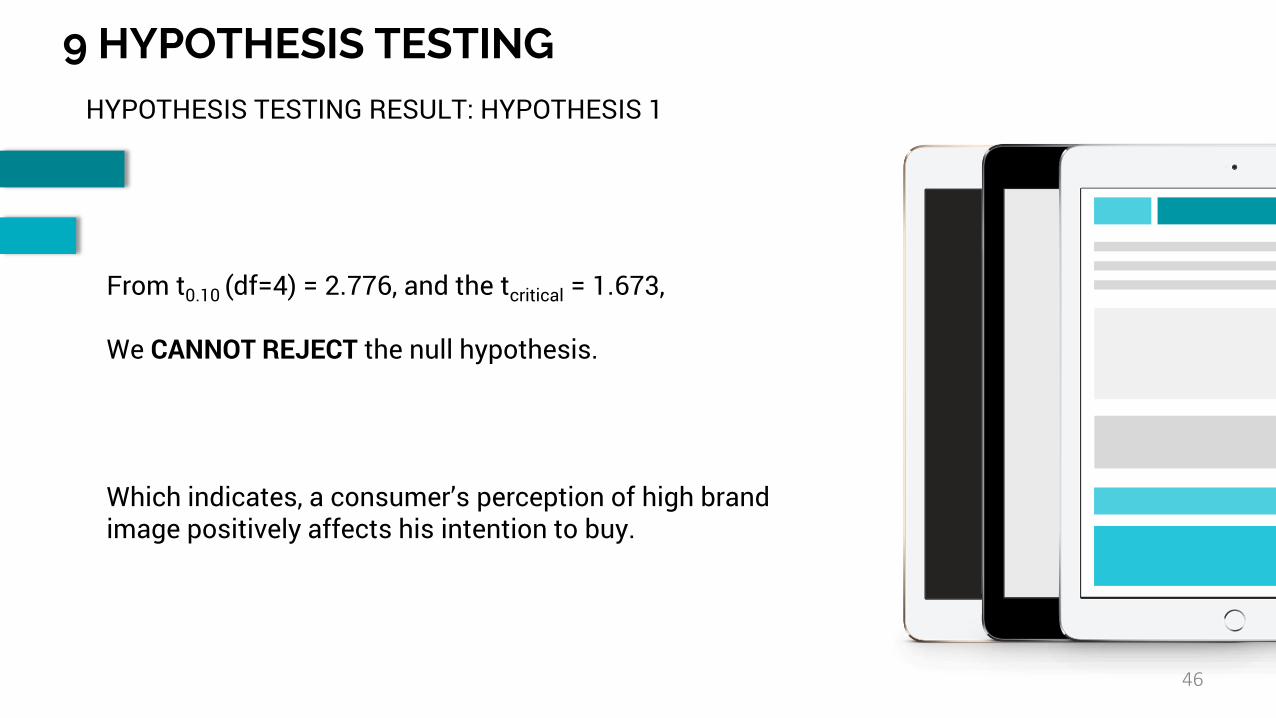
HYPOTHESIS TESTING RESULT: HYPOTHESIS 1
Which indicates, a consumer’s perception of high brand image positively affects his intention to buy.
From t0.10 (df=4) = 2.776, and the tcritical = 1.673,
We CANNOT REJECT the null hypothesis.

9 HYPOTHESIS TESTING
47
HYPOTHESIS 2: A CONSUMER’S PERCEPTION OF HIGH PRIVACY OF INFORMATION POSITIVELY AFFECTS HIS TRUST
H0: µ ≥ 5; the perception of high privacy of info positively affects trust
H1: µ < 5; the perception of high privacy of info does not positively affect trust

9 HYPOTHESIS TESTING
48
HYPOTHESIS 2: TEST RESULTS
One-Sample Statistics
N Mean Std. Deviation
Std. Error Mean
Privacy of Information
4 5.9100 .58572 .29286
One-Sample TestTest Value = 5
t df Sig. (2-tailed)
Mean Difference
90% Confidence Interval of the Difference
Lower Upper
Privacy of Information
3.107 3 .053 .91000 .2208 1.5992
StatisticsDoes 'not
sharing info' affects trust?
Liberty of choosing to share info
affects trust
The company keeps info
private
The company asks permission before sharing
info
Interpretation
NValid 113 113 113 113 From ‘Seems
Untrustworthy’ to Seems
trustworthy
Missing 1 1 1 1Mean 5.10 6.04 6.50 6.00Mode 6 8 9 10Std. Deviation 2.542 2.568 2.676 3.047

9 HYPOTHESIS TESTING
49
HYPOTHESIS TESTING RESULT: HYPOTHESIS 2
Which indicates, a consumer’s perception of high privacy of information does not affect his intention to buy
From t0.10(df=3) = 2.353, and the tcritical = 3.107,
We may REJECT the null hypothesis.

9 HYPOTHESIS TESTING
50
HYPOTHESIS 3: A CONSUMER’S PERCEPTION OF FINANCIAL SECURITY POSITIVELY AFFECTS HIS TRUST
H0: µ ≥ 5; Perception of financial security positively affects trust
Ha: µ < 5; Perception of financial security positively does not affect trust

9 HYPOTHESIS TESTING
51
HYPOTHESIS 3: TEST RESULTS
One-Sample Statistics
N Mean Std. Deviation
Std. Error Mean
Effect of financial security on buying behavior
2 5.4450 .26163 .18500
One-Sample Test
Test Value = 5t df Sig. (2-
tailed)Mean
Difference90% Confidence Interval of
the Difference
Lower UpperEffect of financial security on buying behavior
2.405 1 .251 .44500 -.7230 1.6130
Statistics
How effective is the pricing system?
How much is the transport charge
justified
NValid 113 112
Missing 1 2
Mean 5.26 5.63
Mode 7 5
Std. Deviation 1.963 1.791

9 HYPOTHESIS TESTING
52
HYPOTHESIS TESTING RESULT: HYPOTHESIS 3
Which indicates, a consumer’s perception of high privacy of information does not affect his intention to buy
From t0.10(df=1) = 6.314, and the tcritical = 2.405.
We CANNOT REJECT the null hypothesis

10.1 FACTOR ANALYSIS
53
10.1 USAGE BENEFITS
Identifies unobserved variables that explain patterns of
correlations within a set of observed variables.
Used to identify a small number of factors that explain most
of the variance embedded in a larger number of variables.

10.1 FACTOR ANALYSIS
54
10.2 USAGE
16 Likert scale variable available. 15 was used in the
factor analysis.
One of the variable had the overall trust perception in its
data.
This was used as the dependent variable later.
10.1 FACTOR ANALYSIS
55
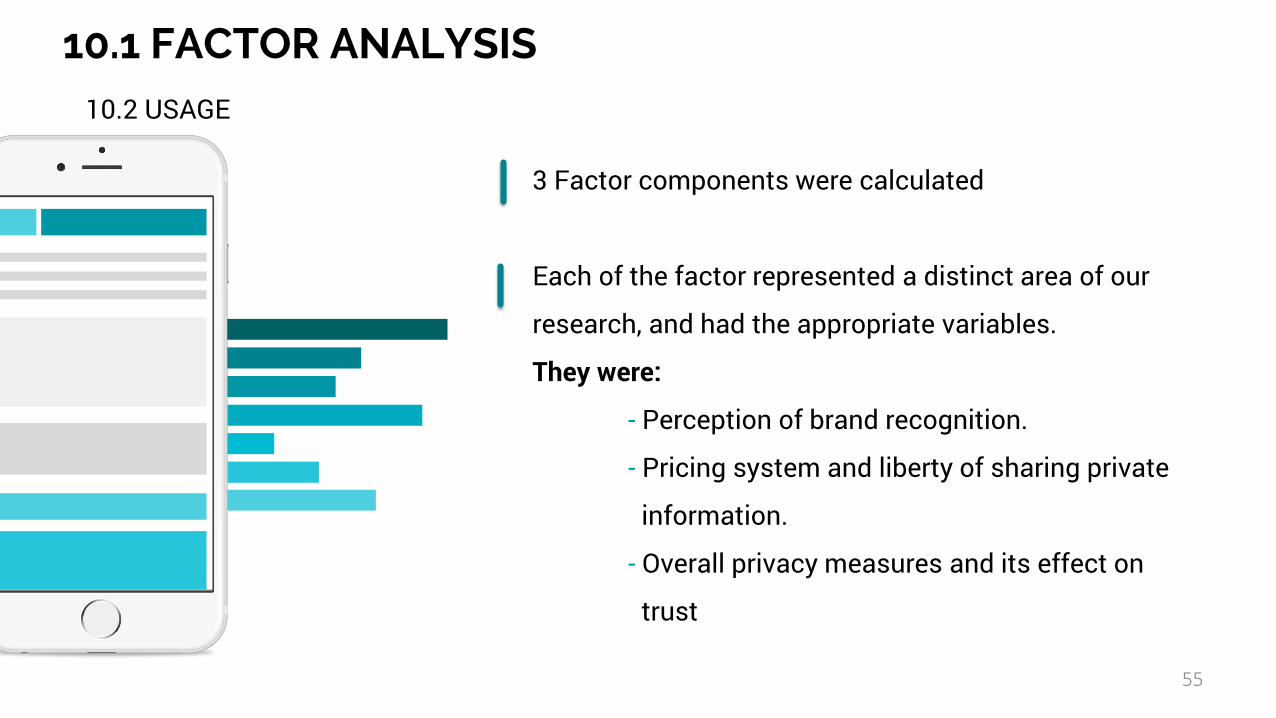
10.2 USAGE
3 Factor components were calculated
Each of the factor represented a distinct area of our
research, and had the appropriate variables.
They were:
- Perception of brand recognition.
- Pricing system and liberty of sharing private
information.
- Overall privacy measures and its effect on
trust
10.2 KMO and Bartlett's test
56
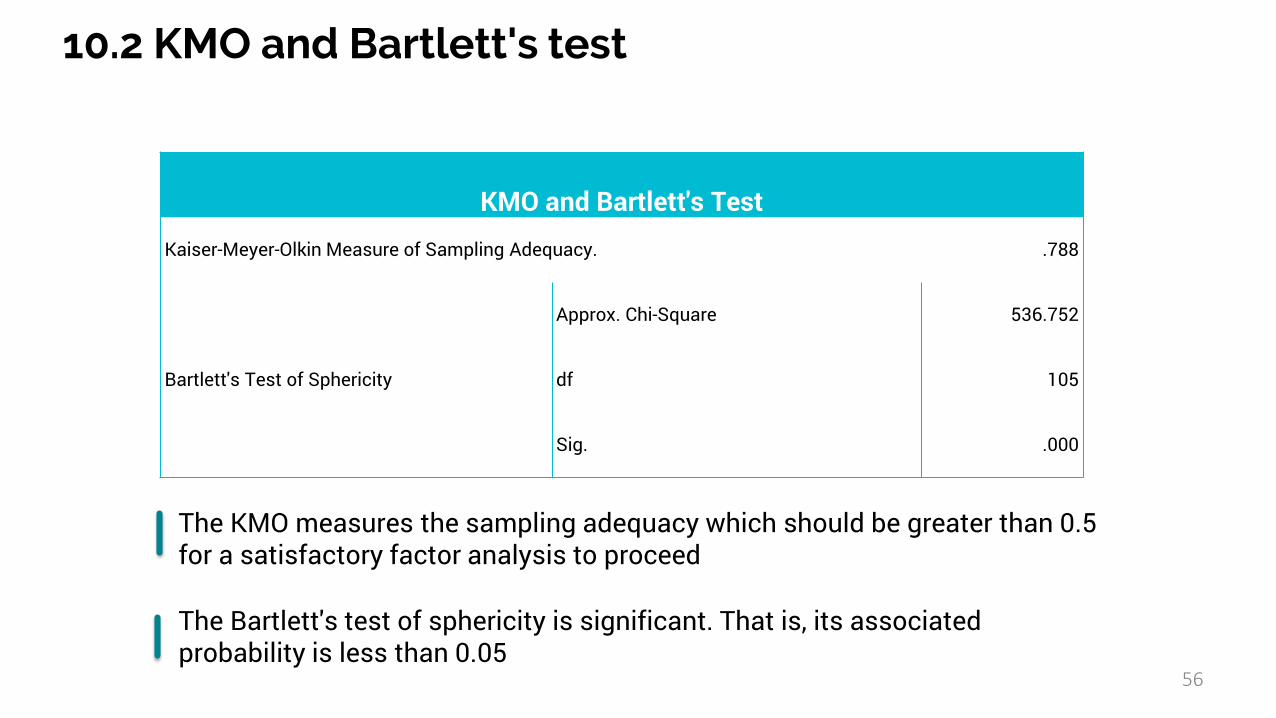
KMO and Bartlett's Test
Kaiser-Meyer-Olkin Measure of Sampling Adequacy. .788
Bartlett's Test of Sphericity
Approx. Chi-Square 536.752
df 105
Sig. .000
The KMO measures the sampling adequacy which should be greater than 0.5for a satisfactory factor analysis to proceed
The Bartlett's test of sphericity is significant. That is, its associated probability is less than 0.05

10.3 REGRESSION ANALYSIS
57
The co-efficient of correlation is .713, it is a significant measure
The model explains 49% of the consumers’ trust and perceived risk
Model SummaryModel R R Square Adjusted R Square Std. Error of the
Estimate
1 .713a .508 .490 1.560
10.4 ANOVA
58
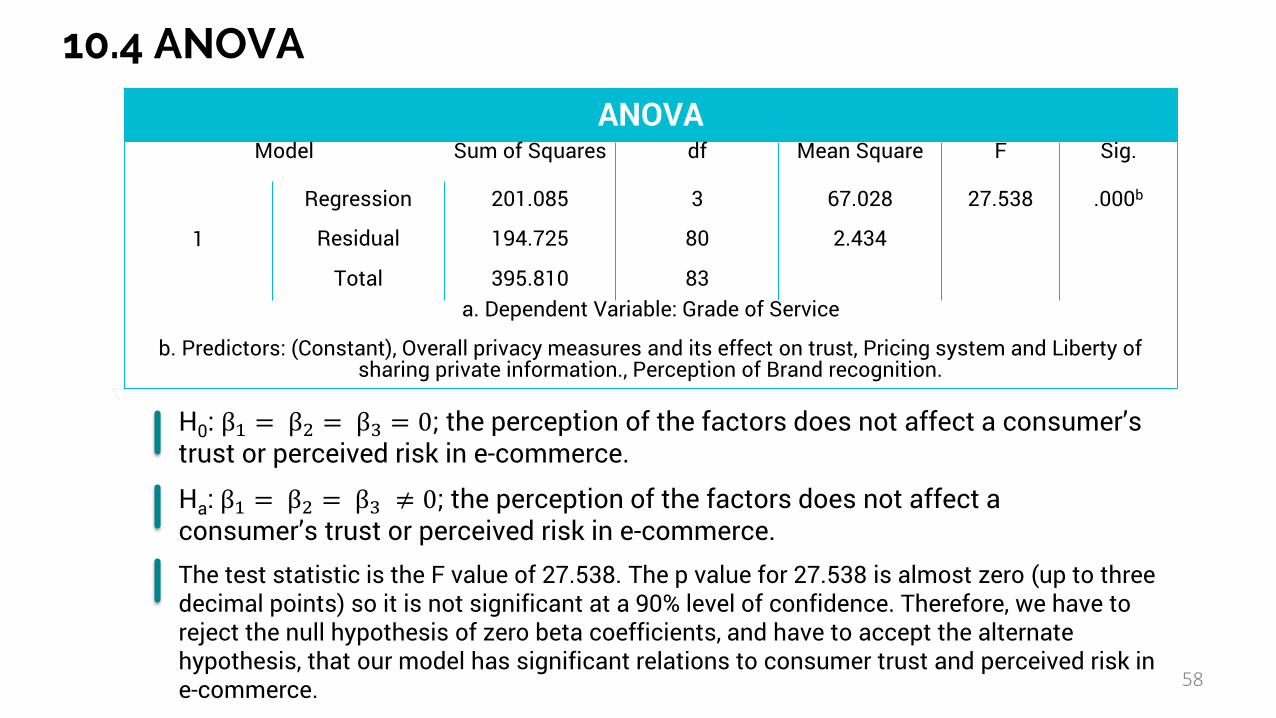
H0: β1 = β2 = β3 = 0; the perception of the factors does not affect a consumer’s trust or perceived risk in e-commerce.
Ha: β1 = β2 = β3 ≠ 0; the perception of the factors does not affect a consumer’s trust or perceived risk in e-commerce.
ANOVAModel Sum of Squares df Mean Square F Sig.
1
Regression 201.085 3 67.028 27.538 .000b
Residual 194.725 80 2.434
Total 395.810 83a. Dependent Variable: Grade of Service
b. Predictors: (Constant), Overall privacy measures and its effect on trust, Pricing system and Liberty of sharing private information., Perception of Brand recognition.
The test statistic is the F value of 27.538. The p value for 27.538 is almost zero (up to three decimal points) so it is not significant at a 90% level of confidence. Therefore, we have to reject the null hypothesis of zero beta coefficients, and have to accept the alternate hypothesis, that our model has significant relations to consumer trust and perceived risk in e-commerce.

CONCLUSION

CONCLUSION
60
Two Out Of Three Hypotheses Cannot Be Rejected
Brand Perception
Consumer Privacy
Financial Risk
Room For Research
Valid And Reliable
1 2 3 4 5 6

61
THANK YOUQUESTIONS?