Consumer Behavior, Eighth Edition SCHIFFMAN & KANUKocw.upj.ac.id/files/Slide-MGT206-Slide-7.pdf ·...
46
6-1 Chapter 6 Consumer Behavior, Eighth Edition SCHIFFMAN & KANUK Consumer Perception
Transcript of Consumer Behavior, Eighth Edition SCHIFFMAN & KANUKocw.upj.ac.id/files/Slide-MGT206-Slide-7.pdf ·...
6-1
Chapter 6
Consumer Behavior,
Eighth Edition
SCHIFFMAN & KANUK
Consumer Perception
6-2
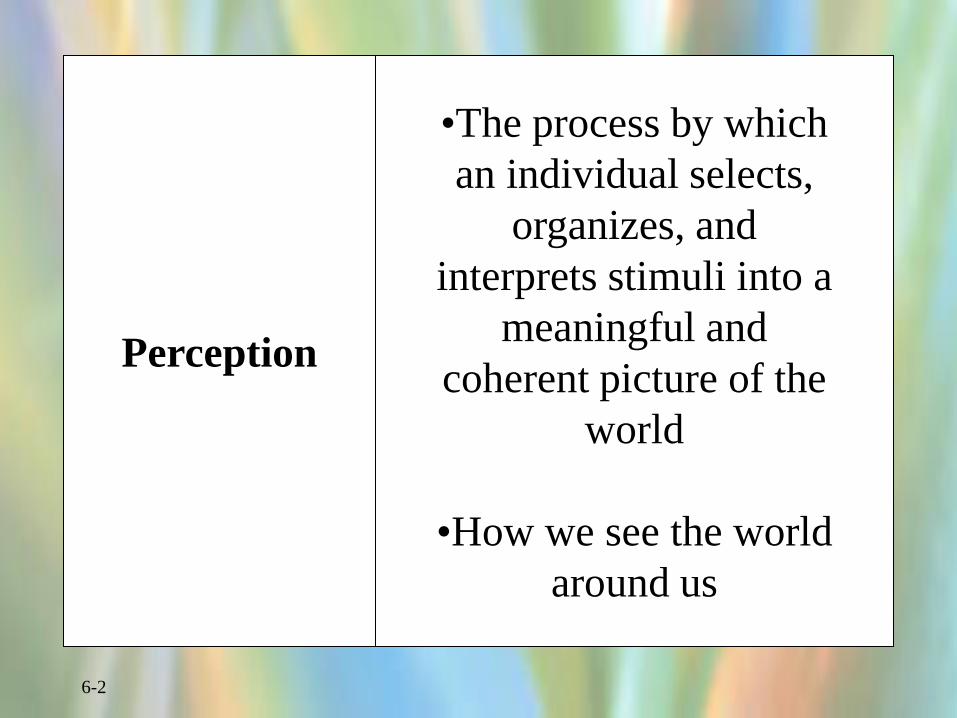
Perception
•The process by which
an individual selects,
organizes, and
interprets stimuli into a
meaningful and
coherent picture of the
world
•How we see the world
around us
6-3
Elements of Perception
• Sensation
• Absolute threshold
• Differential threshold
• Subliminal perception
6-4
Sensation
The immediate and
direct response of the
sensory organs to
stimuli.
A perfectly unchanging
environment provides
little to no sensation at
all!

6-5
Figure 6.1
Increased
Sensory
Input
6-6
Weber’s
Law
A theory concerning the
perceived differentiation
between similar stimuli of
varying intensities (i.e., the
stronger the initial stimulus,
the greater the additional
intensity needed for the
second stimulus to be
perceived as different).
6-7
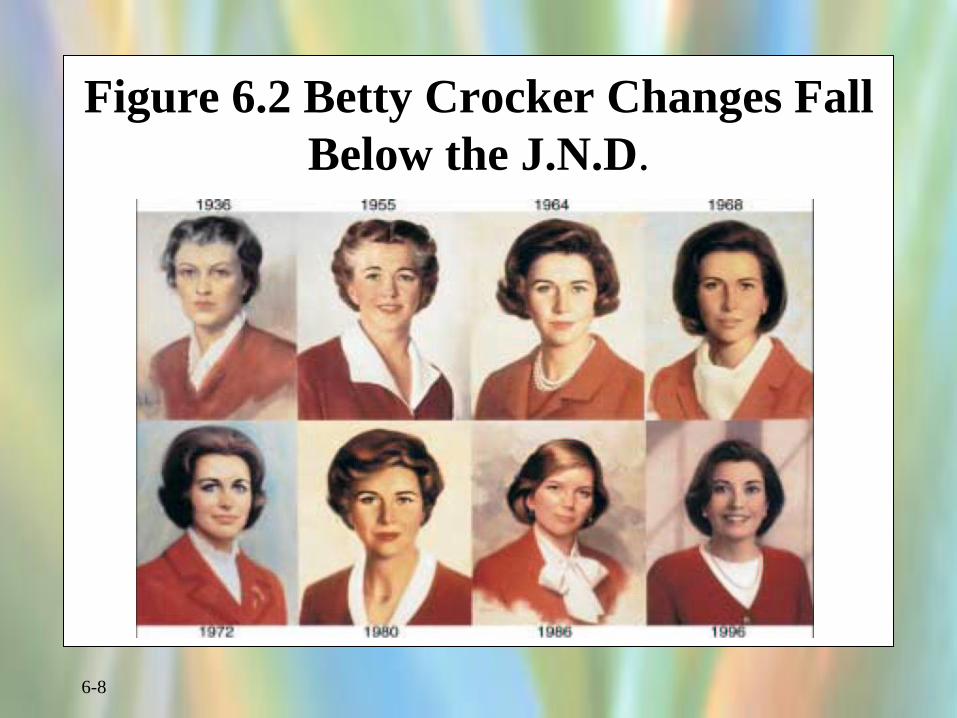
Marketing Applications
of the JND (just noticeable difference)
• Need to determine the relevant j.n.d. for their products
– so that negative changes are not readily discernible to the public
– so that product improvements are very apparent to consumers
6-8
Figure 6.2 Betty Crocker Changes Fall
Below the J.N.D.
6-9
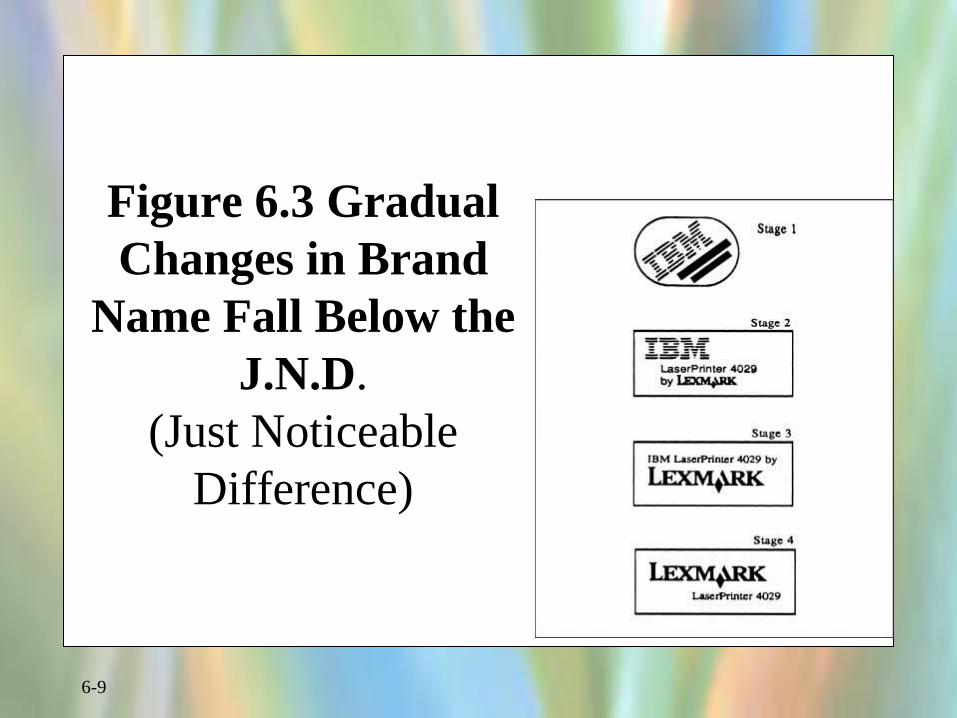
Figure 6.3 Gradual
Changes in Brand
Name Fall Below the
J.N.D.
(Just Noticeable
Difference)
6-10
Subliminal
Perception
Perception of very
weak or rapid stimuli
received below the
level of conscious
awareness.
6-11
Subliminal Perception
• 1957: Drive-In Movie Theater
• 1974: Publication of Subliminal Seduction
• 1990s: Allegations against Disney
6-12
Is Subliminal Persuasion
Effective?
• Extensive research has shown no evidence that subliminal advertising can cause behavior changes
• Some evidence that subliminal stimuli may influence affective reactions

6-13
Subliminal
Perception

6-14
6-15
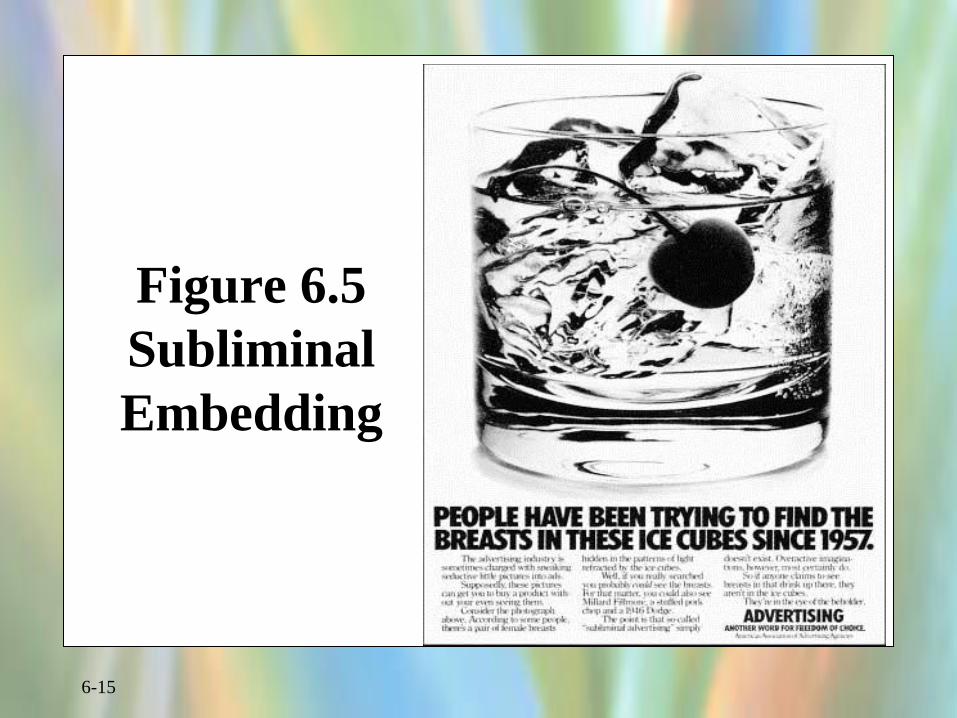
Figure 6.5
Subliminal
Embedding
6-16
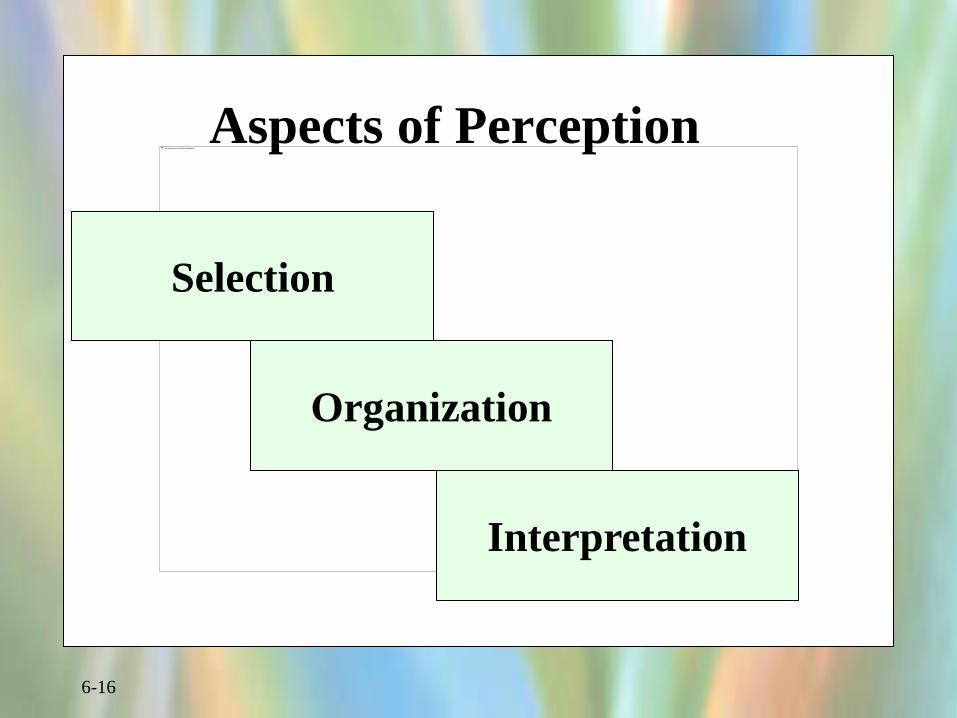
Aspects of Perception
Selection
Organization
Interpretation
6-17
Perceptual Selection
• Depends on two major factors
– Consumers’ previous experience
– Consumers’ motives
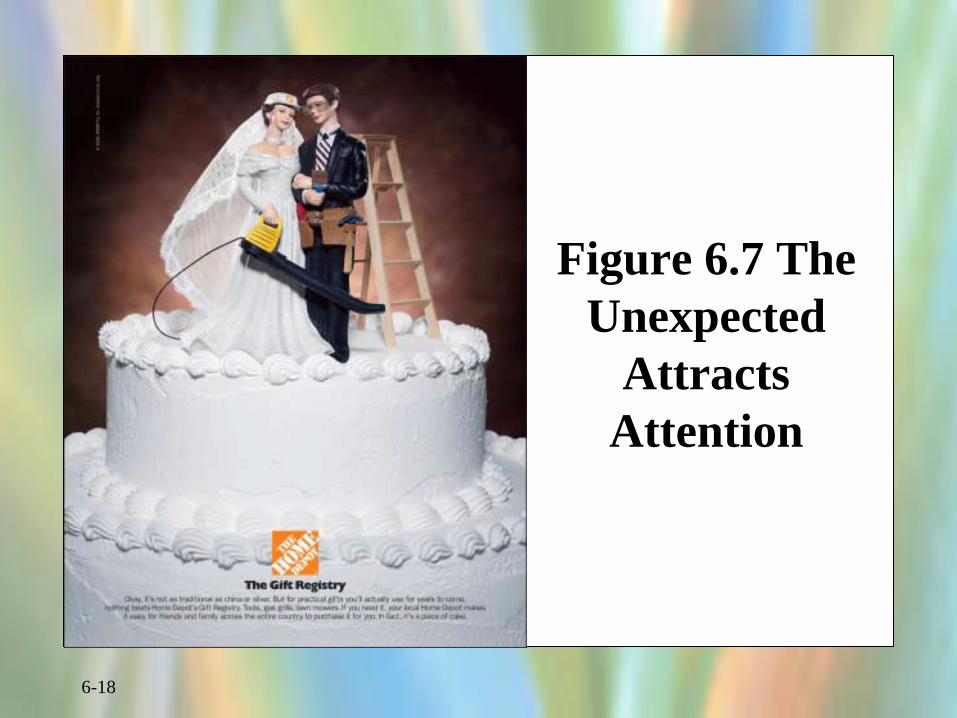
6-18
Figure 6.7 The
Unexpected
Attracts
Attention
6-19
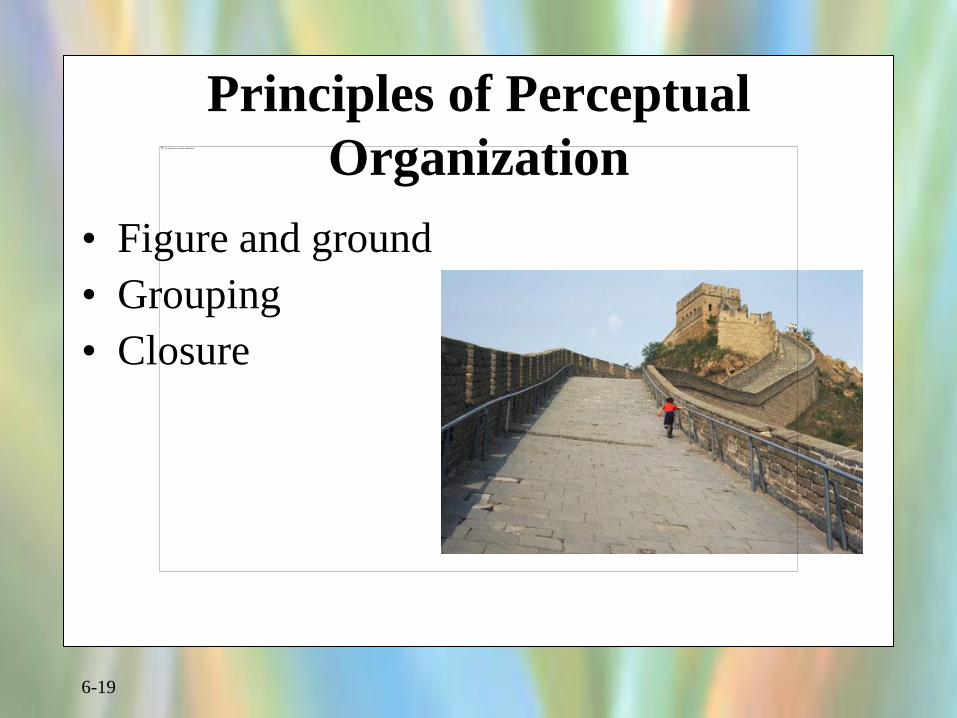
Principles of Perceptual
Organization
• Figure and ground
• Grouping
• Closure
6-20
Influences of Perceptual Distortion
• Physical Appearances
• Stereotypes
• First Impressions
• Jumping to Conclusions
• Halo Effect
6-21
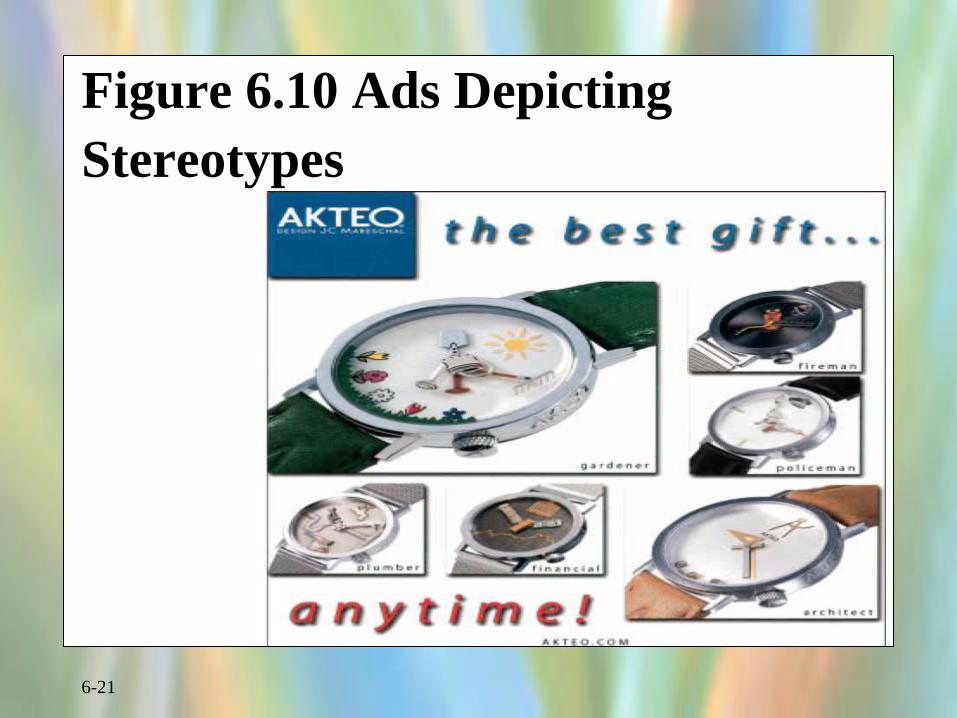
Figure 6.10 Ads Depicting
Stereotypes
6-22
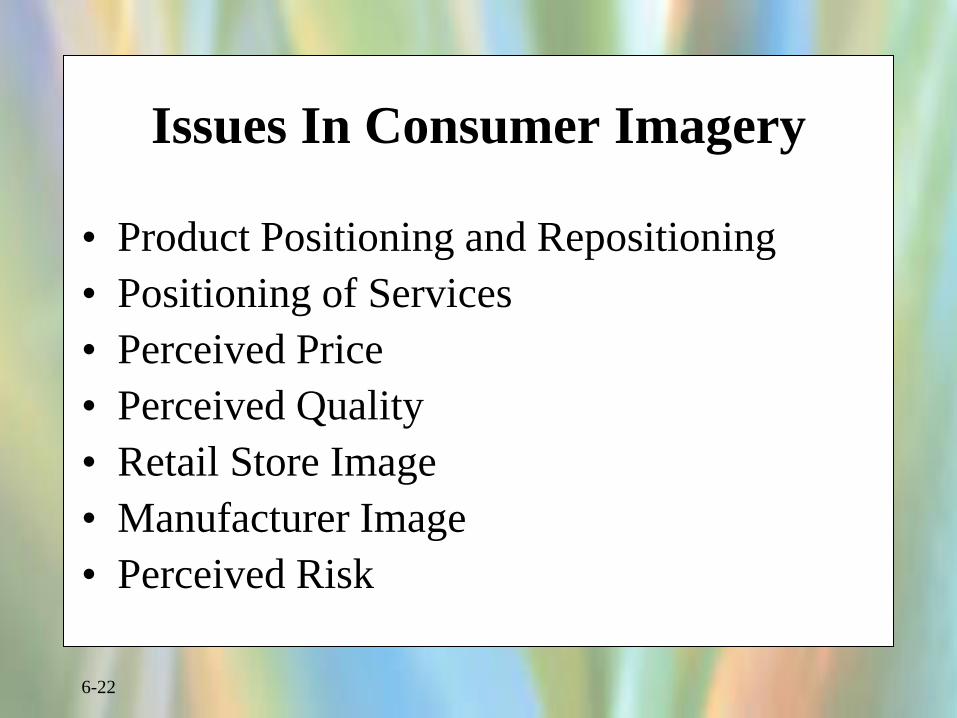
Issues In Consumer Imagery
• Product Positioning and Repositioning
• Positioning of Services
• Perceived Price
• Perceived Quality
• Retail Store Image
• Manufacturer Image
• Perceived Risk

6-23
Figure 6.12
Using Imagery
6-24
Positioning
Establishing a
specific image for a
brand in relation to
competing brands.

6-25
Figure 6.13
Repositioning
6-26
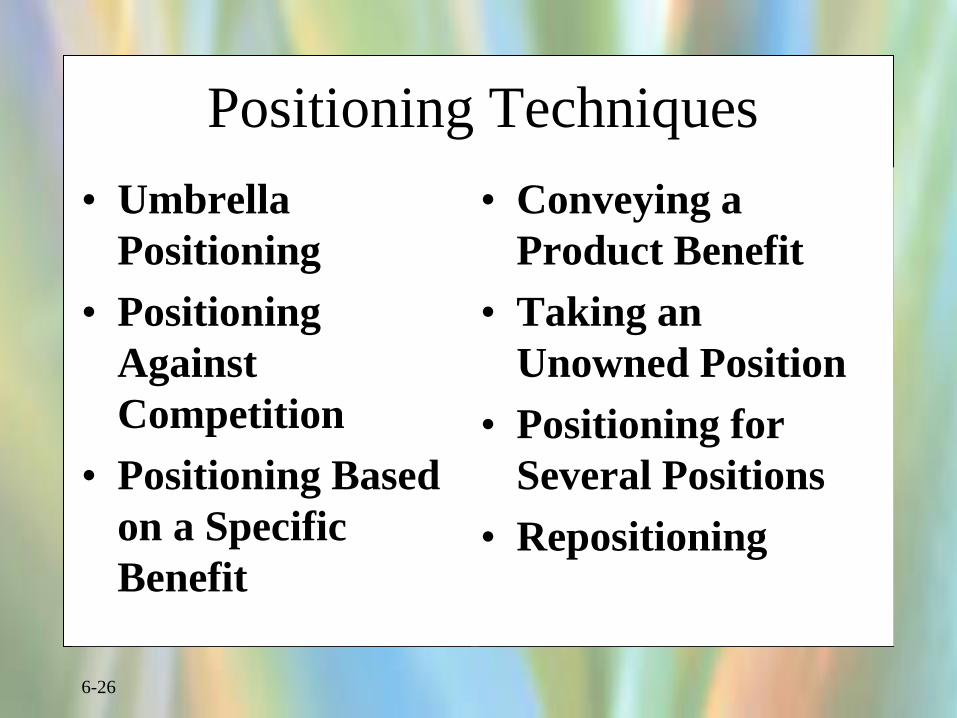
Positioning Techniques
• Umbrella
Positioning
• Positioning
Against
Competition
• Positioning Based
on a Specific
Benefit
• Conveying a
Product Benefit
• Taking an
Unowned Position
• Positioning for
Several Positions
• Repositioning
6-27
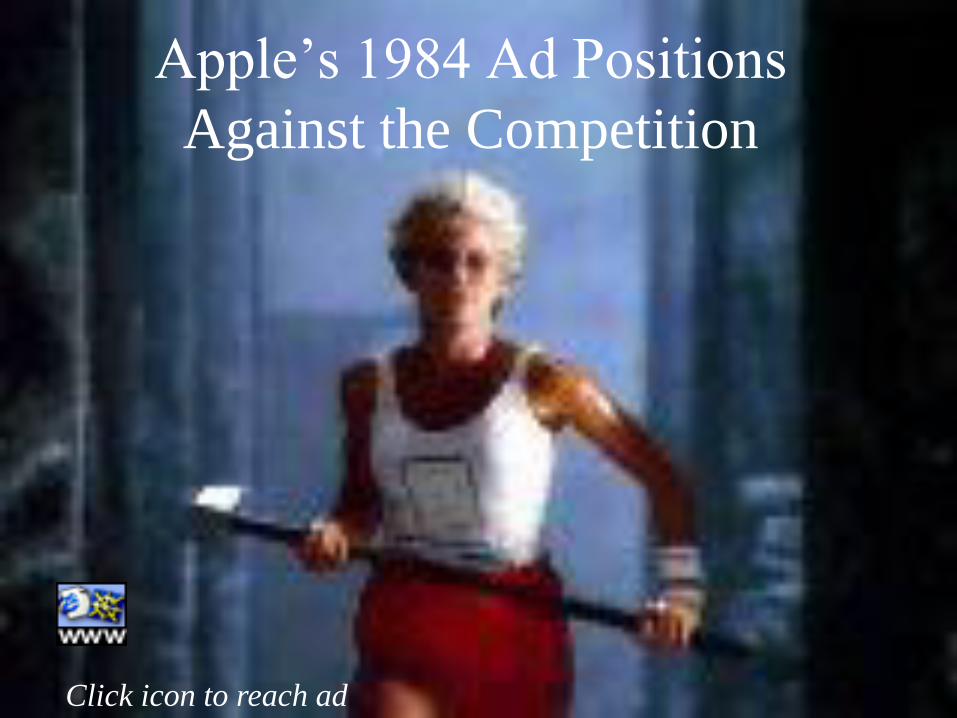
Apple’s 1984 Ad Positions
Against the Competition
Click icon to reach ad
6-28
Perceptual
Mapping
A research technique
that enables
marketers to plot
graphically
consumers’
perceptions
concerning product
attributes of specific
brands.
6-29
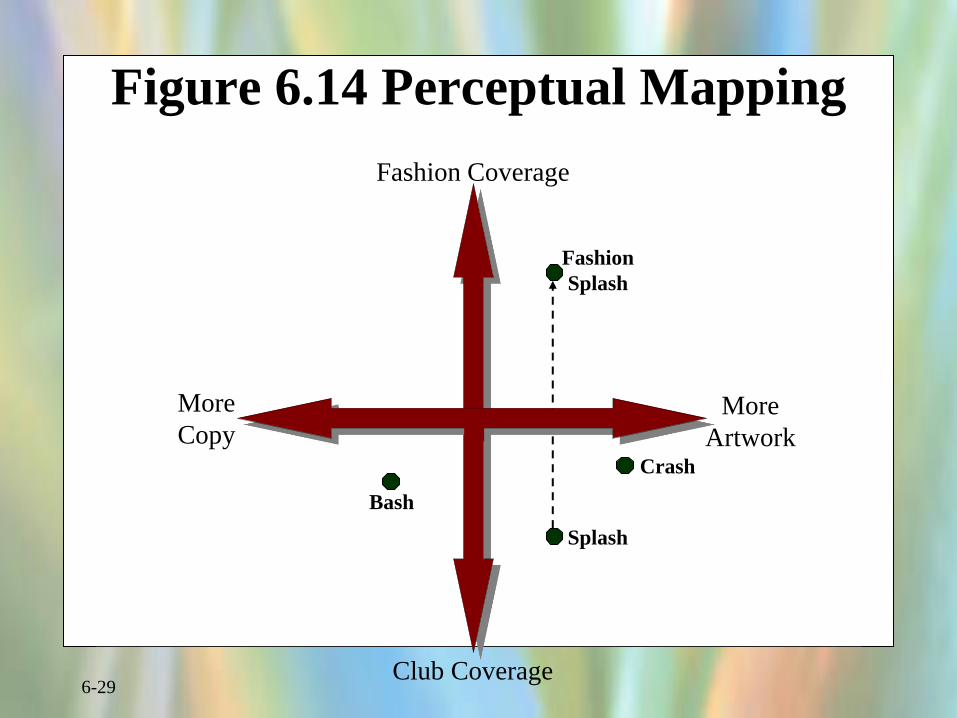
Figure 6.14 Perceptual Mapping
More
Artwork
More
Copy
Fashion Coverage
Club Coverage
Splash
Crash
Fashion
Splash
Bash
6-30
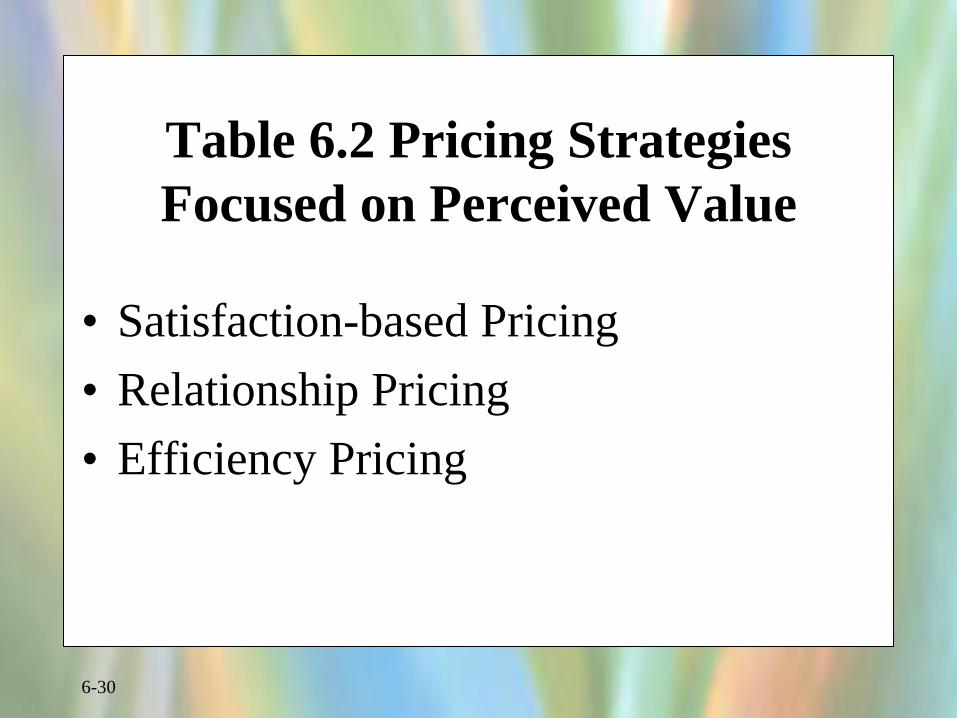
Table 6.2 Pricing Strategies
Focused on Perceived Value
• Satisfaction-based Pricing
• Relationship Pricing
• Efficiency Pricing
6-31
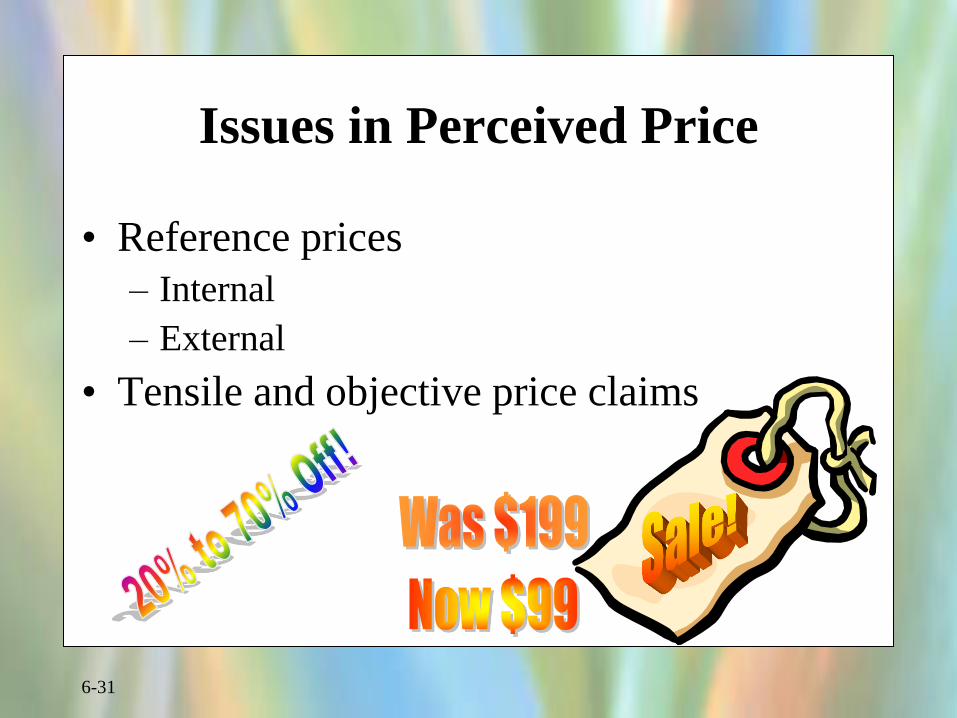
Issues in Perceived Price
• Reference prices
– Internal
– External
• Tensile and objective price claims
6-32
Acquisition-Transaction Utility
• Acquisition utility
represents the
consumer’s perceived
economic gain or loss
associated with the
purchase
• Function of product
utility and purchase
price
• Transaction utility
concerns the perceived
pleasure or displeasure
associated with the
financial aspect of the
purchase
• Determined by the
difference between the
internal reference price
and the purchase price
6-33
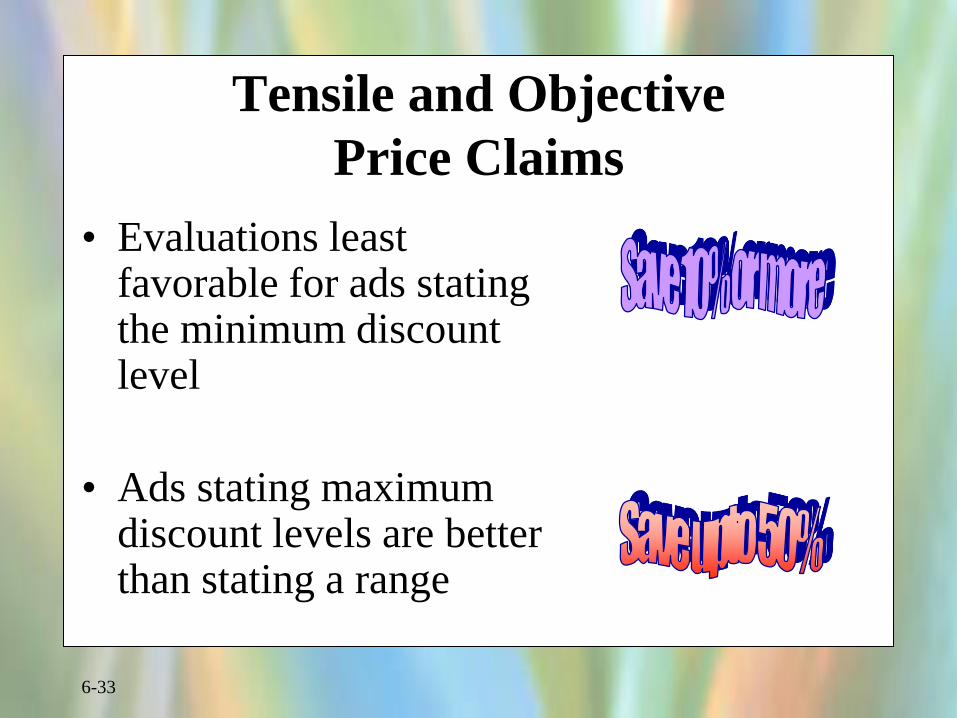
Tensile and Objective
Price Claims
• Evaluations least favorable for ads stating the minimum discount level
• Ads stating maximum discount levels are better than stating a range
6-34
Perceived Quality
• Perceived Quality of Products
– Intrinsic vs. Extrinsic Cues
• Perceived Quality of Services
• Price/Quality Relationship
6-35
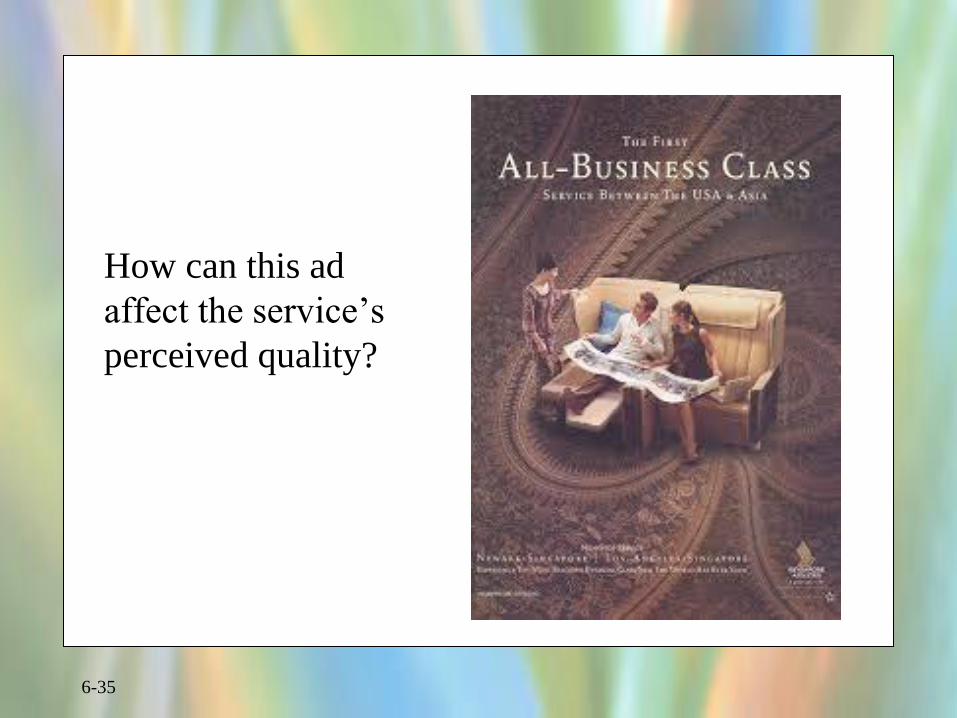
How can this ad
affect the service’s
perceived quality?
6-36
Characteristics of Services
• Intangible
• Variable
• Perishable
• Simultaneously Produced and Consumed
6-37
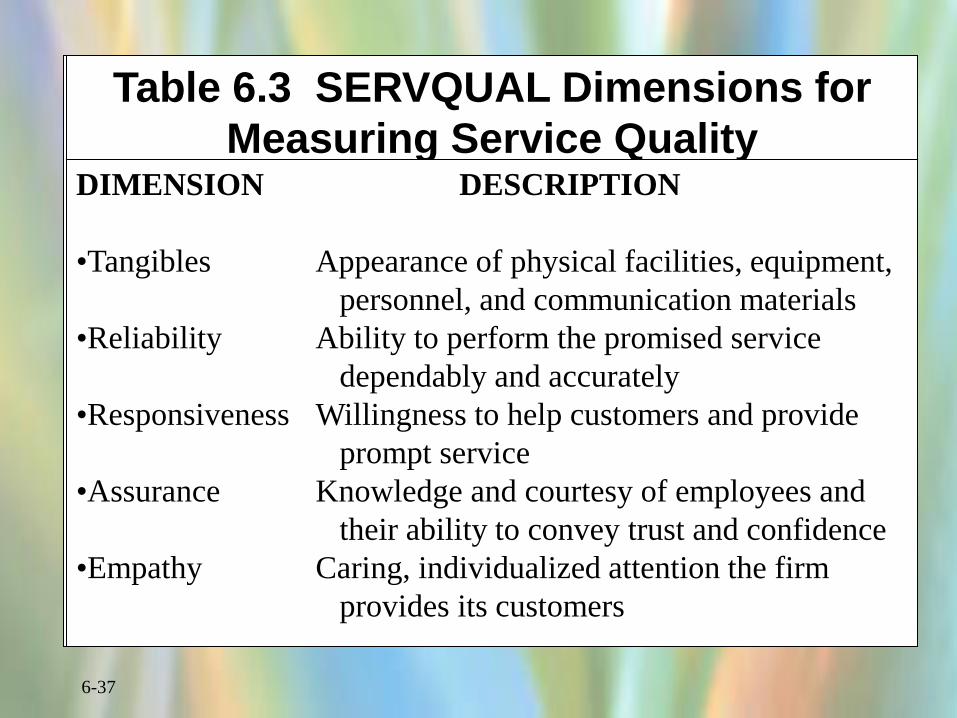
Table 6.3 SERVQUAL Dimensions for
Measuring Service Quality DIMENSION DESCRIPTION
•Tangibles Appearance of physical facilities, equipment,
personnel, and communication materials
•Reliability Ability to perform the promised service
dependably and accurately
•Responsiveness Willingness to help customers and provide
prompt service
•Assurance Knowledge and courtesy of employees and
their ability to convey trust and confidence
•Empathy Caring, individualized attention the firm
provides its customers
6-38
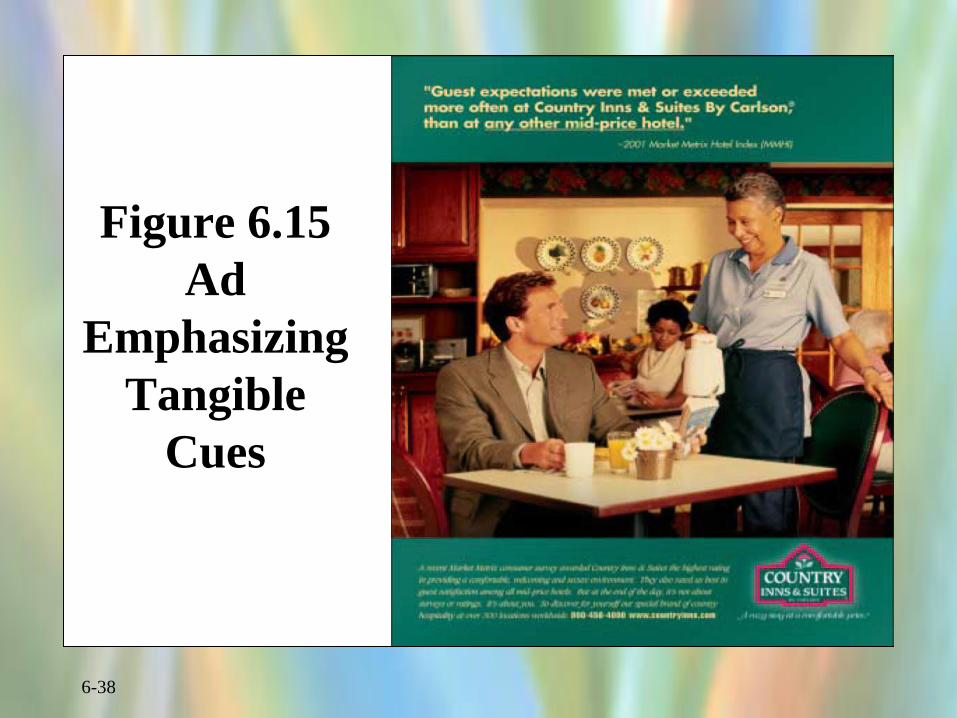
Figure 6.15
Ad
Emphasizing
Tangible
Cues
6-39
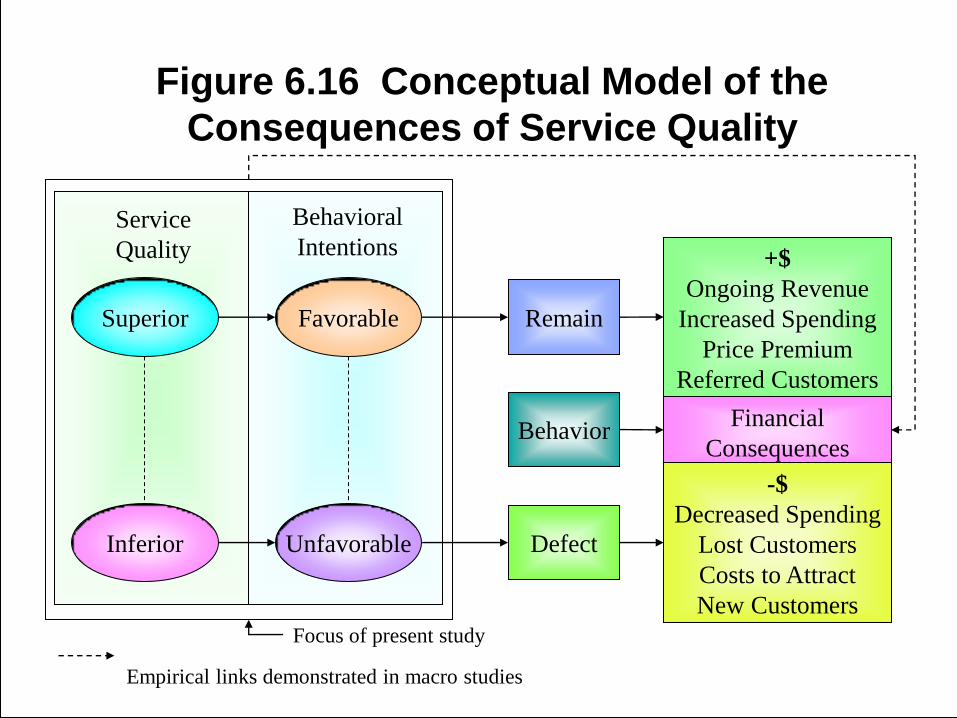
Figure 6.16 Conceptual Model of the
Consequences of Service Quality
Superior
Inferior
Favorable
Unfavorable
Remain
Behavior
Defect
+$
Ongoing Revenue
Increased Spending
Price Premium
Referred Customers
Financial
Consequences
-$
Decreased Spending
Lost Customers
Costs to Attract
New Customers
Service
Quality
Behavioral
Intentions
Focus of present study
Empirical links demonstrated in macro studies
6-40
Price/Quality
Relationship
The perception of
price as an indicator
of product quality
(e.g., the higher the
price, the higher the
perceived quality of
the product).
6-41
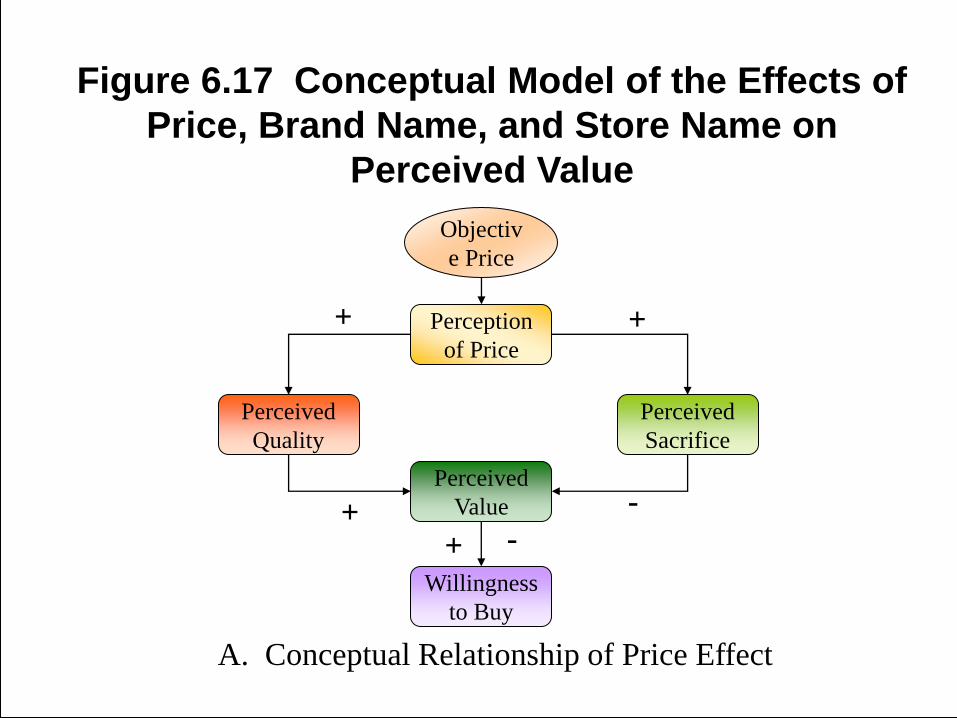
Figure 6.17 Conceptual Model of the Effects of
Price, Brand Name, and Store Name on
Perceived Value
Objectiv
e Price
Perception
of Price
Perceived
Sacrifice
Perceived
Quality
Perceived
Value
Willingness
to Buy
A. Conceptual Relationship of Price Effect
+
+ +
+
-
-
6-42
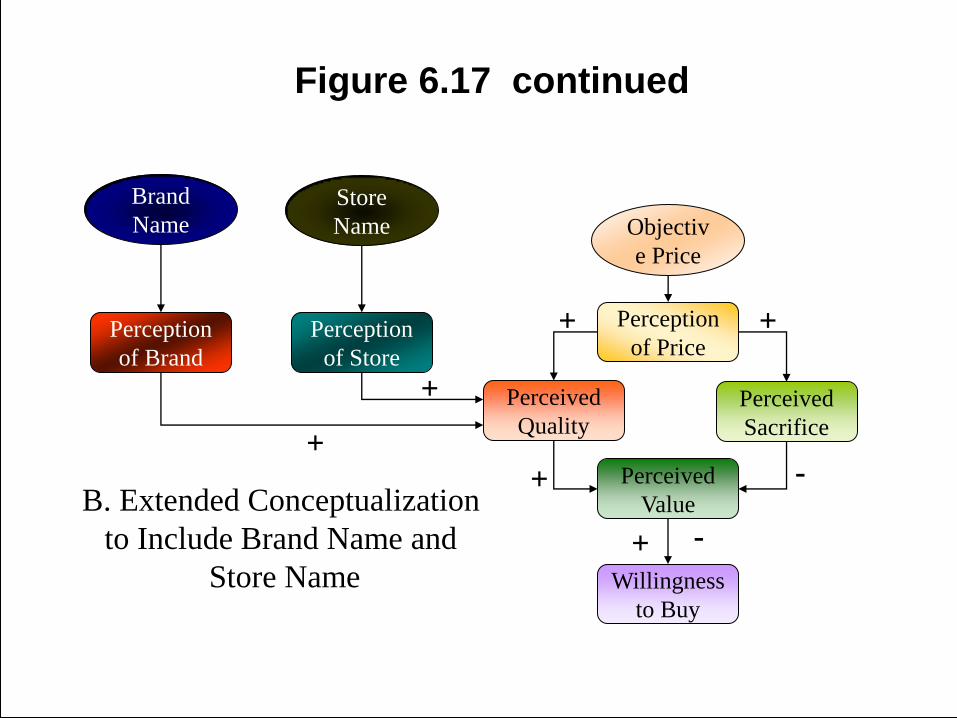
Figure 6.17 continued
B. Extended Conceptualization
to Include Brand Name and
Store Name
Store
Name
Brand
Name
Perception
of Store
Perception
of Brand
+
+
Objectiv
e Price
Perception
of Price
Perceived
Sacrifice
Perceived
Quality
Perceived
Value
Willingness
to Buy
+
+
+
+
-
-
6-43
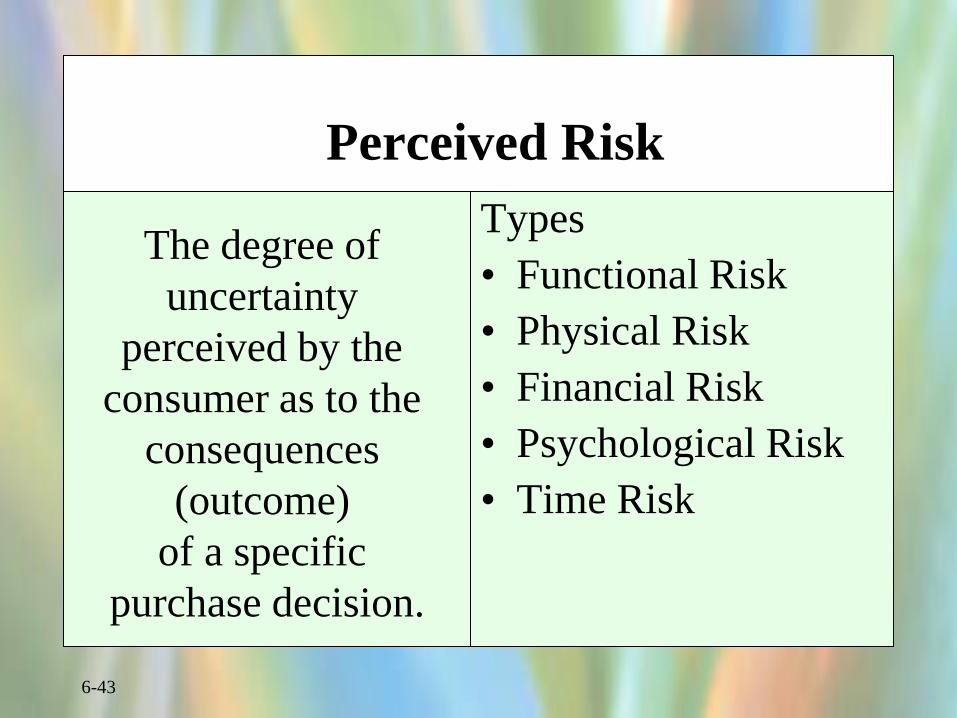
Perceived Risk
Types
• Functional Risk
• Physical Risk
• Financial Risk
• Psychological Risk
• Time Risk
The degree of
uncertainty
perceived by the
consumer as to the
consequences
(outcome)
of a specific
purchase decision.
6-44
How Consumers Handle Risk
• Seek Information
• Stay Brand Loyal
• Select by Brand Image
• Rely on Store Image
• Buy the Most Expensive Model
• Seek Reassurance

6-45
Pengumuman
• Kamis, 7 April 2016 tidak ada perkuliahan
perilaku konsumen
• Kuliah pengganti, Jumat, 8 April 2016, jam
10,30-selesai (setelah kuliah MBI)

6-46
• KP Perilaku Konsumen untuk 5 Mei19
Mei jam 11:00-13.30