
Consultation Draft September 2017 - Regional economics · Consultation Draft – September 2017....
62
National Infrastructure Data Collection and Dissemination Plan Consultation Draft – September 2017
Transcript of Consultation Draft September 2017 - Regional economics · Consultation Draft – September 2017....

National Infrastructure
Data Collection and Dissemination Plan
Consultation Draft – September 2017

Draft National Infrastructure Data Collection and Dissemination Plan ii
© Commonwealth of Australia 2017
ISBN 978-1-925531-64-0
2017 / INFRASTRUCTURE 3320
Ownership of intellectual property rights in this publication
Unless otherwise noted, copyright (and any other intellectual property rights, if any) in this publication is owned by the Commonwealth of
Australia (referred to below as the Commonwealth).
Disclaimer
The material contained in this publication is made available on the understanding that the Commonwealth is not providing professional
advice, and that users exercise their own skill and care with respect to its use, and seek independent advice if necessary.
The Commonwealth makes no representations or warranties as to the contents or accuracy of the information contained in this
publication. To the extent permitted by law, the Commonwealth disclaims liability to any person or organisation in respect of anything
done, or omitted to be done, in reliance upon information contained in this publication.
Creative Commons licence
With the exception of (a) the Coat of Arms; (b) the Department of Infrastructure and Regional Development’s photos and graphics; and
(c) Case Study 3.5 (Quantium Case Study), copyright in this publication is licensed under a Creative Commons Attribution 3.0 Australia
Licence.
Creative Commons Attribution 3.0 Australia Licence is a standard form licence agreement that allows you to copy, communicate and
adapt this publication provided that you attribute the work to the Commonwealth and abide by the other licence terms.
A summary of the licence terms is available from http://creativecommons.org/licenses/by/3.0/au/deed.en.
The full licence terms are available from http://creativecommons.org/licenses/by/3.0/au/legalcode.
This publication should be attributed in the following way: ©Commonwealth of Australia 2017.
Use of the Coat of Arms
The Department of the Prime Minister and Cabinet sets the terms under which the Coat of Arms is used. Please refer to the
Department’s Commonwealth Coat of Arms and Government Branding web page http://www.dpmc.gov.au/pmc/about-pmc/core-
priorities/guidelines-and-procedures-other-agencies and in particular, the Commonwealth Coat of Arms - Information and Guidelines
publication.
Contact us
This publication is available in hard copy or PDF format. All other rights are reserved, including in relation to any Departmental logos or
trade marks which may exist. For enquiries regarding the licence and any use of this publication, please contact:
Director - Publishing and Communications
Communications Branch
Department of Infrastructure and Regional Development
GPO Box 594
Canberra ACT 2601
Australia
Email: [email protected]
Website: www.infrastructure.gov.au
Draft National Infrastructure Data Collection and Dissemination Plan 1
Contents
Foreword ................................................................................................................................... 3
CHAPTER 1: INTRODUCTION ...................................................................................................... 4
Background ............................................................................................................................... 4
Building on similar projects ....................................................................................................... 5
Approach for developing the Draft Data Plan ........................................................................... 6
How to Contribute to the Data Plan .......................................................................................... 7
CHAPTER 2: ENDURING QUESTIONS ........................................................................................ 9
Draft Enduring Questions and key data sources ...................................................................... 9
Priority Enduring Questions, Gaps and Opportunities ............................................................ 14
CHAPTER 3: OPPORTUNITIES .................................................................................................. 16
EQ 1.2 – What is the condition of Australia’s infrastructure? ....................................... 16
EQ 2.1 – How well are Australia’s infrastructure networks performing? ...................... 16
EQ 2.3 – How well is Australia’s freight sector performing? ......................................... 17
EQ 3.2 – What are the planned and actual costs and benefits involved in infrastructure
projects? ....................................................................................................................... 18
EQ 3.3 – How do infrastructure construction costs vary? ............................................ 19
EQ 3.4 –Are Australia’s infrastructure assets sufficient to meet current and projected
needs? .......................................................................................................................... 19
EQ 4.3 – What are the main sources, types and quantities of economic benefits from
transport? ...................................................................................................................... 20
EQ 5.1a – What freight is moving to, from and around Australia, what is it comprised
of, how are different industries affecting the volume and value of freight? .................. 21
EQ 5.2a – How and when does freight move to, from and around Australia, and by
what routes?; and ......................................................................................................... 21
EQ 5.3a – What barriers exist to efficiently transporting freight to, from and around
Australia? ...................................................................................................................... 21
EQ 5.5a – How, when, why and in what numbers do people travel to, from and within
Australia, for what purposes, what are the origins and destinations of their
journeys? ...................................................................................................................... 23
EQ 5.1b – What are the key service characteristics for water, energy and
communications (including cost, time, speed, accessibility and reliability) and how do
these characteristics affect the amount and type of services provided? ...................... 25

Draft National Infrastructure Data Collection and Dissemination Plan 2
CHAPTER 4: INFRASTRUCTURE PERFORMANCE MEASURES ............................................. 26
Customer performance framework ......................................................................................... 26
Service quality performance measures ........................................................................ 26
Applying the framework ................................................................................................ 27
Infrastructure productivity ........................................................................................................ 29
End-to-end (supply chain) performance ................................................................................. 31
End-to-end performance indicators .............................................................................. 31
Overarching framework ........................................................................................................... 33
Priorities for measuring infrastructure performance................................................................ 34
EQ 2.1 – How well are Australia’s infrastructure networks and assets performing? .... 34
EQ 2.3 – [Specifically] How well is Australia’s freight sector performing? ................... 34
CHAPTER 5: DATA DISSEMINATION ........................................................................................ 38
Australian Government data commitments and leading entities ............................................ 39
State and territory data commitments and associated entities ............................................... 40
Open Data initiatives ............................................................................................................... 40
data.gov.au ................................................................................................................... 40
State and territory open data portals ............................................................................ 42
Infrastructure and transport related portals .................................................................. 43
Benefits of making public data open ....................................................................................... 44
The need for a national framework for public data sharing and accessibility ......................... 47
Priorities for improving data sharing and accessibility ............................................................ 48
EQ 6.1 – What infrastructure data and information is currently publicly available and
what datasets and information can be made available? .............................................. 48
EQ 6.2 – What data do governments need to provide in order to enable emerging
technologies and innovative business models of infrastructure provision and use? .... 52
APPENDIX A – REQUESTS FOR INPUT..................................................................................... 53
APPENDIX B – TERMS OF REFERENCE ................................................................................... 54
APPENDIX C – STEERING GROUP MEMBERSHIP ................................................................... 55
APPENDIX D – KEY DATA AND INFORMATION SOURCES ..................................................... 56

Draft National Infrastructure Data Collection and Dissemination Plan 3
Foreword
The Bureau of Infrastructure, Transport and Regional Economics (BITRE) has released this draft version of the National Infrastructure Data Collection and Dissemination Plan (Data Plan) to assist individuals and organisations to contribute to the development of the Final Data Plan. It contains and outlines: • an overview of the purpose, objectives and approach for developing the Data Plan • an initial list of ‘Enduring Questions’ to address in the Data Plan • data and information gaps related to the Enduring Questions • prioritised Enduring Questions • opportunities relating to Enduring Questions • draft infrastructure and freight performance frameworks • next steps and matters which BITRE are seeking comment and information. Participants are not restricted to comment only on matters raised in the Draft Data Plan (Appendix A). BITRE wishes to receive information and comment on issues which participants consider relevant to the project’s Terms of Reference (Appendix B). Comments and suggestions can be lodged online via [email protected] or by phone on +61 2 6274 7818. Further information on the project and specific requests for input are available at https://bitre.gov.au/data_dissemination/tor.aspx
The Bureau of Infrastructure, Transport and Regional Economics (BITRE) BITRE provides economic analysis, research and statistics on infrastructure, transport and regional development issues to inform Australian Government policy development and wider community understanding. BITRE holds unique aviation, maritime, road and rail transport data collections which are made available in a number of publication series. BITRE also publishes the results of individual research projects. Most BITRE publications are made available on its website. BITRE employs about 30 staff, comprising economists, statisticians, modellers, social researchers and policy analysts. For more information visit https://bitre.gov.au/

Draft National Infrastructure Data Collection and Dissemination Plan 4
Chapter 1: Introduction
Key Points
A National Infrastructure Data Collection and Dissemination Plan (Data Plan) is being developed to provide improved and more timely information for infrastructure decisions and monitoring infrastructure performance. This chapter of the Draft Data Plan summarises the background to the overall project and the process used to develop the Data Plan.
Background
Better software, better technology and better use of data is fundamentally changing the way that
our infrastructure networks operate. As new technologies are developed and rapidly become very
affordable, they are taken up very quickly by businesses and organisations in the infrastructure
sectors. The increasing automation of infrastructure services is also fundamentally changing our
built environment. Infrastructure assets and vehicles are now providing us with real-time
information on the movement of people and goods.
New ways of generating, collecting, sharing and analysing data can help us determine where
infrastructure investments are most required and how to better utilise existing infrastructure assets.
The ability to connect infrastructure users with operators also has the potential promoting
consumer-focussed infrastructure decision making1.
For example, smart traffic sensors can report on road conditions and congestion. GPS Tracking
devices can pinpoint the exact locations of buses or the whereabouts of emergency crews.
Automated weather stations can report conditions, and smart phones contain sensors that can –
when specifically authorised by their users to do so – collect their position, speed, commuting
patterns, where they cluster at different times of the day and the environmental conditions around
them2.
The Australian Government recognises the opportunity to utilise the growing quantity of
infrastructure and transport data. In November 2016, the Minister for Urban Infrastructure, the Hon
Paul Fletcher MP, announced a focus on obtaining more and better data in the transport and
infrastructure space, through a National Infrastructure Data Collection and Dissemination Plan
(Data Plan). The announcement was made as part of the Commonwealth Government’s response
to Infrastructure Australia’s Australian Infrastructure Plan, which also highlights the importance of
data in infrastructure decision making.
1 Infrastructure Australia (2016), Australian Infrastructure Plan, http://infrastructureaustralia.gov.au/policy-publications/publications/Australian-Infrastructure-Plan.aspx 2 Smart Cities Council (2014), Smart Cities Readers Guide, http://kenosha.uwex.edu/files/2013/11/SmartCitiesCouncil-READINESSGUIDEV1.5-7.17.14.pdf

Draft National Infrastructure Data Collection and Dissemination Plan 5
The Data Plan will improve and coordinate information and data collection, and will provide improved and more timely information for infrastructure investment decisions and monitoring of the performance of Australia's infrastructure networks. Developing opportunities to harness new data sources (including 'Big Data') from emerging data sources will be a key part of the Data Plan's development. Minister Fletcher released the Terms of Reference for the National Infrastructure Data Collection and Dissemination Plan on 28 February 2017 (Attachment B) that outlines the overall objectives
of the Data Plan:
Identify key national infrastructure and transport statistics;
Develop national infrastructure performance measures;
Identify opportunities to use new technologies to collect infrastructure data;
Develop means of disseminating data to encourage innovation and improved public and
private decision making; and
Promote and identify priority projects that:
o Fill key data gaps
o Develop and report performance relevant to infrastructure operators and customers
o Support innovation in data collection and use.
Scope
The Data Plan will focus on data used to assess and inform the performance, investment and planning related to Australia’s transport, water, energy and communications infrastructure networks and assets. Infrastructure use and impact will also be assessed as part of the Plan.
Project management
The Bureau of Infrastructure, Transport and Regional Economics (BITRE), within the Department of Infrastructure and Regional Development, is leading the development of the Data Plan, with assistance from an expert Steering Group (see Appendix C for membership).
Building on similar projects
The Data Plan will draw on similar recently completed, or ongoing, projects, including:
The National Transport Commission’s (NTC): Who moves what where: Better informing
transport planning for Australians
Australian Strategic Transportation Agenda for Research and Technology (ASTART)
The Australian Transport Data Action Network (ATDAN)
New Zealand Transport Domain Plan and Transport Research Strategy 2016–2020
State and territory transport and infrastructure data projects.

Draft National Infrastructure Data Collection and Dissemination Plan 6
Approach for developing the Draft Data Plan
This Draft Data Plan was developed using a similar process to develop the New Zealand Transport
Domain Plan3. This involved the following steps:
Identifying Enduring Questions, gaps and opportunities (Chapter 2)
Creating an initial list of ‘Enduring Questions’ to be addressed in the Data Plan, grouped by
overarching topic (such as ‘Infrastructure performance’). These were developed based on
Steering Group feedback and the Terms of Reference for the project. They outline the main
infrastructure statistical and information needs for the Data Plan.
Identifying and summarising key data and information sources4, data and information gaps
and opportunities that relate to the Enduring Questions. This provides an assessment of
what we already know and what we need to know.
Prioritising enduring questions and gaps based on early stakeholder feedback. This process
serves to manage the scope of the Data Plan. The Data Plan is developed around these
Prioritised Enduring Questions.
Opportunities (Chapter 3)
Identifying opportunities to expand existing projects and develop new projects to address
gaps.
Identifying opportunities to utilise data from new and emerging technologies.
Infrastructure performance measures (Chapter 4)
Developing an infrastructure performance framework and applying it to different
infrastructure types
The framework incorporates customer-side measures and producer-side measures (of
which productivity is the primary focus here) of infrastructure performance and also
suggests some whole-of-supply chain measures.
Data dissemination (Chapter 5)
Consider the benefits from improved data dissemination.
The need for a national framework for public data sharing and accessibility.
Identifying priorities for improved data sharing and accessibility.
The Final Data Plan will incorporate stakeholder feedback and develop Priority Projects that relate to data priorities, utilising opportunities from new and emerging technologies, and improvements to data sharing and accessibility. The steps involved in developing the Data Plan are summarised in Figure 1.1.
3 Ministry of Transport (2016) - Transport Domain Plan. http://www.transport.govt.nz/research/transport-domain-plan/. 4 Key data sources refer to high-level statistical and information sources that relate to transport activity and infrastructure networks.

Draft National Infrastructure Data Collection and Dissemination Plan 7
Figure 1.1 Steps involved in developing the Data Plan
How to Contribute to the Data Plan
BITRE is particularly interested in receiving input from individuals and organisations on the
following aspects of the Draft Data Plan:
Key statistical and information sources, and data and information gaps (Chapter 2)
Prioritised Enduring Questions (Chapter 2)
Opportunities (Chapter 3)
Draft infrastructure and freight performance measures (Chapter 4)
Priorities for improving infrastructure data sharing and accessibility (Chapter 5)
Ideas for priority projects that relate to data gaps associated with prioritised Enduring
Questions.

Draft National Infrastructure Data Collection and Dissemination Plan 8
Specific requests for input are listed in Appendix A.
Formal submissions may be made by email or mail. By email: [email protected] By post: Data Collection and Dissemination Plan Bureau of Infrastructure, Transport and Regional Economics Department of Infrastructure and Regional Development GPO Box 594 CANBERRA CITY ACT 2601 Submissions are open until 1 November 2017.

Draft National Infrastructure Data Collection and Dissemination Plan 9
Chapter 2: Enduring Questions
Key Points
This chapter summarises the prioritised Enduring Questions that were identified through initial stakeholder consultation and form the basis of the Data Plan. These Enduring Questions outline the underpinning reasons for collecting infrastructure data. Associated gaps and opportunities are also summarised.
Draft Enduring Questions and key data sources
Enduring questions were developed based on the Terms of Reference for the Data Plan and
Steering Group input. They outline the overarching questions that need to be addressed in order to
provide improved and more timely information for infrastructure investment decisions and
monitoring of the performance of Australia's infrastructure networks.
Enduring Questions were grouped into six broad categories:
1. Infrastructure stocktake
These questions seek to provide descriptive statistics on Australia’s major economic infrastructure
networks (transport, communications, energy and water). This information is essential for
infrastructure planning, measuring performance and understanding the impact of infrastructure.
2. Infrastructure performance
Australians expect their infrastructure networks to support a high quality, first world standard of
living5. These questions seek to assess the performance of Australia’s major economic
infrastructure networks and also develop customer-focussed measures of infrastructure
performance.
A draft Infrastructure Performance Framework based on these questions is included in Chapter 4.
Freight performance measures are also applied to this framework.
3. Infrastructure investment and planning
Investment in infrastructure has the capacity to stimulate and enhance the productivity of the
economy in both the short and long term. It is an investment that has a multiplier effect throughout
the economy, generating lasting economic, social and environmental benefits. These questions
seek to provide better information to promote sound infrastructure investment, decision making and
planning by governments.
5 Infrastructure Australia (2015), Australian Infrastructure Audit. http://infrastructureaustralia.gov.au/policy-publications/publications/Australian-Infrastructure-Audit.aspx.

Draft National Infrastructure Data Collection and Dissemination Plan 10
4. Impact of infrastructure
Efficient and effective infrastructure is a key driver of the Australian economy and its use has
significant environmental impacts, for example, through carbon emissions. Infrastructure, or lack of
infrastructure, also has key social impacts, such as, social exclusion6. These questions attempt to
better assess the economic, environmental and social impacts of infrastructure.
5a. Infrastructure use – Transport
These questions are aimed at improving the quality of freight and passenger data to enable better
informed planning and policy development.
5b. Infrastructure use – Energy, Water and Communications
This section aims to better understand the provision of energy, water and communications services
in Australia.
6. Data for decision making and innovation
These questions relate to improving the availability, discoverability and accessibility of government
and non-government transport and infrastructure data.
6 Australian Institute of Family Studies (2011).The Relationship Between Transport and Disadvantage in Australia Report. https://aifs.gov.au/cfca/publications/relationship-between-transport-and-disadvantage-austr

Draft National Infrastructure Data Collection and Dissemination Plan 11
Table 2.1 Draft Enduring Questions
Topic Enduring Questions
1. Infrastructure Stocktake EQ 1.1 – What infrastructure does Australia have, what is its capacity, geospatial location and value?
EQ 1.2 – What is the condition of Australia’s infrastructure?
2. Infrastructure and freight
performance
EQ 2.1 – How well are Australia’s infrastructure networks performing?
EQ 2.2 – How can customer satisfaction measures be combined with other infrastructure performance
measures to provide a holistic measure of the performance of Australia’s infrastructure networks?
EQ 2.3 – [Specifically] How well is Australia’s freight sector performing?
3. Infrastructure investment and
planning
EQ 3.1 – How well are infrastructure projects assessed in Australia before they are built?
EQ 3.2 – What are the planned and actual costs and benefits involved in infrastructure projects?
EQ 3.3 – How do infrastructure construction costs vary?
EQ 3.4 – Are Australia’s infrastructure assets sufficient to meet current and projected needs?
4. What are the impacts of our
infrastructure?
EQ 4.1 – In what ways and to what extent does infrastructure provision impact on the environment?
EQ 4.2 – What are the social impacts of infrastructure?
EQ 4.3 – What are the main sources, types and quantities of economic benefits from transport?
5a. Infrastructure use – Transport EQ 5.1a – What freight is moving to, from and around Australia, what is it comprised of, how are different
industries affecting the volume and value of freight?
EQ 5.2a – How and when does freight move to, from and around Australia, and by what routes?
EQ 5.3a – What barriers exist to efficiently transporting freight to, from and around Australia?
EQ 5.4a – What are the key service characteristics of freight movement services in Australia (including cost,
time and reliability) and how do these characteristics affect mode and route choice, and the amount and type
of services provided?
EQ 5.5a – How, when, why and in what numbers do people travel to, from and within Australia, for what
purposes, what are the origins and destinations of their journeys?
5b. Infrastructure use– Energy,
Water and Communications
EQ 5.1b – What are the key service characteristics for water, energy and communications (including cost,
time, speed, accessibility and reliability) and how do these characteristics affect the amount and type of
services provided?
6. Data for decision making and
innovation
EQ 6.1 – What infrastructure data and information is currently publicly available and what datasets and
information can be made available?
EQ 6.2 – What data do governments need to provide in order to enable emerging technologies and
innovative business models of infrastructure provision and use?
EQ 6.3 How can existing and new data be used to enhance transport service delivery? What data can be
collected from existing and future transport services and infrastructure?

Draft National Infrastructure Data Collection and Dissemination Plan 12
Table 2.2 Key data and information sources, grouped by Enduring Question subject area7
Topic Key data and information sources
1. Infrastructure
Stocktake
Australian Infrastructure Audit (IA). Undertaken every five years and summarises current stock of infrastructure and
whether this is sufficient to meet current and projected demand
Transport and Infrastructure Council Road Expenditure and Condition Plans and Asset Registers
Infrastructure Yearbook – BITRE– summary statistics for all economic infrastructure types
An assessment of available data, by sector, is included below:
Data available? Gaps?
Transport Yes- National and state-level data Yes – particularly for rail. Also issues with consistency between collections (e.g road condition data and detailed road maintenance data).
Energy Yes – consistent data available for most states
Yes – not all states covered for indicators based on the National Electricity Market (NEM)
Water Yes – consistent data available for large water providers
Yes – data missing for small water providers and rural water services
Communications Yes – data available for large communication projects (e.g. NBN)
Yes – limited publicly available data on condition of networks
2. Infrastructure and
freight performance
BITRE’s review of existing performance frameworks8 summarises some available infrastructure performance
frameworks.
Performance data is available for all infrastructure types, specific gaps include: Transport - particularly around comparisons between states and modes Energy - not all states covered, particularly for National Electricity Market (NEM) reliability indicators Water - data missing for small water providers and rural water services, especially in regard to water quality indicators
Communications - limited information on internet reliability, actual internet speeds, and service quality for mobile phones
3. Infrastructure
investment and planning
Infrastructure business cases, post completion reports, annual reports, industry reports (e.g. “Electricity Generation
Major Projects”)
BITRE Infrastructure benchmarking report
Infrastructure asset management models
State government and BITRE demand forecasting
State government infrastructure and transport planning documents
ABS population projections
4. What are the impacts of
our infrastructure?
Infrastructure business cases
Benefit realisation studies (ex-post analyses)
ABS National Accounts (Gross Value Added by industry)
ABS Census information (e.g. employment/household location and spatial distribution of incomes).
BITRE Yearbook (transport emissions, safety and freight data help track the broader impacts of transport infrastructure).
Department of Environment, numerous reports about emissions by sector (e.g. Australia’s Emissions Projections)
7 Appendix D contains more detailed information on key data and information sources. 8 BITRE (2017), Measuring Infrastructure Asset Performance and Customer Satisfaction.

Draft National Infrastructure Data Collection and Dissemination Plan 13
Table 2.2 Key data and information sources, grouped by Enduring Question subject area (continued)9
5a. Infrastructure use –
Transport
Infrastructure Yearbook (BITRE)
Mode-specific domestic and international freight information (BITRE)
NTC’s Who Moves What Where Project (Freight)
New and alternative sources of road traffic-related data, such as, GPS, Bluetooth readers and video imaging
detection10,11
Household Travel Surveys (states) Journey to Work surveys (ABS)
Smart card (e.g. Opal, Myki) data
State government road reports and traffic data (numerous sources)
5b. Infrastructure use –
Energy, Water and
Communications
Infrastructure Yearbook (BITRE)
Energy, Water and Communication specific government reports (e.g. ACMA monitoring report) and industry reports (e.g.
Optus coverage maps)
6. Data for decision
making and innovation
Open data portals (data.gov.au and state and territory open data portals)
Transport and infrastructure data portals (e.g. Aurin Portal)
Infrastructure Pipeline portal (IPA), http://infrastructurepipeline.org/
9 Appendix D contains more detailed information on key data and information sources. 10 Data sources summarised in https://bitre.gov.au/events/2014/files/NewDataSources-BackgroundPaper-April%202014.pdf 11Data can also be used to assess infrastructure performance

Draft National Infrastructure Data Collection and Dissemination Plan 14
Priority Enduring Questions, Gaps and Opportunities
Based on initial Steering Group consultation, the Enduring Questions were prioritised depending
on the relevance of identified associated data and information gaps and the feasibility (in terms of
cost and time) of addressing these data and information gaps as part of the Data Plan.
These Priority Enduring Questions serve to manage the scope of the Data Plan and promote the
development of achievable Priority Projects (in the Final Data Plan). BITRE acknowledge that
Enduring Questions not prioritised are still important and warrant attention.
Table 2.3 Prioritised Enduring Questions, grouped by Enduring Question subject area
Topic Prioritised Enduring Questions
1. Infrastructure Stocktake EQ 1.2 – What is the condition of Australia’s infrastructure?
2. Infrastructure and freight performance EQ 2.1 – How well are Australia’s infrastructure networks performing?
EQ 2.3 – [Specifically] How well is Australia’s freight sector performing?
3. Infrastructure investment and planning EQ 3.2 – What are the planned and actual costs and benefits involved in infrastructure projects?
EQ 3.3 – How do infrastructure construction costs vary?
EQ 3.4 – Are Australia’s infrastructure assets sufficient to meet current and projected needs?
4. What are the impacts of our infrastructure? EQ 4.3 – What are the main sources, types and quantities of economic benefits from transport?
5a. Infrastructure use – Transport EQ 5.1a – What freight is moving to, from and around Australia, what is it comprised of, how are
different industries affecting the volume and value of freight?
EQ 5.2a – How and when does freight move to, from and around Australia, and by what routes?
EQ 5.3a – What barriers exist to efficiently transporting freight to, from and around Australia?
EQ 5.5a – How, when, why and in what numbers do people travel to, from and within Australia, for
what purposes, what are the origins and destinations of their journeys?
5b. Infrastructure use– Energy, Water and
Communications
EQ 5.1b – What are the key service characteristics for water, energy and communications (including
cost, time, speed, accessibility and reliability) and how do these characteristics affect the amount and
type of services provided?
6. Data for decision making and innovation EQ 6.1 – What infrastructure data and information is currently publicly available and what datasets
and information can be made available?
EQ 6.2 – What data do governments need to provide in order to enable emerging technologies and
innovative business models of infrastructure provision and use?

Draft National Infrastructure Data Collection and Dissemination Plan 15
Table 2.4 Prioritised Enduring Questions, associated data and information gaps and opportunities
EQ Data and Information Gaps Opportunity
1.2 Data for better infrastructure asset management and the ability to make like-for-like
comparisons.
Cost effective approach to monitoring of (transport infrastructure) assets. Using this data to
create a national database.
2.1 A consistent approach for measuring infrastructure performance. Develop an Infrastructure performance framework and key performance metrics for transport,
energy water and communications sectors.
2.3 Measuring freight performance. Develop a national freight performance framework and associated freight indicators.
3.2 Determining the accuracy of benefit cost ratios (BCRs). BITRE to continue post completion analysis work.
3.3 Assessing value for money in infrastructure investments. BITRE to continue cost benchmarking work.
3.4 Population estimates or growth factors for rapidly growing small areas. Develop short-term population updates or growth factors for the fast growing areas.
4.3 Measuring transport’s economic contribution. Develop Transport Satellite Account.
5.1a Better understanding the movement of freight to and from ports. Utilise Customs data collected by the Department of Immigration and Border Protection.
5.2a
5.3a
Determining points of congestion for freight vehicles and when road freight is moved
around Australia.
BITRE to continue and expand their collection and analysis of truck telematics data.
5.5a Understanding large scale patterns in the movement of people. Use of emerging data sources.
5.1b Reporting on water, energy and communications infrastructure use. Track developments in water, energy and communications infrastructure use reporting.
6.1 Consistent data standards for transport and infrastructure data. Promoting consistent data standards.
6.1 Information on best-practice modelling assumptions. Develop and promote best-practice modelling assumptions
6.1 Locating and understanding available transport and infrastructure datasets. Projects aimed at improving the discoverability and metadata information for infrastructure
datasets (e.g. improvements to data.gov.au).
6.1 Incomplete recording of historical infrastructure and transport data, policies and
regulation.
Promote the recording of historical infrastructure data and information.
6.1 Data sharing guidance, methods and standards. Facilitate data sharing by developing data sharing guidance, methods and standards.
6.2 Open data to support the implementation of Connected and Automated Vehicles
(CAVs).
Identify gaps between what road operator data is provided to users (e.g. TomTom) and what
is likely to be required in future for CAV operations.

Draft National Infrastructure Data Collection and Dissemination Plan 16
Chapter 3: Opportunities
Key Points
This chapter outlines opportunities to address the information and data gaps identified for the Prioritised Enduring Questions (summarised in Table 2.4). Opportunities are grouped into ‘expanding ongoing projects’, ‘developing new projects’ and ‘harnessing data from new and emerging sources’. Case studies illustrating how data can be used to address gaps are also discussed. ‘Infrastructure and freight performance’ Enduring Questions (EQ 2.1 and 2.3) and ‘Data for decision making and innovation’ Enduring Questions (EQ 6.1 and 6.3) are discussed in more detail in Chapter 4 and 5.
EQ 1.2 – What is the condition of Australia’s infrastructure?
Data gap: Data for better transport infrastructure asset management and the ability to
make like-for-like comparisons.
Description: Current monitoring of transport infrastructure assets (such as roads, tracks,
bridges, and tunnels) is made on an ad hoc basis, with data being collected by
private or public entities. This leads to difficulties in developing consistent
infrastructure asset management measures and difficulties in having near real-
time asset management (where needed).
Opportunity: There is a need for a cost effective approach to monitoring transport
infrastructure assets and using this data to create a national database, similar
to the Heavy Vehicle Infrastructure Asset Registers (Case Study 3.1). There is
also an opportunity to use more data from smart sensors and other emerging
data sources for real time monitoring of infrastructure assets.
Expanding existing work New project Data from new and emerging sources
EQ 2.1 – How well are Australia’s infrastructure networks performing?
Data gap: A consistent approach for measuring infrastructure performance.
Description: In many cases, there is little or no requirement for infrastructure operators to
collect performance data that can be used to measure performance or to
enable comparisons to be made between infrastructure asset types. In even
fewer circumstances has data been used to incentivise infrastructure owners to
respond to the needs of their customers. This leads to difficulties in comparing
infrastructure performance across infrastructure operators and asset types.
Opportunity: Develop a consistent and general framework for comparing performance,
incorporating customer satisfaction, across different infrastructure asset types
and to develop infrastructure key performance measures. This is addressed in
Chapter 4 of the Data Plan.
Expanding existing work New project Data from new and emerging sources

Draft National Infrastructure Data Collection and Dissemination Plan 17
Case Study 3.1 - Heavy Vehicle Infrastructure Asset Registers
Heavy Vehicle Infrastructure Asset Registers (asset registers) provide information on key freight routes across Australia. The asset registers increase the transparency of service delivery to the heavy vehicle industry and enhance public understanding of the performance of the road infrastructure network.
The asset registers are developed annually for each jurisdiction and published on the Transport and Infrastructure Council website12. The information is provided in both data tables and interactive map files, which can be opened in Google Earth or a similar mapping application.
Opportunities exist to improve and expand on the asset registers over time, including, for example: harmonisation of asset reporting data across states and territories; improved data accessibility; and increased breadth of data – to incorporate more roads.
.
EQ 2.3 – How well is Australia’s freight sector performing?
Data gap: Measuring freight performance.
Description: Mode-specific freight indicators are currently available in a number of
publications from BITRE and other sources. However, this information is not
easily available, making comparisons across transport modes difficult. There is
also limited information on supply chain performance measures.
Opportunity: Develop a freight performance framework, including identifying and developing
new performance measures – This is addressed in Chapter 4 of the Data Plan.
Expanding existing work New project Data from new and emerging sources
12 Transport and Infrastructure Council, Heavy Vehicle Road Reform, http://transportinfrastructurecouncil.gov.au/publications/heavy_vehicle_road_reform.aspx
The image to the left shows heavy vehicle infrastructure routes in Ravenshoe (Far North Qld).
Ratings above the expected level for a particular road type are coloured blue, those within the expected range are coloured green while those with a rating below the expected range are coloured red.

Draft National Infrastructure Data Collection and Dissemination Plan 18
EQ 3.2 – What are the planned and actual costs and benefits involved in infrastructure
projects?
Data gap: Determining the accuracy of cost benefit studies for infrastructure projects.
Description: Governments at all levels make infrastructure spending decisions based on
cost-benefit analyses (CBA). CBAs are a rigorous, transparent, quantitative
method that measures the degree to which individual projects generate net
benefits (benefits minus costs) across Australia, and allows comparison and
ranking of options and projects13. CBAs are conducted ex-ante (before
construction), meaning, based on CBAs only, there is limited information on
the accuracy of CBA predictions and whether projects fulfil their objectives.
Opportunity: Conduct independent post completion (ex-post) evaluations of CBAs for
infrastructure projects and make findings publicly available. This will
complement work already completed by BITRE (see Case Study 3.2).
Expanding existing work New project Data from new and emerging sources
Case Study 3.2 - Ex-post Economic Evaluation of National Road Investment Projects BITRE has undertaken two rounds of ex-post evaluations of national road investment projects: one in 2005-2007 and the other in 2014-2016. BITRE Research Report 145 (unpublished) synthesises the earlier ex-post evaluation results with the aim of identifying opportunities to improve future cost-benefit analyse (CBA) and project appraisal. Evidence drawn from the ex-post case studies suggests there is much room for improvement in the quality of practical Australian road CBAs if they are to be used as an effective tool for option ranking and project prioritisation purposes. Key areas identified for improvement include: - CBA documentation - CBA review - Traffic forecasts - Road user benefit assessment; and - Project cost estimation. Findings of this report are expected to inform the ongoing update of Australian Transport Assessment and Planning (ATAP) guidelines and Infrastructure Australia’s Assessment Framework, which will in turn contribute to making better infrastructure investment decisions in future.
13BITRE (2014), Overview of Project Appraisal for Land Transport. https://bitre.gov.au/publications/2014/files/overview_of_project_appraisal_for_land_transport.pdf
Draft National Infrastructure Data Collection and Dissemination Plan 19
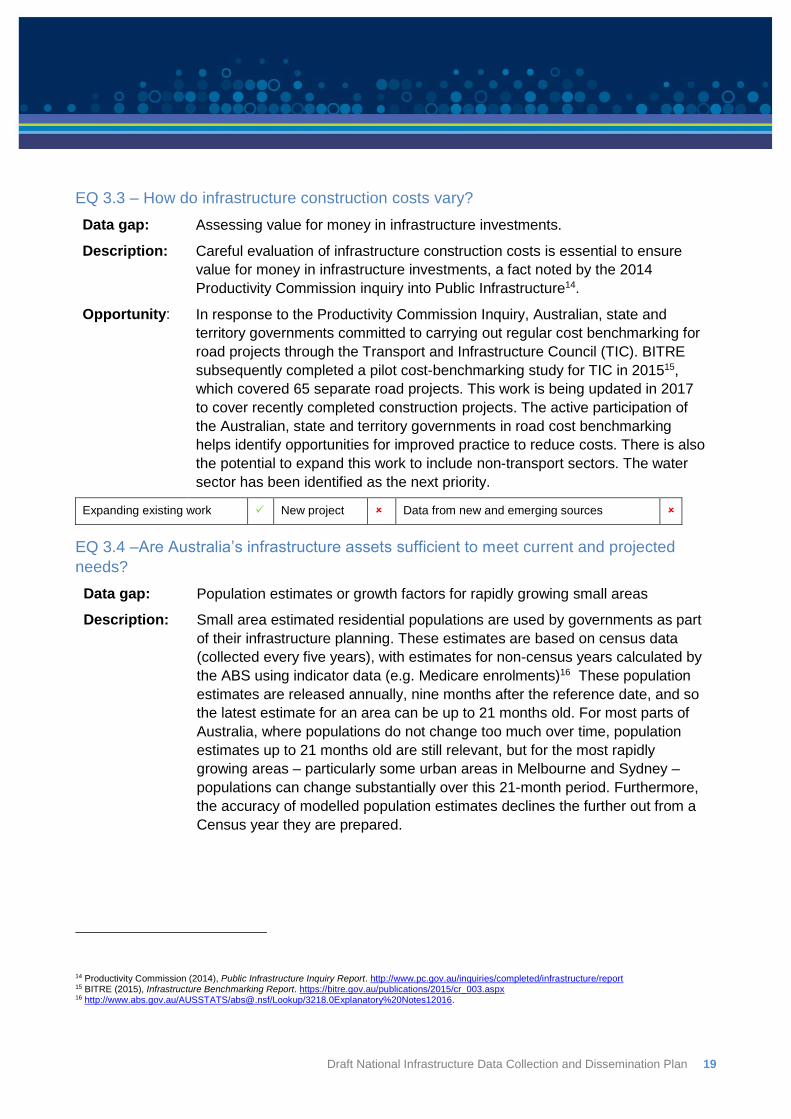
EQ 3.3 – How do infrastructure construction costs vary?
Data gap: Assessing value for money in infrastructure investments.
Description: Careful evaluation of infrastructure construction costs is essential to ensure
value for money in infrastructure investments, a fact noted by the 2014
Productivity Commission inquiry into Public Infrastructure14.
Opportunity: In response to the Productivity Commission Inquiry, Australian, state and
territory governments committed to carrying out regular cost benchmarking for
road projects through the Transport and Infrastructure Council (TIC). BITRE
subsequently completed a pilot cost-benchmarking study for TIC in 201515,
which covered 65 separate road projects. This work is being updated in 2017
to cover recently completed construction projects. The active participation of
the Australian, state and territory governments in road cost benchmarking
helps identify opportunities for improved practice to reduce costs. There is also
the potential to expand this work to include non-transport sectors. The water
sector has been identified as the next priority.
Expanding existing work New project Data from new and emerging sources
EQ 3.4 –Are Australia’s infrastructure assets sufficient to meet current and projected
needs?
Data gap: Population estimates or growth factors for rapidly growing small areas
Description: Small area estimated residential populations are used by governments as part
of their infrastructure planning. These estimates are based on census data
(collected every five years), with estimates for non-census years calculated by
the ABS using indicator data (e.g. Medicare enrolments)16 These population
estimates are released annually, nine months after the reference date, and so
the latest estimate for an area can be up to 21 months old. For most parts of
Australia, where populations do not change too much over time, population
estimates up to 21 months old are still relevant, but for the most rapidly
growing areas – particularly some urban areas in Melbourne and Sydney –
populations can change substantially over this 21-month period. Furthermore,
the accuracy of modelled population estimates declines the further out from a
Census year they are prepared.
14 Productivity Commission (2014), Public Infrastructure Inquiry Report. http://www.pc.gov.au/inquiries/completed/infrastructure/report 15 BITRE (2015), Infrastructure Benchmarking Report. https://bitre.gov.au/publications/2015/cr_003.aspx 16 http://www.abs.gov.au/AUSSTATS/[email protected]/Lookup/3218.0Explanatory%20Notes12016.

Draft National Infrastructure Data Collection and Dissemination Plan 20
Opportunity: The ABS could take on responsibility for developing short-term population
updates or growth factors for the fastest growing areas – thereby reducing the
need for multiple government departments to produce their own population
estimates, and leading to a consistent methodology. These estimates would
need to draw on a wide range of data sources, some not currently utilised in
the development of population estimates.
Expanding existing work New project Data from new and emerging sources
EQ 4.3 – What are the main sources, types and quantities of economic benefits from
transport?
Data gap: Measuring transport’s economic contribution.
Description: At present, a key gap that exists with transport statistics is having a set of
detailed, up-to-date economic measures of transport activity undertaken within
industries whose main function is not transport, including transport activities
that occur as part of retail and within mining, agricultural and service industries.
Opportunity: The ABS to develop a “Transport Satellite Account” (TrSA) to assess the full
contribution of transport across the whole of the economy. This would make it
possible to measure transport activity undertaken by all industries, including
their costs, capital expenditure, income, employment, hours worked, as well as
volume data such as vehicle stocks and even emissions. The need for a TrSA
has been raised by ATDAN and the NTC17, and would also be integral for
developing transport productivity estimates (see Chapter 4, ‘Infrastructure
Productivity’). Preliminary scoping work for a TrSA been carried out by the
ABS18.
Expanding existing work New project Data from new and emerging sources
17 National Transport Commission (2017), Who moves what where: Better informing transport planning for Australians, information sheet. https://www.ntc.gov.au/Media/Reports/(D121CACB-6406-F0FB-D940-8B1290BF2893).pdf 18 Australian Bureau of Statistics (2011), A Future Australian Transport Satellite Account, ABS Views, 2011, information sheet. http://www.abs.gov.au/ausstats/[email protected]/mf/5269.0.55.001

Draft National Infrastructure Data Collection and Dissemination Plan 21
EQ 5.1a – What freight is moving to, from and around Australia, what is it comprised of,
how are different industries affecting the volume and value of freight?
Data gap: Better understanding the movement of freight to and from ports.
Description: BITRE currently reports on Australia’s international trade using trade data from
the ABS, which is based on Customs information collected by the Department
of Immigration and Border Protection (DIBP). This data provides information on
commodity type, mode of transport (air or sea), freight volume and value, and
port of origin and destination19. However, DIBP also collects more detailed data
that provides information on how freight is carried (for example, containerised
versus non containerised) and the location (postcode) of the importer or
exporter.
Opportunity: NTC recently established a data sharing arrangement with DIBP for BITRE
and state territory transport agencies to access confidentialised Customs
freight data. There is an opportunity to utilise this data source to better
understand freight movements to and from ports in Australia.
Expanding existing work New project Data from new and emerging sources
EQ 5.2a – How and when does freight move to, from and around Australia, and by what
routes?; and
EQ 5.3a – What barriers exist to efficiently transporting freight to, from and around
Australia?
Data gap: Determining points of congestion for freight vehicles and when road freight is
moved around Australia.
Description: The high cost and significant lag time of collecting freight-related data by
traditional surveys means that detailed data on road freight movements in
Australia is scarce, not sufficiently timely and not available at low enough
levels of geography. This lack of sufficient data to inform decision making
increases the risk of governments underinvesting, or investing in the wrong
places. There is also limited data on congestion, which is of particular interest
to the public, industry and government.
Opportunity: BITRE and the ABS are currently working to develop innovative means of
collecting road freight data from telematics and administrative data sources.
This project has involved collaboration with the Australian Trucking Association
(ATA) and Australian Logistics Council (ALC), freight industry operators,
government agencies, vehicle telematics services providers and other freight
industry stakeholders.
19 See Chapter One of Australian Sea Freight 2014-15 for example analysis output – https://bitre.gov.au/publications/2017/files/asf_2014_15.pdf.

Draft National Infrastructure Data Collection and Dissemination Plan 22
A pilot study using vehicle telematics data was completed in 2016 (see Case
Study 3.3).
BITRE is currently working with Data61 to expand this pilot study into a pilot
collection, by moving to routine collection of data from a larger sample of fleet
operators. This will enable users inside and outside government to better
understand the freight industry, including identifying points of congestion and
patterns in the movement of road freight.
Expanding existing work New project Data from new and emerging sources
Case Study 3.3 – Road freight telematics pilot study
BITRE and the ABS recently completed a pilot study using vehicle telematics data based on one month of vehicle GPS records, collected from 1,500 vehicles. This equates to approximately 18 million individual GPS records. Data from the analysis provides insights into questions that influence government and private sector decisions that shape our transport infrastructure, including: - What routes are currently used by freight vehicles, and do these align with agreed national freight routes? - Where does freight congestion occur? What parts of the network are the most congested locations for freight? - Where do trucks stop? Is the existing network of rest stops and service centres adequate? - How do route travel times vary across urban areas? - How do freight movements vary over time and by region?
The figure (left) is based on the GPS sample dataset and shows average truck speeds across roads in the Sydney Greater Metropolitan Area, during the sample period (May 2016). Red sections represent slow average speeds and the coloured circles represent stops at popular stop locations.

Draft National Infrastructure Data Collection and Dissemination Plan 23
EQ 5.5a – How, when, why and in what numbers do people travel to, from and within
Australia, for what purposes, what are the origins and destinations of their journeys?
Data gap: Understanding large scale patterns in the movement of people.
Description: Temporary population estimates, which represent actual population counts for
areas at particular points in time, are a significant data gap and provide
information on large scale movements of people. For example, patterns in
movements of people from their usual residence to place of work or study. This
is particularly a problem for regional areas, where movement data sources often
do not exist (e.g. Smart Card data). A data gap also exists in understanding how
and why people travel within Australia.
Opportunity: There is an opportunity to use telecommunications data (see Case Study 3.4)
and other emerging sources of data (see Case Study 3.5) to better understand
the movement of people within Australia, both in regional and urban areas. This
could compliment already completed work by the ABS20 and other agencies.
Expanding existing work New project Data from new and emerging sources
Case Study 3.4 – Telstra Location Insights®
Telstra Location Insights® utilises aggregated and anonymised GSM (Global Systems for Mobile Communications) data from Telstra’s national mobile network and CRM platform. Telstra weights and projects against the ABS universal estimates, enabling Telstra to offer rich insights on the movements of the national Australian population, with characteristics such as location, travel patterns, times and demographics while ensuring that customer privacy is protected. As of 11 May 2017, Telstra has matured its spatial resolution offering from SA2 sized geometries to higher granularity of SA1 sized areas.
Customers are able to access near real-time insights on transient populations. Organisations can plan and report on performance of infrastructure before, during and after implementations, a council can quantify the strain of tourism on local facilities or government bodies can observe and predict the shift in population movements stemming from a natural disaster.
Case Study 3.5 – Using retail data to provide insights on the travel habits of granular
population segments
20 See Estimating Temporary Populations – the Power of Aggregates Mobile Device Data (2017). https://spatialinformationday.org.au/program/2017/estimating-temporary-populations-the-power-of-aggregated-mobile-device-data
The figure (left) is based on analysis Telstra completed for a client to better understand transient populations. The figure shows population insights at an SA1 level covering the Melbourne CBD district and inferring residential, worker and visitor representations using sophisticated data science modelling.

Draft National Infrastructure Data Collection and Dissemination Plan 24
Case Study 3.5 – Using retail data to provide insights on the travel habits of granular
population segments
Within Quantium’s data ecosystem, there are over 20 trillion data points on the everyday habits of
Australians, including anonymised credit and debit transaction records. Quantium has applied analytics to
these data points and other open source routing data to map citizen journeys. This was done by looking at
their transactions location at each point in their journey and applying algorithm to predict which path they
would have taken. This analysis provides insights into the travel habits of different population segments
and answers several questions, such as:
- Who are the travellers?
- Where are they travelling to?
- Why are they travelling? (for example, grocery shopping or attending medical appointments)
- Which segment of the road network are they using?
The images below shows retail footprint of citizens aged 65+ who live in the Sydney suburb of Liverpool, by
time of day and postcode. Darker colours represent higher number of retail transactions.
These images (Images) have been prepared by The Quantium Group Pty Limited and / or Market Blueprint Pty Ltd (together, Quantium) using raw data owned by National Australia Bank Limited (NAB). NAB has not been involved in the analysis of the raw data, nor the preparation of these Images and does not make any representation (express or implied), nor give any warranty in relation to the accuracy, completeness or appropriateness of the raw data or the analysis supporting these Images. To the maximum extent permitted by law, NAB expressly disclaims, takes no responsibility for and has no liability for the preparation, contents, accuracy or completeness of these Images or the analysis on which it is based. The information in this report is provided in confidence and may only be used for the purpose provided and may not be reproduced or disclosed without permission.

Draft National Infrastructure Data Collection and Dissemination Plan 25
EQ 5.1b – What are the key service characteristics for water, energy and communications
(including cost, time, speed, accessibility and reliability) and how do these characteristics
affect the amount and type of services provided?
Data gap: Better reporting on water, energy and communications infrastructure use.
Description: BITRE currently reports on water, energy and communications infrastructure use
in its Australian Infrastructure Yearbook based on data provided by external
sources. However, as specified in Table 2.2 and Appendix D, key data and
information gaps exist for these sectors, including, for example, lack of data for
rural water suppliers and limited data on actual internet speeds.
Opportunity: There is an opportunity to track developments in water, energy and
communications infrastructure use reporting, and to use new data and
information sources to report on infrastructure use. This could be done by
reviewing data sources as well as including these sectors in the Infrastructure
Performance Measurement Framework (discussed in Chapter 4).
Expanding existing work New project Data from new and emerging sources

Draft National Infrastructure Data Collection and Dissemination Plan 26
Chapter 4: Infrastructure performance measures
Key Points
This chapter presents a proposed draft infrastructure performance framework that is sufficiently general enough to cover the wide range of infrastructure sub-sectors, but at the same time also provides for collection of detailed measures to provide meaningful performance information. The framework incorporates customer-side measures and producer-side measures (of which productivity is the primary focus here) of infrastructure performance and also suggests some whole-of-supply chain measures. Data priorities relating to measuring infrastructure performance are also discussed.
Customer performance framework
Historically infrastructure performance has usually been measured on a mode-specific basis and
often using producer-centric output-based measures. However for customers, more relevant
measures include service availability, timeliness and reliability. Increasingly, for many customers,
whole-of-supply-chain, or door-to-door, performance is also of greater importance than the
performance of any individual mode or part of the transport supply chain.
Currently there is no customer-focused, consistent and broadly implemented infrastructure
performance measurement framework. In response to this, BITRE, in collaboration with the Better
Infrastructure Initiative, recently released a report, Measuring infrastructure asset performance and
customer satisfaction21, which outlines a newly developed infrastructure performance framework
created from the perspective of infrastructure users.
Service quality performance measures
The framework combines objective service quality performance measures and customer
perception of performance (subjective performance measures). The framework is divided into
seven service quality attributes which are applicable across the transport, water, communications
and energy sectors:
Price – what customers must pay to access an infrastructure asset or service.
Accessibility/availability – the degree to which an infrastructure service is accessible by its
customer or potential customers, either as a result of its coverage, its proximity to other
forms of infrastructure, and/or the frequency, and/or class of service22 (if applicable).
Timeliness – the average infrastructure service delivery time.
21 BITRE (2017), Measuring Infrastructure Asset Performance and Customer Satisfaction. 22 Class of service is relevant for when there are multiple classes of product in the same infrastructure asset category, which is particularly relevant for telecommunications services. For example, accessibility for mobile telecommunications services may relate to the coverage of 4G signal in a particular area, and customer’s perception of the availability of 4G signal in that area. Ratings of telecommunication service speed may be covered in either the Timeliness service quality attribute, or the Reliability service quality attribute, depending on the performance measures available and the phrasing of customer perception questions.

Draft National Infrastructure Data Collection and Dissemination Plan 27
Reliability – the degree to which an infrastructure asset’s availability varies, including the
variability in the timeliness (standard deviation) of services, travel times and the frequency
and length of interruptions to normal services.
Safety – typically measured by the number of casualties, health, and/or safety-related
incidents associated with the infrastructure asset or the service provided.
User amenity – the quality of an infrastructure asset or service provided, including
crowding, compliance with disability standards and the presence of desirable additional
features.
Information – the availability to consumers of timely and up-to-date information on the
status of the preceding service quality attributes.
Several further measures are frequently of great interest to infrastructure operators and
governments, if not to customers, and are often essential to gauging the operational efficiency of
infrastructure services. These include:
Activity (use) – the number of users (for example, passengers, freight volume, vehicles or
other relevant metric) of the infrastructure over a period of time.
Capacity – the capacity of the infrastructure or service in terms of either throughput per unit
time and/or maximum storage capacity at any point in time (where applicable).
These supplementary measures provide indicators of infrastructure service output, rather than
service outcomes encapsulated by the seven service quality attributes.
Several additional measures can be derived from these and other data sources, including:
Capacity utilisation – a measure of the margin to accommodate additional utilisation
derived from measures of activity and capacity. (The ACCC’s Airport Monitoring Report, for
example, captures and reports capacity utilisation measures across several aspects of
airport operations).
Productivity – the level of output (throughput) per unit of input (See Infrastructure
productivity section for further discussion).
Applying the framework
As per Figure 4.1, the framework involves identifying,
1. the infrastructure asset type;
2. the customer segment; and
3. an objective measure and customer perception measure for each service quality
attribute, and an objective measure for each supplementary output attribute (activity
and capacity).

Draft National Infrastructure Data Collection and Dissemination Plan 28
Figure 4.1 Infrastructure performance and customer satisfaction framework, flow diagram23
Objective measures and customer perceptions are then combined into a single metric for each
service quality attribute and output attribute using Eboli and Mazzulla’s (2011) methodology24.
As an example, Table 4.1 presents the infrastructure performance and customer satisfaction
framework in a form that shows how it might be applied to residential urban water. The measures
are sourced from the Bureau of Meteorology’s Urban water utilities national performance report25,
but further consideration should be given as to which measures are the most suitable proxies for
each service quality attribute.
Table 4.1 Application of Infrastructure Performance and Customer Satisfaction Framework, Urban Water –
Residential
Service quality attribute Candidate objective measures Customer perception
Price Annual bill based on 200kL/a – $ Residential customer rating of water costs
Availability Average duration of an unplanned interruption
– minutes
Residential customer rating of water availability
Timeliness Na Na
Reliability Average frequency of unplanned interruption
per 1 000 properties
Residential customer rating of water reliability
Safety Percentage of population where microbial
compliance is achieved
Residential customer rating of water safety
Amenity Water quality complaints per 1 000 properties Residential customer rating of water quality
Information Na Na
Activity Average annual residential water supplied – kL
per property
na
Capacity Urban water storage/conveyancing capacitya na
23 Adapted from BITRE (2017), Measuring Infrastructure Asset Performance and Customer Satisfaction. 24 Eboli, L., Mazzulla, G. (2011) A methodology for evaluating transit service quality based on subjective and objective measures from the passenger’s point of view, Transport Policy 18 (1), pp. 172-181. 25 Bureau of Meteorology (2016), National Performance Report 2015 – 2016: Urban Water Utilities, http://www.bom.gov.au/water/npr/
Infrastructure Asset
Customer Service Quality Attribute
Customer Perception
Objective Measure
• Price • Availability • Timeliness • Reliability • Safety • Amenity • Information

Draft National Infrastructure Data Collection and Dissemination Plan 29
Table 4.2 presents how the framework might be applied to roads. Most of the measures are taken
from the Transmission Gully Project (New Zealand road project) performance contract26, so would
most readily apply to toll roads, or other individual major roads, rather than a road network as a
whole.
Table 4.2 Application of Infrastructure Performance and Customer Satisfaction Framework, Toll Roads
Service quality attribute Candidate objective measures Customer perception
Price Cost of toll
Average annual increase in toll
Road user rating of toll price
Availability Percentage of time during the period whole
road is available to traffic
Road user rating of road availability
Timeliness Average time to delivery of
upgrades/maintenance
Road user rating of duration of road works
Reliability Percentage of time during the period where
travel times exceeds baseline travel time
Road user rating of congestion
Safety Number of incidents not responded to within 25
minutes after receipt of notification
Number of causalities/road crashes/fatalities on
road
Road user rating of incident response
Road user rating of safety of road
Amenity Percentage of road meeting pavement
condition assessment standard
Road user rating of road surface
Information Availability of real-time road and travel
condition information to road users
Road user rating of information services (e.g. road
closure, travel time advice, etc.)
Activity Average daily traffic Na
Capacity Maximum free flow traffic capacity Na
Source: BITRE (2017), Measuring Infrastructure Asset Performance and Customer Satisfaction.
Infrastructure productivity
Productivity is a measure of the rate at which inputs (labour, capital and intermediate goods) are
transformed into outputs. Infrastructure operators and governments focus on productivity because,
in developed economies, improved productivity is the largest driver of long-term income and GDP
growth, as well as a measure of competitiveness of trade-exposed industries.
26 Schedule 13 to the TGP contract: http://www.nzta.govt.nz/assets/projects/transmission-gully/docs/schedule-13.pdf

Draft National Infrastructure Data Collection and Dissemination Plan 30
BITRE produces two regular reports providing industry production performance:
Waterline provides information on container movements on both the wharf-side and landside
of five major Australian port terminal: Brisbane, Sydney, Melbourne, Adelaide and
Fremantle. The twice-yearly publication includes 24 container terminal productivity
measures, covering both capital and labour productivity measures.
Trainline provides an overview of freight, urban and non-urban passenger rail. The report
analyses traffic levels, the provision of infrastructure and rolling stock, and railway
performance.
BITRE has also previously analysed long-term trends in productivity in the road transport sector. In
the report, Truck productivity: sources, trends and future prospects27, BITRE calculated that
average road freight productivity doubled between 1971 and 2007, meaning that the 2007 road
freight task required half as many vehicles as would have been required in the absence of
productivity growth.
One problem with the existing data on transport productivity is that the transport, postal and
warehousing industry classification under the Australian and New Zealand Standard Industrial
Classification system only covers businesses whose primary activity is to provide transport, postal
and/or warehousing activities to third parties. This means, for example, that all of the transport-
related construction activity (e.g. rail infrastructure to Port Hedland) that has taken place in the
mining industry over the past decade is captured by mining sector productivity statistics, not the
transport, postal and warehousing productivity statistics. As a further example, only around a third
of total road vehicle capital and operating expenditure in 2010-11 was made by the transport,
postal and warehousing sector28. A Transport Satellite Account in the System of National Accounts
would “present a more complete picture of transport activity within the national accounting
framework by explicitly measuring transport services in all industries, not just the transport
industry” 29. Developing a Transport Satellite Account is listed as a data development opportunity in
Chapter 3 – EQ 4.3 – “What are the main sources, types and quantities of economic benefits from
transport?”.
A Transport Satellite Account would also present the opportunity to link physical data with
monetary data contained in the National Accounts. To this end, the National Transport Commission
(NTC) has recently considered potential measures of land transport activity and productivity that
would allow jurisdictional- and national-level comparison of this data over time30. Further work to
develop additional productivity indicators would require calculating the physical capital assets of
each infrastructure asset or transport mode.
27 BITRE (2011), Truck productivity: sources, trends and future prospects. https://bitre.gov.au/publications/2011/report_123.aspx. 28 ABS (2011), 9269.0 - Business Transport Activity, Australia, 2010-11, Australian Bureau of Statistics, Canberra. http://www.abs.gov.au/AUSSTATS/[email protected]/Lookup/9269.0Main+Features12010-11?OpenDocument. 29 ABS (2011), 5269.0.55.001 - Information Paper: A Future Australian Transport Satellite Account: ABS Views, Australian Bureau of Statistics, Canberra. http://www.abs.gov.au/ausstats/[email protected]/Lookup/5269.0.55.001Main+Features122011. 30 National Transport Commission (2017), Designing a national land transport productivity framework, report prepared by Houston Kemp, National Transport Commission, Melbourne.

Draft National Infrastructure Data Collection and Dissemination Plan 31
End-to-end (supply chain) performance
As part of the Inquiry into National Freight and Supply Chain Priorities, BITRE has proposed a new
focus on end-to-end supply chain performance31. The proposal centres on the performance of
freight supply chains, rather than individual assets or single transport modes within the chain. This
is an acknowledgement that exporters and importers are concerned with the aggregate
performance of the freight network, rather than the performance of individual firms or assets along
it. Many importers and exporters may only deal with one company along the freight supply chain
(for example, a freight forwarder), rather than each firm that will handle their goods.
A similar case can be made for other infrastructure networks in which customers may only interact
with one company. Residential and non-industrial electricity and gas customers only deal directly
with their energy retailer, but the quality of service they receive is also dependent on various gas
producers, electricity generators, and distribution and transmission companies.
End-to-end performance indicators
A narrower set of indicators will likely be possible for supply chain performance than are contained
in the full Measuring infrastructure asset performance and customer satisfaction32 set. Additional
measures, notably of productivity and capacity, which are important to the freight industry could
also be included in the end-to-end performance framework.
Some proposed mode-specific indicators are summarised in Table 4.2 and include indicators
currently available in a number of publications from BITRE (see Appendix D for descriptions of
data sources), as well as some indicators in development and/or based on data from new and
emerging sources.
31 Department Infrastructure and Regional Development, Inquiry into National Freight and Supply Chain Priorities, https://infrastructure.gov.au/transport/freight/files/working-paper_national-freight-performance-framework.pdf 32 BITRE (2017), Measuring Infrastructure Asset Performance and Customer Satisfaction

Draft National Infrastructure Data Collection and Dissemination Plan 32
Table 4.3 Existing mode-specific freight performance indicators
Container ports Rail Road Air freight
Cost $/container (including land-
side)33
ABS producer price indexes35*
Freight rate estimates34
ARTC revenue/tkm
ABS producer price index35
Freight rate
estimates34
ABS producer price
index34
Freight rate
estimates34
Travel/transport
time
Container turnaround times33
Truck turnaround times33
Vessel turnaround times33
Duration of import/export
procedures36
Scheduled terminal to
terminal time37
Some road speeds, as
available from states38
In development:
Average travel
time/Truck speeds on
key freight routes39
Reliability 95th percentile of ship
turnaround time33
Ships waiting at anchorage >
2hr33
Trains within 30 minutes of
schedule37
In development:
GPS truck movement
data40
GPS car data
Flight delays41
Productivity Wharfside, landside and whole
of port indicators33
Tonnes/route (track)km. Tonnes/truck per
kilometre42
ABS productivity estimates (whole of transport & storage industry)43
Capacity Ship turnaround times33 Scheduled dwell time (due
to other trains using line)37
Double stacking capacity
Permitted train lengths
Congestion measures
(e.g. GPS car data)
In development: truck
speeds at congested
locations (from GPS
data)40
Safety Maritime fatalities and injuries44 Rail-related fatalities and
injuries44
Fatalities and injuries
from heavy vehicle
crashes45
Aviation fatalities
and injuries44
*The producer price index (PPI) measures changes over time in prices received by producers
33 BITRE, Waterline. https://bitre.gov.au/publications/2017/water_059.aspx 34 BITRE (2017), Freight rates in Australia. https://bitre.gov.au/publications/2017/is_090.aspx 35 ABS, Producer Price Indexes. http://www.abs.gov.au/ausstats/[email protected]/mf/6427.0 36 Available from Dept. of Immigration & Border Protection 37 BITRE, Trainline. https://bitre.gov.au/publications/2016/train_004.aspx 38 For example, TfNSW Historical Travel Time Data. https://opendata.transport.nsw.gov.au/dataset/historic-roads-travel-time-data-ttds 39 See example in Chapter 4, Case Study 4.1. 40 See Road freight telematics project in Chapter 5 –EQ 5.2 and 5.3. 41 BITRE. Domestic on time performance. https://bitre.gov.au/statistics/aviation/otphome.aspx 42 ABS, Survey of Motor Vehicle Use. http://www.abs.gov.au/ausstats/[email protected]/mf/9208.0 43 ABS, Estimates of Industry Multifactor Productivity. http://www.abs.gov.au/AUSSTATS/[email protected]/DetailsPage/5260.0.55.0022015-16?OpenDocument 44 BITRE. Australian Infrastructure Statistics—Yearbook. https://bitre.gov.au/publications/2016/yearbook_2016.aspx 45 BITRE. Fatal Heavy Vehicle Crashes – Quarterly Bulletins. https://bitre.gov.au/publications/ongoing/fatal_heavy_vehicle_crashes_quarterly.aspx

Draft National Infrastructure Data Collection and Dissemination Plan 33
Complementing the mode-specific performance indicators already collected and those in
development, BITRE proposes investigating three additional indicators: access, land
use/encroachment and emissions. These are summarised in Table 4.3.
Table 4.4 Potential new mode-specific indicators
Indicator Transport modes Potential indicators
Access Road % of network accessible to each vehicle class
% of producers within a set distance of network for each
class
Land
use/encroachment
All modes – Air and Sea
Ports, intermodal
terminals, logistics
precincts
Population and jobs density within set distance of port
precinct or intermodal terminal sites
Congestion on roads approaching ports
Environment Road, Rail, Air, Sea Emissions per tonne kilometre of freight
Overarching framework
These three perspectives presented in this chapter—customer, productivity and supply chain—are
closely related. While they fulfil different purposes, one important commonality is the data used in
each. The data for the three supply chain indicators include the same data that as three of the
service quality attributes in the infrastructure performance and customer satisfaction framework.
Data on activity and capacity can both be used by productivity measures and the infrastructure
performance and customer satisfaction framework. The interaction of the three perspectives with
data collection is shown in Figure 4.2.
Figure 4.2 Data requirements for performance frameworks

Draft National Infrastructure Data Collection and Dissemination Plan 34
Priorities for measuring infrastructure performance
The following data priorities are based on data gaps related to Enduring Questions under Topic 2
– ‘Infrastructure and freight performance’ (see Table 2.4).
EQ 2.1 – How well are Australia’s infrastructure networks and assets performing?
Data gap: A consistent approach for measuring infrastructure performance across and
within infrastructure sectors.
Description: As discussed earlier in this chapter, BITRE has developed a consistent and
general framework for comparing infrastructure performance.
Opportunity: Specific objective and customer-focussed service quality performance indicators for example water, energy, communications and transport assets could be developed or identified (based on existing performance reporting) and applied to this framework. These indicators could be presented in an accessible location and updated regularly to allow performance comparisons over time, and between and within infrastructure types and assets. The framework would also provide an opportunity to expose key data gaps.
Expanding existing work New project Data from new and emerging sources
EQ 2.3 – [Specifically] How well is Australia’s freight sector performing?
Data gap: Measuring freight performance
Description: BITRE has recently proposed a National Freight Performance Framework
and associated freight performance indicators.
Opportunity 1:
Mode-specific freight indicators
As part of a National Freight Performance Framework, these freight
indicators could be presented in a single location, which would increase
visibility and provide an overall picture of freight performance (see example
presentation in Table 4.5). This work would involve first developing a set of
widely agreed performance indicators, some potential indicators are
presented in Table 4.3.
Expanding existing work New project Data from new and emerging sources

Draft National Infrastructure Data Collection and Dissemination Plan 35
Table 4.5 Potential presentation of new mode-specific freight performance indicators, using price and
reliability indicators as an example.
Infrastructure
asset
Customer Service
quality
attribute
Objective
measure
Performance over past decade
Container ports Freight
importers
and
exporters
Price Port Interface
Cost Index (real
$/container,
index
2016=100)
Steady
Rail Freight
movers
Price Non-bulk rail
freight rate (real
$/ntk)
Steady
Road Freight
movers
Price Non-bulk road
freight rate (real
$/ntk) Steady
Air freight Freight
movers
Price Air freight rate
(real $/ntk)
Steady
Container ports Freight
importers
and
exporters
Reliability 95th percentile
of ship
turnaround time
(hours)
Improving
Aviation Freight
movers
Reliability % flights within
15 min of
schedule
Steady
0
50
100
150
2007 2008 2009 2010 2011 2012 2013 2014 2015 2016
0
1
2
3
4
5
20062007200820092010201120122013201420152016
0
2
4
6
8
10
2006 2007 2008 2009 2010 2011 2012 2013 2014 2015 2016
0
50
100
150
200
2007 2008 2009 2010 2011 2012 2013 2014 2015 2016
0
20
40
60
80
2007 2008 2009 2010 2011 2012 2013 2014 2015 2016
0
0.2
0.4
0.6
0.8
1
2006 2007 2008 2009 2010 2011 2012 2013 2014 2015

Draft National Infrastructure Data Collection and Dissemination Plan 36
Opportunity 2: Individual supply chain performance indicators.
For specific supply chains, mode specific indicators could also be combined to calculate performance using a weighted46 score for each relevant mode. Indicative supply chains will be chosen to capture, as far as possible, a range of freight types, locations, and modes. Table 4.6 shows a potential list of indicative supply chains.
Mode-specific and whole of supply chain measures for these indicative
supply chains could also be regularly updated, to monitor changes in
performance over time, and to compare with similar domestic and
international supply chains. There is also the potential to present mode-
specific indicators through data visualisations (see Case Study 4.1 for
HERE data example).
Table 4.6 - Potential Supply chains to include in supply chain performance reporting.
Supply chain Perspective
represented
Representative
routes
Transport modes
Road Rail Sea Intermodal
terminal/port
Air
Grain Producer/exporter Riverina ->
overseas
WA wheatbelt ->
Perth
Export beef
(air)
Producer/exporter Darling Downs -
> overseas
Imported
manufactured
goods
Final customer Overseas ->
suburban
retailer
Intercapital
general
freight
Freight customer Sydney-
Brisbane
Melbourne-Perth
46 Individual weightings will need to be developed, potentially based on time and/or distance.

Draft National Infrastructure Data Collection and Dissemination Plan 37
Case Study 4.1 - Prototype road-speed performance dashboard HoustonKemp has built a prototype road-speed dashboard using HERE traffic GPS probe data to provide information on speed performance and reliability of road networks. The dashboard currently provides information on speed performance and reliability at a number of spatial scales: citywide, major roads, postcode, point to point custom route selection, and for individual roads. Users are provided with insights on road performance across a number of time dimensions, including hourly, AM and PM peaks, by day of the week, monthly and yearly. The prototype version currently contains data from January 2013 to December 2016 and for Brisbane, but can be extended to include data up until yesterday and to all roads across Australia. The dashboard is currently only available to BITRE staff.
The screen shot (above) is from the Houston Kemp Dashboard showing speed performance and reliability measures.

Draft National Infrastructure Data Collection and Dissemination Plan 38
Chapter 5: Data Dissemination
Key Points
This chapter provides a summary of current Australian data initiatives and commitments aimed at improving the availability of data, as well as specific examples of realised benefits associated with the release47 of infrastructure data. Data sharing is also discussed, focussing on infrastructure and transport data sharing activity. The need for a national framework for public data sharing and accessibility, and other priorities for improving infrastructure data sharing and accessibility are also highlighted.
Data held by governments and the private sector is often of high value and its use can lead to
improved services delivery and better policy outcomes. Recognising the potential social and
economic benefits associated with open data and data sharing, the Australian Government, and
state and territory governments have recently made commitments and implemented several
initiatives and projects to improve the release and sharing of public data. In addition, specific
national infrastructure and transport data sharing and accessibility priorities are identified in this
Data Plan. These are summarised in Figure 5.1 and discussed further in this Chapter.
Figure 5.1 Overview of open government data commitments and initiatives, infrastructure data sharing
activities, and Data Plan data sharing and accessibility priorities.
47 It is important to recognise the distinction between the ‘release’ and ‘sharing’ of data. In the context of this Data Plan, ‘data release’ refers to making data accessible to all potential users without restrictions (open data), while ‘data sharing’ is the restricted provision of data to organisations or individuals.

Draft National Infrastructure Data Collection and Dissemination Plan 39
Australian Government data commitments and leading entities
Australian National Action Plan under the Open Government Partnership 2016-201848
On 7 December 2016, the Australian Government released its first National Action Plan that
contains open data commitments including the release of high-value datasets while maintaining
public trust and addressing concerns about data sharing and release.
Australia’s adoption of the International Open Data Charter49
On 27 March 2017, Australia adopted the International Open Data Charter as part of its Open
Government National Action Plan. The Charter reinforces Australia’s commitment to open data
agenda and enables Australia to share and learn best practice on international open data
initiatives.
Australian Government Public Data Policy Statement (2015)50
Commits Australian Government entities to make non-sensitive public data open by default, and
also to other actions aimed at improving the availability and accessibility of public data, while
maintaining appropriate security and privacy protections.
Data Integration Partnership for Australia (DIPA)51
Data Integration Partnership for Australia (DIPA) is a Commonwealth initiative that will establish
data analytics teams and use Government data to deliver improved, evidence-based programs and
policy. DIPA will coordinate specialised teams focused on social, industry, environmental and
government efficiency policies.
BITRE is leading the Department of Infrastructure and Regional Development’s involvement in
DIPA and will work with other Commonwealth agencies on cross-portfolio data activities,
particularly focused on energy and natural resources analysis.
The Data and Digital Branch in the Department of the Prime Minister and Cabinet (DPMC)52
The Data and Digital Branch develops and provides advice on whole-of-government policies on the
use and reuse of data. It also manages the secretariat for APS wide data governance structures
that provides leadership and facilitates the use of public data across government and private
entities.
The Branch manages specific open-data initiatives that include – data.gov.au and NationalMap
(see ‘Open Data Initiatives’ section).
48 See DPMC, https://ogpau.pmc.gov.au/australias-first-open-government-national-action-plan-2016-18 49 See blog.data.gov.au, https://blog.data.gov.au/news-media/blog/australia-adopts-international-open-data-charter 50 See DPMC, https://www.pmc.gov.au/public-data/public-data-policy 51 See DIPA description - https://ministers.pmc.gov.au/taylor/2017/data-analytics-teams-deliver-better-targeted-services 52 See DPMC, https://www.pmc.gov.au/public-data

Draft National Infrastructure Data Collection and Dissemination Plan 40
Data6153
Data61 was created from the merger of National ICT Australia (NICTA) and CSIRO’s digital
research unit.
Part of Data61’s remit is to use data analytics to connect disparate government datasets and
publicly release them on open data platforms. Data61 is also actively involved with other open data
and data sharing projects.
State and territory data commitments and associated entities
All state and territory jurisdictions have an official open data policy, or are working towards an open
data policy, and have a particular department with ownership and lead implementation
responsibilities for that policy54.
Open Data initiatives
data.gov.au
data.gov.au provides an easy way to find, access and reuse public datasets. As of 10 August 2017
data.gov.au has over 28,000 discoverable datasets and 6,000 APIs55, and includes transport and
infrastructure datasets published by BITRE and other Australian government agencies, state and
territory governments and local governments. See Case Study 5.1 for more information on recent
developments to data.gov.au.
Case Study 5.1 – search.data.gov.au
The Data and Digital Branch at DPMC are working with Data61 to develop the next generation of data.gov.au. This work includes sharing early prototype projects. Information about this functionality is available on preview.data.gov.au providing users with the opportunity to provide feedback.
One early prototype is located at search.data.gov.au56. It demonstrates the concept of ‘borderless searching’, making it easier to discover data from all levels of government by including search results from open data portals not usually available through data.gov.au. The prototype also improves user experience by providing enhanced searching options such as a search syntax that allows users to find data from a specific publisher or in a particular data format
53 See Data61, http://data61.csiro.au/en/Who-we-are 54 http://www.pc.gov.au/inquiries/completed/data-access/report/data-access.pdf 55 An API – application programming interface –allows programmers to easily access data and present it in new and different ways, for example, public transport data APIs are often used by trip planning app developers. 56 Note. search.data.gov.au will eventually work in all browsers, but currently only works with modern web browsers (such as the latest versions of Google Chrome and Mozilla Firefox).

Draft National Infrastructure Data Collection and Dissemination Plan 41
NationalMap57
NationalMap is a website for map-based access to spatial data from Australian government
agencies. The software was developed by Data61 working closely with the Department of
Communications and the Arts, Geoscience Australia and other government agencies with the goal
to facilitate the opening and access to public spatial data. Users are able to overlay spatial data
from multiple government agencies and also load their own custom data. See Case Study 5.2 for a
demonstration of displaying multiple spatial datasets on NationalMap.
Case Study 5.2 – NationalMap demonstration
This case study demonstrates how data from multiple sources can be displayed using NationalMap. The image below shows regions around Australia’s largest coal port, Newcastle, and includes spatial datasets on: - The location of major sea ports (Department of Infrastructure and Regional Development) - Mine areas (Geoscience Australia) - Railways (Geoscience Australia) - Industry of employment data (mining), by SA2 (ABS). NationalMap also allows users to interactively display information on selected datasets by clicking on the relevant section of the map. For example, the box on the right of the image below shows Industry of Employment data for the Singleton region.
57 See NationalMap https://nationalmap.gov.au/

Draft National Infrastructure Data Collection and Dissemination Plan 42
GovHack58
GovHack is a community driven international open data competition that started as a government
sponsored initiative in 2009. Since its inception, GovHack has grown into a volunteer run
international competition, and in 2017 over 2,300 participants took part in the event.
A key benefit of GovHack is that it encourages governments across Australia to improve how they
deliver their data, to make it easier for the public to understand how governments use revenues,
and to focus more attention on delivering citizen centric services.
Commonwealth and state/territory transport and infrastructure agencies regularly sponsor
GovHack. In 2017, the Department of Infrastructure and Regional Development, sponsored two
award categories:
‘Going places’ - projects aimed at enabling the Department to factor in population change
and technology to plan sustainable cities and regions for the next 30 years.
‘Places hack’ – projects aimed at cultivating more productive cities and towns – ‘smart
cities’.
Submissions to these and other categories are able to be accessed via –
https://2017.hackerspace.govhack.org
State and territory open data portals
Most jurisdictions have well developed open data portals which provide access to government data
in a similar way to data.gov.au. Portals include:
ACT https://data.act.gov.au
NSW https://data.nsw.gov.au and the transport specific https://opendata.transport.nsw.gov.au/
(see Case Study 5.3)
QLD https://data.qld.gov.au
SA https://data.sa.gov.au
VIC https://data.vic.gov.au
WA http://data.wa.gov.au
Most state and territory open data portals also encourage the use of their data by app developers
through making data available in APIs.
58 See GovHack, https://govhack.org/

Draft National Infrastructure Data Collection and Dissemination Plan 43
Case Study 5.3 – Transport for NSW Open Data Hub Open Data Hub
TfNSW’s Open Data Hub was launched in April 2016 and is the portal to TfNSW’s data and information. It also acts as a showcase for innovation from the use of transport data.
There are now around 5,000 subscribers on the Transport Open Data Hub, including a range of Data Scientists, Researchers, App Developers and other members of the community who are deriving benefits from it. There is also a supporting forum which enables active dialogue with the subscriber community that provides the direction for the further release of data sets and continuous improvement in the Open Data Hub. The image below shows the Product Showcase section of TfNSW Open Data Hub. Users are able to click on individual Apps to access more information and to view download links.
Infrastructure and transport related portals
Transmet – An online metadata portal that contains information about key Australian
transportation datasets–https://www.nss.gov.au/transportmetadata/index.jsp
Australian Urban Research Infrastructure Network (AURIN) – brings together a broad range of
research and data relevant to urban and infrastructure researchers, policy-makers and planners–
https://aurin.org.au/.

Draft National Infrastructure Data Collection and Dissemination Plan 44
Benefits of making public data open
Technological developments and advances in analytical techniques allow open public data to be
used in innovative ways, thus realising immense social and economic benefits such as:
Stimulating economic growth and enabling innovation;
Facilitating the development of new products and services;
Increasing transparency of government decision-making and policy development;
Fostering collaboration between government, business, academia, non-government
organisations and the community59
Provision of better, richer information to customers
Ability for customers and regulators to compare relative performance across infrastructure
operators, develop transparent performance benchmarks and expectations, and create
incentives/pressures to improve services and performance
Improved public and customer engagement.
Specific examples relating to the use of publicly available infrastructure and transport data include:
Apps that utilise real time road data to provide alerts to road users of congestion incidents
and alternative routes60
Public transport trip planning apps e.g 61,62
Information on upcoming public infrastructure investment and major construction activity63
(also see Case Study 5.4).
59 DPMC, Australia’s First Open Government National Action Plan (2016-2018) https://ogpau.pmc.gov.au/australias-first-open-government-national-action-plan-2016-18 60 See Roads and Maritime Services (RMS), Real-time road apps http://www.rms.nsw.gov.au/roads/using-roads/trip-information/real-time-road-apps.html 61 https://transportnsw.info/apps 62 See Transport Canberra, https://www.transport.act.gov.au/routes-and-timetables/Plan-Your-Trip 63 Transport for NSW, Transport Projects Map. https://future.transport.nsw.gov.au/business/detailed-project-map/

Draft National Infrastructure Data Collection and Dissemination Plan 45
Case Study 5.4 – Australia & New Zealand Infrastructure Pipeline64
The Australia & New Zealand Infrastructure Pipeline (ANZIP) is a joint initiative between the Australian and New Zealand Governments, and Infrastructure Partnerships Australia (IPA). It informs industry of where and what infrastructure opportunities are available, and when they come to market by tracking greenfield and brownfield transactions from when they are proposed, until they reach contractual and financial close. ANZIP information is displayed on an interactive map that provides a forward view of public infrastructure activity across Australia and New Zealand. Users are able to filter infrastructure projects by jurisdiction, type, status and value and click on individual projects for more information (see example below)
,
,
Infrastructure and transport data sharing
There are several ongoing projects that aim to better utilise infrastructure and transport data
through data sharing between government agencies. These projects can be grouped into three
broad categories, examples for each are listed below:
Data sharing between government agencies to create national data
Heavy Vehicle Infrastructure Asset Registers
o State and territory agencies share road condition data that is published on the
Transport and Infrastructure Council website65 - see Case Study 3.1 in Chapter 3.
64 See Australian and New Zealand Infrastructure Pipeline, http://infrastructurepipeline.org/ 65 Transport and Infrastructure Council, Heavy Vehicle Road Reform, http://transportinfrastructurecouncil.gov.au/publications/heavy_vehicle_road_reform.aspx
The screenshot (left) shows ANZIP infrastructure project information in Perth, with the Perth Airport Third Runway project selected.

Draft National Infrastructure Data Collection and Dissemination Plan 46
National key freight routes map66 -
o Developed through the collaboration and data sharing between Commonwealth,
state and territory governments and industry, to provide a more comprehensive
understanding of Australia's freight system.
Data sharing to combine data from multiple data sources
Austroads pilot study on non-fatal hospitalised road (BITRE as project lead)
o Involves developing a national approach to supply routine national data on non-fatal
hospitalised road injuries in Australia by linking crash and hospital data. This project
requires approvals in each state and territory from transport agencies, (in some
cases) Police, ethics committee/s and hospital data custodian/s; as well as the
AIHW and Flinders University.
Understanding the Infrastructure Needs of Communities67 (Infrastructure NSW in
partnership with the NSW Data Analytics Centre)
o This project draws on over 100 datasets, from multiple agencies, and applies
analytics to better understand the composition of communities and their
dependence on infrastructure, including transport, schools, hospitals, water and
electricity.
Private sector data shared with government agencies
Road freight telematics pilot study (BITRE and ABS)
o Utilises truck telematics data shared by the trucking industry (see Case Study 3.3 in
Chapter 3).
Waterline (BITRE)68
o Based on data provided by stevedores and port authorities.
Aviation statistics (BITRE)69
o Based on data shared with BITRE by the airline industry.
66 http://maps.infrastructure.gov.au/KeyFreightRoute/index.html 67 The NSW Data Analytics Centre, https://www.dac.nsw.gov.au/case-study/understanding-infrastructure-needs-communities-0 68 BITRE, Waterline https://bitre.gov.au/publications/2017/water_059.aspx 69 BITRE, Aviation Statistics, https://bitre.gov.au/statistics/aviation/

Draft National Infrastructure Data Collection and Dissemination Plan 47
The need for a national framework for public data sharing and accessibility
As outlined above, the Australian Government, and most state and territory governments have
implemented a number of open data policies and initiatives to make non-sensitive public sector
data open by default. There are also several infrastructure and transport related open data and
data sharing projects. However, as noted by the Productivity Commission, the sharing and release
of data is still often hampered by a complex, restrictive and conflicting legislative framework that is
outdated for the modern data driven environment. There is a clear need for a data sharing and
release framework that can scale up, evolve and improve in line with technology70.
The Productivity Commission’s public Inquiry into Data Availability and Use (Inquiry report)71
proposes a new data sharing and release framework aimed at improving the way Australians use
and share data.
The Inquiry Report recommends:
A new Data Sharing and Release Act that is meant to simplify the existing legislative
framework for data access, and allow data access arrangements to be dialled up or down
according to the different risks associated with different types of data, uses and use
environments;
Accredited Release Authorities (ARAs) that will bear the primary responsibility for
curating, linking, sharing and releasing data within a particular sector (while data custodians
would still have responsibility for business-as-usual sharing and releasing data). ARAs do
not necessarily have to be Commonwealth entities, even if the relevant sectoral datasets cut
across jurisdictional boundaries.
National Data Custodian (NDC) to guide the operation and integrity of the reformed data
Framework.
Designation of a small number of nationally beneficial National Interest Datasets (NIDs)
that would be assessed and nominated for declaration as NIDs by the NDC. The NIDs will
be a particular category of datasets that should be treated and funded as national assets
(because of their ability to deliver benefits in the national interest), and available for wider
use in an integrated fashion.
The Inquiry Report also recommends that Australian Government agencies should create
comprehensive, easy to access registers of datasets, including metadata, they hold or fund. Where
datasets are not available for public release, the register should indicate why this is so.
70 Productivity Commission (2017), Productivity Commission Inquiry Report, Data Availability and Use http://www.pc.gov.au/inquiries/completed/data-access/report/data-access.pdf 71 Productivity Commission (2017), Productivity Commission Inquiry Report, Data Availability and Use http://www.pc.gov.au/inquiries/completed/data-access/report/data-access.pdf

Draft National Infrastructure Data Collection and Dissemination Plan 48
In response to the Inquiry Report, the Australian Government has established a cross-portfolio
Data Availability and Use Taskforce within the Department of the Prime Minister and Cabinet. The
Taskforce will be responsible for developing the Government’s response to the Productivity
Commission’s recommendations in consultation with stakeholders from the public sector,
academia, not-for-profits, industry and the community.
The Final Data Plan will report on progress relating to the Government’s response, focussing
specifically on infrastructure data.
Priorities for improving data sharing and accessibility
The following priorities are based on data gaps related to Enduring Questions under Topic 6 –
‘Data for decision making and innovation’ (see Table 2.4).
EQ 6.1 – What infrastructure data and information is currently publicly available and what
datasets and information can be made available?
Data gap: Consistent transport data standards.
Description: To enable comparisons and linking of available transport datasets and
transport models it is important to have consistent data standards.
Opportunity 1:
There is a need to further promote consistent transport data standards. This will complement ongoing work such as the Austroads’ Road Data Harmonisation Project72 (see Case Study 5.5) and the Household Transport Survey Harmonisation Project73.
Expanding existing work New project Data from new and emerging sources
Case Study 5.5 – Data Standard for road management and investment
Austroads is undertaking a project to establish a harmonised road asset data standard for use in Australia and New Zealand. Types of data considered in the project include road asset data, descriptions and locations of assets, maintenance activities and cost metrics, asset condition and performance and road classification.
The first version of the Standard involved extensive research into existing data requirements and current practice and provided information for road managers and the wider road sector. It was delivered by Opus International Consultants and GISSA and published in November 201674. The second version of the Standard is being undertaken by Opus International Consultants and will contain additional data fields, and will be supported with an implementation plan. It is expected to be published in 2017.
72 Austroads, Road Data Harmonisation Project. http://www.austroads.com.au/road-operations/asset-management/road-data-harmonisation-project 73 AURIN, Household Transport Survey Harmonisation Project. https://aurin.org.au/projects/lens-sub-projects/household-transport-survey/ 74 Austroads (2016), Data Standard for Road Management and Investment in Australia and New Zealand: Version 1. https://www.onlinepublications.austroads.com.au/items/AP-T315-16

Draft National Infrastructure Data Collection and Dissemination Plan 49
Data gap: Information on best-practice modelling assumptions.
Description: Estimates of the potential benefits and costs associated with infrastructure
investments are often based on model outputs, such as those from traffic
forecasting models. These models often use inconsistent modelling
assumptions, making it difficult to compare models, and assess infrastructure
project proposals and planning documents.
Opportunity 2:
There is a need to develop and promote national best practice and consistent modelling assumptions to improve infrastructure planning and investment. This work could expand on work currently underway in New South Wales (see Case Study 5.6)
Expanding existing work New project Data from new and emerging sources
Case Study 5.6 – Driving Consistency with Common Planning Assumptions
The preparation of Common Planning Assumptions is a New South Wales initiative to collect and document fundamental assumptions to underpin the development of key government strategies. This cross-agency initiative is aimed at ensuring the alignment and consistency of assumptions in strategies and plans prepared by different NSW government agencies and departments. It was established to minimise the risk of some agencies using different assumptions and projections for service and infrastructure planning – a situation which could contribute to sub-optimal decision making. The Common Planning Assumptions represent a consistent baseline or a starting point to underpin planning decisions and policy analysis for government strategies and investment decisions. They include: - assumptions for economic growth, industry sectors, fertility, mortality, migration and infrastructure (to inform projections); and - projections, forecasts and the use of approved targets for population, housing and employment. The Common Planning Assumptions provide for certain agencies to have primary responsibility for key assumptions.
Data gap: Locating available transport and infrastructure datasets
Description: Data portals such as data.gov.au and state and territory portals provide
access to open transport and infrastructure datasets. However, it is
sometimes difficult, especially for non-experienced users, to locate key
transport and infrastructure datasets due to problems with identifying
appropriate datasets from the large quantity of available datasets. Metadata
describing each collection is also sometimes lacking.

Draft National Infrastructure Data Collection and Dissemination Plan 50
Opportunity 3:
There is an opportunity for BITRE to work with state and territory transport
and infrastructure agencies to develop consistent open data principles, such
as consistent metadata information. BITRE could also work with the Data
and Digital Branch on ways to improve the discoverability of key transport
and infrastructure datasets through data.gov.au and NationalMap.
Expanding existing work New project Data from new and emerging sources
Data gap: Incomplete recording of historical infrastructure and transport data,
policies and regulations.
Description: Information on historical infrastructure data, policies and regulation data
needs to be available to make accurate retrospective analysis of the
effectiveness of infrastructure and transport policy. Currently, the
recording of historical infrastructure data is incomplete, and historical
infrastructure policy and regulation data is not treated as key data. For
example, driver licence restrictions vary by jurisdiction and often change
over time. This historical information is not readily available making long
term analysis of road safety outcomes difficult.
Opportunity 4 : There is an opportunity to promote the recording of historical
infrastructure and transport data, and to treat and record policy and
regulation information as data.
Expanding existing work New project Data from new and emerging sources
Data gap: Data sharing guidance, methods and standards
Description: Despite the potential benefits of increased data sharing and the
establishment of state-level legislative reform around public data sharing75,
data sharing within government remains a challenge for several reasons.
Many data custodians remain hesitant to share data due to concerns around
appropriate use and interpretation of data, concerns about unintended
consequences of sharing data, concerns about accidental release of
sensitive data and concerns about adherence to privacy legislation.
Aggregation of individual data is a standard approach to reduce the risk that
personal information is included in a shared dataset. Part of data sharing
challenge is that there is no way to unambiguously determine if there is
personal information in aggregated data.
75 For example, the NSW Data Sharing (Government Sector) Act 2015.

Draft National Infrastructure Data Collection and Dissemination Plan 51
There are also concerns by Privacy advocates that as the capability of data
analytics increases so does the risk of combining multiple datasets to reveal
personal information. Accurately assessing the privacy risks associated with
linking multiple datasets often exceeds the ability of human judgement.
Opportunity 5 : In addition to the recommendations proposed by the Productivity
Commission76, there is an opportunity to facilitate data sharing by:
providing advice on existing relevant legal frameworks;
developing methods and standards for anonymising personal
information; and
developing methods for testing the existence of personally
identifiable data in datasets.
This Opportunity could involve tracking data sharing work currently led by
the NSW Data Analytics Centre and the Australian Computer Society (see
Case Study 5.7)
Expanding existing work New project Data from new and emerging sources
Case Study 5.7 – Data Sharing Taskforce
A Data Taskforce led by the Australian Computer Society (ACS), and the NSW Data Analytics Centre (DAC) has been created to address the overarching challenge of developing privacy preserving frameworks which support automated data sharing to facilitate smart services creation and deployment. This framework will seek to address technical, regulatory, and authorising frameworks. The intention is to identify, adopt, adapt, or develop frameworks for data governance, privacy preservation, and practical data sharing which facilitates smart service creation and cross jurisdictional data sharing between governments. The approach is to identify best practice where it is known to exist; consider existing models in an Australian privacy context or identify ‘whitespace’ opportunities to develop frameworks for Australia.
The Taskforce includes representatives from ACS, the NSW DAC, Standards Australia, the Federal Government’s Digital Transformation Office (DTO), CSIRO, Data61, the Department of Prime Minister and Cabinet, other Commonwealth and State agencies/departments, Gilbert and Tobin, the Communications Alliance, Telstra, IBM, Mastercard, and Microsoft.
76 Productivity Commission (2017), Productivity Commission Inquiry Report, Data Availability and Use http://www.pc.gov.au/inquiries/completed/data-access/report/data-access.pdf

Draft National Infrastructure Data Collection and Dissemination Plan 52
EQ 6.2 – What data do governments need to provide in order to enable emerging
technologies and innovative business models of infrastructure provision and use?
Data gap: Open data to support the implementation of Connected and Automated
Vehicles (CAVs).
Description: The ongoing advances in transport technology have the potential to
fundamentally improve safety, efficiency, sustainability and accessibility of
Australia’s transport systems. Australian Governments, industry and research
institutions recognise this potential and are actively exploring the best ways
to develop and deploy new transport technologies such as CAVs.
The developers of these new transport technologies may require dynamic
road operator data, such as speed zone changes, road closures and road
works information, to operate effectively77.
Opportunity 6:
There is a need to identify gaps between the road operator data provided to
users (developers) and what is likely to be required in future for CAV
operations (see Case Study 5.8, for example project).
Expanding existing work New project Data from new and emerging sources
Case Study 5.8 – Open Data to support connected and automated vehicle (CAV) systems
Austroads, as part of the National Policy Framework for Land Transport Technology78, is undertaking a project to investigate key road operator data attributes that will be used as part of the CAV system. The project will identify gaps with the current environment and whether a further range of projects are required on this issue, given the work that is being undertaken by road operators.
Issues that will potentially be explored as part of this project will include road data management, standardisation/harmonisation and support for proprietary models, and road authority regulatory framework in a digital environment.
77 Austroads (2017), Assessment of Key Road Operator Actions to Support Automated Vehicles https://www.onlinepublications.austroads.com.au/items/AP-R543-17 78 Transport and Infrastructure Council (2016), National Policy Framework for Land Transport Technology (2016-2019) http://transportinfrastructurecouncil.gov.au/publications/files/National_Policy_Framework_for_Land_Transport_Technology.pdf

Draft National Infrastructure Data Collection and Dissemination Plan 53
Appendix A – Requests for input
Timeframes for the specific requests for input are available on the Data Plan’s website –
https://bitre.gov.au/data_dissemination/index.aspx
Specific areas for comment include:
1. Key statistical and information sources and data gaps (Table 2.2 and Appendix D)
o Additional key statistical and information sources. .
2. Prioritised Enduring Questions and associated data and information gaps (Table 2.3
and 2.4)
o Relevance and prioritisation of Enduring Questions.
o Additional data and information gaps associated with these questions that need to
be addressed in the Data Plan?
3. Opportunities (Chapter 3; and summarised inTable 2.4)
o Additional opportunities to address identified data and information gaps? This could
include similar ongoing or completed projects.
4. Infrastructure performance measures (Chapter 4)
o Overarching infrastructure performance framework.
o Additional priorities for measuring infrastructure performance.
5. Priorities for improving data sharing and accessibility (Chapter 5)
o Additional priorities for improving data sharing and accessibility.

Draft National Infrastructure Data Collection and Dissemination Plan 54
Appendix B – Terms of Reference
The Bureau of Infrastructure, Transport and Regional Economics (BITRE), within the Department of Infrastructure and Regional Development, will lead the development of a Data Collection and Dissemination Plan (the Plan) that:
Identifies key national infrastructure and transport statistics;
Develops national infrastructure performance measures;
Identifies opportunities to use new technologies to collect infrastructure data;
Develops means of disseminating data to encourage innovation and improved public and private
decision making; and
Promotes and identifies priority projects that:
o Fill key data gaps
o Develop and report performance relevant to infrastructure operators and customers
o Support innovation in data collection and use.
The Plan will improve and coordinate information and data collection across key stakeholders, and provide improved and more timely information for infrastructure investment decisions and monitoring of the performance of Australia's infrastructure networks. Developing opportunities to harness new data sources (including 'Big Data') from emerging data sources will be a key part of the Plan's development.
A Steering Group will be established to oversee the development and implementation of the Plan and include representatives from:
The Department of Infrastructure and Regional Development;
Infrastructure Australia;
The Australian Bureau of Statistics (ABS);
Data61;
State and territory transport departments
Private industry; and
Academia.
Collaboration and workshops with key transport and infrastructure stakeholders, and research and data analytics groups will be part of developing the Plan. This will give people working in the transport and infrastructure space an opportunity to highlight what data and information is required to achieve better transport and infrastructure outcomes, and identify methods for obtaining and disseminating this information.
A draft Plan will be available for industry and government comment in six months, and the final Plan will be provided to the Commonwealth Government within 12 months.
Paul Fletcher Minister for Urban Infrastructure 28/2/17

Draft National Infrastructure Data Collection and Dissemination Plan 55
Appendix C – Steering Group membership
A Steering Group made up of key transport and infrastructure stakeholders, and research and data
analytics groups has been established to oversee the development of the National Infrastructure
Data Collection and Dissemination Plan. Steering Group members include:
Dr Gary Dolman, Head of Bureau of Infrastructure, Transport and Regional Economics
(BITRE), Department of Infrastructure and Regional Development
Mr Bill Simpson-Young, Director, Engineering and Design, CSIRO
Prof Pascal Perez, Director SMART Infrastructure Facility, University of Wollongong
Mr Roy Cummins, Chief Executive Officer, Port of Brisbane
Mr Royce Christie, Group Manager, Public Policy and Research, Group Corporate Affairs,
Toll Group
Ms Amanda Clark, Program Manager, Geospatial and Regional Statistics Branch, The
Australian Bureau of Statistics
Mr Jeff Potter, Project Director Productivity and Safety, National Transport Commission
Mr Phil Davies, Chief Executive Officer, Infrastructure Australia
Mr Brendan Lyon, Chief Executive Officer, Infrastructure Partnerships Australia
Dr Ian Oppermann, Chief Executive Officer and Chief Data Scientist, NSW Data Analytics
Centre
Mr Phil Bullock, Director, Transport Performance and Analytics, Transport for NSW
Mr Garry Bowditch, Executive Director, Better Infrastructure Initiative, University of Sydney.

Draft National Infrastructure Data Collection and Dissemination Plan 56
Appendix D – Key data and information sources79
Table D.1 Infrastructure Stocktake – Key data and information sources
Sector Data Source Entity Description Link to publication80
All Infrastructure Yearbook BITRE Provides a single, comprehensive annual source of economic infrastructure statistics.
Yearbook - 2016
Transport – rail Trainline BITRE Presents an overview of characteristics of the railways and train operators’ rolling stock.
Trainline 4
Transport – maritime Australian Sea Freight BITRE Summarises information on Australian owned and/or operated trading vessels
Australian Sea Freight
2014-15
Transport – maritime Waterline BITRE Information about facilities and port services available at the five major Australian container ports
Waterline 59
Energy State of the energy market reports
Australian Energy Regulator
Summarises electricity and gas markets, the transmission and distribution networks and the rapidly evolving retail sector
State of the energy
market, May 2017
Water Urban water, water storage information and other water data
BOM BOM currently report on a series of water infrastructure, including urban water, water storage information.
BOM water
publications
Communications NBN rollout map NBN Provides interactive information on NBN rollout NBN rollout map
Communications Communications report ACMA Includes information on communications infrastructure Communications
report 2015–16
79 Key data and information sources include national level statistical and information sources that relate to transport activity and infrastructure networks. The tables in Appendix D are not aimed at providing a comprehensive list of all transport and infrastructure data and information sources and focuses specifically on available data and information sources. 80 Link to latest publication, if routine publication.

Draft National Infrastructure Data Collection and Dissemination Plan 57
Table D.2 Infrastructure and freight performance – Key data and information sources
Sector Data Source Entity Description Link to latest publication
Multiple sectors BITRE’s review of existing
performance frameworks81
BITRE Summarises some available infrastructure performance frameworks, focussing mostly on transport infrastructure.
The publication is published on
the BITRE website.
Transport – Rail Trainline BITRE Presents an overview of characteristics of the railways and train operators’ rolling stock.
Trainline 4
Transport – Maritime Waterline BITRE Reports on port and stevedore performance at Australia’s five main container ports.
Waterline 59
Transport – Aviation Domestic on time performance BITRE Reports on the on time performance for selected domestic and regional airlines
Domestic on time performance
Energy Australian Energy Regulator (AER) network performance data
AER The AER publishes a series of performance reports on electricity networks and gas pipeline service
Network performance data
Water National performance report: urban water utilities
BOM National performance reports benchmark the pricing and service quality of Australian water utilities
National performance report
2015–16
Communications Australian Communications and Media Authority (ACMA) Communications Report
ACMA Provides an overview of the Australian telecommunications industry performance against a range of regulatory obligation
ACMA Communications report
2015–16
81 BITRE (2017), Measuring Infrastructure Asset Performance and Customer Satisfaction.

Draft National Infrastructure Data Collection and Dissemination Plan 58
Table D.3 Infrastructure investment and planning – Key data and information sources
Sector Data Source Entity Description Link to latest publication
Multiple sectors Infrastructure business cases
-Project proponent -Infrastructure Australia
A rigorous and transparent analysis of the costs and benefits of a project. Business cases normally provide strategic context, options development and full cost-benefit analysis.
For large projects, full or partial business cases are normally available on proponent’s website Project evaluations, including summary of costs and benefits, are published on Infrastructure Australia’s website for projects and initiatives on the Infrastructure
Priority List82.
Multiple sectors Infrastructure post completion reports
Project deliverer Seeks to understand the outcomes of the project, as well as project delivery, against the benefits described in the business case.
Not systematically undertaken or published.
Multiple sectors Annual reports Asset owner Describe the organisations projects, achievements and financial position for the year. Include information on capital and operating costs.
Website of each organisation.
All sectors Demand forecasting models
State governments and BITRE
Benefits from infrastructure investments are usually strongly related to forecast infrastructure utilisation levels. So demand forecasts play a critical role in appraisal of initiatives.
State governments and BITRE regularly produce demand models for different sectors. BITRE’s demand forecast outputs (e.g. container throughput projections) are included in Trends: Transport and Australia's Development to 2040.
All sectors State government infrastructure and transport planning documents
Relevant state government infrastructure agencies
Provide a summary for the planning, investment and delivery of infrastructure and Transport
Example Plans Include: -State Infrastructure Plan (Qld);
- Long Term Transport Master Plan (NSW) -10 Year Infrastructure Plan (NT).
Energy Electricity Generation Major Projects
Office of the Chief Economist
Provides a list of major electricity generation projects in Australia
Electricity Generation Major Projects
82 Infrastructure Australia, Infrastructure Priority List. http://infrastructureaustralia.gov.au/projects/infrastructure-priority-list.aspx

Draft National Infrastructure Data Collection and Dissemination Plan 59
Table D.3 Infrastructure investment and planning – Key data and information sources (continued)
Sector Data Source Entity Description Link to latest publication
Water National performance report: urban water utilities
BOM Capital works grants, by utility, for water and sewerage.
National performance report
2015–16
Communications NBN CBA Department of Communications
Independent Cost-Benefit Analysis of the NBN NBN CBA
Table D.4 What are the impacts of our transport infrastructure?– Key data and information sources
Sector Data Source Entity Description Link to latest publication
Multiple sectors Infrastructure business cases Project proponent -Infrastructure Australia
Generally information on relevant impacts as part of cost benefit analysis.
Normally available on
proponent’s website
Project evaluations are
published on Infrastructure
Australia’s website for projects
and initiatives on the
Infrastructure Priority List
Multiple sectors Infrastructure post completion reports
Project deliverer Seeks to understand the outcomes of the project, as well as project delivery, against the benefits described in the business case.
Not systematically undertaken
or published.
Transport Benefit realisation studies (ex-post analyses)
BITRE Systematic review of the after projected costs and benefits of major investments.
BITRE ex-post evaluations –
Working Paper 70.1 and 70.2

Draft National Infrastructure Data Collection and Dissemination Plan 60
Table D.5a Infrastructure services – Transport– Key data and information sources
Mode Data Source Entity Description Link to latest publication
All modes Infrastructure Yearbook BITRE Contains freight and transport metrics for all transport modes.
Yearbook - 2016
All modes BITRE freight data BITRE BITRE produce mode-specific statistical publications for rail, road, air and sea freight.
BITRE publications grouped by subject area
Road and rail Who Moves What Where – Freight and Passenger Transport in Australia
NTC Reviews existing transportation data sources and reports and presents information on passenger and freight movements in Australia.
Who Moves What Where
Road New and alternative sources of road traffic-related data overview
Summary by
BITRE and IPA
This report summarises new and alternative sources of road-traffic data.
New traffic data sources – An overview
Table D.5b Infrastructure services – Energy, Water and Communications
Mode Data Source Entity Description Link to latest publication
All sectors Infrastructure Yearbook BITRE Contains energy, water and communications metrics
Yearbook - 2016
Energy Australian Energy Regulator (AER) regular reports
AER The AER publishes a regular reports on gas and electricity markets, including information on price and demand.
Gas and electricity reports
Water National performance report: urban water utilities
BOM Includes information on urban water use in Australia.
National performance report 2015–16
Water Australian water markets report
ABARES Presents comprehensive annual statistics on water trading activity across Australia
Australian water markets report 2015–16
Communications ACMA Communications Report
ACMA Reports communications (e.g. internet) usage, access and cost.
ACMA Communications report 2015–16