
Construction of Jones Lang LaSalle Prime and Secondary Index Nasima Ahmed Senior Analyst EMEA...
19
Construction of Jones Lang LaSalle Prime and Secondary Index Nasima Ahmed Senior Analyst EMEA Capital Market Research 24 th June 2010
-
Upload
joshua-francis -
Category
Documents
-
view
226 -
download
0
Transcript of Construction of Jones Lang LaSalle Prime and Secondary Index Nasima Ahmed Senior Analyst EMEA...

Construction of Jones Lang LaSalle Prime and Secondary Index
Nasima AhmedSenior Analyst EMEA Capital Market Research
24th June 2010

2
Agenda
Why?
Definition
Methodology
Health Warnings
Results
Conclusion

3
Why?
Create the first Jones Lang LaSalle Prime and Secondary Index
Limited work done so far, thus need for more academic work in this field
Address the issues of over representation of certain sectors in the existing Jones Lang LaSalle “Growth” and “Value” Index

4
Definition….
“Prime” asset is one which is located in the best position, is new and well designed, is of a lot size popular with investors and is
freehold with no restrictive covenants and is let to a sound covenant on a long term lease. All these factors are reflected in the yield of the property, thus “Prime” assets are low yielding property because it has the potential of future capital and rental growth
A “Secondary” asset is characterised by high yields, largely reflecting the location, covenant strength and the age of the property

5
Methodology

6
Sample size 913 properties
Sectors – Office, Retail and Industrial
Two approaches:
- Equivalent yield quartiles
- Capital value quartiles
In order to exclude “hybrid properties” the middle quartile was ignored
Only the “super prime” and “super secondary” (properties which remained in the lower and upper quartiles over the period studied 1996 to 2008) assets were included
Methodology
25th percentile
Lower quartile
50th percentile Middle quartile
Upper quartile 75th percentile

7
Methodology
Total Return:
Capital value growth: The compounded increase in quarterly values, net of capital expenditure, expressed as a percentage of the capital employed each quarter.
Income Return: The net income receivable for the quarter expressed as a percentage of the capital employed over the quarter.
Estimated rental value: The increase in the estimated rental value of properties held throughout the measurement period, expressed as a percentage of the rental value at the beginning of the period.
Initial yield: The rent passing (net of ground rent) as a percentage of the capital value at the same date.
Equivalent yield: Estimation of the discount rate which equates the future income flows to the current capital value.
1
1
t
tttt Value
IncomeValueValuer
8
Health Warnings
Data -Lag in valuation
-Issue of serial correlation
-How representative is the sample
Methodology
-Issues concerning management expenses and depreciation

9
Results
10
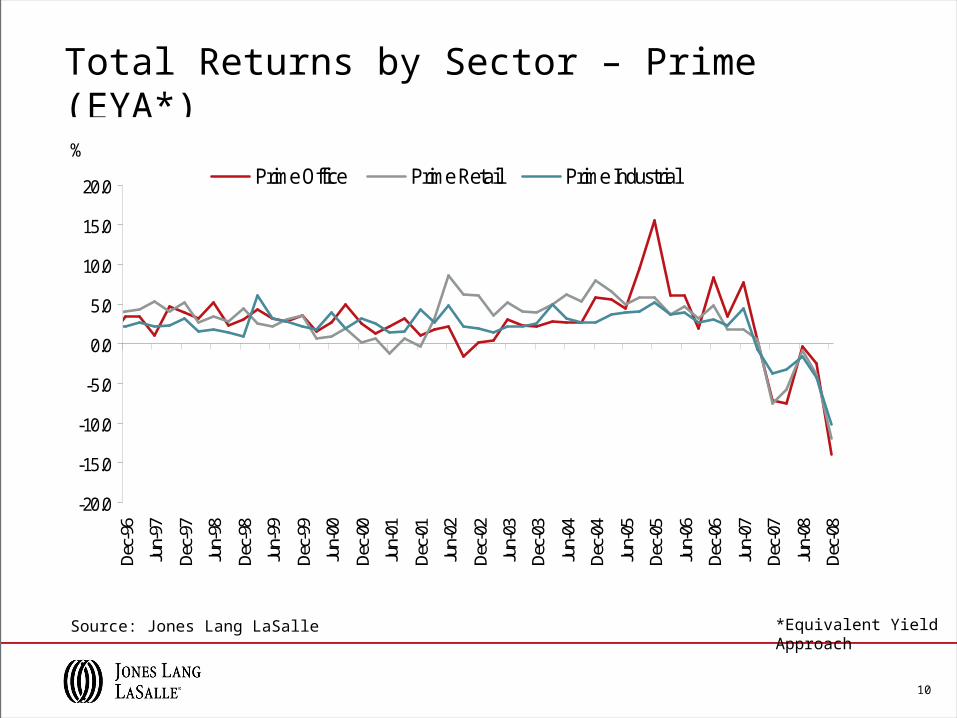
Source: Jones Lang LaSalle
Total Returns by Sector – Prime (EYA*)
*Equivalent Yield Approach
-20.0
-15.0
-10.0
-5.0
0.0
5.0
10.0
15.0
20.0
Dec-
96
Jun-
97
Dec-
97
Jun-
98
Dec-
98
Jun-
99
Dec-
99
Jun-
00
Dec-
00
Jun-
01
Dec-
01
Jun-
02
Dec-
02
Jun-
03
Dec-
03
Jun-
04
Dec-
04
Jun-
05
Dec-
05
Jun-
06
Dec-
06
Jun-
07
Dec-
07
Jun-
08
Dec-
08
%Prime Office Prime Retail Prime Industrial
11
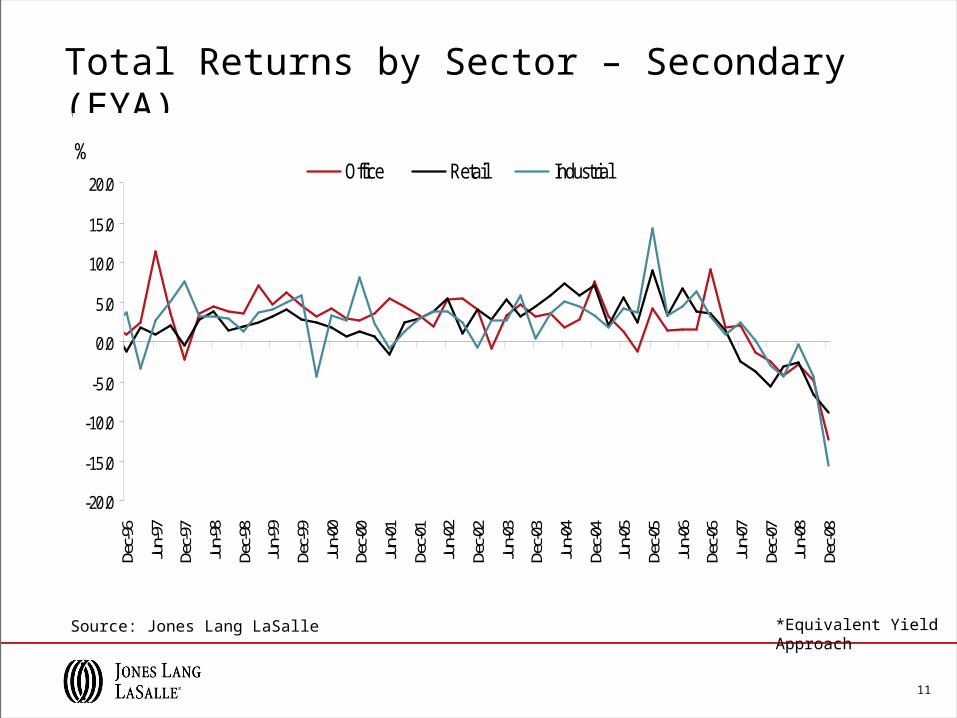
Total Returns by Sector – Secondary (EYA)
Source: Jones Lang LaSalle *Equivalent Yield Approach
-20.0
-15.0
-10.0
-5.0
0.0
5.0
10.0
15.0
20.0
Dec-9
6
Jun-
97
Dec-9
7
Jun-
98
Dec-9
8
Jun-
99
Dec-9
9
Jun-
00
Dec-0
0
Jun-
01
Dec-0
1
Jun-
02
Dec-0
2
Jun-
03
Dec-0
3
Jun-
04
Dec-0
4
Jun-
05
Dec-0
5
Jun-
06
Dec-0
6
Jun-
07
Dec-0
7
Jun-
08
Dec-0
8
%Office Retail Industrial
12
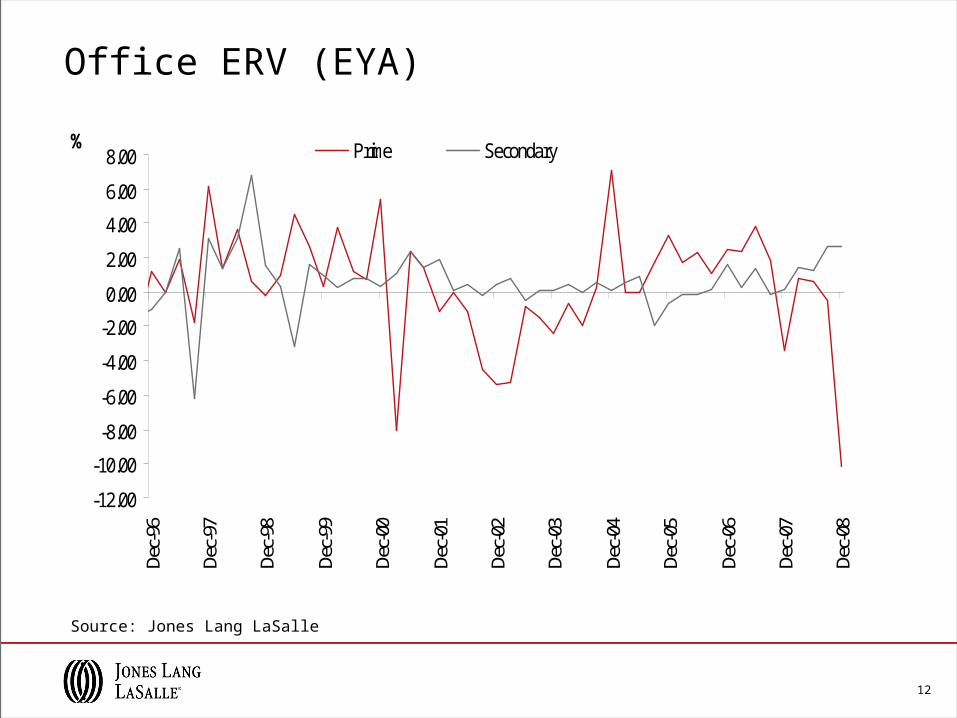
Office ERV (EYA)
Source: Jones Lang LaSalle
-12.00
-10.00
-8.00
-6.00
-4.00
-2.00
0.00
2.00
4.00
6.00
8.00De
c-96
Dec-
97
Dec-
98
Dec-
99
Dec-
00
Dec-
01
Dec-
02
Dec-
03
Dec-
04
Dec-
05
Dec-
06
Dec-
07
Dec-
08
% Prime Secondary

13
Total Returns by Sector – Prime (CVA)
Source: Jones Lang LaSalle *Capital Value Approach
-15.0
-10.0
-5.0
0.0
5.0
10.0
Dec-
96
Jun-
97De
c-97
Jun-
98
Dec-
98
Jun-
99
Dec-
99Ju
n-00
Dec-
00
Jun-
01
Dec-
01
Jun-
02
Dec-
02Ju
n-03
Dec-
03
Jun-
04
Dec-
04
Jun-
05De
c-05
Jun-
06
Dec-
06
Jun-
07
Dec-
07Ju
n-08
Dec-
08
% Office Retail Industrial

14
Total Returns by Sector – Secondary (CVA)
Source: Jones Lang LaSalle *Capital Value Approach
-20.0
-15.0
-10.0
-5.0
0.0
5.0
10.0
Dec-
96Ju
n-97
Dec-
97Ju
n-98
Dec-
98Ju
n-99
Dec-
99Ju
n-00
Dec-
00Ju
n-01
Dec-
01Ju
n-02
Dec-
02Ju
n-03
Dec-
03Ju
n-04
Dec-
04Ju
n-05
Dec-
05Ju
n-06
Dec-
06Ju
n-07
Dec-
07Ju
n-08
Dec-
08
% Office Retail Industry

15
IPD and JLL Prime and Secondary Index
-20.0
-15.0
-10.0
-5.0
0.0
5.0
10.0
15.0
20.0
Mar-0
1
Mar-0
2
Mar-0
3
Mar-0
4
Mar-0
5
Mar-0
6
Mar-0
7
Mar-0
8
% Prime Secondary IPD Low Yield IPD High Yield
Office Total Returns – (EYA) Office Total Returns – (CVA)
-15.0
-10.0
-5.0
0.0
5.0
10.0
Mar-0
1
Mar-0
2
Mar-0
3
Mar-0
4
Mar-0
5
Mar-0
6
Mar-0
7
Mar-0
8
%Prime Secondary
IPD Low Yield IPD High Yield
Source: Jones Lang LaSalle, IPD
16
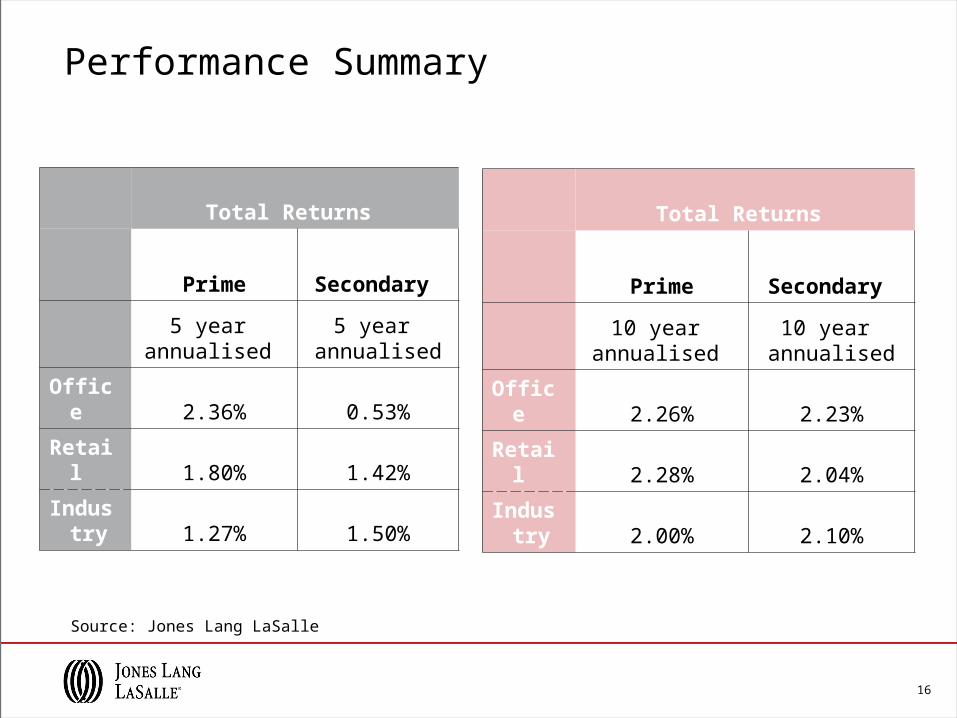
Performance Summary
Total Returns
Prime Secondary
5 year annualised
5 year annualised
Office 2.36% 0.53%
Retail 1.80% 1.42%
Industry 1.27% 1.50%
Total Returns
Prime Secondary
10 year annualised
10 year annualised
Office 2.26% 2.23%
Retail 2.28% 2.04%
Industry 2.00% 2.10%
Source: Jones Lang LaSalle
17
Conclusion
Two approaches :
The equivalent yield approach: More comparable with IPD upper and lower quartile Accurately demonstrated the market cyclical trends across all the sectors
The Capital Value Approach: Limitation given that it is a lot size measure – e.g. a big block of secondary office can be
classified as prime Does not capture the market cyclical trends across all three sectors
Sector Performance: Office sector: Secondary properties outperformed in the boom years and underperform
in down cycle Retail sector: Followed a similar trend to the office sector from 2007 onwards with prime
assets outperforming in boom years and underperforming in down cycle Industrial sector: showed similar trends to the office sector

18
Recommendation
Alternative approaches:
Conduct similar analysis using Initial Yield and Reversionary Yield Split sample by the qualitative property characteristics of prime and
secondary
Methodology : Conduct tests to incorporate some of the “Hybrid” properties to the sample? The assumption to exclude properties showing +50%/-50% was that the best
approach to take? When calculating returns additional costs such as management costs,
depreciation should be included.

19
Thank you
Nasima AhmedSenior AnalystEMEA Capital Market ResearchTel: +44 (0)20 3147 1211 Fax: +44 (0)20 3147 1730 email: [email protected]